
Hydrological Evaluation of Satellite-Based Precipitation Products in Hunan Province


Abstract
:1. Introduction
2. Data and Methods
3. Results
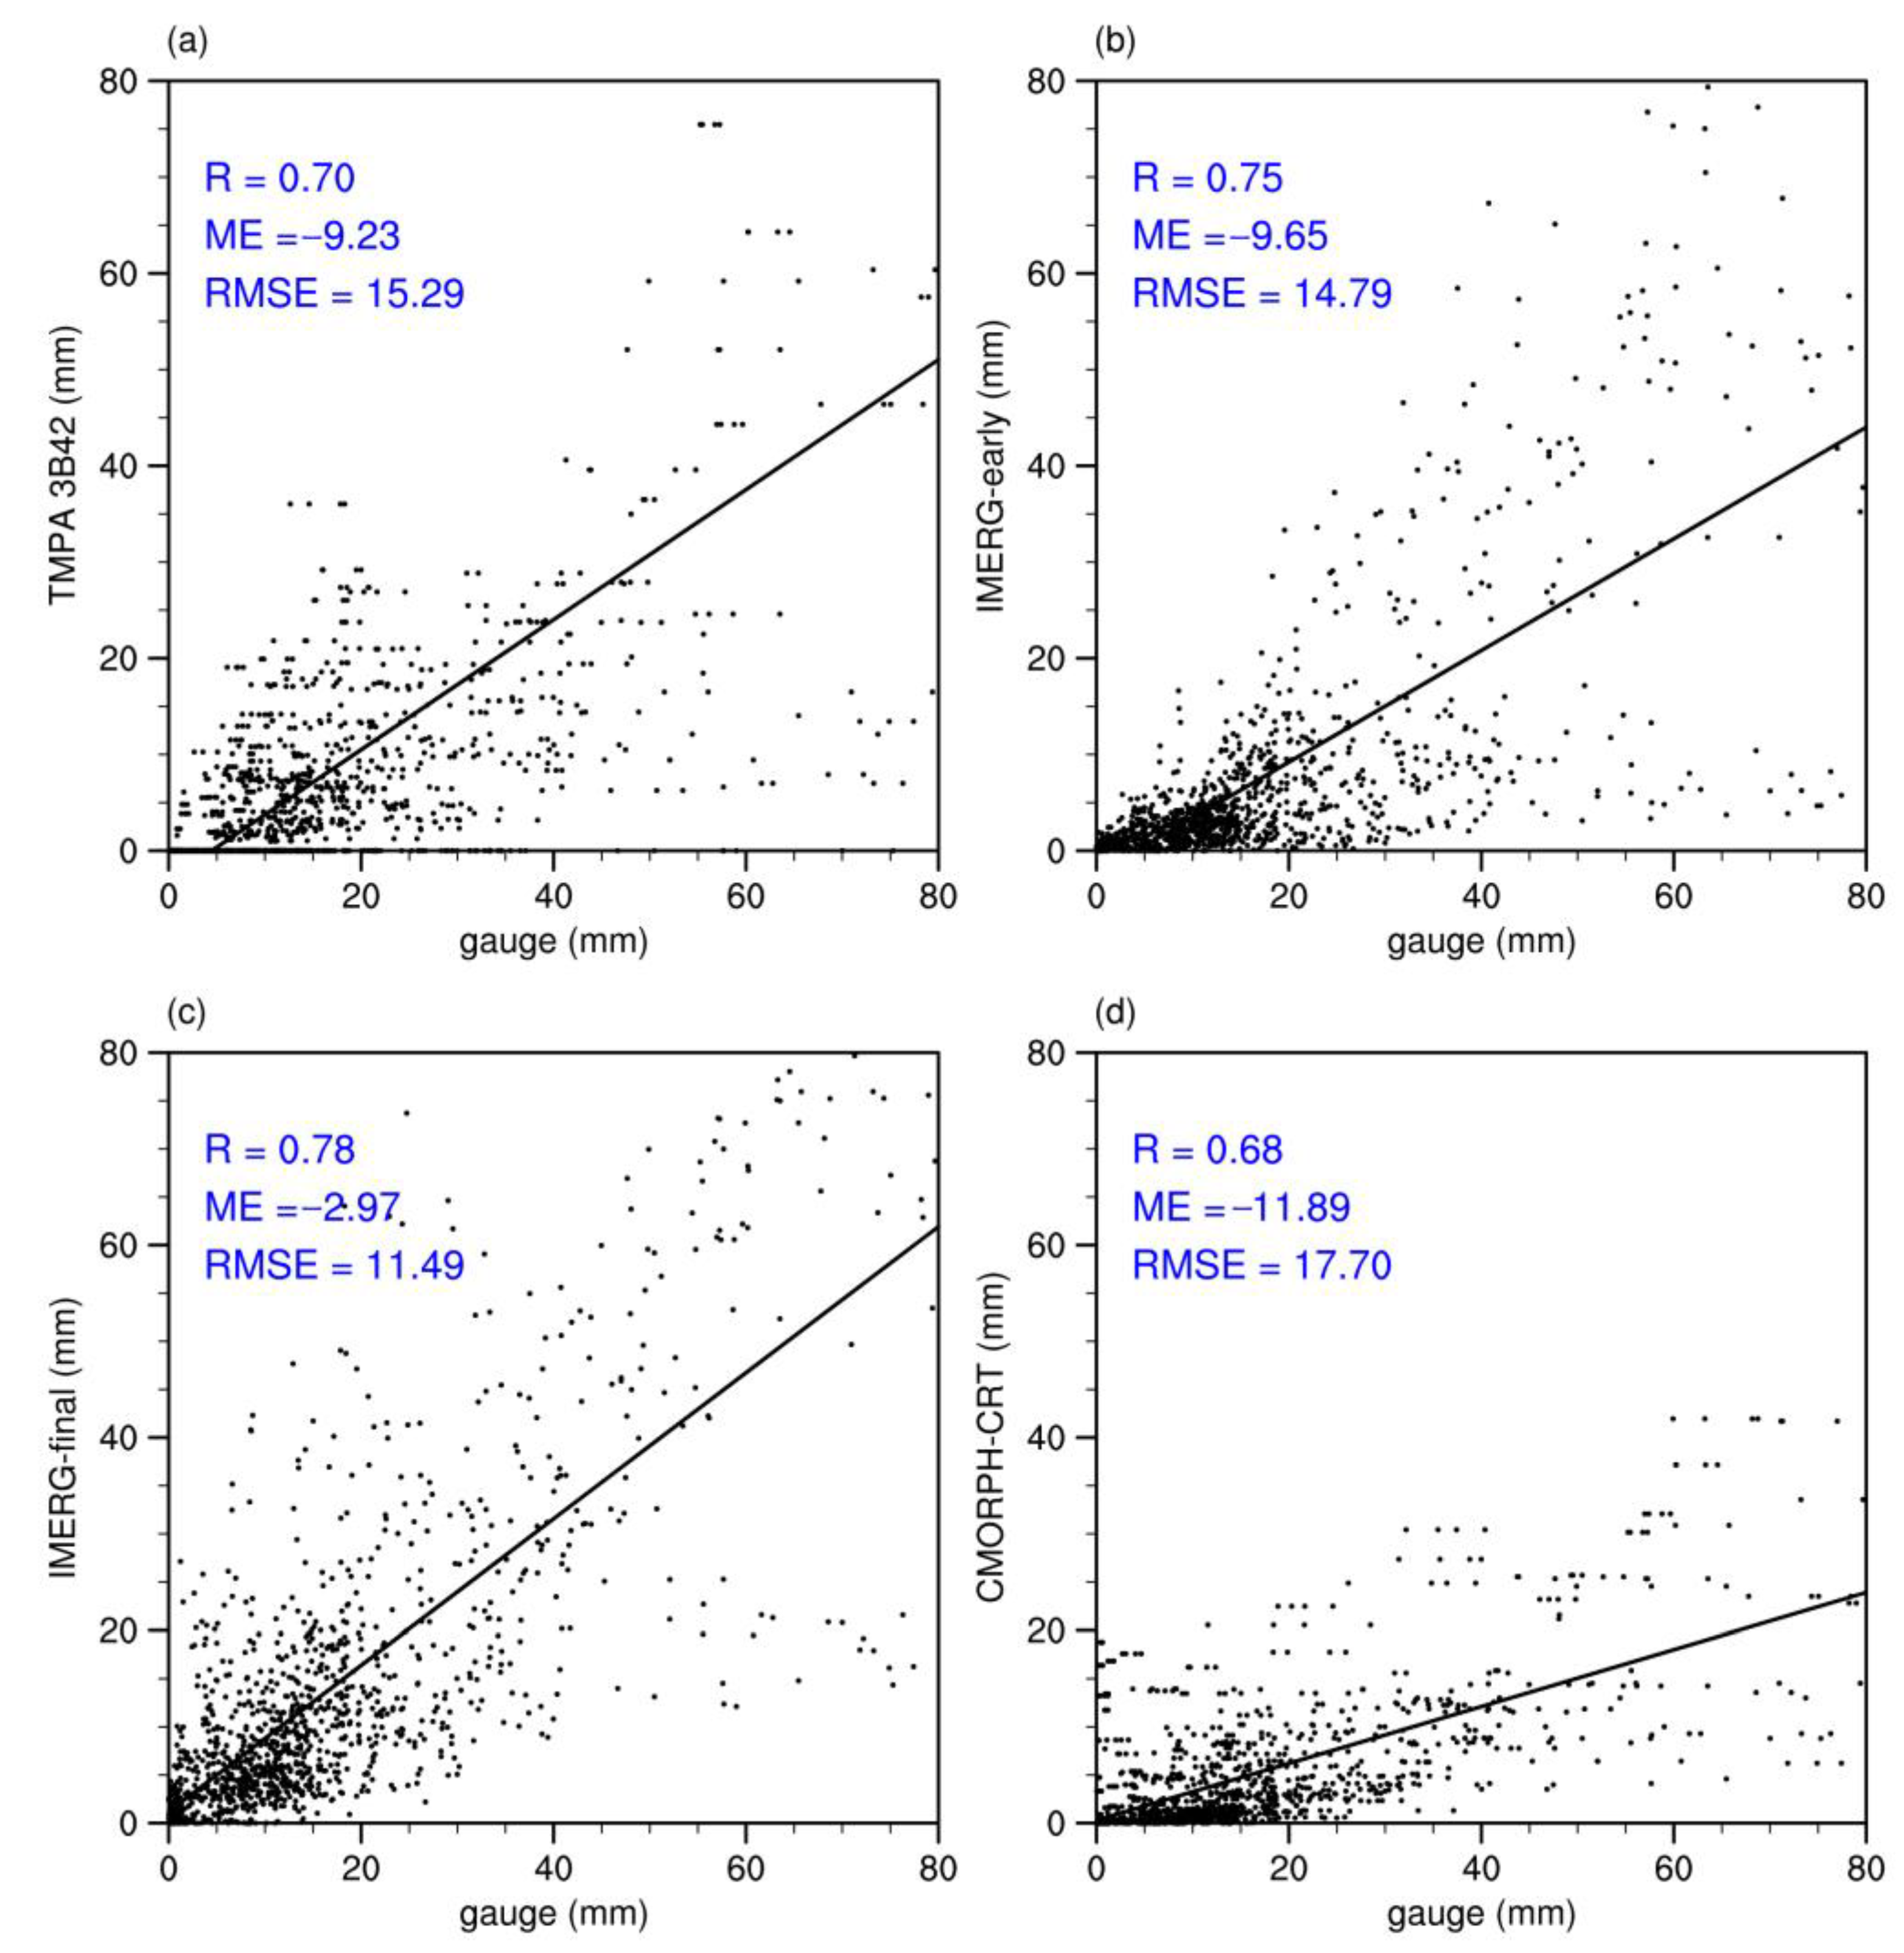
3.1. Evaluation of Satellite-Based Precipitation


3.2. Evaluation of DRIVE Outputs Driven by Different Precipitation
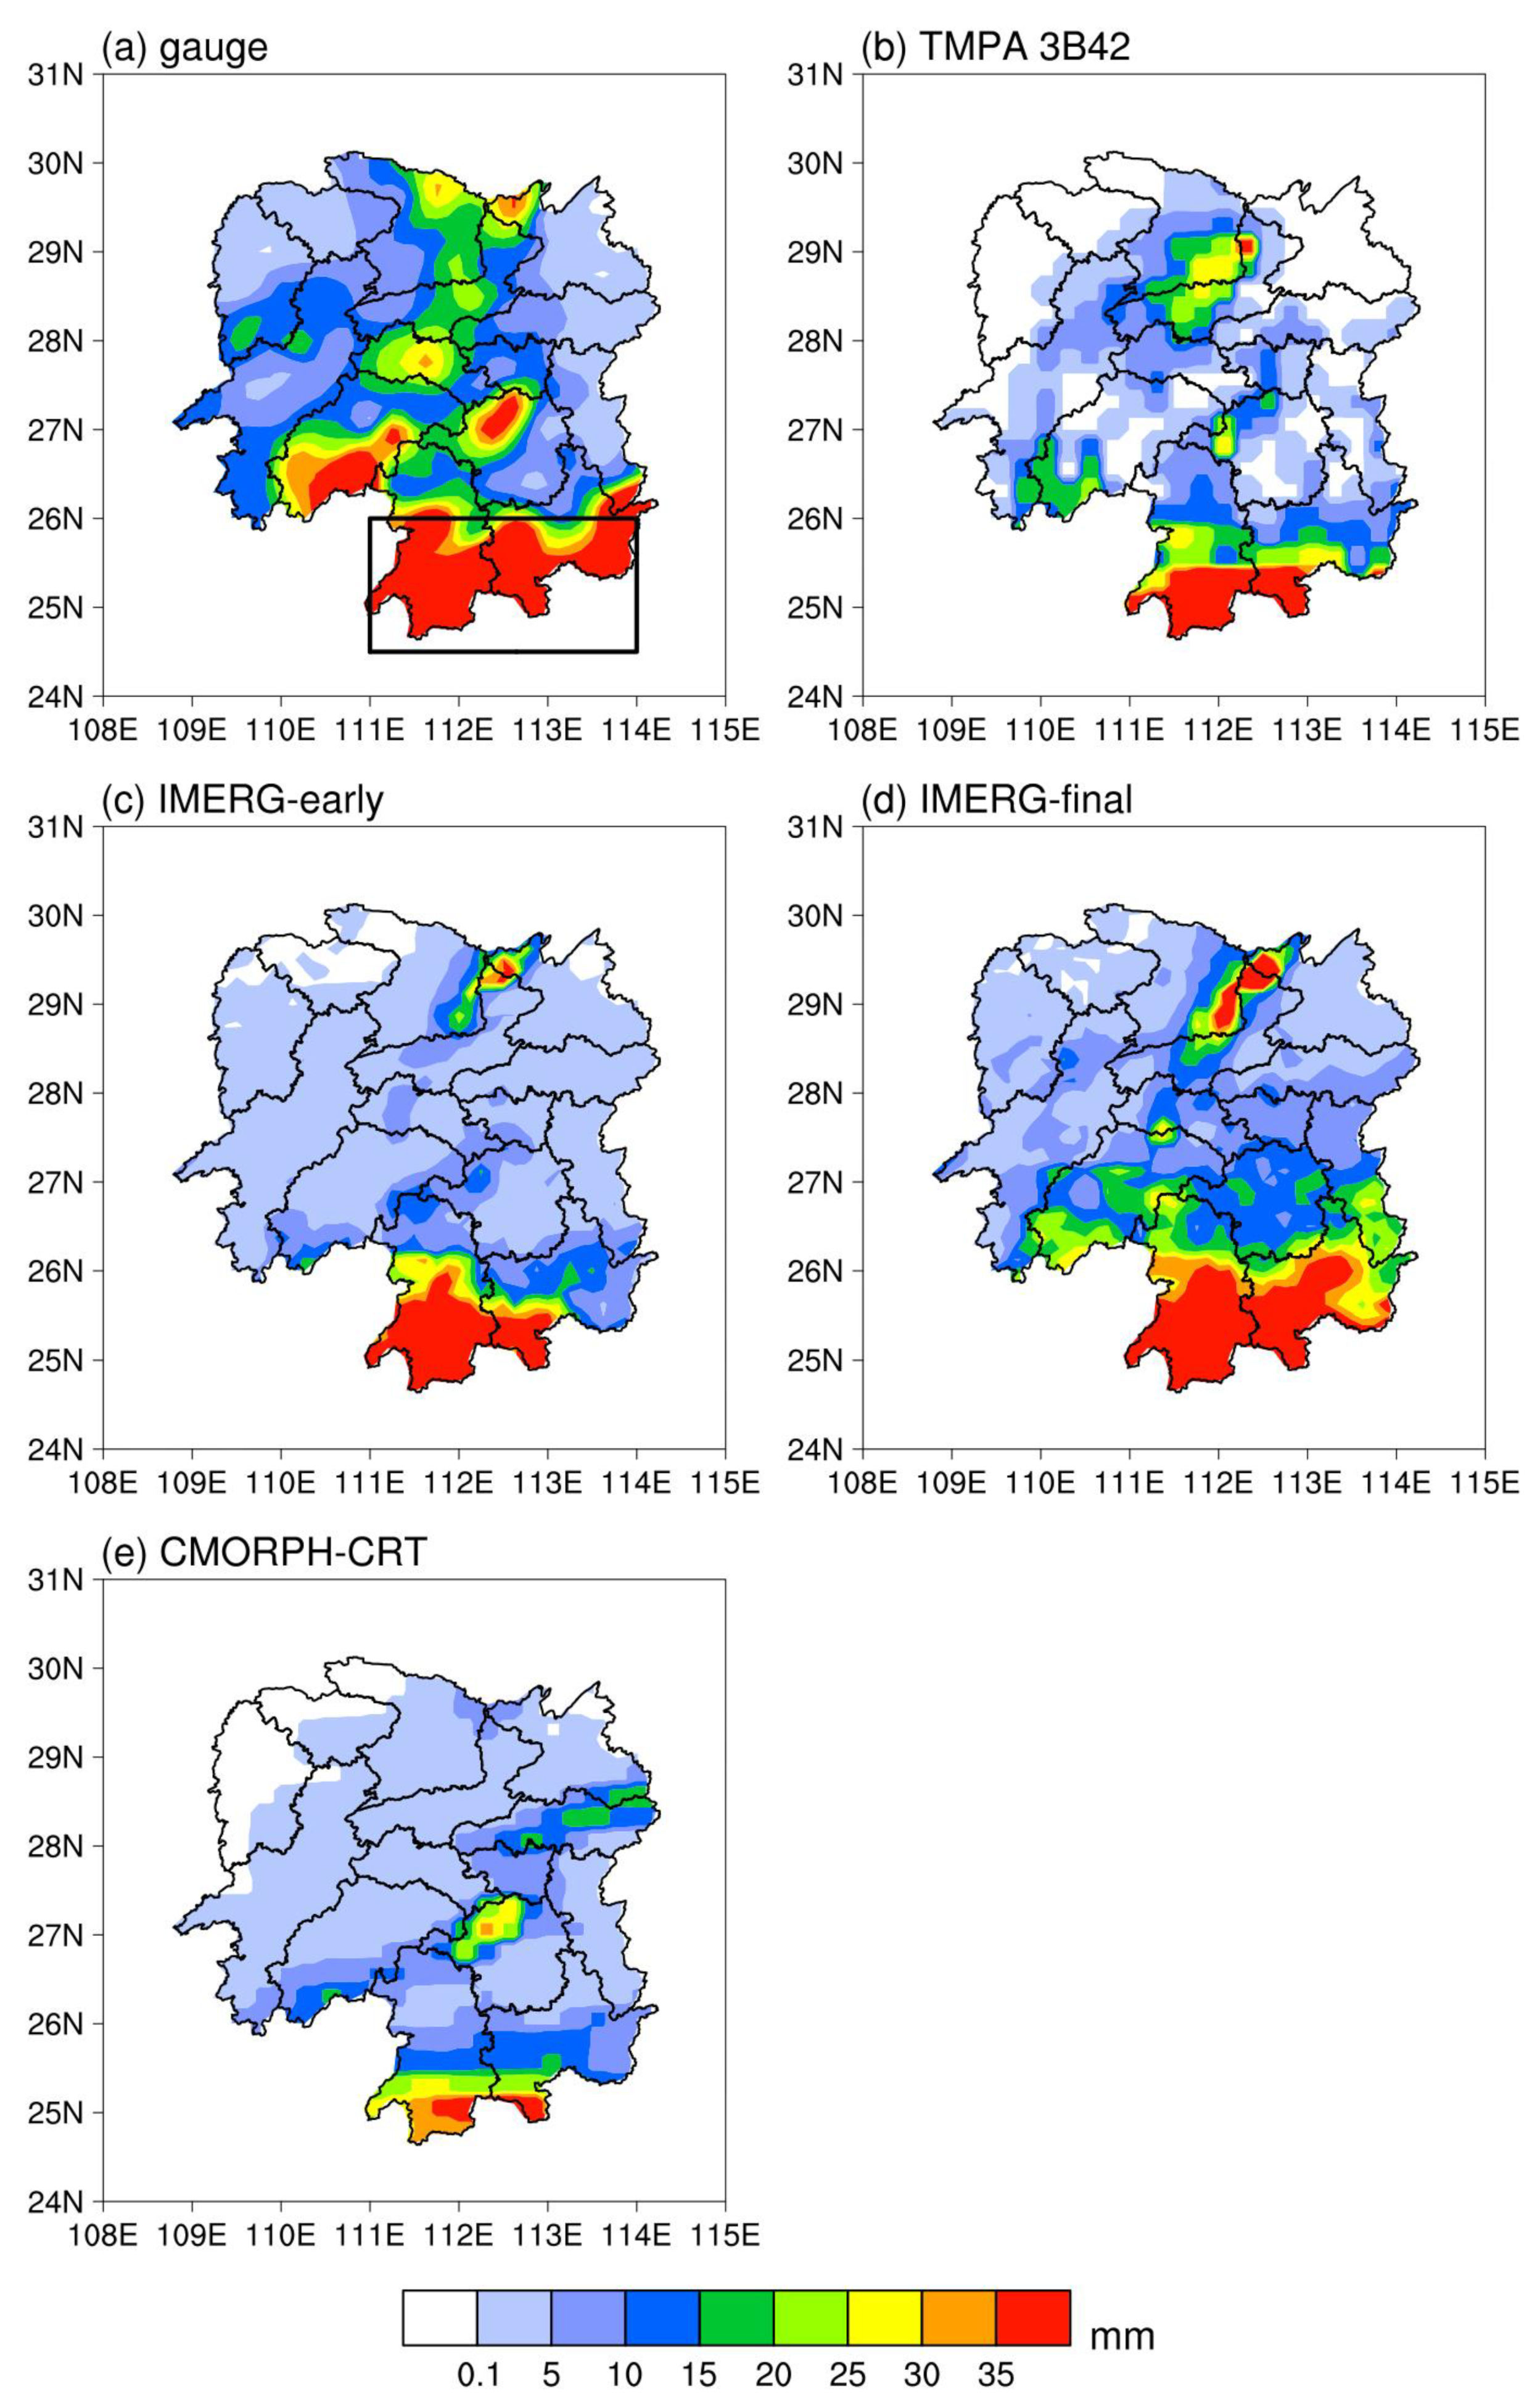
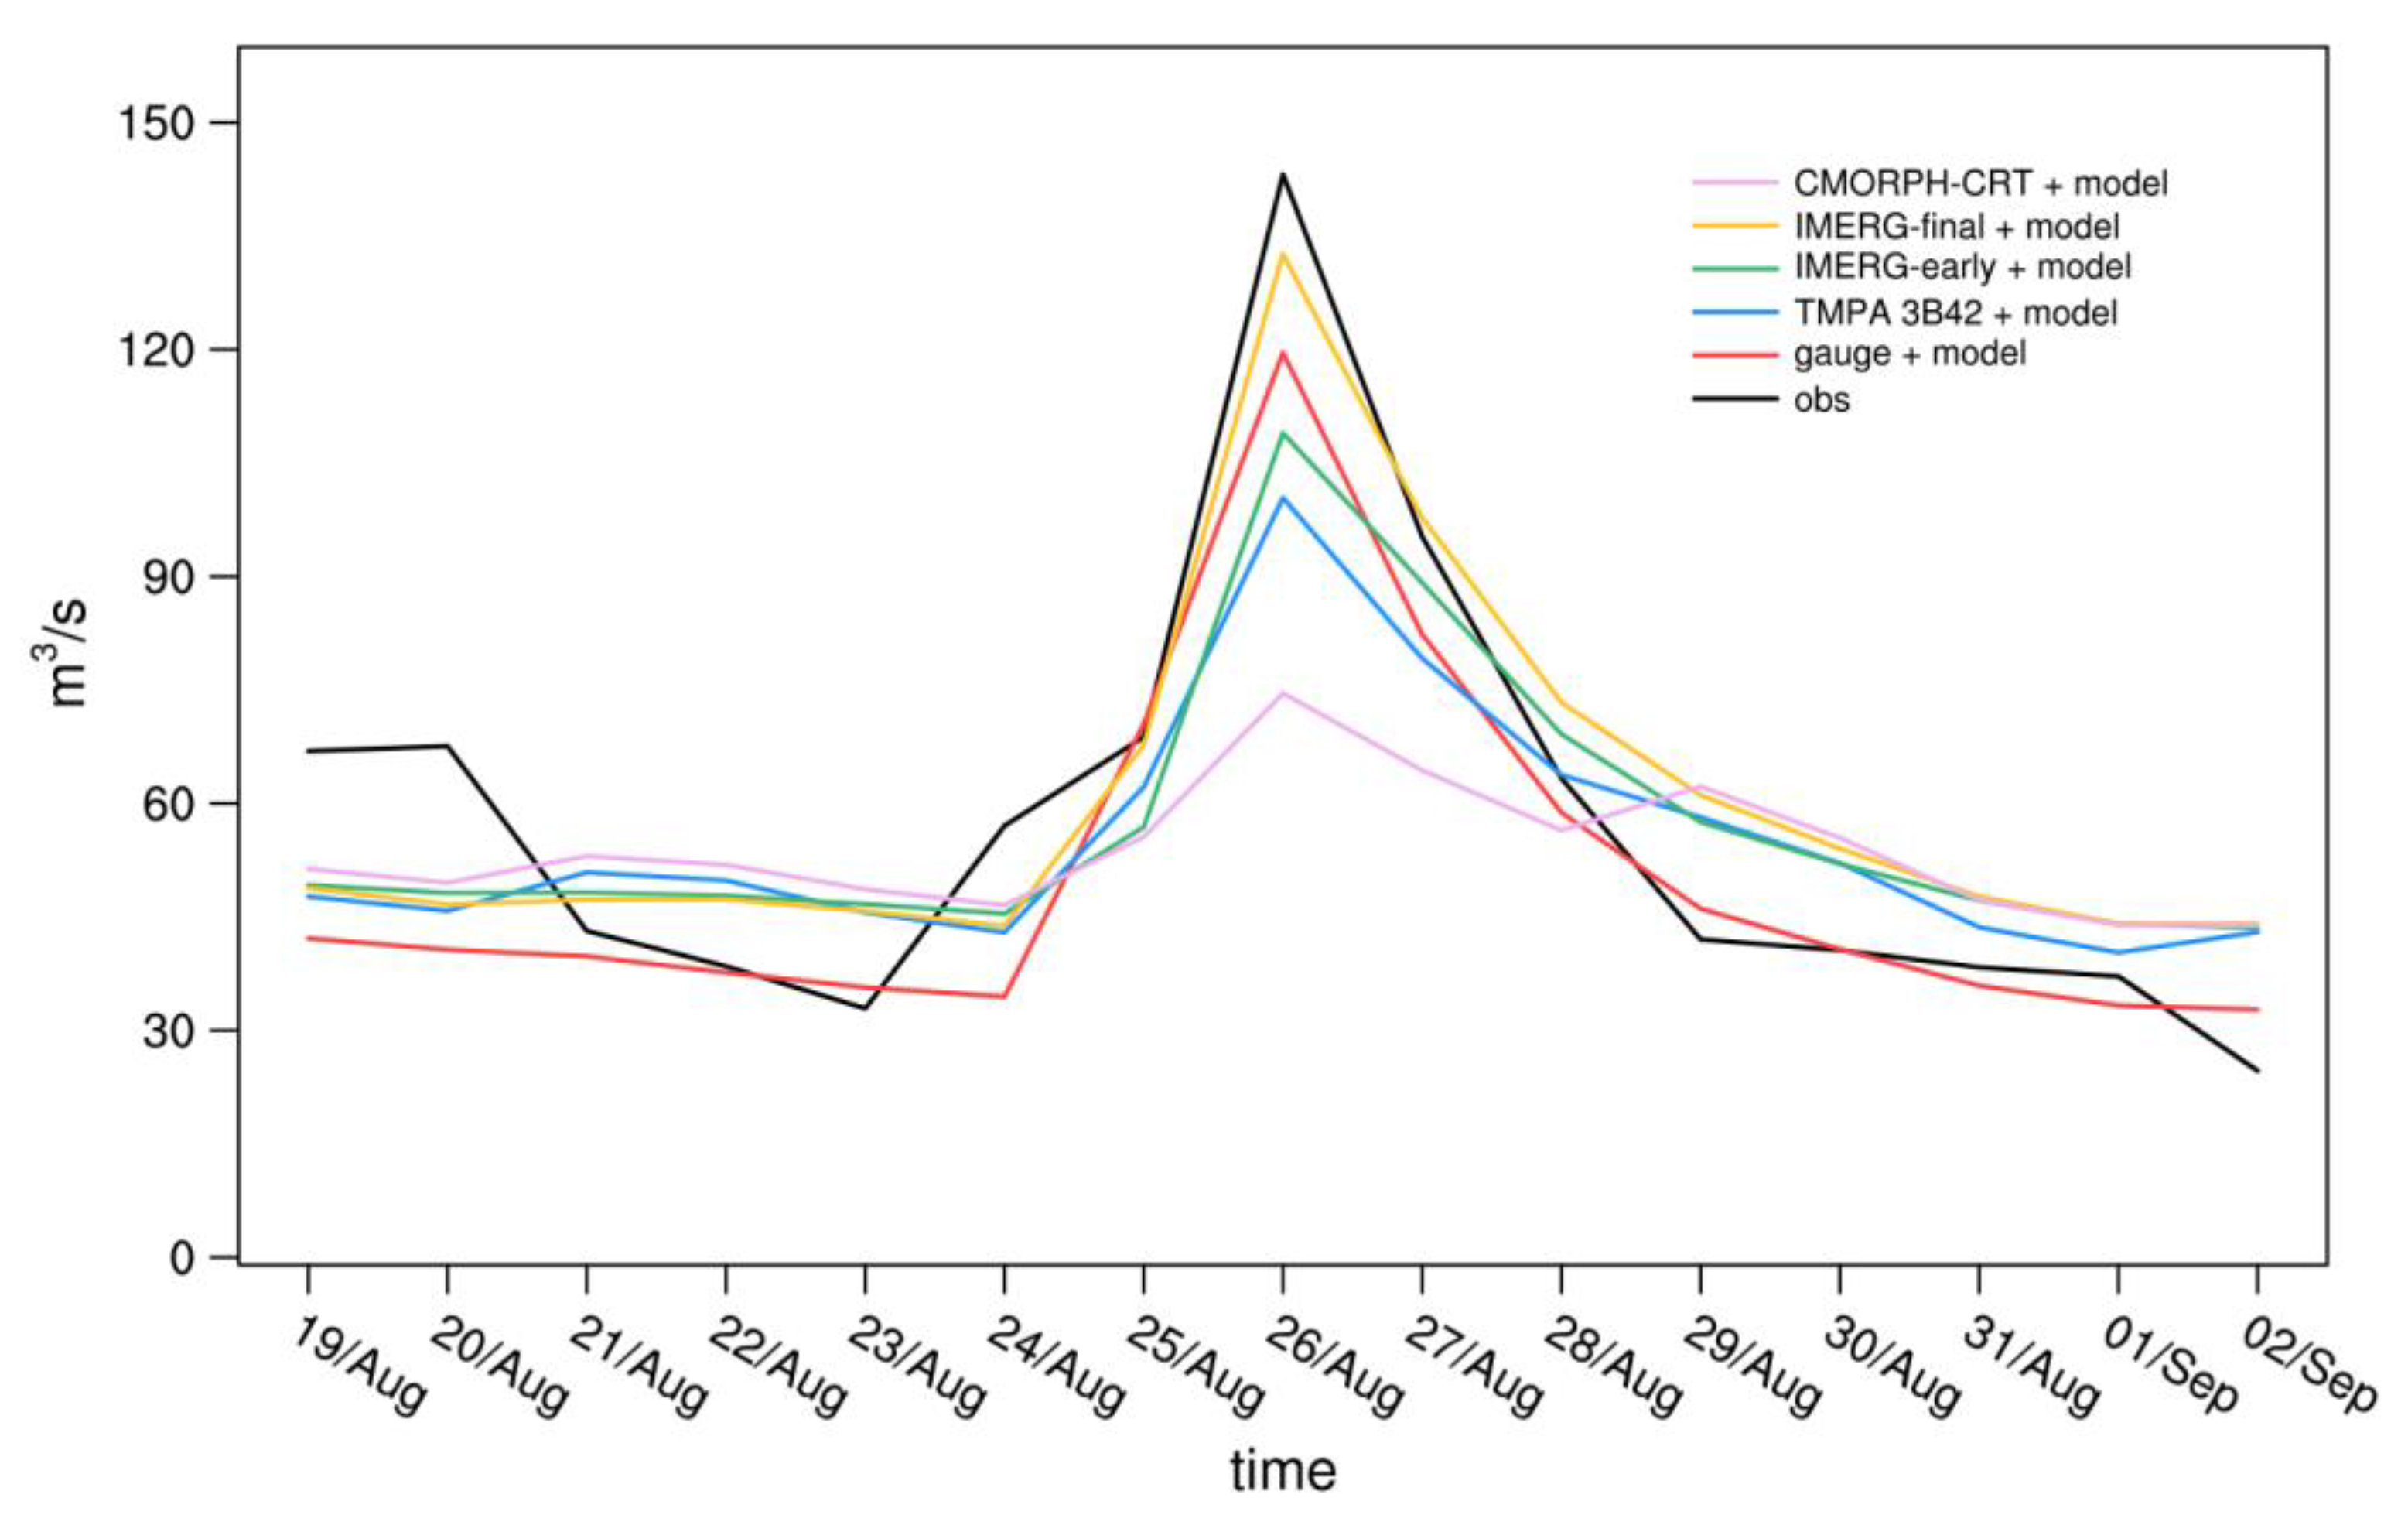
3.3. A Case Study of Typhoon Bailu
4. Discussion
5. Conclusions
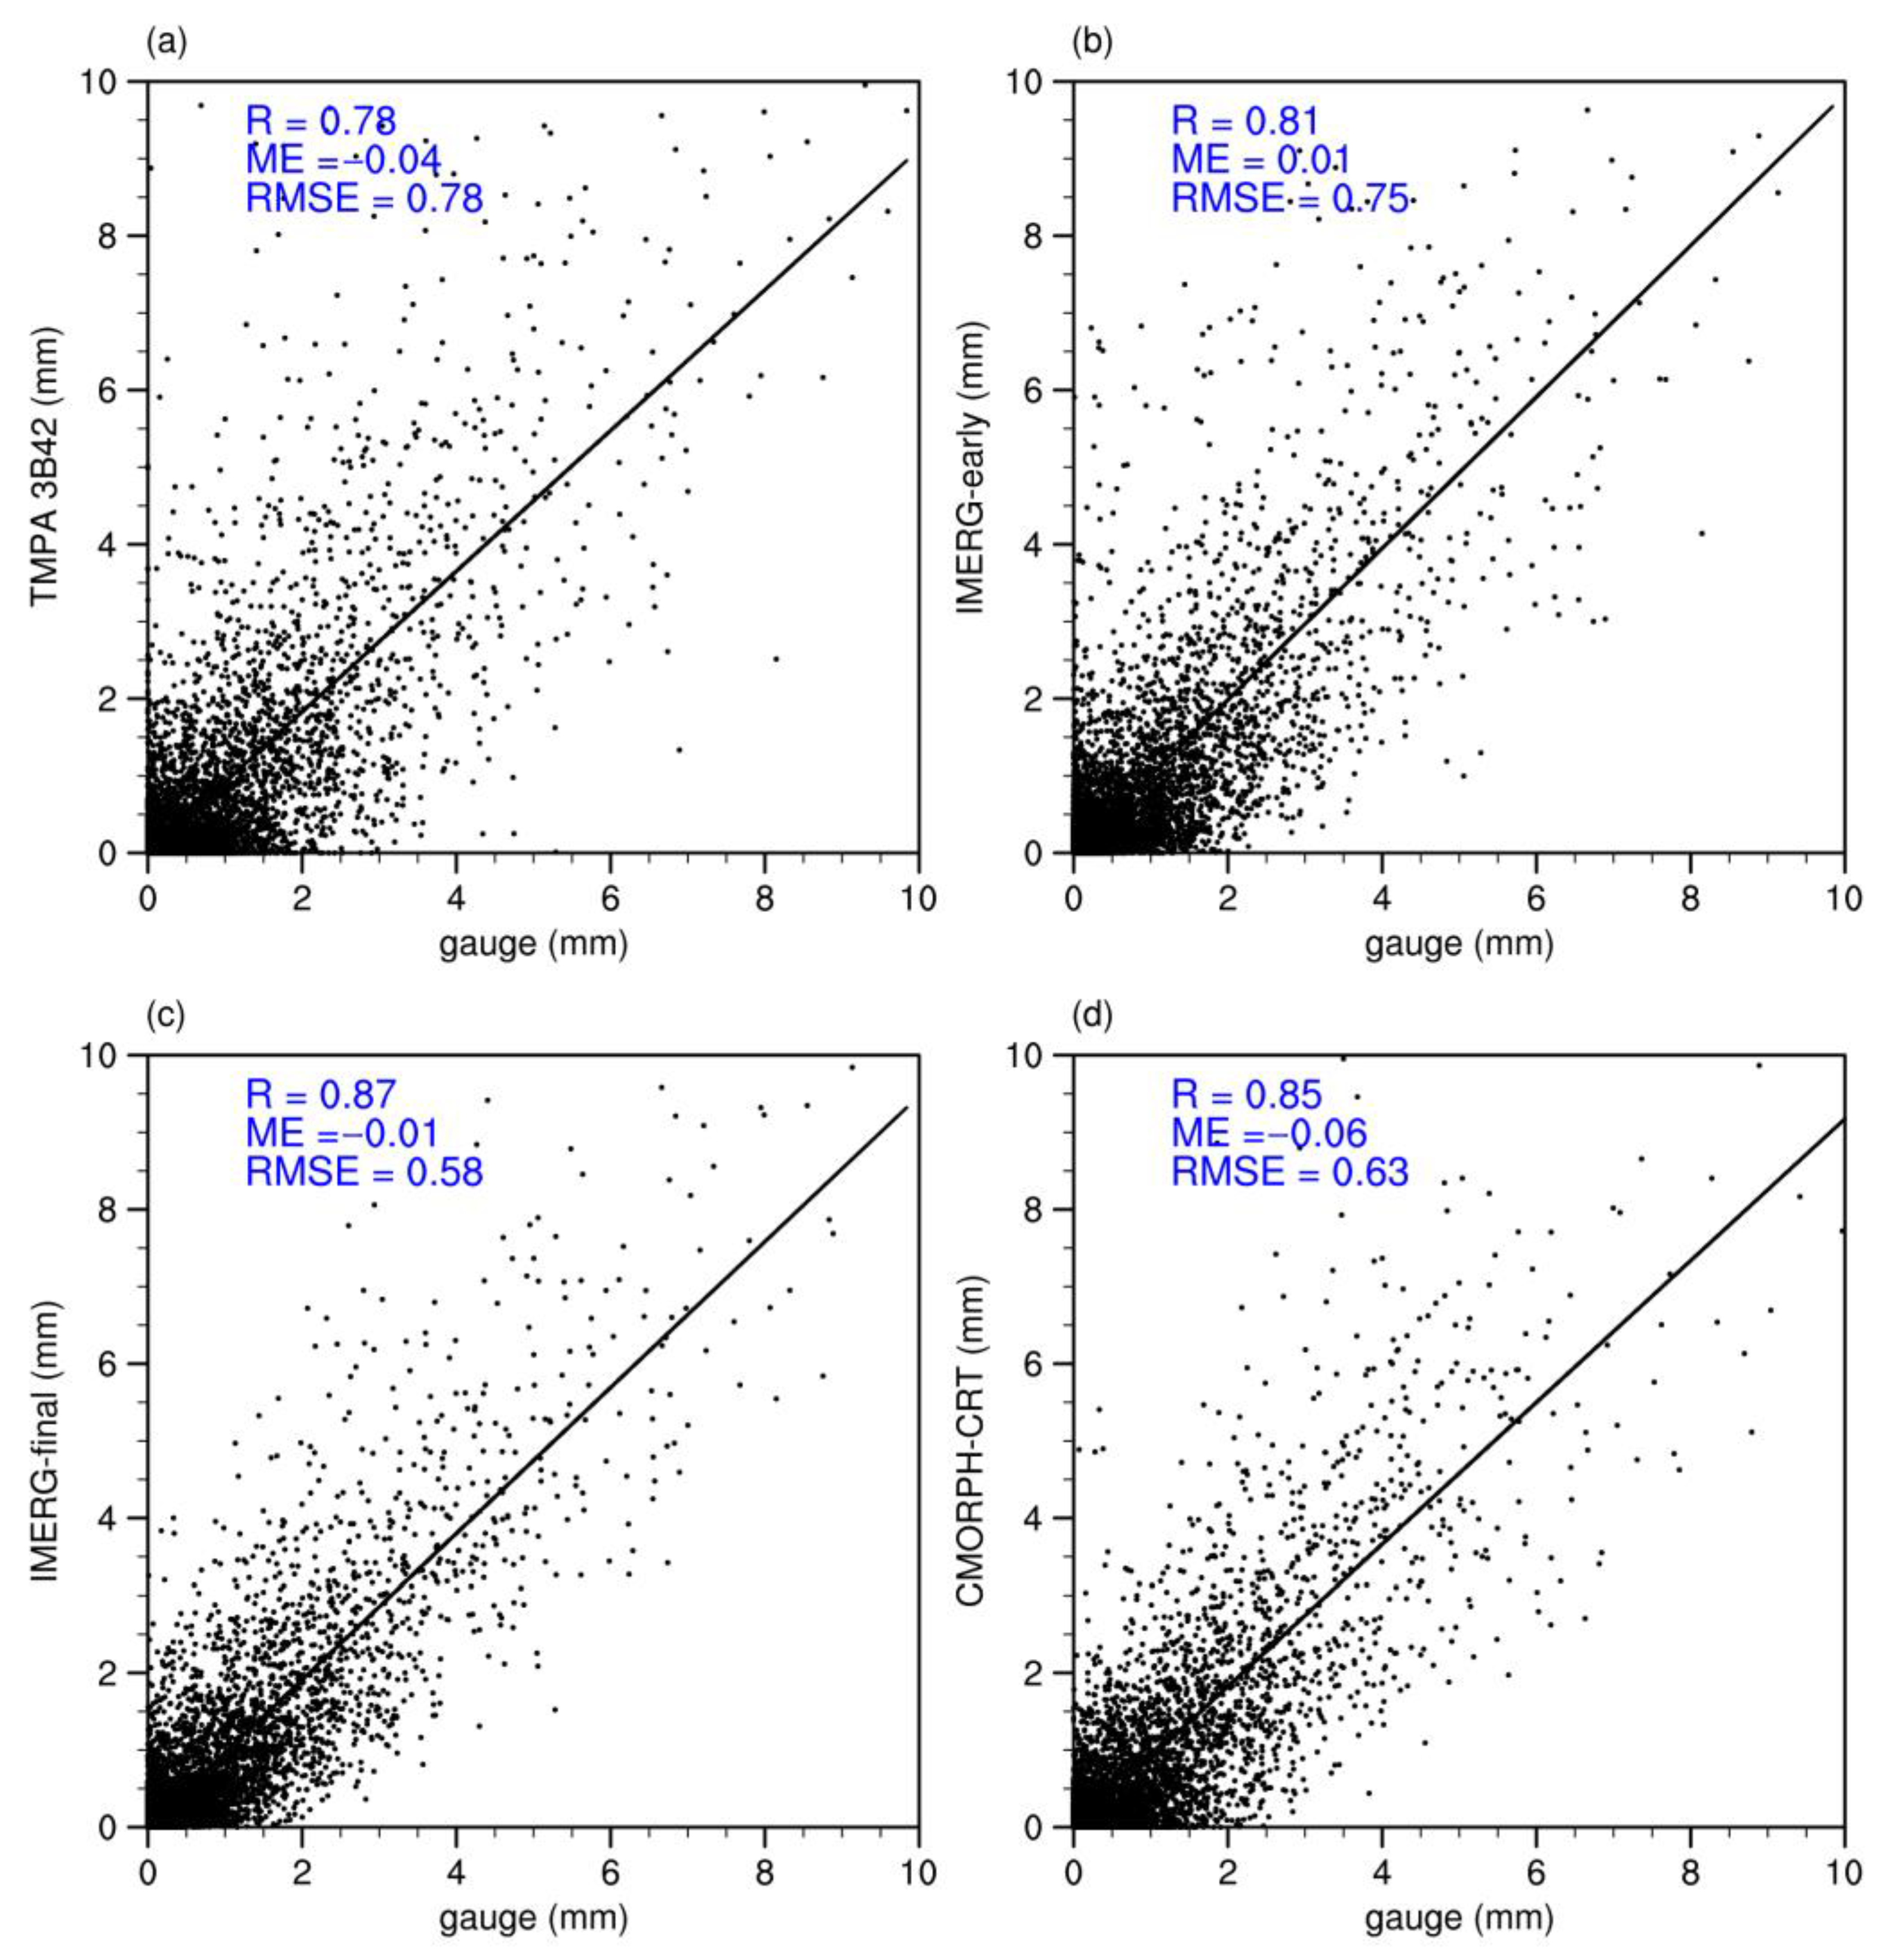
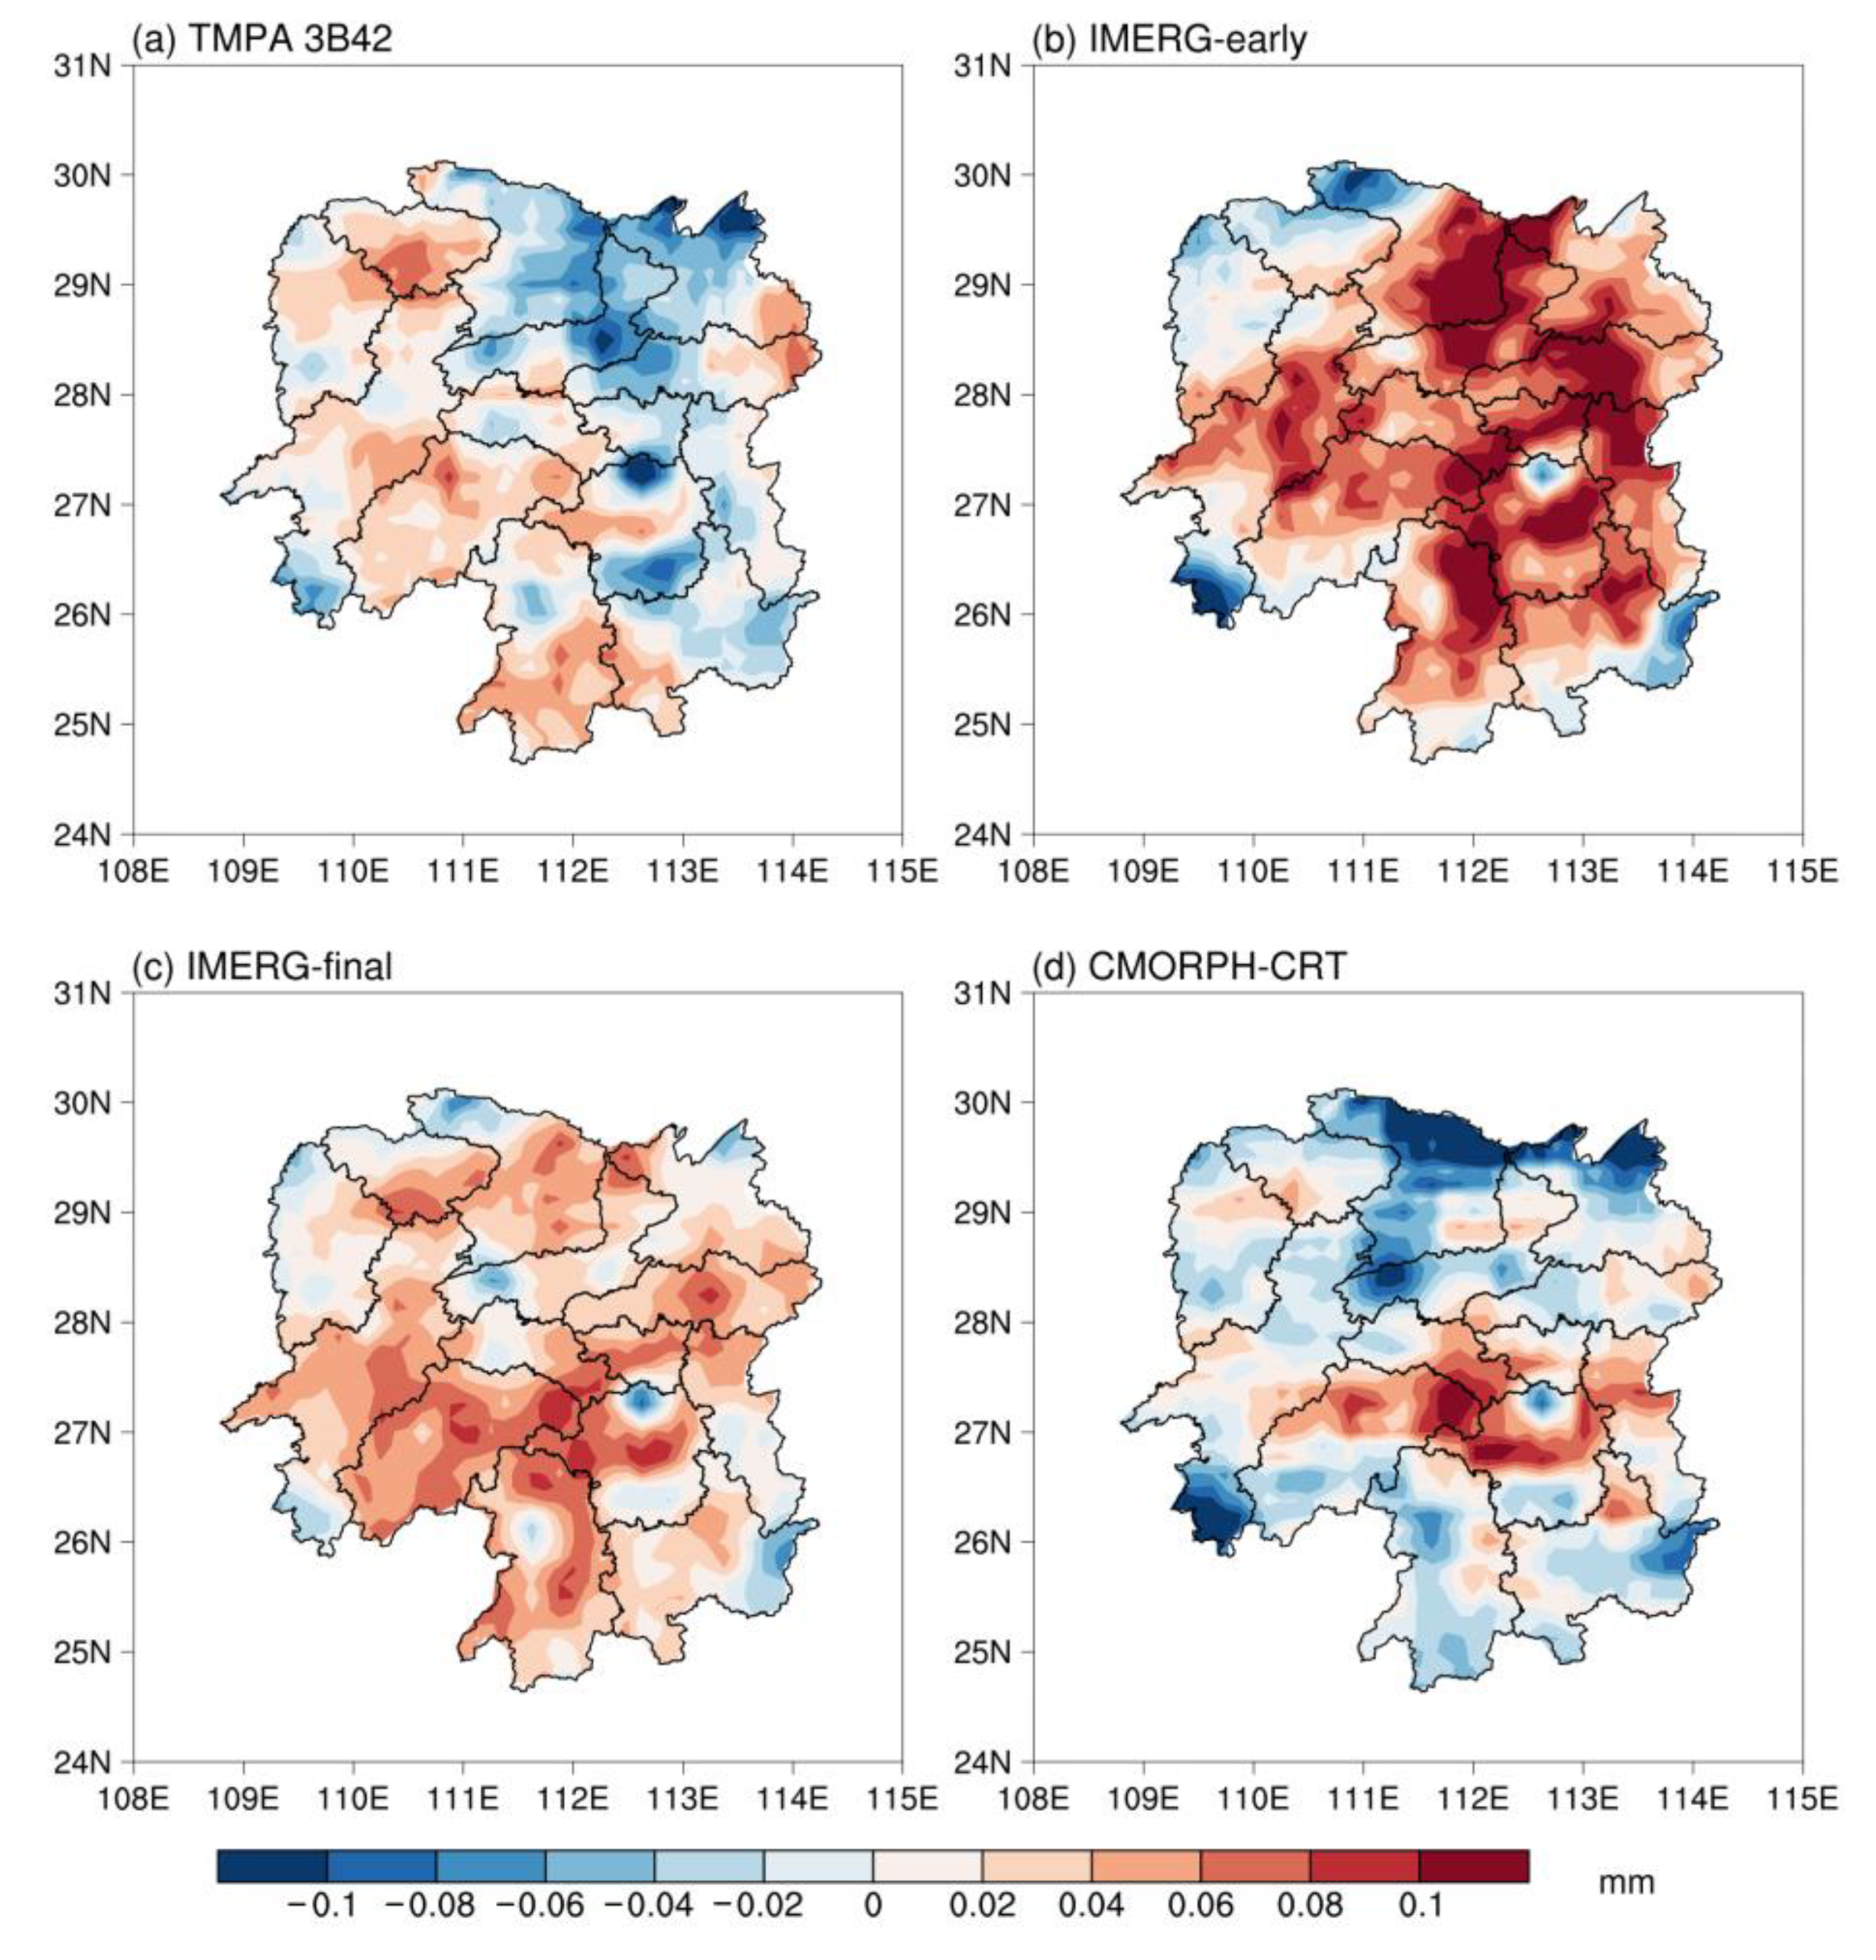
- (1)
- At the 3-hourly, regional scale, IMERG-final has the strongest correlation (with a CC of 0.87) and smallest RMSE (0.58 mm) with the gauge-based precipitation. The results of CMORPH-CRT and IMERG-early are consistent with those of gauge-based observations (with CCs of 0.85 and 0.81, respectively), whereas TMPA 3B42 performs the worst relatively, with a CC of 0.78. IMERG-early overestimates the precipitation, whereas IMERG-final, TMPA 3B42, and CMORPH-CRT underestimates it.
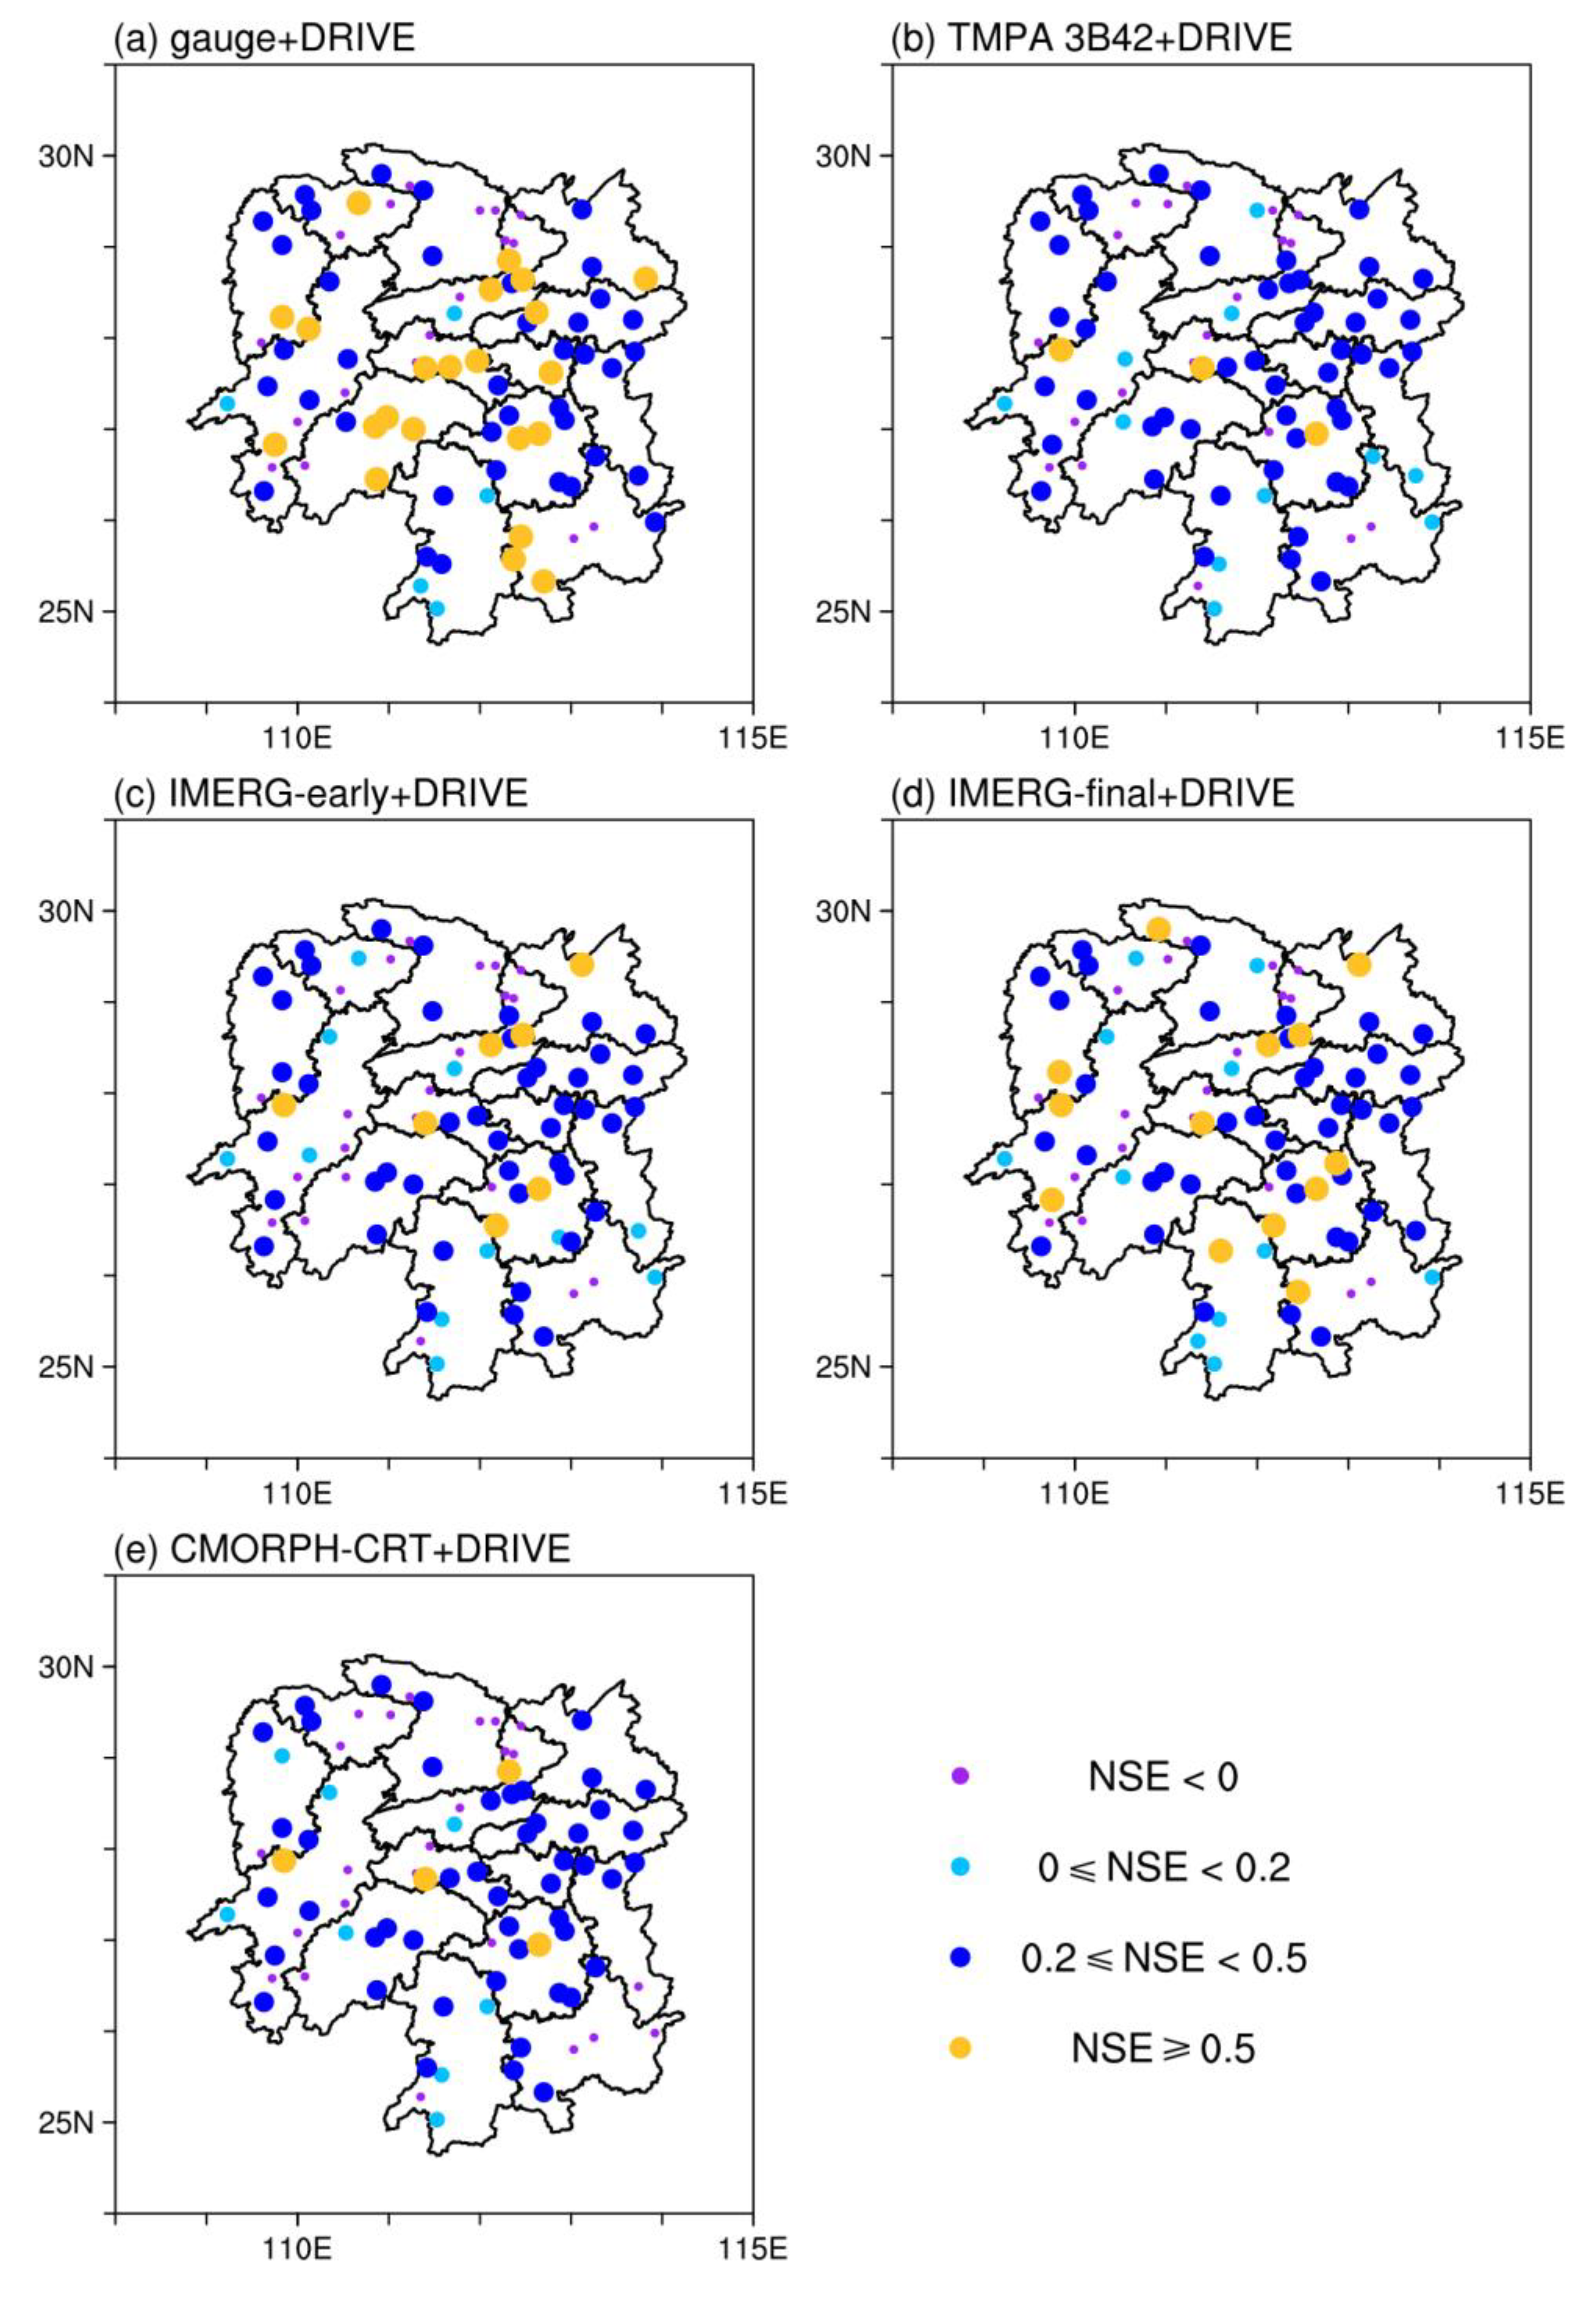
- (2)
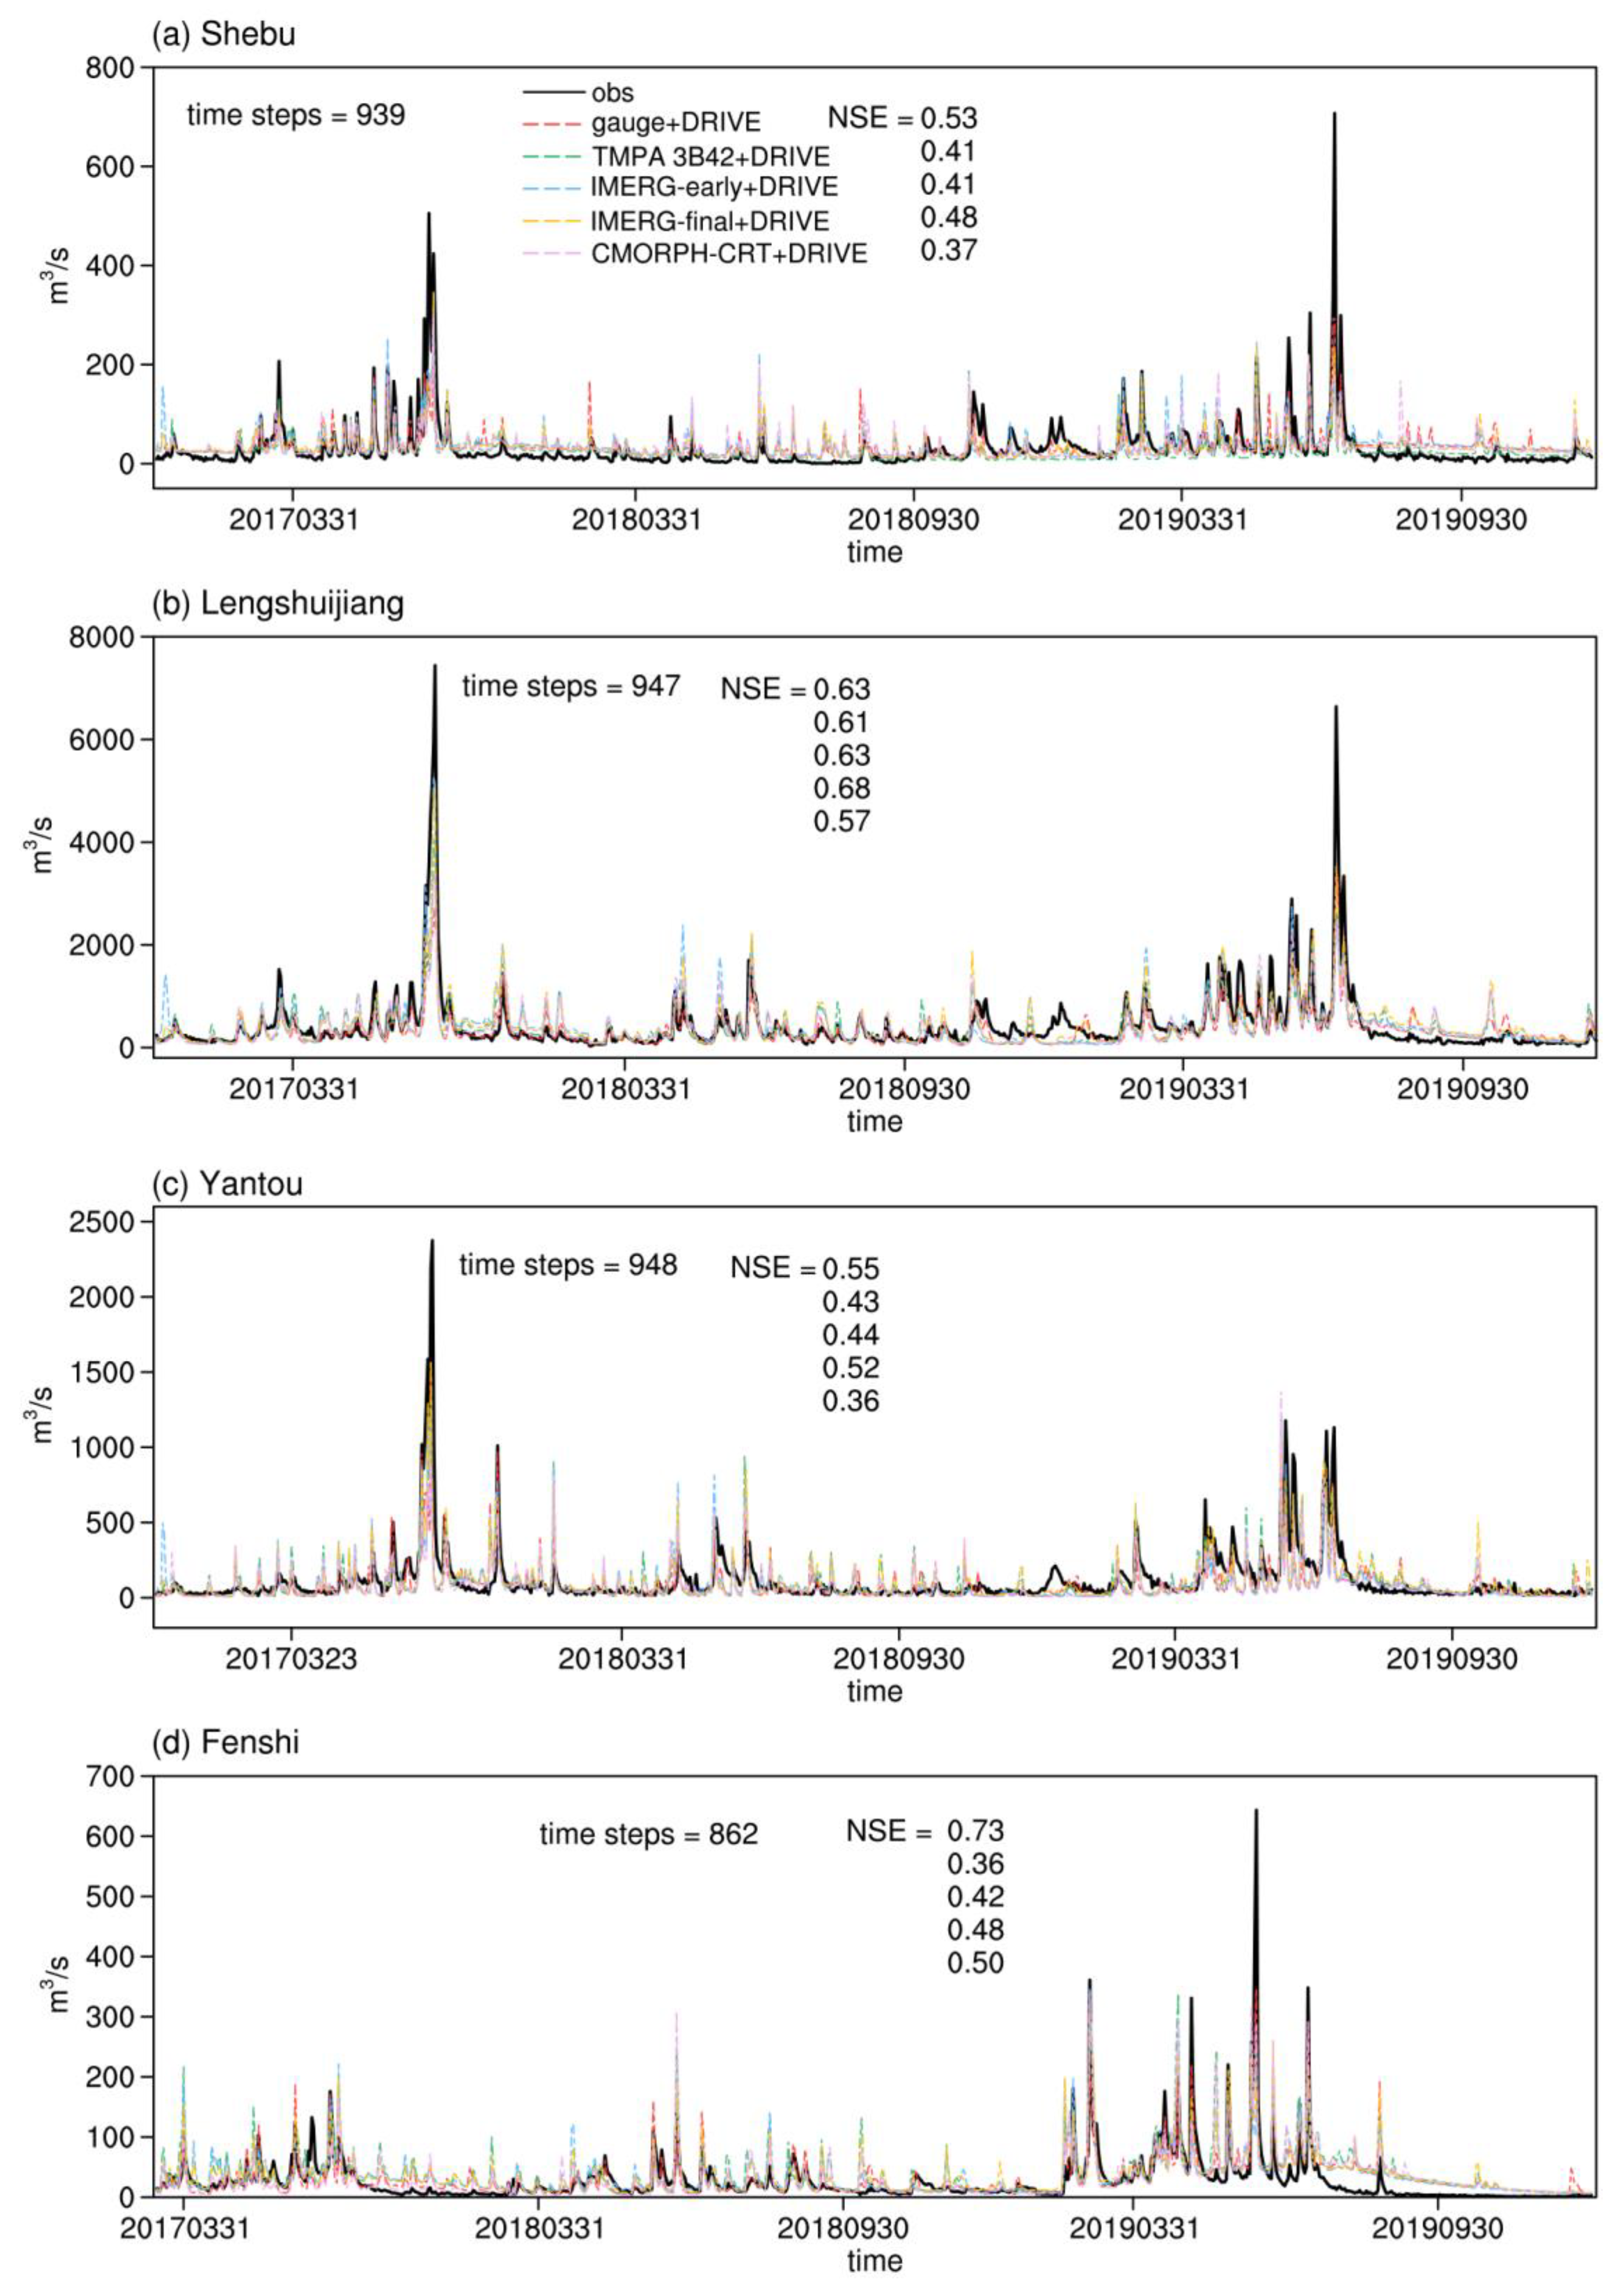
- The gauge-based observations and four satellite-based precipitation products perform well in a hydrological application. The gauge-based observation performs the best in terms of estimating streamflow, with NSE values for 66 gauges (79%) are positive and 22 gauges (26%) are larger than or equal to 0.5. IMERG-final is more accurate than the IMERG-early, TMPA 3B42, and CMORPH-CRT regarding streamflow simulations.
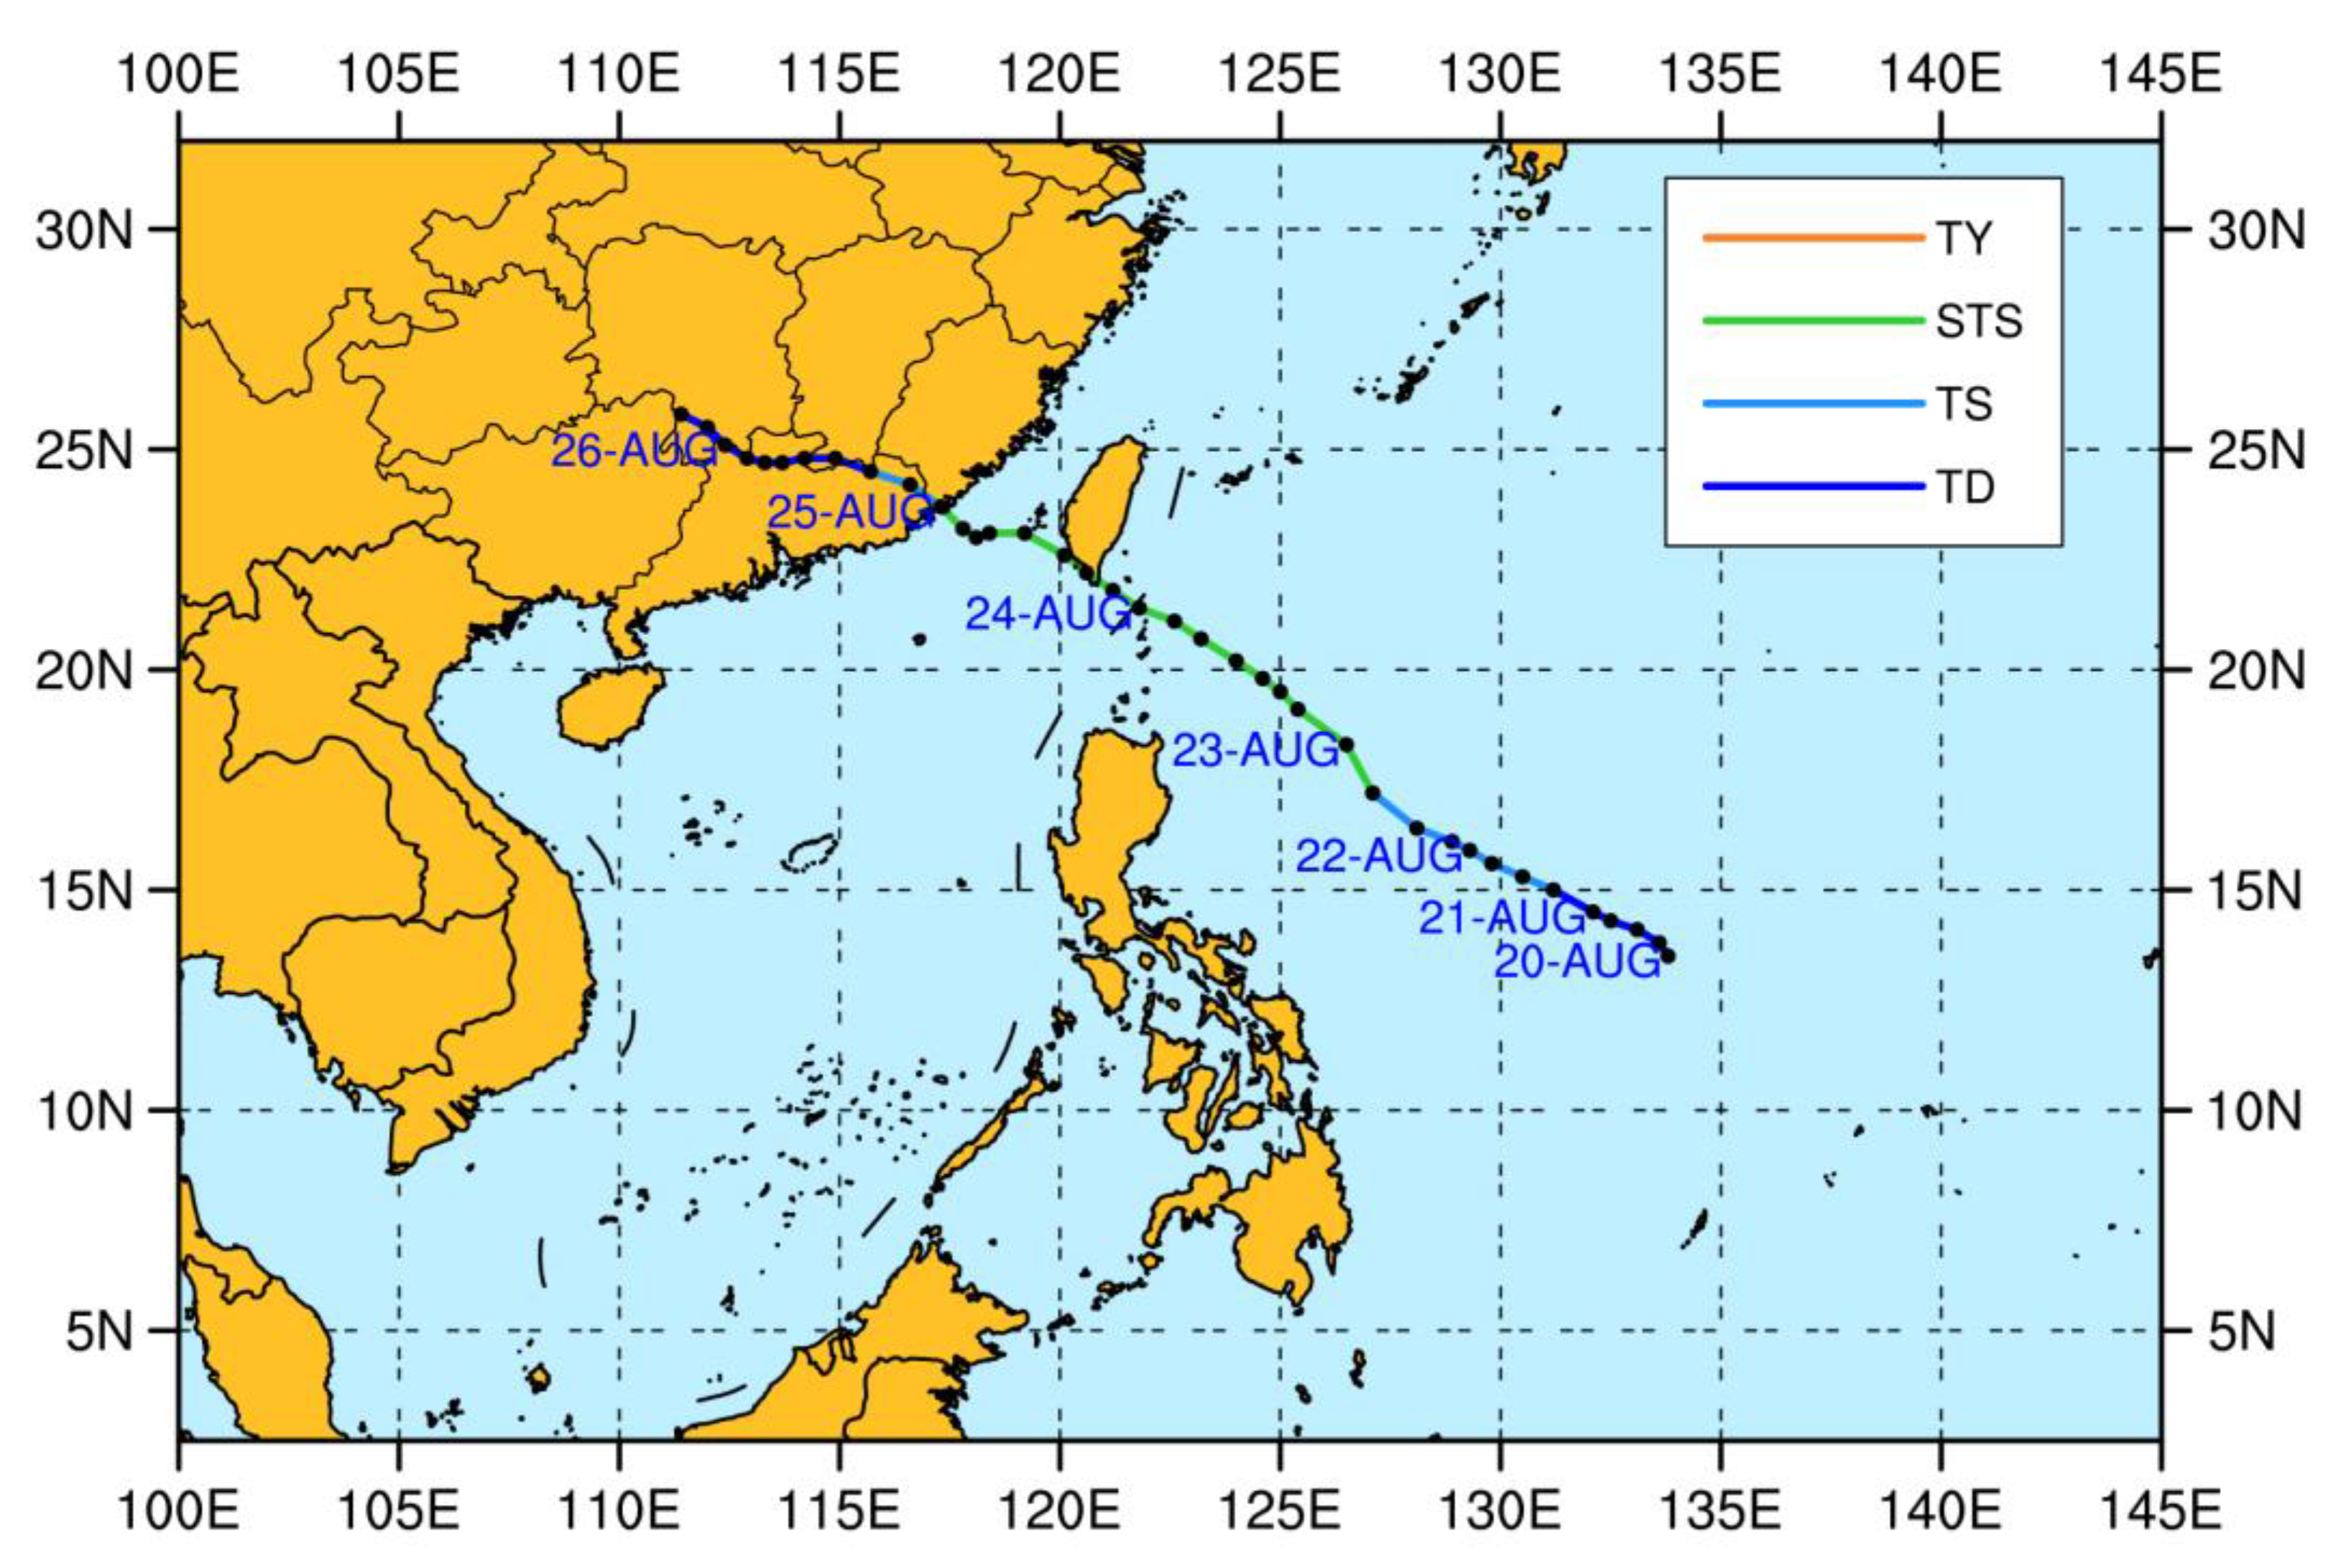
- (3)
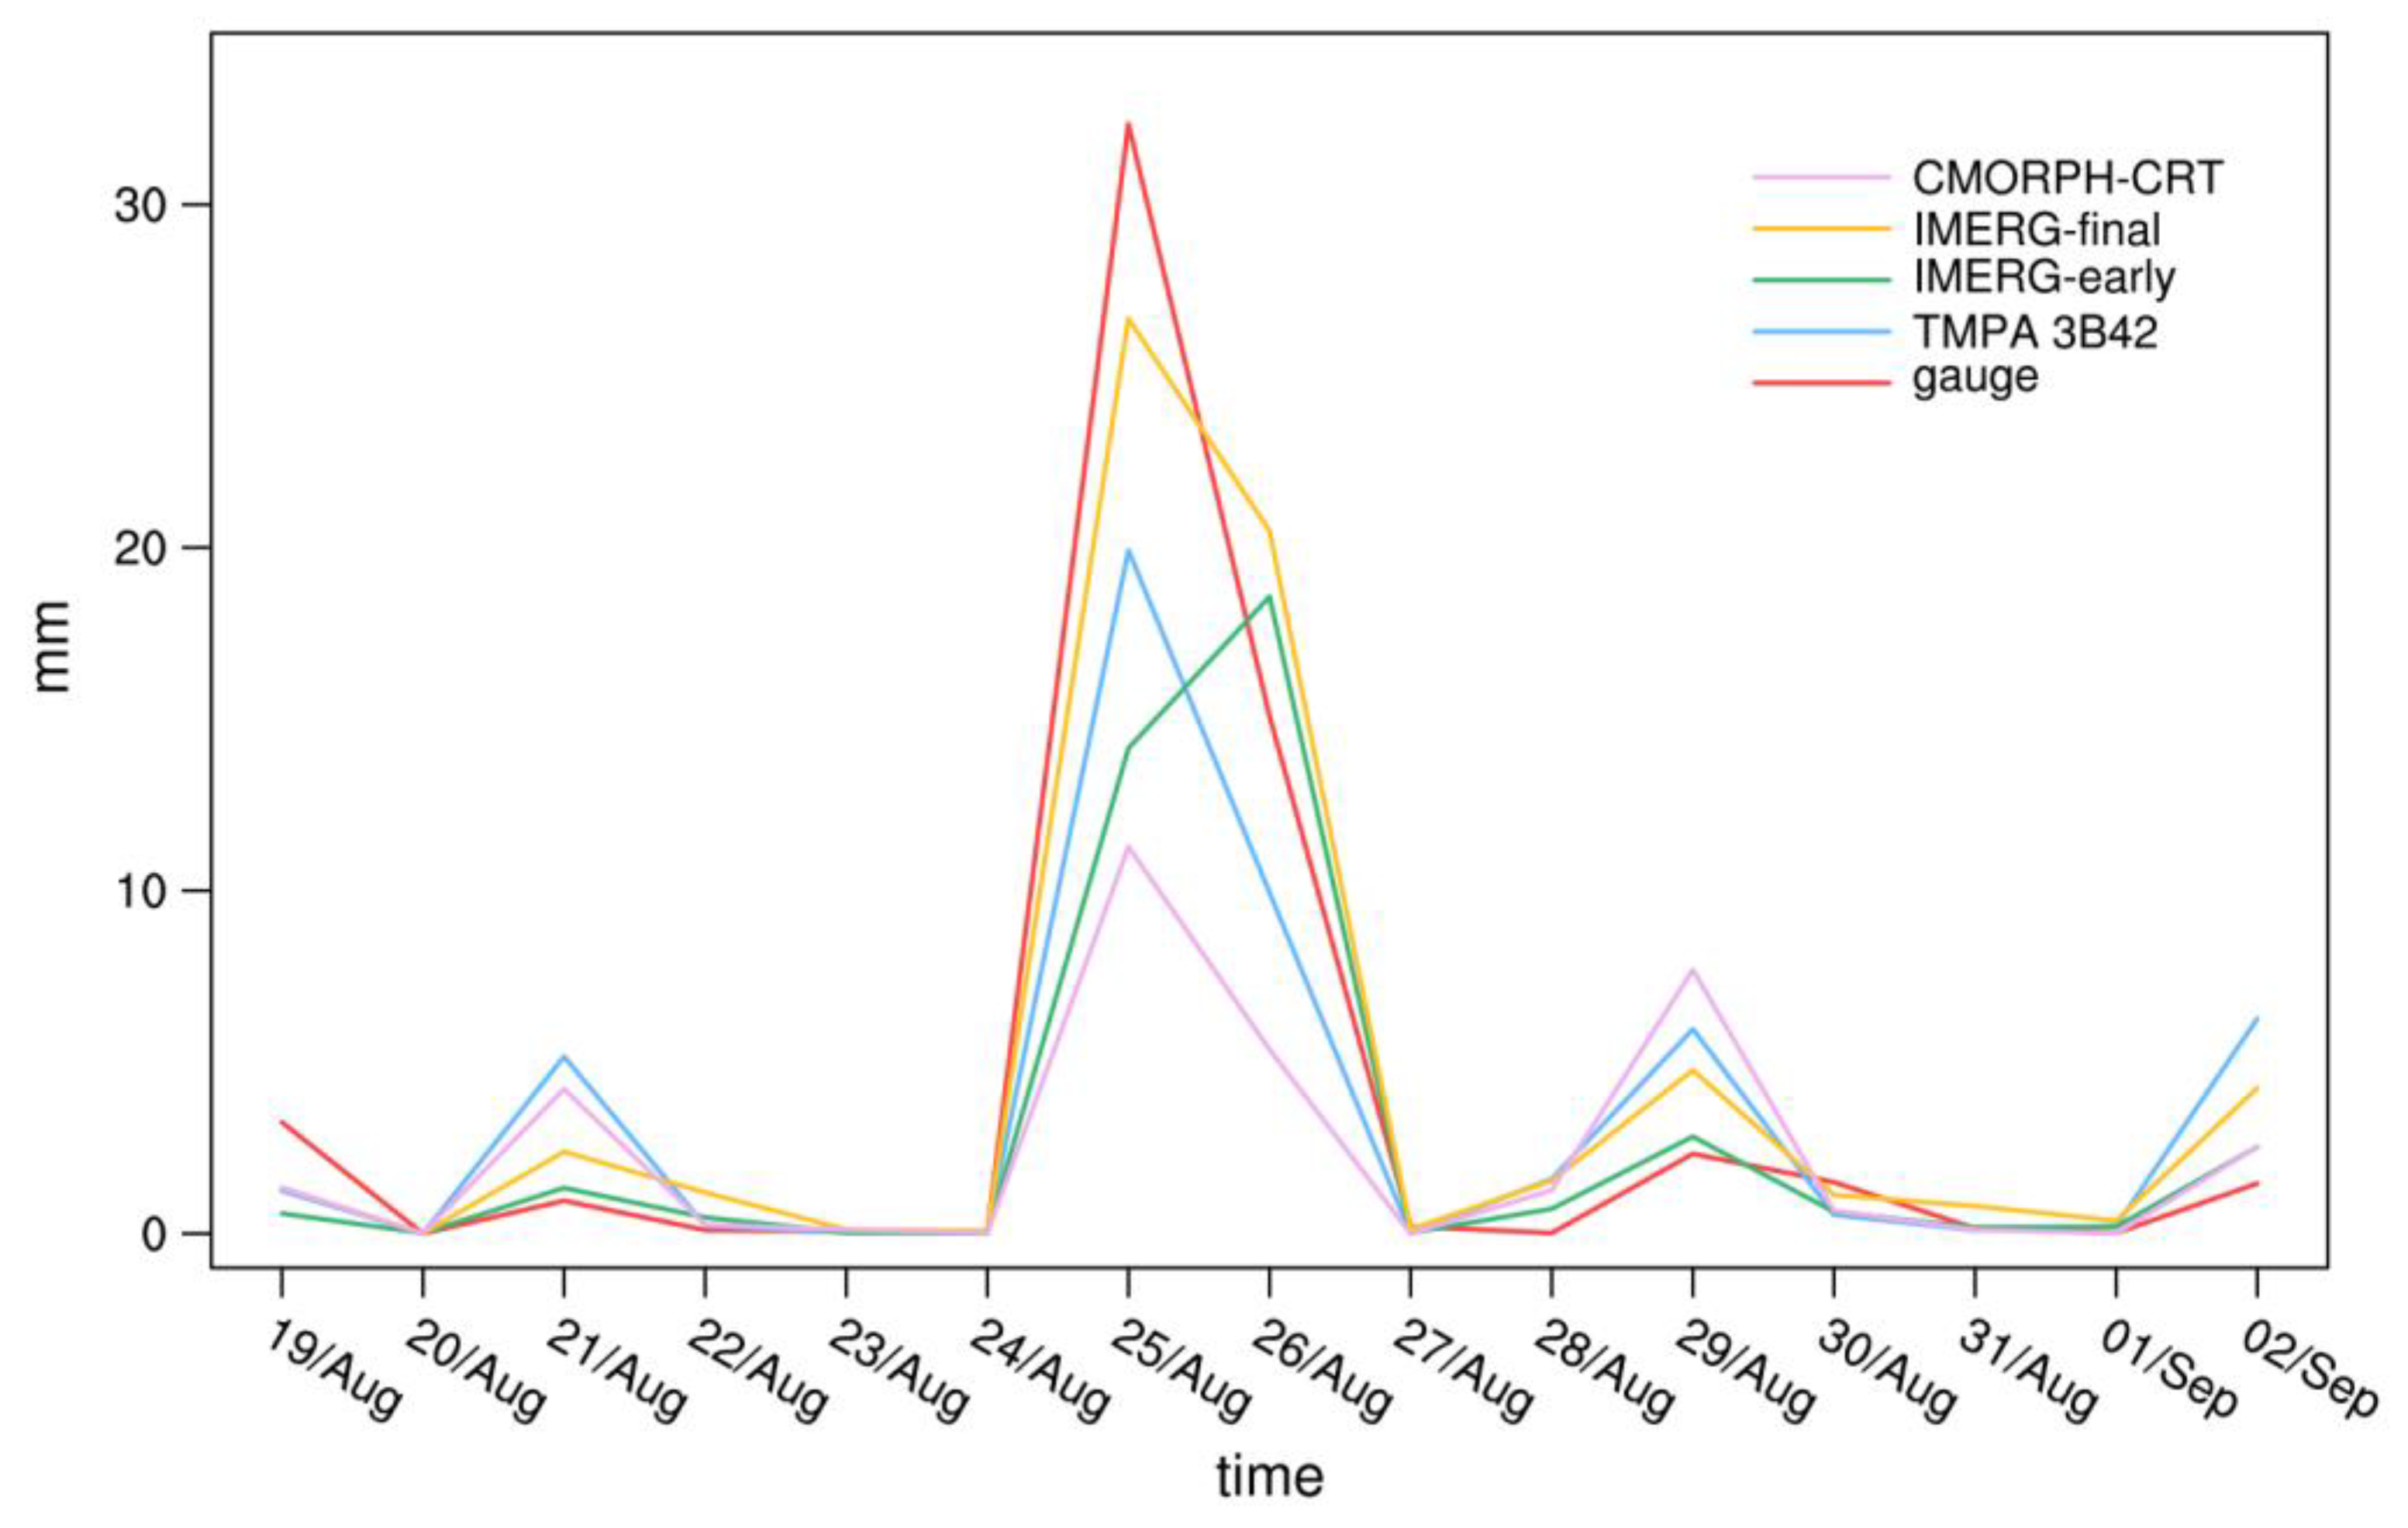
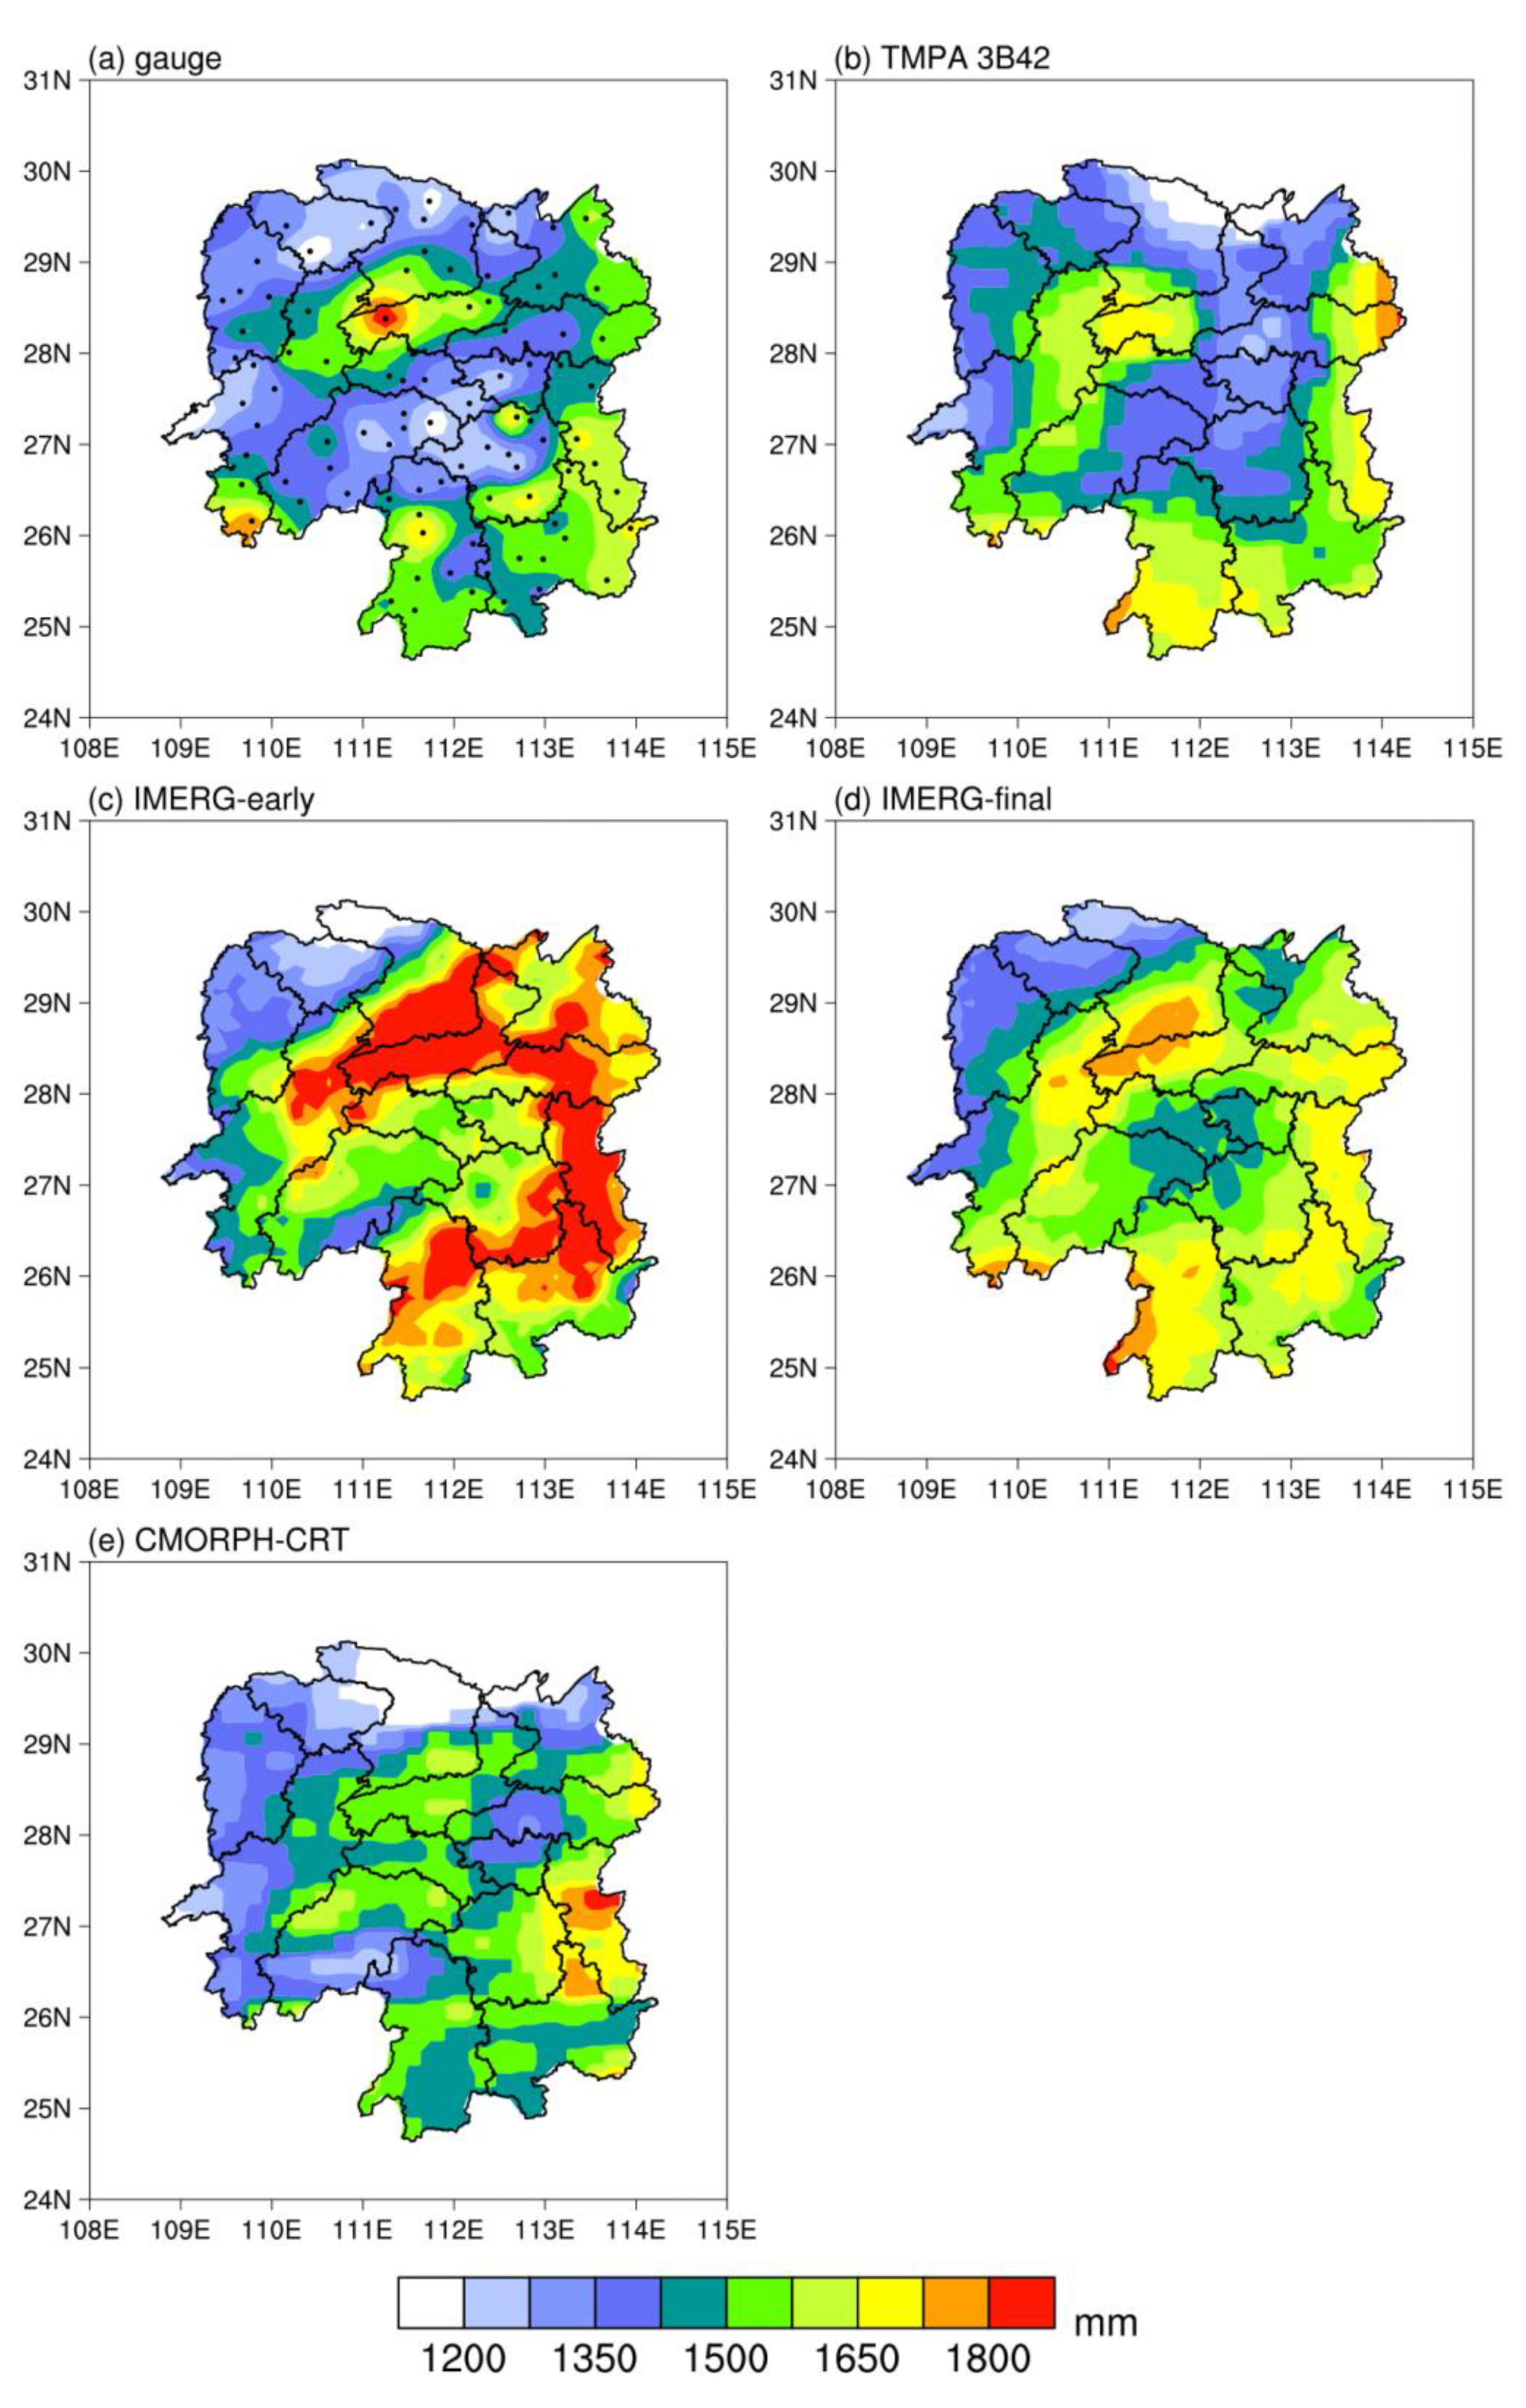
- The rainfall center in the gauge-based precipitation observations is located at 24.5°N–26°N, 111°E–114°E during Typhoon Bailu in Hunan. The areas of rainfall centers derived from four different satellite-based precipitation products are smaller than that of gauge-based observations. All satellite-based precipitation products underestimate the accumulated precipitation during Typhoon Bailu. The daily series of the mean precipitation in the rainfall center peaked on 25 August 2019, and the streamflow reached its peak one day later, suggesting the lagged impact of precipitation on streamflow.
- (4)
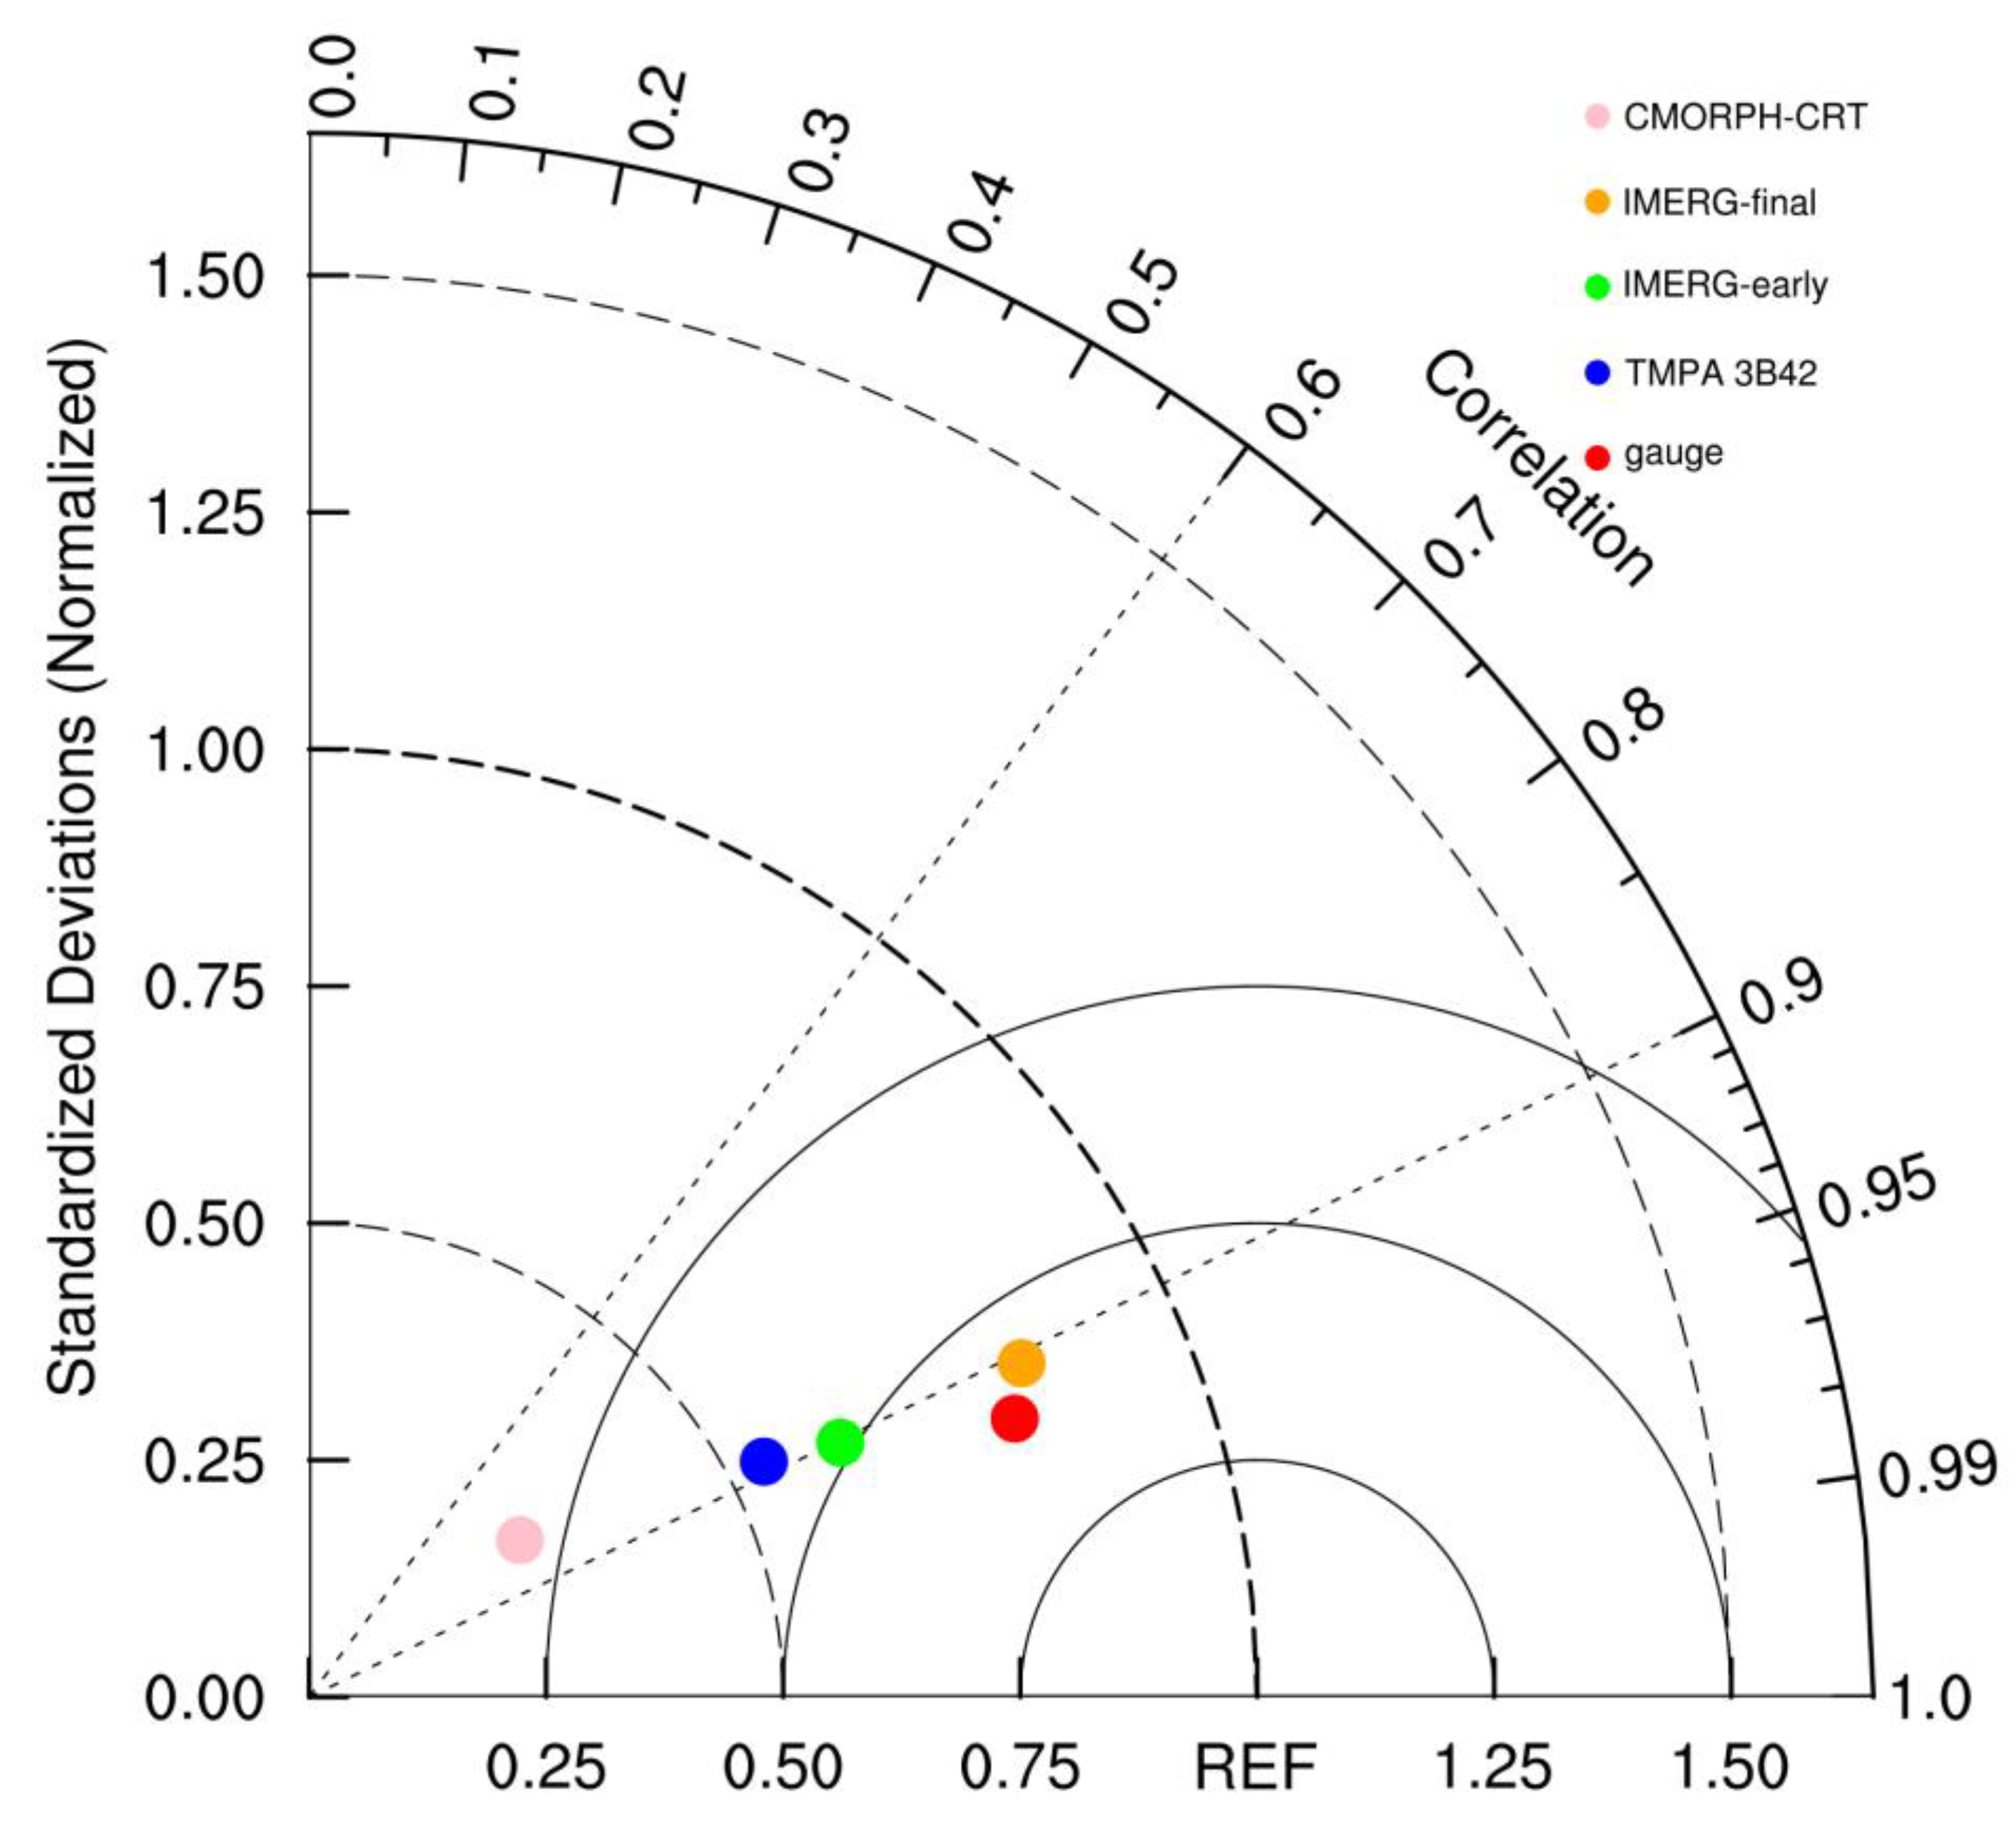
- The Taylor diagram shows that the gauge-based observations performed the best in hydrological estimation during Typhoon Bailu, followed by IMERG-final, IMERG-early, TMPA 3B42, and CMORPH-CRT, respectively.
Author Contributions
Funding
Data Availability Statement
Conflicts of Interest
References
- Faurès, J.M.; Goodrich, D.C.; Woolhiser, D.A.; Sorooshian, S. Impact of small-scale spatial rainfall variability on runoff modeling. J. Hydrol. 1995, 173, 309–326. [Google Scholar] [CrossRef]
- Gottschalck, J.; Meng, J.; Rodell, M.; Houser, P. Analysis of Multiple Precipitation Products and Preliminary. J. Hydrometeorol. 2005, 6, 573–598. [Google Scholar] [CrossRef]
- Oki, T.; Kanae, S. Global Hydrological Cycles and World Water Resources. Science 2006, 313, 1068–1072. [Google Scholar] [CrossRef] [Green Version]
- Sorooshian, S.; AghaKouchak, A.; Arkin, P.; Eylander, J.; Foufoula-Georgiou, E.; Harmon, R.S.; Hendrickx, J.M.H.; Imam, B.; Kuligowski, R.; Skahill, B.; et al. Advanced Concepts on Remote Sensing of Precipitation at Multiple Scales. Bull. Am. Meteorol. Soc. 2011, 92, 1353–1357. [Google Scholar] [CrossRef]
- Su, F.G.; Hong, Y.; Lettenmaier, D.P. Evaluation of TRMMMulti-Satellite Precipitation Analysis (TMPA) and its Utility in Hydrologic Prediction in La Plata Basin. J. Hydrometeorol. 2008, 9, 622–640. [Google Scholar] [CrossRef] [Green Version]
- Etchevers, P.; Durand, Y.; Habets, F.; Martin, E.; Noilhan, J. Impact of spatial resolution on the hydrological simulation of the Durance high-Alpine catchment, France. Ann. Glaciol. 2001, 32, 87–92. [Google Scholar] [CrossRef] [Green Version]
- Yu, M.Y.; Chen, X.; Li, L.H.; Bao, A.M.; Paix, M.J. Streamflow Simulation by SWAT Using Different Precipitation Sources in Large Arid Basins with Scarce Raingauges. Water Resour. Manag. 2011, 25, 2669–2681. [Google Scholar] [CrossRef]
- Miao, C.; Ashouri, H.; Hsu, K.-L.; Sorooshian, S.; Duan, Q. Evaluation of the PERSIANN-CDR Daily Rainfall Estimates in Capturing the Behavior of Extreme Precipitation Events over China. J. Hydrometeorol. 2015, 16, 1387–1396. [Google Scholar] [CrossRef] [Green Version]
- Li, M.; Shao, Q. An improved statistical approach to merge satellite rainfall estimates and raingauge data. J. Hydrol. 2010, 385, 51–64. [Google Scholar] [CrossRef]
- Prasetia, R.; As-syakur, A.R.; Osawa, T. Validation of TRMM precipitation radar satellite data over Indonesian region. Theor. Appl. Climatol. 2013, 112, 575–587. [Google Scholar] [CrossRef]
- Yilmaz, K.K.; Hogue, T.S.; K-l, H.; Sorooshian, S.; Gupta, H.V.; Wagener, T. Intercomparison of rain gauge, radar, and satellite-based precipitation estimates with emphasis on hydrologic forecasting. J. Hydrometeorol. 2005, 6, 497–517. [Google Scholar] [CrossRef]
- Yong, B.; Hong, Y.; Ren, L.-L.; Gourley, J.J.; Huffman, G.J.; Chen, X.; Wang, W.; Khan, S.I. Assessment of evolving TRMM-based multisatellite real-time precipitation estimation methods and their impacts on hydrologic prediction in a high latitude basin. J. Geophys. Res. Atmos. 2012, 117, D09108. [Google Scholar] [CrossRef] [Green Version]
- Zhang, J.; Howard, K.; Langston, C.; Vasiloff, S.; Kaney, B.; Arthur, A.; Van Cooten, S.; Kelleher, K.; Kitzmiller, D.; Ding, F.; et al. National Mosaic and Multi-Sensor QPE (NMQ) system: Description, results, and future plans. Bull. Am. Meteorol. Soc. 2011, 92, 1321–1338. [Google Scholar] [CrossRef] [Green Version]
- Nanding, N.; Rico-Ramirez, M.A. Precipitation Measurement with Weather Radars. In ICT for Smart Water Systems: Measurements and Data Science; Scozzari, A., Mounce, S., Han, D., Soldovieri, F., Solomatine, D., Eds.; Springer International Publishing: Cham, Switzerland, 2020; pp. 235–258. [Google Scholar]
- Nanding, N.; Rico-Ramirez, M.A.; Han, D. Rainfall-runoff modelling using merged rainfall from radar and raingauge measurements. In Proceedings of the Eighth European Conference on Radar in Meteorology and Hydrology (ERAD), Garmisch-Partenkirchen, Germany, 1–5 September 2014; pp. 1–6. [Google Scholar]
- Nanding, N.; Rico-Ramirez, M.A.; Han, D. Comparison of different radar-raingauge rainfall merging techniques. J. Hydroinf. 2015, 17, 422–445. [Google Scholar] [CrossRef]
- Nanding, N.; Rico-Ramirez, M.A.; Han, D.; Wu, H.; Dai, Q.; Zhang, J. Uncertainty assessment of radar-raingauge merged rainfall estimates in river discharge simulations. J. Hydrol. 2021, 603, 127093. [Google Scholar] [CrossRef]
- Kucera, P.A.; Ebert, E.E.; Turk, F.J.; Levizzani, V.; Kirschbaum, D.; Tapiador, F.J.; Loew, A.; Borsche, M. Precipitation from Space: Advancing Earth System Science. Bull. Am. Meteorol. Soc. 2013, 94, 365–375. [Google Scholar] [CrossRef]
- Huffman, G.J.; Adler, R.F.; Bolvin, D.T.; Gu, G.J.; Nelkin, E.J.; Bowman, K.P.; Hong, Y.; Stocker, E.F.; Wolff, D.B. The TRMM Multi-Satellite Precipitation Analysis (TMPA): Quasi-Global, Multi-Year, Combined-Sensor Precipitation Estimates at Fine Scales. J. Hydrometeorol. 2007, 8, 38–55. [Google Scholar] [CrossRef]
- Huffman, G.J.; Adler, R.F.; Bolvin, D.T.; Nelkin, E.J. The TRMM multi-satellite precipitation analysis (TMPA). In Satellite Rainfall Applications for Surface Hydrology; Springer: Berlin/Heidelberg, Germany, 2010; pp. 3–22. [Google Scholar]
- Huffman, G.J.; Bolvin, D.T.; Braithwaite, D.; Hsu, K.; Joyce, R.; Kidd, C.; Nelkin, E.J.; Xie, P. NASA Global Precipitation Measurement (GPM) Integrated Multi-Satellite Retrievals for GPM (IMERG); Algorithm Theoretical Basis Document (ATBD); NASA/GSFC: Greenbelt, MD, USA, 2015. [Google Scholar]
- Joyce, R.J.; Janowiak, J.E.; Arkin, P.A.; Xie, P. CMORPH: A method that produces global precipitation estimates from passive microwave and infrared data at high spatial and temporal resolution. J. Hydrometeorol. 2004, 5, 487–503. [Google Scholar] [CrossRef]
- Ashouri, H.; Hsu, K.L.; Sorooshian, S.; Braithwaite, D.K.; Knapp, K.R.; Cecil, L.D.; Nelson, B.R.; Prat, O.P. PERSIANN-CDR: Daily Precipitation Climate Data Record from Multisatellite Observations for Hydrologicaland Climate Studies. Bull. Am. Meteorol. Soc. 2014, 96, 197–210. [Google Scholar] [CrossRef] [Green Version]
- Wei, G.; Lü, H.; Crow, W.T.; Zhu, Y.; Wang, J.; Su, J. Comprehensive Evaluation of GPM-IMERG, CMORPH, and TMPA Precipitation Products with Gauged Rainfall over Mainland China. Adv. Meteorol. 2018, 2018, 3024190. [Google Scholar] [CrossRef] [Green Version]
- Cai, Y.; Jin, C.; Wang, A.; Guan, D.; Wu, J.; Yuan, F.; Xu, L. Comprehensive precipitation evaluation of TRMM 3B42 with dense rain gauge networks in a mid-latitude basin, northeast, China. Arch. Meteorol. Geophys. Bioclimatol. Ser. B 2016, 126, 659–671. [Google Scholar] [CrossRef]
- Chen, F.; Huang, H. Comparisons of gauge, TMPA and IMERG products for monsoon and tropical cyclone precipitation in southern China. Pure Appl. Geophys. 2019, 176, 1767–1784. [Google Scholar] [CrossRef]
- Cheng, S.; Wang, W.; Yu, Z. Evaluating the Drought-Monitoring Utility of GPM and TRMM Precipitation Products over Mainland China. Remote Sens. 2021, 13, 4153. [Google Scholar] [CrossRef]
- Wang, Z.; Zhong, R.; Lai, C. Evaluation and hydrologic validation of TMPA satellite precipitation product downstream of the Pearl River Basin, China. Hydrol. Process. 2017, 31, 4169–4182. [Google Scholar] [CrossRef]
- Tian, B.; Chen, H.; Wang, J.; Xu, C.Y. Accuracy assessment and error cause analysis of GPM (V06) in Xiangjiang river catchment. Hydrol. Res. 2021, 52, 1048–1065. [Google Scholar] [CrossRef]
- Zhu, Q.; Luo, Y.; Zhou, D.; Xu, Y.P.; Wang, G.; Gao, H. Drought monitoring utility using satellite-based precipitation products over the Xiang River Basin in China. Remote Sens. 2019, 11, 1483. [Google Scholar] [CrossRef] [Green Version]
- Zhu, Q.; Xuan, W.; Liu, L.; Xu, Y.-P. Evaluation and hydrological application of precipitation estimates derived from PERSIANN-CDR, TRMM 3B42V7, and NCEP-CFSR over humid regions in China. Hydrol. Process. 2016, 30, 3061–3083. [Google Scholar] [CrossRef]
- Gao, X.; Zhu, Q.; Yang, Z.; Wang, H. Evaluation and Hydrological Application of CMADS against TRMM 3B42V7, PERSIANN-CDR, NCEP-CFSR, and Gauge-Based Datasets in Xiang River Basin of China. Water 2018, 10, 1225. [Google Scholar] [CrossRef] [Green Version]
- Jiang, S.; Ren, L.; Hong, Y.; Yang, X.; Ma, M.; Zhang, Y.; Yuan, F. Improvement of multi-satellite real-time precipitation products for ensemble streamflow simulation in a middle latitude basin in South China. Water Resour. Manag. 2014, 28, 2259–2278. [Google Scholar] [CrossRef]
- Li, X.; Zhang, Q.; Ye, X. Dry/Wet Conditions Monitoring Based on TRMM Rainfall Data and Its Reliability Validation over Poyang Lake Basin, China. Water 2013, 5, 1848–1864. [Google Scholar] [CrossRef]
- Liang, X.; Lettenmaier, D.P.; Wood, E.F.; Burges, S.J. A simple hydrologically based model of land surface water and energy fluxes for GSMs. J. Geophys. Res. 1994, 99, 14415–14428. [Google Scholar] [CrossRef]
- Liang, X.; Wood, E.; Lettenmaier, D.P. Surface soil moisture parameterization of the VIC-2L model: Evaluation and modification. Glob. Planet. Chang. 1996, 13, 195–206. [Google Scholar] [CrossRef]
- Wu, H.; Adler, R.F.; Tian, Y.; Huffman, G.J.; Li, H.; Wang, J.J. Real-time global flood estimation using satellite-based precipitation and a coupled land surface and routing model. Water Resour. Res. 2014, 50, 2693–2717. [Google Scholar] [CrossRef] [Green Version]
- Wu, H.; Adler, R.F.; Hong, Y.; Tian, Y.; Policelli, F. Evaluation of Global Flood Detection Using Satellite-Based Rainfall and a Hydrologic Model. J. Hydrometeorol. 2012, 13, 1268–1284. [Google Scholar] [CrossRef]
- Wu, H.; Kimball, J.S.; Mantua, N.; Stanford, J. Automated upscaling of river networks for macroscale hydrological modeling. Water Resour. Res. 2011, 47, W03517. [Google Scholar] [CrossRef] [Green Version]
- Wu, H.; Kimball, J.S.; Elsner, M.M.; Mantua, N.; Adler, R.F.; Stanford, J. Projected climate change impacts on the hydrology and temperature of Pacific Northwest rivers. Water Resour. Res. 2012, 48, W11530. [Google Scholar] [CrossRef]
- Wu, H.; Kimball, J.S.; Li, H.; Huang, M.; Leung, L.R.; Adler, R.F. A new global river network database for macroscale hydrologic modeling. Water Resour. Res. 2012, 48, W09701. [Google Scholar] [CrossRef] [Green Version]
- Wu, H.; Adler, R.F.; Tian, Y.; Gu, G.; Huffman, G. Evaluation of quantitative precipitation estimations through hydrological modeling in IFloodS river basins. J. Hydrometeorol. 2017, 18, 529–553. [Google Scholar] [CrossRef]
- Yan, Y.; Wu, H.; Gu, G.; Huang, Z.; Alfieri, L.; Li, X.; Nanding, N.; Pan, X.; Tang, Q. Climatology and Interannual Variability of Floods during the TRMM Era (1998–2013). J. Clim. 2020, 33, 3289–3305. [Google Scholar] [CrossRef]
- Yan, Y.; Wu, H.; Gu, G.; Ward, P.J.; Luo, L.; Li, X.; Huang, Z.; Tao, J. Exploring the ENSO impact on Basin-scale floods using hydrological simulations and TRMM precipitation. Geophys. Res. Lett. 2020, 47, e2020GL089476. [Google Scholar] [CrossRef]
- Huang, Z.; Wu, H.; Adler, R.F.; Schumann, G.; Gourley, J.J.; Kettner, A.; Nanding, N. Multisourced Flood Inventories over the Contiguous United States for Actual and Natural Conditions. Bull. Am. Meteorol. Soc. 2021, 102, E1133–E1149. [Google Scholar] [CrossRef]
- Nanding, N.; Wu, H.; Tao, J.; Maggioni, V.; Beck, H.E.; Zhou, N.; Huang, M.; Huang, Z. Assessment of Precipitation Error Propagation in Discharge Simulations over the Contiguous United States. J. Hydrometeorol. 2021, 22, 1987–2008. [Google Scholar] [CrossRef]
- Gelaro, R.; McCarty, W.; Suárez, M.J.; Todling, R.; Molod, A.; Takacs, L.; Randles, C.A.; Darmenov, A.; Bosilovich, M.G.; Reichle, R.; et al. The Modern-Era Retrospective Analysis for Research and Applications, Version 2 (MERRA-2). J. Clim. 2017, 30, 5419–5454. [Google Scholar] [CrossRef]
- Cressman, G.P. An operational objective analysis system. Mon. Weather. Rev. 1959, 87, 367–374. [Google Scholar] [CrossRef]
- Huffman, G.J.; Stocker, E.F.; Bolvin, D.T.; Nelkin, E.J.; Tan, J. GPM IMERG Early Precipitation L3 Half Hourly 0.1 Degree × 0.1 Degree V06; Goddard Earth Sciences Data and Information Services Center (GES DISC): Greenbelt, MD, USA, 2019. [Google Scholar] [CrossRef]
- Huffman, G.J.; Stocker, E.F.; Bolvin, D.T.; Nelkin, E.J.; Tan, J. GPM IMERG Final Precipitation L3 Half Hourly 0.1 Degree × 0.1 Degree V06; Goddard Earth Sciences Data and Information Services Center (GES DISC): Greenbelt, MD, USA, 2019. [Google Scholar] [CrossRef]
- Ying, M.; Zhang, W.; Yu, H.; Lu, X.; Feng, J.; Fan, Y.; Zhu, Y.; Chen, D. An overview of the China Meteorological Administration tropical cyclone database. J. Atmos. Ocean. Technol. 2014, 31, 287–301. [Google Scholar] [CrossRef] [Green Version]
- Lu, X.; Yu, H.; Ying, M.; Zhao, B.; Zhang, S.; Lin, L.; Bai, L.; Wan, R. Western North Pacific Tropical Cyclone Database Created by the China Meteorological Administration. Adv. Atmos. Sci. 2021, 38, 690–699. [Google Scholar] [CrossRef]
- Nash, J.E.; Sutcliffe, J.V. River flow forecasting through conceptual models part I—A discussion of principles. J. Hydrol. 1970, 10, 282–290. [Google Scholar] [CrossRef]
- Taylor, K.E. Summarizing multiple aspects of model performance in a single diagram. J. Geophys. Res. Atmos. 2001, 106, 7183–7192. [Google Scholar] [CrossRef]
- Yan, Y.; Wang, G.; Wu, H.; Gu, G.; Nanding, N. Characteristics of Precipitation and Floods during Typhoons in Guangdong Province. Remote Sens. 2022, 14, 1945. [Google Scholar] [CrossRef]
- Sun, Y.; Yang, X.; Cui, X. Analysis of the Suitability of High Resolution Satellite Inversion Precipitation Data in Sichuan Province. Clim. Chang. Res. Lett. 2018, 7, 5. [Google Scholar] [CrossRef]
- Anjum, M.N.; Ding, Y.; Shangguan, D.; Ahmad, I.; Ijaz, M.W.; Farid, H.U.; Yagoub, Y.E.; Zaman, M.; Adnan, M. Performance Evaluation of Latest Integrated Multi–Satellite Retrievals for Global Precipitation Measurement (Imerg) over the Northern Highlands of Pakistan. Atmos. Res. 2018, 205, 134–146. [Google Scholar] [CrossRef]


| NSE/Data | Gauge | TMPA 3B42 | IMERG-Early | IMERG-Final | CMORPH-CRT |
|---|---|---|---|---|---|
| ≥0 | 66 | 64 | 62 | 65 | 60 |
| ≥0.2 | 61 | 53 | 51 | 54 | 52 |
| ≥0.5 | 22 | 3 | 7 | 13 | 4 |
| Location/Gauges | Shebu | Lengshuijiang | Yantou | Fenshi |
|---|---|---|---|---|
| lat | 27.62 | 27.67 | 26.83 | 25.33 |
| lon | 112.78 | 111.40 | 109.75 | 112.70 |
| drainage area | 1404 | 16,260 | 5236 | 880 |
Publisher’s Note: MDPI stays neutral with regard to jurisdictional claims in published maps and institutional affiliations. |
© 2022 by the authors. Licensee MDPI, Basel, Switzerland. This article is an open access article distributed under the terms and conditions of the Creative Commons Attribution (CC BY) license (https://creativecommons.org/licenses/by/4.0/).
Share and Cite
Yan, Y.; Wang, G.; Nanding, N.; Chen, W. Hydrological Evaluation of Satellite-Based Precipitation Products in Hunan Province. Remote Sens. 2022, 14, 3127. https://doi.org/10.3390/rs14133127
Yan Y, Wang G, Nanding N, Chen W. Hydrological Evaluation of Satellite-Based Precipitation Products in Hunan Province. Remote Sensing. 2022; 14(13):3127. https://doi.org/10.3390/rs14133127
Chicago/Turabian StyleYan, Yan, Guihua Wang, Nergui Nanding, and Weitian Chen. 2022. "Hydrological Evaluation of Satellite-Based Precipitation Products in Hunan Province" Remote Sensing 14, no. 13: 3127. https://doi.org/10.3390/rs14133127
APA StyleYan, Y., Wang, G., Nanding, N., & Chen, W. (2022). Hydrological Evaluation of Satellite-Based Precipitation Products in Hunan Province. Remote Sensing, 14(13), 3127. https://doi.org/10.3390/rs14133127