Abstract
The quality of satellite-based precipitation products including TMPA 3B42, IMERG-early, IMERG-final, and CMORPH-CRT, is evaluated by comparing with gauge observations in Hunan province of China between 2017 and 2019. By using the outputs of the Dominant River Routing Integrated with VIC Environment (DRIVE) model, the hydrological applications of gauge- and satellite-based precipitation products are analyzed by comparing them with streamflow observations. Furthermore, we conduct a case study considering Typhoon Bailu. It is found that IMERG-final can produce better results compared to the other three satellite-based products against gauge-based precipitation. In terms of discharge simulations, the gauge-based precipitation provides the most accurate results, followed by IMERG-final. During Typhoon Bailu, the peak of the mean gauge-based precipitation in the rainfall center (24.5°N–26°N, 111°E–114°E) occurred on 25 August 2019, whereas the daily streamflow reached its peak one day later, suggesting the lagged impact of precipitation on streamflow. From the Taylor diagram, the gauge-based precipitation is the most accurate for estimating the streamflow during Typhoon Bailu, followed by IMERG-final, IMERG-early, TMPA 3B42, and CMORPH-CRT, respectively. Overall, gauge-based precipitation has the best performance in terms of hydrological application, whereas IMERG-final performs the best among four satellite-based precipitation products.
1. Introduction
Precipitation is an essential physical process in the global water and energy cycles [1,2,3,4,5]. The accurate estimation of precipitation is crucial for hydrological simulation, climate change studies, and other scientific researches [4,6,7,8]. In general, three primary instruments are used to measure precipitation, including rain gauges, weather radars, and satellites. Rain gauge networks are sparse in remote areas [9], and are limited in terms of spatial and temporal variability [10,11,12], and weather radars are influenced by atmospheric conditions and complex topography [13,14,15,16,17]. In contrast, satellite precipitation products can provide global precipitation maps with high spatial and temporal resolutions [18]; therefore, how remote sensing satellite precipitation data can capture the characteristics of observed precipitation is a relevant topic.
In recent years, a suite of satellite-based precipitation products have become available at the global scale, such as the TMPA 3B42 [19,20], IMERG [21], CMORPH-CRT [22], and the PERSIANN-CDR [23]. Many researchers have evaluated the precision of these satellite precipitation products in specific countries and regions worldwide, including China [24,25,26,27,28,29,30,31,32,33,34]. Cai et al. evaluated the quality of the TMPA 3B42-V7 data set over the Hun-Tai Basin at daily, monthly, and annual scales [25]. Chen et al. compared gauge-based precipitation with TMPA and IMERG products for monsoon and tropical cyclone precipitations in south China [26]. Cheng et al., evaluated the drought-monitoring applicability of TRMM and GPM precipitation products in China [27]. Li et al., analyzed the reliability of TRMM rainfall data over the Poyang Lake [34]. In previous studies, researchers have mainly focused on the evaluation of satellite-based precipitation products over China’s Xiang River Basin at daily and monthly scales [29,30,31,32]. However, few researchers have aimed their studies at the entirety of Hunan Province. Likewise, few have performed hydrological assessments of hydrological model outputs driven by gauge- or satellite-based precipitation. It is crucial for study of hydrological application in Hunan, which is a humid region with a large population. Therefore, the purpose of our study is to evaluate four satellite-based precipitation products in comparison with gauge-based precipitation observations for the entire Hunan province. The simulation outputs of the DRIVE model driven by different precipitation products are compared with the observed streamflow. Despite the fact that Hunan is an inland province, it is also influenced by typhoons that affect its neighboring provinces. Consequently, we also carried out a case study focused on Typhoon Bailu. Thus, the highlights of this study are to evaluate various satellite precipitation products at a finer spatial and temporal scale, and to use the state-of-the-art DRIVE hydrological model to reveal the hydrological application of different precipitations.
2. Data and Methods
This study uses the DRIVE model, which couples the Variable Infiltration Capacity (VIC) land surface model [35,36] and the Dominant River Tracing (DRT)-based Routing (DRTR) model [37,38,39,40,41,42]. The DRT methods includes hydrographic upscaling algorithms and resulting global data sets for large-scale hydrological modeling. The DRIVE model includes flood inundation modules and is suitable for flood simulation at different spatial and temporal scales. Researchers have also applied the DRIVE model in many other studies [37,42,43,44,45,46]. The detailed descriptions of the DRIVE model can be found in the literatures [37,45,46].
In this study, we perform discharge simulations during a period from 2017–2019 at a temporal resolution of 3-hourly and a spatial resolution of 0.125° × 0.125°. The meteorological inputs of the DRIVE model include wind speed, temperature (minimum and maximum), and precipitation. The 3-hourly wind speed and temperature data are from the MERRA-2 [47]. We have interpolated the precipitation observations at 97 rain gauges (Figure 1) by using the Cressman interpolation algorithm [48]; the interpolated rain gauge data is gridded and is used as reference. The satellite-based products included the TMPA 3B42 V7 [19], IMERG Early Run (IMERG-early) V06 [49], IMERG Final Run (IMERG-final) V06 [50], and CMORPH-CRT [22] products. All the input data are converted from their original resolution to the DRIVE input format.
The Hunan Hydrological and Water Resources Survey Center (accessible at http://yzt.hnswkcj.com:9090/#/ in Chinese, accessed on 1 September 2021) provided the observed streamflow at 84 hydrological gauges. We also obtain the best track data for Typhoon Bailu from the Tropical Cyclone Data Center, China Meteorological Administration (http://tcdata.typhoon.org.cn, accessed on 1 September 2021) [51,52].
This study applies a number of statistical metrics to access the performance of different precipitation products, including correlation coefficient (R), the Nash–Sutcliffe efficiency (NSE) [53], mean error (ME), root mean square error (RMSE), and Taylor diagram [54]. NSE values range from −∞ to 1, where the value of 1 indicates the perfect performance, and positive NSE indicate the acceptable performance [53]. R values range from −1 to 1, and the value of 1 represents the perfect performance in this study. RMSE values range from 0 to +∞, and the value of 0 indicates the best performance. The positive mean error (ME) indicates the overestimation of bias, whereas negative ME indicates the underestimation of bias [31], ME values range from −∞ to +∞, where the value of 0 indicates the best performance. The Taylor diagram includes various indicators such as root mean square error (RMSE), correlation coefficient (R), and standard deviation, and it can reveal the model performance in many aspects.
3. Results
3.1. Evaluation of Satellite-Based Precipitation
Figure 1 depicts the annual mean precipitation from 2017–2019, estimated from different precipitation products. We observed large gauge-based annual mean precipitation in the north-central, eastern, and southern parts of Hunan Province. Meanwhile, smaller annual mean precipitations are shown in northern and central parts of Hunan. Generally, the TMPA 3B42 and gauge-based precipitation have similar precipitation distributions in the north-central and eastern parts of Hunan. However, TMPA 3B42 tends to overestimate the precipitation in west-central and southwestern Hunan and a small part of eastern Hunan, and underestimate it in the north-central areas, where are the highest precipitation shown in gauge-based precipitation. However, the distribution of TMPA 3B42 has the most similar distribution with gauge-based precipitation compared to the other three products. The IMERG products overestimate the majority of the distribution compared with gauge-based precipitation shown in the north-central, eastern, and southern parts of Hunan. IMERG-final produces a similar distribution to IMERG-early, but has lower and more accurate values. After the corrections based on ground observations, the performance of IMERG-final has improved compared to satellite-only IMERG-early products. CMORPH-CRT tends to underestimate precipitation in the north-central parts of Hunan, but overestimates it in central Hunan and some parts of southeastern Hunan.
The linear correspondence between 3-hourly gauge-based precipitation and satellite-based precipitation estimates in Hunan is shown in Figure 2. We observe that satellite-based precipitation estimates are rather consistent with the gauge observations, and that TMPA 3B42 shows a good correlation (CC = 0.78) with gauge-based precipitation; however, it tends to underestimate precipitation (ME = −0.04 mm); the RMSE for TMPA 3B42 is 0.78 mm. The correlation coefficient is 0.81 between IMERG-early and gauge-based precipitation; however, IMERG-early overestimates the precipitation (ME = 0.01 mm) at the 3-hourly, regional scale, and the RMSE for IMERG-early is lower than TMPA 3B42, which is 0.75 mm. IMERG-final has the highest correlation (CC = 0.87) and the smallest RMSE (0.58 mm) against the gauge-based precipitation observations it underestimates the gauge-based precipitation with ME of −0.01 mm. CMORPH-CRT has a higher correlation with the gauge-based precipitation compared to TMPA 3B42 and IMERG-early. However, it has the largest ME (−0.06 mm), showing that it can capture the temporal variations of observed precipitation but underestimates it to some extent. Overall, IMERG-final performs the best at 3-hourly scale in Hunan Province. CMORPH-CRT and IMERG-early show better performance than TMPA 3B42. Except for IMERG-early, the other precipitation products underestimate the precipitation.
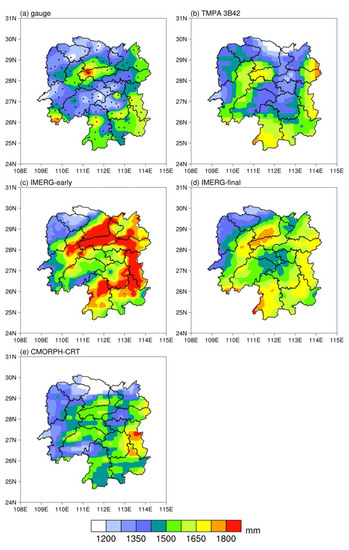
Figure 1.
Annual mean precipitation for 2017–2019.
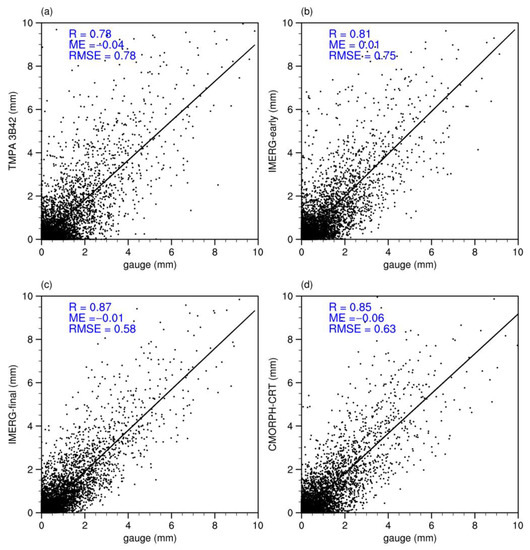
Figure 2.
Scatterplots of satellite- vs. gauge-based precipitation in Hunan at 3-hourly. (a) TMPA 3B42; (b) IMERG-early; (c) IMERG-final; and (d) CMORPH-CRT.
In Figure 3, the spatial distribution of the mean error show that TMPA 3B42 underestimates gauge observations over eastern Hunan and overestimates them over western Hunan at 3-hourly, grid scale. IMERG-early tends to overestimate gauge observations over most districts in Hunan, except for the northwest and small parts of southern Hunan, so is the IMERG-final. However, IMERG-final shows the smaller ME compared with IMERG-early at grid scale (Figure 3). CMORPH-CRT underestimates gauge observations over the most regions in Hunan, but overestimates them in the central parts.
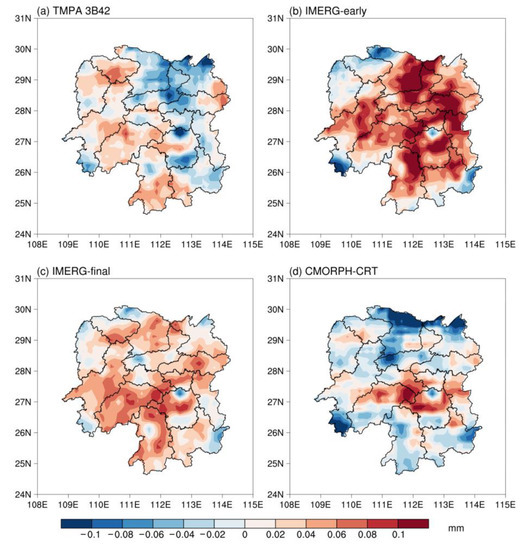
Figure 3.
Spatial distribution of the mean error at 3-hourly time scale.
The monthly mean precipitation illustrated in Figure 4 shows four satellite-based precipitations are able to demonstrate the monthly changes of observed precipitation in Hunan. We observe high precipitation in the spring and summer months (i.e., May, June, and July). During these months, satellite-based precipitation overestimates the values compared with gauge observations. Meanwhile, IMERG-early has an obvious overestimation in March. From October to December, except for IMERG-final, other satellite-based precipitations underestimate the monthly precipitation. From January to February, TMPA 3B42 and CMORPH-CRT underestimates the monthly precipitation, whereas IMERG products overestimate it. In terms of monthly precipitation, IMERG-final and TMPA 3B42 perform better than IMERG-early and CMORPH-CRT in capturing the magnitude and variation in precipitation.
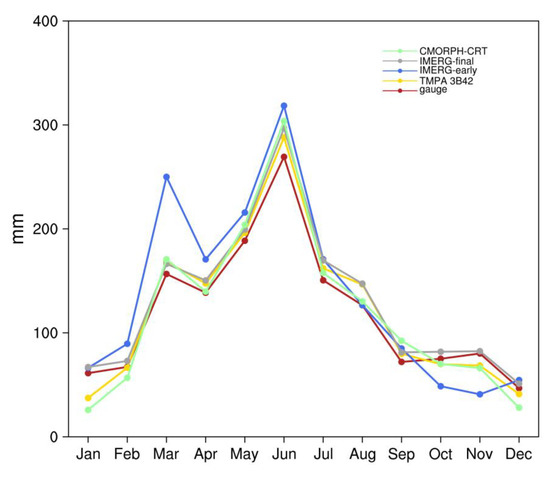
Figure 4.
Spatial-averaged monthly total precipitation in Hunan.
3.2. Evaluation of DRIVE Outputs Driven by Different Precipitation
We use the DRIVE model to simulate river discharges during 2017–2019, and compare the outputs of the DRIVE model driven by different precipitation inputs with the observed streamflow at 84 gauges in Hunan. The DRIVE model outputs have been validated compared with the observations at 1121 stations globally in previous study [37].
In terms of the NSE score, we observed positive values for different precipitation inputs for most of the gauges (see Figure 5). As shown in Table 1, gauge-based precipitation produces the most accurate discharge simulations, with 66 gauges showing positive NSE values, 61 out of 84 gauges (73%) having values greater than or equal to 0.2, and 22 out of 84 gauges (26%) having NSE values greater than or equal to 0.5. This is followed by TMPA 3B42, with 64 positive NSE values, 53 out of 84 gauges (63%) having NSE values greater than or equal to 0.2, and 3 out of 84 gauges having values greater than or equal to 0.5. We observed that IMERG products (IMERG-early or IMERG-final) provide more accurate hydrological performance than TMPA 3B42. Specifically, IMERG-final performs better in this hydrological application than IMERG-early, showing 65 gauges with positive NSE values, 54 out of 84 gauges (64%) with values greater than or equal to 0.2, and 13 out of 84 gauges (15%) with NSE values greater than or equal to 0.5 (Table 1). IMERG-early performs well, with 7 gauges having NSE values greater than or equal to 0.5. CMORPH-CRT performs well, with 60 gauges showing positive NSE values and 4 gauges having values greater than or equal to 0.5.
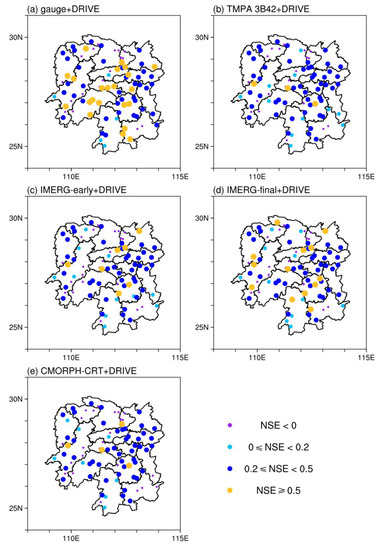
Figure 5.
NSE for DRIVE outputs.

Table 1.
NSE statistics.
The simulated and observed daily streamflows for four different gauges are shown in Figure 6. These four gauges are located in eastern, central, western, and southern parts of Hunan respectively (Table 2). For the Shebu gauge, the model outputs driven by gauge- and satellite-based precipitations can capture the variation and magnitude of the observed streamflow, demonstrating the accuracy of the DRIVE model. However, the model outputs sometimes underestimate the peak streamflow, especially in spring and summer. For the Lengshuijiang and Yantou gauge, the model outputs consistently underestimate the peak streamflow. For the Fenshi gauge, the model outputs simulate the variation but produce errors in the magnitude, especially for the peak streamflow. Among the different precipitation-driven DRIVE simulations, the gauge-based is the most accurate, with NSE of 0.53–0.73 for the four gauges, followed by IMERG-final, with an NSE of 0.48-0.68. IMERG-early was more accurate (NSE 0.41–0.63) than TMPA 3B42 (NSE 0.36–0.61). CMORPH-CRT shows the worst performance, with an NSE of 0.36–0.57.
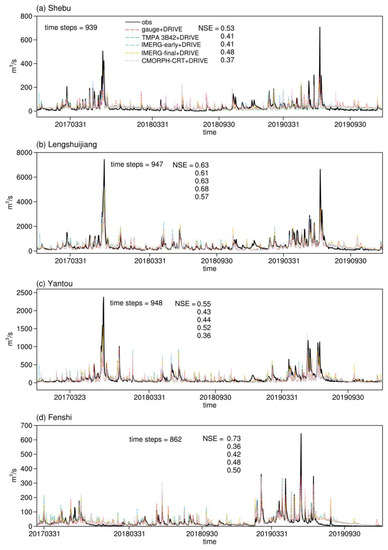
Figure 6.
Simulated and observed streamflow at the four gauges.

Table 2.
Locations of four gauges.
Overall, the outputs of the DRIVE model driven by gauge- or satellite-based precipitation shows reasonable applicability, where the gauge-based observation is the most accurate one, followed by IMERG-final, which has better performance than IMERG-early, TMPA 3B42, and CMORPH-CRT. Possible reasons for the magnitude errors between the model-simulated streamflow and the observations may be the systematic error in the hydrological model or spatial variability in precipitation distributions.
3.3. A Case Study of Typhoon Bailu
The satellite-based precipitation estimation performance, as well as the hydrological application of gauge- and satellite-based precipitation during Typhoon Bailu are evaluated. As shown in Figure 7, Typhoon Bailu, which originated on 20 August 2019 (UTC), first landed in Taiwan on 24 August; it then landed in Fujian on 25 August and, eventually, dissipated in Hunan on 26 August. We evaluated the associated performance of satellite-based precipitation products. Furthermore, the outputs of the DRIVE model are compared with observed streamflow during the Typhoon Bailu period.
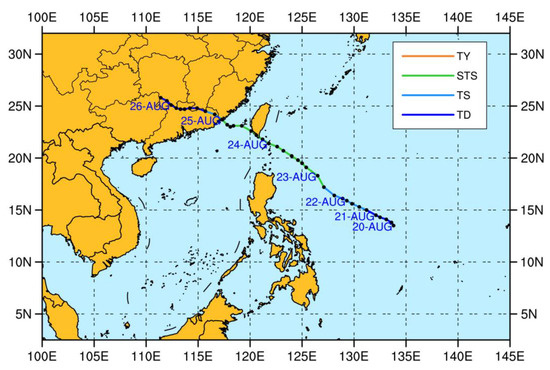
Figure 7.
Track of Typhoon Bailu between 20 August 2019 and 26 August 2019. TD, tropical depression; TS, tropical storm; STS, severe tropical storm; TY, typhoon.
The accumulated precipitation from 25 August 2019 at 00:00 to 27 August 2019 at 00:00 (UTC) in Hunan Province is calculated (Figure 8). Figure 8 shows that the four satellite-based precipitation products underestimate the precipitation during the Typhoon Bailu period, where TMPA 3B42 and CMORPH-CRT shows relatively large differences from the gauge-based precipitation. The rainfall centers derived by TMPA 3B42 and CMORPH-CRT are smaller than those that are gauge-based, and their spatial distributions differs, especially in the northern and eastern parts of Hunan. In addition, the rainfall center of IMERG-early is smaller than that of the gauge-based data, and it underestimates the precipitation in central parts of Hunan. IMERG-final has the most similar spatial distribution to the gauge-based observations. As illustrated in the black box in Figure 8a, the high-rainfall center, according the gauge-based precipitation, is located at 24.5°N–26°N, 111°E–114°E.
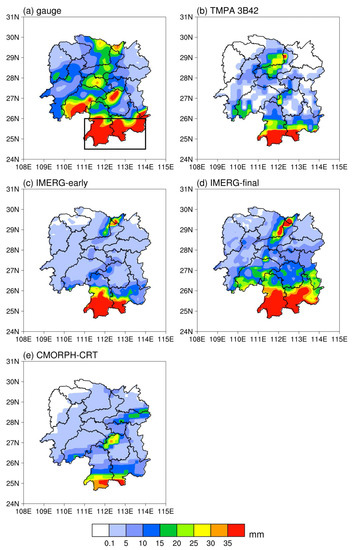
Figure 8.
Accumulated precipitation during Typhoon Bailu between 25 August 2019 at 00:00 and 27 August 2019 at 00:00 (UTC).
Figure 9 depicts the daily time-series of the mean precipitation in the rainfall center shown in Figure 8. The gauge-based precipitation increases from 24 August and peaked on 25 August. The satellite-based precipitation, except for IMERG-early, shows similar variations to the gauge-based precipitation. However, the precipitation estimated by IMERG-early peaked on 26 August. Precipitation peak estimated by IMERG-final is the most similar to the gauge-based observations, as expected, whereas CMORPH-CRT clearly underestimates the observed peaks.
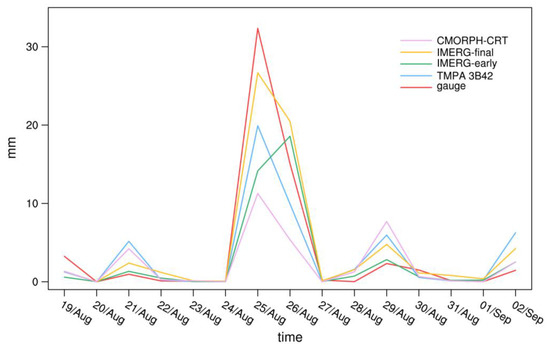
Figure 9.
Daily time-series between 19 August 2019 and 2 September 2019 of the mean precipitation in the rainfall center.
By using ten hydrological gauges in the rainfall center, we calculate the daily time-series of the mean streamflow in the rainfall center before and after the typhoon reached Hunan (Figure 10). The streamflow peaked on 26 August, one day later than the precipitation peak, similar to the results reported in a previous study [55]. This means the precipitation has a lagged effect on streamflow. It is worth noting that instead of model outputs driven by gauge-based precipitation, the model outputs driven by IMERG-final has the nearest peak to observed streamflow, followed by gauge-based precipitation. As discussed above, CMORPH-CRT produces the lowest peak streamflow, which can also be seen for precipitation.
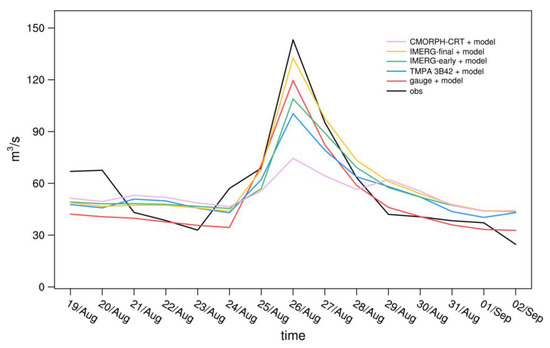
Figure 10.
Daily time-series between 19 August 2019 and 22 September 2019 of mean streamflow in the rainfall center.
The linear correspondences between the gauge-based precipitation accumulations and satellite-based precipitation accumulations from 25 August 2019 at 00:00 to 27 August 2019 at 00:00 (UTC) are shown in Figure 11. It can be seen that IMERG-final has the strongest correlation (R = 0.78) and lowest RMSE (RMSE = 11.49 mm), compared with gauge-based observations during Typhoon Bailu; whereas CMORPH-CRT has the lowest correlation (R = 0.68) and the highest RMSE (RMSE = 17.7 mm) with gauge-based observations during this time. During the same period, all of the satellite-based products underestimate the precipitation, with mean errors ranging between −2.97 mm and −11.89 mm.
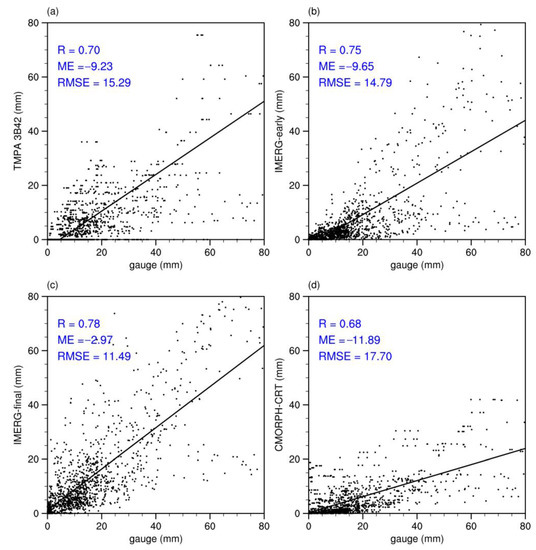
Figure 11.
Scatterplots of satellite- and gauge-based accumulated precipitation in Hunan from 25 August 2019 at 00:00 to 27 August 2019 at 00:00. (a) TMPA 3B42; (b) IMERG-early; (c) IMERG-final; and (d) CMORPH-CRT.
Taylor diagrams can reveal the similarity between observations and model outputs, where the closest dot to the “REF” represents the most accurate performance. From the averaged streamflow in the rainfall center during Typhoon Bailu, we found that the model outputs driven by gauge-based precipitation is the most accurate (shown as the red dot in Figure 12), followed by IMERG products, where IMERG-final performs better than IMERG-early (shown as orange and green dots, respectively). CMORPH-CRT performs the worst (shown as pink dots).
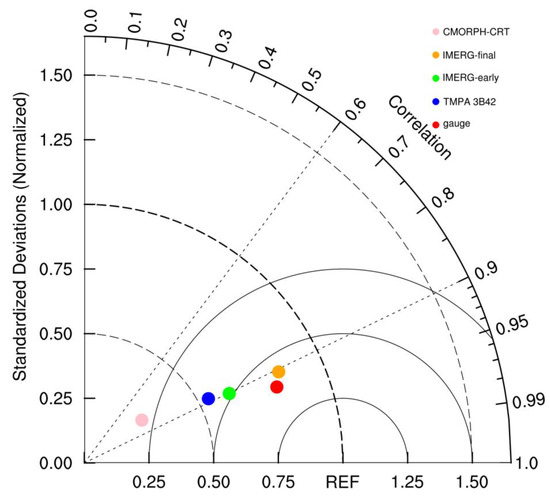
Figure 12.
Taylor diagram of the averaged streamflow in the rainfall center.
4. Discussion
Satellite-based precipitation products are compared with gauge-based precipitation in this study. The results show that there exist errors; possible reasons are discussed in this section. Errors for TMPA 3B42 data are due to use of the geostationary orbit satellite data, and the east or west deviation of the detection area may occur during the detection of geostationary orbit satellites; the deviation of detection area will result in the deviation of the precipitation area [56]. The error of the CMORPH-CRT precipitation data is because the CMORPH-CRT data is based on the data fusion of multiple data; each data has its own error, after the fusion, the errors are still existing in the data [56]. IMERG product has better performance, because the sensitivity of the DPR and the high–frequency channels on the GMI were increased [21,57]. IMERG-final has better performance than IMERG-early, because it has incorporated the ground observations in retrieving precipitation estimates.
5. Conclusions
In this study, four different satellite-based precipitation products, TMPA 3B42, IMERG-final, IMERG-early, and CMORPH-CRT are evaluated, against gauge-based precipitation from 2017 to 2019 in Hunan Province, China. The hydrological application of gauge- and satellite-based precipitation products are also evaluated by using the outputs of the DRIVE model. Furthermore, a case study during Typhoon Bailu event is performed. The main conclusions can be summarized as follows:
- (1)
- At the 3-hourly, regional scale, IMERG-final has the strongest correlation (with a CC of 0.87) and smallest RMSE (0.58 mm) with the gauge-based precipitation. The results of CMORPH-CRT and IMERG-early are consistent with those of gauge-based observations (with CCs of 0.85 and 0.81, respectively), whereas TMPA 3B42 performs the worst relatively, with a CC of 0.78. IMERG-early overestimates the precipitation, whereas IMERG-final, TMPA 3B42, and CMORPH-CRT underestimates it.
- (2)
- The gauge-based observations and four satellite-based precipitation products perform well in a hydrological application. The gauge-based observation performs the best in terms of estimating streamflow, with NSE values for 66 gauges (79%) are positive and 22 gauges (26%) are larger than or equal to 0.5. IMERG-final is more accurate than the IMERG-early, TMPA 3B42, and CMORPH-CRT regarding streamflow simulations.
- (3)
- The rainfall center in the gauge-based precipitation observations is located at 24.5°N–26°N, 111°E–114°E during Typhoon Bailu in Hunan. The areas of rainfall centers derived from four different satellite-based precipitation products are smaller than that of gauge-based observations. All satellite-based precipitation products underestimate the accumulated precipitation during Typhoon Bailu. The daily series of the mean precipitation in the rainfall center peaked on 25 August 2019, and the streamflow reached its peak one day later, suggesting the lagged impact of precipitation on streamflow.
- (4)
- The Taylor diagram shows that the gauge-based observations performed the best in hydrological estimation during Typhoon Bailu, followed by IMERG-final, IMERG-early, TMPA 3B42, and CMORPH-CRT, respectively.
Overall, gauge-based precipitation has the best performance in terms of hydrological application, whereas IMERG-final performs best among the four satellite-based precipitation products in term of precipitation evaluation and hydrological application. In future studies, more concentrated precipitation observations may improve the accuracy of hydrological simulations. Hydrological models with different structure are also necessary for the assessment of streamflow as our results only focus on a single model.
Author Contributions
Y.Y. and G.W. conceived and designed the experiments; Y.Y. analyzed the data and wrote the paper; N.N. and W.C. helped edit the paper; N.N. helped analyze the results; G.W. provided funding support. All authors have read and agreed to the published version of the manuscript.
Funding
This research was funded by the National Key Research and Development Program of China (2019YFC1510101), the National Natural Science Foundation of China (41976003 and 41905101), and the Key-Area Research and Development Program of Guangdong Province (2020B1111020001).
Data Availability Statement
Not applicable.
Conflicts of Interest
The authors declare no conflict of interest.
References
- Faurès, J.M.; Goodrich, D.C.; Woolhiser, D.A.; Sorooshian, S. Impact of small-scale spatial rainfall variability on runoff modeling. J. Hydrol. 1995, 173, 309–326. [Google Scholar] [CrossRef]
- Gottschalck, J.; Meng, J.; Rodell, M.; Houser, P. Analysis of Multiple Precipitation Products and Preliminary. J. Hydrometeorol. 2005, 6, 573–598. [Google Scholar] [CrossRef]
- Oki, T.; Kanae, S. Global Hydrological Cycles and World Water Resources. Science 2006, 313, 1068–1072. [Google Scholar] [CrossRef] [Green Version]
- Sorooshian, S.; AghaKouchak, A.; Arkin, P.; Eylander, J.; Foufoula-Georgiou, E.; Harmon, R.S.; Hendrickx, J.M.H.; Imam, B.; Kuligowski, R.; Skahill, B.; et al. Advanced Concepts on Remote Sensing of Precipitation at Multiple Scales. Bull. Am. Meteorol. Soc. 2011, 92, 1353–1357. [Google Scholar] [CrossRef]
- Su, F.G.; Hong, Y.; Lettenmaier, D.P. Evaluation of TRMMMulti-Satellite Precipitation Analysis (TMPA) and its Utility in Hydrologic Prediction in La Plata Basin. J. Hydrometeorol. 2008, 9, 622–640. [Google Scholar] [CrossRef] [Green Version]
- Etchevers, P.; Durand, Y.; Habets, F.; Martin, E.; Noilhan, J. Impact of spatial resolution on the hydrological simulation of the Durance high-Alpine catchment, France. Ann. Glaciol. 2001, 32, 87–92. [Google Scholar] [CrossRef] [Green Version]
- Yu, M.Y.; Chen, X.; Li, L.H.; Bao, A.M.; Paix, M.J. Streamflow Simulation by SWAT Using Different Precipitation Sources in Large Arid Basins with Scarce Raingauges. Water Resour. Manag. 2011, 25, 2669–2681. [Google Scholar] [CrossRef]
- Miao, C.; Ashouri, H.; Hsu, K.-L.; Sorooshian, S.; Duan, Q. Evaluation of the PERSIANN-CDR Daily Rainfall Estimates in Capturing the Behavior of Extreme Precipitation Events over China. J. Hydrometeorol. 2015, 16, 1387–1396. [Google Scholar] [CrossRef] [Green Version]
- Li, M.; Shao, Q. An improved statistical approach to merge satellite rainfall estimates and raingauge data. J. Hydrol. 2010, 385, 51–64. [Google Scholar] [CrossRef]
- Prasetia, R.; As-syakur, A.R.; Osawa, T. Validation of TRMM precipitation radar satellite data over Indonesian region. Theor. Appl. Climatol. 2013, 112, 575–587. [Google Scholar] [CrossRef]
- Yilmaz, K.K.; Hogue, T.S.; K-l, H.; Sorooshian, S.; Gupta, H.V.; Wagener, T. Intercomparison of rain gauge, radar, and satellite-based precipitation estimates with emphasis on hydrologic forecasting. J. Hydrometeorol. 2005, 6, 497–517. [Google Scholar] [CrossRef]
- Yong, B.; Hong, Y.; Ren, L.-L.; Gourley, J.J.; Huffman, G.J.; Chen, X.; Wang, W.; Khan, S.I. Assessment of evolving TRMM-based multisatellite real-time precipitation estimation methods and their impacts on hydrologic prediction in a high latitude basin. J. Geophys. Res. Atmos. 2012, 117, D09108. [Google Scholar] [CrossRef] [Green Version]
- Zhang, J.; Howard, K.; Langston, C.; Vasiloff, S.; Kaney, B.; Arthur, A.; Van Cooten, S.; Kelleher, K.; Kitzmiller, D.; Ding, F.; et al. National Mosaic and Multi-Sensor QPE (NMQ) system: Description, results, and future plans. Bull. Am. Meteorol. Soc. 2011, 92, 1321–1338. [Google Scholar] [CrossRef] [Green Version]
- Nanding, N.; Rico-Ramirez, M.A. Precipitation Measurement with Weather Radars. In ICT for Smart Water Systems: Measurements and Data Science; Scozzari, A., Mounce, S., Han, D., Soldovieri, F., Solomatine, D., Eds.; Springer International Publishing: Cham, Switzerland, 2020; pp. 235–258. [Google Scholar]
- Nanding, N.; Rico-Ramirez, M.A.; Han, D. Rainfall-runoff modelling using merged rainfall from radar and raingauge measurements. In Proceedings of the Eighth European Conference on Radar in Meteorology and Hydrology (ERAD), Garmisch-Partenkirchen, Germany, 1–5 September 2014; pp. 1–6. [Google Scholar]
- Nanding, N.; Rico-Ramirez, M.A.; Han, D. Comparison of different radar-raingauge rainfall merging techniques. J. Hydroinf. 2015, 17, 422–445. [Google Scholar] [CrossRef]
- Nanding, N.; Rico-Ramirez, M.A.; Han, D.; Wu, H.; Dai, Q.; Zhang, J. Uncertainty assessment of radar-raingauge merged rainfall estimates in river discharge simulations. J. Hydrol. 2021, 603, 127093. [Google Scholar] [CrossRef]
- Kucera, P.A.; Ebert, E.E.; Turk, F.J.; Levizzani, V.; Kirschbaum, D.; Tapiador, F.J.; Loew, A.; Borsche, M. Precipitation from Space: Advancing Earth System Science. Bull. Am. Meteorol. Soc. 2013, 94, 365–375. [Google Scholar] [CrossRef]
- Huffman, G.J.; Adler, R.F.; Bolvin, D.T.; Gu, G.J.; Nelkin, E.J.; Bowman, K.P.; Hong, Y.; Stocker, E.F.; Wolff, D.B. The TRMM Multi-Satellite Precipitation Analysis (TMPA): Quasi-Global, Multi-Year, Combined-Sensor Precipitation Estimates at Fine Scales. J. Hydrometeorol. 2007, 8, 38–55. [Google Scholar] [CrossRef]
- Huffman, G.J.; Adler, R.F.; Bolvin, D.T.; Nelkin, E.J. The TRMM multi-satellite precipitation analysis (TMPA). In Satellite Rainfall Applications for Surface Hydrology; Springer: Berlin/Heidelberg, Germany, 2010; pp. 3–22. [Google Scholar]
- Huffman, G.J.; Bolvin, D.T.; Braithwaite, D.; Hsu, K.; Joyce, R.; Kidd, C.; Nelkin, E.J.; Xie, P. NASA Global Precipitation Measurement (GPM) Integrated Multi-Satellite Retrievals for GPM (IMERG); Algorithm Theoretical Basis Document (ATBD); NASA/GSFC: Greenbelt, MD, USA, 2015. [Google Scholar]
- Joyce, R.J.; Janowiak, J.E.; Arkin, P.A.; Xie, P. CMORPH: A method that produces global precipitation estimates from passive microwave and infrared data at high spatial and temporal resolution. J. Hydrometeorol. 2004, 5, 487–503. [Google Scholar] [CrossRef]
- Ashouri, H.; Hsu, K.L.; Sorooshian, S.; Braithwaite, D.K.; Knapp, K.R.; Cecil, L.D.; Nelson, B.R.; Prat, O.P. PERSIANN-CDR: Daily Precipitation Climate Data Record from Multisatellite Observations for Hydrologicaland Climate Studies. Bull. Am. Meteorol. Soc. 2014, 96, 197–210. [Google Scholar] [CrossRef] [Green Version]
- Wei, G.; Lü, H.; Crow, W.T.; Zhu, Y.; Wang, J.; Su, J. Comprehensive Evaluation of GPM-IMERG, CMORPH, and TMPA Precipitation Products with Gauged Rainfall over Mainland China. Adv. Meteorol. 2018, 2018, 3024190. [Google Scholar] [CrossRef] [Green Version]
- Cai, Y.; Jin, C.; Wang, A.; Guan, D.; Wu, J.; Yuan, F.; Xu, L. Comprehensive precipitation evaluation of TRMM 3B42 with dense rain gauge networks in a mid-latitude basin, northeast, China. Arch. Meteorol. Geophys. Bioclimatol. Ser. B 2016, 126, 659–671. [Google Scholar] [CrossRef]
- Chen, F.; Huang, H. Comparisons of gauge, TMPA and IMERG products for monsoon and tropical cyclone precipitation in southern China. Pure Appl. Geophys. 2019, 176, 1767–1784. [Google Scholar] [CrossRef]
- Cheng, S.; Wang, W.; Yu, Z. Evaluating the Drought-Monitoring Utility of GPM and TRMM Precipitation Products over Mainland China. Remote Sens. 2021, 13, 4153. [Google Scholar] [CrossRef]
- Wang, Z.; Zhong, R.; Lai, C. Evaluation and hydrologic validation of TMPA satellite precipitation product downstream of the Pearl River Basin, China. Hydrol. Process. 2017, 31, 4169–4182. [Google Scholar] [CrossRef]
- Tian, B.; Chen, H.; Wang, J.; Xu, C.Y. Accuracy assessment and error cause analysis of GPM (V06) in Xiangjiang river catchment. Hydrol. Res. 2021, 52, 1048–1065. [Google Scholar] [CrossRef]
- Zhu, Q.; Luo, Y.; Zhou, D.; Xu, Y.P.; Wang, G.; Gao, H. Drought monitoring utility using satellite-based precipitation products over the Xiang River Basin in China. Remote Sens. 2019, 11, 1483. [Google Scholar] [CrossRef] [Green Version]
- Zhu, Q.; Xuan, W.; Liu, L.; Xu, Y.-P. Evaluation and hydrological application of precipitation estimates derived from PERSIANN-CDR, TRMM 3B42V7, and NCEP-CFSR over humid regions in China. Hydrol. Process. 2016, 30, 3061–3083. [Google Scholar] [CrossRef]
- Gao, X.; Zhu, Q.; Yang, Z.; Wang, H. Evaluation and Hydrological Application of CMADS against TRMM 3B42V7, PERSIANN-CDR, NCEP-CFSR, and Gauge-Based Datasets in Xiang River Basin of China. Water 2018, 10, 1225. [Google Scholar] [CrossRef] [Green Version]
- Jiang, S.; Ren, L.; Hong, Y.; Yang, X.; Ma, M.; Zhang, Y.; Yuan, F. Improvement of multi-satellite real-time precipitation products for ensemble streamflow simulation in a middle latitude basin in South China. Water Resour. Manag. 2014, 28, 2259–2278. [Google Scholar] [CrossRef]
- Li, X.; Zhang, Q.; Ye, X. Dry/Wet Conditions Monitoring Based on TRMM Rainfall Data and Its Reliability Validation over Poyang Lake Basin, China. Water 2013, 5, 1848–1864. [Google Scholar] [CrossRef]
- Liang, X.; Lettenmaier, D.P.; Wood, E.F.; Burges, S.J. A simple hydrologically based model of land surface water and energy fluxes for GSMs. J. Geophys. Res. 1994, 99, 14415–14428. [Google Scholar] [CrossRef]
- Liang, X.; Wood, E.; Lettenmaier, D.P. Surface soil moisture parameterization of the VIC-2L model: Evaluation and modification. Glob. Planet. Chang. 1996, 13, 195–206. [Google Scholar] [CrossRef]
- Wu, H.; Adler, R.F.; Tian, Y.; Huffman, G.J.; Li, H.; Wang, J.J. Real-time global flood estimation using satellite-based precipitation and a coupled land surface and routing model. Water Resour. Res. 2014, 50, 2693–2717. [Google Scholar] [CrossRef] [Green Version]
- Wu, H.; Adler, R.F.; Hong, Y.; Tian, Y.; Policelli, F. Evaluation of Global Flood Detection Using Satellite-Based Rainfall and a Hydrologic Model. J. Hydrometeorol. 2012, 13, 1268–1284. [Google Scholar] [CrossRef]
- Wu, H.; Kimball, J.S.; Mantua, N.; Stanford, J. Automated upscaling of river networks for macroscale hydrological modeling. Water Resour. Res. 2011, 47, W03517. [Google Scholar] [CrossRef] [Green Version]
- Wu, H.; Kimball, J.S.; Elsner, M.M.; Mantua, N.; Adler, R.F.; Stanford, J. Projected climate change impacts on the hydrology and temperature of Pacific Northwest rivers. Water Resour. Res. 2012, 48, W11530. [Google Scholar] [CrossRef]
- Wu, H.; Kimball, J.S.; Li, H.; Huang, M.; Leung, L.R.; Adler, R.F. A new global river network database for macroscale hydrologic modeling. Water Resour. Res. 2012, 48, W09701. [Google Scholar] [CrossRef] [Green Version]
- Wu, H.; Adler, R.F.; Tian, Y.; Gu, G.; Huffman, G. Evaluation of quantitative precipitation estimations through hydrological modeling in IFloodS river basins. J. Hydrometeorol. 2017, 18, 529–553. [Google Scholar] [CrossRef]
- Yan, Y.; Wu, H.; Gu, G.; Huang, Z.; Alfieri, L.; Li, X.; Nanding, N.; Pan, X.; Tang, Q. Climatology and Interannual Variability of Floods during the TRMM Era (1998–2013). J. Clim. 2020, 33, 3289–3305. [Google Scholar] [CrossRef]
- Yan, Y.; Wu, H.; Gu, G.; Ward, P.J.; Luo, L.; Li, X.; Huang, Z.; Tao, J. Exploring the ENSO impact on Basin-scale floods using hydrological simulations and TRMM precipitation. Geophys. Res. Lett. 2020, 47, e2020GL089476. [Google Scholar] [CrossRef]
- Huang, Z.; Wu, H.; Adler, R.F.; Schumann, G.; Gourley, J.J.; Kettner, A.; Nanding, N. Multisourced Flood Inventories over the Contiguous United States for Actual and Natural Conditions. Bull. Am. Meteorol. Soc. 2021, 102, E1133–E1149. [Google Scholar] [CrossRef]
- Nanding, N.; Wu, H.; Tao, J.; Maggioni, V.; Beck, H.E.; Zhou, N.; Huang, M.; Huang, Z. Assessment of Precipitation Error Propagation in Discharge Simulations over the Contiguous United States. J. Hydrometeorol. 2021, 22, 1987–2008. [Google Scholar] [CrossRef]
- Gelaro, R.; McCarty, W.; Suárez, M.J.; Todling, R.; Molod, A.; Takacs, L.; Randles, C.A.; Darmenov, A.; Bosilovich, M.G.; Reichle, R.; et al. The Modern-Era Retrospective Analysis for Research and Applications, Version 2 (MERRA-2). J. Clim. 2017, 30, 5419–5454. [Google Scholar] [CrossRef]
- Cressman, G.P. An operational objective analysis system. Mon. Weather. Rev. 1959, 87, 367–374. [Google Scholar] [CrossRef]
- Huffman, G.J.; Stocker, E.F.; Bolvin, D.T.; Nelkin, E.J.; Tan, J. GPM IMERG Early Precipitation L3 Half Hourly 0.1 Degree × 0.1 Degree V06; Goddard Earth Sciences Data and Information Services Center (GES DISC): Greenbelt, MD, USA, 2019. [Google Scholar] [CrossRef]
- Huffman, G.J.; Stocker, E.F.; Bolvin, D.T.; Nelkin, E.J.; Tan, J. GPM IMERG Final Precipitation L3 Half Hourly 0.1 Degree × 0.1 Degree V06; Goddard Earth Sciences Data and Information Services Center (GES DISC): Greenbelt, MD, USA, 2019. [Google Scholar] [CrossRef]
- Ying, M.; Zhang, W.; Yu, H.; Lu, X.; Feng, J.; Fan, Y.; Zhu, Y.; Chen, D. An overview of the China Meteorological Administration tropical cyclone database. J. Atmos. Ocean. Technol. 2014, 31, 287–301. [Google Scholar] [CrossRef] [Green Version]
- Lu, X.; Yu, H.; Ying, M.; Zhao, B.; Zhang, S.; Lin, L.; Bai, L.; Wan, R. Western North Pacific Tropical Cyclone Database Created by the China Meteorological Administration. Adv. Atmos. Sci. 2021, 38, 690–699. [Google Scholar] [CrossRef]
- Nash, J.E.; Sutcliffe, J.V. River flow forecasting through conceptual models part I—A discussion of principles. J. Hydrol. 1970, 10, 282–290. [Google Scholar] [CrossRef]
- Taylor, K.E. Summarizing multiple aspects of model performance in a single diagram. J. Geophys. Res. Atmos. 2001, 106, 7183–7192. [Google Scholar] [CrossRef]
- Yan, Y.; Wang, G.; Wu, H.; Gu, G.; Nanding, N. Characteristics of Precipitation and Floods during Typhoons in Guangdong Province. Remote Sens. 2022, 14, 1945. [Google Scholar] [CrossRef]
- Sun, Y.; Yang, X.; Cui, X. Analysis of the Suitability of High Resolution Satellite Inversion Precipitation Data in Sichuan Province. Clim. Chang. Res. Lett. 2018, 7, 5. [Google Scholar] [CrossRef]
- Anjum, M.N.; Ding, Y.; Shangguan, D.; Ahmad, I.; Ijaz, M.W.; Farid, H.U.; Yagoub, Y.E.; Zaman, M.; Adnan, M. Performance Evaluation of Latest Integrated Multi–Satellite Retrievals for Global Precipitation Measurement (Imerg) over the Northern Highlands of Pakistan. Atmos. Res. 2018, 205, 134–146. [Google Scholar] [CrossRef]
Publisher’s Note: MDPI stays neutral with regard to jurisdictional claims in published maps and institutional affiliations. |
© 2022 by the authors. Licensee MDPI, Basel, Switzerland. This article is an open access article distributed under the terms and conditions of the Creative Commons Attribution (CC BY) license (https://creativecommons.org/licenses/by/4.0/).