Abstract
The Nadir Mapper (NM) and Nadir Profiler (NP) within the Ozone Mapping and Profiler Suites (OMPS) are ultraviolet spectrometers to measure Earth radiance and Solar irradiance spectra from 300–380 nm and 250–310 nm, respectively. The OMPS NM and NP instruments flying on the Suomi-NPP (SNPP) satellite have provided over ten years of operational Sensor Data Records (SDRs) data sets to support a variety of OMPS Environmental Data Record (EDR) applications. However, the discrepancies of quality remain in the operational OMPS SDR data prior to 28 June 2021 due to changes in calibration algorithms associated with the calibration coefficient look-up tables (LUTs) during this period. In this study, we present results for the newly () reprocessed SNPP OMPS NM and NP SDR data prior to 30 June 2021, which uses consistent calibration tables with improved accuracy. Compared with a previous () reprocessing, this new reprocessing includes the improvements associated with the following updated tables or error correction: an updated stray light correction table for the NM, an off-nadir geolocation error correction for the NM, an artificial offset error correction in the NM dark processing code, and biweekly solar wavelength LUTs for the NP. This study further analyzes the impact of each improvement on the quality of the OMPS SDR data by taking advantage of the existing OMPS SDR calibration/validation studies. Finally, this study compares the reprocessed OMPS data sets with the operational and the reprocessed data sets. The results demonstrate that the new reprocessing significantly improves the accuracy and consistency of the life-time SNPP OMPS NM and NP SDR data sets. It also advances the uniformity of the data over the dichroic range from 300 to 310 nm between the NM and NP. The normalized radiance differences at the same wavelength between the NM and NP observations are reduced from 0.001 order ( reprocessing) or 0.01 order (operational processing) to 0.001 order or smaller. The reprocessed data are archived in the NOAA CLASS data center with the same format as the operational data.
1. Introduction
The Ozone Mapping and Profiler Suites (OMPS) [1,2,3] are an important payload onboard the Suomi NPP (SNPP) and Joint Polar Satellite System (JPSS)-01 (alias NOAA-20) satellites, which launched on 28 October 2011 and 18 November 2017, respectively. The Nadir Mapper (NM) and Nadir Profiler (NP) within the OMPS, which are hereinafter named as NM and NP for clarity, are two grating spectrometers designed to measure the Earth radiance and Solar irradiance spectra in the UV bands. As an experimental sensor, the Limb profiler is the third spectrometer within the SNPP OMPS for measuring the scattering radiance from the Earth limb, and is not included in this study. For simplification, the OMPS hereinafter represents only the NM and NP. After intensive pre-launch and post-launch calibration/validation activities [4,5,6,7,8,9,10,11,12], the SNPP OMPS Sensor Data Record (SDR) data show scientific quality within the requirements through the JPSS final (validated maturity) review in August 2015, which is an official review board to determine the quality maturity of JPSS instrument SDR data. The SDR data are operationally produced in the JPSS Interface Data Processing Segment (IDPS) at the NOAA Environmental Satellite Processing Center (ESPC). Near-real time SDR data are distributed through the Production Distribution and Access (PDA) system, the JPSS Government Resources for Algorithm Verification, Independent Test and Evaluation (GRAVITE) system [13], and the NOAA Direct Readout [14]. Long-term access to OMPS SDR data is available through the NOAA Comprehensive Large Array-data Stewardship System (CLASS). So far, a series of environmental data record (EDR) products [15,16,17,18,19], such as total column ozone, vertical ozone, aerosol index, and SO2, have been operationally produced by using OMPS SDR data. Other applications of OMPS EDR data includes trend monitoring of the ozone profile [20], studies of the Antarctic ozone hole [21], retrieval of HCHO total columns [22], SO2 and NO2 retrievals [23,24], and H2CO retrieval [25]. A good summary of OMPS SDR-derived EDR products was also given in Dunlap [26] and Zhou et al. [27]. Recently, an experimental OMPS NM SDR radiance assimilation was demonstrated through one-dimensional variational analysis [28], yielding encouraging results for OMPS SDR data assimilation into Numerical Weather Prediction (NWP) models.
Currently, the IDPS operational SNPP OMPS SDR has been distributed to the user community to support the aforementioned product retrievals and analyses for over ten years. Nevertheless, occasional discrepancies in the calibration algorithm and coefficient look-up-tables (LUTs) were incurred prior to 28 June 2021, causing inconsistencies in the quality of this long-term operational SDR data set for both OMPS NM and NP. The discrepancy also appeared over the dichroic range from 300 to 310 nm between the NM and NP in the operational data set. Appendix A provides details of the calibration table updates in the whole operational processing history before 30 June 2021, when the operational processing employed a number of experimental LUTs. With the successful JPSS final review [29], a series of the validated LUTs were implemented into the operational processing to ensure that the data quality was averagely within the OMPS science requirements defined in [1,30,31]. Appendix B lists the JPSS scientific requirements for the OMPS NM and NP SDR data. An initial reprocessing of SNPP OMPS data was conducted in 2016 to improve the discrepancy of the available operational data quality [32]. In 2020, a more comprehensive reprocessing, referred to as version 1 (), was completed [33]. Version 1 reprocessing covered the period prior to 8 March 2017 for the NP and the period prior to 30 September 2018 for the NM. reprocessing was found compared to the operational data during the same period. However, the reprocessing did not implement several of the improvements developed in the last couple of years since 2020, which further improved the accuracy of the SNPP OMPS SDR data under specific circumstances. Those improvements include a newly updated stray light (SL) table to improve the accuracy of the NM Earth-view radiance data at short wavelengths [11], the correction of an artifactual dark processing coding error for the NM [34], and an updated Field Angle Map (FAM) LUT for off-nadir geolocation error corrections to the NM [35,36]. In addition, the reprocessing used a fixed solar irradiance wavelength calibration table for the NP [33], which was the solar wavelength shift table applicable for two succeeding weeks after 18 July 2015. Such tables were unable to represent the variable wavelength shift features with time. To satisfy the need for consistencies in the OMPS EDR retrievals, ozone climate reanalysis, OMPS radiance climate data records, and assimilation into NWP models, it is necessary to conduct a new reprocessing to generate mission-long quality-consistent SNPP OMPS SDR data records.
In this study, we reprocess the SNPP OMPS SDR data from 25 January (30 January) 2012 through to 30 June 2021 for the NP (NM). This is done by incorporating the calibration tables validated through the JPSS final review and the aforesaid new improvements into the IDPS Algorithm Development Library (ADL) processing package. This new reprocessing is hereafter referred to as version 2 () reprocessing. The reprocessing utilizes the dynamic solar wavelength shift LUT by using raw solar flux measurement data during the same period (two weeks per period) to better represent the effect of the radiance spectral wavelength shift with time. This derivation is slightly different from the operational processing where each solar wavelength shift table is derived using the measurements two weeks earlier than the implementation week of the LUT. In other words, the solar wavelength shift information used in the operational processing is a prediction for two succeeding weeks. The differences between the prediction and the ‘truth’ of wavelength shifts from the current two weeks are typically small with some margins (see Section 3 and Section 4). The operational data streams after 28 June 2021 use all consistent calibration tables, except for the prediction of the solar wavelength shifts. Notice that there are two days of overlapped data between the operational processing and reprocessing that use the same calibration tables, except for the solar wavelength table. Therefore, a mission-long quality-consistent SNPP OMPS SDR data set is expected to be produced by combining the new reprocessing and the operational procession after June 2021. In fact, the results about the reprocessed data set have been presented in [37]. Importantly, all OMPS SDR calibration algorithms associated with the abovesaid improvements that are used in the reprocessing were well validated in previous studies (e.g., [4,5,6,7,8,9,10,11,12,35,36,38]). Hence, this study does not intend to further validate the quality of reprocessed SDR data sets. Instead, this study focuses on the individual impact of each major improvement and their overall impacts on the Long-Term (LT) quality stability of the OMPS SDR data sets. This study presents details of the four new improvements and their impacts on the SDR data by taking advantages of the existing calibration/validation studies. For example, the improved geolocation accuracy of the reprocessed OMPS NM SDR data for off-nadir pixels is validated using a newly-developed geolocation error assessment algorithm [36]. Furthermore, the LT quality inconsistencies of the operational and OMPS data records are assessed by comparing the time series of the daily averaged Earth-view radiance against the reprocessed data. A similar analysis is also applied to either the normalized radiance (the ratio of Earth-view radiance to solar irradiance) or the N-value due to their significance in OMPS ozone product retrievals. Here, the N-value is defined as the log of the normalized radiance multiplied by 100 (see Section 2 below for more explanations).
This paper is organized as follows. In Section 2, an introduction is given to the OMPS instrument and calibration methodology. In Section 3, major improvements are delineated about the SNPP OMPS SDR calibration tables after the final review, along with individual impacts on the data quality. Section 4 provides an assessment on the lifetime quality stability of the operational and OMPS SDR data sets against the data sets to demonstrate the overall impact of all improvements on the OMPS SDR data quality. A summary and concluding remarks are provided in Section 5.
2. Briefings of OMPS Instrument and Radiometric Calibration Algorithms
The descriptions of OMPS NM and NP sensors and calibration algorithms were described in detail in previous studies (e.g., [1,3,4,5,8]). Below, a briefing is given based on those references.
2.1. OMPS NM and NP Instruments
The OMPS flying in the SNPP satellite consists of a nadir sensor and a limb profile sensor. The nadir sensor includes two grating spectrometers of NM and NP, which are heritages of the Total Ozone Mapping Spectrometer (TOMS) [39] and NASA Backscatter UltraViolet Instrument (SBUV/2) [40]. The NM and NP provide global measurements of the solar radiation backscattered by the Earth’s atmosphere and surface along with measurements of the solar irradiance. Specifically, the OMPS NM operational processing covers the wavelength from 300 to 380 nm for the ozone total column observations using 196 channels, while the NP covers the wavelength from 250 to 310 nm using 147 channels for the ozone vertical profile’s observations. The two spectrometers have a spectral sampling of 0.4 nm and full-width half maximum (FWHM) of around 1.1 nm. Table 1 summarizes the SNPP OMPS nadir sensor characteristics.

Table 1.
SNPP OMPS NM and NP Instrument Characteristics.
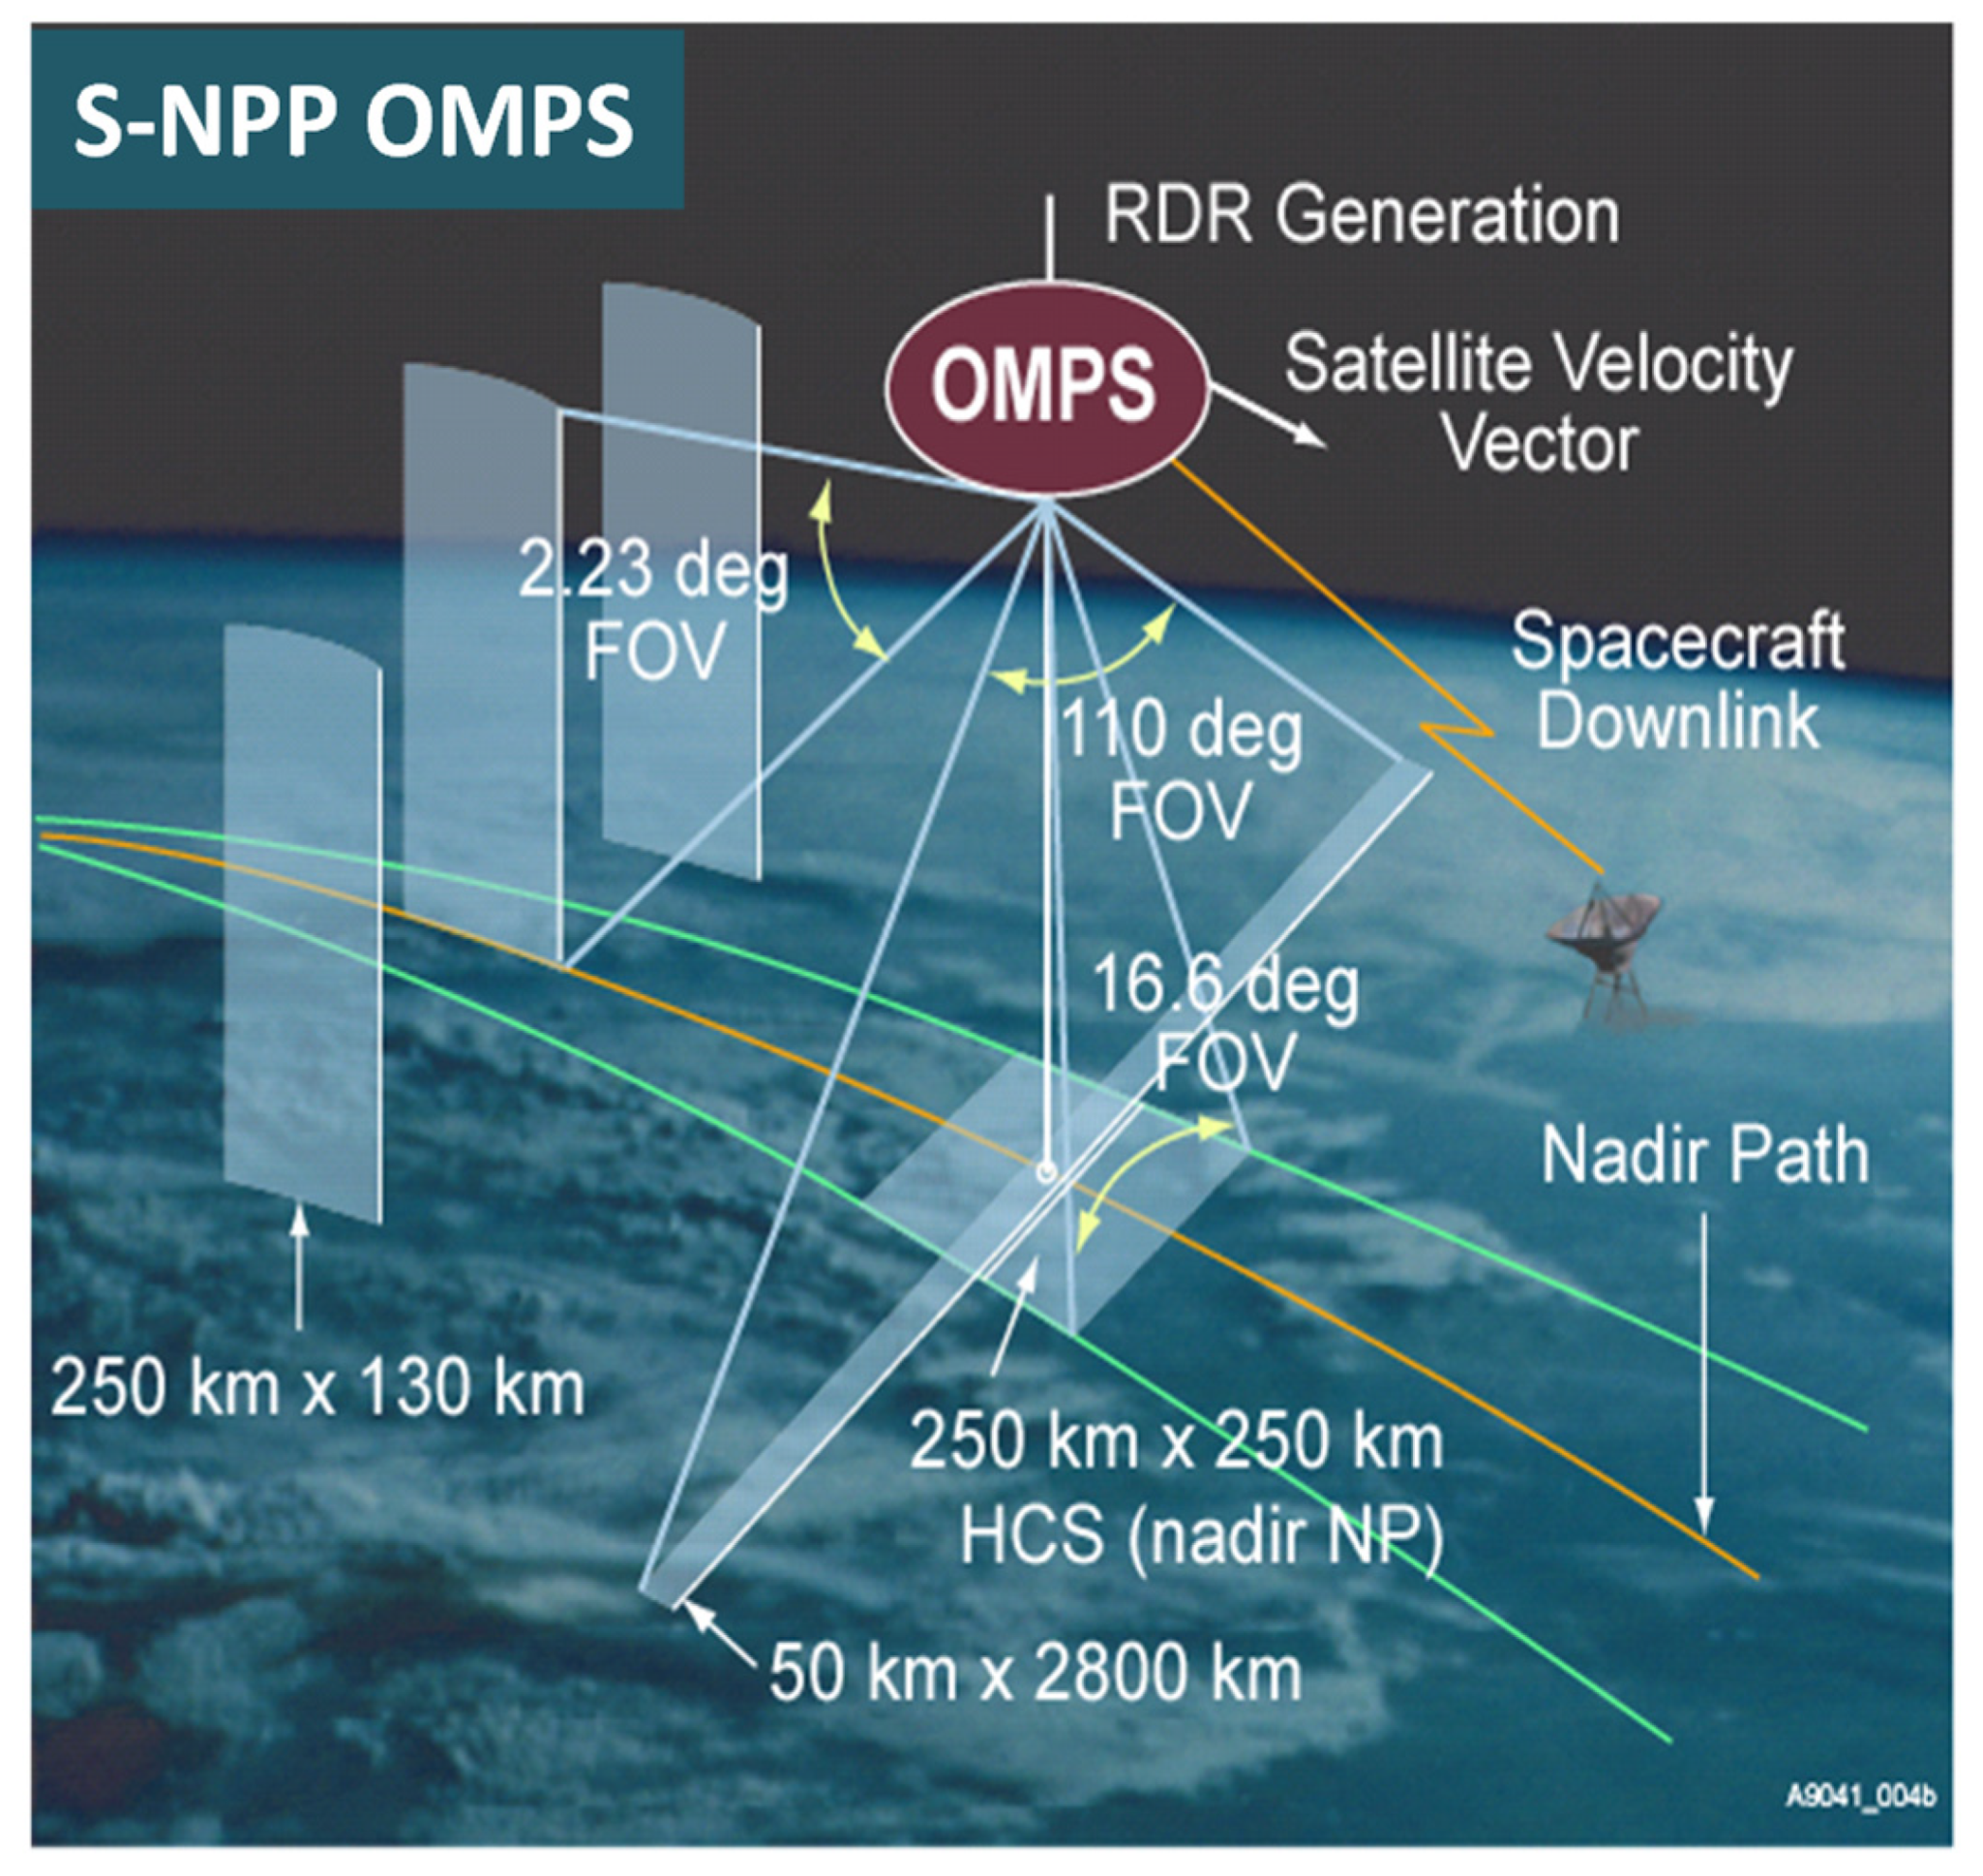
For the Earth radiance scanning mode, as described in Figure 1, the total column observations from the NM are collected over the full 110° cross-track field-of-view (FOV) across a 2800 km Earth-view swath, while the NP observations are taken only for the central 16.7° cross-track FOVs along a swath of 250 km. The OMPS measurements per swath are recorded by the CCD located at each spectrometer’s focal plane [4]. Each CCD image consists of 340 micropixels (CCD cells) along the spectral dimension and 740 micropixels in the spatial dimension. However, valid measurements in the NM sensor are obtained only by illuminating 196 spectral cells and 708 spatial cells within them, while the corresponding numbers for the NP sensor are 147 spectral and 93 spatial cells spanning the nadir [4]. In the NOAA ground nominal operational processing, for the NM spectrometer, the 708 active micropixel signals in the spatial dimension are co-added into 35 separate macro-pixels; for the NP sensor, the 93 spatial micropixel signals are aggregated into a single one for the SNPP. Hence, for the SNPP OMPS ground operational processing, the NM measurements per swath correspond to 35 ground cells (macro-pixels) with a spatial resolution of 50 × 50 km at nadir; the NP swath corresponds to 1 macro-pixel with a spatial resolution of 250 × 250 km. There is no aggregation in the spectral dimension to have a full spectral resolution, thus there are 196 wavelength channels for the NM and 147 wavelength channels for the NP. The OMPS SDR data in this study correspond to the macro-pixels. The summary of those ground OMPS SDR nominal specifications is also provided in Table 1.
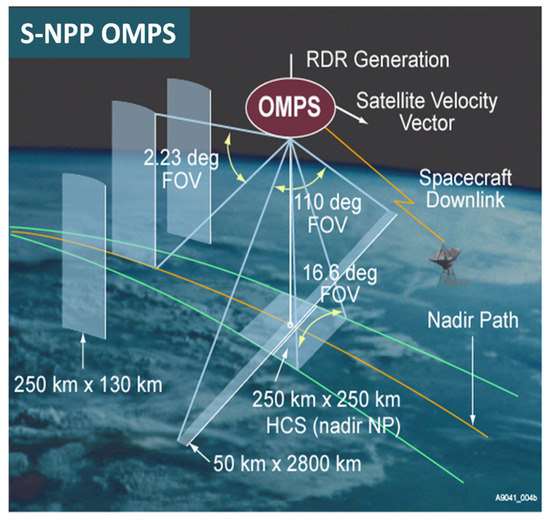
Figure 1.
Geometry of SNPP OMPS NM and NP cross-track and along-track, and Limb Profiler (LP) cross-track, along-track, and vertical observations [32,41].
Besides the Earth radiance measurements, the orbital solar observations are made via a reflective working diffuser once every two weeks for short-term monitoring, and a reflective reference diffuser once every six months (later reduced to once per year) for the long-term monitoring of sensor stability. During a measurement, the diffuser moves through seven different positions to cover the entire NM sensor FOV of 110 degrees, while the solar irradiance measurements for the NP are deployed at the 4th position to cover the entire NP FOV of 16.7 degrees. Each position corresponds to coverage with different solar azimuth and elevation angles. The entire sequence of solar measurements is completed near the Northern Earth Terminator from solar zenith angles of 80° to 100° spanning three consecutive orbits of observations to produce a total of 168 images. The final solar irradiance data per NM and NP are produced based on the measurements of the images with respect to each sensor. Details are given in [42] of the measurements per the position, the solar geometry, the orbit, and the number of the images.
2.2. OMPS Radiometric Calibration Methodology
The radiometric calibration of OMPS SDR data consists of the Earth radiance and solar irradiance calibrations, along with an important derived quantity, normalized radiance (NR). Note that ‘Earth’ and ‘solar’ are hereinafter typically omitted for clarity. The calibration is based on offsets-corrected radiometric counts of radiance and irradiance after the correction of the nonlinearity. The nonlinearity correction for the radiometric counts is performed in the OMPS flight software to reduce the impact of imperfect gain responses of on-chip CCD amplifiers within the instrument. As a result, the nonlinearity is not explicitly given in the following equations. In addition, the equations are given in a single CCD pixel, while those at a macro-pixel level, which is an aggregation of variables at multiple CCD pixels, are referred to in [42]. The following equations from (1) through to (5) illustrate the calibration principle of OMPS radiance and irradiance.
The Earth radiance calibration at a single pixel ( is expressed as a function of the corrected radiance counts that are included in the OMPS Raw Data Record (RDR) data by [3,43,44]
where the is the calibration coefficient that was determined in the prelaunch calibration, the represents the sensor response change as a function of time and the subscript indices and correspond to spectral and spatial dimensions, respectively. The specific wavelength and spatial geolocation with respect to the two indices are determined by the spectral wavelength and spatial registrations separately. The explanations of the variables in (1) and other equations in this study are summarized in Table 2.

Table 2.
Physical explanations of variables in (1) and other equations in this study.
The solar irradiance calibration is expressed as
Here, denotes the relative angular irradiance response (goniometric) of the sensor at the solar angle where and denote the solar zenith angle and azimuthal angle, respectively. The is the solar diffuser plate reflectivity change, which is also a critical quantity in the time-dependent calibration of the irradiance and following normalized radiance, . The calibration coefficients, , and are determined during the prelaunch calibration.
Then, the normalized radiance (NR), is defined by
where the sensor-change cancels through the ratio since the sensor change affects both the Earth and solar. The log of the normalized radiance, termed the N-value, is commonly used, which is expressed to be
The N-value provides a unit for the NR that has a scaling comparable to the total column ozone [44], while the factor of 100 is to produce a convenient numerical range.
In (1)–(3), both and represent the corrected radiometric counts for radiance and irradiance at a pixel after removing a number of offsets from the raw count data, which can be expressed in a common equation, i.e.,
where the represents the offset-corrected counts for a pixel which is applicable for both and The is for the nonlinearity-corrected counts for either radiance or solar irradiance at a pixel The denotes the received stray light at which is related to the Out of Band (OOB) and Out of field (OOF) SL contributions. The denotes the smear after corrections of electronic bias and dark, where the smear results from the photon flux incident upon the pixels during the parallel charge transfer operations were originally observed. The represents the CCD dark current that is subject to bias corrections. A detailed description is referred to in [44].
According to (1)–(5), the calibration accuracies of radiance, irradiance, and the NR (or N-value) are determined primarily by accuracies of the spectral wavelength registration associated with the index for the variables, the geolocation registration associated with the index , the SL correction [see in (5)], and the dark current correction [see in (5)]. This stimulates the development of the validated calibration tables through the final review and additional updates of the tables to ensure the accuracy of the radiance and irradiance, which are implemented into the whole new reprocessing in this study.
Note that uncertainties in the instrument pre-launch radiometric coefficients, , are not considered in this study. The pre-launch instrument calibration coefficients meet the sensor requirements with margins. Hence, strictly speaking, the calibration accuracies are also affected by uncertainties in the calibration coefficients [], and two time-dependent parameters relevant to instrument performance [i.e., and ]. In fact, certain uncertainties were reported in measurements of the pre-launch instrument calibration coefficients. There are several possible error sources, i.e., the wavelength interpolation error among a set of discrete wavelengths, calibration uncertainties in the used FEL lamps and the Complex Source Beam (CSB) during measurements of OMPS sensor calibration coefficients [45]. It would be interesting to conduct an analysis about potential impacts of these calibration coefficient uncertainties on the OMPS SDR data quality in a future study. In addition, changes of and with time will be important if the instrument onboard the satellite experiences a significant degradation. The change of was assessed in a recent study [46], showing a non-negligible sensor degradation for the SNPP NP instrument. A regular (probably once per half year) sensor degradation correction was proposed for the future IDPS OMPS SDR operational processing. In order to comply with the current operational OMPS SDR processing, however, the effect of the NP sensor degradation is not considered for the reprocessing of SNPP NP data in this study.
Overall, the calibration tables implemented into the new reprocessing are only related to the improvements in the spectral wavelength registration, the geolocation registration, the SL correction, and the dark current correction, as presented below.
3. New Improvements in the SNPP OMPS SDR Calibration Tables after the Final Review
The reprocessed SNPP OMPS SDRs cover the period between 25 January 2012 through to 30 June 2021 for the NP and the period from 30 January 2012 to 30 June 2021 for the NM, where the starting date was determined by the first measurement for the NP and NM, respectively. As mentioned above, the new reprocessing implements two types of calibration tables. The first one covers the validated-maturity calibration tables passing the JPSS’ final review, which were implemented in the reprocessing [33], while the second one consists of the new improvements under circumstances associated with the updated tables after the review. The validated tables include, but are not limited to, the following list: the weekly dark calibration tables for both NM and NP, validated day-1 solar spectrum data for the NM and NP, and the SL calibration tables for the NP and NM. Their algorithms were well described in previous studies [4,5,6,7,8,9,10,29,32] and thus their discussions are omitted here. This study focuses on the latest improvements after the reprocessing, i.e., an offset error correction in the dark count processing code for NM, an updated SL correction table for NM, and an off-nadir geolocation error correction in the geolocation registration for NM. The bi-weekly solar wavelength shift LUTs for NP are also described since the reprocessing used a fixed solar LUT for the whole data set, which was a solar wavelength shift table on 18 July 2015. In addition, the new reprocessing used dynamic solar LUTs derived by using the raw solar flux data during the same period as the implementation weeks, while the operational processing used the prediction of solar wavelength shifts that are based on the solar raw flux measurement data from two weeks earlier. Thus, an impact should be expected due to this difference in raw flux data (see Section 3.1 for more discussions).
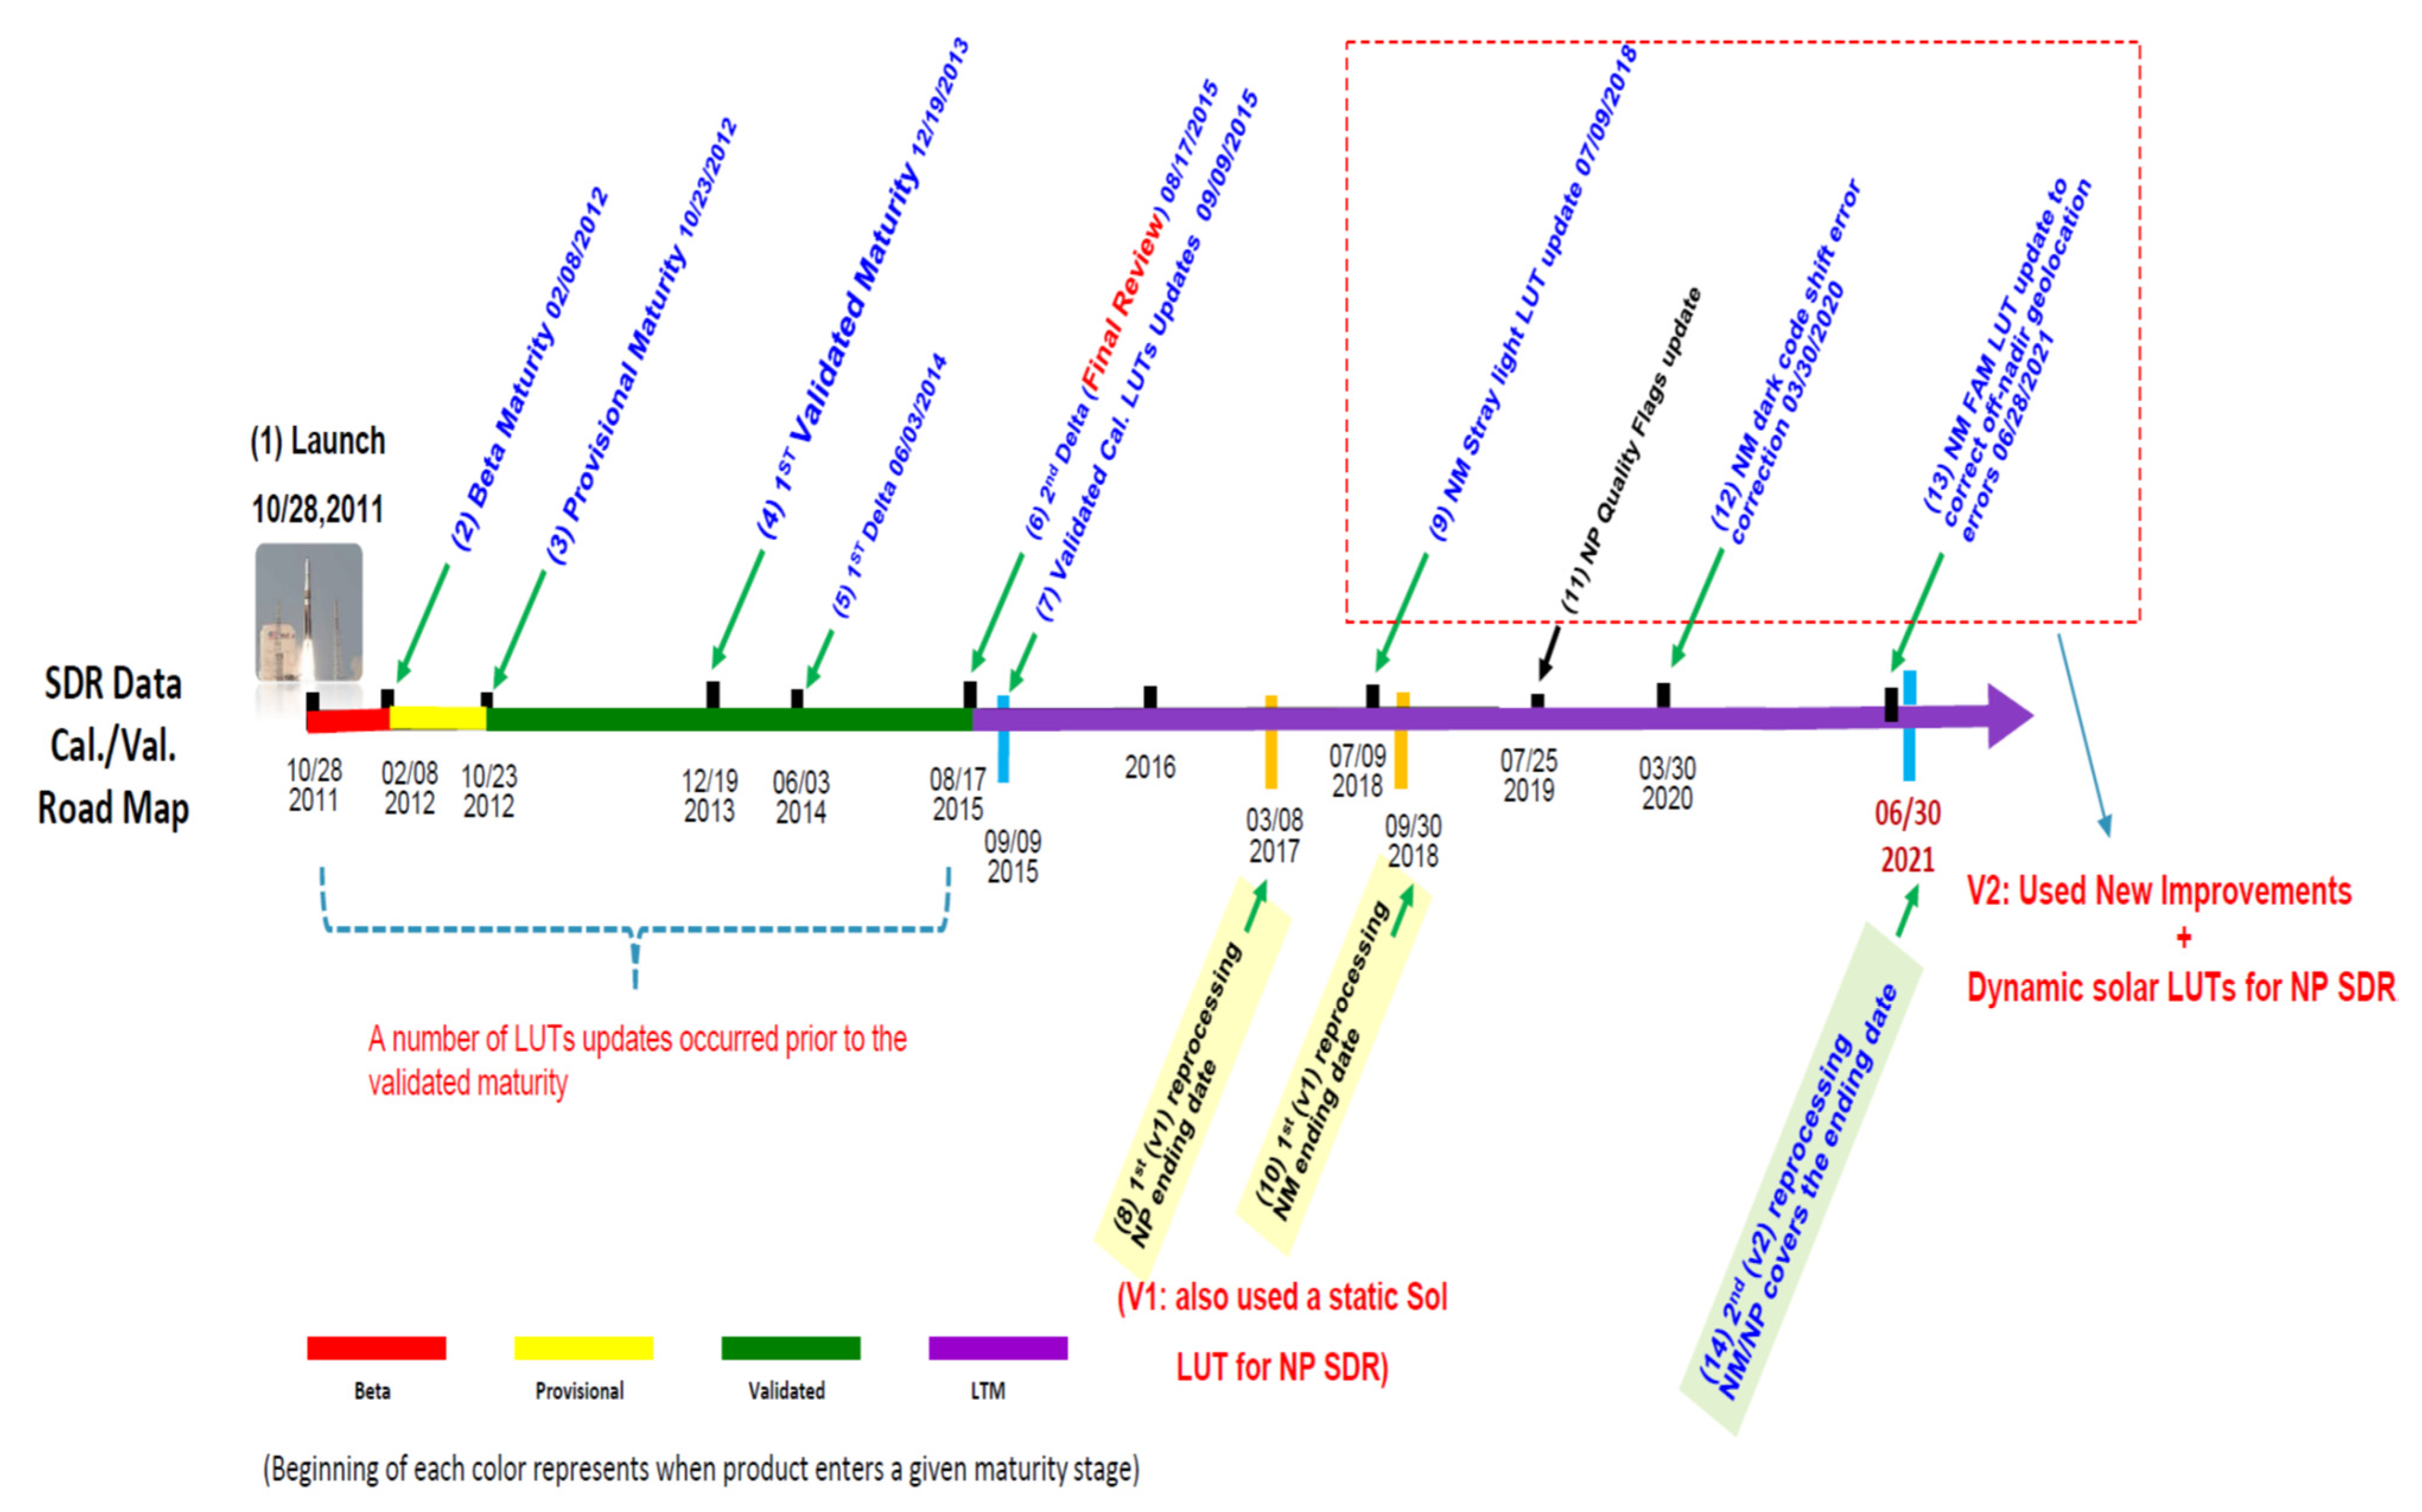
Figure 2 shows the timeline of the SNPP OMPS SDR calibration reviews and major LUT updates that were implemented into the SNPP OMPS operational processing until June 2021. The four updates highlighted in the dashed line of the rectangular box are the new improvements in the new reprocessing. The deficiencies of the reprocessing in [33] are thus illustrated in the figure: missing the four updated LUTs within the rectangular box and using a static solar wavelength shift LUT. In addition, the NP quality flag update among them does not affect the quality of the SDR data, so its discussions are omitted in this study. Therefore, in the following subsections, we introduce, in detail, the biweekly solar LUTs, the offset error correction in the dark count processing code, the updated SL correction table with the OOB correction, and the updated Field Angle Map or FAM table. The individual impact is analyzed based on the existing studies.
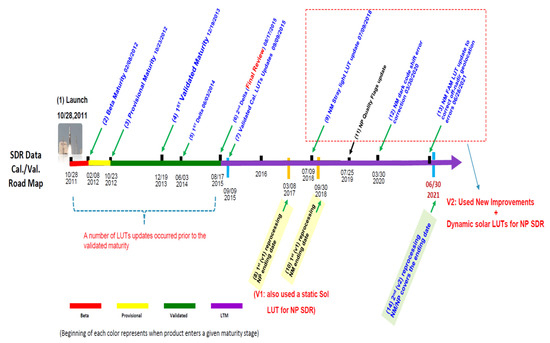
Figure 2.
Timeline of official reviews required by the JPSS program and major improvements (updated LUTs) in the SNPP OMPS operational processing. In the figure, three JPSS reviews consist of the beta maturity review, provisional maturity review, and well–validated maturity review (final review). The two delta reviews are following–up meetings to pursue improvements in the calibration corresponding to the comments from the validated review. The descriptions are given in Table 3 about the reviews, major improvements, and events in the SNPP OMPS SDR calibration/validation timeline. The length of the timeline is not scaled.
3.1. Dynamical Tables for NP Solar Wavelength Shift Calibration
Spectral registration is a key component in the OMPS calibration process, which intends to specify the value of the central wavelength corresponding to the index j in each variable from (1) to (5). The initial wavelengths, bandpass, and synthetic solar spectrum for a pre-launch OMPS instrument were well characterized prior to launch, and a day-1 solar spectrum was further derived based on the synthetic spectrum to reflect the spectral wavelength shift of the instrument from ground (pre-launch) to boarding the satellite [10]. However, for an in-flight OMPS instrument, over time, the spectral illumination can shift slightly due to sensor temperature change, thus requiring a periodical wavelength registration. For the OMPS NP, a solar irradiance and wavelength shift LUT is generated every two weeks, simply named as a bi-weekly solar LUT, by comparing the measured solar spectrum from the solar working diffuser with the day-1 solar spectrum [42].
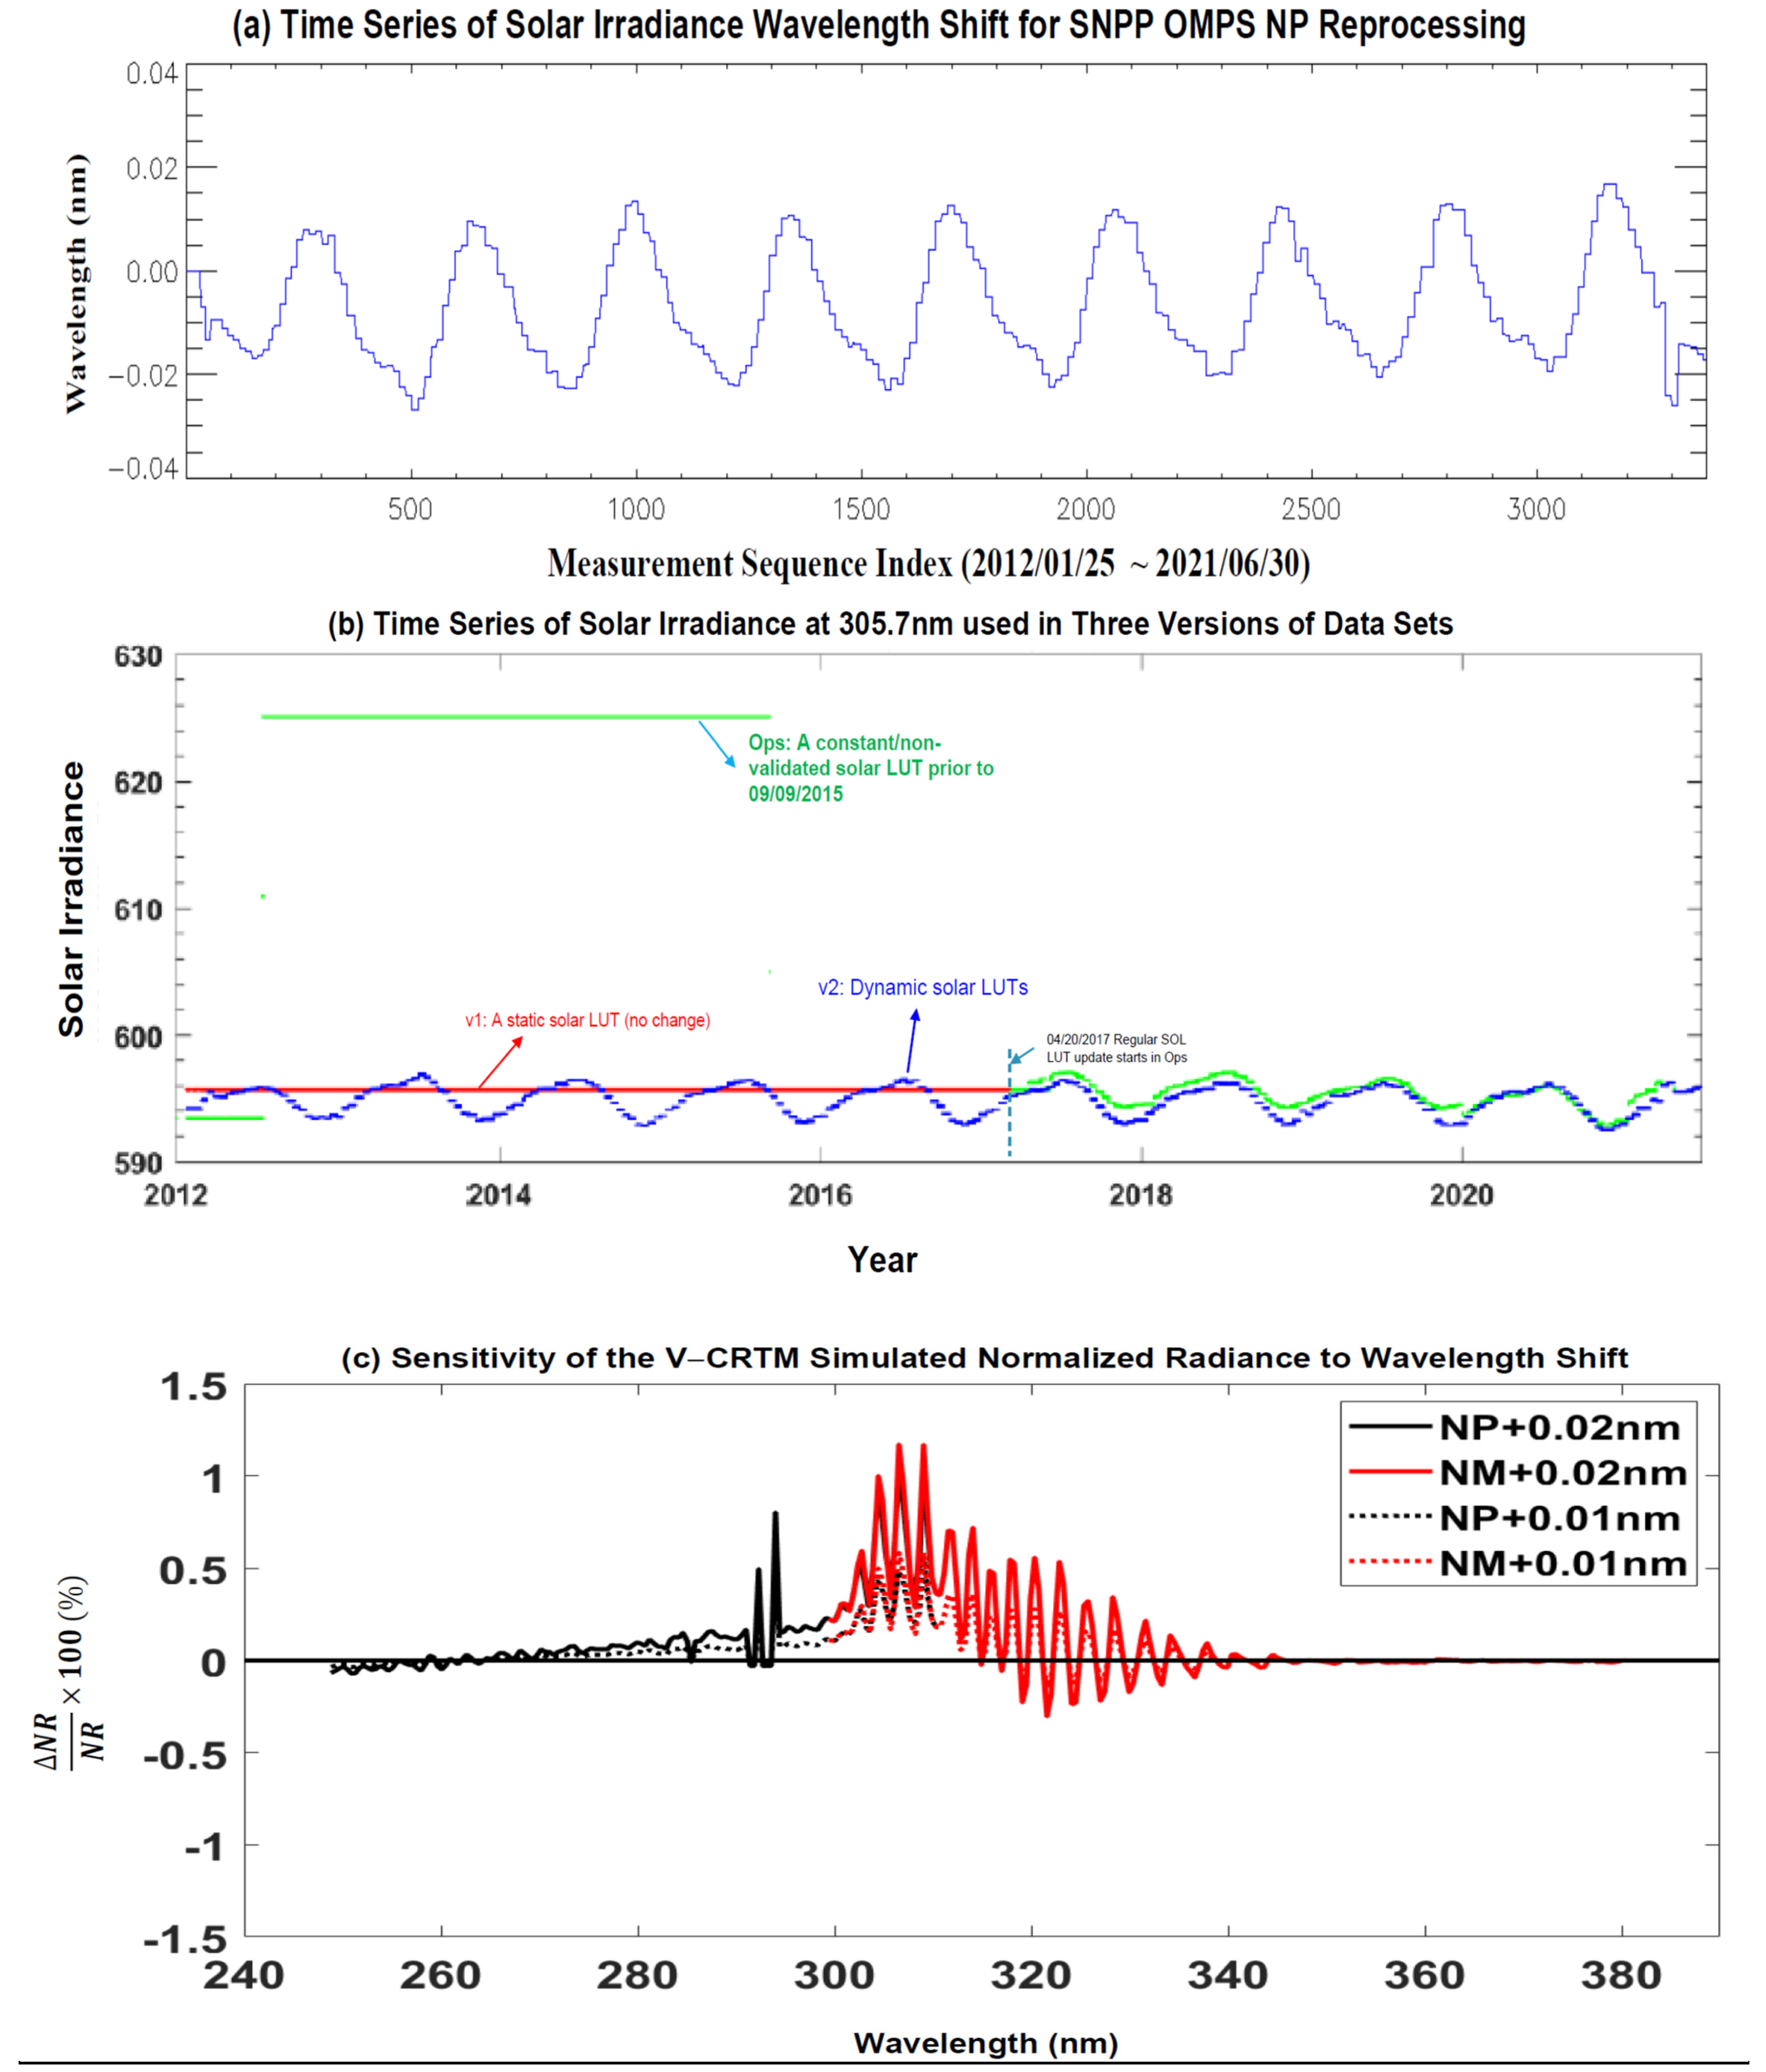
Figure 3a illustrates the time series of the wavelength shifts in the solar LUTs that are utilized in the SNPP OMPS NP reprocessing. The wavelength shift shows an annual pattern per channel with the absolute magnitude up to around 0.025 nm. However, this active wavelength shift feature was not entirely addressed in both the whole reprocessing and operational processing. The reprocessing used a static solar LUT, thus failing in capturing the effect of the instrument temperature change on the wavelength shift. The requirement of 0.01 nm for the wavelength shift is not always met in the reprocessing. The operational processing experienced several changes: it used two fixed solar LUTs prior to 9 September 2015; after 9 September 2015, it started using dynamic solar LUTs to account for the effect of the instrument temperature change on the wavelength shift.
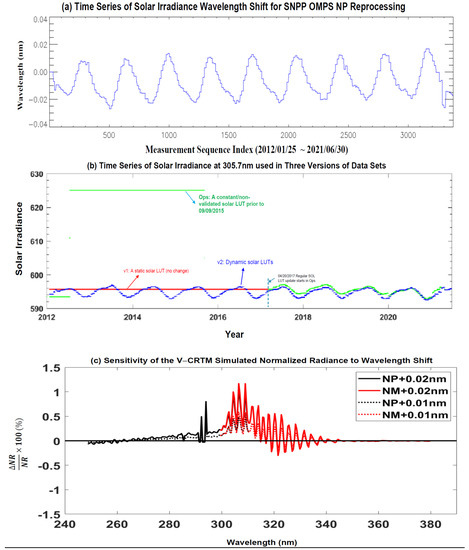
Figure 3.
(a) Time series of solar irradiance wavelength shifts used in the SNPP OMPS NP new reprocessing. (b) Time series of the solar irradiance at 305.7 nm in the SNPP NP solar LUT used in the operational (OPS), the reprocessing, and the reprocessing. (c) Sensitivity of the V–CRTM simulated normalized radiance (NR) at the whole OMPS NM and NP wavelengths to wavelength shifts of 0.01 nm and 0.02 nm, respectively.
To demonstrate the significance of using accurate solar LUTs, Figure 3b displays the long-term time series of the solar irradiance at 305.7 nm in the SNPP NP solar LUTs that are used in the operational (OPS), the first version of reprocessing (), and the second (new) version of reprocessing (). Large discrepancies in the solar irradiance were found prior to the final review between the fixed wavelength shift LUTs in the operational processing and the solar LUTs: approximately 0.5% (1st fixed solar LUT) ~ 5% (2nd fixed solar LUT). After the final review, the solar flux in the operational data was slightly different from that in the data, around 0.15% with some exceptions, demonstrating an overall good performance of the predicted spectral wavelength shifts after the final review. These small differences are caused by using the predictions. Each solar LUT in the operational processing was derived using the past two weeks of raw solar flux measurement data. In the reprocessing, each solar LUT was derived by using the raw solar flux measurements during the same period when it was implemented. Hence, the resulting solar LUTs in the can more accurately capture the wavelength shift features of the NP than those in the operational processing. Additionally, the new solar LUTs in the reprocessing fix imperfect predictions of the wavelength shifts in the operational processing that typically occurred in the Christmas week through to the New Year week each year. The starting date of the Christmas week changes with the year. During these short holiday weeks, there was no new implementation of the solar wavelength shift table due to the conflict with the operational processing working schedule. Finally, the new LUTs in the reprocessing also improve a few imperfect predictions of the wavelength shifts in the operational processing (see Figure 3b). For the reprocessing, the wavelength shift correction is a constant due to the use of a fixed solar LUT, with a deviation of around ±0.015 nm from that in the reprocessing depending upon the date. The differences of the solar flux at 305.7 nm against the reprocessing are around 0.15% to 0.5% depending upon an actual wavelength shift error. In addition to the impact of the wavelength shift on the solar flux, the impact also occurs on the Earth-view radiance. Figure 3c provides a sensitivity analysis about the normalized radiance (NR) change (%) due to the wavelength shift of 0.01 nm and 0.02 nm by using the vectorized Community Radiative Transfer Model (CRTM) [47]. There is around a 0.5% impact on the NR due to a wavelength shift of 0.01 nm at wavelengths between 300 and 320 nm. The impact is also observed at the time series of radiance and normalized radiance (see Section 4 below). Therefore, it is important to use dynamic solar LUTs to capture the changes of the OMPS NP sensor solar wavelength shift with time.
3.2. Fixing an Artifactual Offset Error in Dark Count Processing Code for SNPP NM
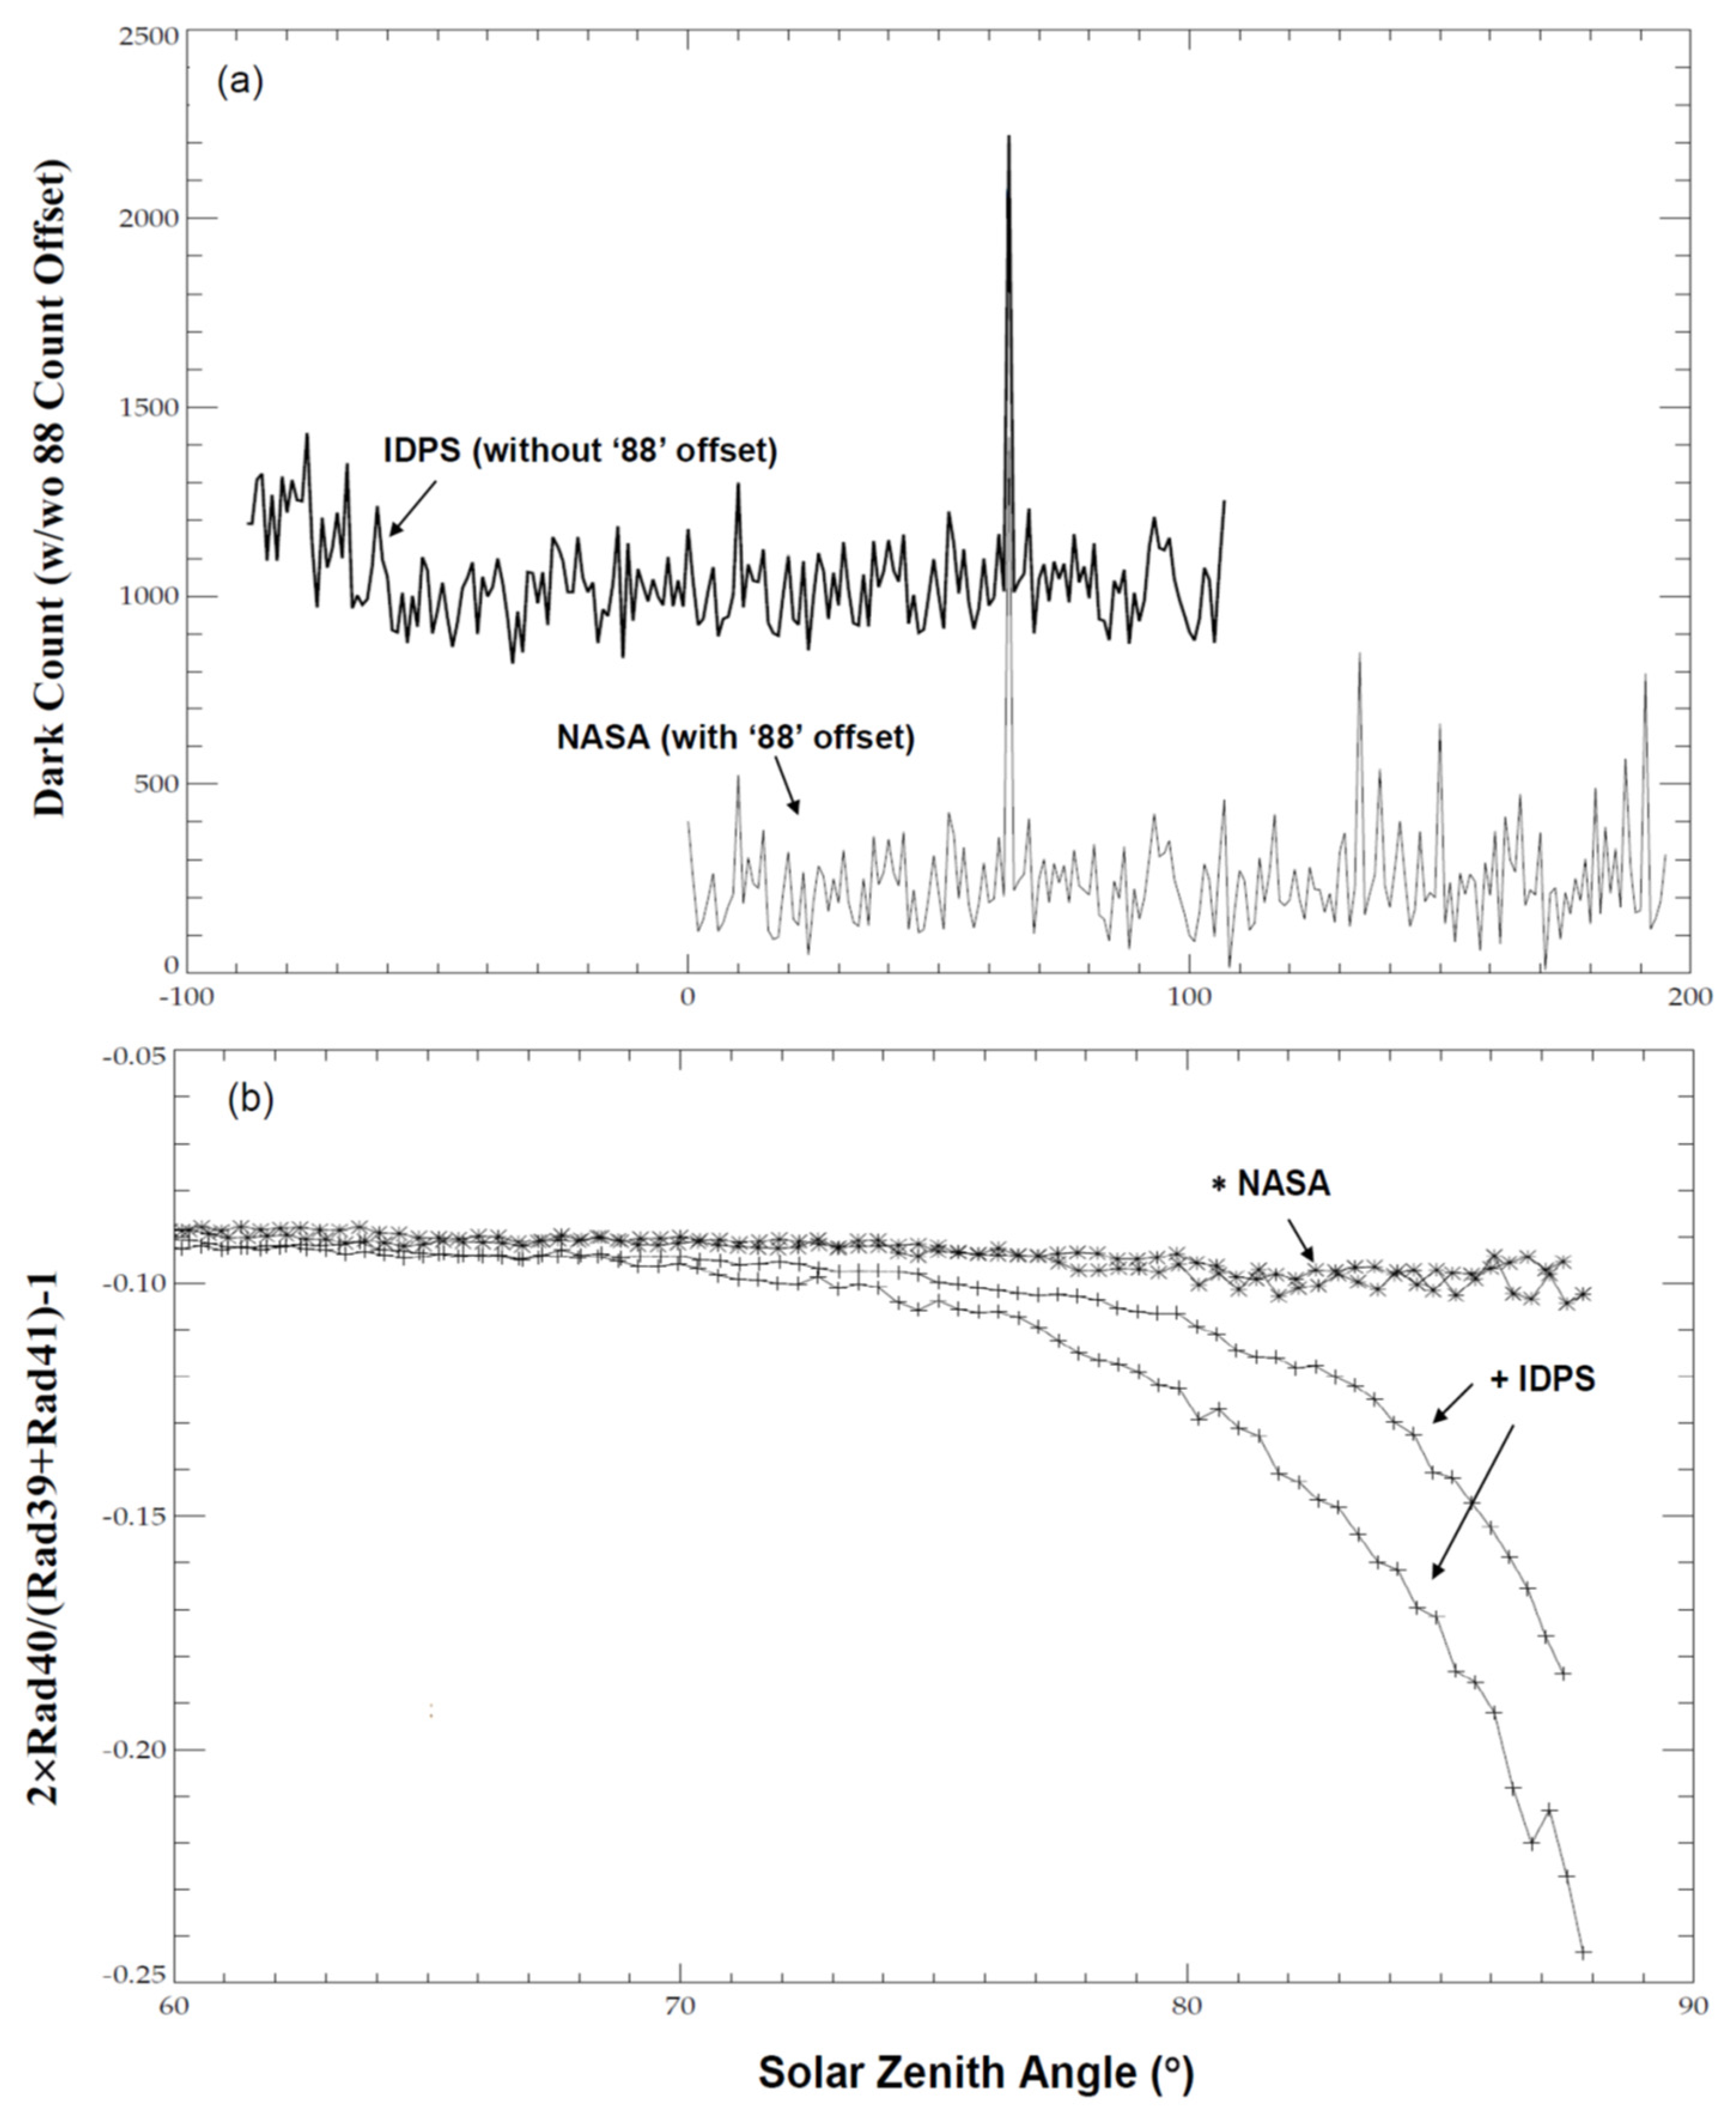
The dark signal, which is produced from thermally emitted electrons, results in additional offset counts to the photon-generated pixel counts [see in (5)]. The dark signal is variable with time due to the changes of instrument temperature and exposure time. For instance, the weekly increase in the dark signal is estimated to be around 0.3% for NM and 0.4% for NP [42]. A weekly calibration table is routinely implemented in the IDPS OMPS SDR operational processing to capture major changes of the dark current in the Earth and solar radiometric counts [8]. Unfortunately, an artifactual error associated with a wrong offset occurred in the IDPS OMPS processing for the SNPP NM dark current count correction. Theoretically, the spectral range in the code is needed to be clipped from the maximum of 340 CCD indices to the IDPS size of 196 channels for NM and 147 channels for NP, with a spectral offset parameter of 88 [34]. However, the offset was mistakenly set to be zero in the code. Figure 4a shows an example of resultant dark counts from the IDPS (offset = zero) and NASA processing (offset = 88) 1 December 2019. The wrong offset caused an inaccurate dark current correction with the largest relative effect at high solar zenith angles and low radiance wavelengths. Figure 4b shows the centered differences between the two types of processing changing with the Solar Zenith Angle (SZA) for the radiances at the 41st wavelength. The wavelength at the 41st index approximately corresponds to 317 nm, relative to those at the 40th (around 316.6 nm) and 42nd (around 317.4 nm) wavelength in the spectral index direction. For the 317 nm radiances with SZAs smaller than 80°, the coding error caused every dark current correction value to be wrong, leading to radiance errors on the order of 0.1%. In addition, the IDPS results have an unexpectedly strong SZA dependence that was not seen in the NASA results, indicating an additive error in the NOAA operational processing. This wrong offset was fixed on 30 March 2020, in the IDPS OMPS operational processing for SNPP NM dark current count correction.
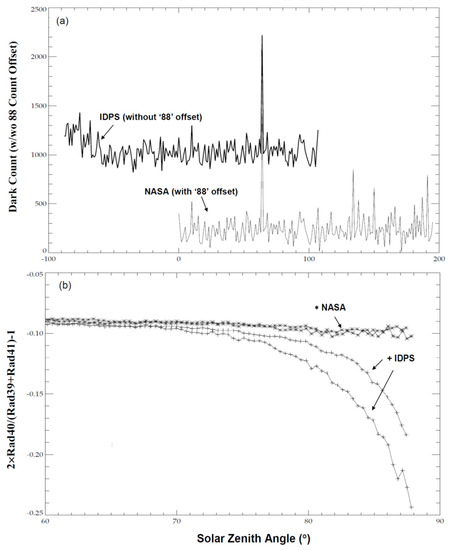
Figure 4.
(a) Comparison of SNPP OMPS NM dark corrections between the NASA (offset = 88) and the IDPS processing (offset = 0). (b) Centered difference for the radiances at the 41st wavelength (Rad41 in the figure; approximately corresponding to 317 nm), relative to those at the 40th and 42nd wavelength (Rad40 and Rad42) for the third cross-track position. More discussions are referred to [34].
3.3. An Updated Stray Light Correction LUT for SNPP NM
The stray light refers to any unintended light in an optical system, which can be from an unintended source or an intended source through an undesired path. As a 2D spectral-spatial CCD detector, the OMPS NM is susceptible to internally scattered SL (spectrally and spatially), so-called the Out-of-Field (OOF) SL. Alternatively, the OOF SL is defined as a signal within a spatial/spectral bin originating from the same spectral band, but from outside the convolution of the specular IFOV during a single measurement [44]. Hence, a stray light correction table is needed to correct the impact of SL on the OMPS radiance, which was determined by the instrument’s point spread function (PSF) [44,48]. In the reprocessed SNPP NM SDR data, an old version of the SL LUT without the Out-of-Band or OOB correction was used to correct the OOF SL effect on the radiance. According to the analysis in [11], however, the measured radiance counts at shorter wavelengths suffer from the contamination of the OOB SL signals resulting from the longer wavelength of the 415-nm spectrum. The updated SL LUT is to add the OOB correction into the old correction LUT. It was demonstrated that the calibration performance, by adding the OOB correction, can be well aligned with that of the NP radiance that is expected to have small SL signals. This updated SL table is used in the reprocessing, with a large impact on radiance at shorter NM wavelengths.
3.4. Off-Nadir Geolocation Error Correction for NM
Besides the spectral wavelength registration, the geolocation registration is another important calibration work which contains CCD pixel look angles for the Field Angle Map (FAM) LUT and is used to compute the pointing direction (unit vectors) of each individual CCD pixel in the OMPS SDR processing. The unit vectors are further combined according to the EV sample table to calculate the overall Line Of Sight (LOS) for each Earth View (EV) macropixel, which is utilized by the satellite common geolocation algorithm to geolocate the EV data location per the index l in variables from (1) to (5) [44]. Hence, the accuracy of the OMPS geolocation is closely linked to the FAM LUT and the unit vector equations. For the SNPP OMPS NM, the geolocation accuracy of nadir pixels was well validated [6,29], which is demonstrated to be within the JPSS OMPS geolocation accuracy requirement. However, large geolocation errors were detected in early 2018 for off-nadir pixels for the OMPS NM, although quantitative analyses were postponed to 2020 [49]. Recently, the root cause has been well understood as being caused by discrepancies in the instrument rotation coordinate definition between ground and in-flight [36]. An updated FAM LUT was developed in [35] to reduce the geolocation errors for off-nadir pixels and was further implemented on 28 June 2021 into the operational processing. The accuracy of the updated FAM LUT was confirmed against the VIIRS geolocation data [36].
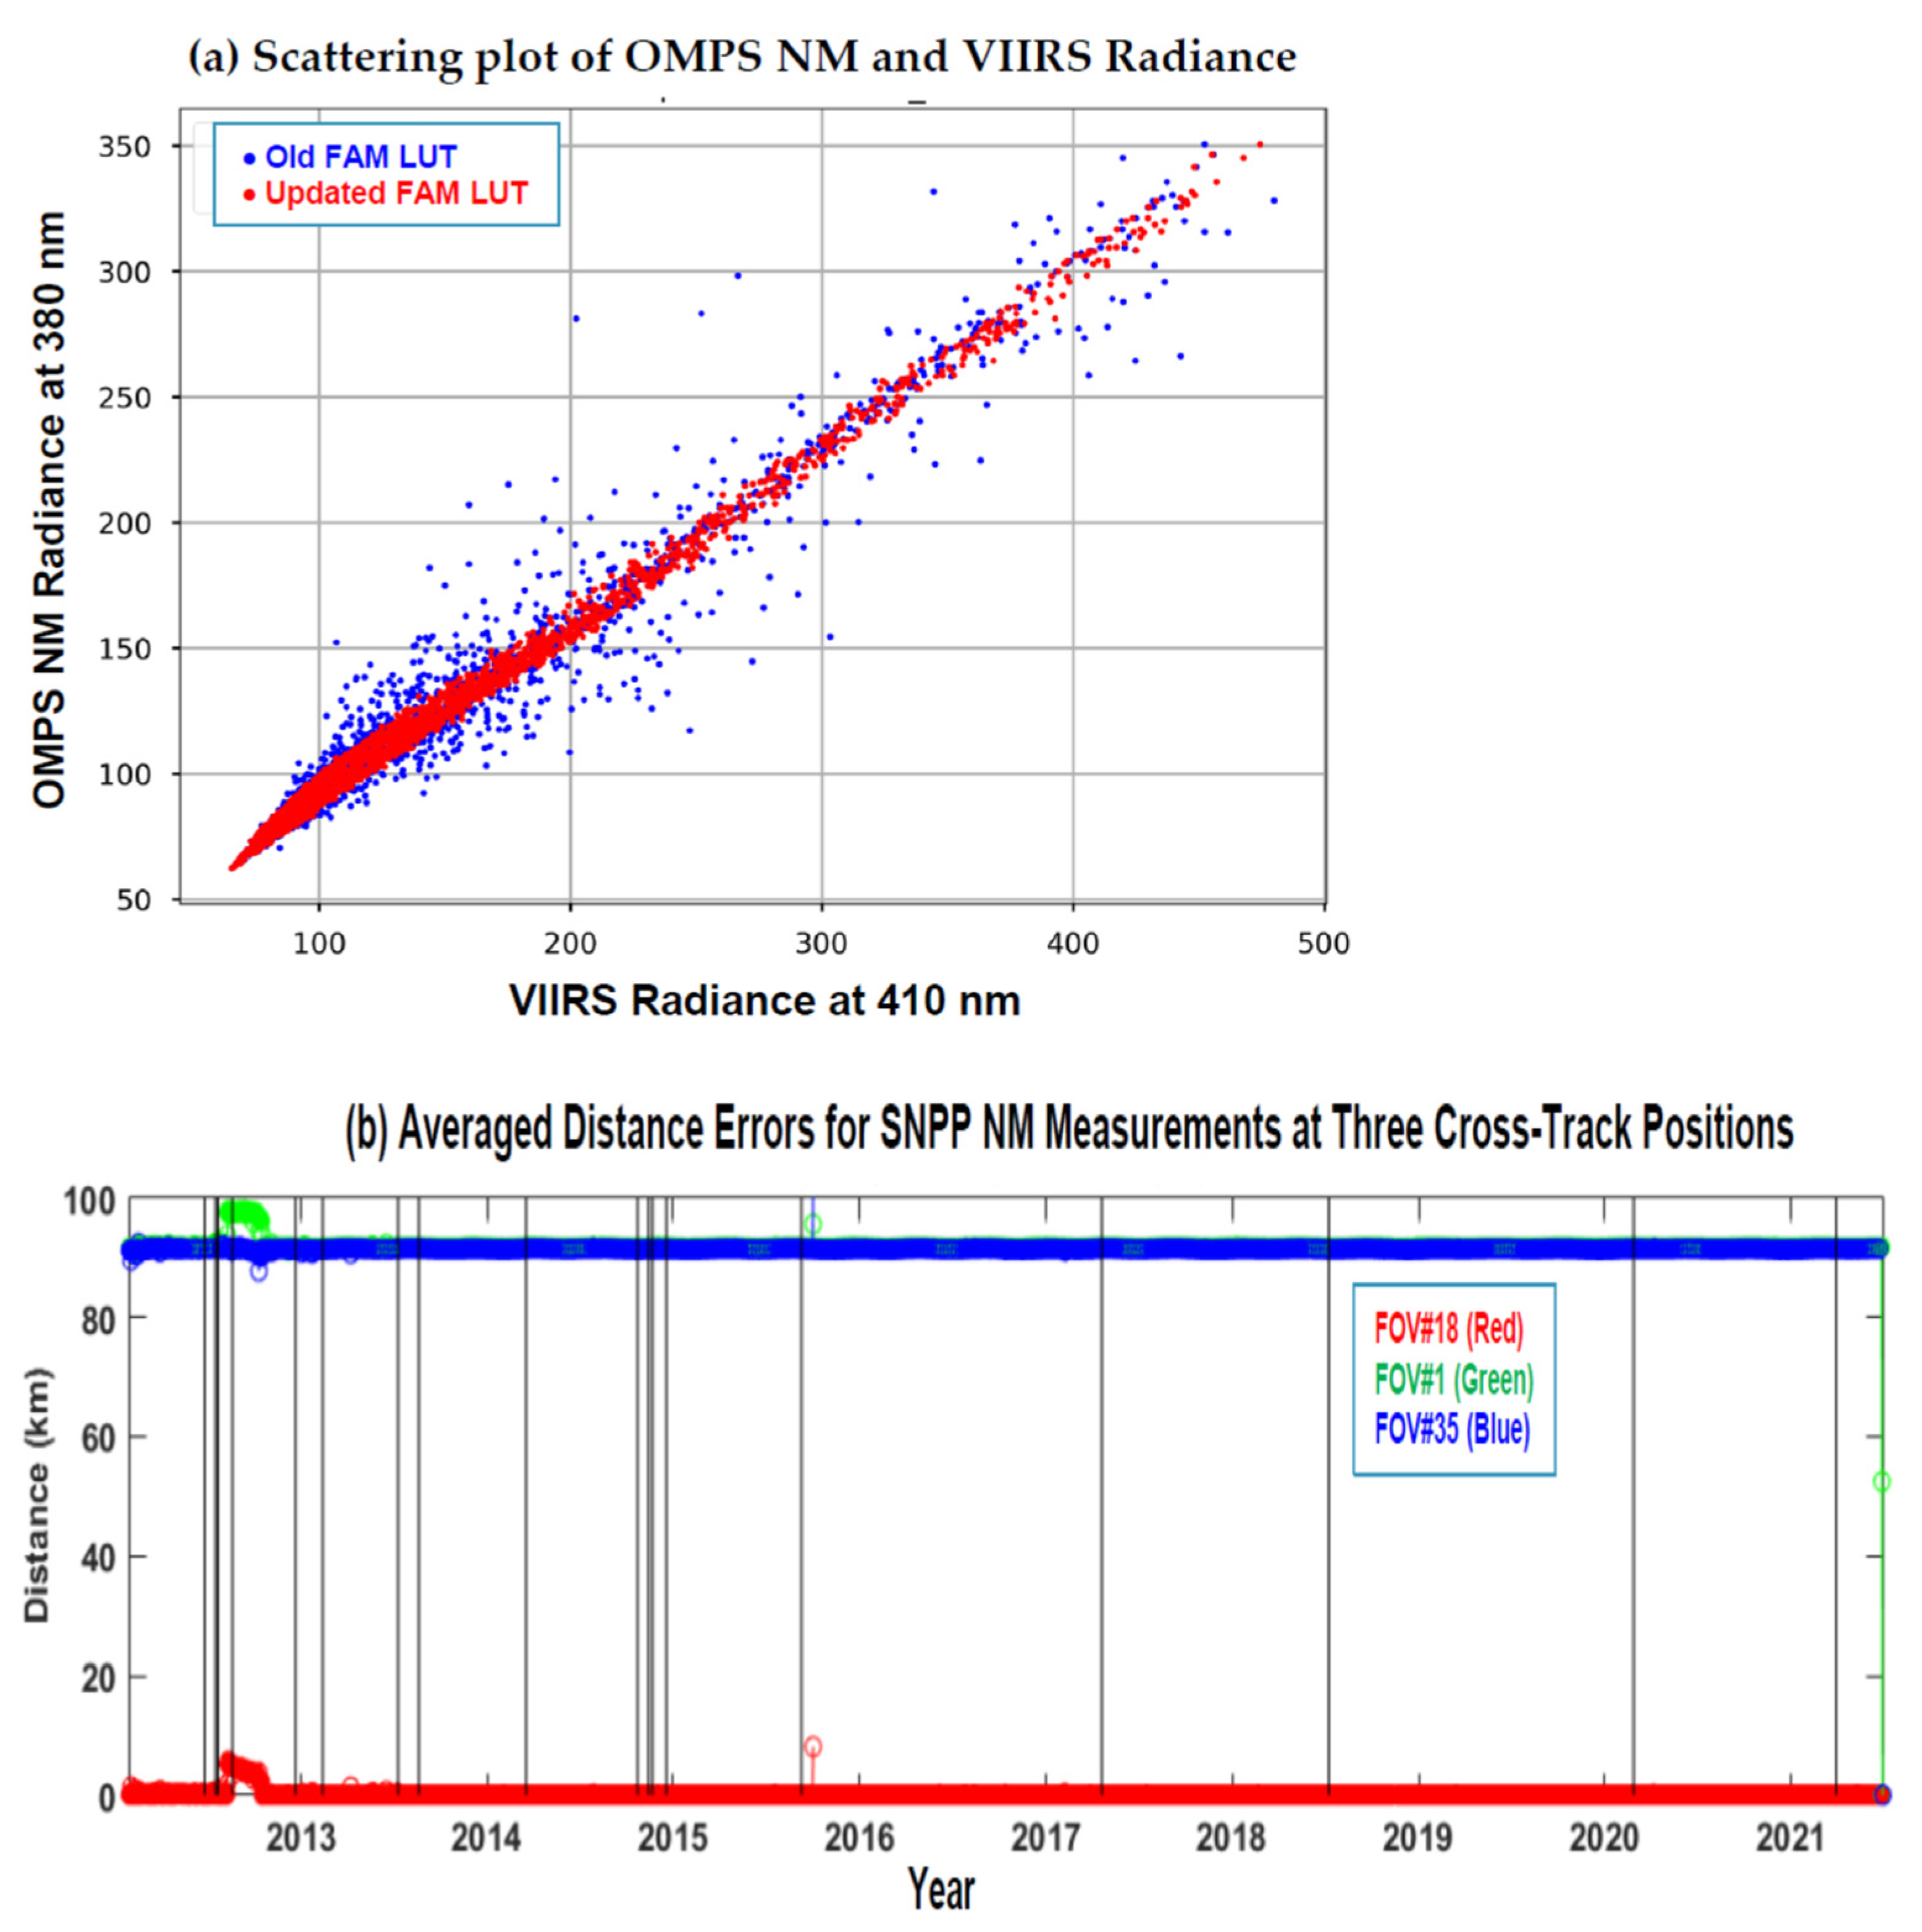
Figure 5a is a scattering plot of OMPS radiance at 380 nm and VIIRS radiance at 410 nm with the two versions of the FAM LUTs. The correction coefficient between the VIIRS and OMPS radiance data is 0.997 and 0.782 by using the updated and original LUT, respectively. Hence, the updated LUT results in a high correlation between the two sensors of radiance. Additionally, Figure 5b displays the time series of the averaged distance errors at three cross-track positions (leftmost, nadir, and rightmost) over the area with latitudes greater than 60° to assess the impact of the updated FAM LUT. Here, the distance error is defined to be the averaged distance for the pixels with the same cross-track position per scan between the operational and the reprocessed data sets over the regions above 60° N.
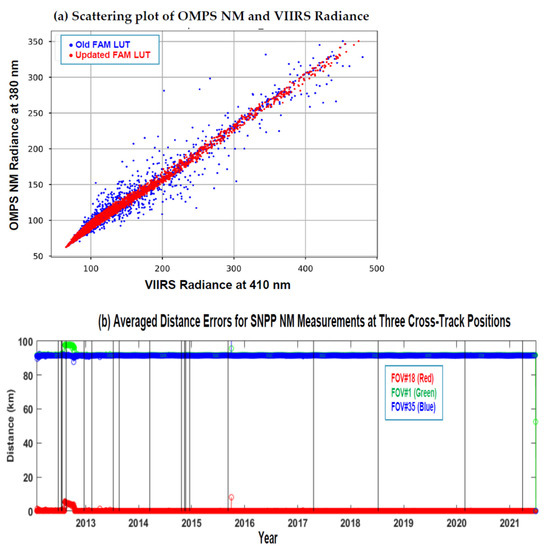
Figure 5.
(a) Scattering plot of OMPS radiance at 380 nm and VIIRS radiance at 410 nm with (red dots)/without (blue dots) the update of the FAM LUT. (b) Time series of averaged distance errors for SNPP OMP NM measurements at three cross-track positions over the area with latitudes greater than 60°: leftmost pixels with FOV #1; nadir pixels with FOV #18; rightmost pixels with FOV #35. The distance error represents the distance difference between the OMPS data at the same cross-track position with the updated and old versions of the FAM LUT.
The nadir pixels constantly exhibit a high accuracy (close to zero distance difference) with an exception. Notice that the relatively large distance errors happened even for the nadir pixel around October 2012. This issue was caused by using an inaccurate interpolated Two-Line-Element (TLE) to calculate the SNPP OMPS NM ephemeris when the information of the spacecraft diary was not available. In fact, this TLE issue also affected the leftmost pixels (see green color in the figure). However, this impact was not present in the rightmost pixels (blue color). A possible reason is that the interpolation error due to this TLE issue was small at some specific positions, such as the rightmost pixels. A separate analysis is needed to understand the root cause of this feature. This issue was fixed by Raytheon later via a modified interpolation approach.
Contrary to the nadir pixels, the far-off nadir pixels (leftmost and rightmost) can have a distance error as large as 90 km. Similar analyses are applied to other regions such as the tropic area and high latitudes over the Southern Hemisphere. Similar distance errors around 90 km are present (the figures are omitted). Importantly, the distance errors for the off-nadir pixels on 28 June 2021 are rapidly decreased to 0 km because the updated LUT has been implemented into the operational processing since that day. The impact on the radiance values is dependent upon the spatial distribution of radiance and the position of the pixel at the cross-track direction (see next section for a detailed analysis).
4. Lifetime Quality Stability Assessment on the Operational and Reprocessed Data Sets against Reprocessed Data Sets
Each of the major improvements and corresponding impacts on the OMPS SDR data quality have been individually analyzed above. The quality of the data is actually affected by their composite impacts of the associated calibration tables. In the following subsections, we first produce the long-term time series of the daily averaged radiance and N-values among the three data sets over the tropic areas (20°N~20°S) for the SNPP OMPS NP and NM, respectively. The tropic region is selected because the radiance variability is relatively less affected by variation of the ozone in comparison with that in polar regions. The operational and data sets cover the period until 30 June 2021, but the data set only covers the period until 8 March 2017 for the NP and until 30 September 2018 for the NM. For the NM, we also compare the data at two cross-track positions between the operational and data sets in order to analyze the impact of the geolocation error correction calibration table. This comparison focuses on a small area (10° × 10°) centered at the San Francisco International airport. Furthermore, the data sets are used as the reference to assess the overall impacts of all improvements on the LT stability of the operational and reprocessed data sets prior to 28 June 2021. This is reasonable since the data sets employ-consistent calibration algorithms and tables through the whole processing, and thus have LT quality-consistent data records. After the assessment for each of the NP and NM, we further compare the daily averaged normalized radiance and N-value spectra over a small area per data set and the spectrum difference of the operational and data sets against the data set by covering the NP wavelengths through the NM wavelengths.
In the following analysis, ‘daily averaged’ is frequently omitted when we mention radiance, N-value, and normalized radiance to simplify our descriptions. To evaluate the impact of the calibration tables used in the NM and NP, we define the relative deviation and absolute deviation of each of the operational and data against the data, as given below, by using the averaged radiance as an example.
In the equations, denotes the daily averaged radiance over selected regions, where subscripts of ‘’, ‘′, and indicate the data source. ‘Absolute’ in (7) is used to discriminate from ‘relative’ in (6), but it is frequently omitted in the following analysis. The definition is applicable for the N-value or normalized radiance. Differences or discrepancies are exchanged with the deviation too.
4.1. OMPS NP Radiance and N-Value Time Series
We have comprehensively analyzed the time series of the daily averaged radiance and N-value over the tropical area for 147 NP channels among the three data sources (also refer to [37]). The reprocessed SNPP OMPS NP SDR data show more quality-consistent mission-long data sets at all channels than the operational and reprocessed data sets. This is understandable since all of the validated and newly-improved calibration tables are implemented throughout the whole reprocessing. The quality inconsistencies in the operational NP data set primarily contribute to the lack of both the validated calibration LUTs prior to the final review and the newly updated LUTs after the review. The inconsistencies in the data set are caused due to using a static solar LUT. Examples are given below by selecting three channels of 253.51 nm, 292.41 nm, and 301.85 nm.
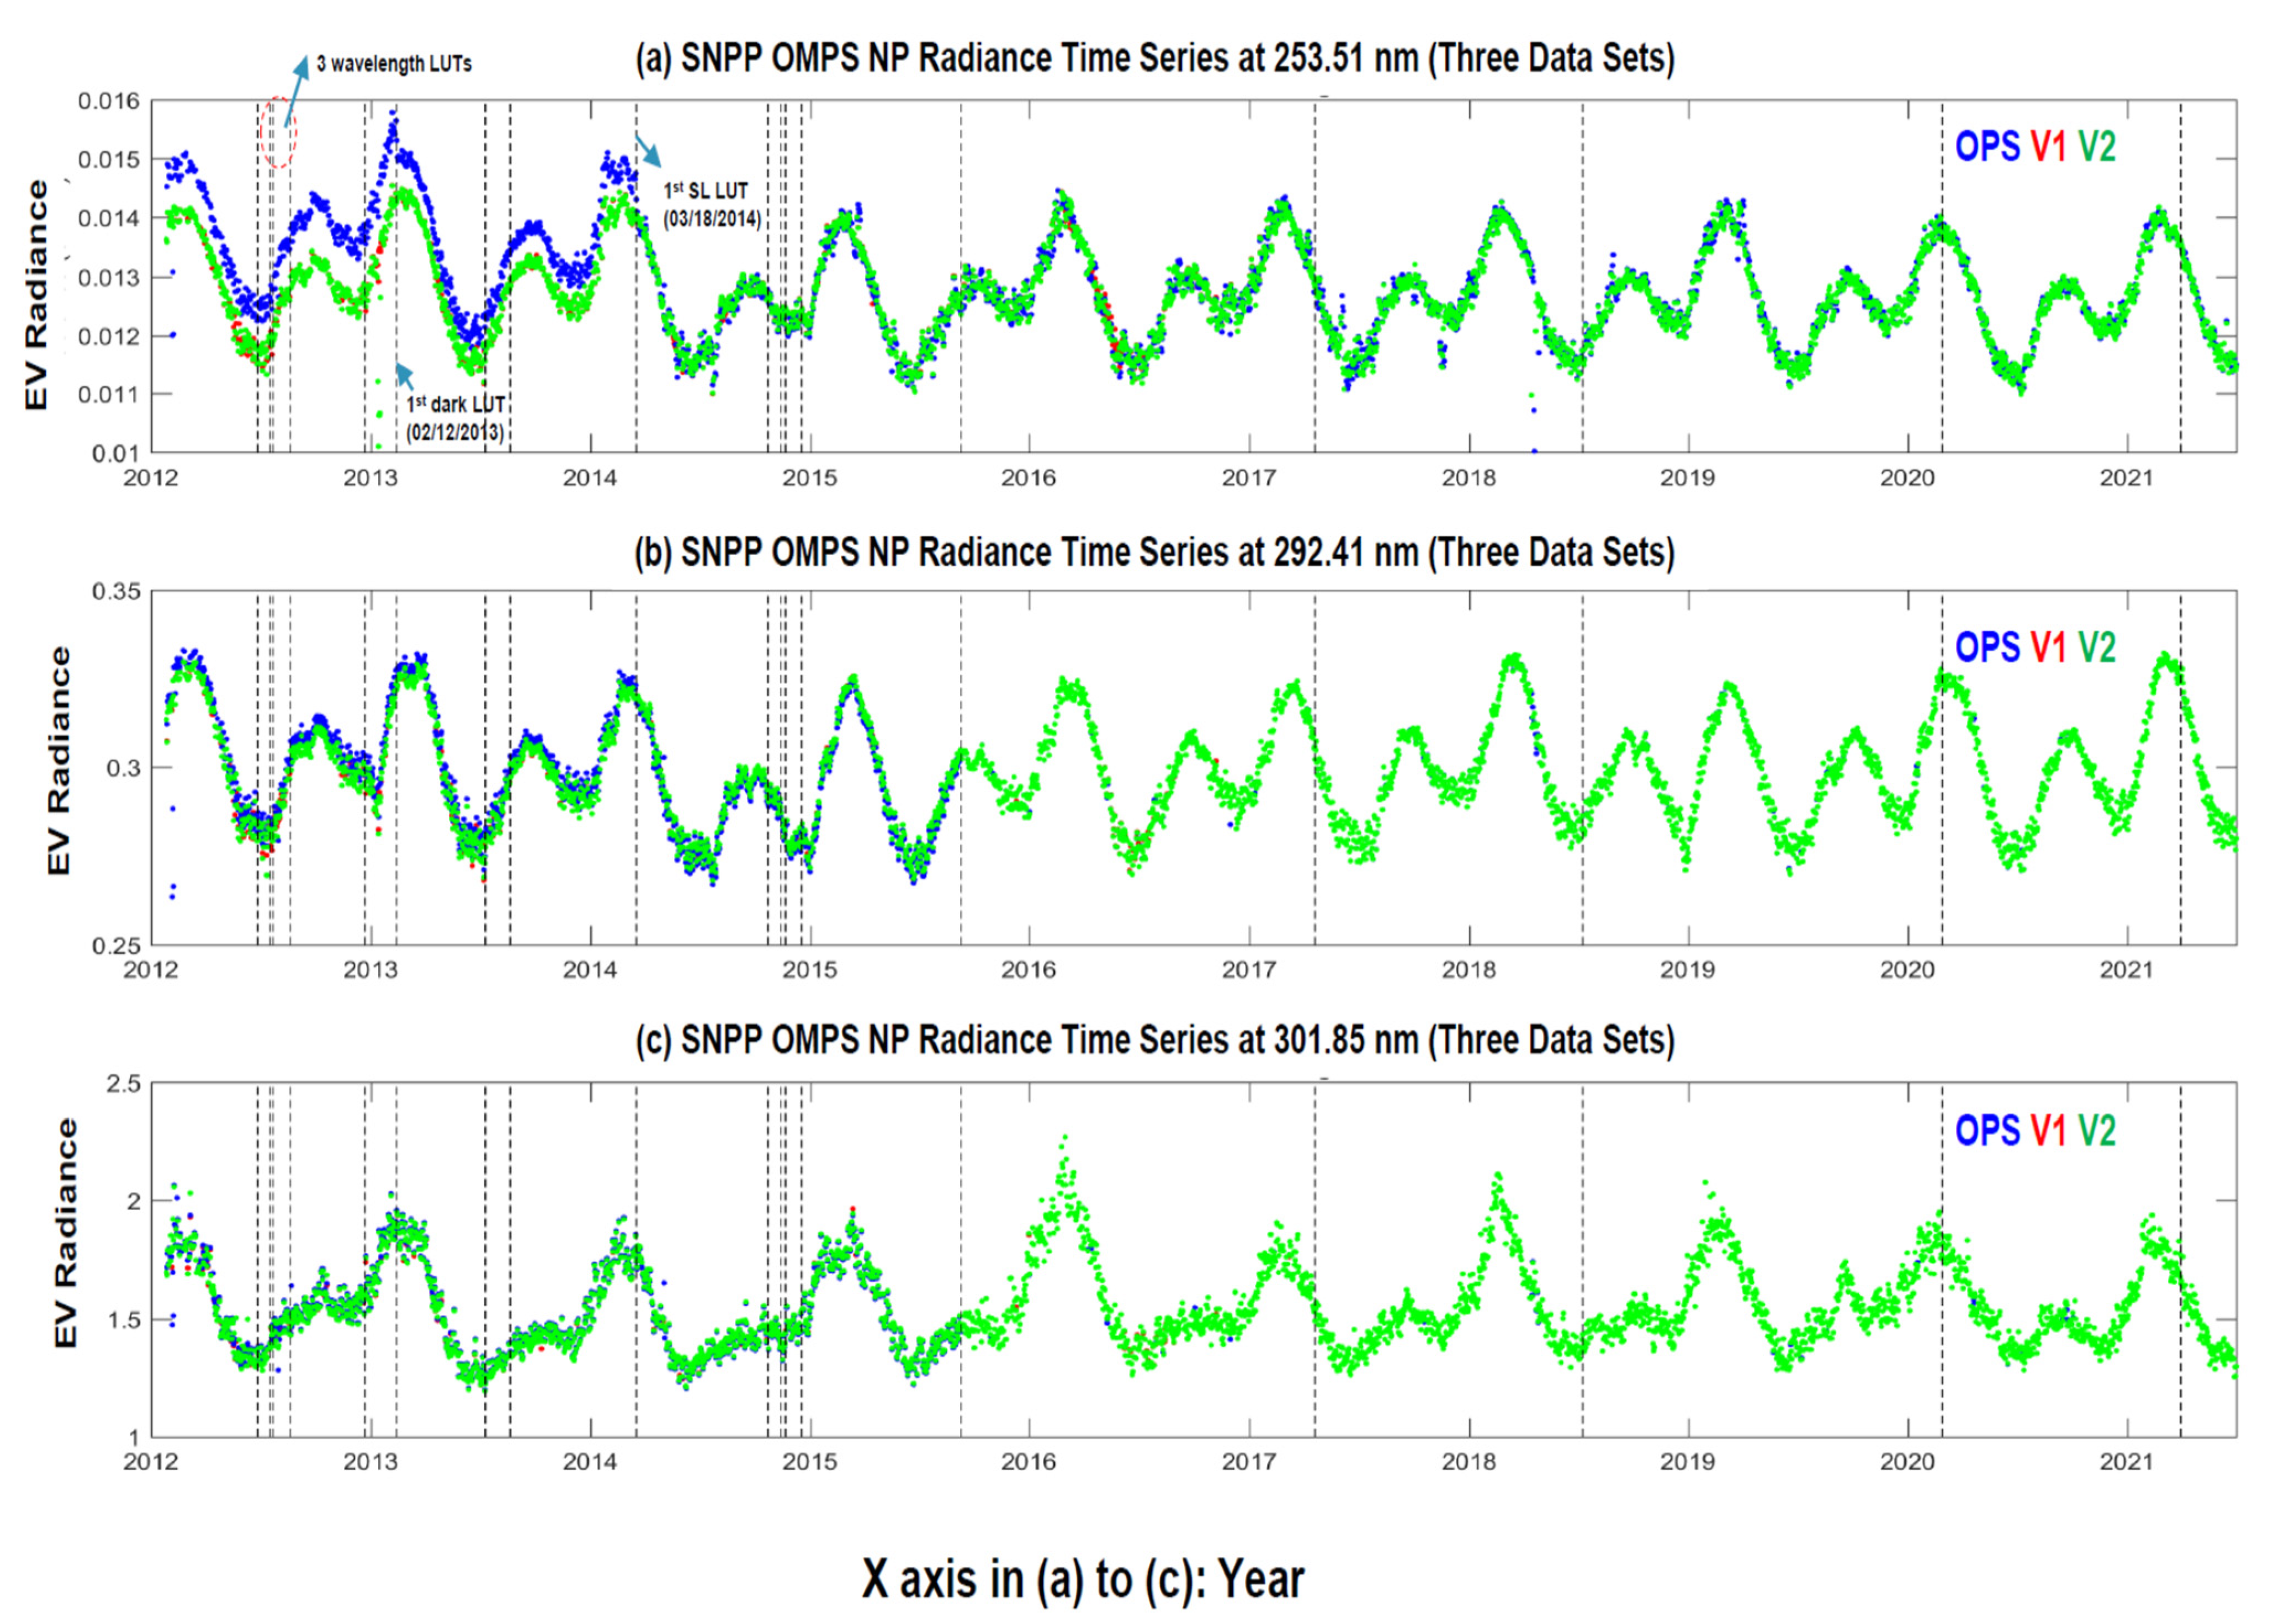
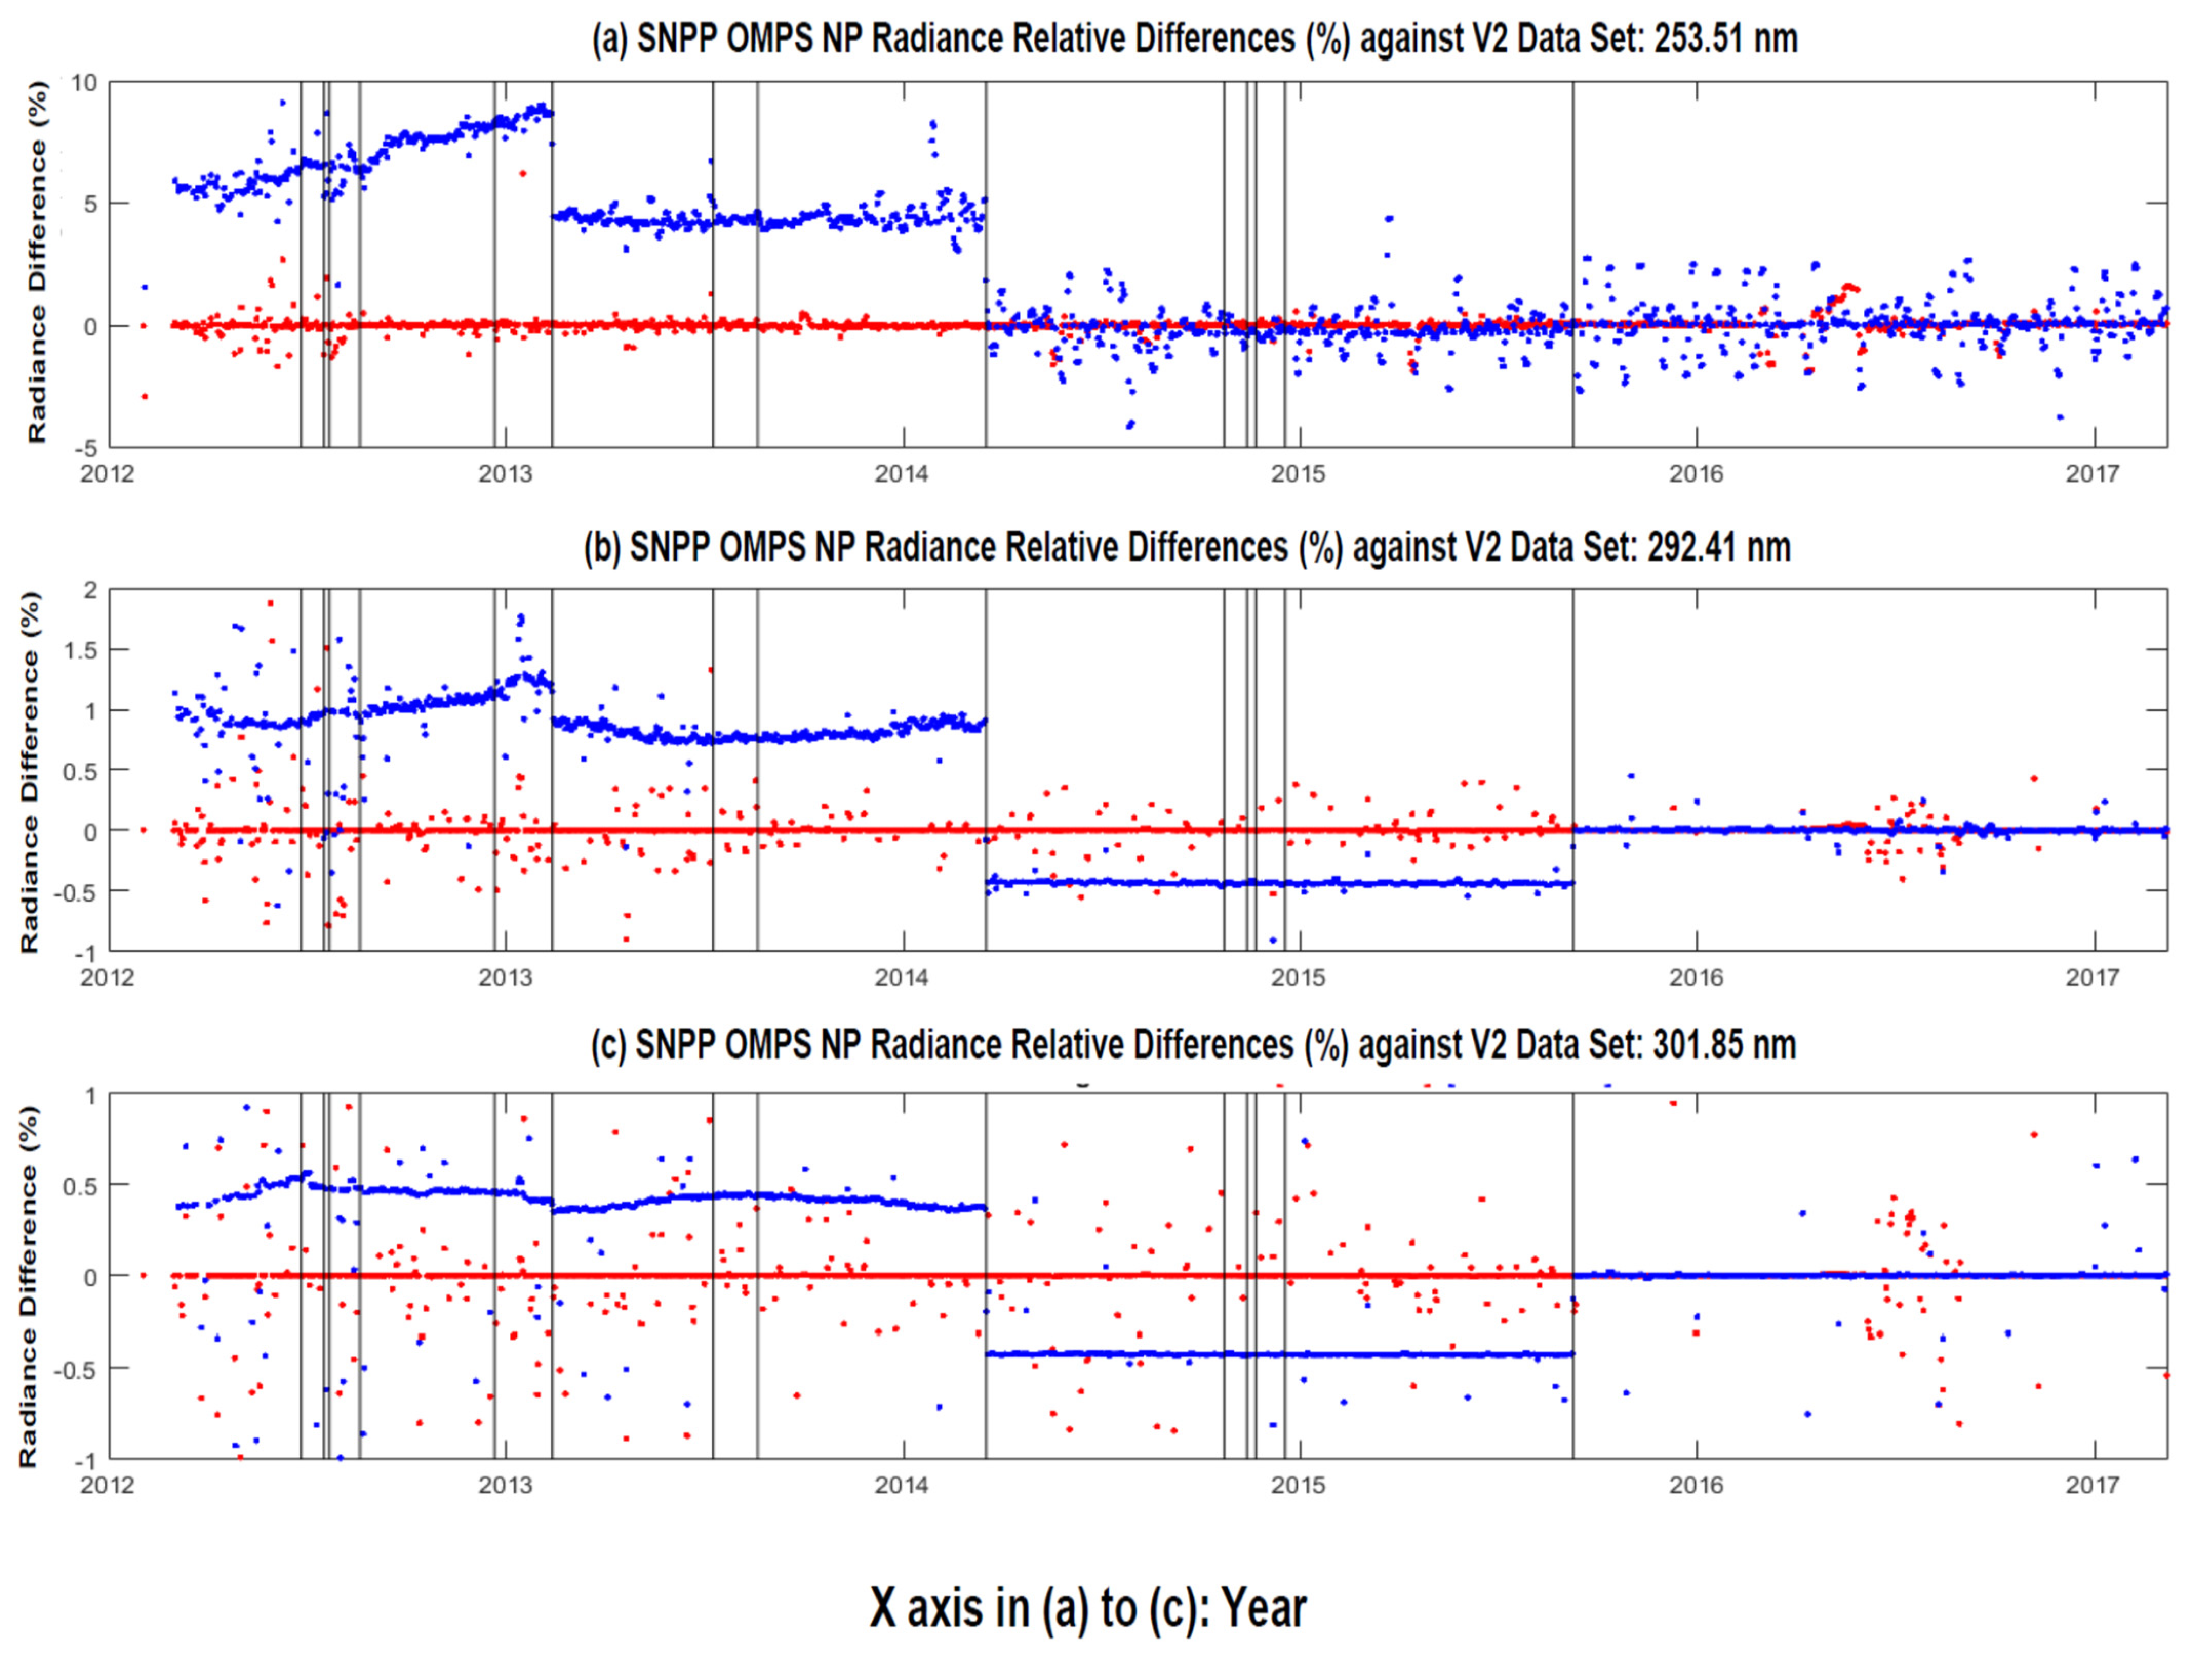
Figure 6 shows the time series of long-term SNPP OMPS NP radiance at the three wavelengths among the three data sets, while Figure 7 provides their radiance relative difference (%) using (6). A series of straight dash lines are added in the figure to illustrate the implementation time of the calibration table updates in the operational data procession until 30 June 2021. The accurate dates of the implementations are given in Table A1 of Appendix A. A few major discoveries are made below based on the results in the figure.
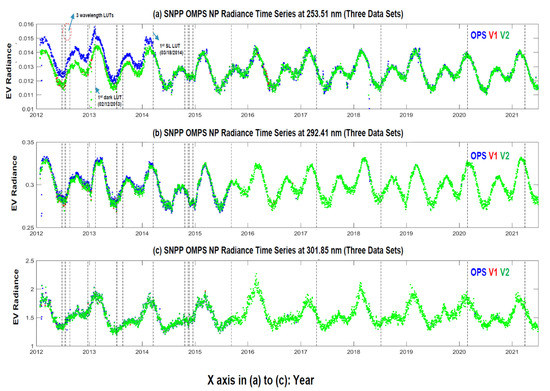
Figure 6.
Time series of long–term SNPP OMPS NP averaged radiance at three wavelengths (253.51 nm, 292.41 nm, and 301.85 nm) over the tropic areas (20°N~20°S) among three data sets. Here, the three data sets consist of operational (OPS) (blue color), the reprocessed (red color), and reprocessed (green color). The data cover the period from 25 January 2012 through 30 June 2021, except for the v01 data set which covers the period until 8 March 2017; a series of straight dash lines in the figure represent the implementation date with respect to a specific calibration table. In (a), the updates of three types of the LUTs are highlighted: 3 wavelength LUTs in middle 2012, 1st dark LUT in February 2012, and 1st SL LUT in March 2014, referring to Appendix A; (a) 253.51 nm, (b) 292.41 nm, (c) 301.85 nm.
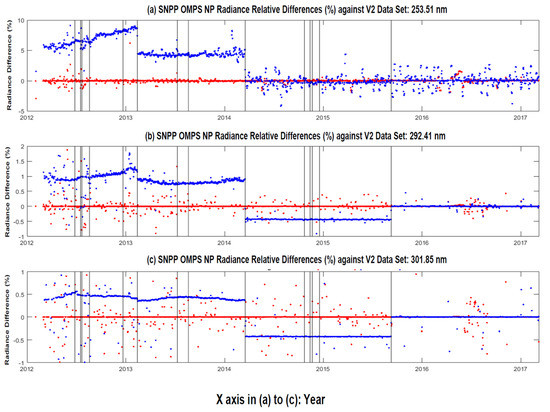
Figure 7.
Time series of long–term SNPP OMPS NP averaged relative radiance differences at three wavelengths (253.51 nm, 292.41 nm, and 301.85 nm) over the tropic areas (20°N~20°S) for the operational and reprocessed data sets against the data set by using (6); (a) 253.51 nm, (b) 292.41 nm, (c) 301.85 nm.
Firstly, the averaged radiance at the three channels in the . data set exhibits a consistent variation from time to time during the entire processing period. This is understandable because the consistent calibration tables effectively remove unexpected jumps that occur in the operational radiance time series, especially prior to the final review. In addition, the . data set shows a relatively similar annual cycle pattern with a peak around the Vernal Equinox from year to year. In reality, the Earth-view radiance at the ultraviolet (UV) band is affected by solar UV irradiance through SZA variations (one largest impacting factor), atmospheric trace gases (ozone, SO2, NO2, and others), clouds, surface reflectivity, and other atmospheric and surface features. The mean radiance in the figure is computed simply using all data over areas from 20°N to 20°S without the cloud screening and other constraints. Hence, a separate study is needed to further categorize the data (e.g., under clear/cloudy conditions with a given solar zenith angle range) in order to better explain the annual feature and peak position.
Secondly, the averaged radiance at the three channels in the data set shows a feature visually close to that in the data set, although actual differences still remain. The two reprocessing use the same calibration tables, except for the solar LUTs. The applied a static solar LUT (a constant spectral wavelength shift) to each day of the data processing, while the used a series of dynamic (bi-weekly) solar LUTs to capture changes of the wavelength shift with time. As analyzed in Section 3.1 above, the differences of the wavelength shift between the dynamic tables and the static table are variable within ±0.015 nm. Some of them can exceed the OMPS NP wavelength shift requirement of 0.01 nm. According to our estimation, the relative radiance difference (%) between the and reprocessing are typically in the range of −2.5%~+2.0%, −0.8%~+0.8%, and −0.5%~0.5% at the three wavelengths from 253.51 through 301.85 nm (see Figure 7). The high relative difference at 253.51 nm stems from a very small radiance (see Figure 7a) that is two or three orders smaller than the values at the wavelengths around and above 300 nm (see Figure 7c). In fact, the absolute deviations normally increase with the increase of wavelengths (with some modulations) (see Section 4.3 below for OMPS spectrum comparisons). Therefore, the use of dynamic solar LUTs is still very necessary to ensure the quality of SNPP OMPS NP radiance data within the specification.
Thirdly, the averaged radiance in the operational data set exhibits rapid jumps in the time series that are associated with updates of a few calibration tables. In particular, resultant radiance changes from the updates of the tables are visually found at 253.41 nm prior to the final review. In view of Figure 6a, the implementation of the SL correction table on 18 March 2014 resulted in a large radiance reduction because of reasonably removing the SL signal from original radiometric counts [see (5)]. In addition, the use of the first dark current table on 12 February 2013 produced an obvious radiance reduction because the radiance count calibration in (5) prior to this date did not include the correction of dark current. Due to the overall impact of all inconsistent calibration tables, the relative radiance differences (%) at the 253.41 nm between the operational and data sets are approximately in the range of −4.5% ~ +8.0% (see Figure 7a). Regarding other wavelengths, a non-trivial relative impact is also observed: the relative radiance differences (%) at 292.41 nm and 301.85 nm are in the range of −1.0%~+1.5% and −0.5%~+1.0%, respectively [see Figure 7b,c]. After the final review, the impact of the calibration table updates on the data quality consistency is relatively small for the three wavelengths. It is estimated that the relative radiance discrepancies (%) between the operational and new reprocessing are typically around ±0.5%, ±0.25%, and ±0.1% at 253.51, 292.41, and 301.85 nm, respectively. These differences are caused by the solar LUTs between the operational (a prediction from two weeks ago) and reprocessing (estimate from the current two weeks). According to the sensitivity analysis using the V-CRTM in Figure 3c, the relative normalized radiance differences are within ±0.5% due to an error of 0.01 nm that is a spectral wavelength registration requirement. For the same wavelength, a slightly larger relative radiance difference exists than the normalized radiance. In other words, the radiance errors up to ±0.5% still meet the OMPS NP radiance calibration accuracy. Therefore, the predictions of the OMPS NP sensor wavelength shifts are reasonable in representing the wavelength shift features in the subsequent two weeks.
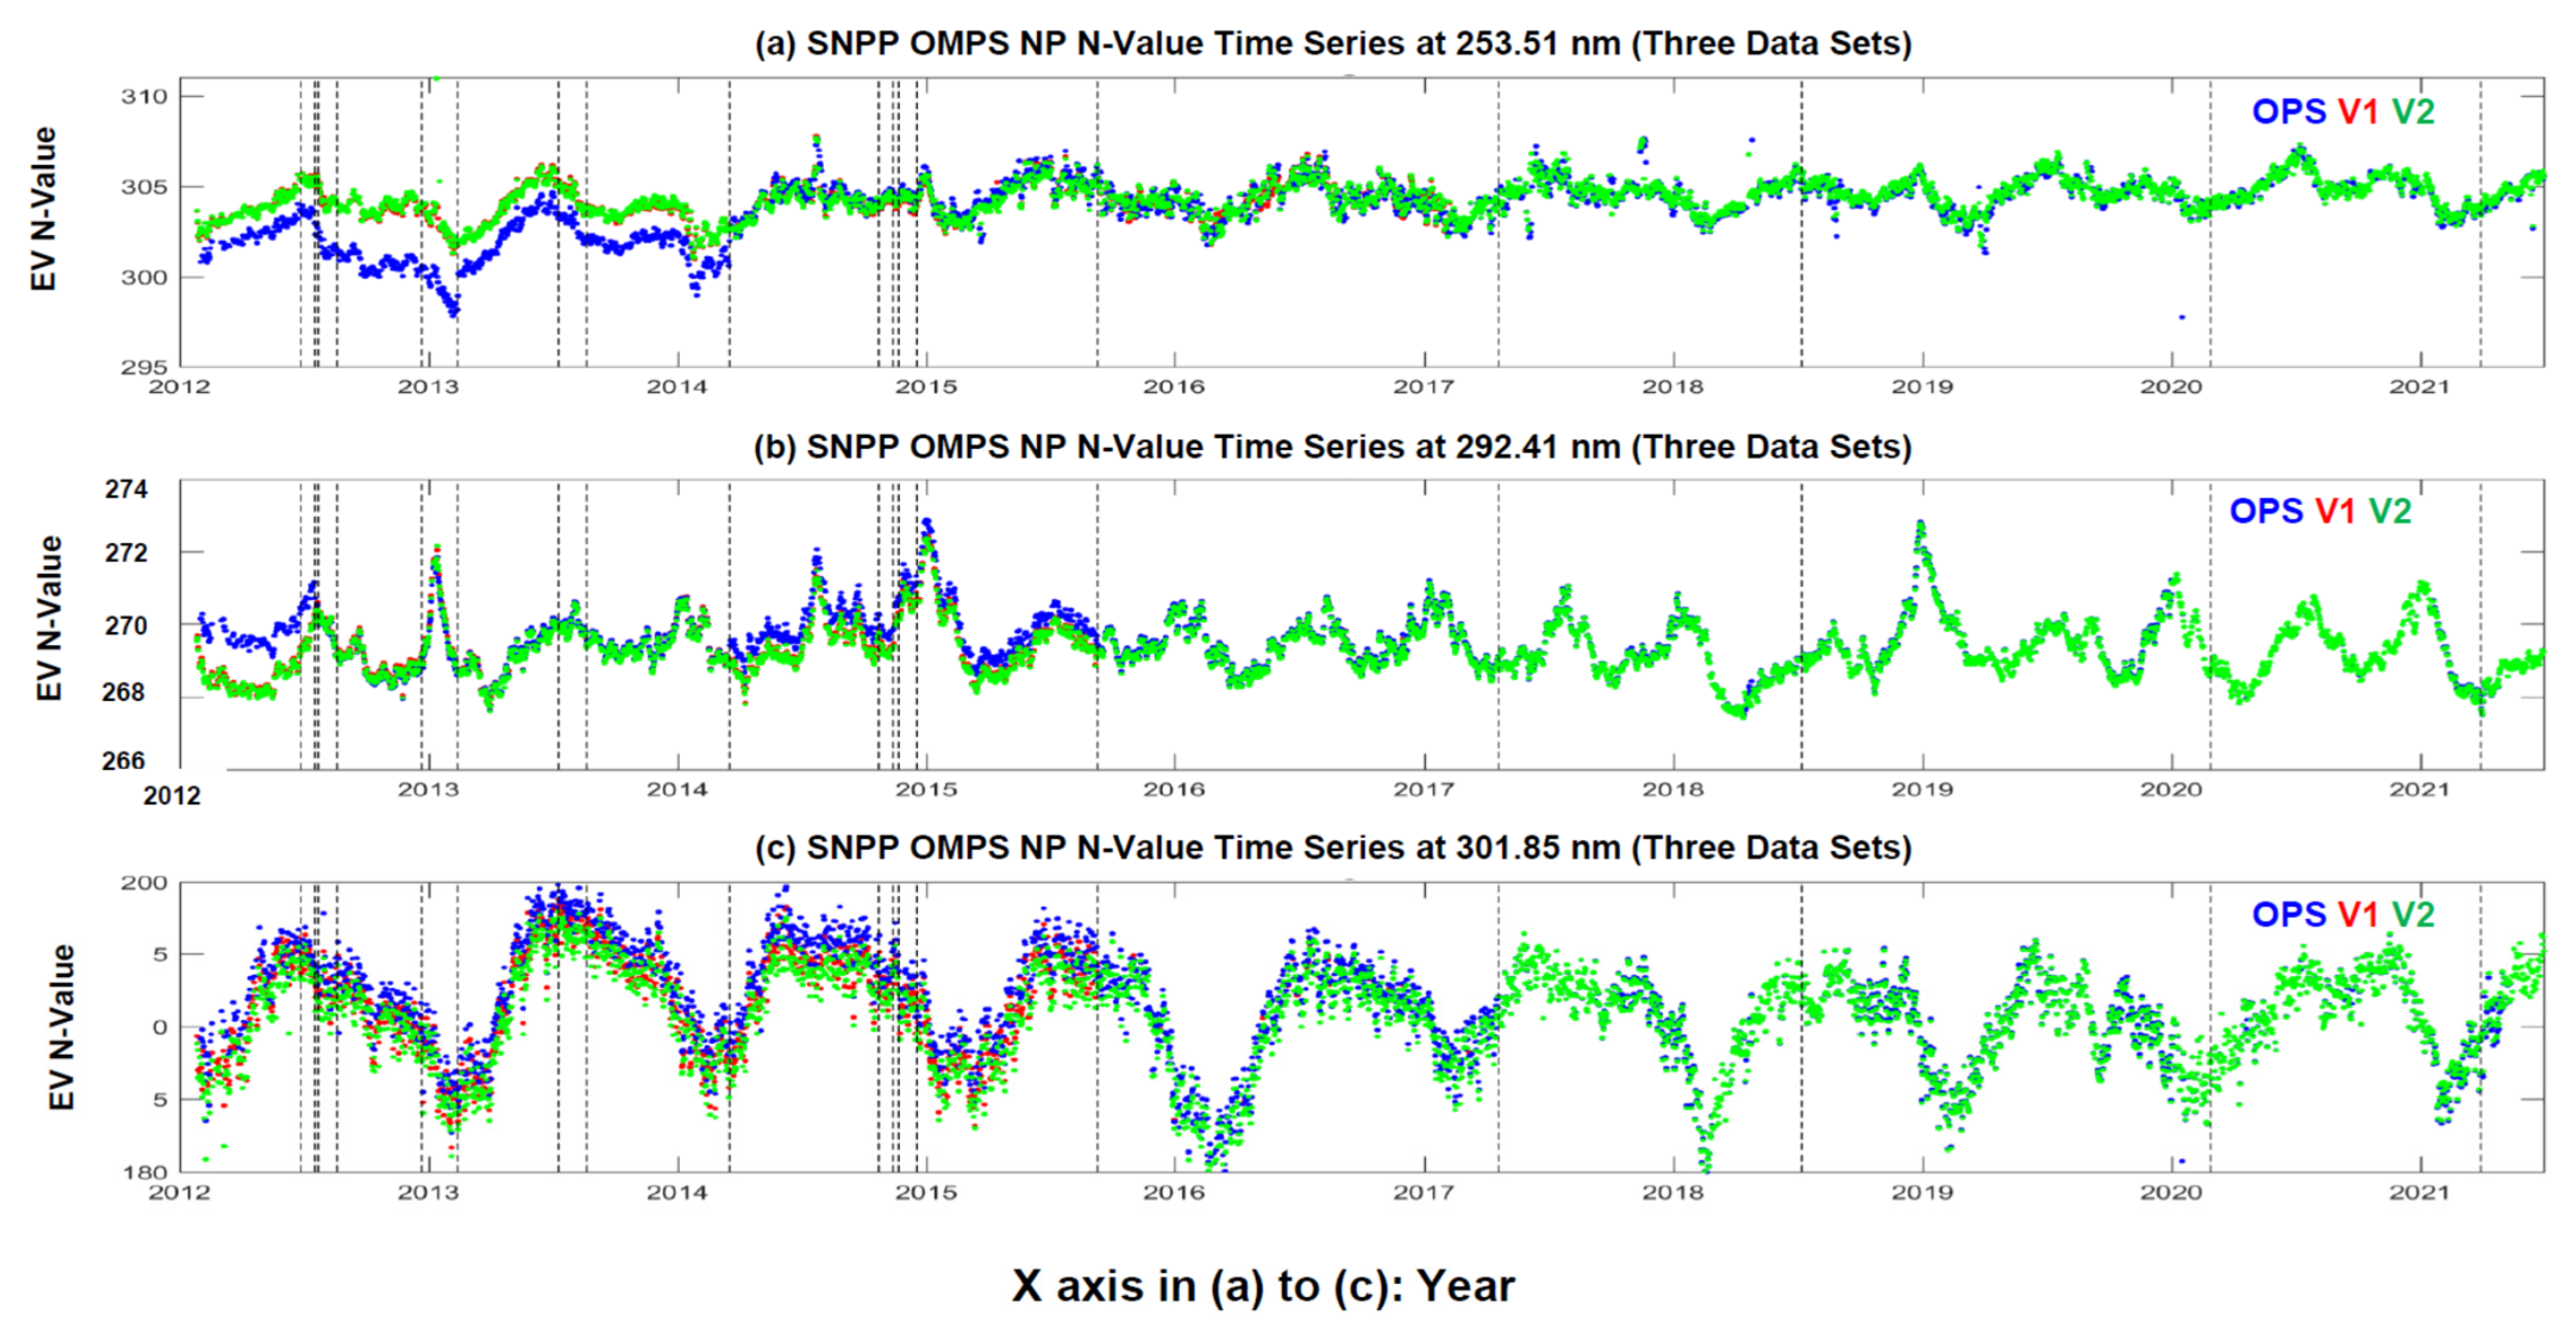
In addition to the radiance, the N-value is an important quantity related to the OMPS SDR data. Figure 8 shows the time series of the daily averaged N-value over the tropical area at the three channels by using the three data sets. Similar conclusions to the radiance are found: The N-value at the three channels in the data set exhibits a consistent variation from time to time during the entire processing period, which contributes to effectively removing unexpected jumps/drops due to inconsistent calibration tables in the operational processing. The data set also shows a similar annual cycle from year to year, although the annual maximum is variable with the year. For example, the annual maximum of N-values at 292.41 nm in 2013, 2015, and 2019 are higher than those in other years. The ozone is not constant or even repeating from year to year. For example, there are oscillations in the ozone on the time scale of the quasi-biennial oscillation (QBO). Thus, it is not clear that there is anything to explain. A detailed analysis in a future study is desirable to understand the root causes to the annual feature in the N-value. Contrary to the data set, the operational N-value time series shows obvious drops/jumps due to inconsistent calibration tables as we analyzed for the radiance above. In particular, large discrepancies for 253.51 nm occurred from 2012 to early 2014 because the calibration table for correcting stray light contamination was not implemented until 18 March 2014 (see Table A1 in Appendix A). This is because the radiance or radiometric count without the stray light correction are higher than that with the correction [see (5)]. An over-estimated radiance results in an under-estimated N-value. The big impact of the stray light correction is at a shorter wavelength. In addition, the wavelength registration error also contributed to this variation. The long-term performance of the N-value is visually close to that of the data with certain differences. Specifically, the relative N-value discrepancies (%) between the operational and data sets are typically −1.5%~+0.5%, −0.3%~+0.5%, and 0.0%~+1.5% at 253.51, 292.41, and 301.85 nm, respectively; the relative N-value discrepancies (%) between the and data sets are primarily around −0.1~+0.1%, −0.1~+0.1%, and −0.5~+0.5% at 253.51, 292.41, and 301.85 nm, respectively, (the figures are omitted).
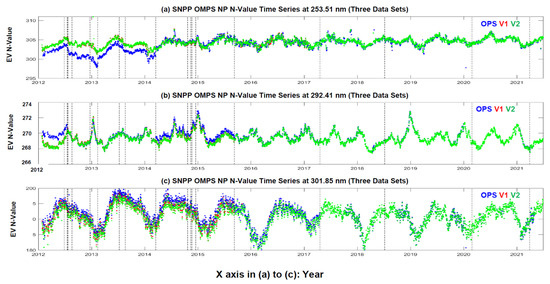
Figure 8.
Same as Figure 6, except for the averaged N-value; (a) 253.51 nm, (b) 292.41 nm, (c) 301.85 nm.
Therefore, the new reprocessing produces a calibration accuracy-consistent mission-long SNPP OMPS NP SDR data set by adding the operational processing after June 2021 that uses the same calibration tables as the reprocessing. Compared with the data set, the operational data set exhibits several jumps/drops in the time series of the daily averaged radiance/N-value, with the highest relative deviation (%) at short wavelengths. The data set shows a better performance than the operational data set, but it still has certain deviations in the radiance/N-value against the data set due to the use of a fixed solar LUT for the whole processing. Those discrepancies address the significance of using calibration accuracy-consistent calibration tables in the whole OMPS NP SDR data processing.
4.2. OMPS NM Radiance and N-Value Time Series
We have analyzed the time series of the averaged radiance data for the nadir pixels and off-nadir pixels, respectively, at the 196 channels among the three data sources. Similarly, it is found that the reprocessed SNPP OMPS NM SDR data show more quality-consistent data sets at all channels than the operational and reprocessed data sets. This reliability is attributed to a fact that all of the validated and newly improved calibration tables are implemented throughout the whole reprocessing. The quality-inconsistencies in the operational data set are due to the lack of both the validated calibration LUTs prior to the final review in 2015 and the latest updated LUTs in the past couple of years. The inconsistencies in the data set are caused by the lack of the latest improved LUTs. Examples are given below by selecting three channels of 301.96 nm, 317.497 nm, and 339.622 nm that are used in the current ozone product retrieval system.
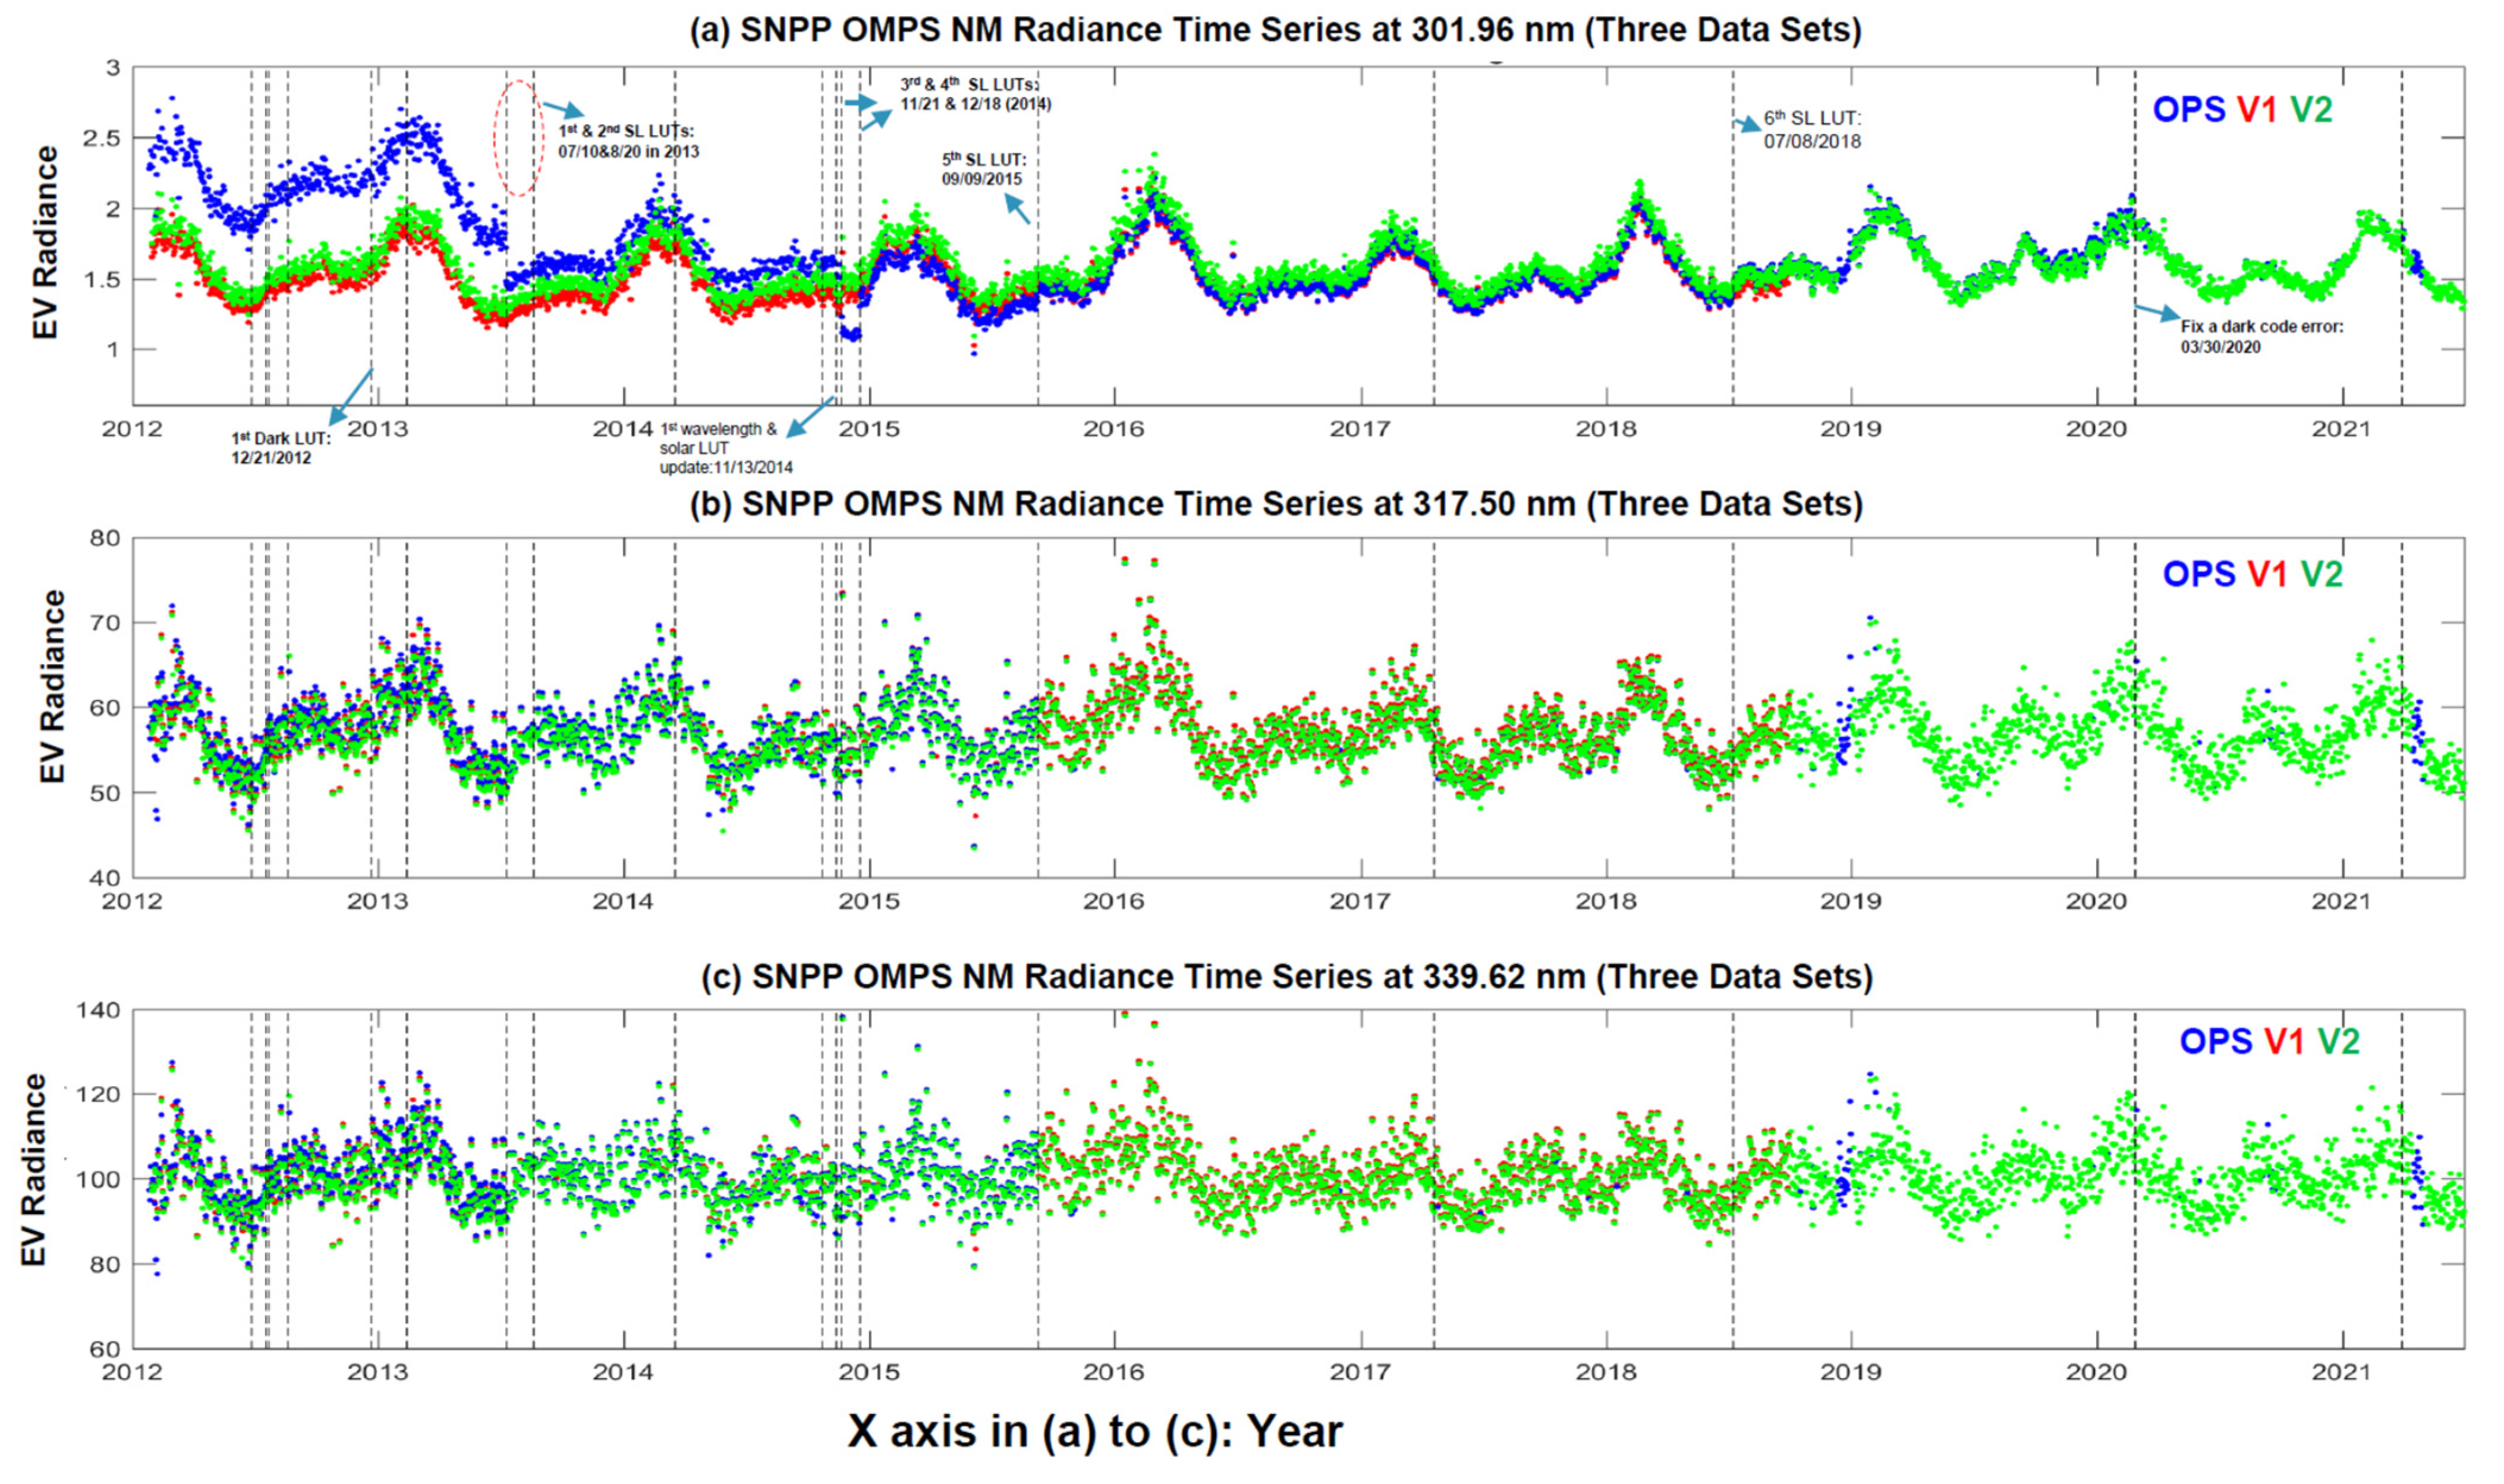
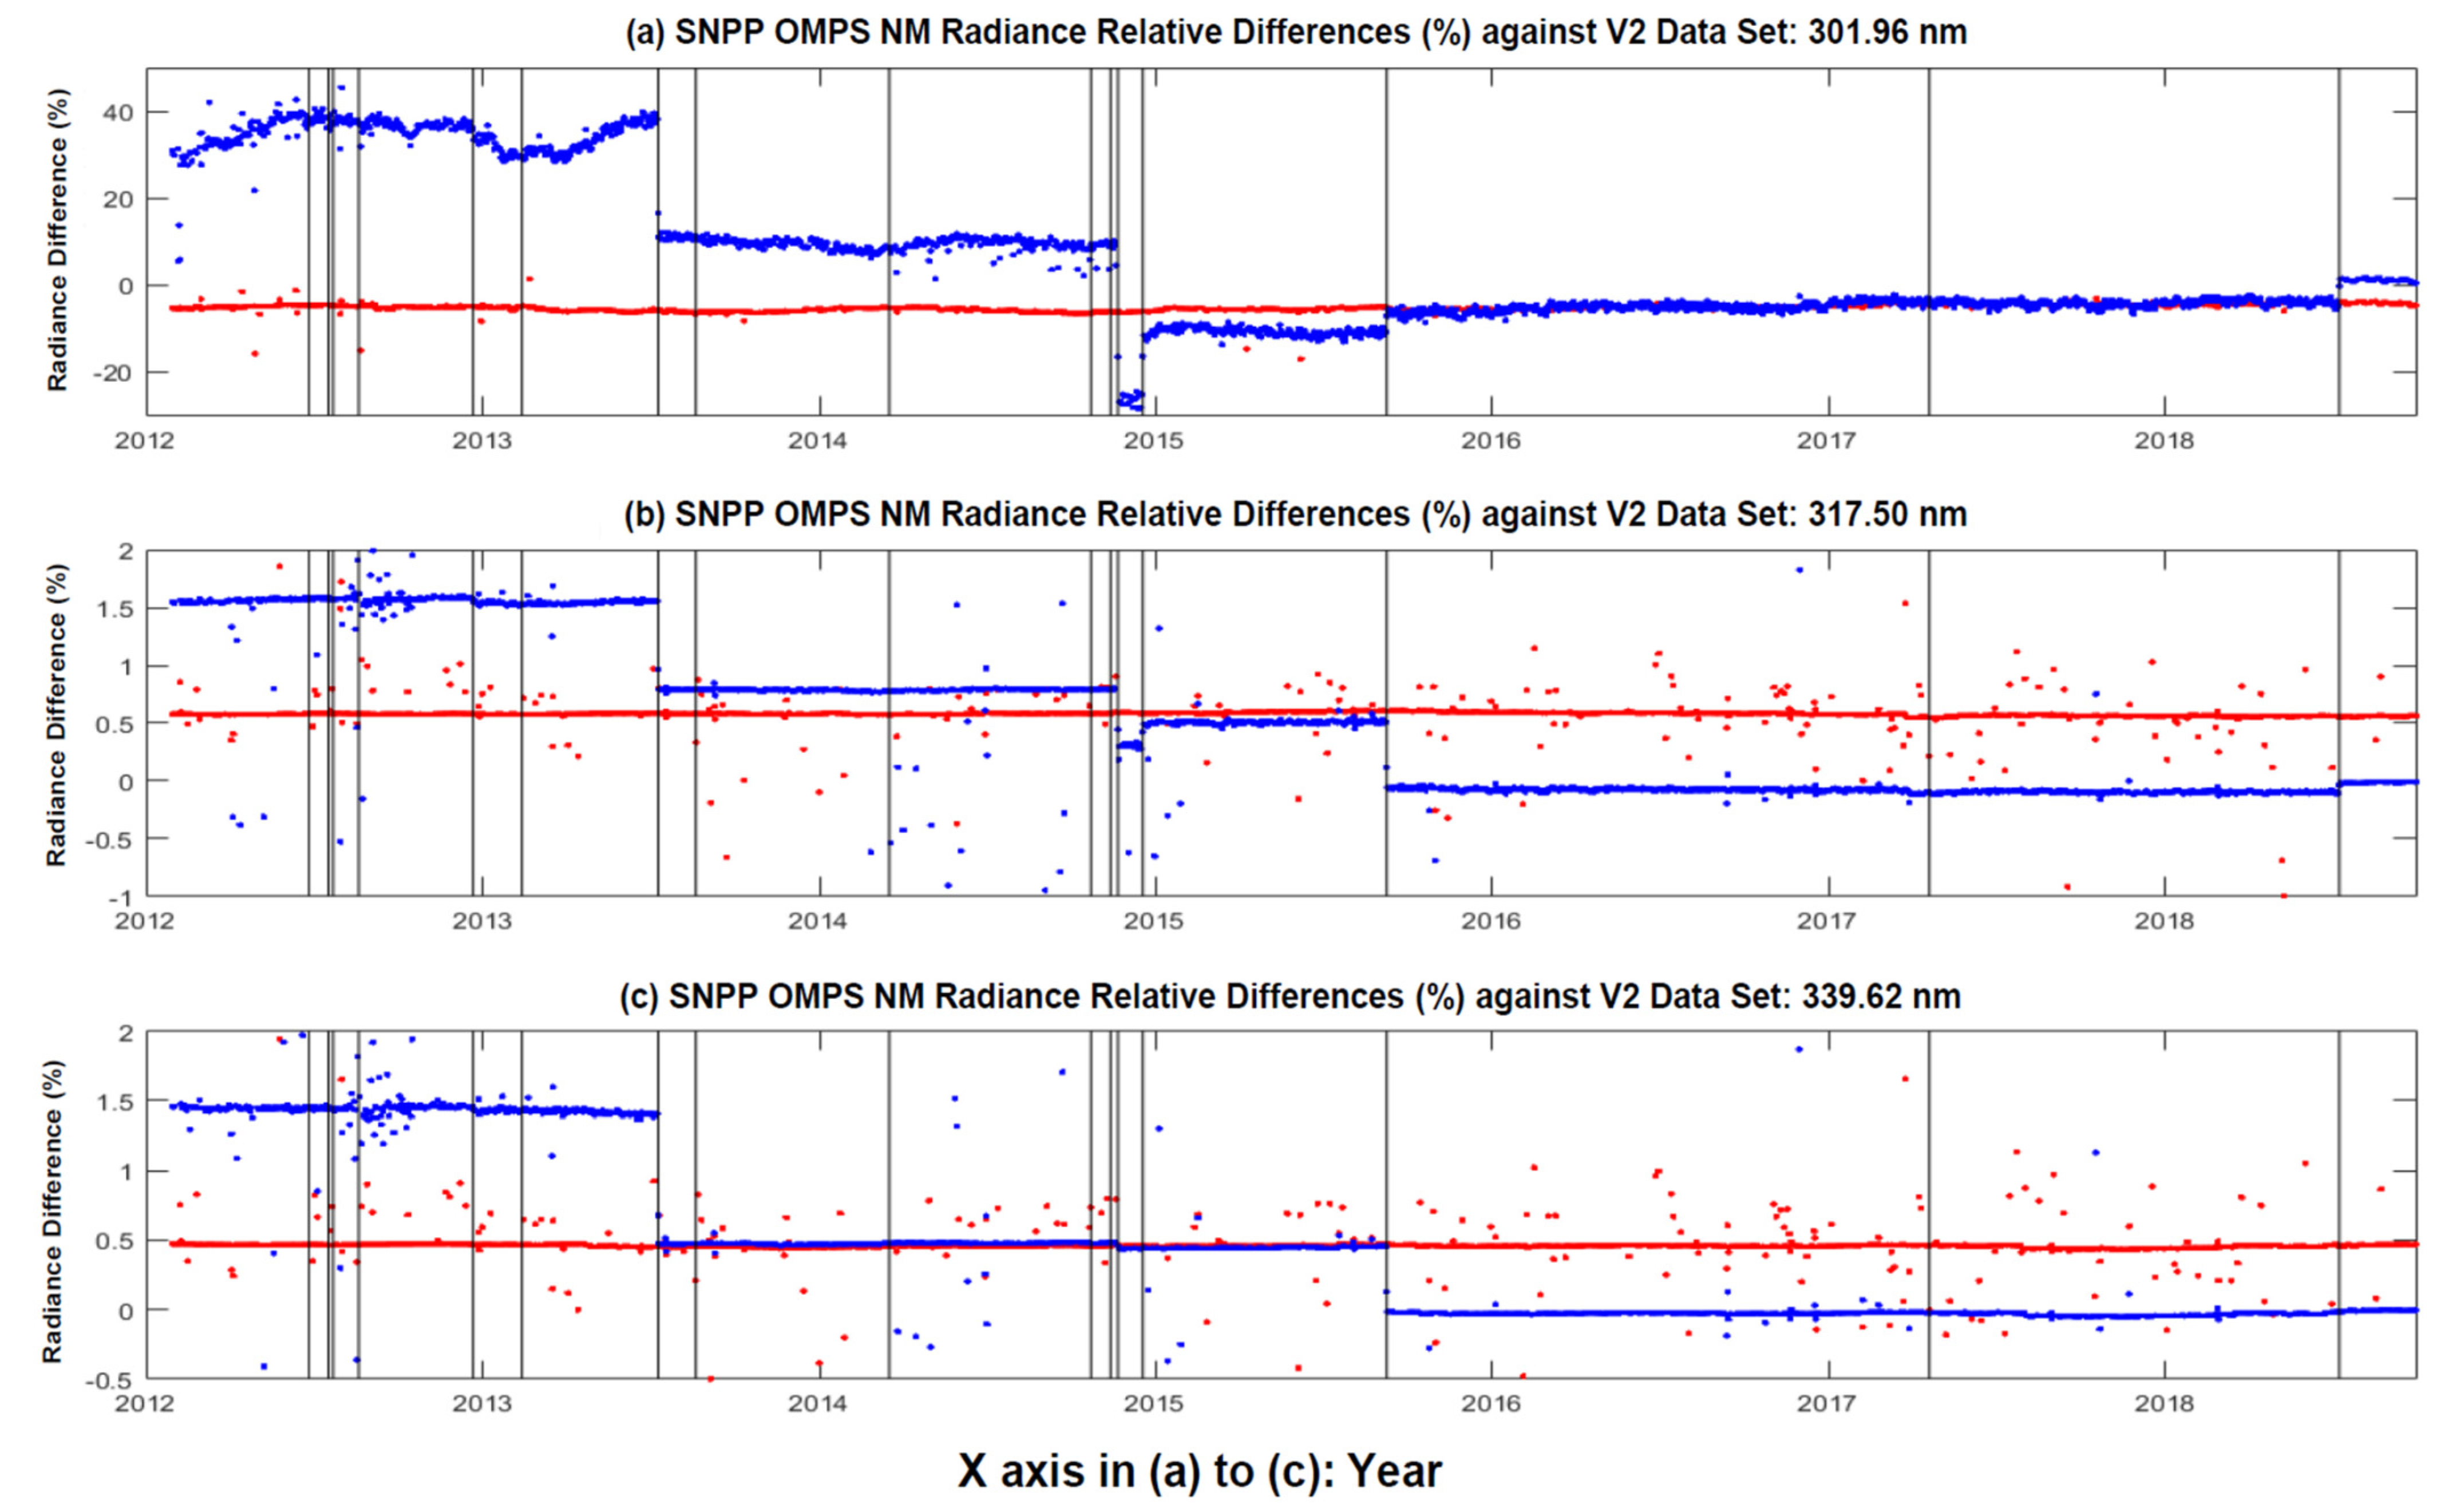
Figure 9 shows the time series of long-term SNPP OMPS NM averaged nadir radiance at the three wavelengths over the tropic areas (20°N~20°S) among the three data sets. To better understand the difference among the three data sets, Figure 10 provides their radiance relative difference (%) using (6). A series of straight lines are added in the figure to illustrate the implementation date of the calibration table updates in the operational data procession until 30 June 2021. The accurate dates of the implementations are given in Table A2 of Appendix A. Several findings are summarized below.
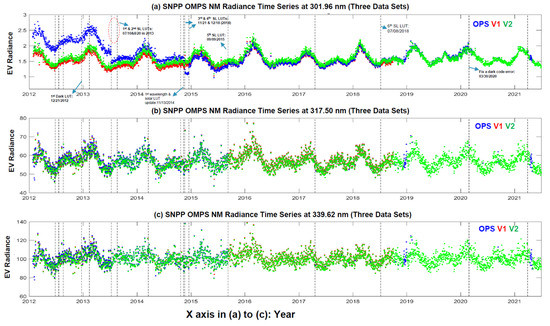
Figure 9.
Time series of long-term SNPP OMPS NM averaged radiance at three wavelengths (301.96 nm, 317.497 nm, and 339.622 nm) over the tropic areas (20°N~20°S) among the three data sets. Here, the three data sets consist of operational (OPS) (blue color), the reprocessed (red color), and reprocessed (green color). The data cover the period from 30 January 2012 through to 30 June 2021, except for the data set that covers the period until 30 September 2018; a series of straight dash lines in the figure represent the implementation date with respect to a specific calibration table. In (a), the updates of seven types of the LUTs are highlighted: 1st dark LUT in December 2012, 1st and 2nd SL LUTs in middle 2013, the first SOL and wavelength calibration LUTs in November 2014, 3rd and 4th SL LUTs in late 2014, 5th SL LUT in September 2015, 6th SL LUT in July 2018, and the dark code shifting error correction in March 2020, referring to Appendix A; (a) 301.96 nm, (b) 317.497 nm, (c) 339.622 nm.
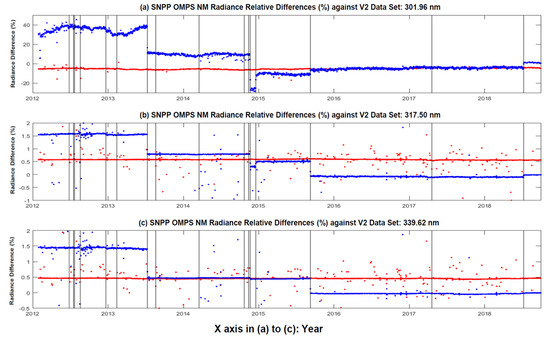
Figure 10.
Same as Figure 9 except for the averaged N-value; (a) 301.96 nm, (b) 317.497 nm, (c) 339.622 nm.
Firstly, the averaged nadir radiance at the three channels in the data set exhibits a consistent variation from time to time during the entire processing period. This is because the consistent calibration tables effectively remove unexpected jumps in the operational radiance time series. In addition, the data set shows a relatively similar annual cycle of mean radiance among approximately nine cycles, with a peak around the Vernal Equinox. Similarly, the Earth-view radiance at the UV band is affected by solar UV irradiance through the SZA (major factor), atmospheric trace gases (ozone, SO2, NO2, and others), clouds, surface reflectivity, and other atmospheric and surface features. A separate study is looked for to better understand this feature.
Secondly, the averaged nadir radiances at the three channels in the data set show a time series feature visually close to that in the data set, but the relative differences (%) are still non-trivial. According to our estimation, the relative nadir radiance differences (%) between the and reprocessing are typically in the range of around −5.0~+1.0%, −1.0~+1.0%, and −0.25~+1.0%, respectively, at the three wavelengths from 301.96 through to 339.622 nm, seeing Figure 9. The two reprocessing use the same calibration tables, except for the three latest updates (dark correction code error, an updated SL table, and an updated FAM table). For the nadir radiance, only the dark count code error correction and the SL correction affect the nadir radiance, with the largest relative impact on the short NM wavelengths. Hence, the use of those new LUTs is still necessary to further improve the quality of the SNPP OMPS NP radiance data under all circumstances.
Thirdly, the averaged nadir radiance in the operation data set exhibit a few rapid jumps/drops from time to time in the time series. The operational processing experienced changes due to either the update of the same calibration coefficient table or the first use of a correction table, e.g., the wavelength calibration table, the solar wavelength shift table, the first dark correction table, and the six versions of the SL correction LUT with the latest update on 8 July 2018 that includes the OOB SL correction for the first time. The updates or use of the calibration table resulted in changes in the Earth-view radiance. For example, at 301.96 nm, each of the six SL correction tables caused visible radiance changes, while the updated wavelength calibration and solar wavelength LUTs on 9 September 2015 caused a rapid drop in radiance (see Figure 9a). As a result, significant relative radiance discrepancies remain in the operational data set against the data, with the largest at 301.96 nm, and a reduced relative impact at longer wavelengths: the relative differences (%) at 301.96 nm, 317.497 nm, and 339.622 nm are in the ranges from −25% through to +40%, −1%~2.0%, and −0.5% to 1.5%, respectively, seeing Figure 10. After the final review, the discrepancies are smaller compared with those before the review, but they are still non-trivial. The relative radiance differences between the operational and data sets are up to −2.0%, −0.25%, and −0.1% at the three wavelengths from the short to the long wavelength, respectively. Those detected impacts indicate the significance of the three updated calibration tables for the nadir radiance.
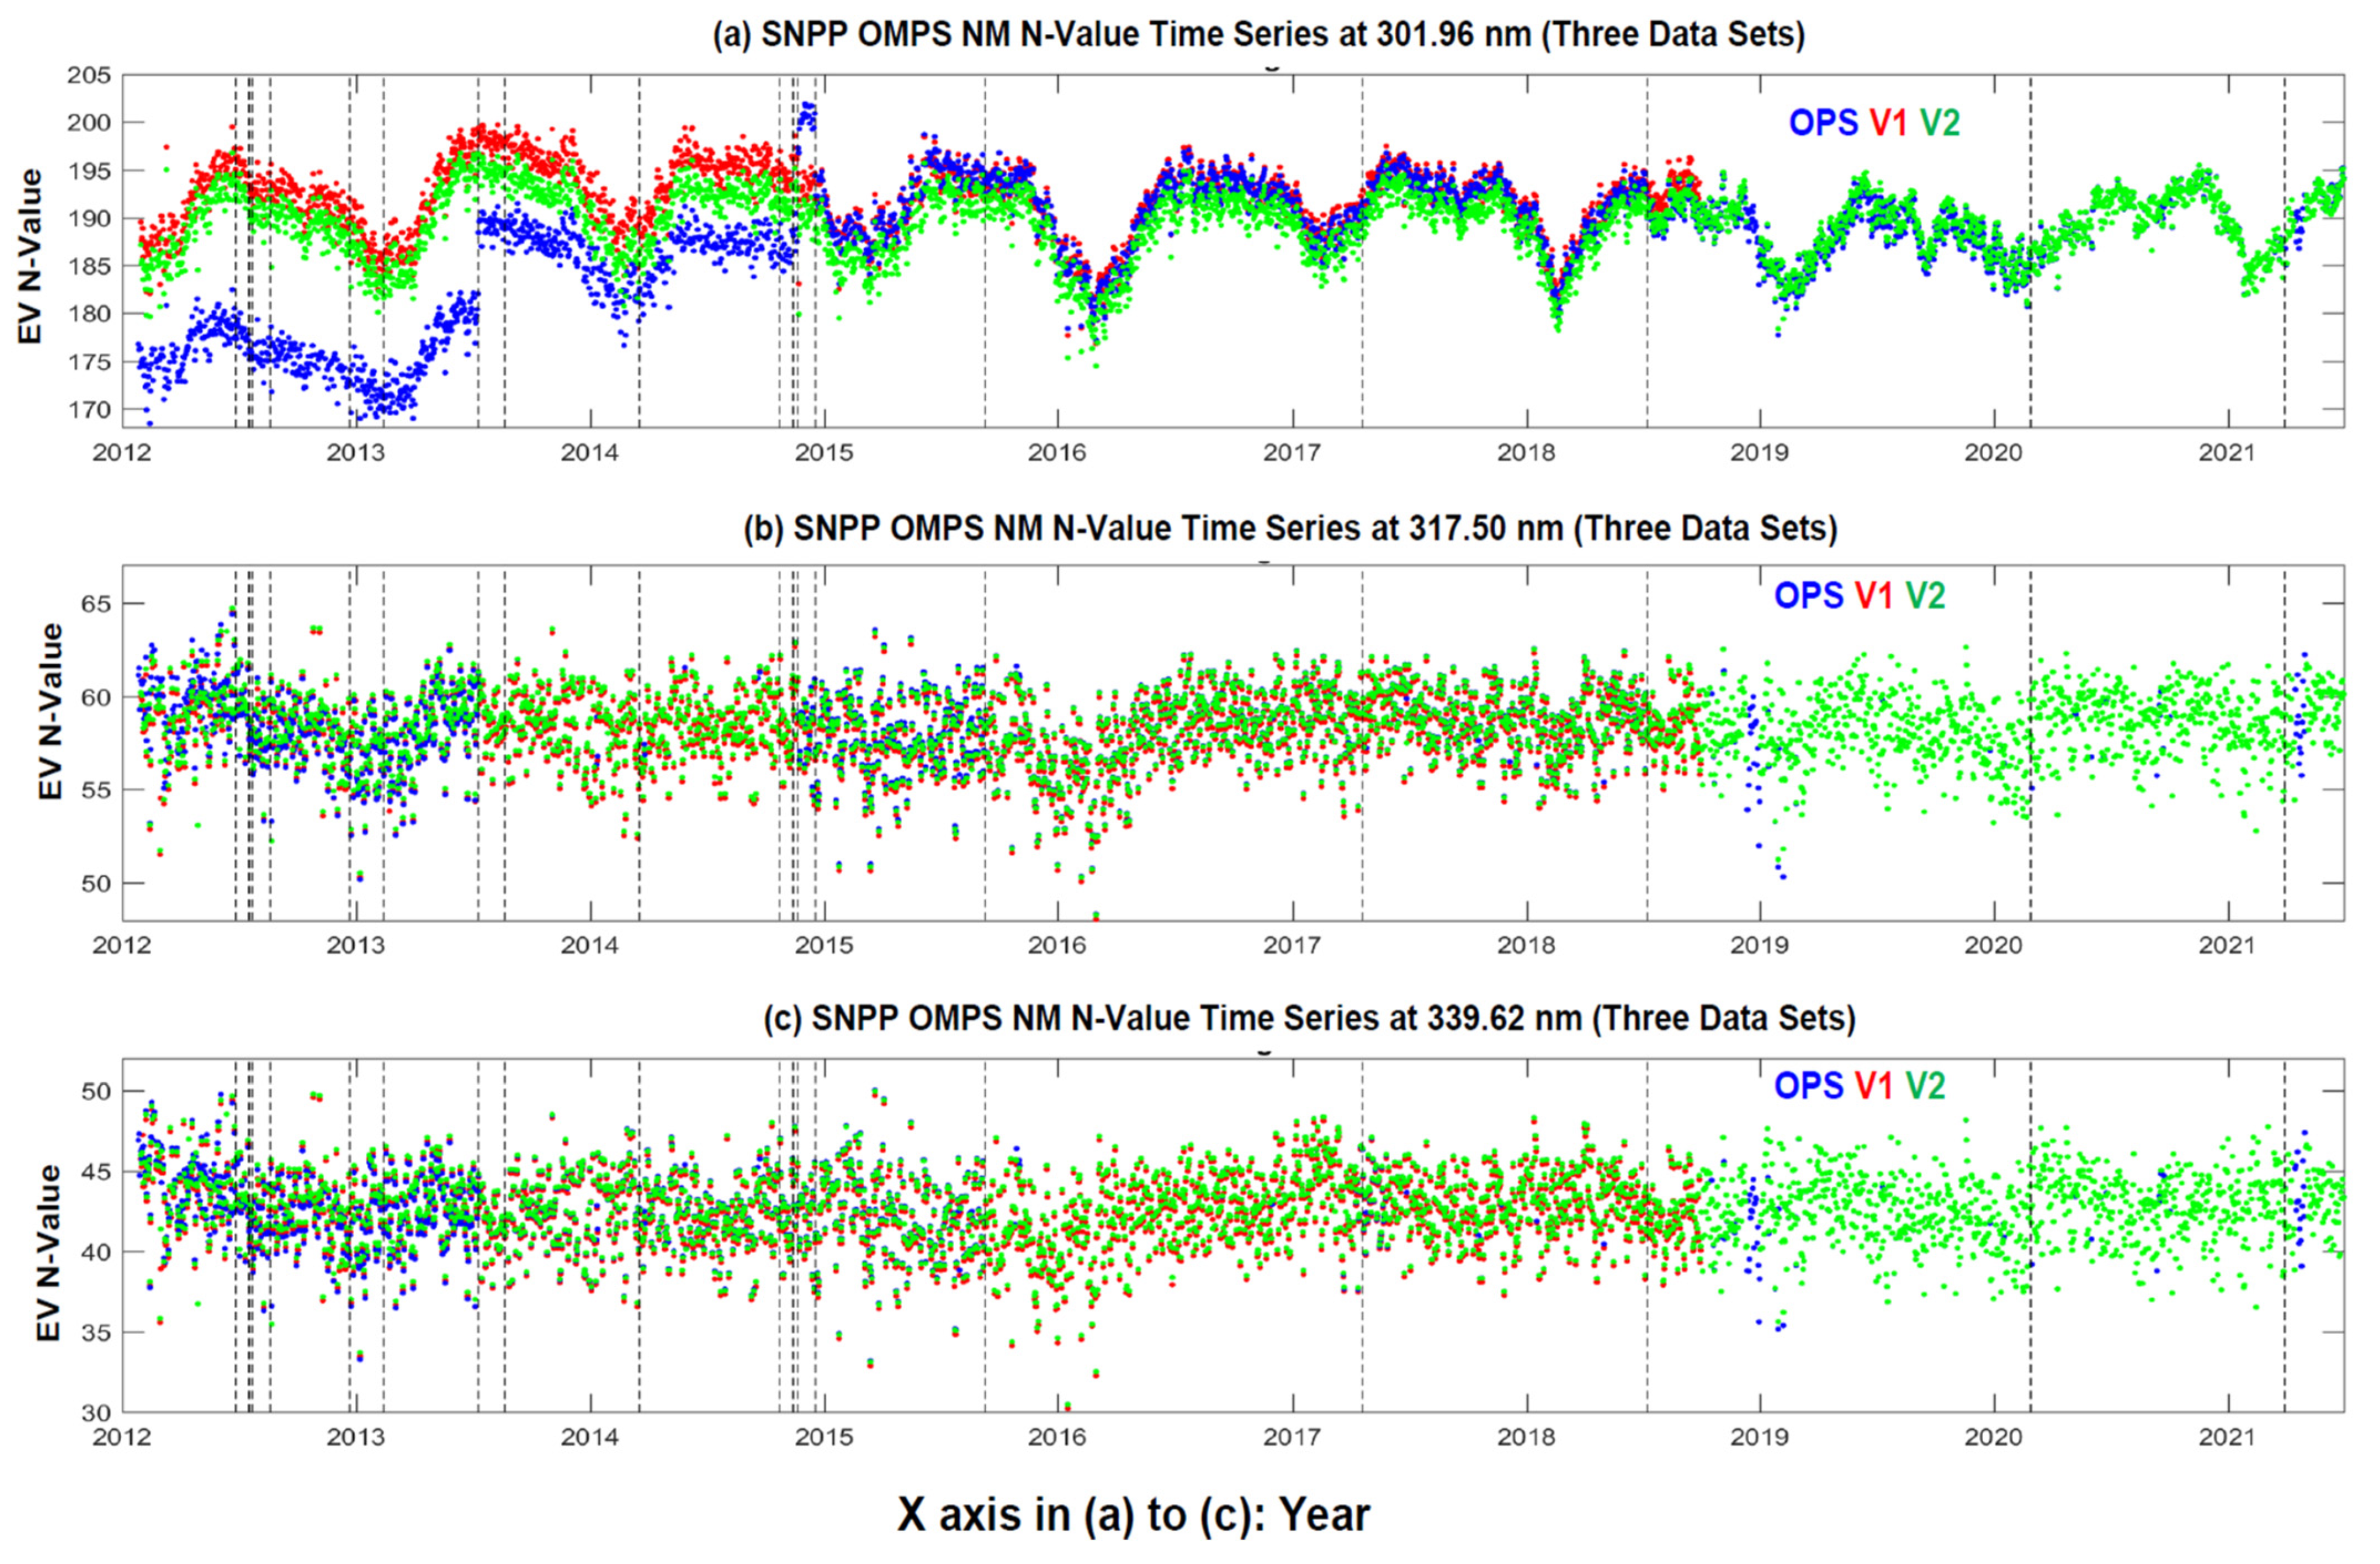
Furthermore, Figure 11 shows the time series of the daily averaged nadir N-value over the tropical area at the three channels by using the three data sources. Similar conclusions are made to those for the nadir radiance: The N-value at the three channels in the data set exhibits a consistent variation from time to time during the entire processing period by removing unexpected jumps/drops due to inconsistent calibration tables in the operational processing. The data set also shows a similar annual cycle from year to year at 301.96 nm with a gradually reduced annual cycle at longer wavelengths. For the operational and data sets, the conclusions for the N-value are similar to those for the radiance. The time series of the operational N-value shows obvious drops/jumps due to inconsistent calibration tables, while the time series is visually close to that of data, although non-negligible differences still remain. For instance, the N-Value for the operational data set has a sudden increase in July 2013. This is caused by the implementation of the first stray light correction table (see Table A2 in Appendix A), where the stray light correction results in a decrease of radiance [see (5)], i.e., an increase of the N-value. According to the results in Figure 11, the relative N-value deviations between the operational and data sets are around −8.0%~+5%, −0.5~+1.0%, and −1%~+1.0% at 301.96 nm, 317.497 nm, and 339.622 nm, respectively; the relative deviations between the and data sets are primarily around −0.1%~+1.0%, −0.5%~+0.5%, and −1%~+1.0% at the three channels, respectively (the figures are omitted).
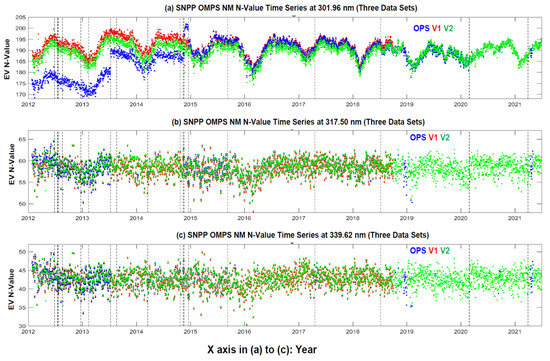
Figure 11.
Time series of long–term SNPP OMPS NM N-values at three wavelengths (301.96 nm, 317.497 nm, and 339.622 nm) over the tropic areas (20°N~20°S) among the three data sets; (a) 301.96 nm, (b) 317.497 nm, (c) 339.622 nm.
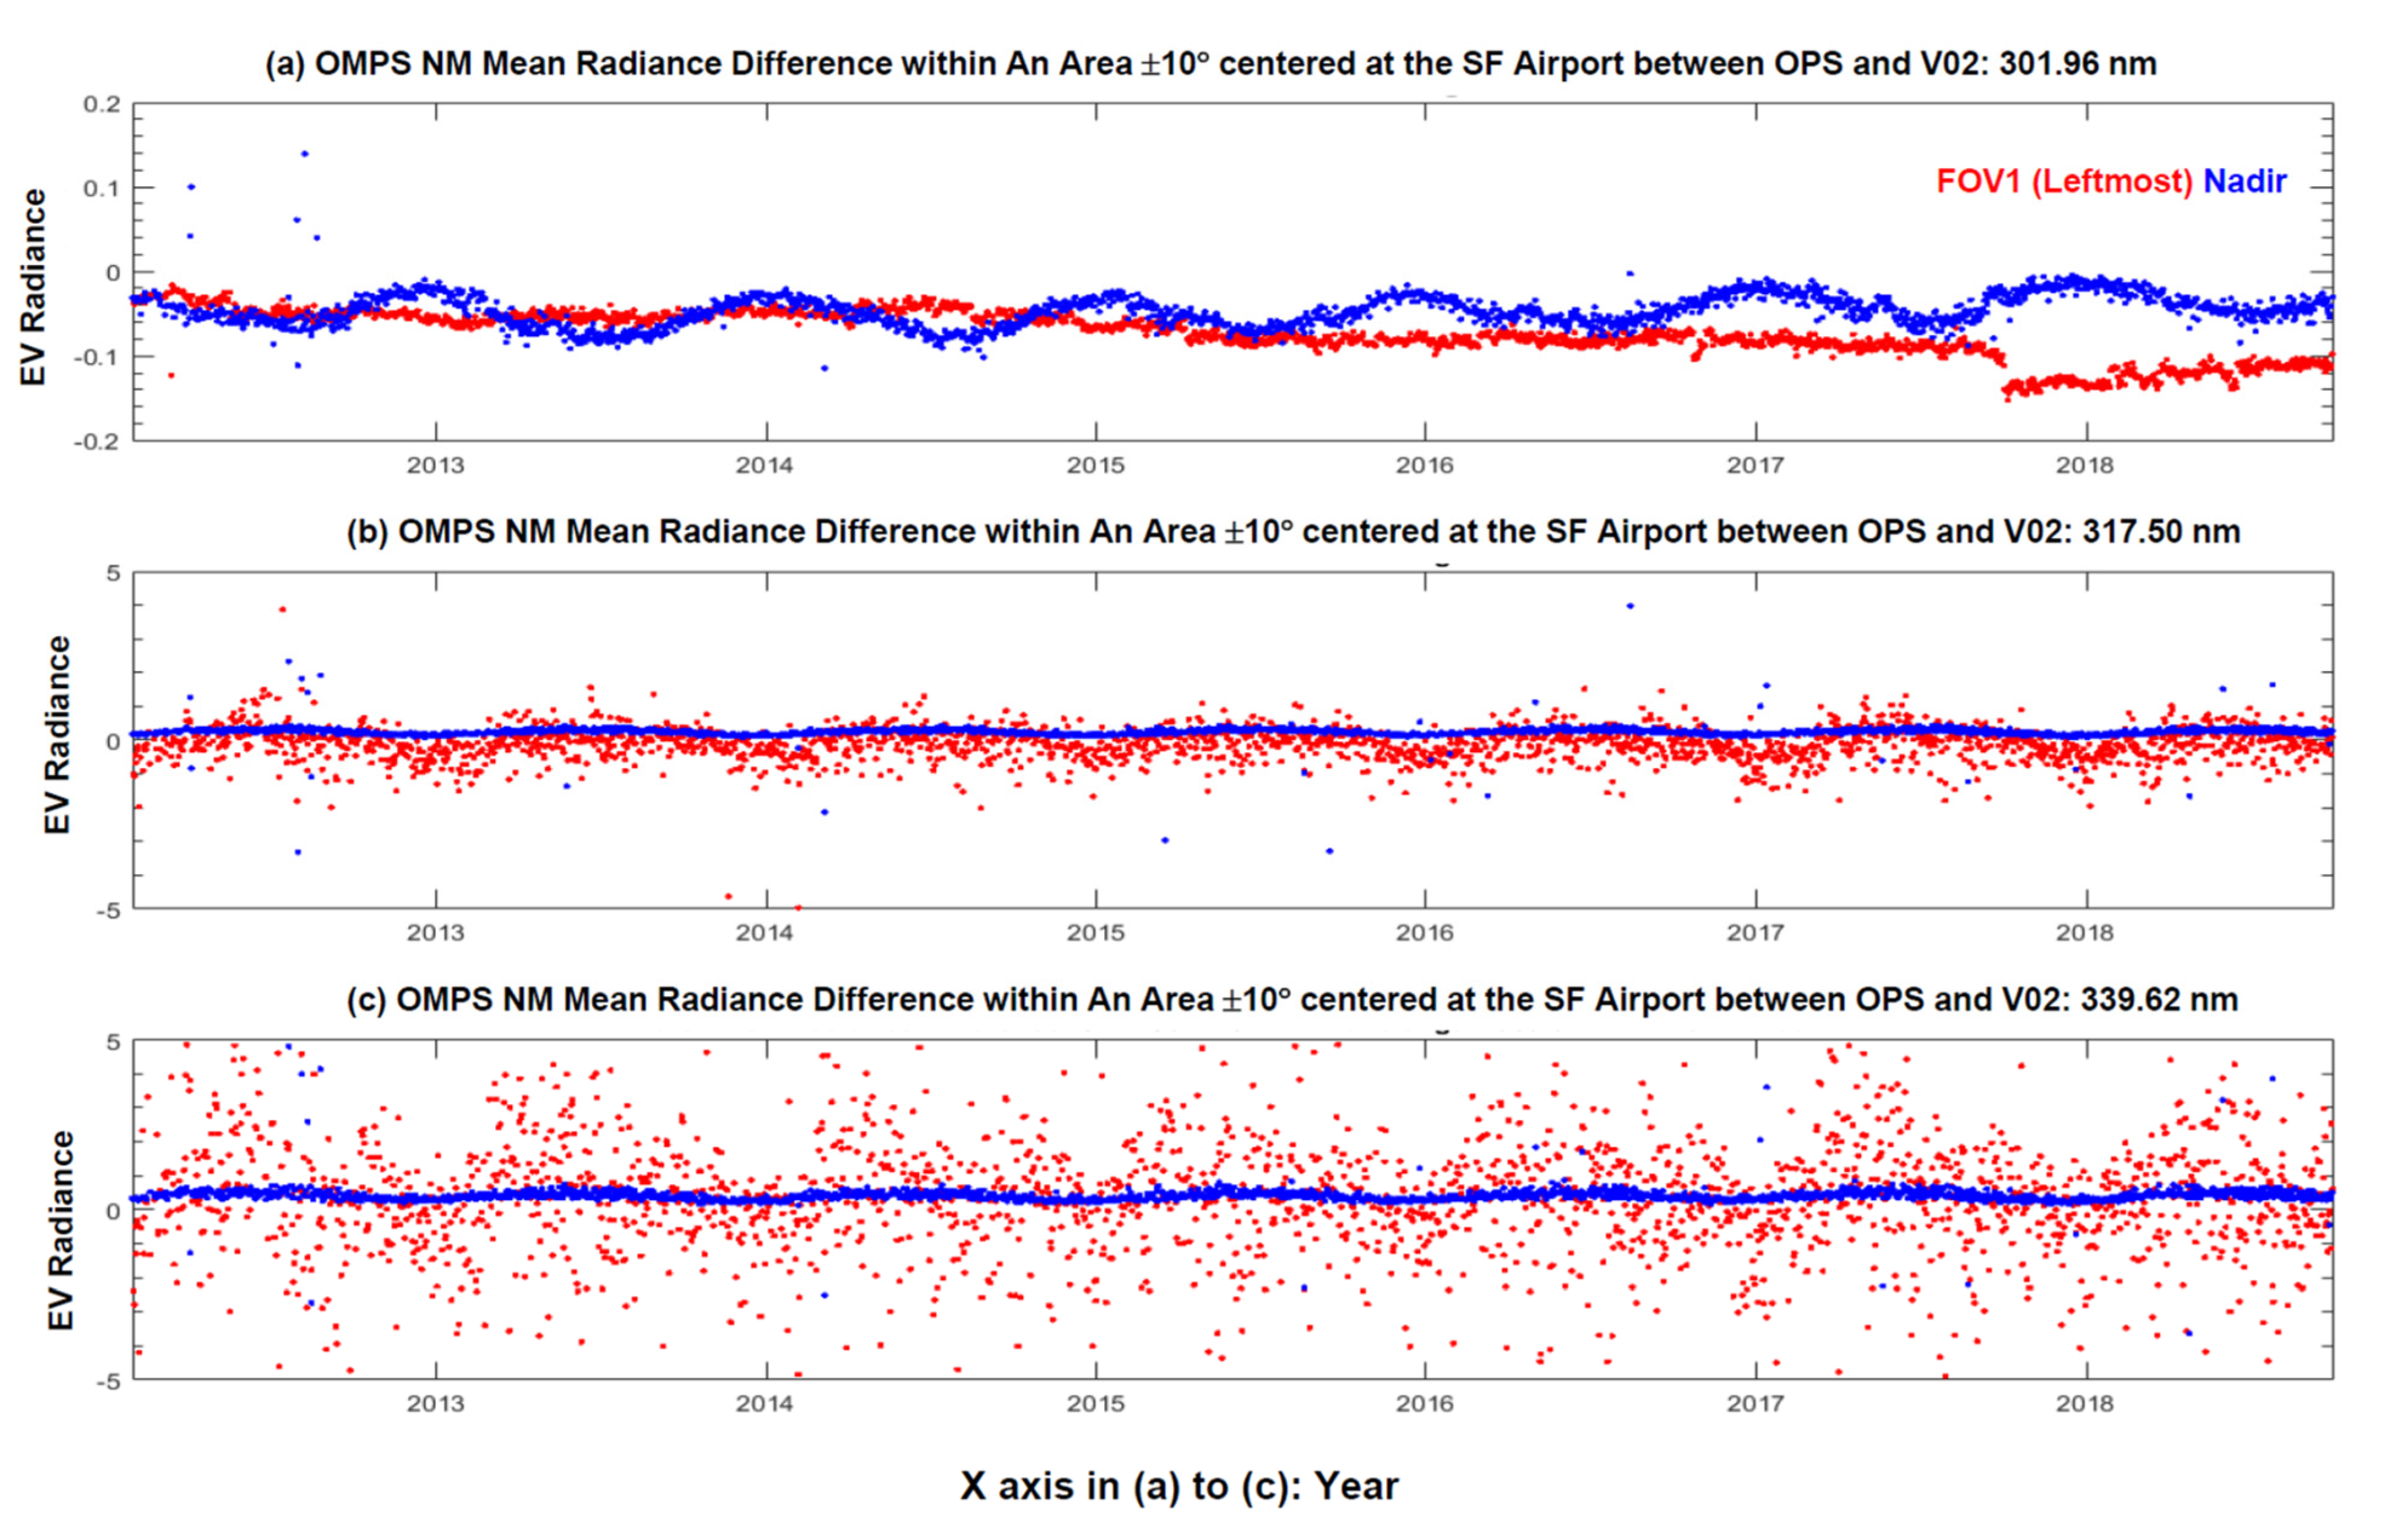
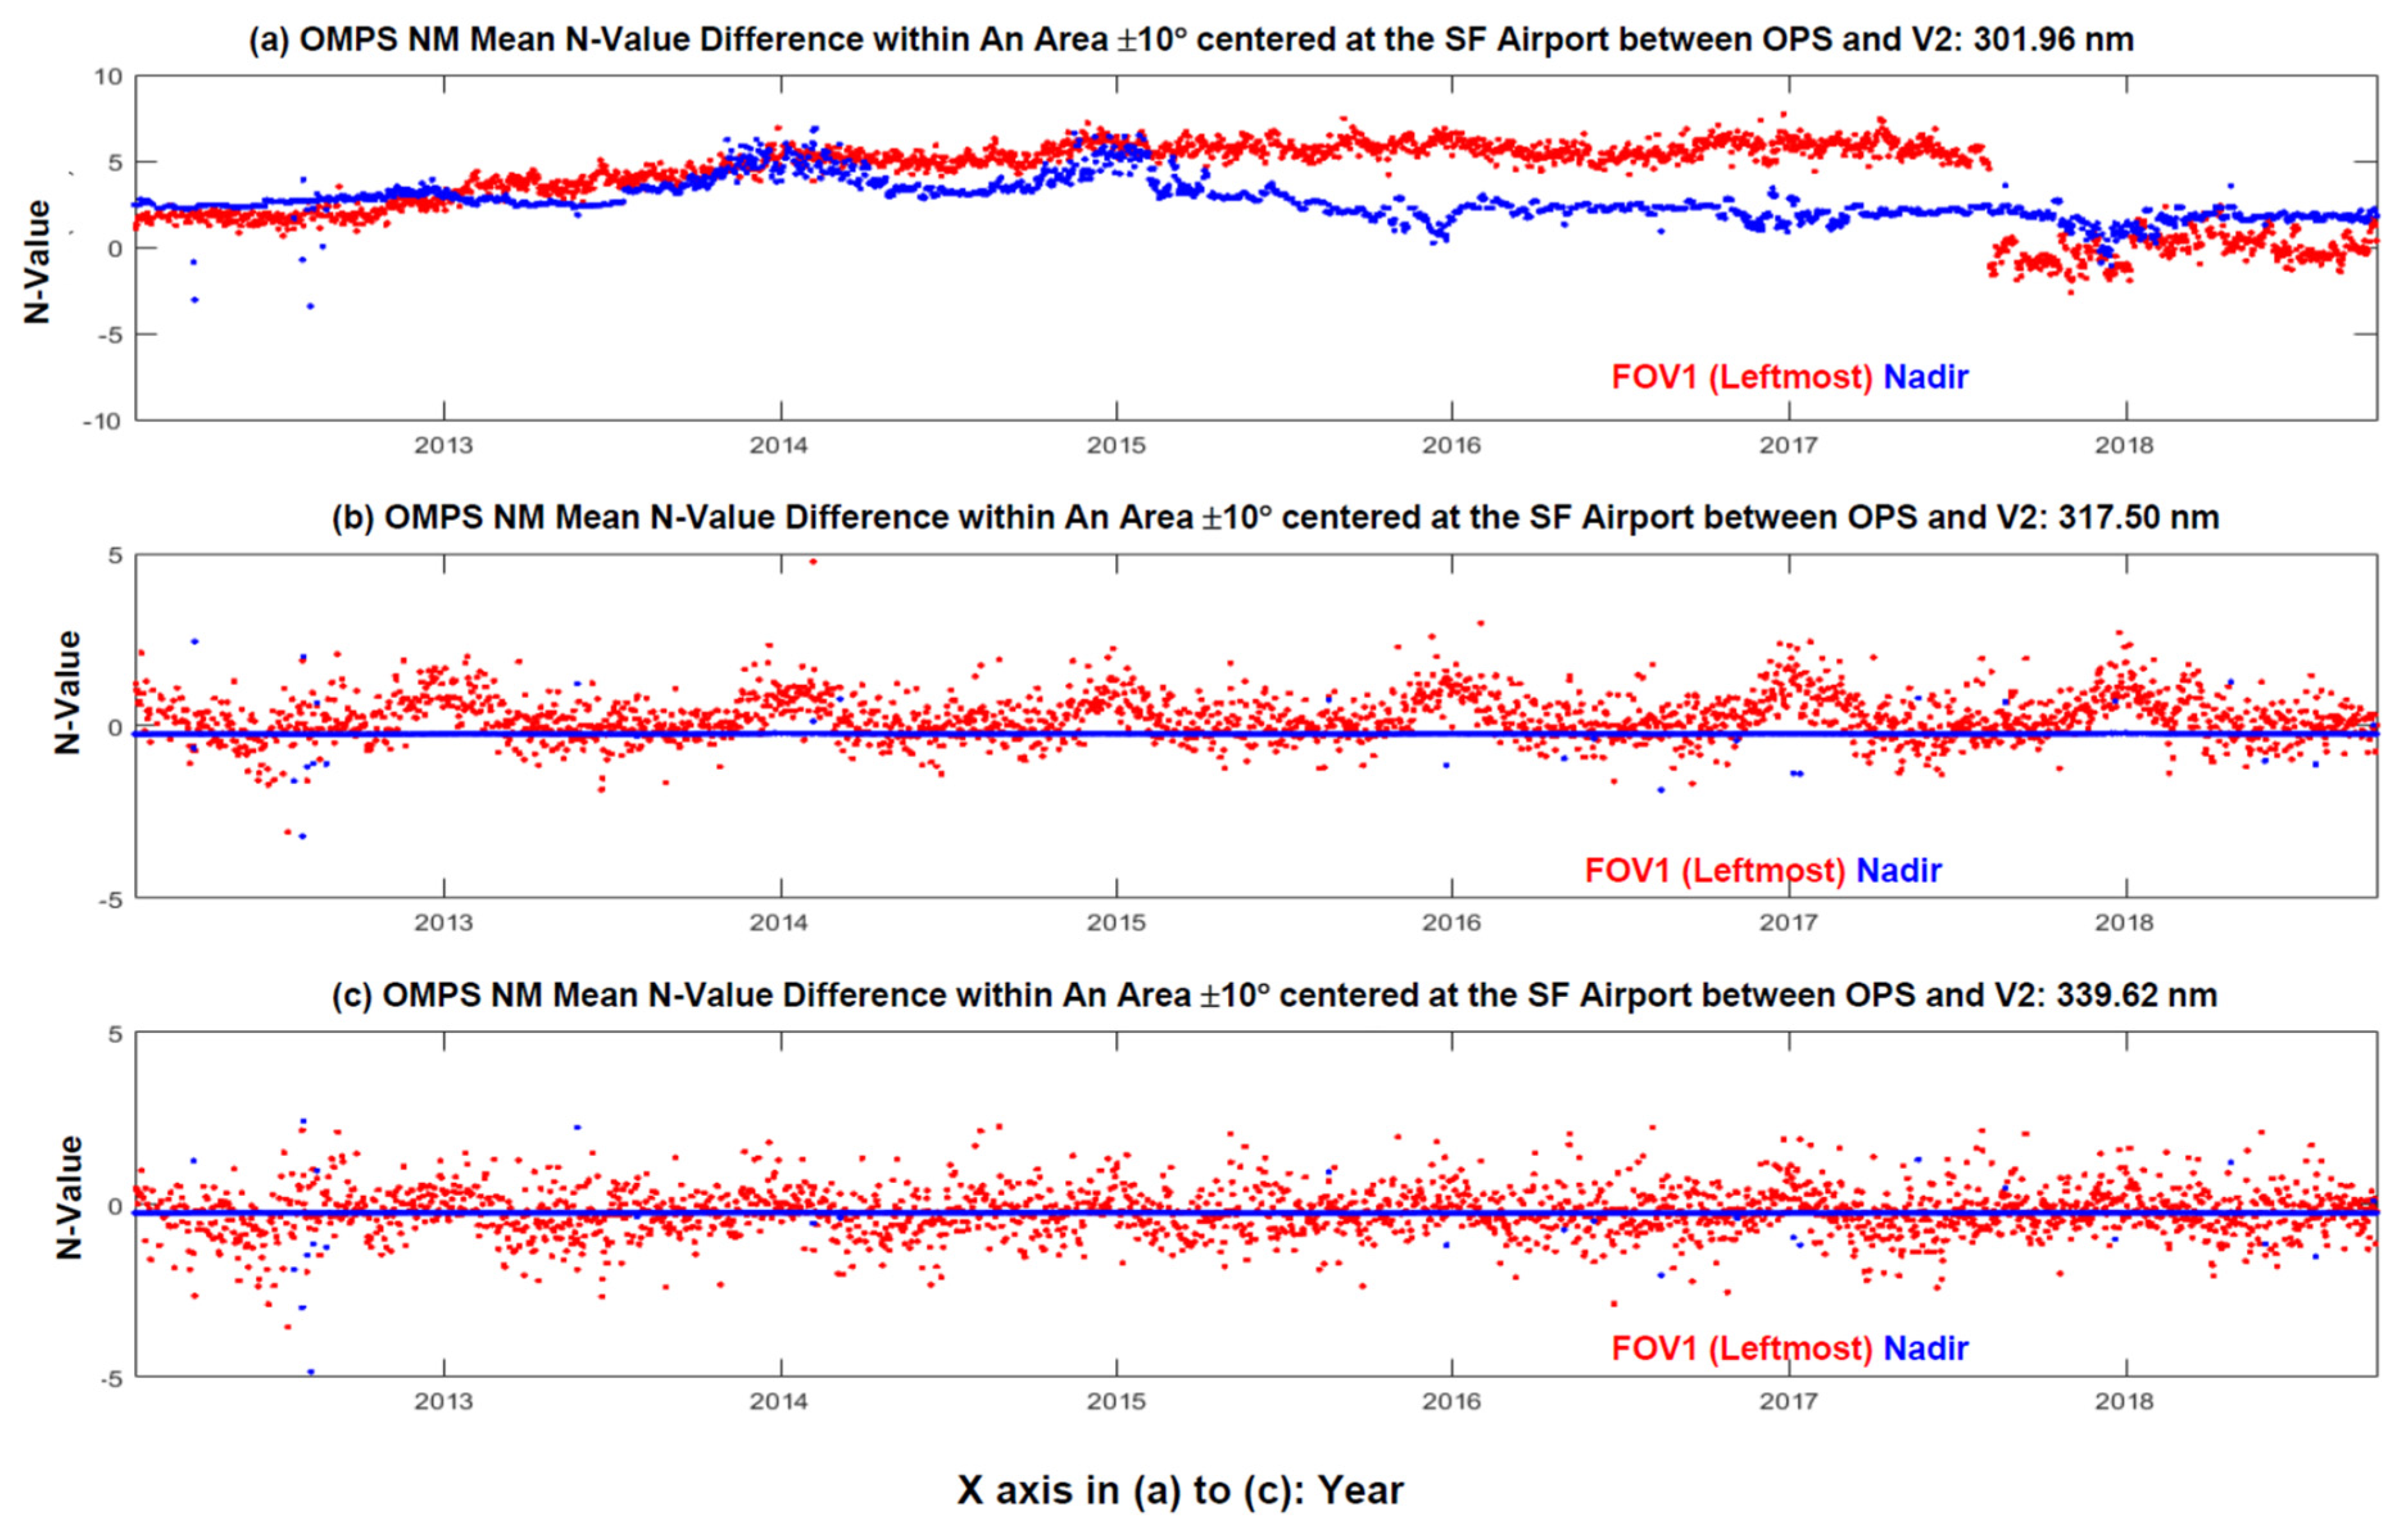
The impact of the calibration tables on the nadir radiance and N-value has been quantified in the above analysis. Compared with other updated tables, the new FAM LUT is designed to solve geolocation errors occurring in off-nadir pixels, so its impact is not observed on the nadir pixels. To assess its impact, we further compare the time series of the daily averaged radiance for the pixels at two cross-track positions (leftmost for FOV#1 and nadir for FOV#18) between the operational and data sets for the selected channels. The coverage of the data is a box area of 10° × 10° centered at the San Francisco International airport. Figure 12 presents the time series of the averaged absolute radiance difference using (7) at the two positions between the operational and data sets for the three selected channels, where the data are not included because they have the same geolocation issue as the operational processing. Apparently, the geolocation FAM LUT significantly changes the values of radiance at the cross-track off-nadir pixels (see the results for the leftmost in the figure) at all channels, with a high absolute impact on longer wavelengths. However, the resulting radiance difference can change with actual radiance magnitude and scene inhomogeneity.
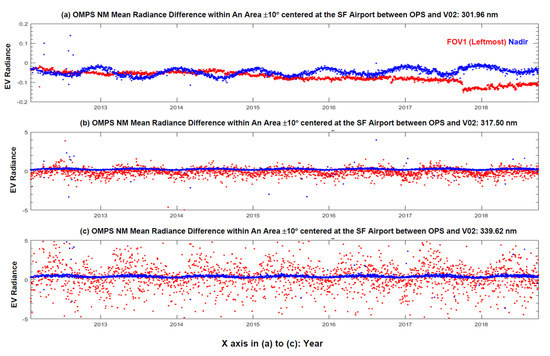
Figure 12.
Time series of long–term SNPP OMPS NM averaged radiance differences at three wavelengths (301.96 nm, 317.497 nm, and 339.622 nm) over the small box (10° × 10°) along the San Francisco International airport among the three data sets; (a) 301.96 nm, (b) 317.497 nm, (c) 339.622 nm.
Except for the off-pixels, the impact of the nadir pixels is also visually observed due to the consequence of other calibration tables as we discussed above. The absolute radiance differences are actually much higher at longer wavelengths than those at shorter wavelengths. This also confirms the abovementioned conclusion that the high relative deviations at shorter wavelengths are caused primarily by low radiance values. The analysis for the OMPS spectrum in Section 4.3 below will further approve these conclusions. For the N-value differences, a similar feature is detected except for changeable magnitudes (see Figure 13). Overall, the geolocation error is demonstrated to be an important factor affecting the quality of the OMPS NM radiance and N-values data for off-nadir pixels at all NM wavelengths.
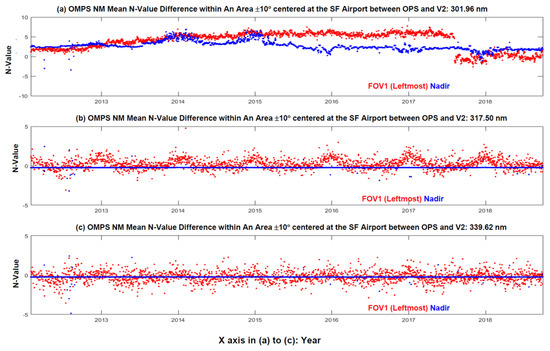
Figure 13.
Same as Figure 12 except for averaged N-values at three wavelengths (301.96 nm, 317.497 nm, and 339.622 nm); (a) 301.96 nm, (b) 317.497 nm, (c) 339.622 nm.
In summary, the reprocessing has been demonstrated to be able to produce a calibration accuracy-consistent mission-long SNPP OMPS NM SDR data set by adding the operational processing after June 2021 through to the present date. Contrary to the LT performance, the operational data set exhibits several jumps/drops of the daily averaged radiance/N-value in the time series. The data set shows a better performance than the operational data set, but it still has certain deviations in the radiance/N-value time series from the data set due to a lack of the newly updated LUTs after the final review. In the comparison, the impacts of the updated calibration tables are clearly seen from the time series of either nadir pixels or off-nadir pixels. Generally, the large relative impact occurs at a short wavelength where the Earth-view radiance is usually two or three orders smaller than these at high wavelengths, while the large absolute impact can occur at long wavelengths, which is especially true for off-nadir pixels. In addition, the impacts particularly resulting from the updated FAM table are relatively flexible with the position of the off-nadir pixels at a cross-track direction, Earth-view scene, and viewing condition.
4.3. OMPS NM and NP Normalized Radiance and N-Value Full Spectrum
The above analysis has individually assessed the long-term performance of the SNPP OMPS NP and NM SDR data sets (OPS, and ). Among the three data sources, the reprocessing produces the most reliable and quality-consistent data set for each of the NM and NP, while the other two data sets exhibit certain discrepancies due to the use of erroneous calibration tables. As a result, the impact of calibration tables is also observed in OMPS combined radiance (or normalized radiance and N-value) spectrum from 250 nm through to 380 nm. This impact further affects the consistency of the NM and NP in the dichroitic wavelength range from 300 to 310 nm for the same data set. In order to demonstrate this, we compare the spectra of a normalized OMPS NM and NP normalized radiance and N-value and the spectrum differences. The two following dates are selected in the analysis: 11 February 2013 when the calibration tables were not mostly validated, and 30 June 2021 when all calibration tables were well validated in the operational processing (see Figure 2 or Appendix A for the timeline of the table updates for the NP).
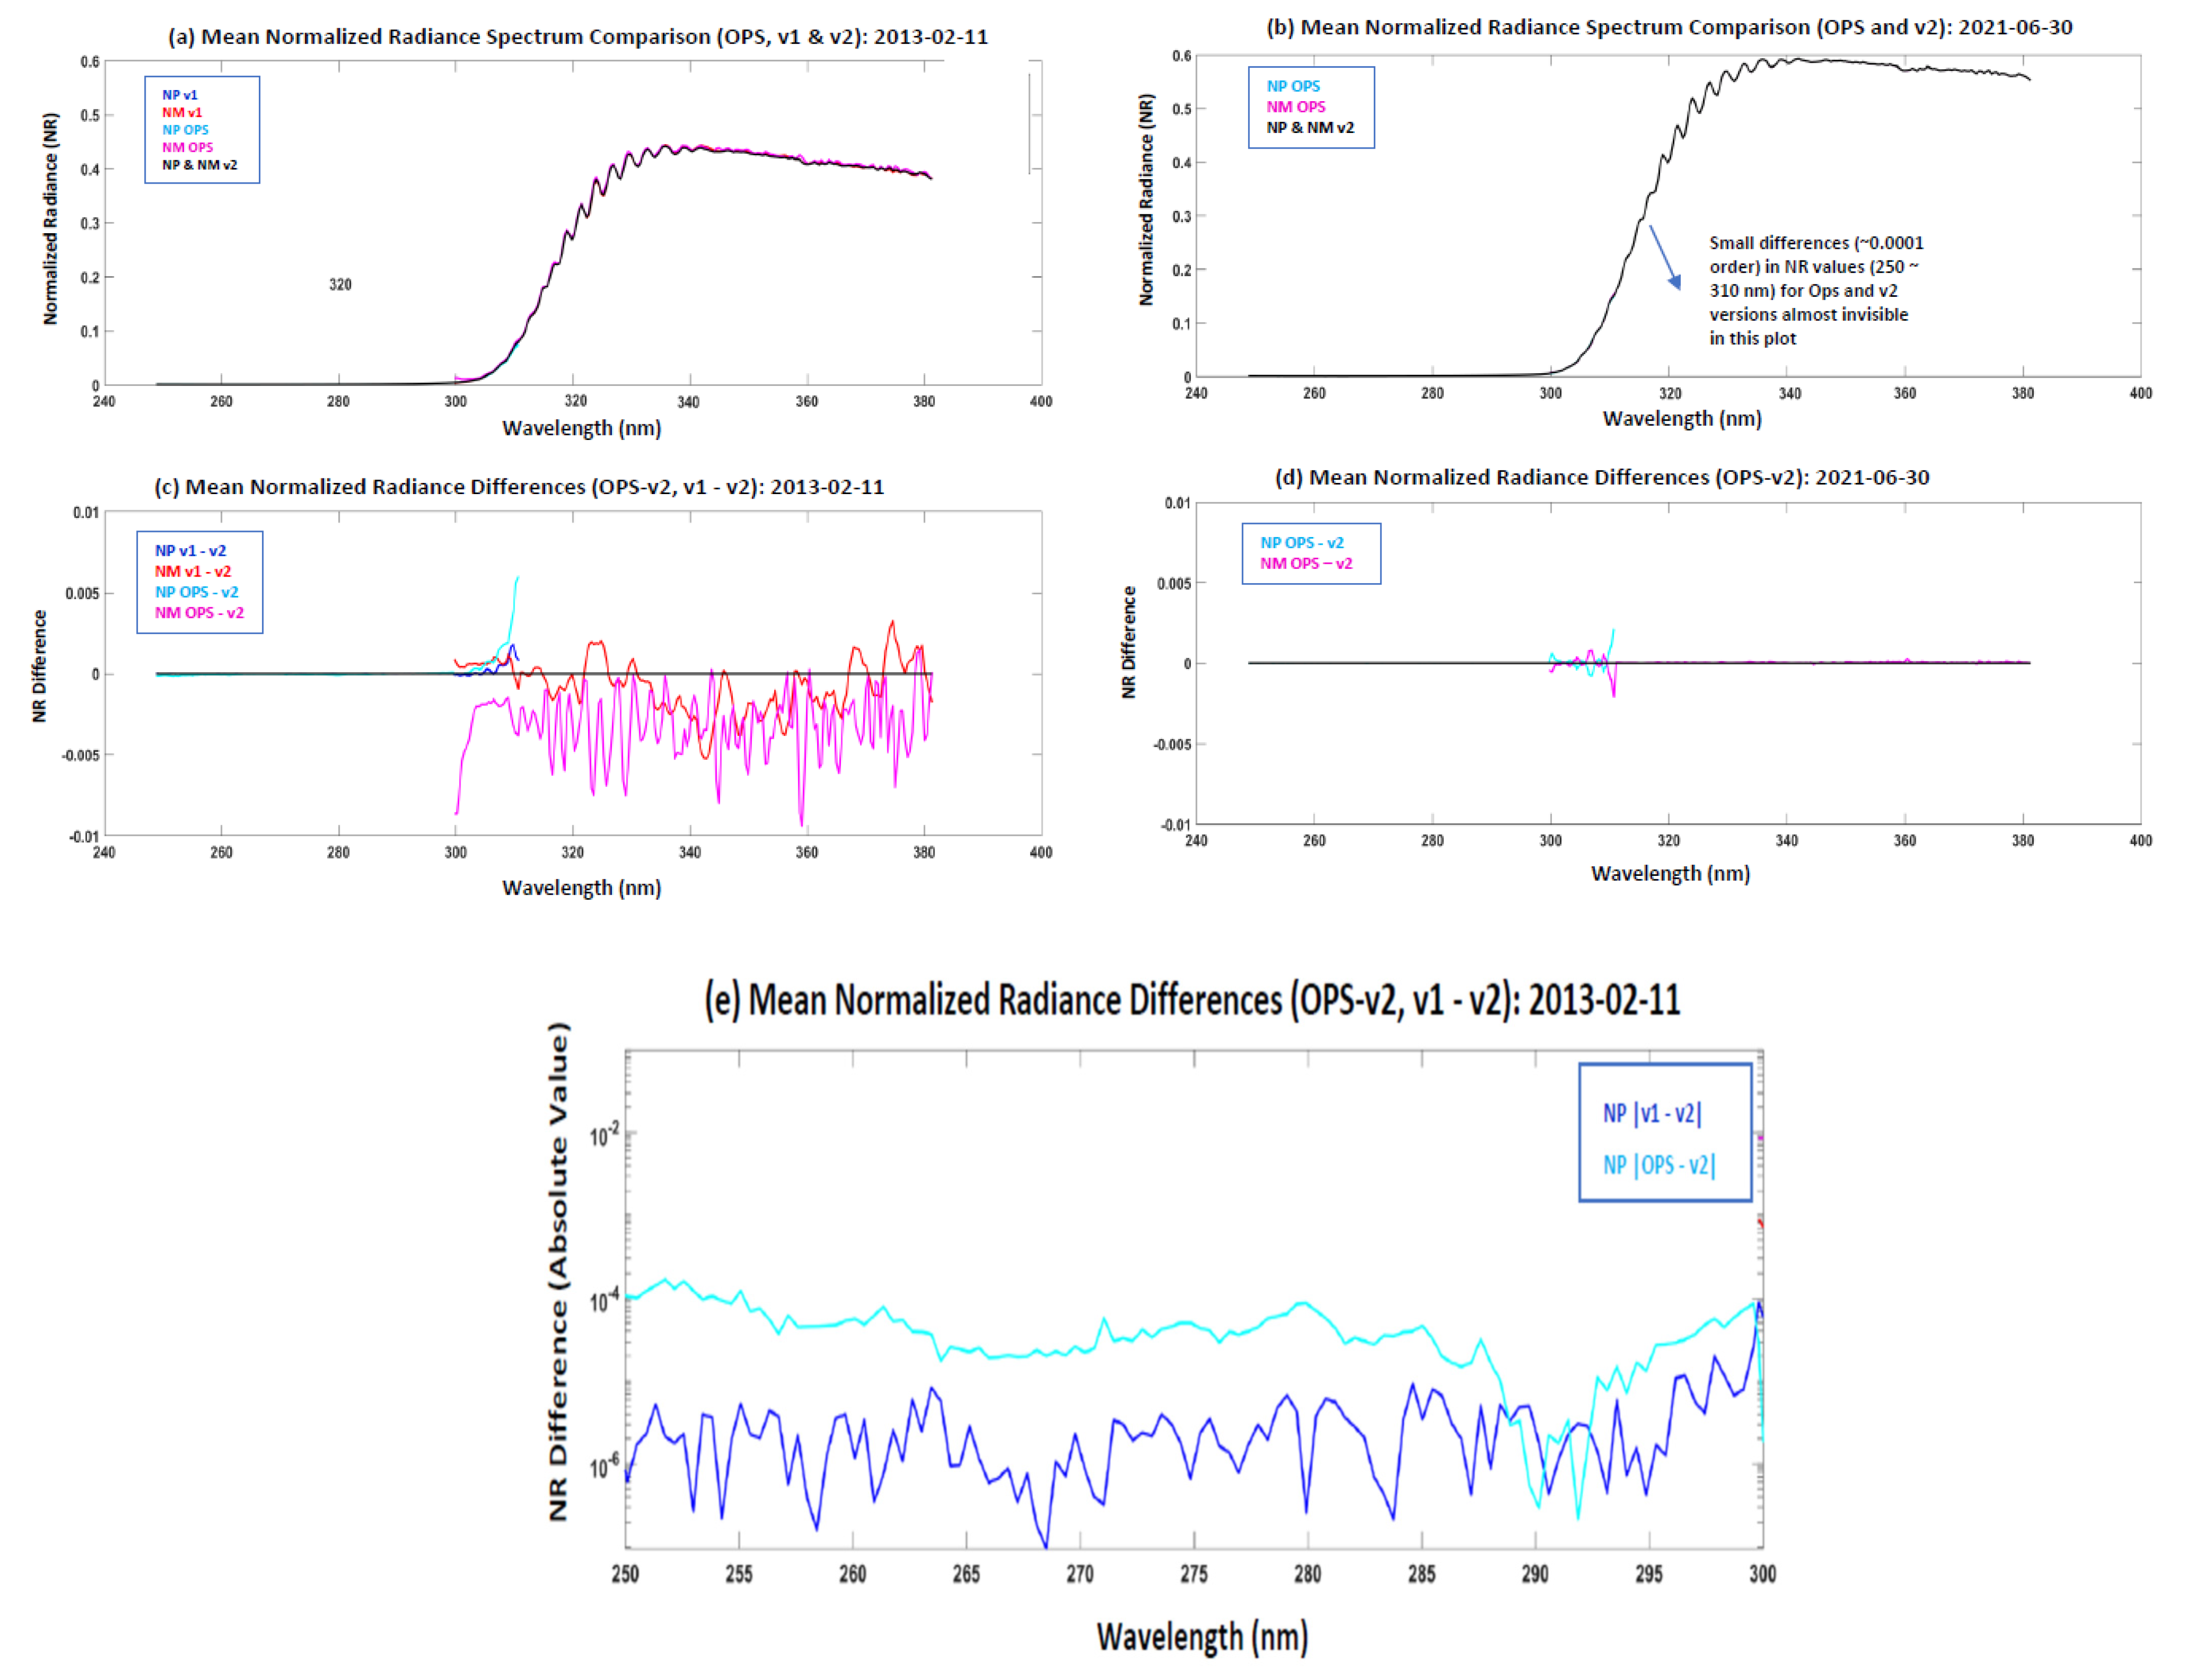
Figure 14a,b display the averaged normalized radiance spectra from 250 nm through to 380 nm using the three data sets over a small box (10° × 10°) along San Francisco International airport at the two selected dates. Here, the OMPS NM data at the nadir pixel position are used to comply with the NP observations. It is difficult to visually observe the discrepancies of either the operational or data sets from the data set in Figure 14a,b. To understand the differences, Figure 14c,d provide their spectrum differences at the two dates. In view of the results in Figure 14c,d, on the first date, when most of the used calibration tables were non-validated in the operational processing, a vital discrepancy was found within the dichroic wavelength range between the OPS and the . Discrepancies also appeared at other wavelengths. Compared with the operational data set, the exhibits a much-improved agreement with the data set since the tables are similar, except for the solar table [see (a) only since there is no data on the second date]. Contrary to the first date, the consistency of the spectrum between the OPS and the is much improved on the second date. Similar conclusions to those in Figure 12 are made: Large normalized radiance discrepancies occur within the wavelengths above 300 nm for each of the OPS and data sets against the data set. In addition, a vital inconsistency remains within the dichroic range between the NP and NM in the operational data set on the first date [see (c)], while a relatively small inconsistency exists between the NM and NP for the data set. There is a large reduction of normalized radiance difference at the same wavelength between the NM and NP observations from 0.001 order ( reprocessing) or 0.01 order (operational processing) to 0.001 order or smaller, seeing (c) and (d). This means that the validated tables significantly improve the consistency of the NM and NP observations at the dichroic wavelengths for the same data set. Here, the conclusions are made based upon the (absolute) discrepancies using (7). When these absolute differences are converted into the relative differences by using (6), as we have shown in Section 4.1 and Section Section 4.2, their relative deviations are extremely increased at short wavelengths due to a much lower normalized radiance (or radiance). As an example, the relative deviations of the normalized radiance over wavelengths between 250 nm and 300 nm are further presented in a log scale in Figure 14e. The absolute values of the relative deviations are made due to a log scale. The magnitude of the deviations is obvious compared to a very small dynamic range of radiance at short wavelengths. Meanwhile, the reprocessing shows smaller deviations from the reprocessing than the operational processing.
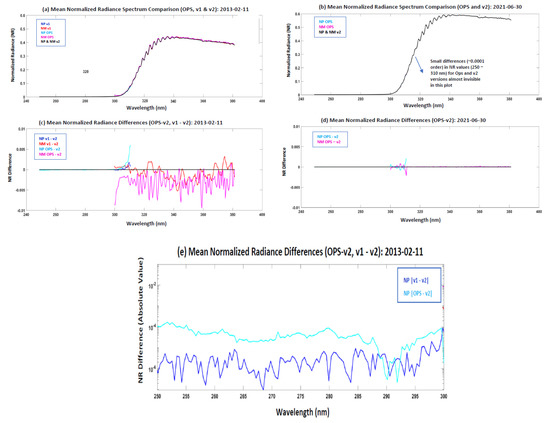
Figure 14.
Comparison of the averaged normalized radiance spectra from 250 nm through 380 nm using the three data sets over a small box (10° × 10°) along San Francisco International airport and the spectrum difference against the data set, at two dates. (a) Averaged normalized radiance spectra using the three data sets (OPS, , and ) on 11 February 2013. (b) Same as (a) except for 30 June 2021. (c) Averaged normalized radiance difference 11 February 2013. (d) Same as (c) except for 30 June 2021. (e) Same as (c) except for a shorter wavelength range from 250 to 300 nm and in a log scale for y-axis.
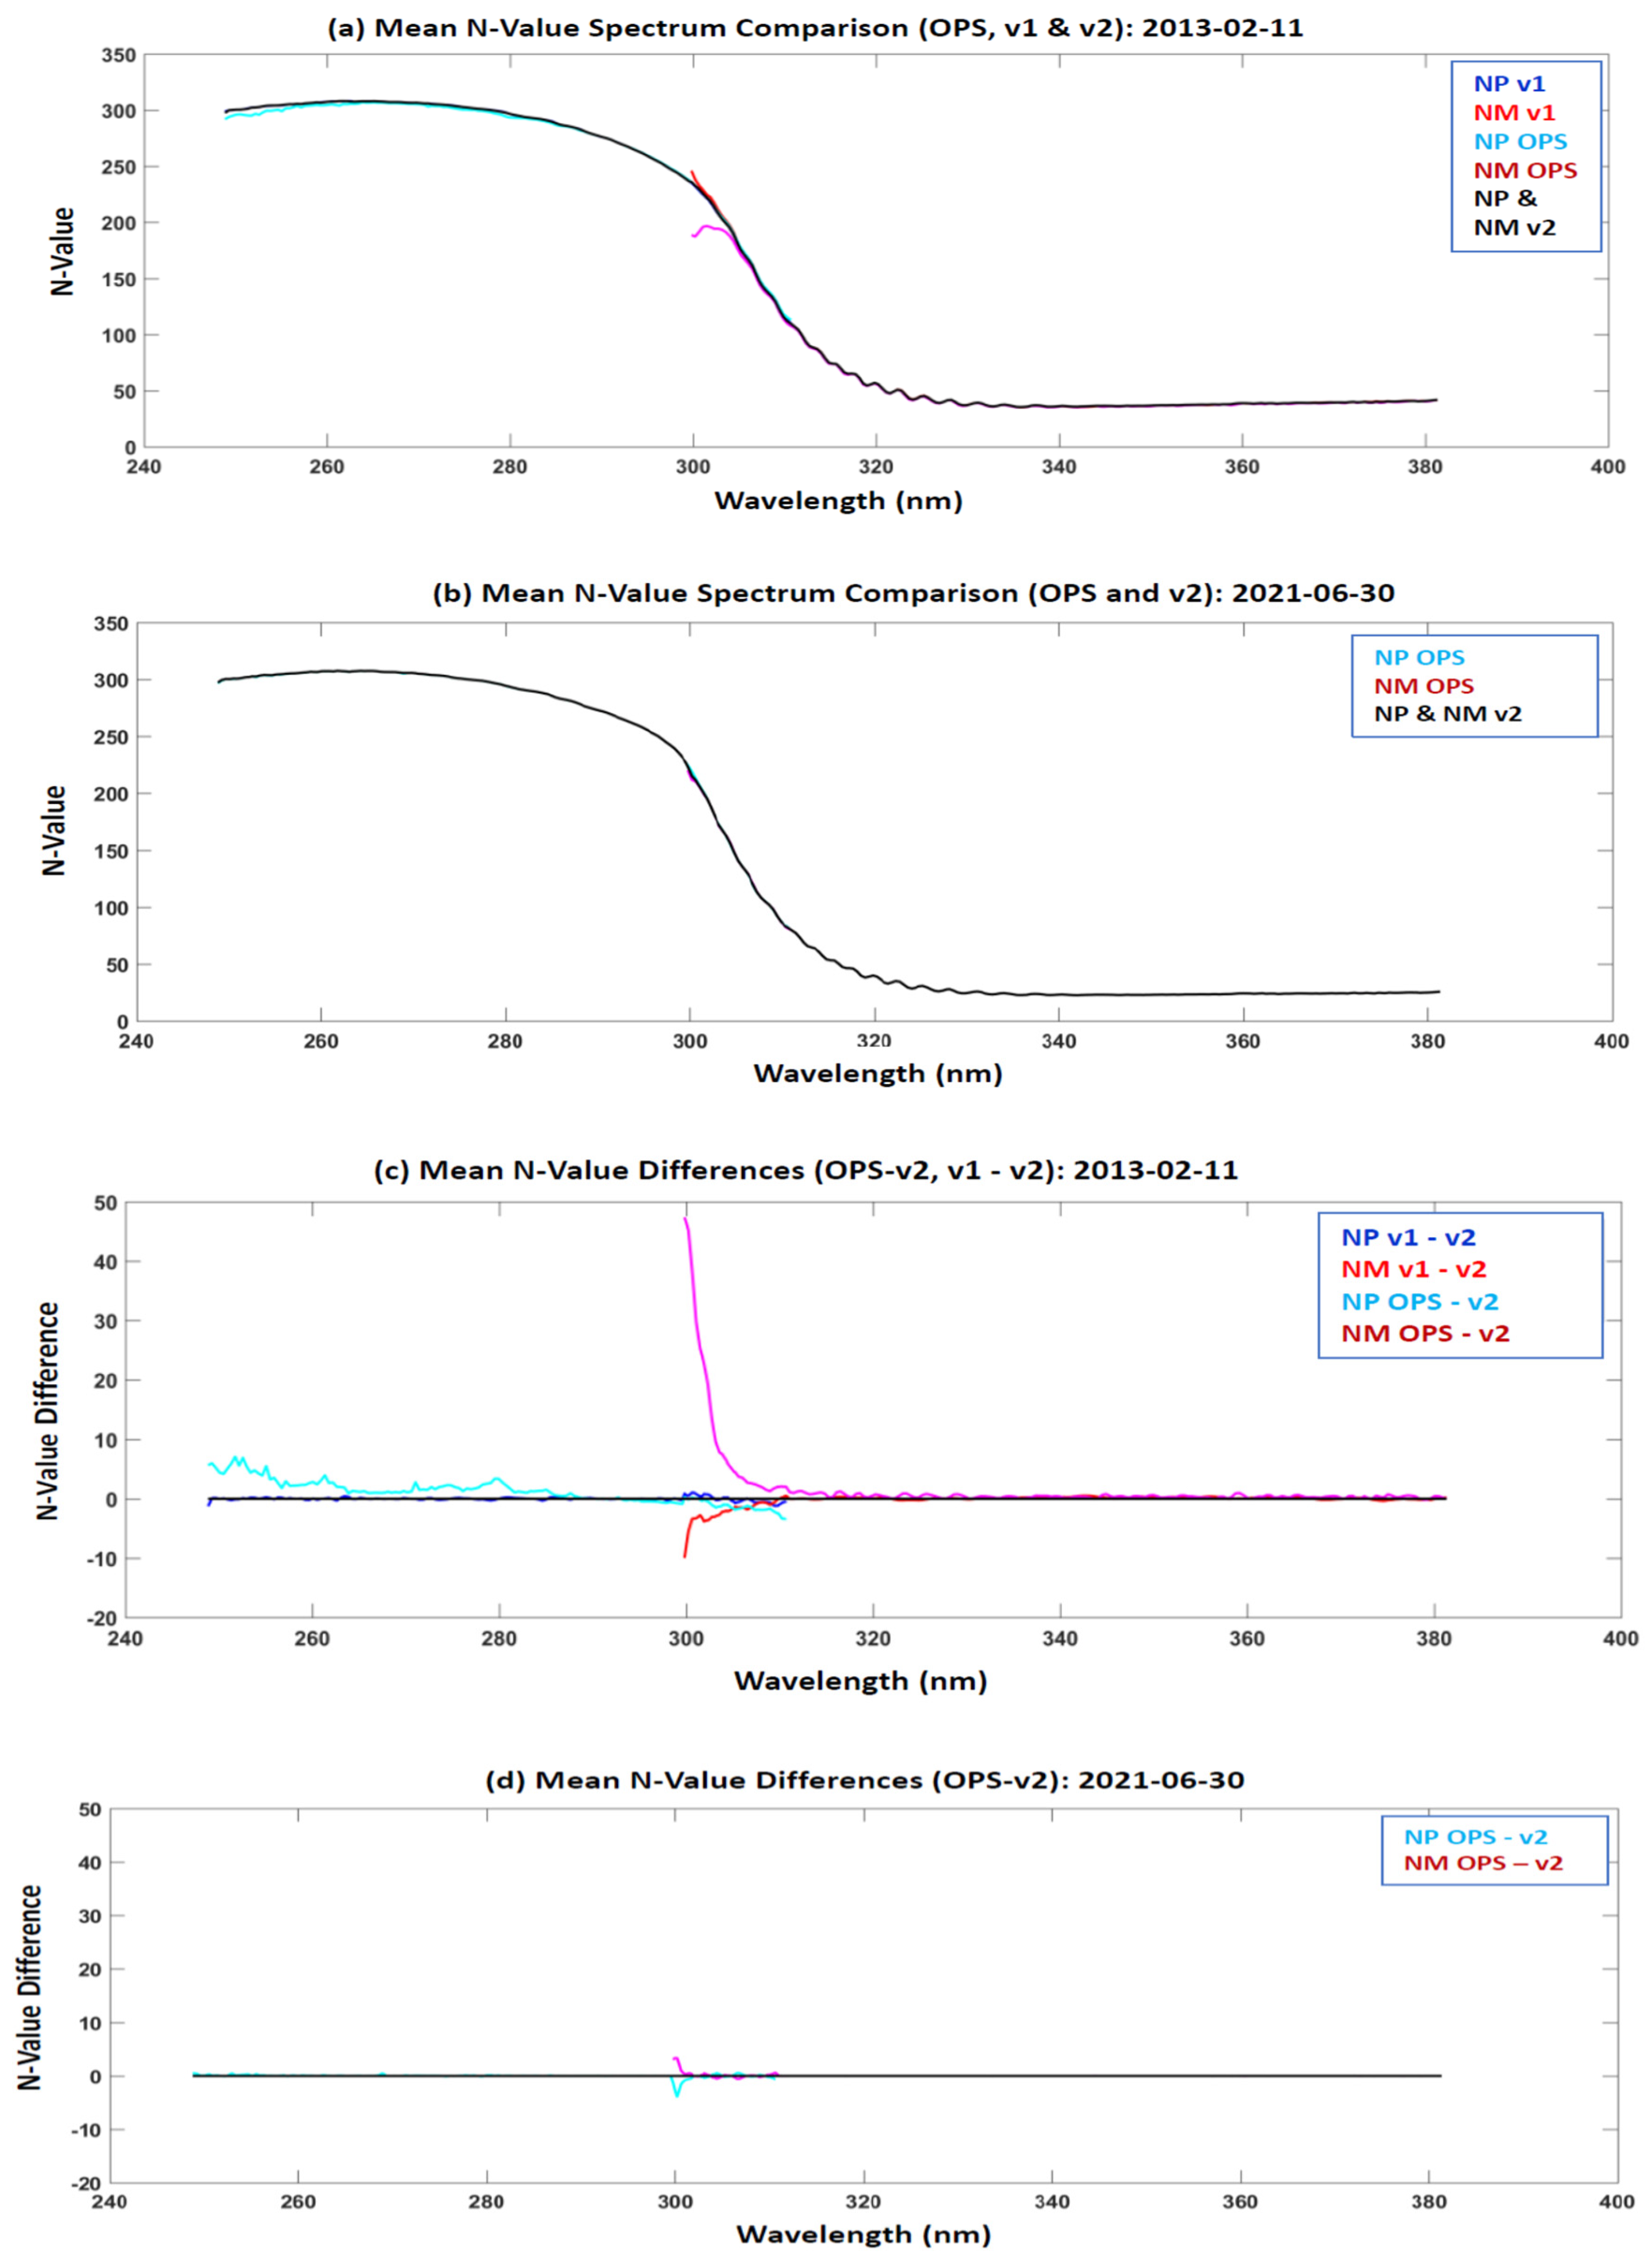
Similarly, we also evaluated the spectrum and spectrum differences of the N-value due to its significance in the ozone retrieval. By using the same data sources as the radiance analysis, Figure 15a,b display the averaged nadir N-value spectra from 250 nm through 380 nm, and Figure 15c,d provide their spectrum differences at the two dates. The conclusions are similar to the analysis for the normalized radiance in Figure 14. Over the dichroic wavelength range, a noticeable discrepancy is found between the OPS and the on the first date. This conclusion is also applicable to the comparison between the NM and NP for the OPS data set. Apparently, those consistencies are much improved at the second date when all used tables are well validated in the operational processing on the second date (30 June 2021). Generally, large N-value absolute discrepancies occur primarily within the wavelengths above 300 nm for the OPS data set. Compared with the operational data set, the exhibits a much-improved comparison with the data set, although the differences are still non-trivial (see Figure 15c). Those assessments are made for selecting two dates for a specific area. In reality, the discrepancies can change with scene conditions and day. Nevertheless, the presence of the discrepancies indicates the significance of using calibration-consistent calibration tables in the whole OMPS NM and NP processing. The uses of the calibration-consistent calibration tables not only improve the LT stability of each of OMPS NM and NP data set, but also advance the reliability of the data between the NM and NP within the dichroic range for each of the operational and data sets.
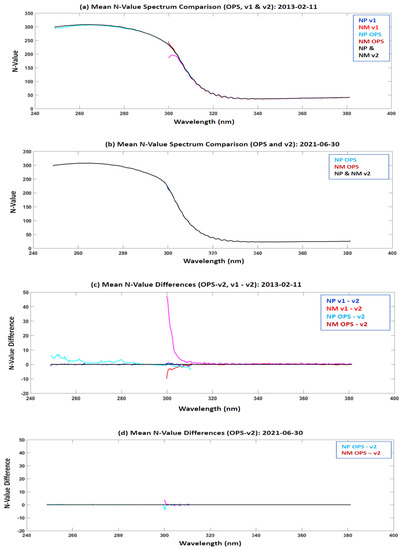
Figure 15.
Same as Figure 14 except for N-value. (a) Averaged N-value spectra using the three data sets (OPS, , and ) in combination of OMPS NM and NP together on 11 February 2013. (b) Same as (a) except for 30 June 2021. (c) Averaged N-value differences of the OPS or data sets from the data set on 11 February 2013. (d) Same as (c) except for 30 June 2021.
Overall, the above analysis has demonstrated that the new reprocessing can effectively remove jumps/drops of the averaged radiance/N-value that occurred in the operational data time series prior to 28 June 2021, producing a calibration-consistent mission-long SNPP OMPS NM SDR data set. Additionally, the new reprocessing significantly improves the uniformity of the NM and NP measurements within the dichroic wavelengths, thus leading to a consistent OMPS radiance spectrum from 250 to 380 nm. Compared with the data set, the operational data set prior to 28 June 2021 exhibits several jumps/drops of the daily averaged radiance/N-value in the time series for nadir pixels and off-nadir pixels. In addition, large discrepancies remain in the range between 300 to 310 nm for the NM and NP operational data set. Compared with the operational data set over the same period, the data set shows a better performance, although it still has non-trivial deviations in the radiance/N-value time series against the data set. This is especially true for off-nadir pixels due to large geolocation errors. Those discrepancies address the significance of using calibration accuracy-consistent calibration tables in the whole OMPS NM SDR data processing.
5. Conclusions and Summary
This study conducts version two reprocessing for SNPP OMPS NM and NP SDR data spanning from 25 January 2012 through to 30 June 2021 for the NP and from 30 January 2012 through to 30 June 2021 for the NM. The reprocessing consistently utilizes the validated maturity level of the calibration tables through the entire periods, which were derived through both the JPSS final review in 2015 and the latest improvements in the past couple of years. This study introduces four major improvements associated with the following calibration LUTs: bi-weekly dynamic solar LUTs for the wavelength shift for the NP, a newly updated stray light LUT with OOB correction for the NM, a dark processing code shift error correction for the NM, and an updated FAM LUT for the NM. Furthermore, the study assesses and compares the LT stability of the daily averaged radiance and N-value for each of the OMPS NM and NP among the three data sources: reprocessing, reprocessing in 2019, and the operational processing. Finally, we analyze the OMPS SDR normalized radiance and N-value spectra covering the shared NM and NP wavelengths for the three data sets by selecting two specific dates. Several important points are summarized below.
Firstly, each of those four improvements affect the quality of the SNPP OMPS NP and NM SDR data with a certain wavelength dependency. For the NP, biweekly solar LUTs are used to represent the wavelength shift changes of the Earth-view radiance with time for all NP wavelengths. Each of the solar LUTs in the reprocessing are derived using the raw flux measurements during the implementation weeks. Those timely raw flux data can consistently capture the wavelength shift features of the Earth-view radiance within the two weeks, thus more efficiently removing discrepancies in solar wavelength shift predictions. The other three improvements are established for NM. The new stray light LUT with OOB correction and the dark processing shift error correction affect the data quality more at shorter wavelengths than at longer wavelengths. However, the new FAM table affects all wavelengths for the OMPS NM off-nadir pixels, with geolocation errors of up to around 90 km for the most off-nadir pixels.
Secondly, version two reprocessing leads to a mission-long (over ten years) accuracy-consistent SNPP OMPS SDR data record in combination with the operational processing after June 2021. The accuracy-consistent calibration tables in the reprocessing are demonstrated to effectively remove jumps/drops in radiance/N-value that occurred in the operational data, thus producing an accuracy-consistent calibrated data set for each of the SNPP OMPS NP and NM. The daily averaged radiance or N-value show a relatively similar annual pattern from year to year with some exceptions. In addition, the accuracy-consistent calibration tables significantly improve the uniformity of the data in the dichroic wavelength range from 300 to 310 nm between the OMPS NM and NP. Importantly, the operational processed SNPP OMPS NP and NM SDR data since 28 June 2021 utilize the same calibration algorithms and calibration tables as the reprocessing, except for the dynamic updates of the solar wavelength (bi-weekly) tables for NP. In the operational processing, a prediction for the solar wavelength shift is used due to the use of the raw flux data two weeks earlier, with a negligible impact on the OMPS NP radiance calibration accuracy. Within this error range, this study has successfully generated a mission-long accuracy-consistent SNPP OMPS SDR data record. Presently, three data sets for SNPP OMPS NM and NP SDR have been archived in the NOAA CLASS, which is accessible to public users.
Thirdly, both the operational and data sets show certain unreliable variations at all OMPS channels in the whole time series of radiance, N-value, or normalized radiance. In particular, the operational data set exhibits significant jumps/drops in the time series due to updates of calibration tables in the whole processing (see Appendix B). The data set shows a better performance than the operational data set, but it still has certain inconsistent variations in the radiance/N-value when compared to the data set due to a lack of the newly updated LUTs after the final review. Generally, relative to the data set, large deviations occur at short wavelengths, where the Earth-view radiance is usually two or three orders smaller than those at high wavelengths. In addition, large absolute deviations occur at long wavelengths, which is especially true for off-nadir pixels. In addition, the non-optimized calibration tables increase the radiance discrepancies within the dichroic range between the NM and NP for the same data source (either the operational or data set).
Overall, mission-long accuracy-consistent SNPP OMPS NM and NP SDR datasets have been established by conducting a new reprocessing. The resultant daily averaged radiance or N-value show a relatively similar annual pattern from year to year, with some margins. This new calibration-consistent SNPP OMPS NM and NP SDR data record is expected to be able to improve the LT trend studies of OMPS radiance climate data records, OMPS EDR products, ozone climate reanalysis, and OMPS SDR data assimilation into NWP models. Nevertheless, the sensor degradation of the SNPP OMPS NP, which is found to be non-negligible, is not considered in the reprocessing in the OMPS NP to comply with the operational processing after June 2021. A separate study has been conducted about the LT photometric stability of the SNPP OMPS NM and NP sensor [50]. This analysis is particularly important in the light of the non-negligible sensor degradation for SNPP. Thus, a future reprocessing for the SNPP OMPS NP SDR would be desirable, particularly for climate trend analysis of the data. This is expected to happen close to the end life of the SNPP mission.
Author Contributions
Conceptualization, B.Y., C.P., T.B., L.F., A.Y. and L.Z.; methodology, B.Y., C.P., T.B., L.W., L.F. and C.-Z.Z.; software, C.P., T.B., X.J., L.W. and D.L.; validation, B.Y., C.P., T.B., L.W., J.C., J.H. and S.B.; formal analysis, C.P., T.B., X.J., D.L. and W.H.; investigation, B.Y., C.P., T.B. and L.W.; resources, A.Y. and L.Z.; data curation, T.B., C.P., X.J., N.S. and L.L.; writing—B.Y.; writing—review and editing, B.Y., L.F., C.P., C.-Z.Z., A.Y. and L.L.; visualization, X.J., J.C., L.W. and T.B.; supervision, B.Y.; project administration, B.Y.; funding acquisition, B.Y. All authors have read and agreed to the published version of the manuscript.
Funding
This study is sponsored by the JPSS program.
Data Availability Statement
The operational SNPP OMPS NM and NP SDR data sets are available in the NOAA Comprehensive Large Array-data Stewardship System (CLASS) by searching ‘JPSS OMPS Sensor Data Record Operational (OMPS_SDR)’ with the link: https://www.avl.class.noaa.gov/saa/products/search?sub_id=0&datatype_family=OMPS_SDR&submit.x=25&submit.y=8, 23 October 2012. The and reprocessed OMPS data sets are available in the CLASS by searching ‘JPSS OMPS Sensor Data Record Reprocessed (RPOMPSSDR)’ with the link: https://www.avl.class.noaa.gov/saa/products/search?sub_id=0&datatype_family=RPOMPSSDR&submit.x=22&submit.y=7, 16 March 2022. The raw flus measurement data used in this study are provided in the NASA’s Ozone Mapping and Profiler Suite (OMPS)’s Science Investigator-led Processing Systems (SIPS) (https://earthdata.nasa.gov/eosdis/sips/ozone-sips, 18 June 2022).
Acknowledgments
Initial versions of the calibration tables for the SNPP OMPS SDR processing are shared by the NASA OMPS group (courtesy of Glen Jaross). Thanks are given to Glen Jaross for giving valuable opinions during the work, as well as to Q. Liu and Y. Chen for support of the VCRTM. Thanks finally go to the anonymous reviewers from the STAR office and the journal reviewers for their valuable comments. The contents in this manuscript are solely the opinions of the authors and do not constitute a statement of policy, decision, or position on behalf of NOAA or the U. S. Government.
Conflicts of Interest
The authors declare no conflict of interest.
Appendix A. Timelines of Implementation of SNPP OMPS Calibration LUTs into the IDPS Operational SDR Processing

Table A1.
Timeline for the S-NPP/OMPS/NP calibration LUTs updates.
Table A1.
Timeline for the S-NPP/OMPS/NP calibration LUTs updates.
| Weekly Dark Current calibration started | 12 February 2013 |
| Stray light calibration LUT update | 18 March 2014 |
| Wavelength calibration LUT updates | 26 June 2012, 22 July 2012, 19 August 2012, 23 October 2014, 9 September 2015 |
| Solar LUT updates prior to the regular update | 17 July 2012, 9 September 2015, 20 April 2017 |
| Wavelength calibration LUT biweekly update started | 20 April 2017 |

Table A2.
Timeline for the S-NPP/OMPS/NM calibration LUTs updates.
Table A2.
Timeline for the S-NPP/OMPS/NM calibration LUTs updates.
| Weekly Dark Current calibration started | 21 December 2012 |
| Stray light calibration LUT updates | 10 July 2013, 20 August 2013, 21 November 2014, 18 December 2014, 9 September 2015, 9 July 2018 |
| Observed Solar LUT update Wavelength calibration LUT update | 13 November 201 |
| Solar LUT update Wavelength calibration LUT update Calibration constant update | 9 September 2015 |
| TC dark shift code error correction (DR9172) that can affect each pixel, with large differences occurring every orbit where the signal level drops to a very low level | 30 March 2020 |
| A new empirical Field Angle Map (FAM) LUT to correct nadir off-geolocation errors | 28 June 2021 |
Appendix B. Scientific Requirements of OMPS NM and NP SDR Data

Table A3.
SNPP OMPS NM SDR requirements or allocation.
Table A3.
SNPP OMPS NM SDR requirements or allocation.
| Variable | Requirement/Allocation |
|---|---|
| Wavelength range | 300–380 |
| Horizontal cell size | 50 km × 50 km @ nadir |
| Signal-to-Noise Ratio (SNR) | Vary with wavelength |
| Irradiance uncertainty | <7% |
| Wavelength registration accuracy | <0.01 nm |
| Intra-orbital wavelength variation | <0.01 nm |
| Radiance uncertainty | <8% |
| OOB Stray Light | <10% |
| Maximum Albedo Calibration | <2% |
| Geolocation Error | ≤25 km @nadir |

Table A4.
SNPP OMPS NP SDR requirements or allocation.
Table A4.
SNPP OMPS NP SDR requirements or allocation.
| Variable | Requirement/Allocation |
|---|---|
| Wavelength range | 250–310 |
| Horizontal cell size | 250 km × 250 km @ nadir |
| SNR | Vary with wavelength |
| Irradiance uncertainty | <7% |
| Wavelength calibration | <0.01 nm |
| Intra-orbital wavelength variation | <0.01 nm |
| Radiance uncertainty | <8% |
| Maximum Albedo Calibration | <2% |
| OOB Stray Light | <5% |
| Geolocation Error | ≤50 km @nadir |
References
- Dittman, M.G.; Ramberg, E.; Chrisp, M.; Rodriguez, J.V.; Sparks, A.L.; Zaun, N.H.; Hendershot, P.; Dixon, T.; Philbrick, R.H.; Wasinger, D. Nadir ultraviolet imaging spectrometer for the NPOESS Ozone Mapping and Profiler Suite (OMPS). In Proceedings of the International Symposium on Optical Science and Technology, Seattle, WA, USA, 24 September 2002; Volume 4814. Earth Observing Systems VII. [Google Scholar] [CrossRef]
- Rodriguez, J.V.; Seftor, C.J.; Wellemeyer, C.G.; Chance, K. An overview of the nadir sensor and algorithms for the NPOESS Ozone Mapping and Profiler Suite (OMPS). Proc. SPIE 2003, 4891, 65–76. [Google Scholar]
- Remund, Q.P.; Newell, D.; Rodriguez, J.V.; Asbury, S.; Jaross, G. The Ozone Mapping and Profiler Suite (OMPS): On-orbit calibration design. Proc. SPIE 2004, 5652, 165–173. [Google Scholar]
- Jaross, G.; Bhartia, P.K.; Chen, G.; Kowitt, M.; Haken, M.; Chen, Z.; Xu, P.; Warner, J.; Kelly, T. OMPS Limb Profiler instrument performance assessment. J. Geophys. Res. Atmos. 2014, 119, 4399–4412. [Google Scholar] [CrossRef] [Green Version]
- Pan, C.; Kowalewski, M.; Buss, R.; Flynn, L.; Wu, X.; Caponi, M.; Weng, F. Performance and Calibration of the Nadir Suomi-NPP Ozone Mapping Profiler Suite from Early-Orbit Images. IEEE J. Sel. Top. Appl. Earth Obs. Remote Sens. 2013, 6, 1539–1551. [Google Scholar] [CrossRef]
- Seftor, C.J.; Jaross, G.; Kowitt, M.; Haken, M.; Li, J.; Flynn, L.E. Postlaunch performance of the Suomi National Polar-orbiting Partnership Ozone Mapping and Profiler Suite (OMPS) nadir sensors. J. Geophys. Res. Atmos. 2014, 119, 4413–4428. [Google Scholar] [CrossRef] [Green Version]
- Wu, X.; Liu, Q.; Zeng, J.; Grotenhuis, M.; Qian, H.; Caponi, M.; Flynn, L.; Jaross, G.; Sen, B.; Buss, R.H.; et al. Evaluation of the sensor data record from the nadir instruments of the Ozone Mapping Profiler Suite (OMPS). J. Geophys. Res. Atmos. 2014, 119, 6170–6180. [Google Scholar] [CrossRef] [Green Version]
- Pan, C.; Flynn, L.; Buss, R.; Wu, X.; Yu, W.; Grotenhuis, M. Performance Monitoring of the S-NPP Ozone Mapping and Profiler Suite’s Sensor Data Records. IEEE J. Sel. Top. Appl. Earth Obs. Remote Sens. 2014, 7, 1763–1770. [Google Scholar] [CrossRef]
- Pan, C.; Flynn, L. Solar observation of Ozone Mapping and Profiler Suite nadir system during the first 3 years of on-orbit operation. J. Appl. Remote Sens. 2015, 9, 94095. [Google Scholar] [CrossRef]
- Pan, C.; Weng, F.; Flynn, L. Spectral Performance and Calibration of the Suomi NPP OMPS Nadir Profiler Sensor. Earth Space Sci. 2017, 4, 737–745. [Google Scholar] [CrossRef]
- Pan, C.; Zhou, L.; Cao, C.; Flynn, L.; Beach, E. Suomi-NPP OMPS Nadir Mapper’s Operational SDR Performance. IEEE Trans. Geosci. Remote Sens. 2019, 57, 1015–1024. [Google Scholar] [CrossRef]
- Pan, C.; Yan, B.; Cao, C.; Flynn, L.; Xiong, X.; Beach, E.; Zhou, L. Performance of OMPS Nadir Profilers’ Sensor Data Records. IEEE Trans. Geosci. Remote Sens. 2020, 59, 6885–6893. [Google Scholar] [CrossRef]
- Peyush, J.; Gyanesh, C. 2015: Overview of the JPSS GRAVITE System, 2015 JPSS Annual Review. Available online: https://www.star.nesdis.noaa.gov/star/documents/meetings/2015JPSSAnnual/dayFive/04_Session8_Jain_GRAVITE%20Overview.pdf (accessed on 26 August 2015).
- McNitt, J. 2017: Overview of NOAA NESDIS Direct Readout Services. Available online: https://www.ssec.wisc.edu/meetings/cspp/2017/presentations/day2/6_CSPP%20Users_McNitt_062617.pdf (accessed on 6 June 2022).
- Flynn, L.; Long, C.; Wu, X.; Evans, R.L.; Beck, C.T.; Petropavlovskikh, I.; Mcconville, G.; Yu, W.; Zhang, Z.; Niu, J.; et al. Performance of the Ozone Mapping and Profiler Suite (OMPS) products. J. Geophys. Res. Atmos. 2014, 119, 6181–6195. [Google Scholar] [CrossRef]
- Flynn, L. Atmospheric Chemistry Products from the Ozone Mapping and Profiler Suite (OMPS). Validation and Applications. In Proceedings of the NOAA Satellite Conference 2015, Greenbelt, MD, USA, 27 April–1 May 2005. [Google Scholar]
- Flynn, L.; Petropavlovskikh, I.; Long, C.; Beck, T.; Niu, J.; Beach, E.; Zhang, Z.; Caponi, M.; Sen, B. Science Maturity Review for OMPS Total Column Ozone EDR–V8TOz, August 2015. Available online: https://www.star.nesdis.noaa.gov/jpss/documents/AMM/NPP/OMPS_Ozone_TC_Val.pdf (accessed on 6 June 2022).
- Flynn, L.; Petropavlovskikh, I.; Long, C.; Beck, T.; Niu, J.; Beach, E.; Zhang, Z.; Caponi, M.; Sen, B. Science Maturity Review for OMPS Total Column Ozone EDR– V8Pro, August 2015. Available online: https://www.star.nesdis.noaa.gov/jpss/documents/AMM/NPP/OMPS_Ozone_NP_Val.pdf (accessed on 6 June 2022).
- Niu, J.; Flynn, L.E.; Beck, T.; Zhang, Z.; Beach, E. Evaluation and Improvement of the Near-Real-Time Linear Fit SO2 Retrievals from Suomi NPP Ozone Mapping and Profiler Suite. IEEE Trans. Geosci. Remote Sens. 2021, 59, 101–113. [Google Scholar] [CrossRef]
- McPeters, R.; Frith, S.; Kramarova, N.; Ziemke, J.; Labow, G. Trend quality ozone from NPP OMPS: The version 2 processing. Atmos. Meas. Tech. 2019, 12, 977–985. [Google Scholar] [CrossRef] [Green Version]
- Kramarova, N.A.; Nash, E.R.; Newman, P.A.; Bhartia, P.K.; McPeters, R.D.; Rault, D.F.; Seftor, C.J.; Xu, P.Q.; Labow, G.J. Measuring the Antarctic ozone hole with the new Ozone Mapping and Profiler Suite (OMPS). Atmos. Chem. Phys. 2014, 14, 2353–2361. [Google Scholar] [CrossRef] [Green Version]
- Li, C.; Joiner, J.; Krotkov, N.A.; Dunlap, L. A new method for global retrievals of HCHO total columns from the Suomi National Polar-orbiting Partnership Ozone Mapping and Profiler Suite. Geophys. Res. Lett. 2015, 42, 2515–2522. [Google Scholar] [CrossRef]
- Yang, K.; Dickerson, R.R.; Carn, S.A.; Ge, C.; Wang, J. First observations of SO 2 from the satellite Suomi NPP OMPS: Widespread air pollution events over China. Geophys. Res. Lett. 2013, 40, 4957–4962. [Google Scholar] [CrossRef] [Green Version]
- Yang, K.; Carn, S.A.; Ge, C.; Wang, J.; Dickerson, R.R. Advancing measurements of tropospheric NO2 from space: New algorithm and first global results from OMPS. Geophys. Res. Lett. 2014, 41, 4777–4786. [Google Scholar] [CrossRef]
- Abad, G.G.; Vasilkov, A.; Seftor, C.; Liu, X.; Chance, K. Smithsonian Astrophysical Observatory Ozone Mapping and Profiler Suite (SAO OMPS) formaldehyde retrieval. Atmos. Meas. Tech. 2016, 9, 2797–2812. [Google Scholar] [CrossRef] [Green Version]
- Dunlap, L. An Overview of The Ozone Mapping and Profiler Suite (OMPS) And Its Science Products. Master’s Thesis, University of Maryland, College Park, MD, USA, 2015. [Google Scholar]
- Zhou, L.; Divakarla, M.; Liu, X.; Layns, A.; Goldberg, M. An Overview of the Science Performances and Calibration/Validation of Joint Polar Satellite System Operational Products. Remote Sens. 2019, 11, 698. [Google Scholar] [CrossRef] [Green Version]
- Liu, Q.; Cao, C.; Grassotti, C.; Liang, X.; Chen, Y. Experimental OMPS Radiance Assimilation through One-Dimensional Variational Analysis for Total Column Ozone in the Atmosphere. Remote Sens. 2021, 13, 3418. [Google Scholar] [CrossRef]
- Wu, X.; Jaross, G.; Sen, B.; Caponi, M.; Cumpton, D. JPSS Validated Maturity Review for SNPP OMPS SDR Earth View Products, August 17, 2015. Available online: https://www.star.nesdis.noaa.gov/jpss/documents/AMM/NPP/OMPS_SDR_Val.pdf (accessed on 6 June 2022).
- DelFierro, A.D.; Kilcoyne, H. Joint Polar Satellite System (JPSS) Ground Segment Data Product Specification (GSegDPS), JPSS GS Systems Engineering, 474-01543, Revision A, October 2019 Electronic Approval. Available online: https://jpssmis.gsfc.nasa.gov/frontmenu_dsp.cfm (accessed on 6 June 2022).
- Lauderdale, J. Joint Polar Satellite System (JPSS) Program Multi Mission System Specification (MMSS) Level 2 Requirements, JPSS-REQ-1005/470-00101, Version 3.0 Joint Polar Satellite System (JPSS) Code 470; Goddard Space Flight Center: Greenbelt, MD, USA, 2020. [Google Scholar]
- Pan, C.; Weng, F. OMPS SDR Overview. In Proceedings of the STAR JPSS Annual Science Team Meeting, College Park, MD, USA, 8–12 August 2016. [Google Scholar]
- Zou, C.-Z.; Zhou, L.; Lin, L.; Sun, N.; Chen, Y.; Flynn, L.E.; Zhang, B.; Cao, C.; Iturbide-Sanchez, F.; Beck, T.; et al. The Reprocessed Suomi NPP Satellite Observations. Remote Sens. 2020, 12, 2891. [Google Scholar] [CrossRef]
- Beck, T.; Flynn, L.; Pan, C.; Dunlap, L. Error in OMPS Nadir Mapper dark count correction. In Proceedings of the JPSS NOAA JPSS Discrepancy Report Action Team (DRAT) Weekly Meeting, Virtual, 8 January 2020. ADR00009172. [Google Scholar]
- Pan, C.; Yan, B.; Flynn, L.; Beck, T.; Wang, L.; Huang, J.; Huang, L. Recent improvements to NOAA-20 Ozone Mapper Profiler Suit Nadir Profiler Sensor Data Records. In Proceedings of the IGARSS Virtual Conference, Brussels, Belgium, 12–16 July 2021. [Google Scholar]
- Wang, L.; Pan, C.; Yan, B.; Beck, T.; Chen, J.; Zou, L.; Goldberg, M. A Method of Geolocation Assessment and Optimization for OMPS Nadir Mapper Using Visible Infrared Imaging Radiometer Suite (VIIRS). In Proceedings of the 102nd AMS Annual Meeting, Houston, TX, USA, 23–27 January 2022. [Google Scholar]
- Yan, B.; Pan, C.; Beck, T.; Jin, X.; Wang, L.; Liang, D.; Flynn, L.; Chen, J.; Huang, J.; Buckner, S.; et al. Reprocessing of Sensor Data Records from OMPS Nadir Mapper and Nadir Profiler onboard Suomi NPP Satellite: Improvements and LT Performance Analysis. In Proceedings of the 102nd AMS Meeting, Houston, TX, USA, 23–27 January 2022. [Google Scholar]
- Seftor, C.; Tiruchirapalli, R. SNPP/N20 NM OMPS Geolocation: Analysis of error, Development of correction, Results after application of correction. In Proceedings of the NASA Ozone Processing Team (OPT) Meeting, Greenbelt, MD, USA, 21 June 2020. [Google Scholar]
- McPeters, R.D.; Bhartia, P.K.; Krueger, A.J.; Herman, J.R.; Schlesinger, B.M.; Wellemeyer, C.G.; Seftor, C.J.; Jaross, G.T.; Steven, L.S.; Swissler, T.; et al. Nimbus-7 TOMS Ozone Mapping Spectrometer (TOMS) Data Products User’s Guide; NASA Reference Publication 1384; NASA: Washington, DC, USA, 1996. [Google Scholar]
- Fleig, A.J. Nimbus 7 Solar Backscatter Ultraviolet (SBUV) Ozone Products User’s Guide; NASA Reference Publication 1234; NASA: Washington, DC, USA, 1990. [Google Scholar]
- Flynn, L. Findings for the OMPS Nadir Mapper 1st Guess Total Column Ozone (INCTO) & Nadir Mapper Total Column Ozone EDR (OOTCO) in Support of Promotion to Provisional Maturity, JPSS Science Provisional Maturity Review. 16 March 2013. Available online: https://www.star.nesdis.noaa.gov/jpss/documents/AMM_All/OMPS_Ozone/Provisional/OMPSTCEDRProvisionalRequestBriefing_pp.pptx (accessed on 6 June 2022).
- Pan, C.; Flynn, L.; Wu, X.; Buss, R. Suomi National Polar-orbiting Partnership Ozone Mapping Profiler Suite Nadir instruments in-flight performance. J. Appl. Remote Sens. 2014, 8, 83499. [Google Scholar] [CrossRef]
- Joint Polar Satellite System (JPSS). OMPS Nadir Profile Ozone Algorithm Theoretical Basis Document (ATBD); JPSS Ground Project Code 474-00026; Goddard Space Flight Center: Greenbelt, MD, USA, 2014. [Google Scholar]
- Joint Polar Satellite System (JPSS). OMPS NADIR Total Column Ozone Algorithm Theoretical Basis Document (ATBD); JPSS Ground Project Code 474-00029; Goddard Space Flight Center: Greenbelt, MD, USA, 2014. [Google Scholar]
- Stephen, C.B.; Geir, K.; James, L. Systems Engineering Report IN0092CAL2-025, OMPS J1 Nadir Sensor Pre-Launch Radiometric Calibration Uncertainties; Ball Aerospace & Technologies Corp.: Boulder, CO, USA, 2014. [Google Scholar]
- Pan, C.; Yan, B.; Flynn, L.; Beck, T.; Jin, X.; Buckner, S. Ozone Mapper Profiler Suite Nadir profiler degradation. In Proceedings of the Kuala Lumpur Convention Centre (KLCC), Kuala Lumpur, Malaysia, 17–22 July 2022. [Google Scholar]
- Liu, Q.; Cao, C. Analytic expressions of the Transmission, Reflection, and source function for the community radiative transfer model. J. Quant. Spectrosc. Radiat. Transf. 2019, 226, 115–126. [Google Scholar] [CrossRef]
- Chen, G.; Jaross, G. SNPP OMPS nadir instruments stray light corrections. In STAR JPSS Annual Science Team Meeting. 2014. Available online: https://www.star.nesdis.noaa.gov/star/documents/meetings/2014JPSSAnnual/dayTwo/04_Session4c_Chen_Stray_Light_Correction.pdf (accessed on 6 June 2022).
- Pan, C.; Yan, B.; Beck, T.; Dunlap, L.; Seftor, C.; Jaross, G.; Flynn, L. Off Nadir Geolocation Error Analysis. In Proceedings of the NOAA JPSS Discrepancy Report Action Team (DRAT) Weekly Meeting, Virtual, 13 July 2020. [Google Scholar]
- Pan, C.; Yan, B.; Flynn, L.; Beach, E.; Beck, T.; Buckner, S.; Liang, D.; Jin, X.; Young, A. 10-Year Performance Evaluation of Suomi-NPP OMPS Nadir Sensors. IEEE Trans. Geosci. Remote Sens. 2022; submitted. [Google Scholar]
Publisher’s Note: MDPI stays neutral with regard to jurisdictional claims in published maps and institutional affiliations. |
© 2022 by the authors. Licensee MDPI, Basel, Switzerland. This article is an open access article distributed under the terms and conditions of the Creative Commons Attribution (CC BY) license (https://creativecommons.org/licenses/by/4.0/).

