Article

Adaptive DDK Filter for GRACE Time-Variable Gravity Field with a Novel Anisotropic Filtering Strength Metric

1
School of Environment Science and Spatial Informatics, China University of Mining and Technology, Xuzhou 221116, China
2
Department of Geoscience and Remote Sensing, Delft University of Technology, 2628 CN Delft, The Netherlands
3
School of Geodesy and Geomatics, Wuhan University, Wuhan 430079, China
4
Department of Earth and Space Sciences, Southern University of Science and Technology, Shenzhen 518055, China
*
Author to whom correspondence should be addressed.
Remote Sens. 2022, 14(13), 3114; https://doi.org/10.3390/rs14133114
Submission received: 2 June 2022 / Revised: 23 June 2022 / Accepted: 25 June 2022 / Published: 28 June 2022
(This article belongs to the Section Earth Observation Data)

Abstract

:
Filtering for GRACE temporal gravity fields is a necessary step before calculating surface mass anomalies. In this study, we propose a new denoising and decorrelation kernel (DDK) filtering scheme called adaptive DDK filter. The involved error covariance matrix (ECM) adopts nothing but the monthly time-variable released by several data centers. The signal covariance matrix (SCM) involved is monthly time-variable also. Specifically, it is parameterized into two parameters, namely the regularization coefficient and the power index of signal covariances, which are adaptively determined from the data themselves according to the generalized cross validation (GCV) criterion. The regularization coefficient controls the global constraint on the signal variances of all degrees, while the power index adjusts the attenuation of the signal variances from low to high degrees, namely local constraint. By tuning these two parameters for the monthly SCM, the adaptability to the data and the optimality of filtering strength can be expected. In addition, we also devise a half-weight polygon area (HWPA) of the filter kernel to measure the filtering strength of the anisotropic filter more reasonably. The proposed adaptive DDK filter and filtering strength metric are tested based on CSR GRACE temporal gravity solutions with their ECMs from January 2004 to December 2010. Results show that the selected optimal power indices range from 3.5 to 6.9, with the corresponding regularization parameters range from 1 × 10¹⁴ to 5 × 10¹⁹. The adaptive DDK filter can retain comparable/more signal amplitude and suppress more high-degree noise than the conventional DDK filters. Compared with the equivalent smoothing radius (ESR) of filtering strength, the HWPA has stronger a distinguishing ability, especially when the filtering strength is similar.

1. Introduction

The GRACE mission can recover monthly time-variable gravity fields. The recovery performance is not uniform either in the space domain or in the (spherical harmonic) spectral domain [1,2,3]. In the spectral domain, the noise increases with degree in general, resulting in the so-called high-frequency errors. In the space domain, the north–south stripe error pattern is often apparent in unconstrained level-2 products. The error covariance matrix (ECM), made available by more and more processing centers, can consistently reflect the level of both kinds of errors. Specifically, the increasing-with-degree variances, namely the diagonal elements of the ECM, reflect the high-frequency errors; while the weak correlations between different orders and the strong correlations within the same order/parity reflect the stripe errors. The empirical decorrelation filter can be regarded as a method exploiting the latter fact [4,5,6].
Prior knowledge can aid in reducing the noise in GRACE level-2 products. One such knowledge is the fact that the signal magnitudes of the spherical harmonic (SH) coefficients decrease with the degree. As the signals decrease while the noise increases with degree, it is natural to shrink higher-degree GRACE level-2 SH coefficients to a larger extent. The Gaussian filtering exactly follows this rationale [7,8]. This prior knowledge can be coded in a variable called the signal covariance matrix (SCM). By combining both the ECM and the SCM through a regularization/inversion framework, we can reduce both kinds of errors [9,10]. This methodology, often called DDK filtering, has clear statistical meanings [11]. There are several different variates of DDK-type filters in the literature [11,12,13]. The differences are mainly due to the different selections of the SCM. The SCM can be diagonal either in the spectral domain [9,11,12] or in the spatial domain [13]. The SCM can be obtained either from prior geophysical models [11] or from the data to be filtered [9,12,13]. The dependence of the SCM and hence the DDK filter on the data means that it is a data-adaptive method.
The data-adaptive DDK filtering design can be viewed as a modeling problem with both the SH coefficients (functional model parameters) and the SCM (stochastic model parameters) as unknowns to be estimated using the same data set. The SCM should be parameterized appropriately in order to avoid overfitting/underfitting (with too many/few unknowns) in the modeling. However, it is unaffordable to determine each element of SCM, even when a diagonal structure is assumed. In our understanding, the rather fast convergence of the method proposed in [13] should be due to the inclusion of too many variance components to be determined in the SCM. On the other hand, the SCM is often assumed to be a known matrix but scaled with an unknown scalar (regularization parameter). The inverse of this known matrix is exactly the so-called regularization matrix and it is often assumed to be a diagonal structure. The known matrix can be simply assumed as identity, if no further prior information is available. The diagonal elements, namely the (scaled) variance can also be assumed to follow a degree-wise power law following Kaula’s rule, from an external geophysical model [9], or the data themselves [12]. Kaula’s rule [14] is regarded as having many physical backgrounds, however, it is still an empirical model, and a predefined power index may not necessarily be consistent with a specific data set. It is possible that when inappropriately used, the Kaula’s rule can be inferior even to the naïve Tikhonov regularization, namely with an identity regularization matrix [15]. The discussions in the above refer to two limit cases, namely one with too many unknowns in the SCM and the other with too few. An intermediate should be beneficial.
In this work, we follow the adaptive and monthly variable strategy as in [15,16]. Rather than determining an unknown for each degree, we only determine two unknown hyperparameters for one month, namely a regularization parameter and a power index. We consider the power law of the signal variances to be satisfactory in general, but the power indices are permitted to vary from month to month. This should be viewed as a better balance between simplicity and flexibility. To alleviate the computational load (recalling the non-convexity of the whole estimation problem), we select appropriate hyperparameters by trial and error, according to the generalized cross validation (GCV) criterion.

2. Materials and Methods

We present the methodology for a single month. It is the same for other months. Denote the SH coefficients to be filtered as a vector x. Note that it is referred to as the residual variables, since a time-mean for time-variable gravity field solutions has been removed. The corresponding monthly error covariance matrix, denoted as Q, is also available. The task is to design a DDK-type filter, denoted as F, and then compute the filtered solution as x ^ = F x , which is the estimate of x. The SCM, needed to design the filter, is simultaneously determined in the filtering process.

2.1. Regularization Strategies

Let the unscaled SCM be denoted as RA. The subscript A, standing for Adaptive, is introduced to distinguish our proposed method from others. We have r l = l p , where r denotes a diagonal element of RA, l denotes degree, and p denotes the power index that is to be determined. Let λA represent the regularization parameter which corresponds to scaling the SCM. For each given pair of λA and p, the filtered variable is defined as the following:
x ^ A = argmin x ^ x x ^ T Q 1 x x ^ + λ A x ^ T R A 1 x ^ = F A x ,
where the DDK filtering matrix (in the spectral domain) is defined accordingly as:
F A = Q 1 + λ A R A 1 1 Q 1 = Q λ A Q λ A Q + R A 1 Q Q 1 = I λ A Q λ A Q + R A 1 ,
and the best pair of λA and p is selected to minimize the following GCV index [17,18]:
G C V p , λ A = x x ^ T Q 1 x x ^ 1 Tr Q 1 + λ A R A 1 1 Q 1 / n t 2 = x x ^ T Q 1 x x ^ 1 Tr I λ A Q λ A Q + R A 1 / n t 2 .
The proposed method is to be compared with the conventional DDK filters, including stationary DDK in [9] and the VADER filter in [12]. For stationary DDK, the time-invariable power index p is usually taken as 4, while for the VADER filter, the time-variable signal variances are cyclo-stationary, modeled as (a · lb)2, with a, b being different from each calendar month. In the following Section 3.1, we provide the values of a and b for VADER filter. The unknowns of the filtered SH coefficients and the regularization parameters will be determined in the same way as the proposed adaptive method (namely using the GCV criterion). The corresponding DDK filtering matrix is determined in the same way as in (2).

2.2. Variance and Covariance Analysis

The error covariance Q is often inconsistent, more often overestimating the accuracy than underestimating it. For example, leakage error and truncation error cannot be captured in Q. We can simply scale the covariance with a scalar to account for this problem. This scalar is often called the variance component, denoted as σ2. This variance component does not affect the filtered solution as shown in Equation (1), because it has already been absorbed into the regularization parameter [19]. However, in some accuracy assessments, e.g., global noise standard deviation estimation [20,21], this variance component is needed. The variance component and the regularization parameters can be estimated simultaneously with variance component estimation approaches [22,23]. However, we estimate the regularization parameter and the variance component separately. This is rational because the variance component does not affect the estimation of the SH parameters. After an appropriate regularization parameter and an appropriate power index are selected, we treat them as knowns. Then the posterior estimate of the variance component is expressed as:
σ ^ j 2 = R S S j + λ j x ^ j T R j 1 x ^ j n ,
where RSS is the residual squared sum term x x ^ T Q 1 x x ^ ; the subscript j denotes A (adaptive DDK), D (conventional DDK), and V (VADER filter); n is the length of the parameter x. This estimate is obtained by viewing the constraints implied by the regularization term as pseudo measurements. Then the SCM is scaled accordingly, expressed as:
S j = λ j 1 σ ^ j 2 R j .
Besides the above variance analysis, the covariance of the filtered variable may also be needed in some situations, e.g., the uncertainty evaluation of filtered mass anomalies. Two approaches can be followed to provide such a covariance matrix. The first is obtained from a Bayesian viewpoint, namely viewing the solution as a maximum a posteriori (MAP) estimate [24]. The covariance matrix is expressed as:
Q j = σ ^ j 2 Q 1 + λ j R j 1 1 = σ ^ j 2 Q λ j σ ^ j 2 Q λ j Q + R j 1 Q .
The second covariance matrix is obtained simply according to the error propagation law. The covariance matrix is then written as:
Q j = σ ^ j 2 F j Q F j T .
This kind of covariance tends to overestimate the accuracy [25,26]. One of the reasons is that only the commission error is propagated while the omission error is neglected in this propagation. In assessing the accuracy of a functional calculated by the filtered SH model, we should use the covariance in (6). If the filtered SH model is treated as a prior in another SH modeling problem, we should use the covariance (7) to better represent the information of previous measurements.

2.3. A Novel Filtering Strength Metric: Half-Weight Polygon Area of the Smoothing Kernel

Anisotropic filters show diverse filtering properties in different directions, making it difficult to quantify their filtering strength reasonably as the smoothing radius defined in isotropic filters. Reference [9] defined a smoothing radius based on kernel variances. However, the negative sidelobes map into the positive ones, which makes the estimated kernel variance larger than the actual one. Another filtering strength metric developed by [11] is to compare the “isotropic part” of the anisotropic filter with the Gaussian smoother, however, this method completely ignores the anisotropic part of the filter kernel. Later, Reference [12] treated the average of half-weight radii of the four cardinal directions as the filtering strength indicator, however, the filtering characteristics in the other directions besides the cardinal ones are completely ignored.
The half-weight radii in different directions constitute an approximate elliptical or rectangular polygon. Instead of taking the Gaussian radii (a distance quantity) into account, in this study, we proposed to calculate the kernel half-weight polygon area (HWPA) (an area quantity) to measure the filter strength. This means that filtering properties in all directions are considered, not just in the four cardinal directions. It is easy to understand that the larger the HWPA of the filter kernel, the stronger the filtering strength, and vice versa. For the filter kernel whose center is located at (λ, θ), cf. Figure 1, its HWPA can be calculated with the following steps:
Step 1: Determine the integral point of the half-weight polygon. In this work, we do not troublesomely interpolate the smoothing kernel values to determine the exact half-weight position (namely equal to 0.5). Instead, we regard the grid points with filtering kernel values distributing between 0.48 and 0.52 as the boundary points of the half-weight polygon. These points are also the vertices of the integral triangle. With these points, the half-weight polygon is divided into the sum of n integral triangles.
Step 2: Calculate the side length a, b, and c of an integral triangle. The length d between two points (λ1, θ1) and (λ2, θ2) on the sphere can be calculated according to the Great-Circle distance formula, shown as follows:
d = R a r c c o s c o s θ 1 c o s θ 2 c o s λ 1 λ 2 + s i n θ 1 s i n θ 2 ,
where R represents the radius of the earth.
Step 3: Calculate the half-weight polygon area (HWPA). The area Si of the i-th integral triangle KC-IPi-IPj can be calculated with Heron’s formula:
S i = p p a p b p c ,
with p being the half-perimeter of the triangle, namely p = a + b + c / 2 . Then the HWPA is the sum of the areas of each integral triangle, namely S = i = 1 n S i .
It is emphasized that the ellipse-like polygon in Figure 1 is only adopted as an example. The half-weight polygon of the filtering kernel may also be rectangle-like, or irregular-shaped. This is the exact reason why we develop the above “segmentation, approximation, and summation” steps to calculate HWPA.
Table 1 shows the HWPAs and their averages of eight DDK filters at different locations (θ = 0°, 30°, and 60° north along the 0° meridian), with the corresponding equivalent smoothing radii (ESR) metric proposed in [11] for comparison. It is observed with the increasing filtering strength (increasing regularization coefficients) from DDK8 to DDK1 that both HWPA and ESR tend to increase also, indicating their general fine measuring performance. The ESR metric cannot discriminate the filtering strength between DDK7 and DDK8, and so does HWPA at (0°, 0°). The HWPA at (0°, 0°) of DDK8 is slightly greater than DDK7, which is attributed to the calculating error from the grid points. Nevertheless, the average HWPA shows better discrimination capacity, especially for weak-strength filters (DDK7, DDK8). Therefore, we suggest adopting the average HWPA as a filtering strength metric.

3. Results

In this section, the GRACE CSR RL05 gravity monthly solutions and their ECMs from January 2004 to December 2010 are used to analyze the properties and filtering performance of the proposed adaptive DDK filter. The 2004.0–2009.999 time mean baseline is subtracted from the monthly solutions. The following filters are also tested for comparisons, including Gaussian 300 km smoother, Gaussian 500 km smoother, DGSW filter [5], two-step-300 (Gaussian 300 km smoother + DGSW), two-step-500 (Gaussian 500 km smoother + DGSW), stationary DDK [9] and VADER filter [12]. The GRACE CSR RL06 v2.0 mascon solution is also included for comparison. Without loss of generality, we first select the filtered solutions of September 2006 and July 2010 for exemplification, and then provide an overall evaluation for the entire time series.

3.1. Analysis of Properties of Adaptive DDK Filter

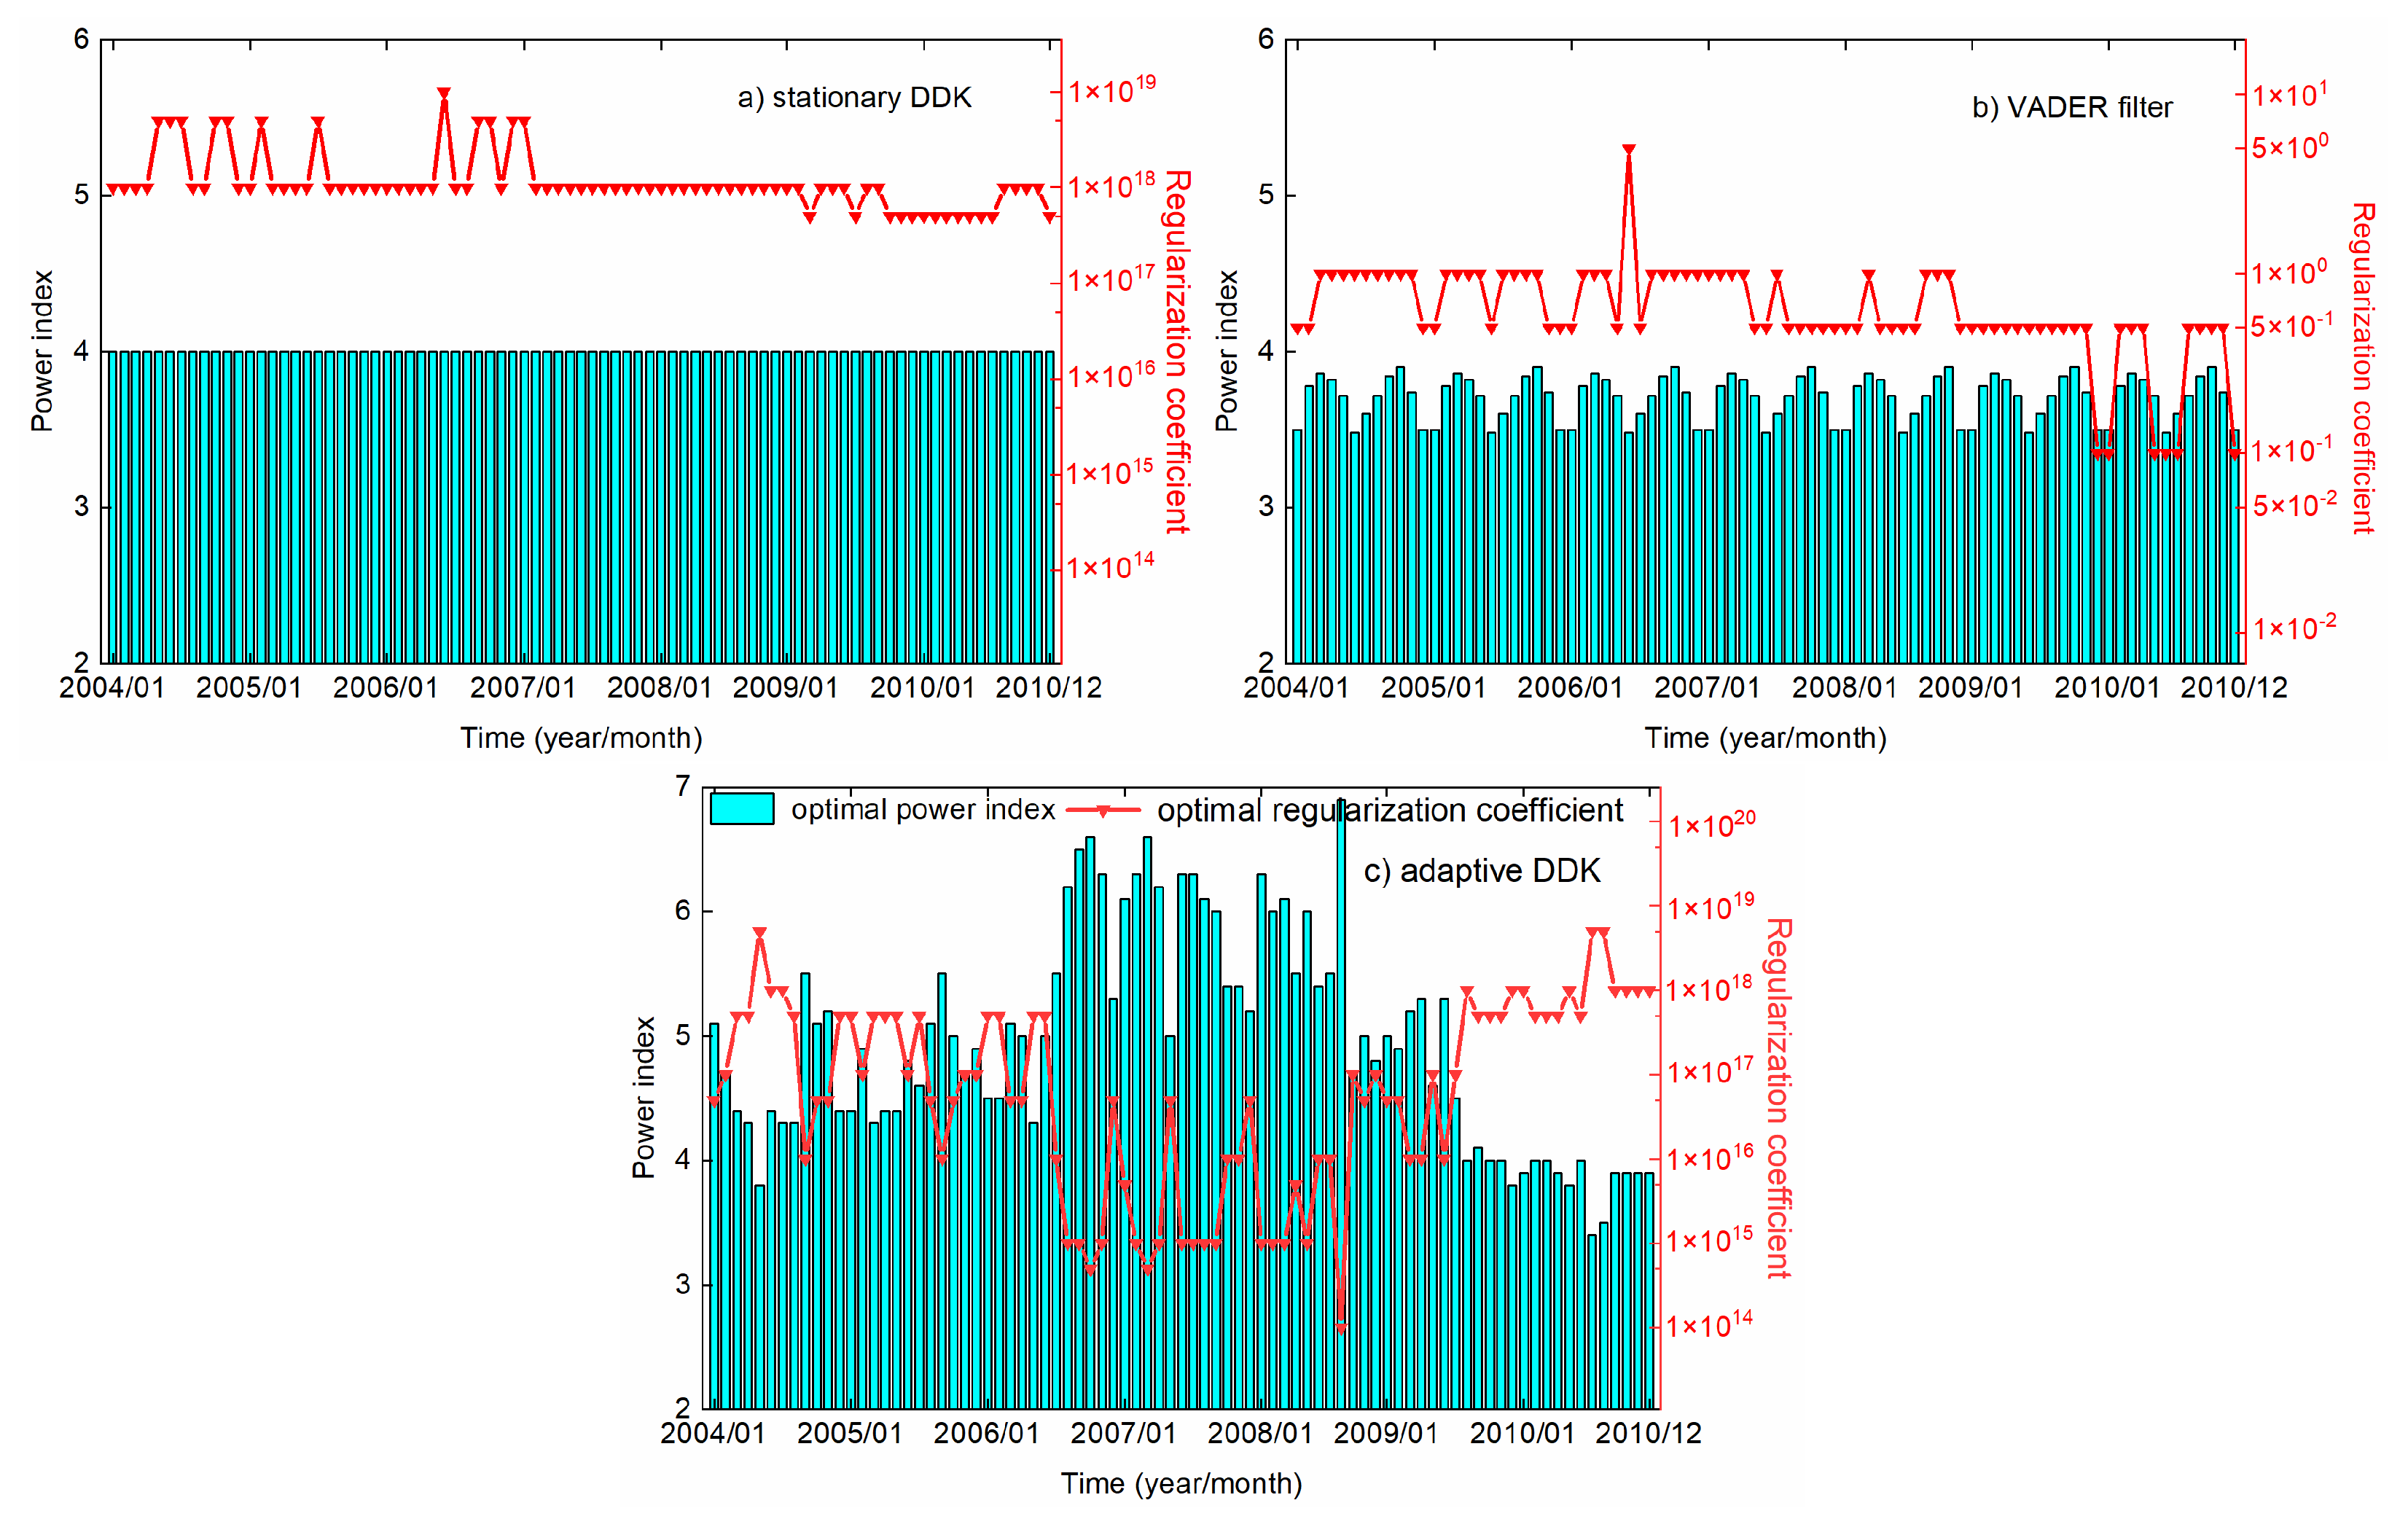
In adaptive DDK, we perform hyperparameter tuning with 41 power indices ranging from 3.0 to 7.0, and also with 15 regularization coefficients ranging from 1.0 × 10¹³ to 1.0 × 10²⁰. The predefined regularization coefficient candidates involved in stationary DDK are the same as that of adaptive DDK, and those in the VADER filter are seven candidates ranging from 0.01 to 10 [12]. Figure 2 presents the selected hyperparameters for stationary DDK, VADER filter, and adaptive DDK. The regularization coefficients of the stationary DDK and VADER filter in Figure 2a,b are time-varying, because the relative values of time-variable ECM and stationary/cyclo-stationary SCM are different from month to month, and this difference is automatically balanced through adjusting the regularization term. Regarding adaptive DDK in Figure 2c, both power index and regularization coefficient are time-variable, which not only enhances the adaptability to changes in relative difference of ECM and SCM, but also helps adjust the signal components of different degrees flexibly. We also notice the change of power indices is negatively correlated to that of regularization coefficients. This result is reasonable, because a greater power index can suppress higher-order noises (including high-frequency and correlated noises) more severely, with a weaker regularization term needed. On the contrary, a smaller power index is insufficient to suppress higher-order noise terms, and these terms can only be suppressed by a stronger regularization term. To sum up, the key is to use the GCV criterion to objectively balance the influence of power index and regularization coefficient, to achieve the optimal filtering strength.
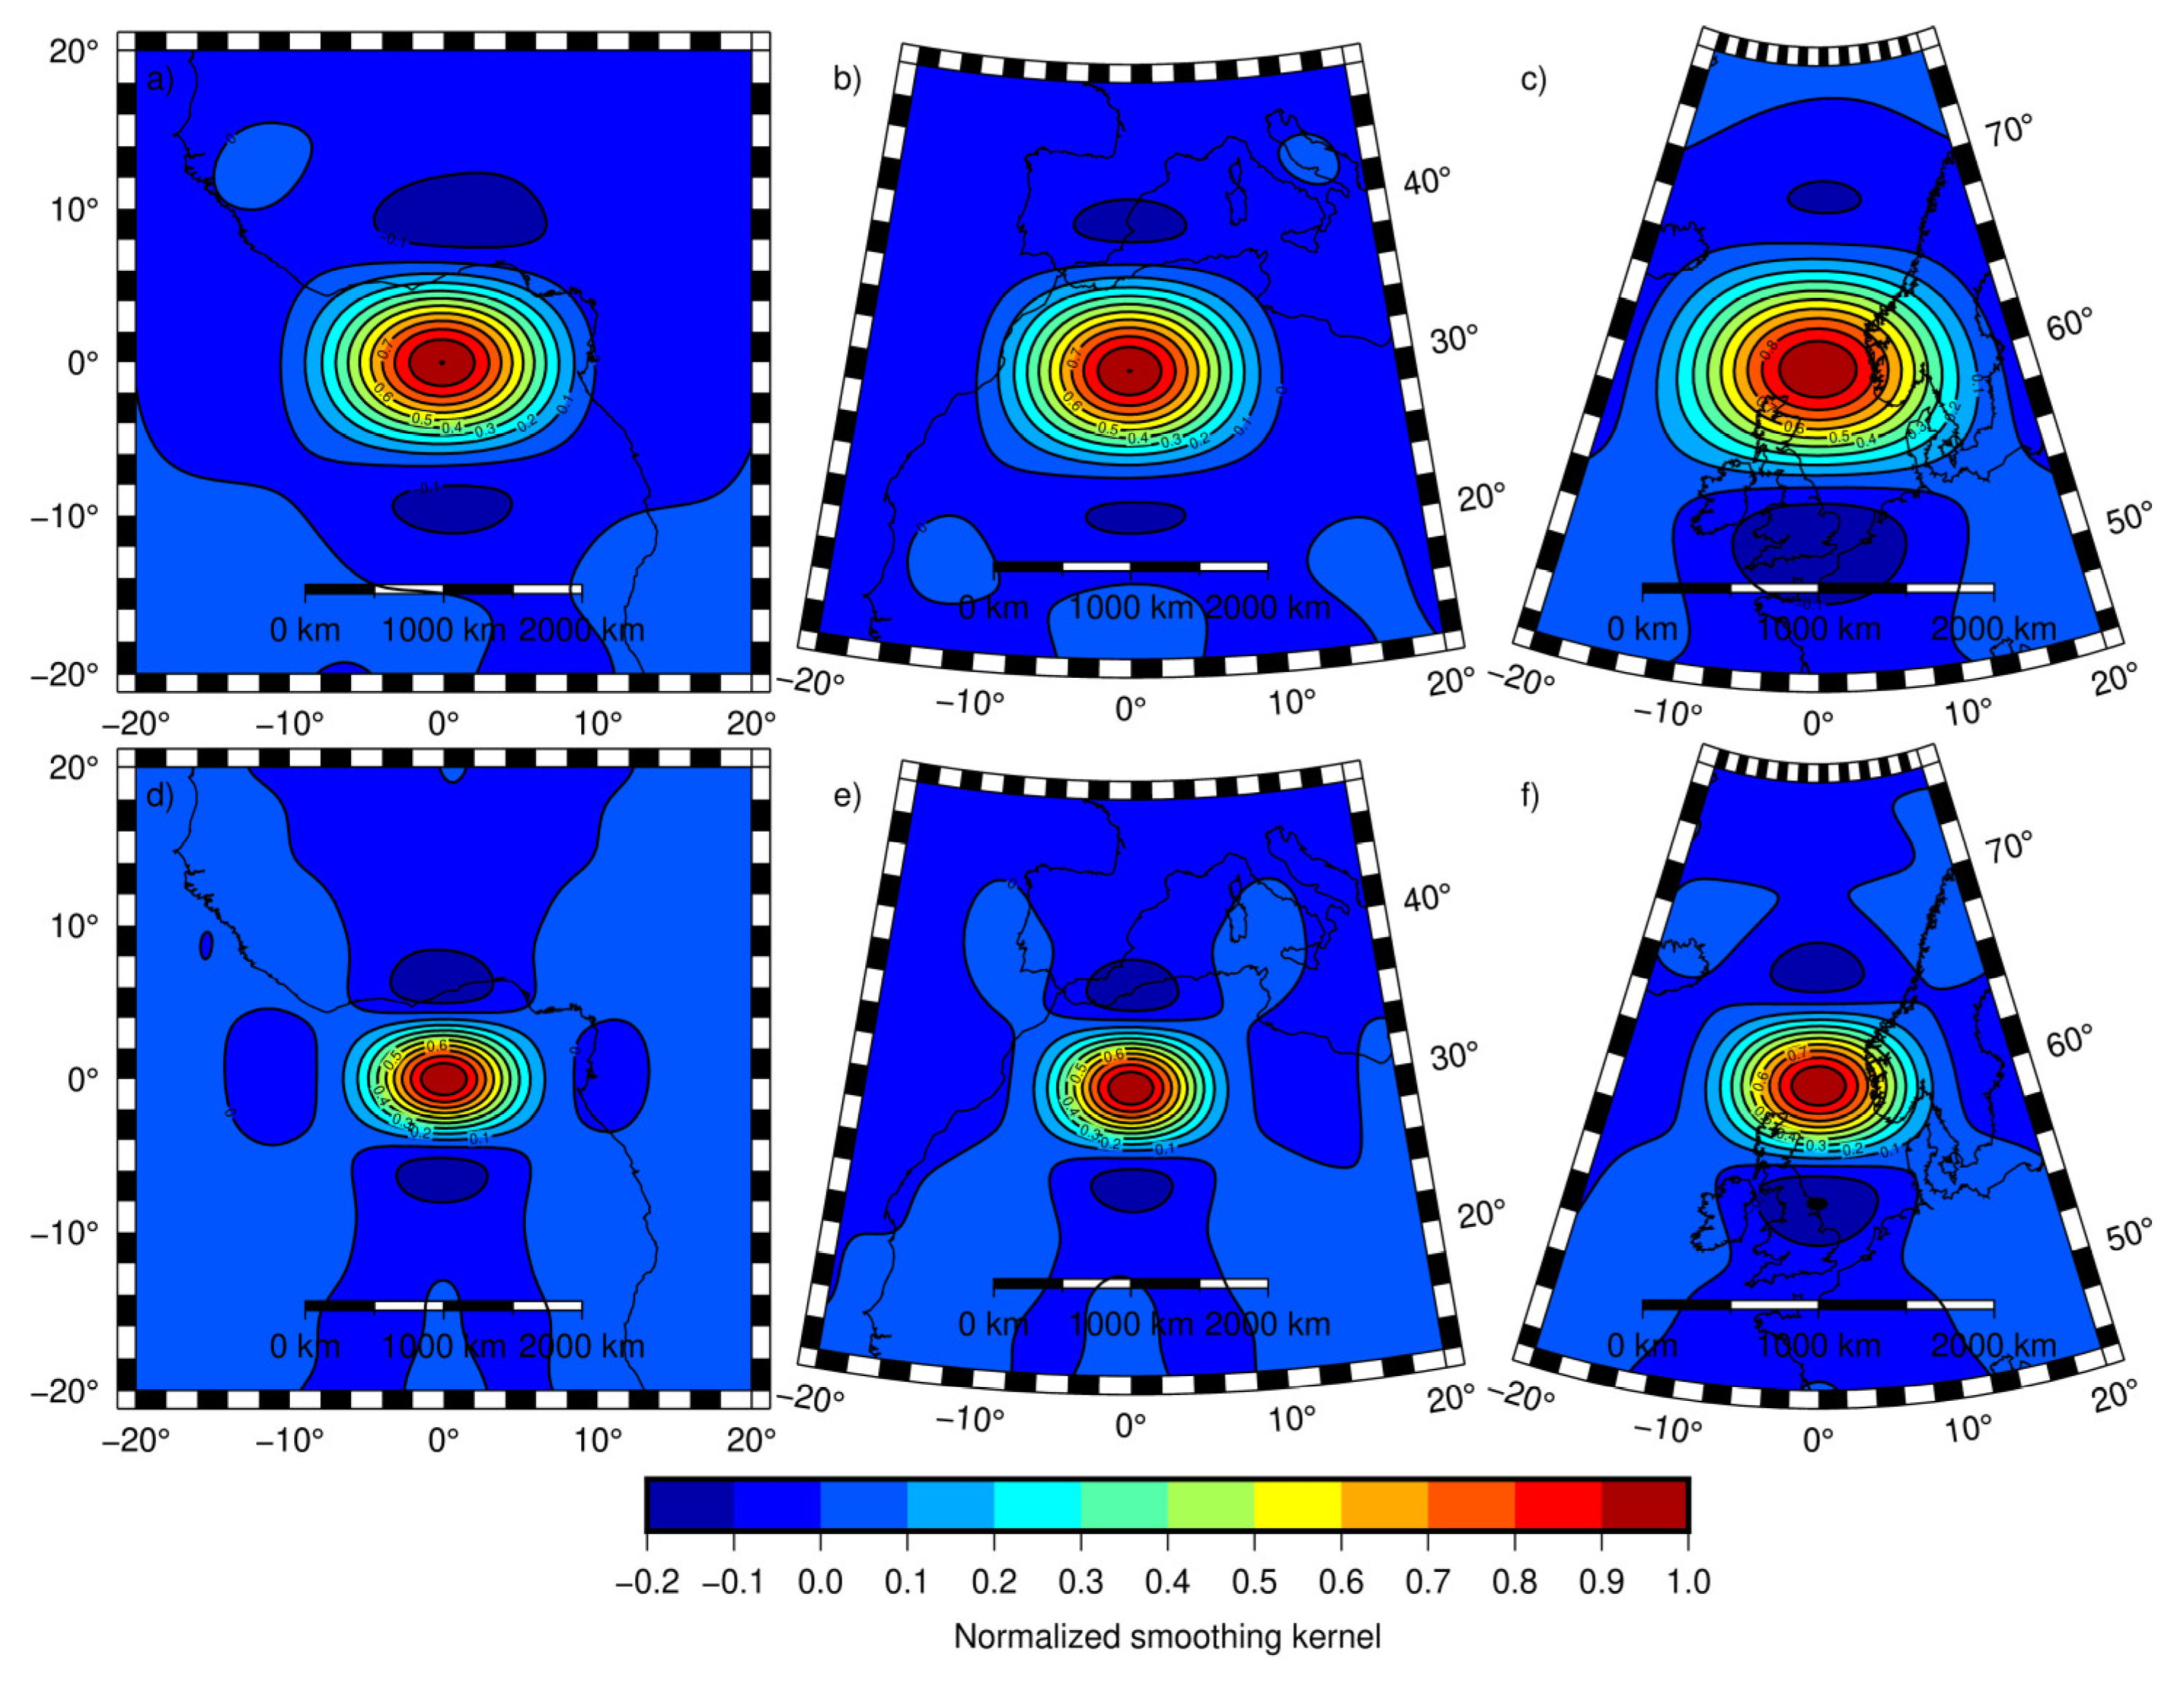
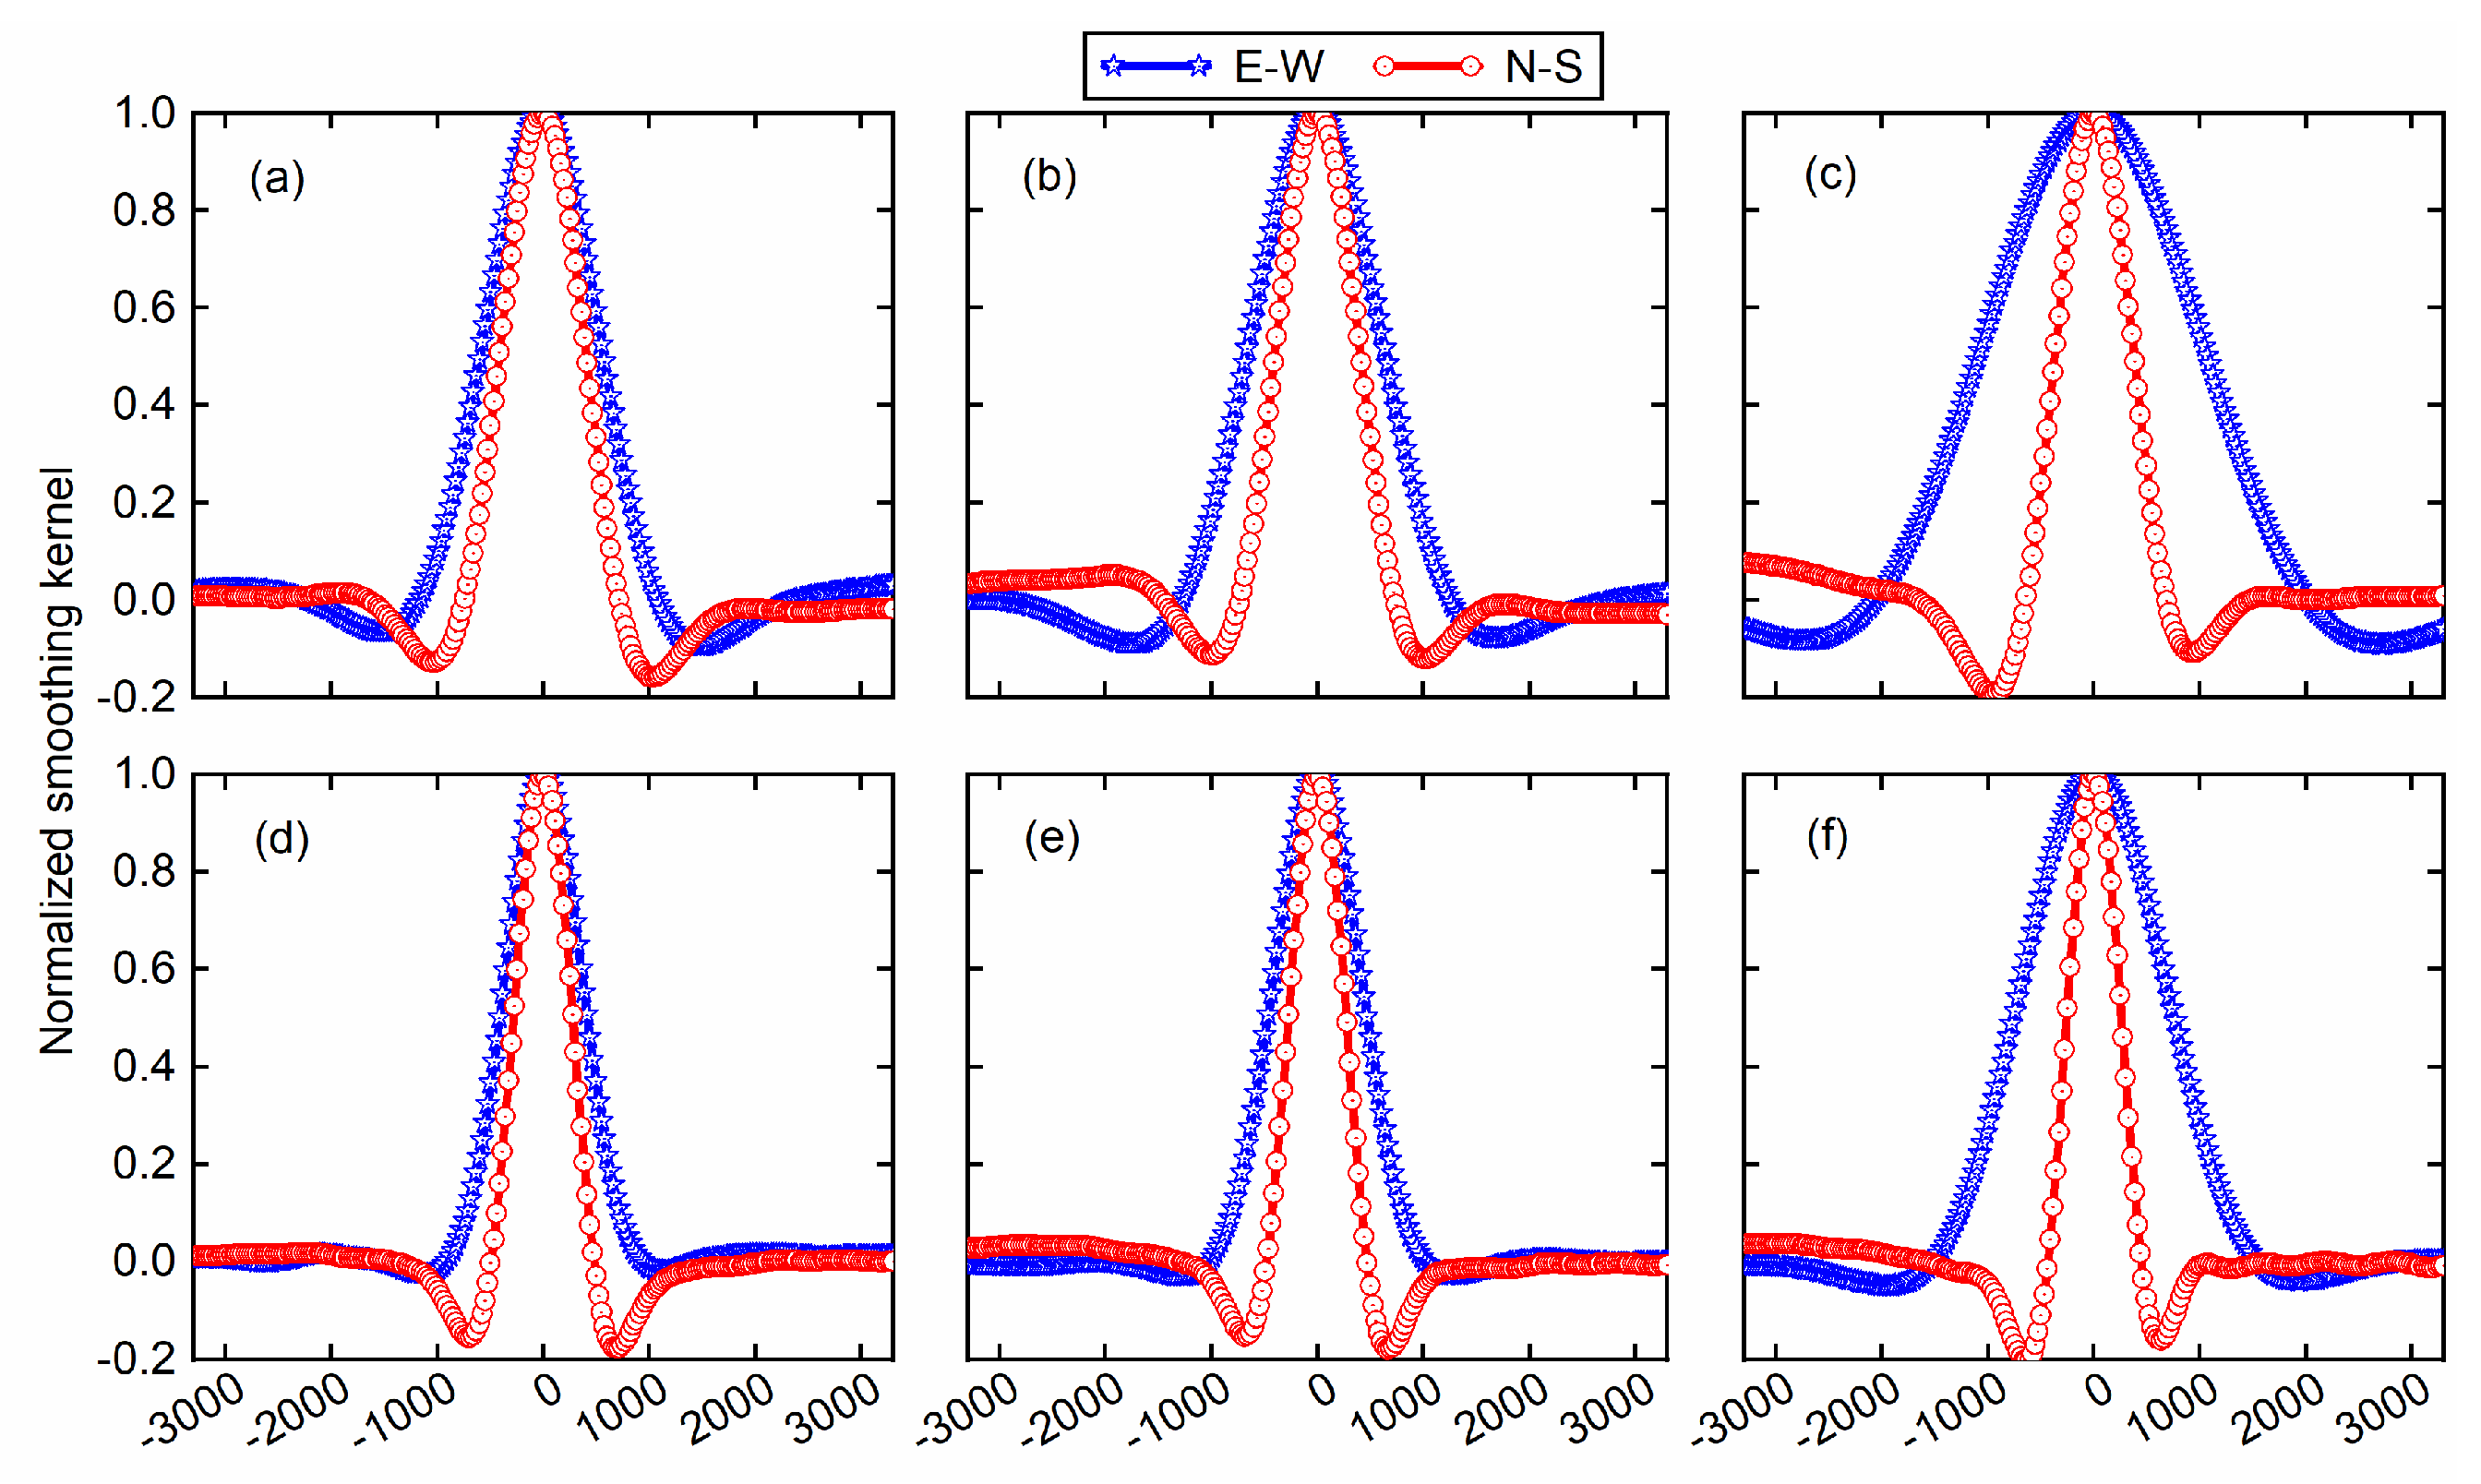
Figure 3 presents the normalized smoothing kernel at different locations of adaptive DDK filters in September 2006 and July 2010, and their cross-sections in cardinal directions are shown in Figure 4. The row-wise comparison indicates the adaptive DDK filter is time-variable, which is also due to the time-variability of ECM and SCM. The column-wise comparison shows the adaptive DDK has different filtering effects at different locations, manifesting its location-inhomogeneity. Furthermore, the azimuth-anisotropy of the proposed adaptive DDK is also noticeable. To be specific, the kernel in the north–south direction is narrower than that in east–west direction, enabling the filter to effectively destripe. To summarize, the proposed adaptive DDK is time-variable, location-inhomogeneous, and azimuth-anisotropic.

3.2. Evaluation of Filtered Mass Anomaly

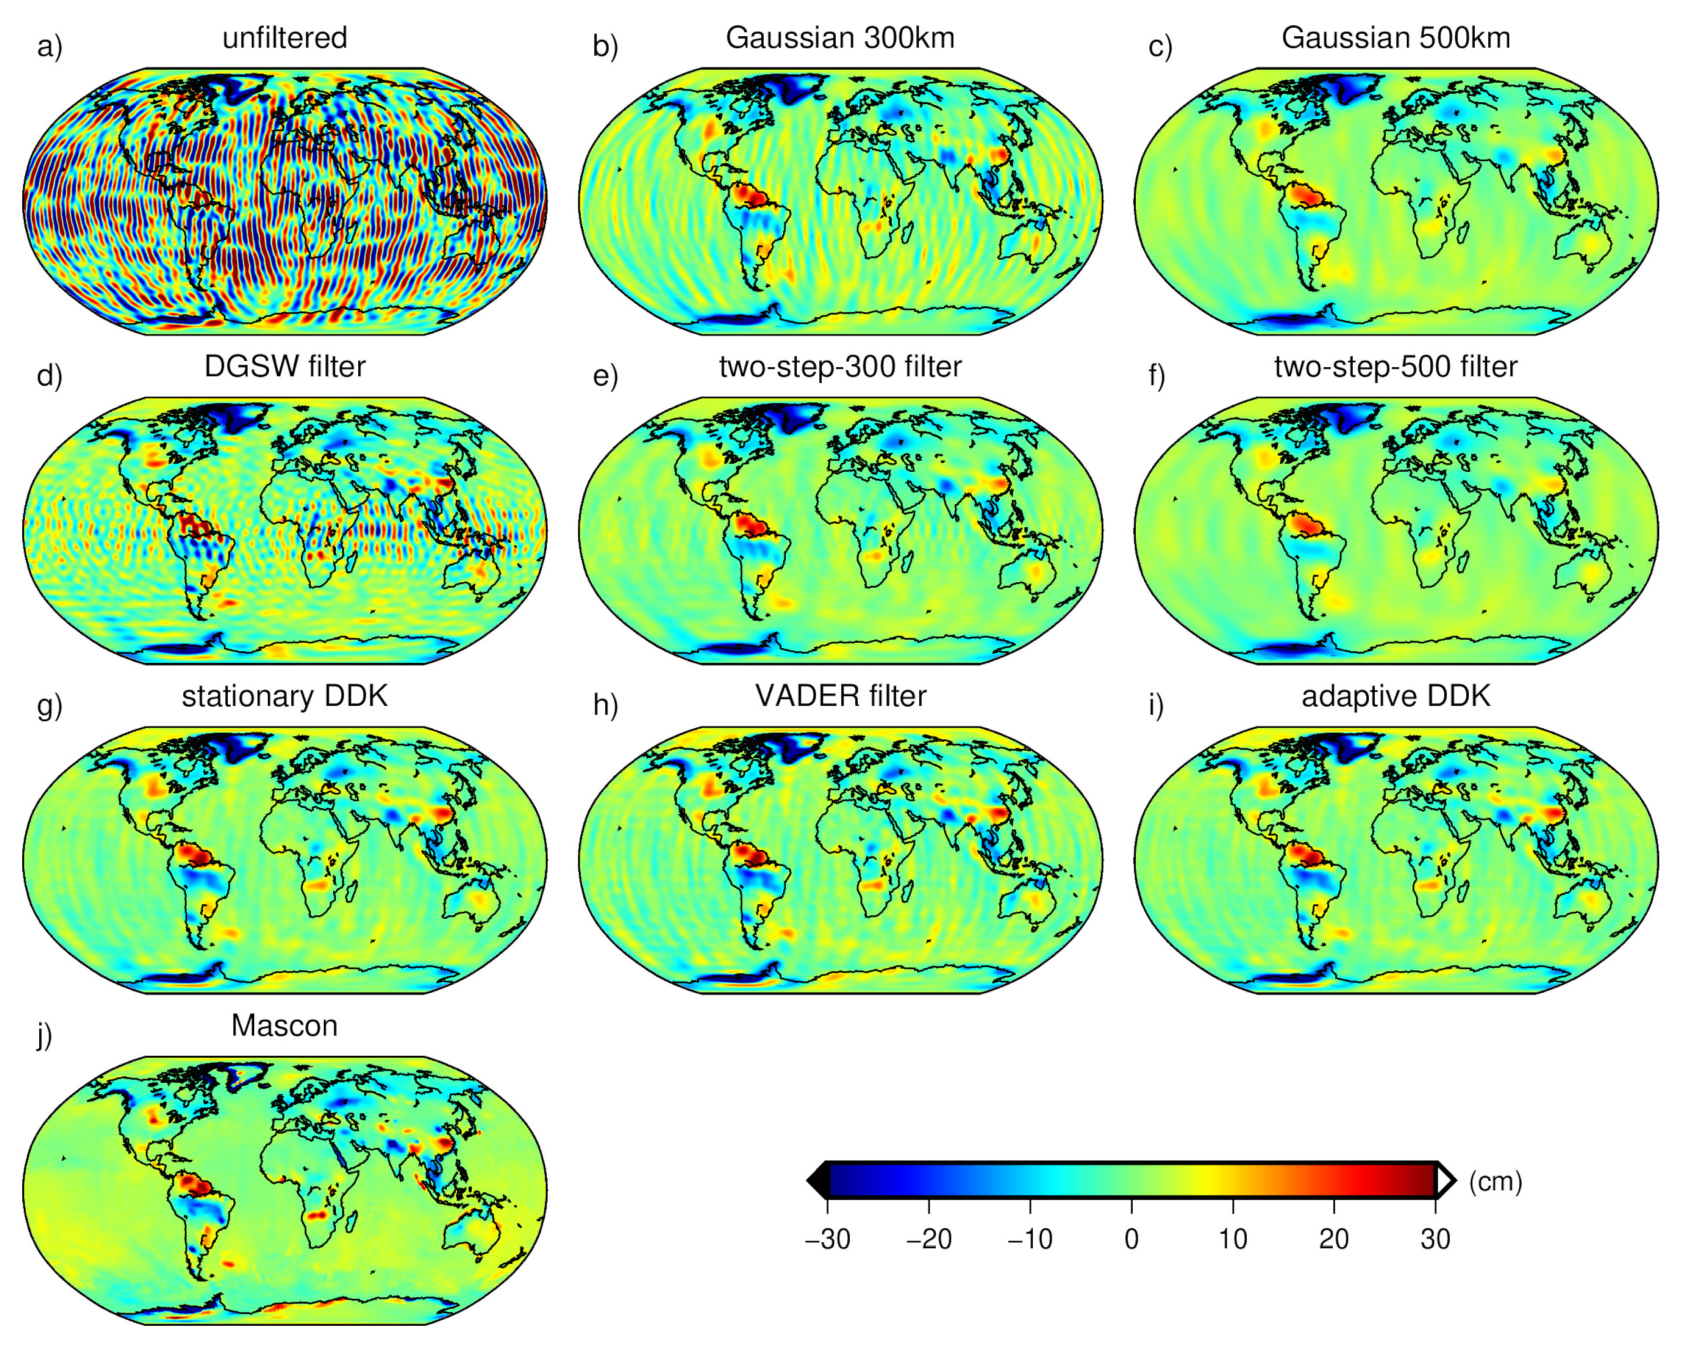
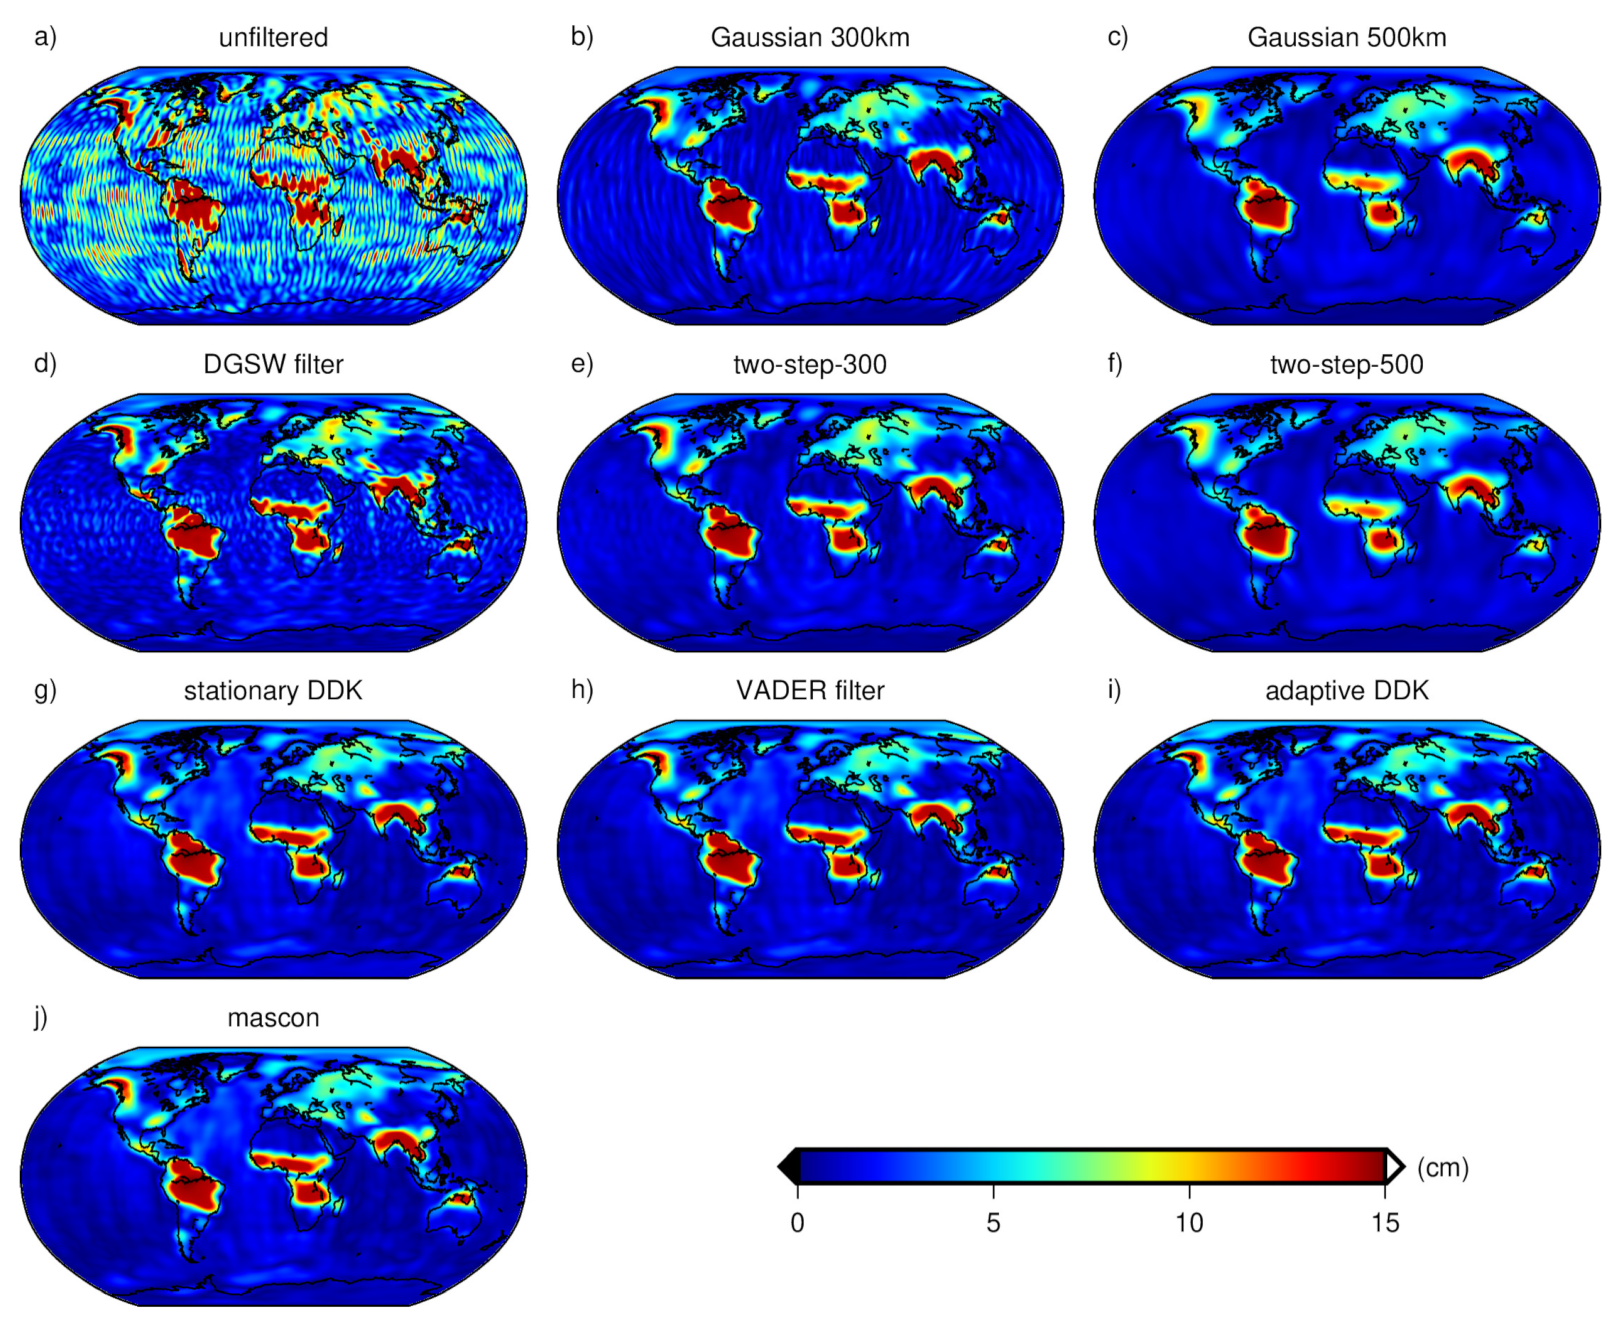
The global mass anomalies in terms of equivalent water height (EWH) are calculated for all the filtered solutions. Figure 5 and Figure 6 present the results for January 2006 and July 2010, with their statistics summarized in Table 2. With the mascon solution in Figure 5j and Figure 6j taken as reference, the following conclusions can be drawn visually. The filtered solution of Gaussian 300 km smoother shows some residual stripes, whereas that of Gaussian 500 km smoother has signal attenuation to some extent, especially in Antarctica and Greenland. For the DGSW filter, there are some residual stripes in middle and low latitudes. When combining the DGSW filter with Gaussian smoother, the stripes are eliminated effectively, and the mass anomalies are visible, and the same is true for stationary DDK, VADER filter, and adaptive DDK. We also notice in Figure 6 that the adaptive DDK presents significantly fewer stripes than VADER filter, while the mass anomaly signals recovered by adaptive DDK and stationary DDK do not show visible differences, though the former is slightly weaker than the latter as presented in Table 2. This is because their relatively close hyperparameters (3.4 and 5 × 10¹⁸ for the former, 4.0 and 5 × 10¹⁷ for the latter) indicate their similar filtering strengths. By tuning two hyperparameters rather than one, the adaptive DDK can adjust filtering strength more flexibly than the stationary DDK and VADER filters.
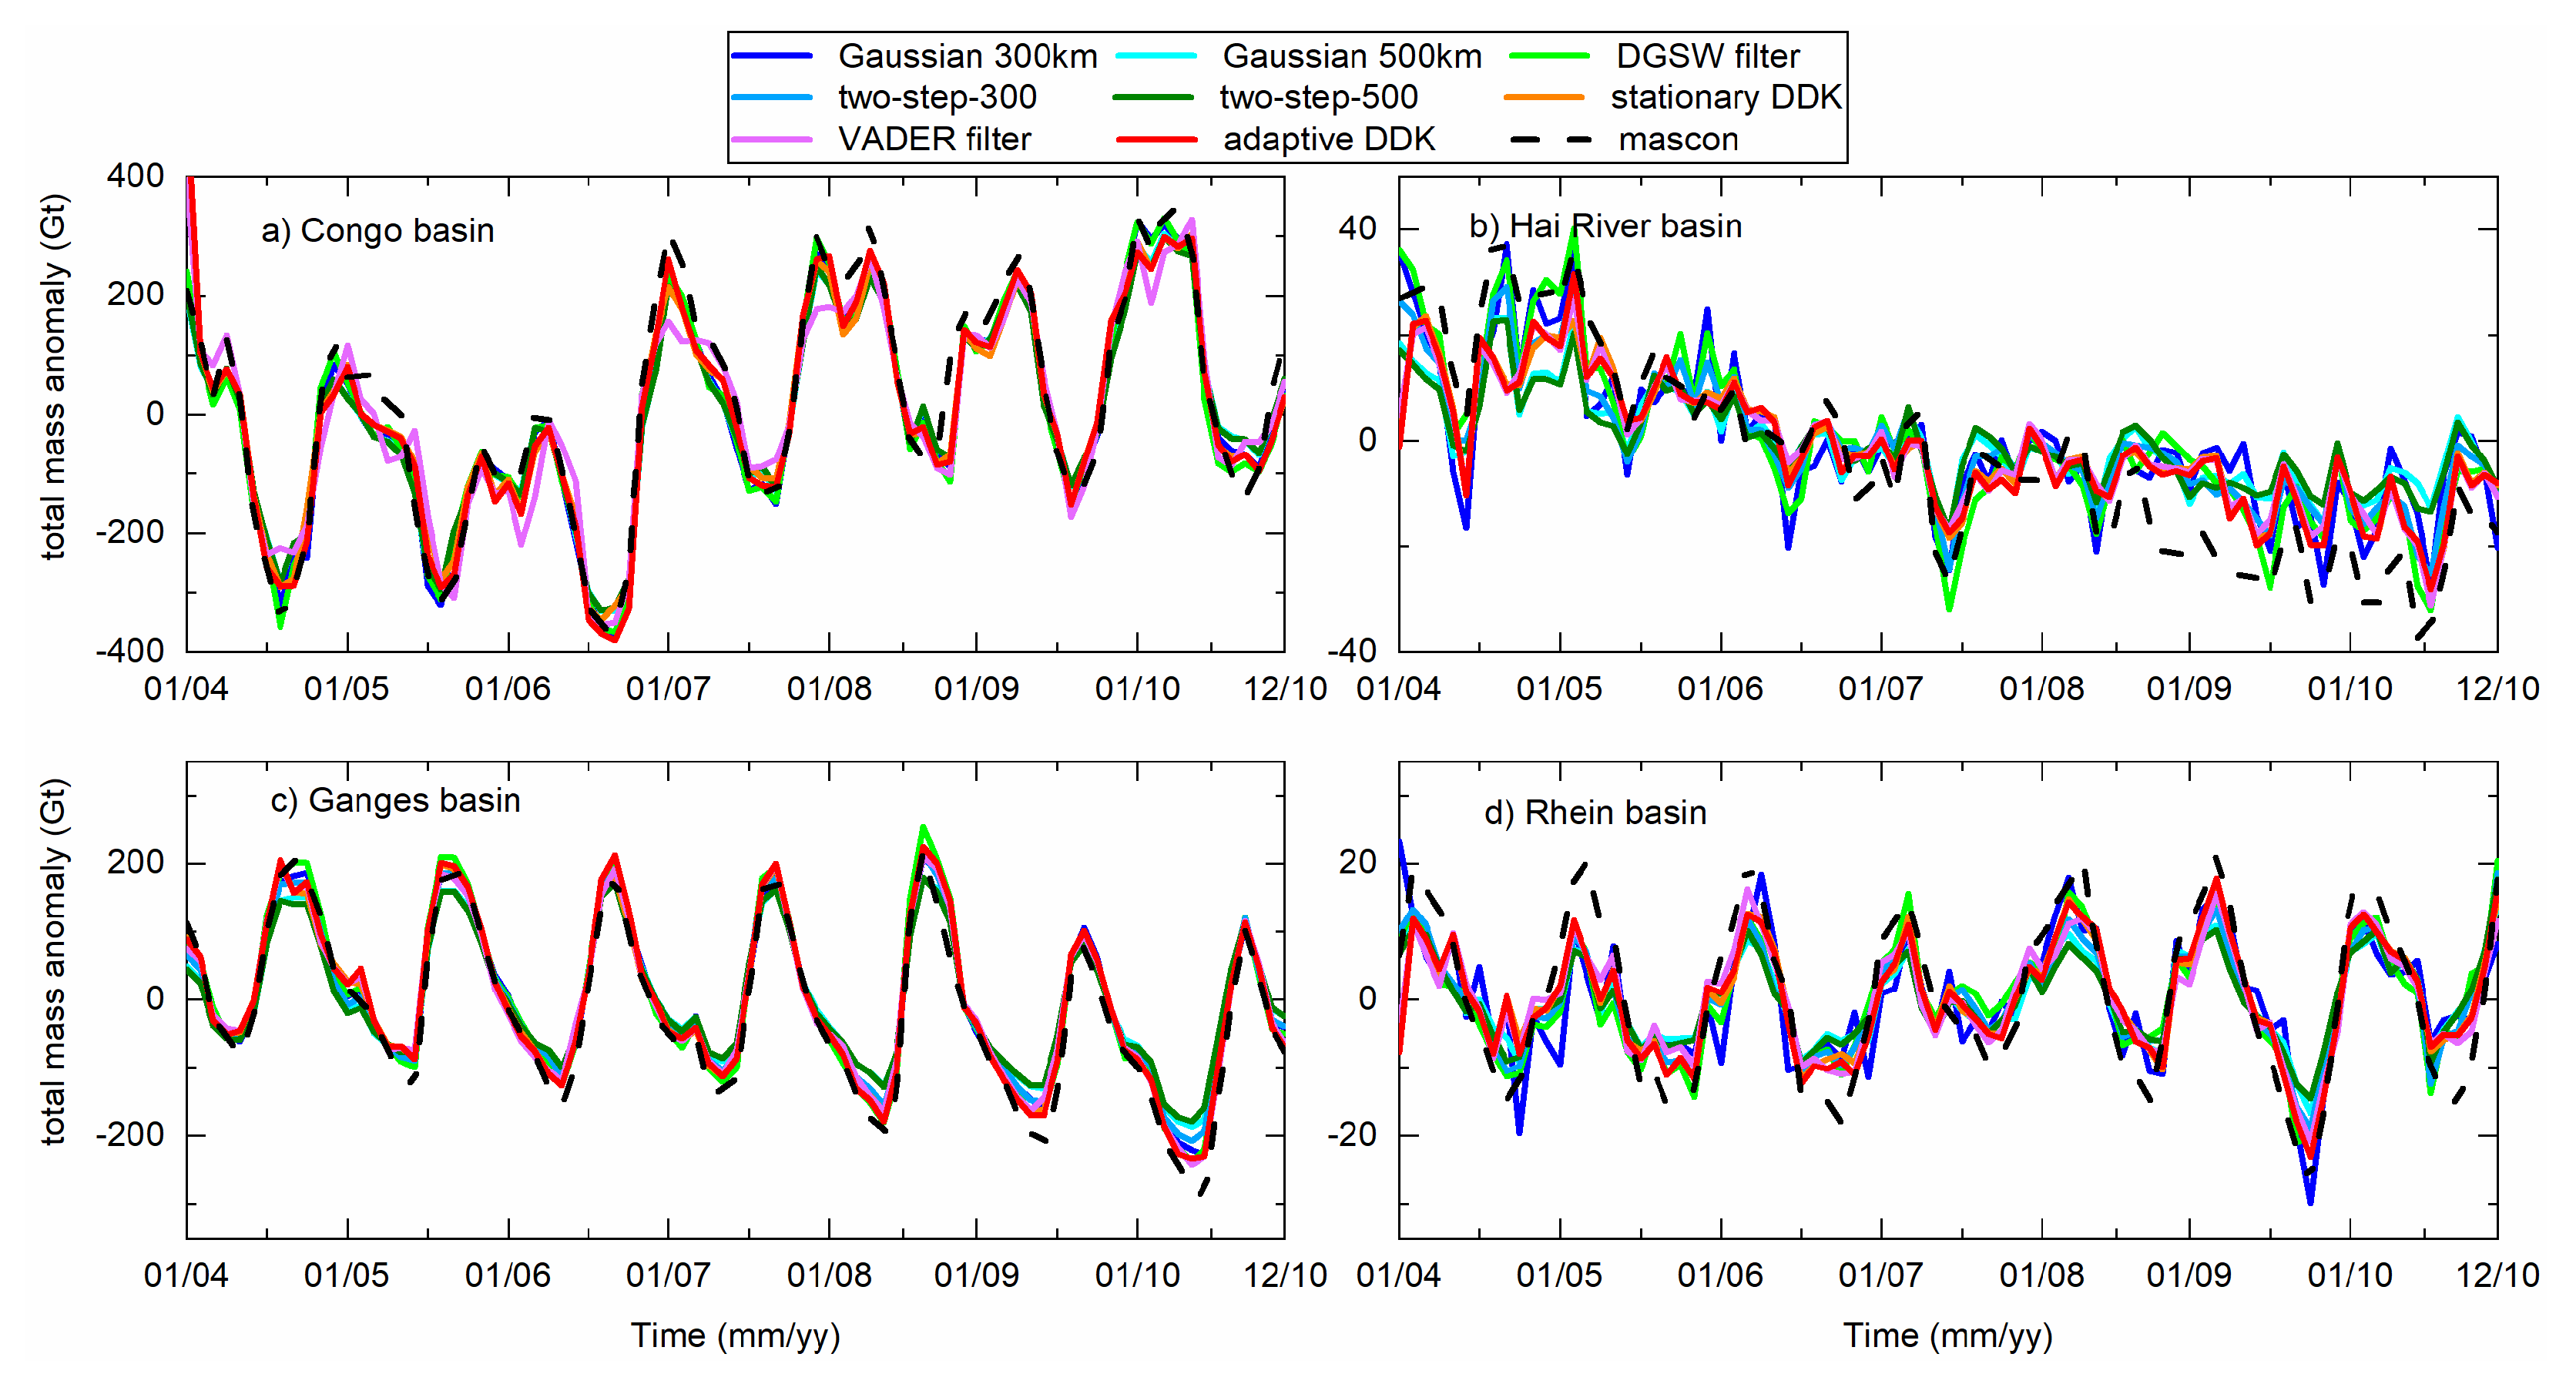
One of the main scientific outcomes of GRACE is its ability to monitor climate variability. To this end, we evaluate the time series of local total mass anomaly in the Congo basin, Ganges basin, Hai River, and Rhein basin. Without loss of generality, the mascon solution is taken as reference truth. Figure 7 presents the time series of different filters, and their RMS difference (RMSD) with respect to mascon solutions are summarized in Table 3. In general, all eight filters can restore significant seasonal variability, albeit with some minor differences. In most cases, the filtered solutions of adaptive DDK always show the lowest RMSD compared with mascon solutions, which again demonstrates its validity.

3.3. Analysis of Signal and Noise Level

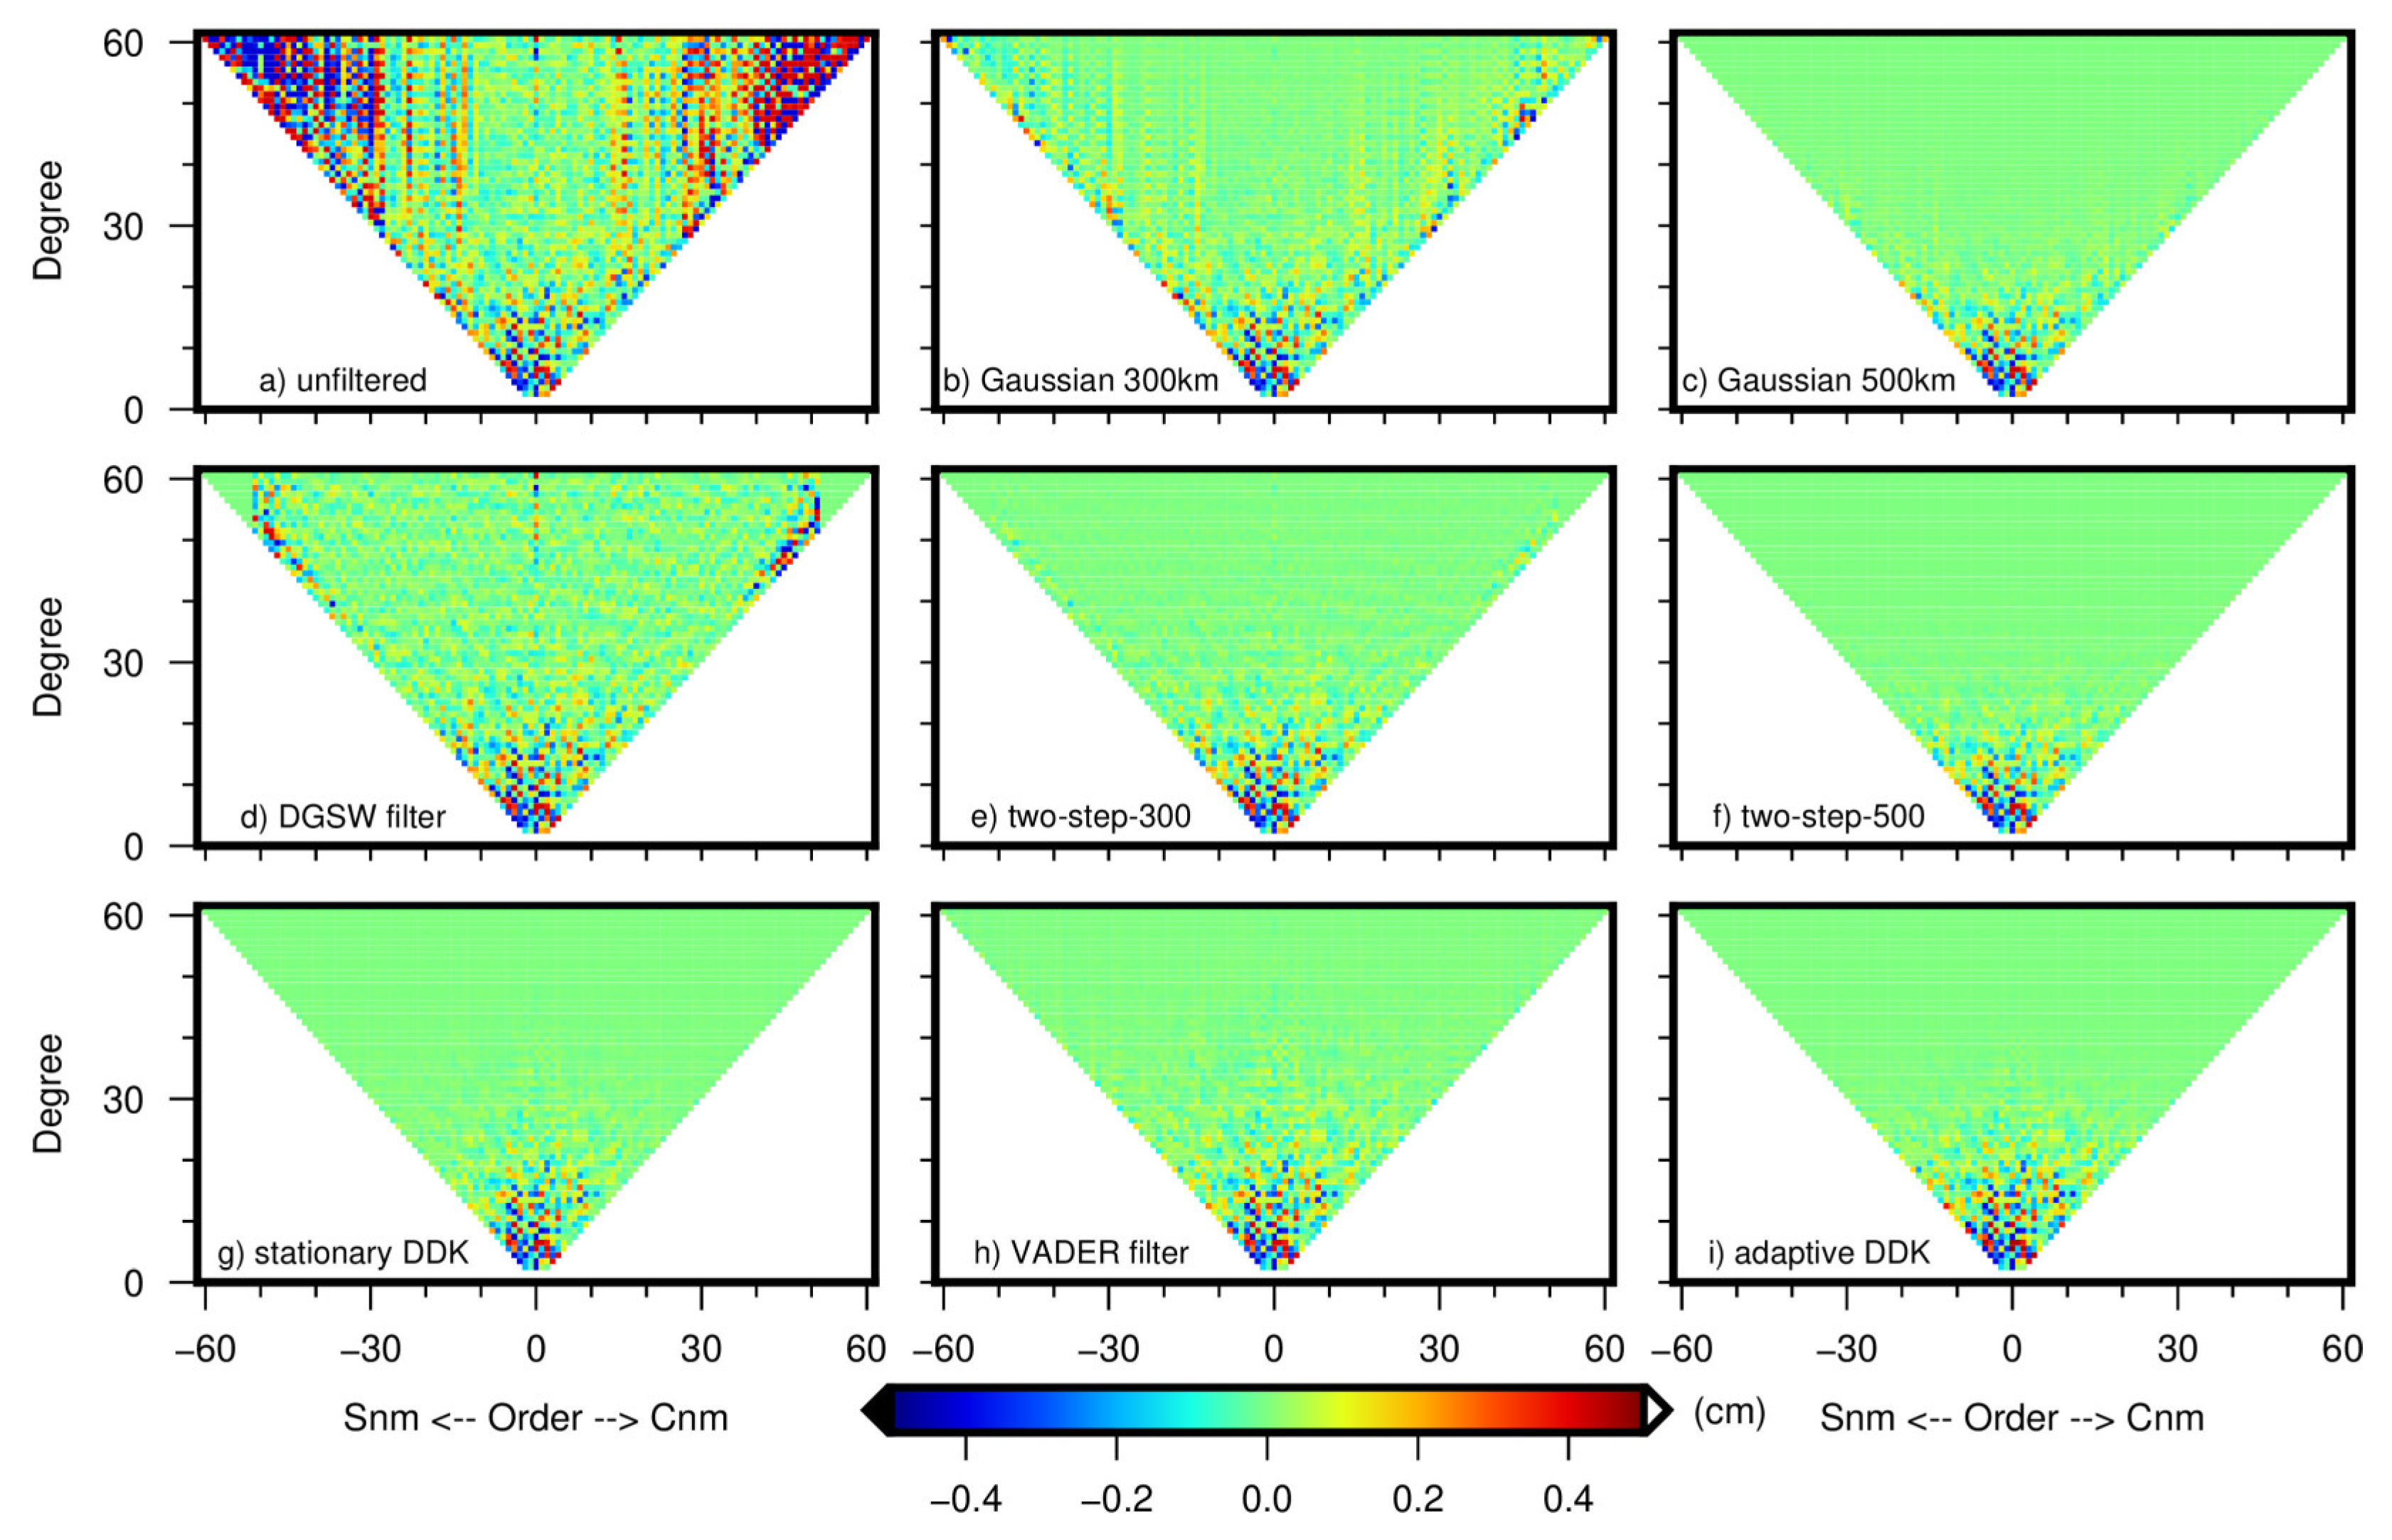
In the following, we first check the signal and noise level of the filtered solutions in the spectral domain, then evaluate that in the spatial domain. Figure 8 shows the distribution of unfiltered and filtered solutions in the SH domain in September 2006 and July 2010. It is observed that there are still some high-frequency noises in solutions of Gaussian 300 km and the DGSW filter, while those using other filters are well removed. As shown in Figure 8g–i, the adaptive DDK retains much lower degree signals than the others, while in Figure 9g–i, the three DDK filters retain comparable low-degree signals. Taking degree 28 as an example, Figure 10 shows the SH coefficients from order 28 to order 60. Before filtering (Figure 10a,c), there is a significant correlation between the spherical harmonic coefficients of odd degrees and even degrees, which is explicitly weakened after filtering (Figure 10b,d).
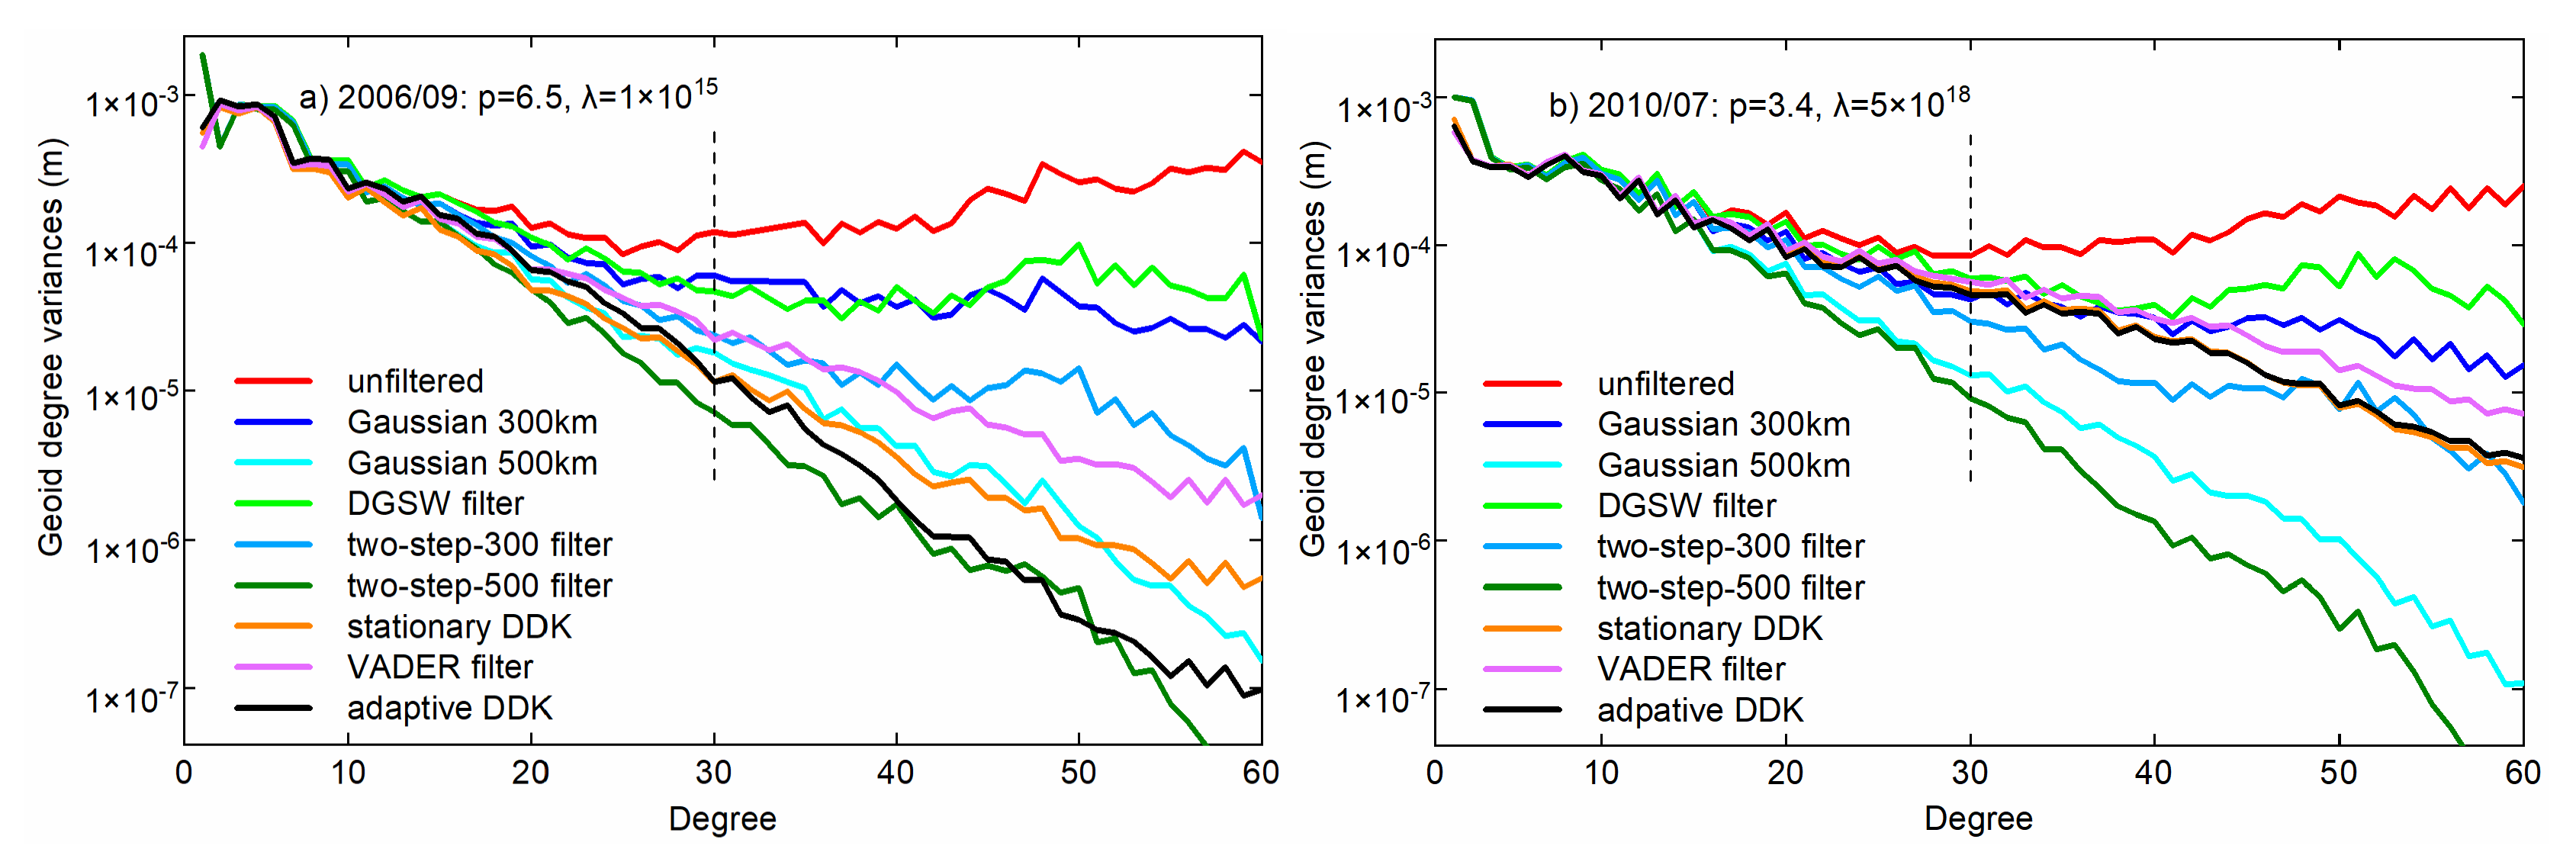
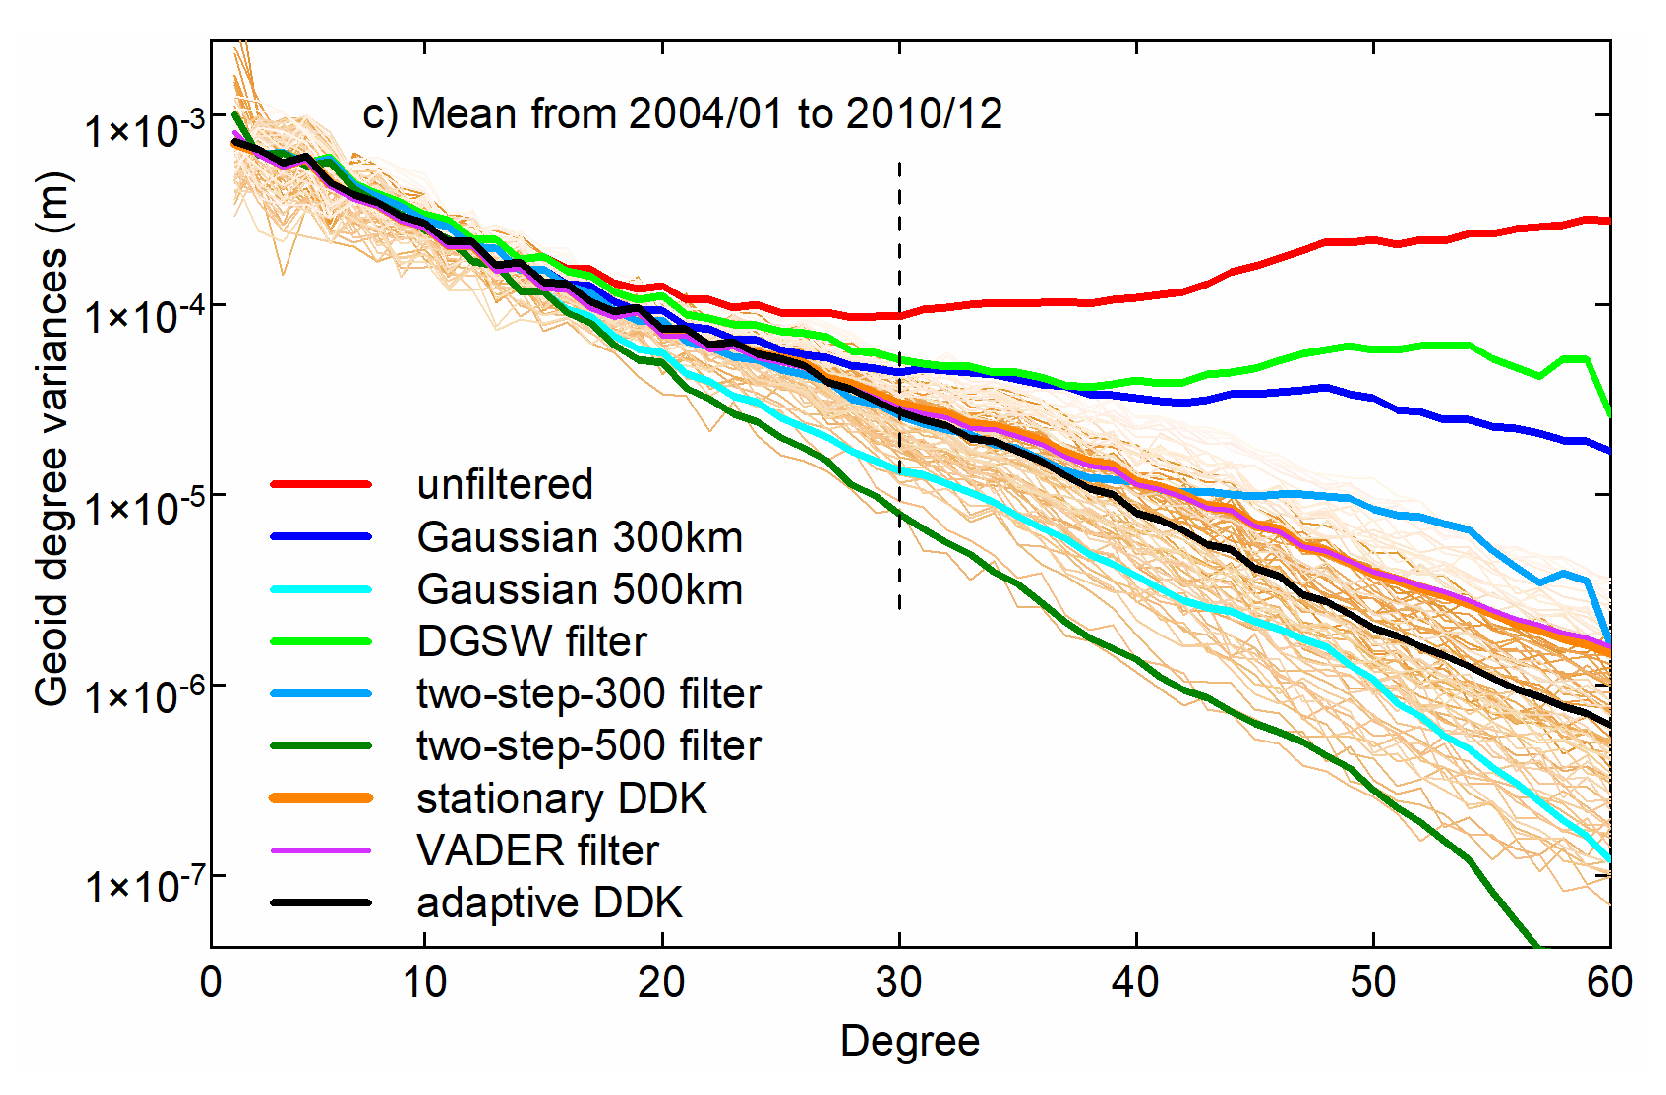
Another way to evaluate the signal and noise level in the spectral domain is the posterior signal degree variances. Figure 11 shows the geoid degree variances of the filtered solutions in September 2006 and July 2010, as well as the 7-year means from January 2004 to December 2010. The geoid degree variances of the first 30 degrees mainly reflect the signal amplitude, while that after the first 30 degrees mainly indicates the noise level [27,28]. The following observations can be drawn from Figure 11. First, the Gaussian 300 km smoother and DGSW filter can retain more gravity signal; however, they cannot suppress high-frequency noise sufficiently. Second, the Gaussian 500 km smoother and the two-step-500 filter reduce the high-degree noise effectively, but the low-degree signal is oversmoothed. Third, the two-step-300 filter retains the low-degree signal well, as stationary DDK and adaptive DDK do; however, it cannot always suppress noise significantly. Finally, the VADER filter shows very similar signal degree variances before degree 30 compared with stationary DDK and adaptive DDK; however, its noise level is significantly higher than that of adaptive DDK. Specifically, the filtered solutions of adaptive DDK always show comparable or stronger signal amplitude, and weaker noise level. This again demonstrates the superiority of the proposed adaptive DDK filter.
Finally, we analyze the signal and noise level in the spatial domain. We adopt the signal-to-noise separation approach presented in [29]. The constant, trend, annual, and semiannual terms are estimated from the time series of the filtered SH solutions. These signal terms are usually considered the actual time-varying signals, and the amplitude derived from the annual signal term, can be used as the indicator of the signal level. Then, by removing the aforementioned signal terms from the time series of the filtered SH solutions, the standard derivation (STD) of residuals can be used to quantify the noise level of the filtered solutions [28].
Figure 12 shows the annual amplitude of the filtered mass anomalies from January 2004 to December 2010, and Figure 13 shows the global noise STD. Considering the atmospheric, oceanic tidal, and most of the oceanic non-tidal variations have been deducted from the unconstrained monthly solutions, the annual signal amplitudes over the ocean mainly reflect the noise level of the filtered solutions. It can be observed that the annual amplitudes of adaptive DDK filtered solutions in ocean regions are as low as those of stationary DDK, VADER filter, and mascon solutions. In the areas with strong geophysical signals, such as the Amazon Basin, Congo Basin, Ganges Basin, and Alaskan glaciers, the annual amplitudes of adaptive DDK filtered solutions, are also comparable to those of the other filtered solutions, and do not show any stripes (compared to the Gaussian smoothed solution) or dotted pattern signals (compared to the SW filtered solution). Then, we check the noise levels indicated by the global noise STD as presented in Figure 13. The filtered solutions of adaptive DDK show a similar noise level to that of the VADER filter. We record the average annual amplitude and the average noise STD for the four basins in Table 4. We find that, in most cases, the adaptive DDK provides closer annual amplitudes to mascon solutions, and their residual STD is also relatively low. We also notice the Gaussian 300 km smoother and DGSW presents higher amplitudes than the others; however, their noise STD is also very high, and residual stripes and patches still exist in their filtered solutions. To sum up, the adaptive DDK shows a comparable signal amplitude to mascon solutions, and its noise level is relatively low.

4. Discussion

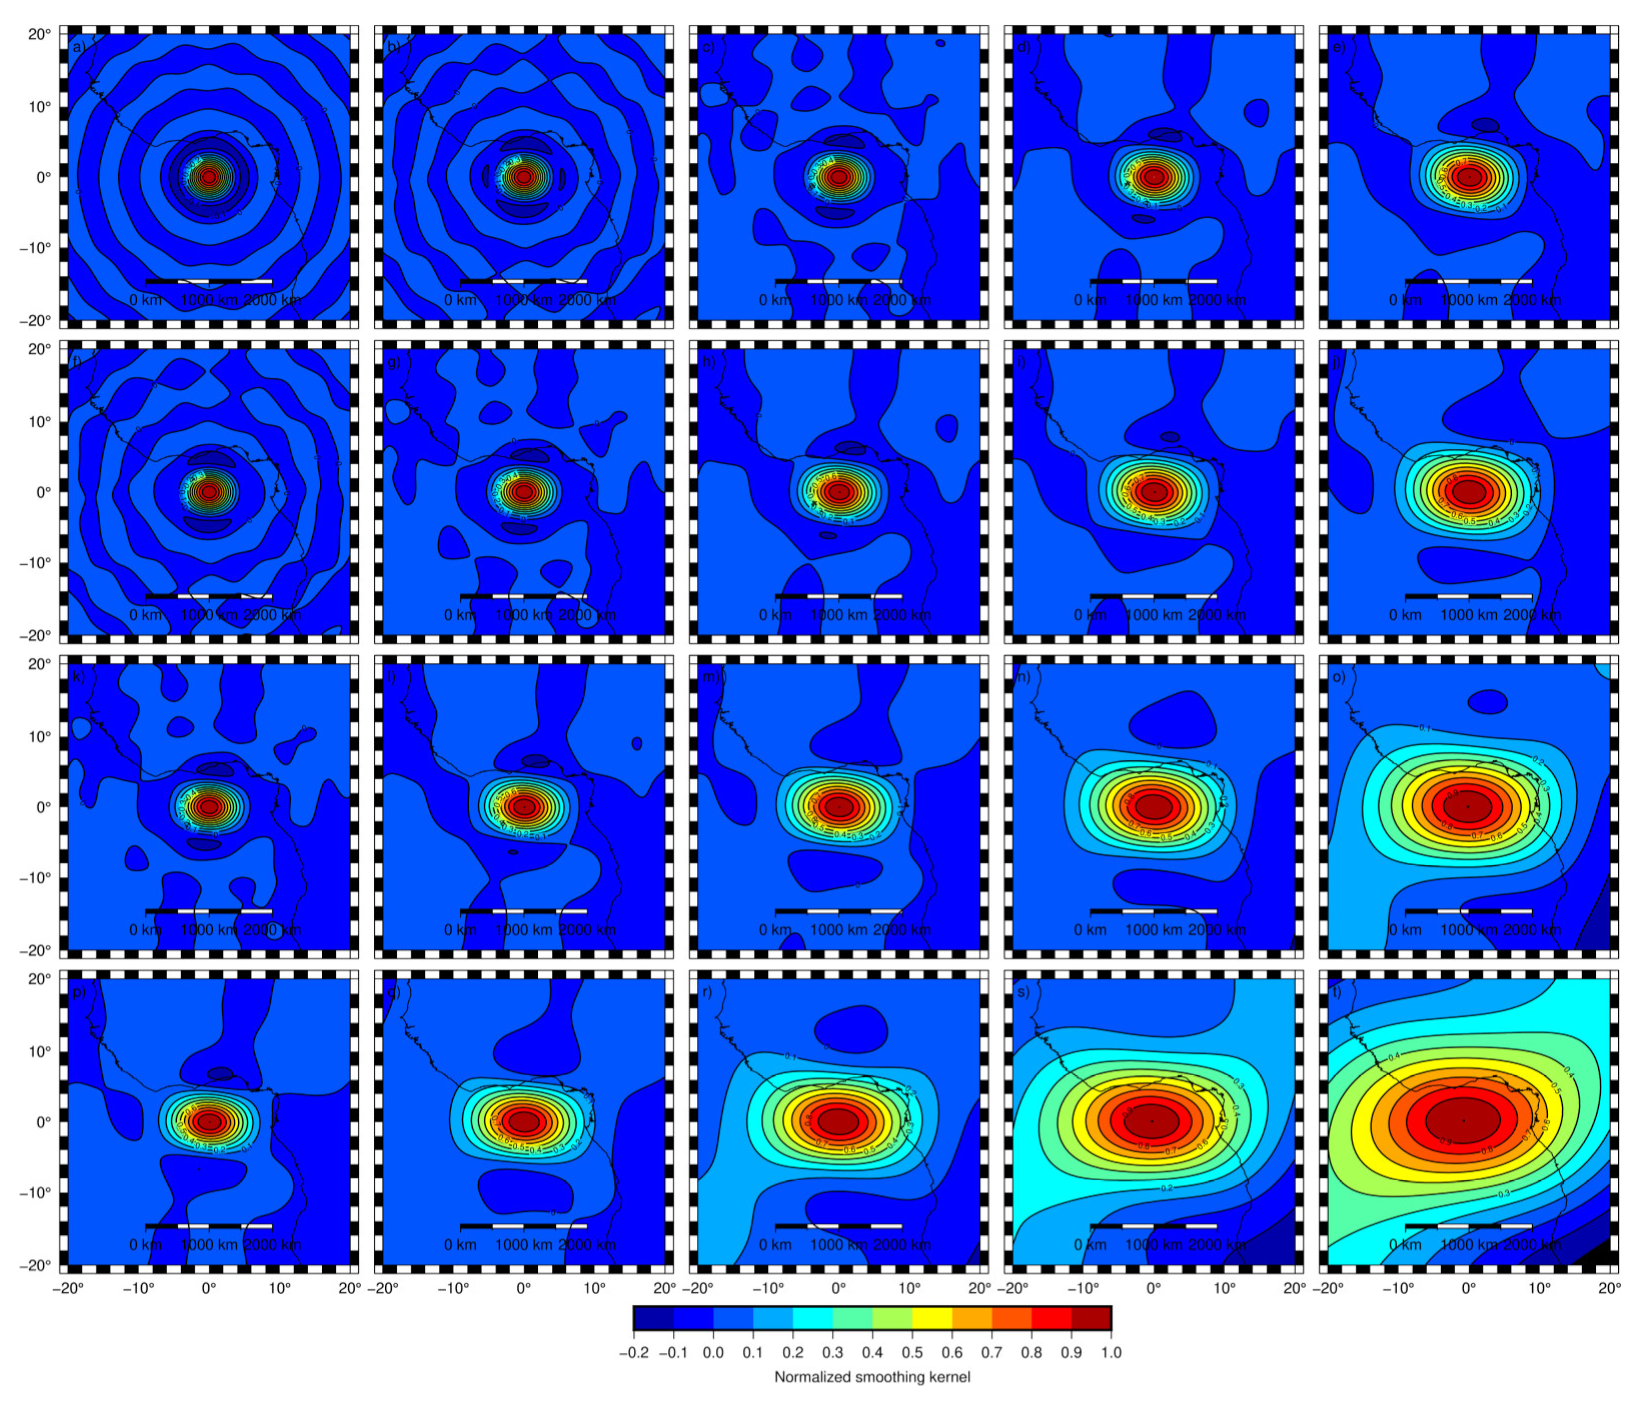
The time-variable gravity field solution in September 2004 and its ECM are taken as an example, to study the influence of the power index of SCM and regularization coefficient in an adaptive DDK filter. We tested four regularization coefficients, including 1 × 10¹⁵, 1 × 10¹⁶, 1 × 10¹⁷ and 1 × 10¹⁸, and five power indices of SCM, including 4.0, 4.5, 5.0, 5.5, and 6.0, totaling 20 hyperparametric combination schemes. Figure 14 shows the normalized smoothing kernel corresponding to each combination scheme, in which the kernel center is located at (0°E, 0°N). It is observed that the normalized smoothing kernel tends to expand with the increase of regularization coefficients and/or power indices. This is because the increase of the regularization coefficient strengthens the all-degree constraint, while the increase of the power index accelerates the attenuation of the signal variance from low degrees to high degrees, thus enhancing the suppression of the high-degree noise terms. Together, these two factors facilitate the flexible adjustment of the filtering strength. The larger the kernel is, the stronger the smoothing strength will be.
Table 5 presents the ESRs and HWPAs of the 20 filter kernels. ESR has been proved ineffective in distinguishing DDK filters with similar weak smoothing strength to that presented in Table 1. When the smoothing strength is strong, ESR is also found to be not capable of measuring filter strength, as shown in Table 5 (see the last row and column). On the contrary, the proposed HWPA always has a strong distinguishing ability, which makes it a reliable smoothing strength metric. By combining Figure 14 and Table 5, it is again proved that the increasing smoothing strength is closely related to both increasing regularization coefficient and power index.
Figure 15 shows the filtered solutions in the spatial domain with the 20 hyperparameter combination schemes for September 2004. From left to right and from top to bottom, the time-varying gravity field solution is from being under-smoothed (see Figure 15a) to being over-smoothed (see Figure 15t). Considering an extreme case, when the filter kernel is expanded to the global scale, the mass anomaly signal will be completely erased. The optimal filtered solution should be with a regularization coefficient 1 × 10¹⁷ and a power index 5.5, as presented in Figure 15n. There are visible geophysical features in the Amazon Basin, Congo River Basin, Ganges Basin, and Greenland, etc., with the stripes-pattern error completely removed.
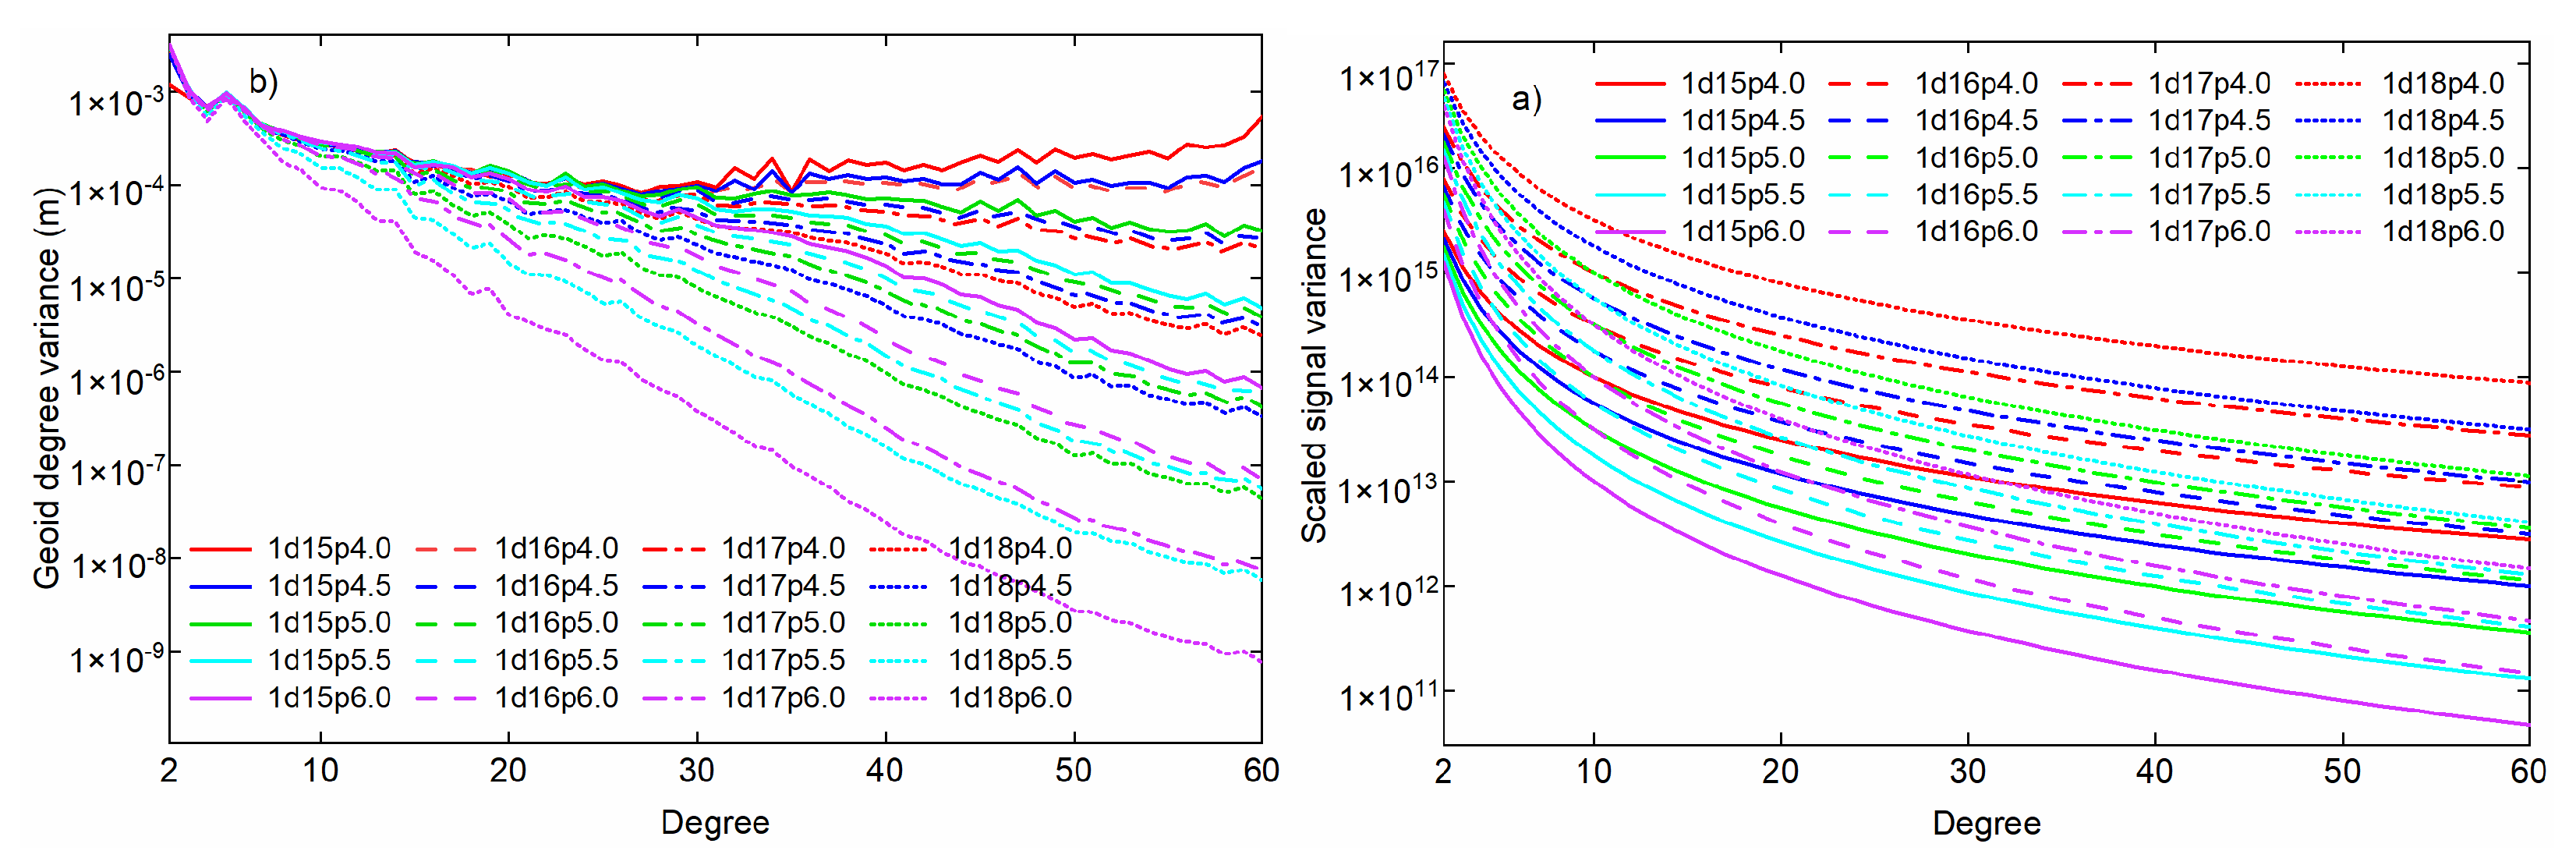
Finally, we also check the degree variances of 20 hyperparameter combination schemes, including priori signal variances scaled with regularization coefficients, and posterior geoid degree variances of filtered solution. The following observations can be made according to Figure 16. First, the regularization coefficients can only adjust the all-degree signal variances at the same time. For a fixed power index in SCM, a too large regularization coefficient may restrain the low-degree signal, while too small regularization coefficient may not be sufficient to suppress high-degree noise. Second, the power index in SCM can tune the signal variances between different degrees. For a fixed regularization coefficient, the power index can flexibly balance the retainment of low-degree signals and the suppression of high-degree noise. Third, by tuning both regularization coefficient and power index according to the data themselves, more filtering solutions with different smoothing strengths can be expected, as in Figure 16b. For example, the filtered solution with a regularization coefficient 1 × 10¹⁵ and a power index 6.0 has comparable low-degree signals and less high-degree noises than all the filtered solutions with power index being 4, which has been widely used in conventional DDK filters. To sum up, the proposed adaptive DDK filter, adjusting both the power index and the regularization coefficient, promotes adaptability to the data and the optimality of the filtering results.

5. Conclusions

This work is devoted to designing a data-adaptive DDK filter. In this filter, the regularization coefficient and the power index of signal variances are adaptively determined from the data themselves according to the GCV criterion. The publicly available monthly error covariance matrices are adopted, so the filter is time-variable not only for error covariance matrices, but also for signal covariance matrices. Furthermore, we also define a metric for filtering strength called half-weight polygon area. We believe that the scope of the filtering kernel can more reasonably define the filtering strength than the conventional half-weight radius only in the cardinal directions. Through a 7-year real GRACE data test, the following conclusions and discussions are drawn:
(1)
Both the regularization coefficient and the power index can be used to adjust the signal variances. Although the increase of the regularization coefficient and the power index results in a stronger smoothing strength, the mechanisms of the two parameters are different. The regularization coefficient controls the signal variances of all degrees, while the power index regulates the signal variances between different degrees. In other words, the former is global regulation, whereas the latter is local regulation. By tuning the two parameters according to the GCV criterion, the adaptability to the data and the optimality of the filtering results can be significantly enhanced;
(2)
Compared with the equivalent smoothing radius in [11], the proposed half-weight kernel polygon area is proved to have a more significant distinguishing ability, especially when the filtering strength is too weak and close, or the filtering strength is too strong;
(3)
The need for filtering is mainly split up in an along- and cross-track direction, based on orbit inclination, orbit height, and ground track spacing. The authors think that filtering with only four cardinal directions taken into account is a simplification in itself, as shown in Figure 5a and Figure 6a. Are the stripes strictly distributed north–south? The answer is, not necessarily. The causes include but are not limited to: (1) the de-aliasing error caused by the incorrectness of the models of tidal and atmospheric ocean non-tidal variation [30]; (2) the shortcomings of instrument accuracy and existing GRACE data processing methods [9,13]. This raises the necessity that the filter can be designed to take into account directions other than the cardinal ones. The anisotropic DDK filter is exactly such a filter that takes into account all directions including the cardinal directions. As shown in Figure 14, the filter kernel is not distributed strictly according to north-south and west-east directions, and the filter kernel can be approximately rectangular/elliptical, or wide/narrow. This indicates: (1) in the conventional approach, the algebraic averages of half-weight smoothing radii in four main directions (east, west, north, and south) are not accurate enough to measure the filtering strength; (2) the proposed HWPA, taking all directions into account, can reasonably measure the filtering strength, regardless of the shape and scope of the kernel. In the future, the research will be focused on optimizing the azimuth-anisotropic HWPA to make it more reasonable to measure the smoothing strength of the location-inhomogeneous filter.
Our research provides an alternative filtering scheme for someone who wants mass anomalies from GRACE/GRACE-FO time-variable gravity field solutions. The anisotropic filtering strength metric, HWPA, can help people choose their ideal filtering strength. A better estimation of global/local mass anomalies will be beneficial in the context of water management, glacier monitoring, and climatological studies.

Author Contributions

Conceptualization, G.C.; methodology, G.C. and N.Q.; software, N.Q.; validation, G.C. and W.S.; formal analysis, J.G. and Z.Y.; investigation, J.G. and Z.Y.; resources, J.G.; data curation, N.Q.; writing—original draft preparation, N.Q., G.C.; writing—review and editing, W.S., J.G. and Z.Y.; visualization, N.Q.; supervision, J.G.; project administration, G.C. and J.G.; funding acquisition, G.C., J.G. and N.Q. All authors have read and agreed to the published version of the manuscript.

Funding

This work is partially sponsored by the National Natural Science Foundation of China (Grant Nos. 41974026, 42074001, and 41774005), partially by the Postgraduate Research & Practice Innovation Program of Jiangsu Province (Grant No. KYCX21_2292), and partially by Postgraduate Innovation Program of China University of Mining and Technology (Grant No. 2021WLKXJ098).

Data Availability Statement

The CSR GRACE monthly gravity solutions and error covariance matrices used in the study are available via http://download.csr.utexas.edu/outgoing/grace (accessed on 2 April 2022). The GRACE MATLAB Toolbox (GRAMAT) software is used for the calculation mass anomaly [31]. The basin boundaries are provided at http://hydro.iis.u-tokyo.ac.jp/~taikan/TRIPDATA/TRIPDATA.html (accessed on 2 April 2022). The geometry of the considered lakes was generated with Generic Mapping Tools (GMT) software [32], which makes use of the Global Self-consistent, Hierarchical, High-resolution Geography database (GSHHG) at https://www.soest.hawaii.edu/pwessel/gshhg (accessed on 2 April 2022). GMT software was also used to create the plots.

Acknowledgments

Jurgen Kusche is acknowledged for insightful discussions on regularization methods in gravity data processing during Guobin’s visit to University of Bonn. The support provided by the China Scholarship Council (CSC) during Nijia’s and Zhengwen’s visits to the Delft University of Technology is also acknowledged. We would like to thank Wei Feng for providing the GRACE MATLAB Toolbox (GRAMAT) [32], Roelof Rietbroek for making his codes on DDK filtering available, and Taikan Oki for providing basin boundaries. Gratitude is also extended to the Centre for Space Research (CSR) for providing GRACE monthly solutions and corresponding covariance matrices.

Conflicts of Interest

The authors declare no conflict of interest.

References

  1. Yi, S.; Sneeuw, N. A novel spatial filter to reduce north–south striping noise in GRACE spherical harmonic coefficients. J. Geod. 2022, 96, 1–17. [Google Scholar] [CrossRef]
  2. Guo, J.Y.; Li, W.D.; Chang, X.T.; Zhu, G.B.; Liu, X.; Guo, B. Terrestrial water storage changes over Xinjiang extracted by combining Gaussian filter and multichannel singular spectrum analysis from GRACE. Geophys. J. Int. 2018, 213, 397–407. [Google Scholar] [CrossRef]
  3. Xiang, L.; Wang, H.; Steffen, H.; Qiao, B.; Feng, W.; Jia, L.; Gao, P. Determination of Weak Terrestrial Water Storage Changes from GRACE in the Interior of the Tibetan Plateau. Remote Sens. 2022, 14, 544. [Google Scholar] [CrossRef]
  4. Swenson, S.; Wahr, J. Post-processing removal of correlated errors in GRACE data. Geophys. Res. Lett. 2006, 33, 8. [Google Scholar] [CrossRef]
  5. Duan, X.J.; Guo, J.Y.; Shum, C.K.; van der Wal, W. On the postprocessing removal of correlated errors in GRACE temporal gravity field solutions. J. Geod. 2009, 83, 1095–1106. [Google Scholar] [CrossRef] [Green Version]
  6. Belda, S.; Garcia-Garcia, D.; Ferrandiz, J.M. On the decorrelation filtering of RL05 GRACE data for global applications. Geophy. J. Int. 2015, 200, 173–184. [Google Scholar] [CrossRef] [Green Version]
  7. Jekeli, C. Alternative Methods to Smooth the Earth’s Gravity Field; Ohio State University: Columbus, OH, USA, 1981. [Google Scholar]
  8. Wahr, J.; Molenaar, M.; Bryan, F. Time variability of the Earth’s gravity field: Hydrological and oceanic effects and their possible detection using GRACE. J. Geophy. Res. Solid Earth 1998, 103, 30205–30229. [Google Scholar] [CrossRef]
  9. Kusche, J. Approximate decorrelation and non-isotropic smoothing of time-variable GRACE-type gravity field models. J. Geod. 2007, 81, 733–749. [Google Scholar] [CrossRef] [Green Version]
  10. Chang, G.; Qian, N.; Chen, C.; Gao, J. Precise instantaneous velocimetry and accelerometry with a stand-alone GNSS receiver based on sparse kernel learning. Measurement 2020, 159, 107803. [Google Scholar] [CrossRef]
  11. Kusche, J.; Schmidt, R.; Petrovic, S.; Rietbroek, R. Decorrelated GRACE time-variable gravity solutions by GFZ, and their validation using a hydrological model. J. Geod. 2009, 83, 903–913. [Google Scholar] [CrossRef] [Green Version]
  12. Horvath, A.; Murböck, M.; Pail, R.; Horwath, M. Decorrelation of GRACE time variable gravity field solutions using full covariance information. Geosciences 2018, 8, 323. [Google Scholar] [CrossRef] [Green Version]
  13. Klees, R.; Revtova, E.; Gunter, B.; Ditmar, P.; Oudman, E.; Winsemius, H.; Savenije, H. The design of an optimal filter for monthly GRACE gravity models. Geophy. J. Int. 2008, 175, 417–432. [Google Scholar] [CrossRef] [Green Version]
  14. Kaula, W.M. The investigation of the gravitational fields of the moon and planets with artificial satellites. Advan. Space Sci. Technol. 1963, 5, 210–230. [Google Scholar]
  15. Xu, P.; Fukuda, Y.; Liu, Y. Multiple parameter regularization: Numerical solutions and applications to the determination of geopotential from precise satellite orbits. J. Geod. 2006, 80, 17–27. [Google Scholar] [CrossRef]
  16. Xu, P.; Rummel, R. Generalized ridge regression with applications in determination of potential fields. Manuscr. Geod. 1994, 20, 8–20. [Google Scholar]
  17. Golub, G.H.; Heath, M.; Technometrics, G.W.J. Generalized cross-validation as a method for choosing a good ridge parameter. Technometrics 1979, 21, 215–223. [Google Scholar] [CrossRef]
  18. Qian, N.; Chang, G.; Gao, J.; Pan, C.; Yang, L.; Li, F.; Yu, H.; Bu, J. Vehicle’s Instantaneous Velocity Reconstruction by Combining GNSS Doppler and Carrier Phase Measurements Through Tikhonov Regularized Kernel Learning. IEEE Trans. Veh. Technol. 2021, 70, 4190–4202. [Google Scholar] [CrossRef]
  19. Qian, N.; Chang, G.; Ditmar, P.; Gao, J.; Wei, Z. Sparse DDK: A Data-Driven Decorrelation Filter for GRACE Level-2 Products. Remote Sens. 2022, 14, 2810. [Google Scholar] [CrossRef]
  20. Ditmar, P. Conversion of time-varying Stokes coefficients into mass anomalies at the Earth’s surface considering the Earth’s oblateness. J. Geod. 2018, 92, 1401–1412. [Google Scholar] [CrossRef] [Green Version]
  21. Pu, L.; Fan, D.; You, W.; Yang, X.; Nigatu, Z.M.; Jiang, Z. Extracting terrestrial water storage signals from GRACE solutions in the Amazon Basin using an iterative filtering approach. Remote Sens. Lett. 2022, 13, 14–23. [Google Scholar] [CrossRef]
  22. Koch, K.R.; Kusche, J. Regularization of geopotential determination from satellite data by variance components. J. Geod. 2002, 76, 259–268. [Google Scholar] [CrossRef]
  23. Kusche, J. A Monte-Carlo technique for weight estimation in satellite geodesy. J. Geod. 2003, 76, 641–652. [Google Scholar] [CrossRef] [Green Version]
  24. Qian, N.; Chang, G. Optimal filtering for state space model with time-integral measurements. Measurement 2021, 176, 109209. [Google Scholar] [CrossRef]
  25. Kleinherenbrink, M.; Riva, R.; Sun, Y. Sub-basin-scale sea level budgets from satellite altimetry, Argo floats and satellite gravimetry: A case study in the North Atlantic Ocean. Ocean. Sci. 2016, 12, 1179–1203. [Google Scholar] [CrossRef]
  26. Zhang, X.; Li, J.; Dong, Q.; Wang, Z.; Zhang, H.; Liu, X. Bridging the gap between GRACE and GRACE-FO using a hydrological model. Sci. Total Environ. 2022, 822, 153659. [Google Scholar] [CrossRef] [PubMed]
  27. Luthcke, S.B.; Rowlands, D.D.; Lemoine, F.G.; Klosko, S.M.; Chinn, D.; McCarthy, J.J. Monthly spherical harmonic gravity field solutions determined from GRACE inter-satellite range-rate data alone. Geophys. Res. Lett. 2006, 33, 2402. [Google Scholar] [CrossRef]
  28. Chen, Q.; Shen, Y.; Chen, W.; Zhang, X.; Hsu, H. An improved GRACE monthly gravity field solution by modeling the non-conservative acceleration and attitude observation errors. J. Geod. 2016, 90, 503–523. [Google Scholar] [CrossRef]
  29. Chen, J.L.; Wilson, C.R.; Blankenship, D.; Tapley, B.D. Accelerated Antarctic ice loss from satellite gravity measurements. Nat. Geosci. 2009, 2, 859–862. [Google Scholar] [CrossRef]
  30. Kurtenbach, E.; Mayer-Guerr, T.; Eicker, A. Deriving daily snapshots of the Earth’s gravity field from GRACE L1B data using Kalman filtering. Geophys. Res. Lett. 2009, 36, 17102. [Google Scholar] [CrossRef]
  31. Feng, W. GRAMAT: A comprehensive Matlab toolbox for estimating global mass variations from GRACE satellite data. Earth Sci. Inform. 2019, 12, 389–404. [Google Scholar] [CrossRef]
  32. Wessel, P.; Smith, W.H.; Scharroo, R.; Luis, J.; Wobbe, F. Generic mapping tools: Improved version released. Eos Trans. Am. Geophys. Union 2013, 94, 409–410. [Google Scholar] [CrossRef] [Green Version]
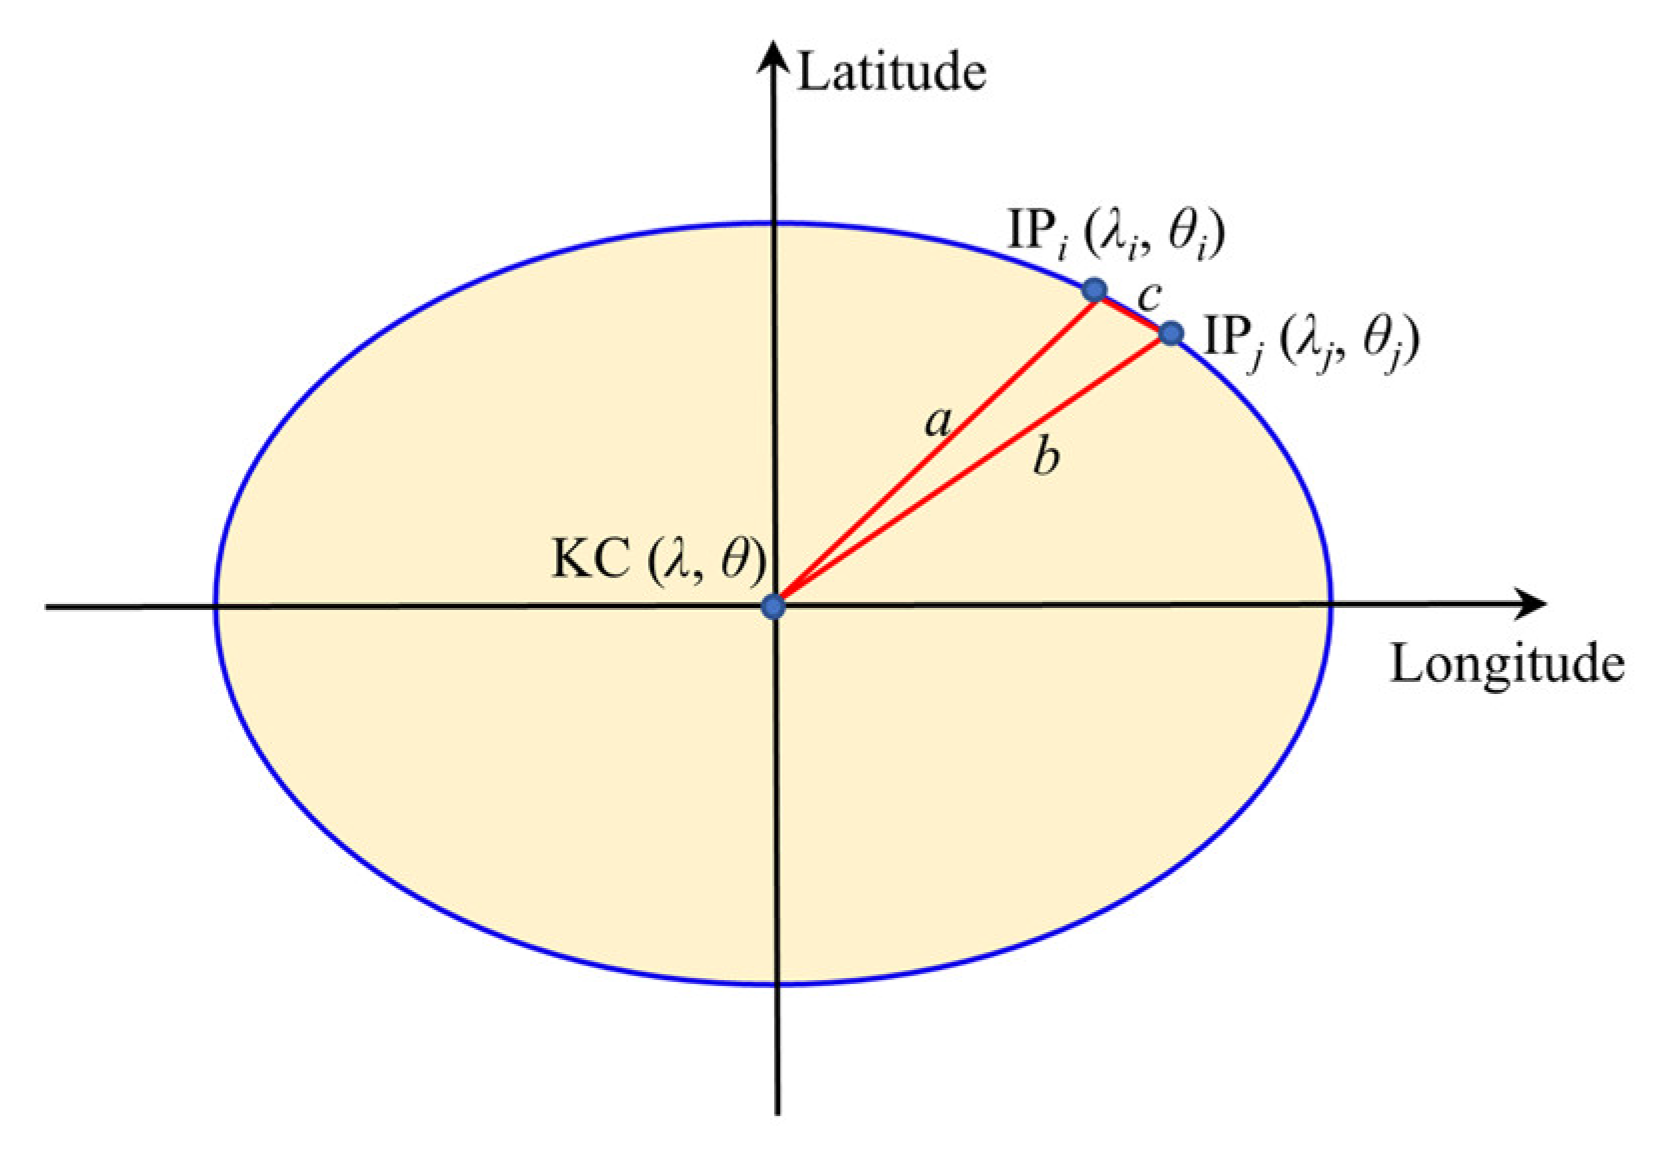
Figure 1. The calculation theory of half-weight polygon area (HWPA) with kernel center (KC) located at (λ, θ). The curvature between integral point (IP) i and j is neglected, thus approximating the fan-shaped integral polygon as a triangle. The symbols a, b and c represent the lengths of the three sides of the triangle KC-IPi-IPj.
Remotesensing 14 03114 g001
Figure 2. The optimized hyperparameters for each month from January 2004 to December 2010 through GCV criterion: (a) stationary DDK, (b) VADER filter, (c) adaptive DDK. Note that the power indices for VADER filter are taken from Figure 2 in [12].
Remotesensing 14 03114 g002
Figure 3. The normalized smoothing kernel weights with kernel center located at different latitudes: 0° (a,d), 30° (b,e), and 60° (c,f) along the 0° meridian. The adaptive DDK filters for September 2006 (a,b) and July 2010 (df) with power indices selected as 6.5 and 3.4, and with regularization coefficients selected as 1 × 10¹⁵ and 5 × 10¹⁸, respectively.
Remotesensing 14 03114 g003
Figure 4. The north–south (red) and east–west (blue) cross-sections of normalized smoothing kernel with kernel center located at different latitudes: 0° (a,d), 30° (b,e), and 60° (c,f) along the 0° meridian. The adaptive DDK filters for September 2006 (top) and July 2010 (bottom) with power indices selected as 6.5 and 3.4, and with regularization coefficients selected as 1 × 10¹⁵ and 5 × 10¹⁸, respectively.
Remotesensing 14 03114 g004
Figure 5. The unfiltered and filtered solutions expressed in EWH in September 2006. Note that the ECMs in all DDK filters are the same and the hyperparameters in them are optimized according to the GCV criterion.
Remotesensing 14 03114 g005
Figure 6. The unfiltered and filtered solutions expressed in EWH in July 2010. Note that the ECMs in all DDK filters are the same and the hyperparameters in them are optimized according to the GCV criterion.
Remotesensing 14 03114 g006
Figure 7. Local total mass anomaly time series of different filtered solutions. The unit is gigatons (Gt). The CSR RL06 v2.0 mascon solutions are included for comparison.
Remotesensing 14 03114 g007
Figure 8. The unfiltered and filtered solutions in the SH domain for September 2006.
Remotesensing 14 03114 g008
Figure 9. The unfiltered and filtered solutions in the SH domain for July 2010.
Remotesensing 14 03114 g009
Figure 10. The unfiltered (a,c) and filtered (b,d) SH coefficient Cnm of the degree n for a specific order m = 28, in September 2006 (top) and July 2010 (bottom).
Remotesensing 14 03114 g010
Figure 11. The geoid degree variances of filtered solutions for (a) September 2006, (b) July 2010, and (c) the 7-year means from January 2004 to December 2010. The cluster of brown curves represents the monthly geoid degree variances of the adaptive DDK filtered solution. The vertical dashed line, corresponding to degree 30, is shown to help compare the signal level (the first 30 degree) and noise level (the last 30 degrees) in the filtering solution intuitively.
Remotesensing 14 03114 g011aRemotesensing 14 03114 g011b
Figure 12. Annual amplitude of different filtered solutions in terms of EWH from January 2004 to December 2010. The annual amplitude is derived from annual periodic terms.
Remotesensing 14 03114 g012
Figure 13. Residuals STD of filtered global mass anomaly from January 2004 to December 2010. To obtain the residuals, the constant, trend, annual, and semiannual signal terms are deducted from the filtered solutions. The noise STDs averaged over the entire ocean are: unfiltered (23.4 cm), Gaussian 300 km (3.7 cm), Gaussian 500 km (1.5 cm), DGSW (5.2 cm), two-step-300 filter (1.9 cm), two-step-500 filter (1.4 cm), stationary DDK (2.0 cm), VADER (2.1 cm), adaptive DDK (2.1 cm) and mascon (2.1 cm), respectively.
Remotesensing 14 03114 g013
Figure 14. The normalized smoothing kernel (located at 0°E, 0°N) of different regularization coefficients and different power indices with ECM in September 2006. (at) The regularization coefficients from top to bottom are 1 × 10¹⁵, 1 × 10¹⁶, 1 × 10¹⁷ and 1 × 10¹⁸, respectively. The power indices of SCMs from left to right are 4.0, 4.5, 5.0, 5.5, and 6.0, respectively.
Remotesensing 14 03114 g014
Figure 15. The filtered solution of different regularization coefficients and different power indices with ECM in September 2004. (at) The regularization coefficients from top to bottom are 1 × 10¹⁵, 1 × 10¹⁶, 1 × 10¹⁷ and 1 × 10¹⁸, respectively. The power indices of SCMs from left to right are 4.0, 4.5, 5.0, 5.5, and 6.0, respectively.
Remotesensing 14 03114 g015
Figure 16. The degree variances of different regularization coefficients and different power indices: (a) the signal variances scaled with regularization coefficients; (b) the geoid degree variances of filtered solution.
Remotesensing 14 03114 g016
Table 1. The HWPAs and their averages, the ESRs in [11] of 8 DDK filters. The unit of HWPA is thousands of square kilometers, whereas that of ESR is kilometers.
DDKHWPA
(0°, 0°)
HWPA
(0°, 30°)
HWPA
(0°, 60°)
Average HWPAESR
DDK11613799022,85310,819536
DDK2808265762443236347
DDK341491622811204242
DDK436285518111009219
DDK52555131035601183
DDK6245414854504172
DDK7190286739405149
DDK8194246700380149
Table 2. The statistics of filtered global mass anomalies in terms of EWH (cm) in September 2006 and July 2010.
Filtered SolutionsSeptember 2006July 2010
MaxMinRMSMaxMinRMS
Gaussian 30036.8−50.05.832.2−69.56.4
Gaussian 50024.5−33.94.121.9−39.75.0
DGSW filter66.9−66.06.864.7−89.68.1
two-step-30028.3−40.94.730.8−60.25.9
two-step-50023.1−31.04.021.3−38.84.9
stationary DDK25.2−33.74.232.9−100.26.9
VADER filter30.8−40.24.426.0−105.26.6
adaptive DDK31.0−40.04.830.6−98.46.7
Mascon143.6−137.06.3165.8−345.311.8
Table 3. RMSD of local total mass anomalies of different filtered solutions (Gt). The CSR RL06 v2.0 mascon solutions are treated as referenced truth.
Filtered SolutionsCongoGangesRheinHai
Gaussian 300 km46.428.17.411.0
Gaussian 500 km51.439.36.912.1
DGSW filter46.426.75.99.0
two-step-30046.531.55.99.6
two-step-50052.442.76.912.2
Stationary DDK49.126.85.59.5
VADER filter63.128.65.59.7
adaptive DDK46.026.75.39.4
Table 4. The regional average annual amplitude (AAMP) and residual STD (RSTD) of filtered mass anomaly solutions at Congo Basin, Ganges Basin, Rhein Basin, and Hai River Basin. The results are based on data from January 2004 to December 2010, and presented in EWH (cm).
FilterIndicatorCongoGangesRheinHai
Gaussian 300 kmAAMP12.112.85.11.9
RSTD5.25.33.74.0
Gaussian 500 kmAAMP10.211.44.11.0
RSTD3.13.11.81.9
DGSW filterAAMP13.713.85.23.7
RSTD9.16.33.23.8
two-step-300AAMP12.012.54.82.1
RSTD4.03.72.22.7
two-step-500AAMP10.111.14.11.2
RSTD3.12.92.01.6
Stationary DDKAAMP12.513.04.21.5
RSTD3.74.12.42.2
VADER filterAAMP12.312.74.11.5
RSTD3.84.02.42.2
adaptive DDKAAMP12.913.44.31.6
RSTD3.84.12.42.2
masconAAMP13.113.46.81.8
RSTD3.56.12.23.3
Table 5. Filtering strength metrics of the kernel with different regularization coefficients and different power indices of SCM: equivalent smoothing radius (ESR) and half-weight polygon area (HWPA). The unit of HWPA is thousands of square kilometers, whereas that of ESR is kilometers.
IndicatorReg.\Pow.4.04.55.05.56.0
ESR1 × 1015149149175219281
1 × 1016149183236300393
1 × 1017190249334453570
1 × 1018272393570570570
HWPA1 × 10153643696039201998
1 × 1016442573112224675332
1 × 101765613673199716316,824
1 × 101815003714955524,23256,903
Publisher’s Note: MDPI stays neutral with regard to jurisdictional claims in published maps and institutional affiliations.