
The Assessment of More Suitable Image Spatial Resolutions for Offshore Aquaculture Areas Automatic Monitoring Based on Coupled NDWI and Mask R-CNN

 , ,
, ,
Abstract
: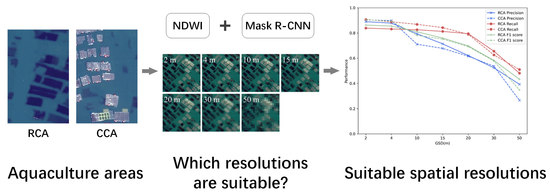
1. Introduction
2. Materials and Methods
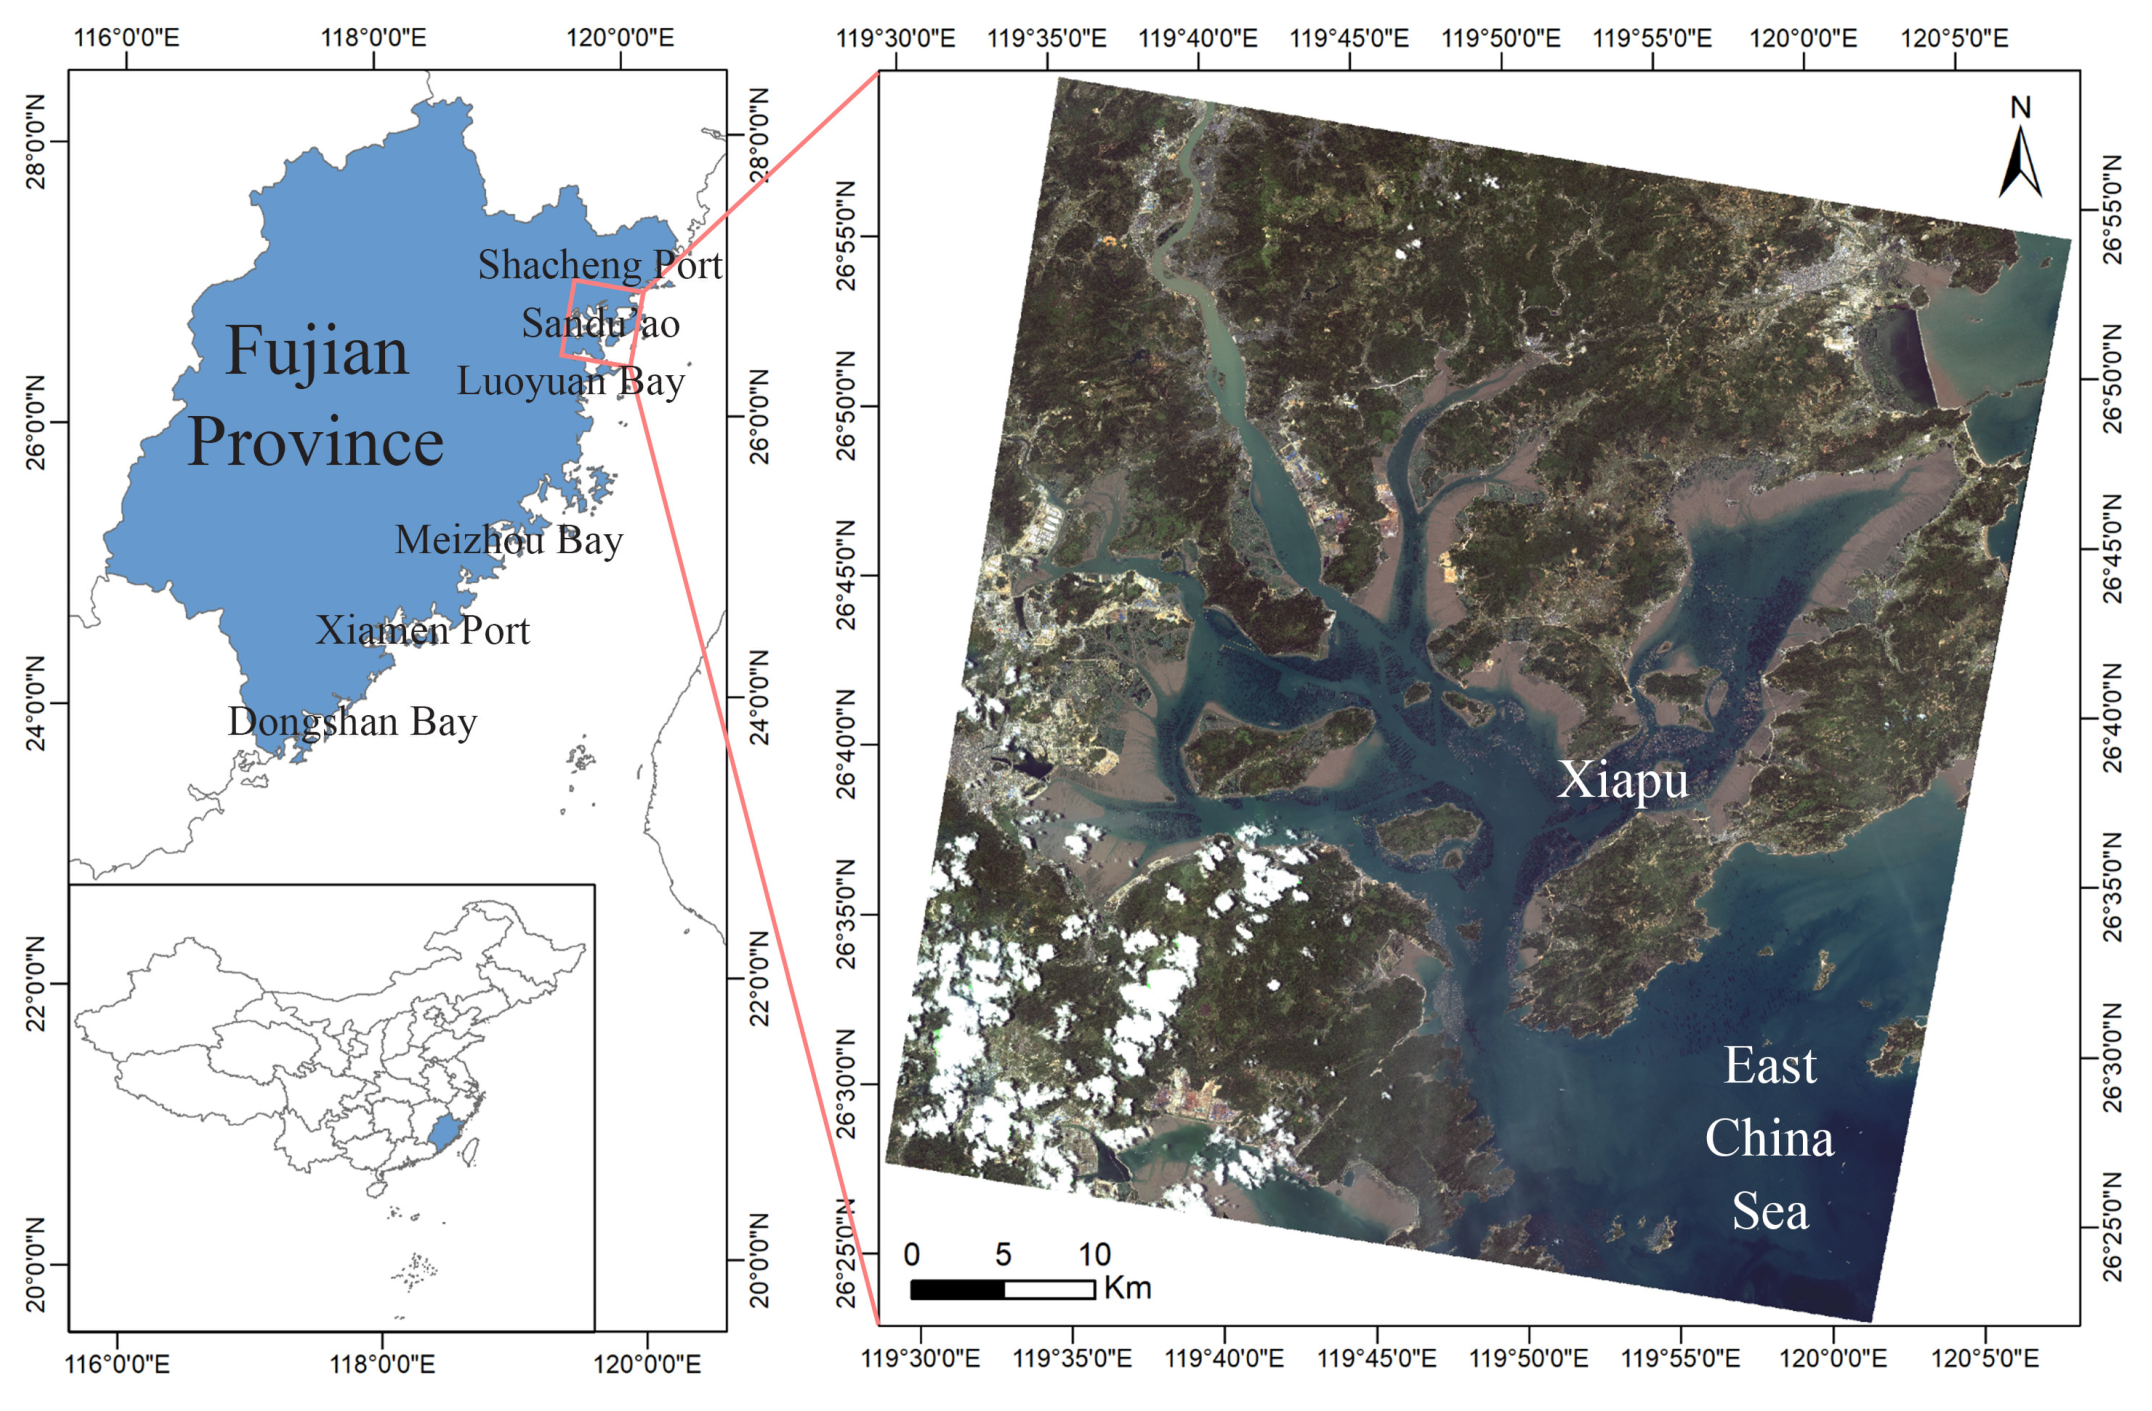
2.1. Study Area and Data Sources
2.1.1. Study Area
2.1.2. Data Sources
2.2. Method
2.2.1. Data Pre-Processing
Production of Training and Test Sets
Resampling of Multi-Resolution Data
2.2.2. Model Training and Validation
2.2.3. Cost-Effectiveness Evaluation
Cost Analysis
Effectiveness Analysis
Comprehensive Performance Evaluation
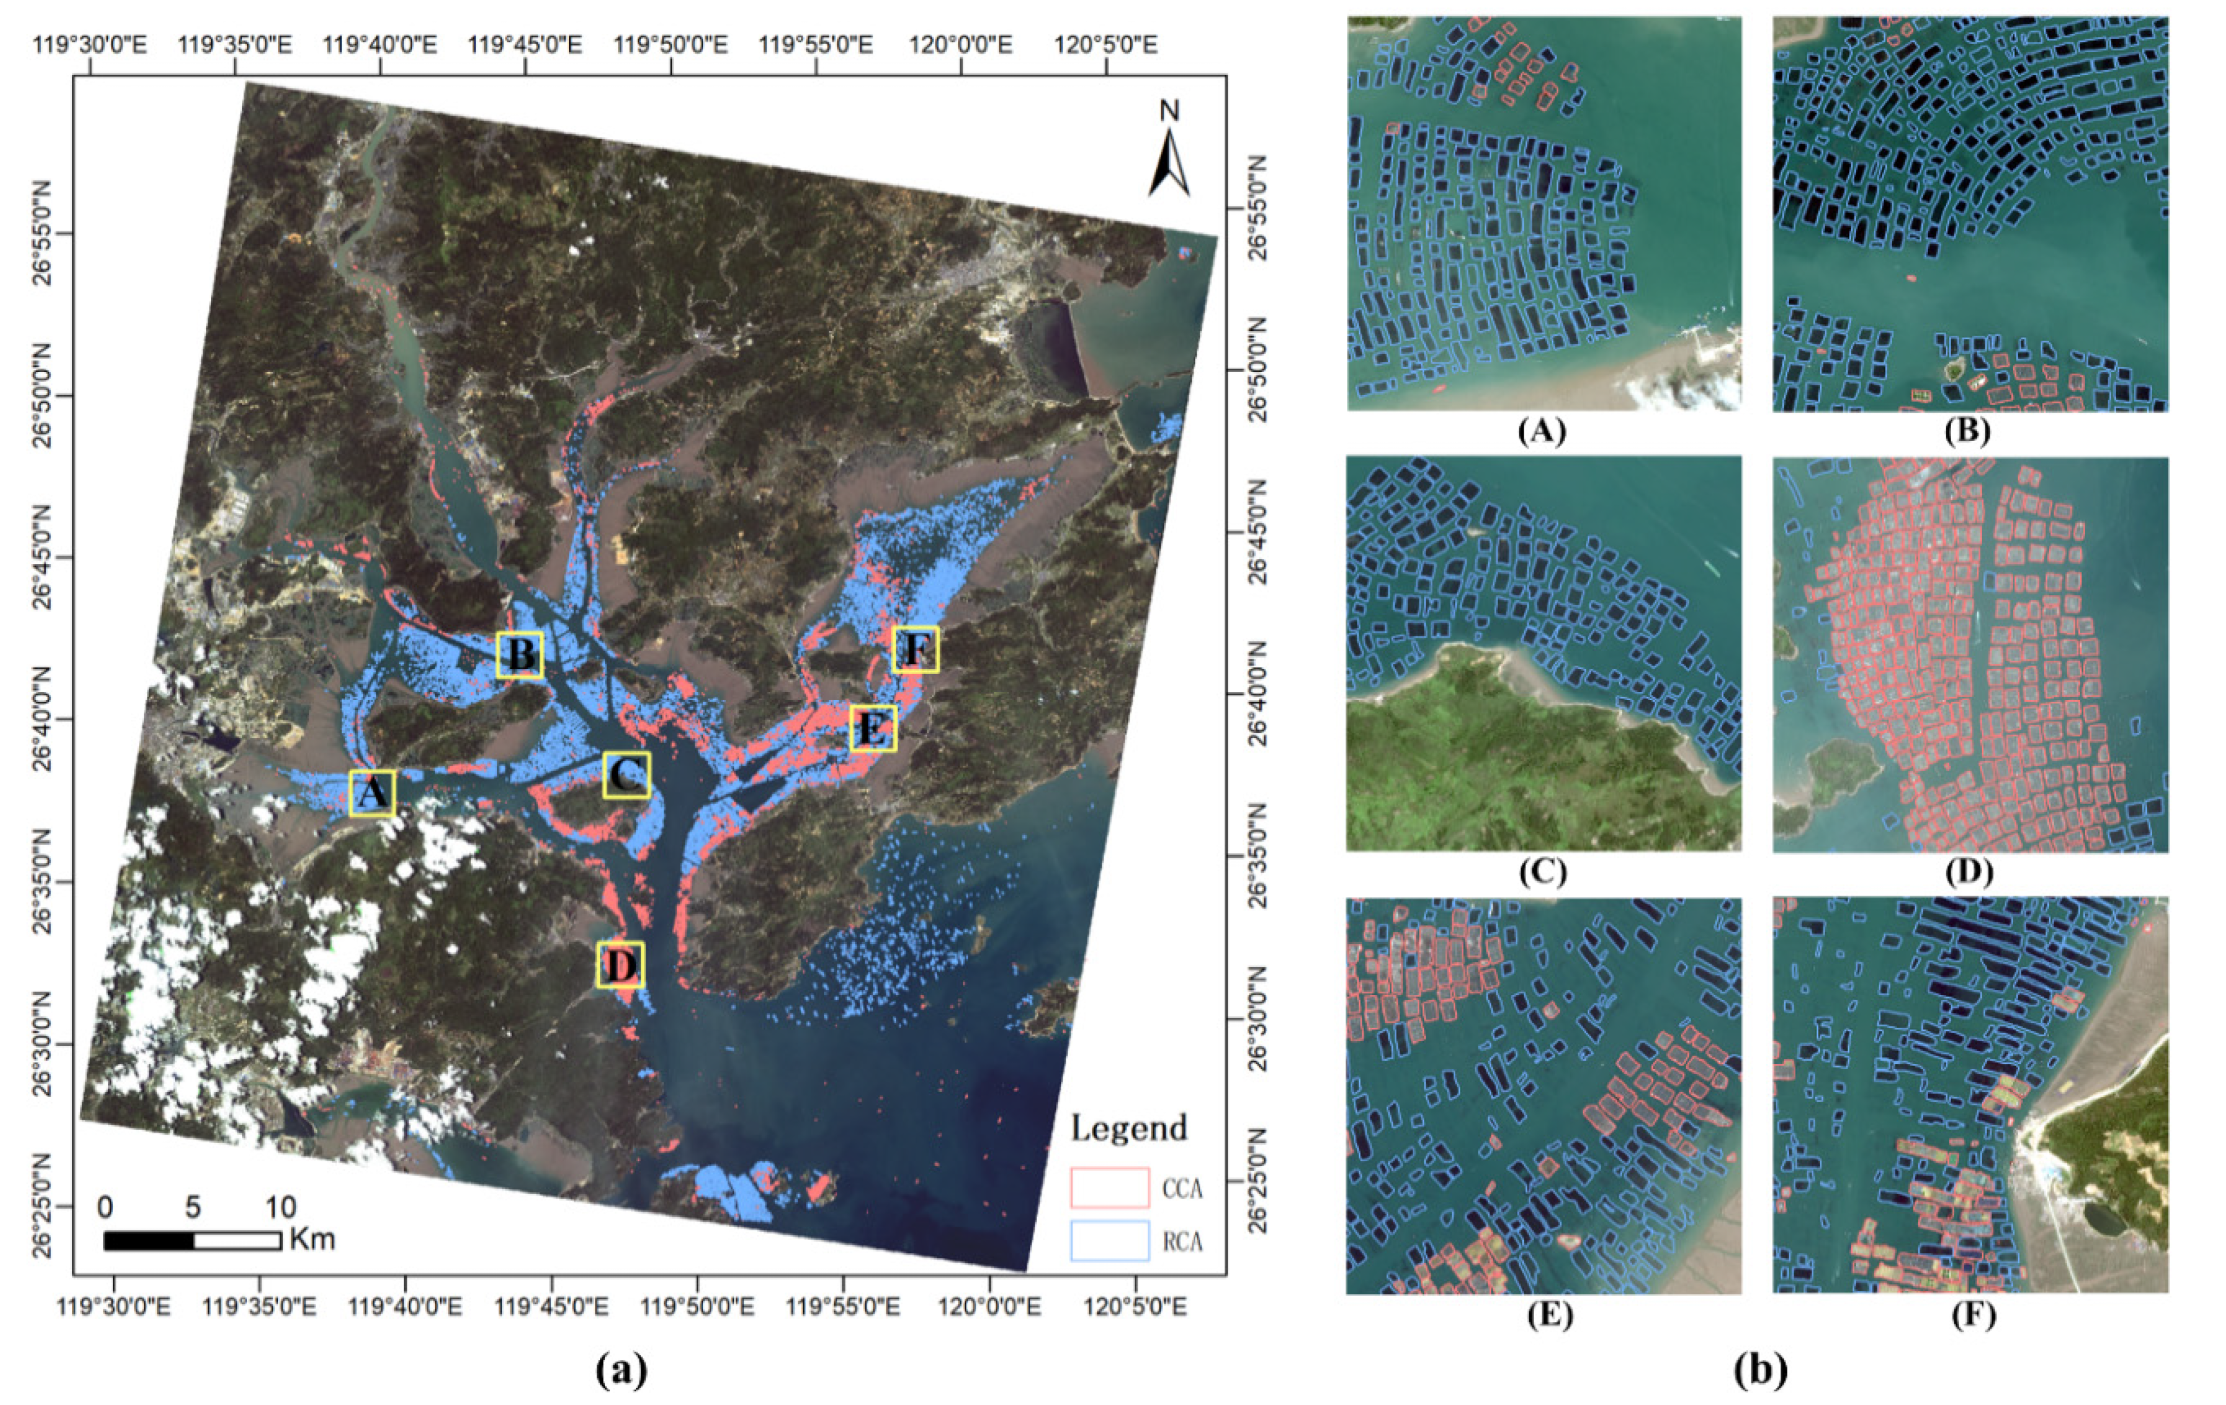
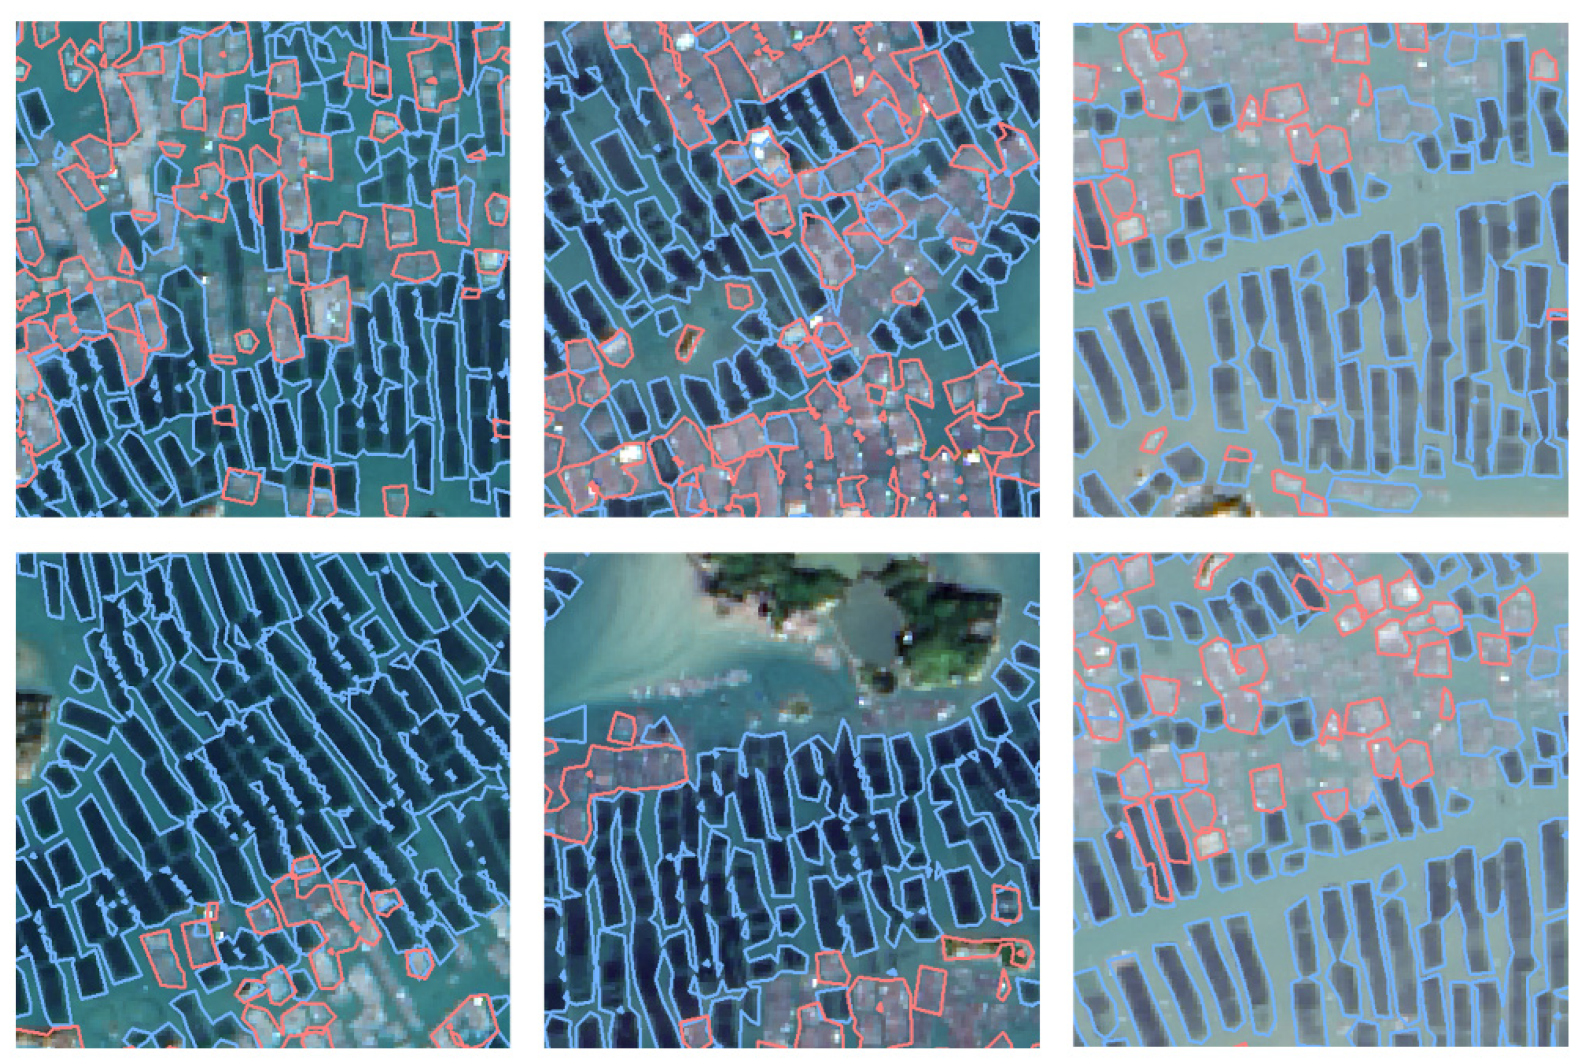
3. Results
3.1. Model Validation
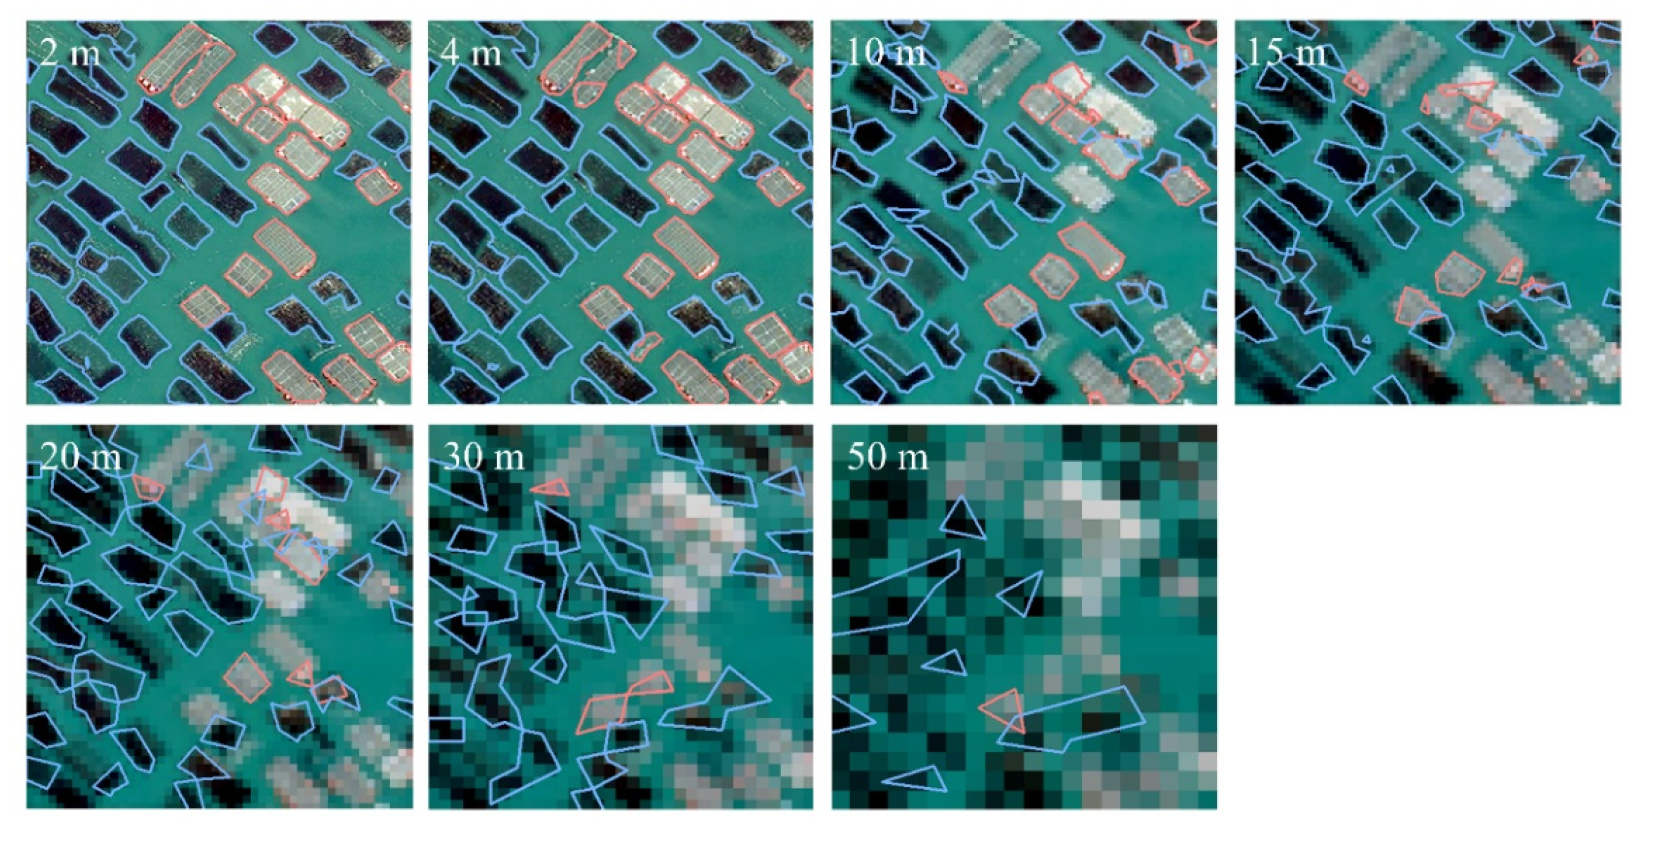
3.2. The Impact of Different Resolutions on Model Performance
3.3. Cost-Effectiveness Analysis of Aquaculture Monitoring
3.3.1. Price First
3.3.2. Effect First
3.3.3. Balancing Price with Effect
4. Discussion
5. Conclusions
Author Contributions
Funding
Data Availability Statement
Conflicts of Interest
References
- FAO. The State of World Fisheries and Aquaculture. Sustainability in Action; FAO: Rome, Italy, 2020. [Google Scholar]
- Penczak, T.; Galicka, W.; Molinski, M.; Kusto, E.; Zalewski, M. The Enrichment of a Mesotrophic Lake by Carbon, Phosphorus and Nitrogen from the Cage Aquaculture of Rainbow Trout, Salmo gairdneri. J. Appl. Ecol. 1982, 19, 371–393. [Google Scholar] [CrossRef]
- Mcginnis, M.V.; Collins, M. A Race for Marine Space: Science, Values, and Aquaculture Planning in New Zealand. Coast. Manag. 2013, 41, 401–419. [Google Scholar] [CrossRef]
- Liu, Y.; Wang, Z.; Yang, X.; Zhang, Y.; Yang, F.; Liu, B.; Cai, P. Satellite-based monitoring and statistics for raft and cage aquaculture in China’s offshore waters. Int. J. Appl. Earth Obs. 2020, 91, 102118. [Google Scholar] [CrossRef]
- Demirak, A.; Balci, A.; Tuefekci, M. Environmental impact of the marine aquaculture in Güllük Bay, Turkey. Environ. Monit. Assess. 2006, 123, 1. [Google Scholar] [CrossRef] [PubMed]
- Fu, Y.; Ye, Z.; Deng, J.; Zheng, X.; Wang, K. Finer Resolution Mapping of Marine Aquaculture Areas Using WorldView-2 Imagery and a Hierarchical Cascade Convolutional Neural Network. Remote Sens. 2019, 11, 1678. [Google Scholar] [CrossRef] [Green Version]
- Xu, Y.; Hu, Z.; Zhang, Y.; Wang, J.; Yin, Y.; Wu, G. Mapping Aquaculture Areas with Multi-Source Spectral and Texture Features: A Case Study in the Pearl River Basin (Guangdong), China. Remote Sens. 2021, 13, 4320. [Google Scholar] [CrossRef]
- Chu, J.; Shao, G.; Zhao, J.; Gao, N.; Wang, F.; Cui, B. Information extraction of floating raft aquaculture based on GF-1. Sci. Surv. Mapp. 2020, 45, 92–98. [Google Scholar]
- Liu, Y.; Yang, X.; Wang, Z.; Lu, C.; Li, Z.; Yang, F. Aquaculture area extraction and vulnerability assessment in Sanduao based on richer convolutional features network model. J. Oceanol. Limnol. 2019, 37, 1941–1954. [Google Scholar] [CrossRef]
- Lin, Q.; Lin, G.; Chen, Z.; Chen, Y. The Analysis on Spatial-temporal Evolution of Beach Cultivation and Its Policy Driving in Xiamen in Recent Two Decades. Geo-Inf. Sci. 2007, 9, 9–13. [Google Scholar]
- Lu, X.; Gu, Y.; Wang, X.; Lin, Y.; Zhao, Q.; Wang, K.; Liu, X.; Fei, X. The identification of Porphyra culture area by remote sensing and spatial distribution change and driving factors analysis. Mar. Sci. 2018, 42, 87–96. [Google Scholar]
- Zhang, Y.; Wang, C.; Chen, J.; Wang, F. Shape-Constrained Method of Remote Sensing Monitoring of Marine Raft Aquaculture Areas on Multitemporal Synthetic Sentinel-1 Imagery. Remote Sens. 2022, 14, 1249. [Google Scholar] [CrossRef]
- Fan, J.; Zhao, J.; An, W.; Hu, Y. Marine Floating Raft Aquaculture Detection of GF-3 PolSAR Images Based on Collective Multikernel Fuzzy Clustering. IEEE J. Sel. Top. Appl. Earth Obs. Remote Sens. 2019, 12, 2741–2754. [Google Scholar] [CrossRef]
- Geng, J.; Fan, J.; Wang, H. Weighted Fusion-Based Representation Classifiers for Marine Floating Raft Detection of SAR Images. IEEE Geosci. Remote Sens. Lett. 2017, 14, 444–448. [Google Scholar] [CrossRef]
- Hu, Y.; Fan, J.; Wang, J. Target recognition of floating raft aquaculture in SAR image based on statistical region merging. In Proceedings of the 2017 Seventh International Conference on Information Science and Technology (ICIST), Da Nang, Vietnam, 16–19 April 2017. [Google Scholar]
- Zhang, Y.; Wang, C.; Ji, Y.; Chen, J.; Deng, Y.; Chen, J.; Jie, Y. Combining Segmentation Network and Nonsubsampled Contourlet Transform for Automatic Marine Raft Aquaculture Area Extraction from Sentinel-1 Images. Remote Sens. 2020, 12, 4182. [Google Scholar] [CrossRef]
- Ottinger, M.; Bachofer, F.; Huth, J.; Kuenzer, C. Mapping Aquaculture Ponds for the Coastal Zone of Asia with Sentinel-1 and Sentinel-2 Time Series. Remote Sens. 2022, 14, 153. [Google Scholar] [CrossRef]
- Cui, B.; Fei, D.; Shao, G.; Lu, Y.; Chu, J. Extracting Raft Aquaculture Areas from Remote Sensing Images via an Improved U-Net with a PSE Structure. Remote Sens. 2019, 11, 2053. [Google Scholar] [CrossRef] [Green Version]
- Fu, Y.; Deng, J.; Wang, H.; Comber, A.; Yang, W.; Wu, W.; You, S.; Lin, Y.; Wang, K. A new satellite-derived dataset for marine aquaculture areas in the China’s coastal region. Earth Syst. Sci. Data 2020, 13, 1829–1842. [Google Scholar] [CrossRef]
- Liang, C.; Cheng, B.; Xiao, B.; He, C.; Liu, X.; Jia, N.; Chen, J. Semi-/Weakly-Supervised Semantic Segmentation Method and Its Application for Coastal Aquaculture Areas Based on Multi-Source Remote Sensing Images—Taking the Fujian Coastal Area (Mainly Sanduo) as an Example. Remote Sens. 2021, 13, 1083. [Google Scholar] [CrossRef]
- Fujian Development and Reform Commission. Layout and Construction Planning of Fishing Ports in Fujian Province; Fujian Development and Reform Commission: Fuzhou, China, 2020. [Google Scholar]
- Wang, Z. Analysis of Variation Trend of Water Quality Based on Time Series in Sansha Bay. Environ. Impact Assess. 2017, 39, 76–81. [Google Scholar]
- Lin, T.Y.; Maire, M.; Belongie, S.; Hays, J.; Zitnick, C.L. Microsoft COCO: Common Objects in Context; Springer International Publishing: Cham, Switzerland, 2014. [Google Scholar]
- Padilla, R.; Netto, S.L.; Silva, E.A.B.D. A Survey on Performance Metrics for Object-Detection Algorithms. In Proceedings of the 2020 Interna-tional Conference on Systems, Signals and Image Processing (IWSSIP), Rio de Janeiro, Brazil, 1–3 July 2020; pp. 237–242. [Google Scholar]
- Zhang, A.; Que, L.; Li, X.; Wang, Y.; Cui, W. Cost-benefit Model and Its Application of Reclaimed Water Project Based on Perspective of Stakeholders. Water Resour. Power 2021, 39, 136–139. [Google Scholar]


| Source | Format | Time Range | Space Range | Spatial Resolution/m |
|---|---|---|---|---|
| GF-1 | .tif | 13 June 2020 | 119°28′8″–120°9′44″E, 26°21′34″–27°0′24″N | 2 |
| Indicator | Raft Culture Area | Cage Culture Area |
|---|---|---|
| Precision | 0.890 | 0.904 |
| Recall | 0.839 | 0.908 |
| F1 score | 0.863 | 0.906 |
| Spatial Resolution/m | Cost/(USD/km2) | Effect | Price First | Effect First | Balancing | ||||||
|---|---|---|---|---|---|---|---|---|---|---|---|
| αE | βC | P | αE | βC | P | αE | βC | P | |||
| 2.5 | 2.361 | 0.883 | 0.708 | 0.883 | 0.175 | 0.142 | 1.766 | 1.624 | 0.142 | 0.883 | 0.741 |
| 5 | 1.417 | 0.858 | 0.425 | 0.858 | 0.433 | 0.085 | 1.716 | 1.631 | 0.085 | 0.858 | 0.773 |
| 10 | 1.102 | 0.805 | 0.331 | 0.805 | 0.474 | 0.066 | 1.610 | 1.544 | 0.066 | 0.805 | 0.739 |
Publisher’s Note: MDPI stays neutral with regard to jurisdictional claims in published maps and institutional affiliations. |
© 2022 by the authors. Licensee MDPI, Basel, Switzerland. This article is an open access article distributed under the terms and conditions of the Creative Commons Attribution (CC BY) license (https://creativecommons.org/licenses/by/4.0/).
Share and Cite
Wang, Y.; Zhang, Y.; Chen, Y.; Wang, J.; Bai, H.; Wu, B.; Li, W.; Li, S.; Zheng, T. The Assessment of More Suitable Image Spatial Resolutions for Offshore Aquaculture Areas Automatic Monitoring Based on Coupled NDWI and Mask R-CNN. Remote Sens. 2022, 14, 3079. https://doi.org/10.3390/rs14133079
Wang Y, Zhang Y, Chen Y, Wang J, Bai H, Wu B, Li W, Li S, Zheng T. The Assessment of More Suitable Image Spatial Resolutions for Offshore Aquaculture Areas Automatic Monitoring Based on Coupled NDWI and Mask R-CNN. Remote Sensing. 2022; 14(13):3079. https://doi.org/10.3390/rs14133079
Chicago/Turabian StyleWang, Yonggui, Yaxin Zhang, Yan Chen, Junjie Wang, Hui Bai, Bo Wu, Wei Li, Shouwei Li, and Tianyu Zheng. 2022. "The Assessment of More Suitable Image Spatial Resolutions for Offshore Aquaculture Areas Automatic Monitoring Based on Coupled NDWI and Mask R-CNN" Remote Sensing 14, no. 13: 3079. https://doi.org/10.3390/rs14133079
APA StyleWang, Y., Zhang, Y., Chen, Y., Wang, J., Bai, H., Wu, B., Li, W., Li, S., & Zheng, T. (2022). The Assessment of More Suitable Image Spatial Resolutions for Offshore Aquaculture Areas Automatic Monitoring Based on Coupled NDWI and Mask R-CNN. Remote Sensing, 14(13), 3079. https://doi.org/10.3390/rs14133079