Article

Optimizing the Assimilation of the GOES-16/-17 Atmospheric Motion Vectors in the Hurricane Weather Forecasting (HWRF) Model

1
Cooperative Institute for Meteorological Satellite Studies, University of Wisconsin-Madison, Madison, WI 53706, USA
2
NOAA NESDIS Center for Satellite Applications and Research, College Park, MD 207040, USA
3
I.M. Systems Group (IMSG), Rockville, MD 20852, USA
4
NOAA/NWS/NCEP/Environmental Modeling Center, College Park, MD 20740, USA
*
Author to whom correspondence should be addressed.
Remote Sens. 2022, 14(13), 3068; https://doi.org/10.3390/rs14133068
Submission received: 3 May 2022 / Revised: 21 June 2022 / Accepted: 23 June 2022 / Published: 26 June 2022

Abstract

:
Hourly and 15 min GOES-16 and -17 atmospheric motion vectors (AMVs) are evaluated using the 2020 version of the operational HWRF to assess their impact on tropical cyclone forecasting. The evaluation includes infrared (IR), visible (VIS), shortwave (SWIR), clear air, and cloud top water vapor (CAWV and CTWV) AMVs derived from the ABI imagery. Several changes are made to optimize the assimilation of these winds. The observational error profile is inflated to avoid overweighting of the AMVs. The range of allowable AMV wind speeds entering the assimilation system is increased to include larger wind speeds observed in tropical cyclones. Two data quality checks, commonly used for rejecting AMVs, namely QI and PCT1, have been removed. These changes resulted in a 20–40% increase in the number of AMVs assimilated. One additional change, specific to infrared AMVs, is narrowing the atmospheric layer where IR AMVs are rejected from 400–800 hPa to 400–600 hPa. The AMVs’ impact on forecast skill is assessed using storms from the North Atlantic and the Eastern Pacific, respectively. Overall, GOES-16 and -17 AMVs are beneficial for improving tropical cyclone forecasting. Positive analysis and forecast impact are obtained for track error, intensity error, minimum central pressure error, and storm size.

1. Introduction

Weather observations provide essential information for data assimilation and forecasting of the atmosphere, which is especially important for high-impact weather such as tropical cyclones. The atmospheric motion vectors (AMVs) supplement direct observations of the vector wind field provided by conventional data (e.g., rawinsondes). Conventional data are unevenly distributed and often concentrated over land. AMVs help to fill in data void regions in the initialization of the Hurricane Weather and Forecasting (HWRF) model used for tropical cyclone forecasting. These AMVs are derived by tracking the horizontal motion of atmospheric fields such as clouds or water vapor gradients from consecutive geostationary satellite images [1], thus having large spatial coverage and more frequent observations.
Numerical Weather Prediction (NWP) Centers have used AMVs from earlier geostationary satellites in their global and/or regional models after showing improved forecast skill [2,3,4,5,6]. The abundance of high temporal and spatial resolution satellite AMVs in the tropics is especially beneficial around tropical cyclones. The authors of [7] showed that the assimilation of these AMVs have improved analyses and intensity forecasts of tropical cyclones, most notably in the upper outflow regions. Assimilation studies using hourly AMVs conducted by the U.S. Navy, using the Navy Operational Global Atmospheric Prediction System [8], showed positive impacts in tropical cyclone track forecasts [9,10,11]. Refs. [7,12,13,14,15] concluded that variational assimilation techniques produce a 100–200 km reduction in tropical cyclone mean track errors when hourly cloud-drift AMVs from Geostationary Operational Environmental Satellite GOES-8 and Geostationary Meteorological Satellite-5 were assimilated. Ref. [16] showed that the assimilation of all five types of hourly AMVs from GOES-13 into operational HWRF helped to improve many of the tropical cyclone forecast metrics.
GOES-16, the first of the United States’ third-generation geostationary satellite in the GOES-R series, was launched on 19 November 2016. One of the instruments onboard GOES-16 is the Advanced Baseline Imager (ABI) [17]. ABI is a 16-band radiometer covering the visible, near-infrared, and infrared portions of the electromagnetic spectrum with four times the spatial resolution and five times faster coverage than instruments on earlier GOESs. ABI is capable of handling multiple scan scenarios. Scan scenario 6 is the default and most commonly used. With scan scenario 6, full disk images are acquired every 10 min, CONtinental United States (CONUS) images are taken every 5 min and mesoscale images are taken every minute. The scan coverage for full disk and CONUS are fixed. The mesoscale scans target high-impact weather, and their locations can change based on operational needs. More details on ABI can be found in [17].
Multiple ABI scans are processed to derive AMVs using the GOES-R nested tracking algorithm [18]. Wind vectors in a search box are derived from multiple targets. A cluster analysis algorithm is then applied to select the final motion vector from the largest cluster in the search box [19]. Ref. [18] showed that AMVs derived using the above method have a reduced slow speed bias. The ABI spectral bands, spatial resolution and the derived AMV spatial resolution with their naming convention are listed in Table 1.
To date, two studies have been published demonstrating that the assimilation of GOES-16 AMVs improves tropical cyclone forecasting. The authors of [20] reported that assimilation of the 15 min AMVs, derived from the GOES-16 rapid scan (mesoscale scan) imagery, have improved the hurricane track and size forecasts for three destructive tropical cyclones. Using Atlantic Hurricane Irma in 2017, [21] demonstrated that assimilating enhanced vortex-scale GOES-16 AMVs using the 2019 version of the operational HWRF, improved track forecast. Both studies used the enhanced vortex-scale GOES-16 AMVs derived from the technique described in [22].
In this work, we report on the evaluation of the assimilation the hourly full disk and 15 min CONUS AMVs from GOES-16 and -17 using tropical cyclones from the 2018–2020 hurricane seasons. The paper is organized as follows. Section 2 provides a summary of the 2020 operational HWRF system. Section 3 describes the experimental set up, the new quality control procedures and its impact on assimilation statistics. Section 4 highlights various aspects of forecast improvements from the GOES AMVs. In Section 4.1, a single assimilation cycle from 2019 Hurricane Dorian is reviewed to understand how the analysis changes with the addition of new AMV types, QC procedures and error profile. Results of the forecast performance for the assimilation of AMVs from GOES-16 and -17 are presented in Section 4.2, Section 4.3 and Section 4.4. Section 5 gives a summary of the findings.

2. Hurricane Weather Forecasting Model

The HWRF is an atmosphere–ocean-coupled system used both in tropical cyclone research and development as well as operations for the National Hurricane Center (NHC). The HWRF is configured with a parent domain and two storm following nested domains shown in Figure 1. The parent domain is 77.2° by 77.2° with its center determined by the initial location of the storm and the 72 h forecast. These storm centers are determined by NHC or the Joint Typhoon Warning Center. The two nested domains are 17.8° by 17.8° and 5.9° by 5.9°. Both nested domains are two-way interactive, i.e., there is information exchange between the domains and their parent domain. The three domains have spatial resolutions of 13.5, 4.5 and 1.5 km [
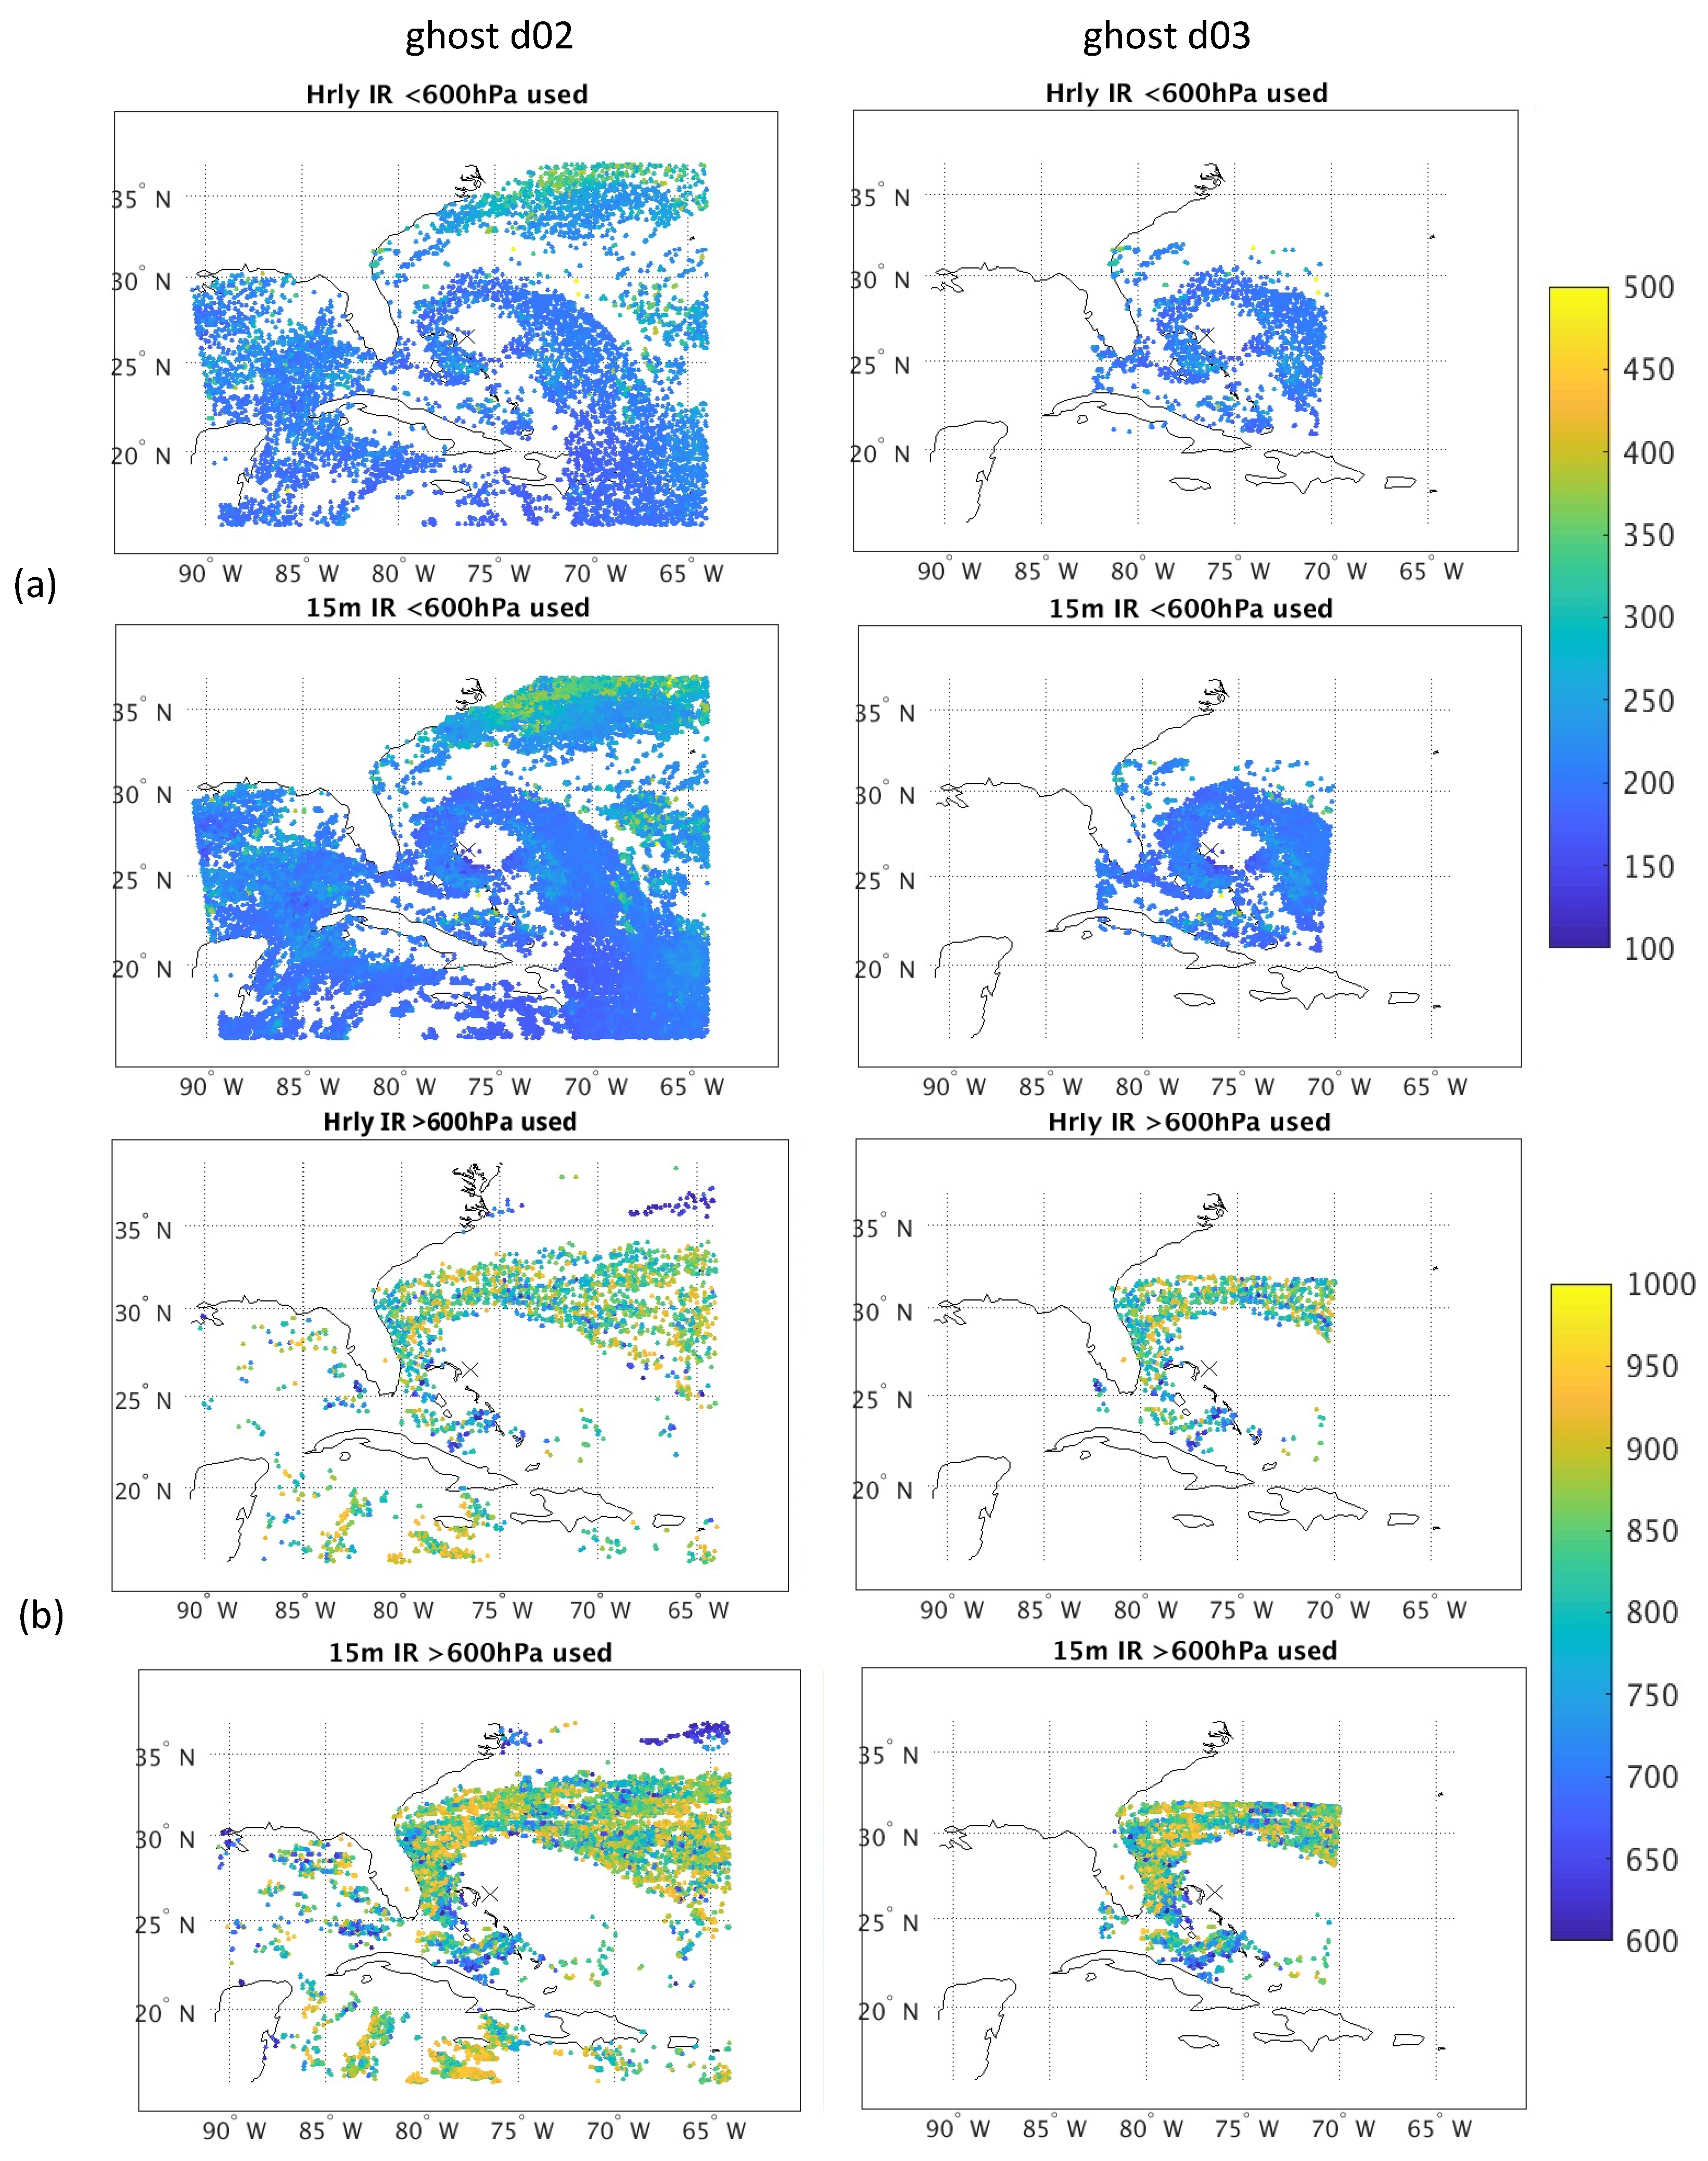
23]. HWRF uses two ghost domains for data assimilation. They have the same spatial resolution as the two nested domains but have larger coverage (d02 is 28° by 28° and d03 is 15° by 15°). The ghost d02 domain sufficiently covers the entire storm, while the ghost d03 domain is used primarily to assimilate aircraft reconnaissance data. The HWRF model has 75 vertical levels with a model top of 10 hPa in all three domains. The initial and boundary conditions used by the HWRF parent domain are provided by the National Centers for Environmental Prediction (NCEP) Global Forecast System (GFS). The suite of physical parameterization used by HWRF are selected for tropical cyclone applications. The parameterizations are the Geophysical Fluid Dynamic Laboratory’s surface-layer parameterization for air–sea interaction, the Noah Land Surface Model [24,25], the Rapid Radiative Transfer Model for General circulation models radiation scheme [26], the Ferrier–Aligo microphysics [27,28], the GFS Hybrid Eddy Diffusivity Mass-Flux (Hybrid-ESMF) Planetary Boundary Layer (PBL) scheme [29], and the scale-aware GFS Simplified Arakawa Schubert (SAS) deep and shallow convection scheme [28,30] and the Hybrid Coordinate Ocean Model. More information on HWRF can be found in [23,31].
The HWRF Data Assimilation System (HDAS) is a hybrid three-dimensional (3D) ensemble-variational (EnVar) assimilation system [32] implementation of the Gridpoint Statistical Interpolation (GSI). Data assimilation is performed in the two ghost domains. The use of a static background error covariance matrix, which is isotropic and constrained by larger scale geostrophic balance, limits the spreading of observation information in the presence of a tropical cyclone [32,33]. To provide information on the flow-dependent error covariance, a 40-member HWRF forecast-based ensemble is used. The self-cycled system updates each member through an Ensemble Kalman Filter (EnKF) analysis. The HWRF self-cycled ensemble hybrid data assimilation system is triggered for tropical cyclones in the North Atlantic and East Pacific basins that have tail doppler radar data or are defined as a priority storm by NHC. The HWRF ensemble forecasts are initialized from a previous 6-h NCEP Global Data Assimilation System (GDAS) EnKF analysis. The ensemble forecasts are run for the parent domain and a 30° by 30° nest with spatial resolution of 0.033°. Both domains are non-vortex following during the forecast but are recentered to the tropical cyclone center at each analysis time.
To initialize the HWRF state, a multistep procedure was used to optimize modeling the tropical cyclone storm center. The HWRF nested domains are initialized by the GDAS 3 h forecast. The vortex (position, structure, and intensity) in the first guess is modified based on the NHC’s Tropical Cyclone Vitals Database prior to data assimilation. The replaced vortex can either be drawn from a prior HWRF 6 h forecast or the GDAS 3 h forecast. The vortex from the 6 h HWRF forecast is extracted if the observed vortex maximum wind speed is greater or equal to 14 ms−1. This vortex is corrected based on NHC’s TC Vitals and inserted into the first guess. Otherwise, the corrected vortex from the 3 h GDAS forecast is used. Details on the vortex correction is outlined in [23]. This vortex-processing step, also known as vortex initialization [33], is designed to optimize forecast skill [32,33]. However, the vortex initialization limits the impact of adding new AMV types by inhibiting the propagation of information from observations assimilated in earlier analysis cycles into the current analysis cycle.
The selection and treatment of the complex suite of weather observations used in the HWRF is likewise optimized to prioritize the modeling of the cyclone. Observation types that are assimilated into HDAS include conventional observations, tail doppler radar data, satellite infrared and microwave radiances, hourly GOES-16 and -17 infrared (IR), Cloud Top Water Vapor (CTWV) and Clear Air Water Vapor (CAWV)-type AMVs and Global Positioning System Radio Occultation bending angle. In [31], an extensive list of all the observations assimilated in HDAS is provided. The HDAS assimilates observations within ±3 h of the analysis time. To better assimilate the observations, HDAS employs the First Guess-Appropriate Time technique by also using the 3 and 9-h GDAS forecasts. Observations are compared with the first guess at the observation time to obtain the innovation. With the First Guess-Appropriate Time, the two closest background fields are interpolated in time within GSI.
After the data assimilation step, a merging procedure is applied to combine the HDAS analysis with the GDAS analysis to produce the final analysis. The data are interpolated to the parent and nested domains to generate a final analysis used to initialize the HWRF forecast. For tropical cyclones that are hurricane strength (maximum winds greater than 65 kt), the GSI analysis increments are decomposed into respective wavenumber spectra. Only wavenumbers 0 and 1 are kept within a 150 km radius of the tropical cyclone center and relaxed to the full GSI increment 250 km. For weak tropical cyclones (maximum winds less than 64 kt), unaltered data assimilation increments are applied.
The operational HWRF model is run four times daily to produce 126 h forecasts of tropical cyclone track, intensity, structure, and rainfall when a tropical cyclone is identified. The HWRF run is stopped when the tropical cyclone either dissipates after making landfall, becomes extratropical, or degenerates into a remnant low. Figure 2 shows a schematic of the various processes of a HWRF run during a single analysis–forecast cycle.
The model configuration, run time scripts, and all data files were provided by NCEP, and experiments were conducted in accordance with NCEP’s parallel testing procedures. The 2020 version of the operational HWRF was used. The new hourly and 15 min AMV data files were provided by NESDIS Office of Satellite and Product Operations and are consistent with their operational limits. Experiments were conducted on NOAA’s High-Performance Computing cluster JET. Forecast evaluations were conducted with NCEP’s verification software.

3. Data Assimilation of GOES AMVs

To optimize the use of AMVs in data assimilation, the quality-control procedures and assigned observation error were reviewed for best use within HWRF. In this section, the current quality control metrics are outlined. Modifications for HWRF use are then discussed. A critical adjustment to the observation error handling is presented as well as a change in the gross check. The impact on data usage from the combined adjustments is shown.
The current quality-control (QC) procedures that are used by HWRF for the assimilation of GOES-16 and -17 AMVs in the GSI are similar to GDAS. The AMVs are used if the assigned Quality Indicator (QI) [34] computed without the forecast component is greater than 80. QI is calculated by estimating the consistency in spatial, direction, speed, and vector. For all AMV types, the observations are used if their normalized Expected Error [35] (Expected Error/AMV speed) is less than 0.8 ms−1. For low-level IR type AMVs with pressure values larger than 800 hPa, the normalized Expected Error must be less than 0.55 ms1 to be used. AMV observations with pressures less than 950 hPa and below the tropopause are used. All AMV types are subject to a PCT1 check [
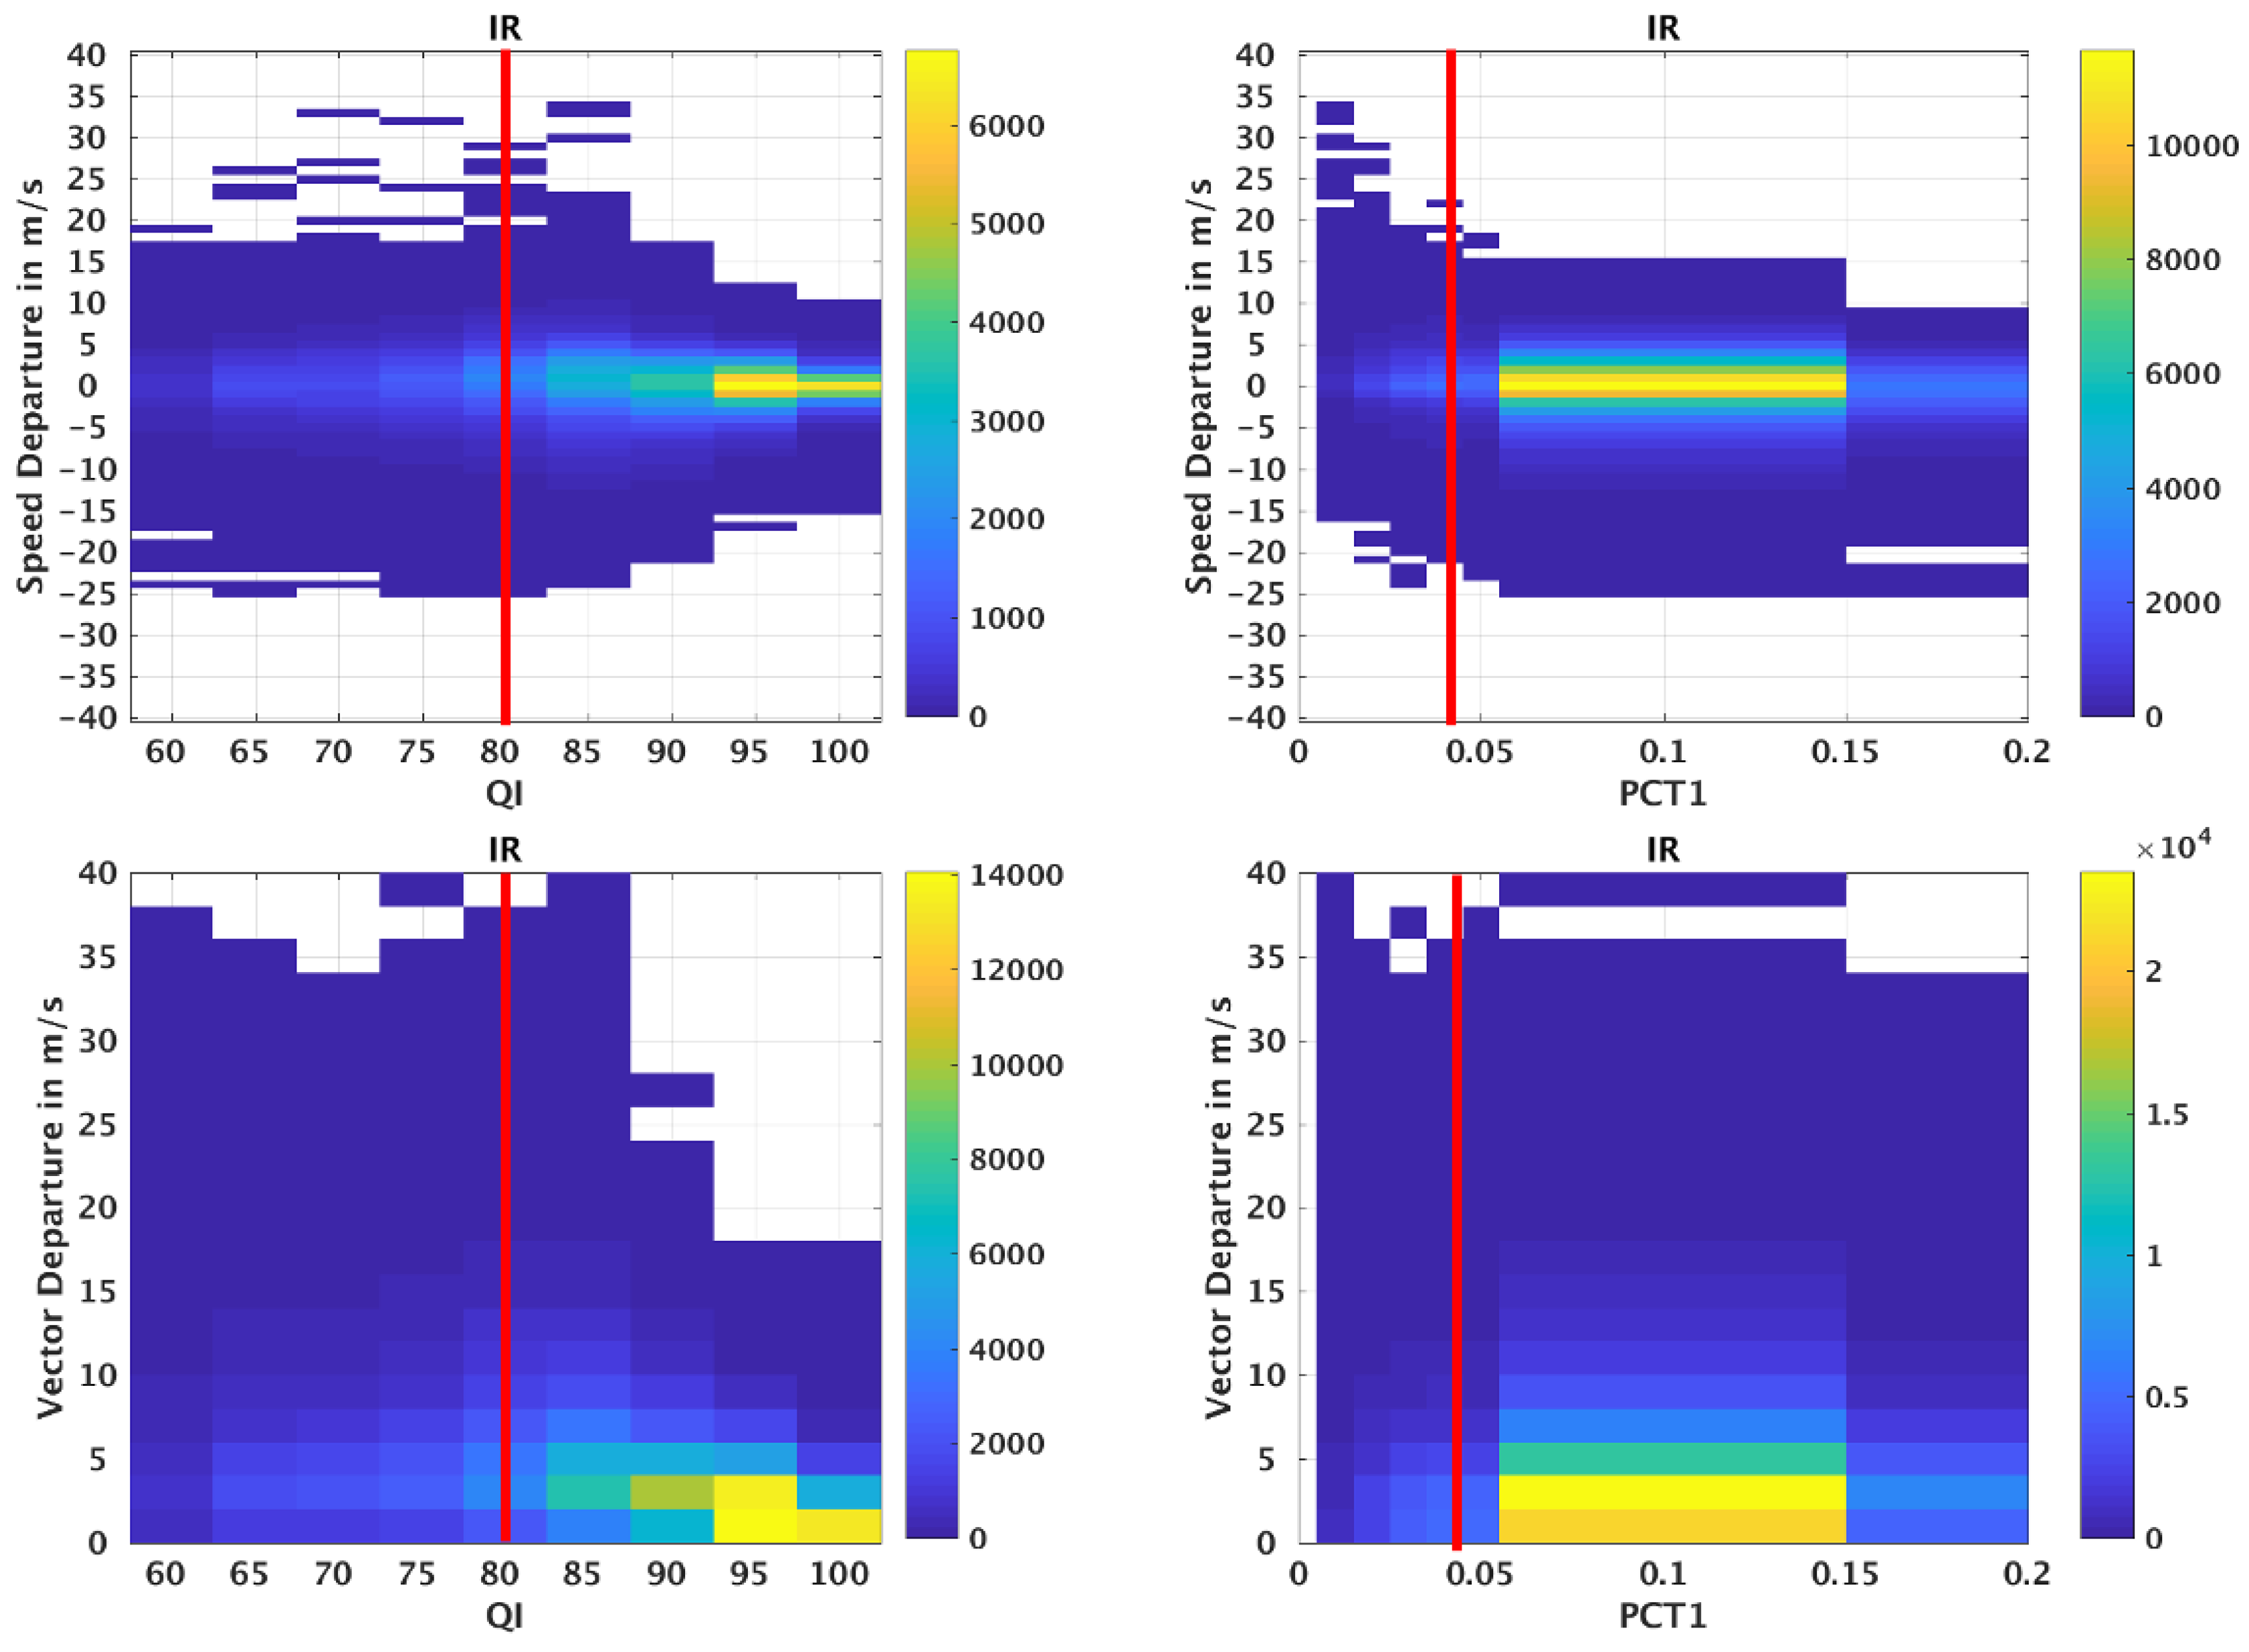
18] and near surface and tropopause checks. In the nested tracking algorithm, PCT1 is defined as the standard deviation of the displacements making up the largest motion cluster divided by the average displacements the cluster travelled. It is a measure of how much the initial cloud scene has deformed over the interval of time the cloud is being tracked. AMVs with PCT1 values less than 0.04 and greater than 0.5 are rejected. The infrared (IR)-type AMV observations over land with latitudes greater than 20°N were found to be problematic and are rejected. In addition, IR-type AMVs with pressure values between 400 and 800 hPa and CTWV-type AMVs with pressure values greater than 400 hPa are excluded due to height assignment concerns. The CAWV-type AMVs are also rejected if the difference in the wind direction is greater than 50° from the forecast wind.
The GOES-R AMVs quality control procedures are reviewed for use in HDAS. HDAS currently employs the global QC procedures derived for synoptic scales, which may not be optimal for mesoscales. Specifically, the QI and PCT1 checks are removed as they reject most of the AMVs available within the HWRF assimilation domains. Density plots of QI and PCT1 for IR AMVs within the assimilation domain for Hurricane Michael are plotted against speed and vector departures (observation minus first guess) in Figure 3. The current QC cutoffs for these two metrics are shown by the red line. From the density plots, IR AMVs speed and vector departures for QI < 80% and PCT1 < 0.04 are no different to those with QI > 80% and PCT1 < 0.04. The QI metric can have low values if there is a lack of a “buddy” AMV for comparison. However, it does not indicate the observation’s quality. Low PCT1 values are desirable from a tracking standpoint because they imply that the cloud scene is not deforming much over time and is behaving like a passive tracer. Both hourly and 15 min AMVs from GOES-16 and -17 for all AMV types are reviewed, and the same conclusions are drawn to remove the QI and PCT1 checks for AMVs in HWRF (figures not shown). In addition, the nested tracking algorithm produces more IR AMVs between 600–800 hPa. Reducing the blacklisting of low-level IR AMVs from 800 hPa to 600 hPa reflects the improved detection.
While quality control acts as a gatekeeper to limit the used observations to those meeting a quality standard, the assigned observation error plays an important role on the influence of the selected observations. Observational error is used within the variational data assimilation system to determine the magnitude of influence from each observation on the final analysis solution. The GSI setting for this error is adopted from the GDAS. For the GDAS, the error profile is halved for GOES-16 AMV assimilation because the global model uses a larger error profile. When applied to the current HWRF error profile, the values become too small due to the GSI software logic. Figure 4 shows the current error profile in blue and labelled as H220. The revised error profile is red. The rawinsonde error profile is black. The root-mean-square error (RMSE) derived by the data provider for IR (green), CTWV (orange), and VIS (in magenta) are also shown for comparison. The revised error profile is comparable to the data provider’s RMSE and the error profile used in the assimilation of rawinsondes.
A final AMV test, called the gross check, was also modified for the HWRF GSI configuration. This test is applied to all AMVs to reject observations that have large observation-model departures. The maximum range of departures allowed by the gross check is determined by a gross error parameter multiplied by the observation error profile. Tropical cyclones generally have larger wind speeds. To allow observations that reflect the higher wind speeds, the gross error parameter was relaxed from current values of 1.3–2.5 to 3.5 for all GOES-16 and 17 AMV wind types. Doing so allows observations with wind speed departures of about 17 ms1 to be assimilated compared to 3 ms1 with the current settings.
By relaxing the gross check, removing the QI & PCT1 tests, and reducing the vertical range of rejected lower level infrared AMVs, the count of AMV observations is significantly increased for HWRF data assimilation. The percentage of accepted GOES-16 AMVs is shown for Hurricane Michael with and without the recommended changes (Figure 5). The assimilation counts for GOES-16 hourly AMVs using the current QC, gross check and error profiles are plotted in Figure 5a. The percentage of observations assimilated is between 40–60%. Together with the use of a larger gross check and the revised error profile, the percentage of observations assimilated increases to 60–95%, as shown in Figure 5b. The inner core domain (ghost domain d03) shows similar improvements in counts. This evaluation was repeated for the 15 min AMVs when the data stream became available (figures not shown). The new QC changes are still effective for these higher temporal-resolution AMVs.
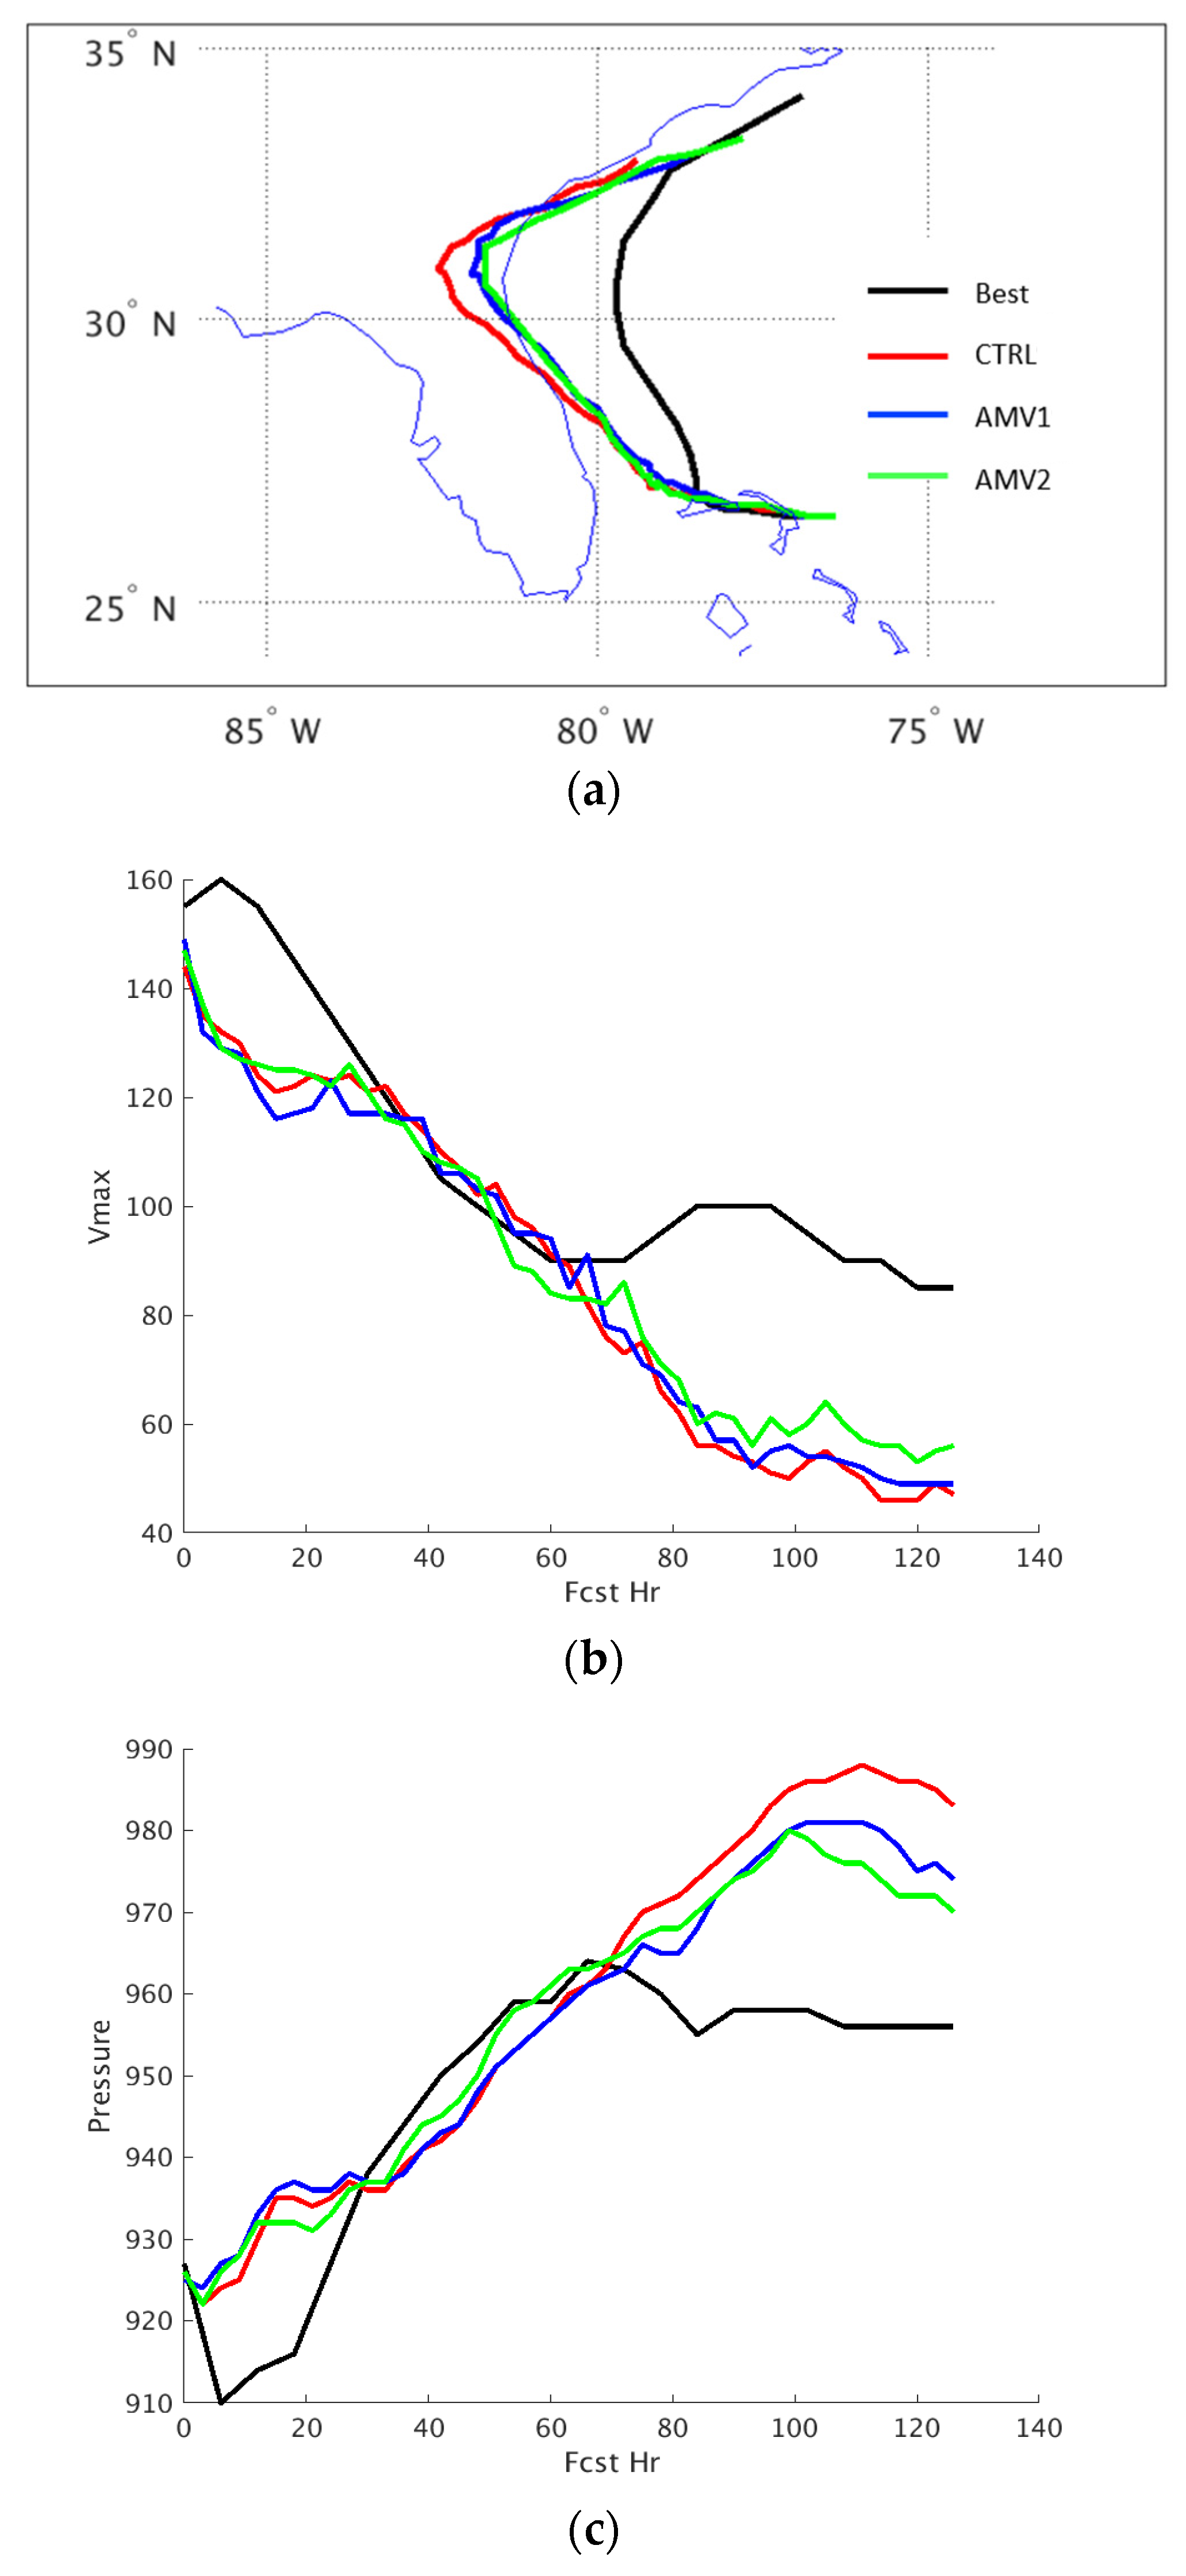
With the optimization of the GSI software for AMV use in the HWRF data assimilation complete, the evaluation of all AMV types at the hourly and 15 min frequency was completed using tropical cyclone cases during the 2018, 2019, and 2020 seasons. Hourly GOES-16 AMVs are already available in the NCEP Central Operations data stream and hence are available for all these seasons. However, the 2020 version of the operational HWRF/HDAS only assimilates hourly IR, CTWV, and CAWV AMVs. It does not contain the SWIR or VIS AMVs. The operational AMV set will be used in the control (CTRL) and maintains the 2020 operational HWRF quality control procedures and error profile of AMVs during data assimilation. A comparison experiment (AMV1) uses the same AMV set as the CTRL but with the addition of hourly SWIR and VIS AMVs. AMV1 also uses the proposed QC procedures and error profiles outlined above. An additional assimilation experiment, AMV2, was conducted and is identical to AMV1 except for the inclusion of the 15-minute CONUS AMVs for all five types. Table 2 summarizes the experimental set up used for each experiment.
To assess the impact of QC changes and error profile adjustment, the assimilation statistics of observation—background (O-B) and observation—analysis (O-A) were examined for the control and the two experiments. The mean normalized wind speed departure and the standard deviation of the normalized wind vector departure were assessed and found to be similar or improved when using the QC changes and error profile adjustment in the experiments. As expected, the number of assimilated AMV observations increased for both experiments. Also expected from the experiments was an increase in the standard deviation of the vector wind departure for both the O-B and O-A. These changes are a result assimilating more observations with larger wind speeds, switching to a more appropriate magnitude of observation error and removes the overfitting of the cycled assimilation state to the AMV data. Assimilation statistics are shown for the infrared AMVs for all cycles of Tropical Storm Cristobal in Figure 6.
More hourly observations are assimilated using the new QC, the updated gross error parameter, and error profiles. The higher frequency 15 min AMVs significantly increases the number of AMVs assimilated, especially at 200 hPa. The mean normalized wind speed difference and standard deviation of normalized wind vector difference increase slightly for the hourly and 15 min AMVs compared to the CTRL. This change is due to an increase in number of observations and inclusion of observations with larger wind speeds. The negative bias observed at 200 hPa agrees with the statistics provided by the data provider. This bias is expected to improve when the Enterprise cloud algorithm (Heidinger, 2016) becomes operational in February 2022 [36]. Figure 6b show similar assimilation statistics for the case when hourly AMVs are assimilated with VIS and SWIR (AMV1) and when hourly and 15 min AMVs are assimilated (AMV2). Normalized wind speed bias is comparable between both experiments. Standard deviation of normalized vector difference is smaller for AMV2 than AMV1. This result indicates the additional 15 min winds were consistent with the hourly winds and improved the analysis. Statistics for other AMV types are also reviewed (figures not shown) and they share similar findings. Table 3 lists both the current QC and gross ratio used in HWRF and the proposed changes.

4. Forecast Impact of GOES AMVs

Tropical cyclone forecast skill is evaluated by comparing model forecasts against NHC’s postprocessed best-track storm data. Various metrics are used to measure the tropical cyclone forecast performance. Track forecast error (km) is defined as the great-circle distance between a cyclone’s forecast position and the best-track position at the forecast verification time. Wind speed error, defined as the maximum sustained 10 m winds, and the minimum central pressure (hPa) are used to measure the strength of the tropical storm. Mean wind radii errors (km) are used to measure the storm size between different experiments [37]. The radius is defined as the distance from the tropical cyclone center to the location where the tangential wind has the required speed magnitude. The mean wind radii errors at 34, 50, and 64 kt in all four quadrants of the tropical cyclone define the tropical-storm-force (RSTF), storm-force (RSF), and hurricane-force (RHF) wind error.

4.1. Imapact of GOES-16 Hourly and 15 Min AMVs Using a Single Cycle of 2019 Hurricane Dorian

Examining a single analysis cycle from the different assimilation experiments listed in Table 2 provides insight to how the analysis is influenced by the new AMV data. A single cycle of the 2019 Hurricane Dorian is examined. The cycle selected is 6 h prior to Hurricane Dorian attaining the lowest minimum central pressure of 910 hPa according to NHC’s best track data. Using this cycle, the AMV coverage, analysis winds innovations, and temperature innovations were found to respond to the changes in AMV assimilation procedures with the addition of hourly and 15 min AMVs.
For the selected Hurricane Dorian cycle, the HWRF outer domain has an 80% overlap with the GOES-16 CONUS scan which allows a comparison between hourly and 15 min AMV coverage. Statistics of innovations and analysis errors are comparable between the hourly AMV assimilation and the hourly plus 15 min AMV assimilation, spatially, they are not the same. Figure 7 shows the horizontal coverage of IR AMVs for the selected single cycle for both HWRF ghost d02 and ghost d03 assimilation domains.
There is a significant increase in the number of 15 min compared to the hourly AMVs, providing better spatial coverage of the model wind field. Temporal information inherent in the high temporal AMVs are not exploited because HDAS is a 3DVAR system. Instead, the 15 min AMVs contribute to spatial regions where hourly AMVs are missing. This includes areas near the center of the storm (Figure 7a). The lack of AMVs close to the tropical cyclone center is due to the limits of the AMV generation by the data provider and is caused by extreme changes in target direction and speed between images. The other four AMV types (figures not shown) show a similar pattern.
A tropical cyclone in the Northern Hemisphere has a negative zonal wind component north of the tropical cyclone center and a positive zonal wind component south of the tropical cyclone center. On the north side of the tropical cyclone, if the analysis zonal wind component is weaker than the first guess zonal wind component, then the zonal wind increment (analysis—first guess) will have a positive magnitude. If the zonal wind increment is negative, the analysis zonal wind component is stronger than the first guess zonal wind component. The opposite is true on the south side of the tropical cyclone. Figure 8a shows zonal wind analysis increment at 250 hPa where IR and CTWV are the dominant AMV types. There is a reduction in extent and magnitude of the negative zonal wind increment, relative to the CTRL, southwest of the tropical cyclone center in the AMV1 experiment. This reduction is enhanced when 15 min AMVs are also assimilated in AMV2. North and west of the tropical cyclone center, zonal wind increments are larger with the assimilation of hourly and 15 min AMVs. These regions coincide with increased observation coverage provided by the 15 min AMVs. Meridional cross section of the zonal wind increment (Figure 8b) shows strengthening anticyclonic increments in the mid troposphere and weakening of the cyclonic increment in the upper troposphere close to the center of the storm, when comparing AMV1 to CTRL. The increase in observation density coverage in the vertical for AMV2 moderated the magnitude of the increments.
Inherent to the GSI multivariate solution is the response of the temperature state from changes in the wind field. Examining the temperature analysis increments reveals this relationship for the Hurricane Dorian cycle. The temperature analysis increments for HWRF’s inner core assimilation domain are plotted in Figure 9 for CTRL, AMV1 and AMV2.
Black contours are first-guess temperature fields. Shaded colors are temperature analysis increments. Temperature analysis increments at 500 hPa (Figure 9a) show increased temperature cooling northwest of the tropical cyclone center and warming southeast of the tropical cyclone center in AMV1 compared to CTRL. The cooling and warming are further enhanced in AMV2. These regions overlap with regions of large change in zonal component wind. The correction to temperature by the wind observations is a result of the multivariate background error covariance. The temperature warming extends further south (Figure 9b) in AMV2 for the entire troposphere. North of the tropical storm center, AMV1 shows larger cooling in the mid troposphere compared to the CTRL. However, presence of better observation coverage in AMV2 reduces the magnitude of cooling compared to AMV1. The moderated analysis increments in AMV2, compared to AMV1, has led to improvements (closer to NHC best track) in forecast storm track (Figure 10a). For intensity and minimum center pressure (Figure 10b,c), all experiments do not produce forecasts that match the NHC best track analysis. However, AMV2 produces forecast intensity closest to the best track beyond 80 forecast hours. It also has the closest minimum center pressure from 20 to 80 forecast hours.

4.2. Statistics for AMV1

A total of 15 tropical cyclones from the 2018 and 2019 hurricane seasons in the North Atlantic are used to evaluate the impact of hourly GOES-16 AMVs (AMV1). For AMV1, the HWRF shows improved forecast skill in track error along with modest improvements in intensity and wind error. Forecast metrics assessing the impact from assimilating hourly SWIR and VIS AMVs, the new QCs, and the revised error profile for tropical cyclones in the North Atlantic Ocean for the 2018 and 2019 hurricane seasons are plotted in Figure 11. A paired t-test with adaptive serial correlation is used for significance testing (Sarah Ditchek, personal communication). Squares (circles) indicate statistical significance at the 95% (90%) confidence level. Overall, the impact is positive. Intensity improvements are achieved between 12 to 112 forecast hours (Figure 11a). The largest improvement is at 72 forecast hours and is statistically significant at the 95% level. Smaller intensity biases coincide with the intensity improvement. The largest improvement of minimum center pressure error (Figure 11c) also falls within the same time range.
Total track error (Figure 11d) is reduced between 18 to 84 forecast hours. Improvements are statistically significant at the 95% level up to 72 h. The total track error is decomposed to across track and along track bias (Figure 11e,f). The speed of tropical cyclone advancement (along track) improves from 12 to 72 forecast hours. Improvement of the veering of the forecast path (across track) from the observed track are observed between 30 to 78 forecast hours. Improvements in the tropical cyclone track forecast were expected to be larger with the addition of the SWIR and VIS AMV types. A possible reason for the smaller improvements is that the additional AMV types are not currently being assimilated in NOAA’s operational GDAS, which provides the initial and boundary conditions for the HWRF. There may be inconsistencies in the large-scale environmental flow between the initial conditions provided by the GDAS to the HDAS.

4.3. Statistics for AMV2

The combined impact of GOES-16 hourly and high-temporal AMVs (AMV2) are evaluated using 2019 and 2020 hurricane seasons due to the data availability. A total of 19 tropical cyclones are used. Small positive impact in the tropical cyclone forecast performance was obtained during the 2019 and 2020 hurricane seasons for AMV2 where GOES-16 15 min AMVs are added. Intensity improvements are positive up to 84 forecast hours (Figure 12a) and intensity bias also improves after 36 forecast hours (Figure 12b). Reduction in track errors (Figure 12c) spans most of the forecast hours and are statistically significant at the 95% level. The across-track bias has more improvement compared to the along-track bias. RSTF and RHF errors (Figure 12e,f) also show improvements for the first 48 and 54 h, respectively.
The lack of computational resources does not allow running experiments to isolate the impacts from the 15 min AMVs. Without such experiments, quantitative conclusions on the impact from the 15 min AMVs alone cannot be drawn. Despite this limitation, data from completed experiments are used to attempt an assessment of the impact from the 15 min AMVs. This approach is to group forecasts according to the percentage overlap between HWRF’s larger assimilation domain (ghost d02 in Figure 1) and the CONUS sector scan, where the 15 min AMVs are produced. A total of 535 cycles were collected from 15 tropical cyclones which had the required intermediate files available for the analysis. Only about 150 cycles have a 70% or greater overlap between the assimilation domain and the CONUS scan sector. Forecast impact statistics (figures not shown) showed small positive improvement in the track error as well as minimum center pressure error between 12 to 48 forecast hours and beyond 84 forecast hours. Impact on wind speed error was neutral. Wind speed bias was reduced from the 18 to 96 forecast hours. If an AMV1 experiment was conducted for comparison, the impact from the addition of high-temporal AMVs would be small. As discussed in Section 2, HDAS is a hybrid 3DEnVar data assimilation system. Flow information inherent in the high temporal AMVs is not exploited; instead the 15 min AMVs extend the coverage of wind data where the hourly AMVs are absent

4.4. GOES-17 Evaluation

Evaluation of GOES-17 AMVs on tropical cyclone forecasting in the East Pacific basin was limited to a small number of tropical cyclones in the 2020 hurricane season. This is due to the GOES-17 ABI’s cooling system not performing as designed. The increased temperature on the ABI detectors has led to degraded or loss of imagery. This setback delayed the production of GOES-17 AMVs until November 2019. The 9 longest-lasting tropical cyclones in the East Pacific basin were used to evaluate the performance of the GOES-17 AMVs with the experiment configuration matching AMV2, which included the 15 min CONUS sector AMVs. Even though the number of tropical cyclones is small, forecast performance evaluation on the impact of these AMV types is informative on expected performance of future GOES-18 AMVs. GOES-17 will be replaced by GOES-18 (launched on 1 March 2022) in the near future.
Figure 13 shows the forecast performance metrics for these nine tropical cyclones. GOES-17 AMVs have a positive impact on tropical cyclone track error across all forecast hours with larger improvements at longer forecast times. These improvements are, on average, 20 km and are statistically significant at the 95% level. The positive impact in track error is due to large improvements in cross track errors (Figure 13b). The maximum education in cross track bias is 30 km. Impact on minimum central pressure is neutral for the first 42 forecast hours and improves after that. RHF is improved from 18 forecast hours onwards. Impact on storm intensity is positive beyond 42 forecast hours. There is a slight degradation in storm intensity error for the first 24 h. Reviewing the intensity errors for each of the individual storms showed that the dominant signal came from Hurricane Marie which contributed the greatest number of samples during this time period. Positive impact in intensity bias error is only between 12 and 36 forecast hours.

5. Conclusions

The assimilation of hourly and 15 min GOES-16 and -17 AMVs is beneficial for improving tropical cyclone forecasting. This can be attributed to the increased number of observations and more consistent mesoscale quality control procedures. The changes that are made to optimize the assimilation of these AMVs in HWRF are as follows. (1) The observational error profile is adjusted to represent more realistic values and to prevent overfitting to the AMVs. The new errors are comparable to those used by rawinsondes and the RMSE derived by the data provider in their data verification. The values range from 3.7 m/s near the surface to 7 m/s at the middle of the troposphere and above. (2) The range of allowable AMV wind speeds entering the assimilation system is increased to accommodate the larger wind speeds observed in tropical cyclones by relaxing the gross check thresholds. (3) Two data quality checks, QI and PCT1, are removed. Wind speed and vector departures between observations and first guess do not justify that these two checks be used to quality control the AMVs. Removing these checks allow more observations to be assimilated. The above changes are applicable for all the GOES-R AMV wind types and have resulted in a 20–40% increase in the number of AMVs assimilated. One additional change specific to IR AMVs is narrowing the blacklisting region of 400–800 hPa to 400–600 hPa.
The forecast performance of the GOES-16 hourly AMVs are evaluated mainly using tropical cyclones in the 2018 North Atlantic hurricane season. The forecast impact of the combined GOES-16 hourly and 15 min AMVs are dominated by tropical cyclones in the 2020 North Atlantic hurricane season. Forecasts from both sets of experiment are verified against the NHC best track and compared with the 2020 operational version of HWRF (control). Addition of SWIR and VIS hourly GOES-16 AMVs and the optimized used of all wind types from GOES-16 improved the intensity error and minimum center pressure for most of the forecast hours verified. Impact on track error is from neutral to positive. GOES-16 15 min AMVs forecast impact are evaluated in the presence of the hourly AMVs. Like the hourly AMVs, improvement in track error is achieved for all forecast hours and the first 3 days for intensity error. Positive impact is also achieved up to day 2 for average 50 and 65 kt radius error.
The GOES-17 AMVs are only evaluated for the 2020 Eastern Pacific hurricane season. The forecast impact for GOES-17 AMVs is also compared with a control experiment. Despite the cooling issue of GOES-17 ABI, positive impact is still achieved when these winds are assimilated. The tropical cyclone metrics that are improved are track error, intensity, minimum center pressure, and hurricane force wind radius error.
Other improvements in the generation of AMVs and incorporating time dependencies in the assimilation system are expected to show further improvements in tropical cyclone forecasts. A major source of error for AMVs is the height assignment. The error increases in regions of high wind shear. The soon-to-be-implemented Enterprise cloud algorithm [38] will also improve data quality as the negative bias observed in AMVs at about 300 hPa is reduced. To fully exploit the temporal information in these AMVs, a data assimilation system that allows for the simultaneous assimilation of asynchronous observations such as the 4DEnVar developed within the HWRF framework [33] will be critical. The next generation Hurricane Analysis and Forecast System (HAFS), currently under development, has plans to move to a 4DEnVar system.

Author Contributions

Conceptualization, A.H.N.L., S.E.N., J.A.J. and J.M.D.; methodology, A.H.N.L., S.E.N. and J.A.J.; software, A.H.N.L. and S.E.N.; validation, A.H.N.L.; formal analysis, A.H.N.L., S.E.N. and J.A.J.; investigation, A.H.N.L.; resources, L.B. and A.M; data curation, A.H.N.L. and A.B.; writing—original draft preparation, A.H.N.L.; writing—review and editing, A.H.N.L., S.E.N., J.A.J., J.M.D., A.B., W.B., L.B. and A.M.; visualization, A.H.N.L.; supervision, A.H.N.L. and J.A.J.; project administration, A.H.N.L.; funding acquisition, A.H.N.L. and J.M.D. All authors have read and agreed to the published version of the manuscript.

Funding

This work was supported by the Next-Generation Global Prediction System (NGGPS) and Hurricane Forecast Improvement Program (HFIP) Grant (NOAA-Award ID NA18NWS4680055).

Data Availability Statement

All existing observational data (including hourly GOES-16/-17 AMVs) use in assimilation and global analyses used for the HWRF are available from NCEP.EMC. The 15 min GOES-16/-17 AMVs used in the study are archived locally for a year from the time the manuscript is accepted and will be made available upon request to the corresponding author.

Acknowledgments

The authors thank NCEP/EMC for providing computing resources on the NOAA research and development computer JET. We would also like to thank Sudhir Nadiga at NCEP/OBSPROC for preparing the satellite wind BUFR files used in this study. The Graphics for OSEs and OSSEs for TROPICAL CYLONEs (GROOT) verification package developed by Sarah Ditchek and funded by the Quantitative Observing System Assessment Program (QOSAP) and the FY18 Hurricane Supplement (NOAA-Award ID #NA190AR0220188) was used to generate graphics for this publication. The views, opinions, and findings contained in this publication are those of the author(s) and should not be construed as an official NOAA or U.S. Government position, policy, or decision.

Conflicts of Interest

The authors declare no conflict of interest.

References

  1. Menzel, W.P. Cloud Tracking with Satellite Imagery: From the Pioneering Work of Ted Fujita to the Present. Bull. Am. Meteorol. Soc. 2001, 82, 33–47. [Google Scholar] [CrossRef]
  2. Bormann, N.; Salonen, K.; Peubey, C.; McNally, T.; Lupu, C. An Overview of the Status of the Operational Assimilation of AMVs at ECMWF. In Proceedings of the 11th International Winds Workshop, Auckland, New Zealand, 20–24 February 2012. [Google Scholar]
  3. Cotton, J.; Forsythe, M. AMVs at the Met Office: Activities to Improve their Impact in NWP. In Proceedings of the 11th International Winds Workshop, Auckland, New Zealand, 20–24 February 2012. [Google Scholar]
  4. Le Marshall, J.; Seecamp, R.; Xiao, Y.; Gregory, P.; Jung, J.; Stienle, P.; Skinner, T.; Tingwell, C.; Le, T. The Operational Generation of Continuous Winds in the Australian Region and Their Assimilation with 4DVAR. Weather Forecast. 2013, 28, 504–514. [Google Scholar] [CrossRef]
  5. Lee, E.; Kim, Y.; Sohn, E.; Cotton, J.; Saunders, R. Application of Hourly COMS AMVs in KMA Operation. In Proceedings of the 11th International Winds Workshop, Auckland, New Zealand, 20–24 February 2012. [Google Scholar]
  6. Su, X.; Daniels, J.; Derber, J.; Lin, Y.; Bailey, A.; Bresky, W.; Qi, H. Assimilation of GOES Hourly AMVs in NCEP Global Data Assimilation and Forecast System. In Proceedings of the 12th International Winds Workshop, Copenhagen, Denmark, 16–20 June 2014. [Google Scholar]
  7. Le Marshall, J.; Leslie, L.M. Modelling Tropical Cyclone Intensity. Aust. Meteorol. Mag. 1999, 48, 147–152. [Google Scholar]
  8. Bayler, G.; Lewit, H. The Navy Operational Global and Regional Atmospheric Prediction System at the Fleet Numerical Oceanography Center. Weather Forecast. 1992, 7, 273–279. [Google Scholar] [CrossRef] [Green Version]
  9. Langland, R.H.; Velden, C.; Pauley, P.M.; Berger, H. Impact of Satellite-Derived Rapid-Scan Wind Observations on Numerical Model Forecasts of Hurricane Katrina. Mon. Weather Rev. 2009, 137, 1615–1622. [Google Scholar] [CrossRef]
  10. Goerss, J.S. Impact of satellite observations on the tropical cyclone track forecasts of the navy operational global atmospheric prediction system. Mon. Weather Rev. 2009, 137, 41–50. [Google Scholar] [CrossRef]
  11. Berger, H.; Langland, R.; Velden, C.S.; Reynolds, C.A.; Pauley, P.M. Impact of enhanced satellite-derived atmospheric motion vector observations on numerical tropical cyclone track forecasts in the western north pacific during TPARC/TROPICAL CYLONES-08. J. Appl. Meteorol. Climatol. 2011, 50, 2309–2318. [Google Scholar] [CrossRef]
  12. Le Marshall, J.; Leslie, L.M.; Bennett, A.F. Tropical Cyclone Beti- an example of the benefits of assimilating hourly satellite wind data. Aust. Meteorol. Mag. 1996, 45, 275–279. [Google Scholar]
  13. Le Marshall, J.; Spinoso, C.; Pescod, N.R. Estimation and assimilation of hourly high spatial resolution wind vectors based on GMS-5 observation. Aust. Meteorol. Mag. 1996, 45, 279–284. [Google Scholar]
  14. Le Marshall, J.; Leslie, L.M.; Spinoso, C. The Impact of Spatial and Temporal Distribution of Satellite Observations on Tropical Cyclone Data Assimilation: Preliminary Results. Meteorol. Atmos. Phys. 1996, 60, 157–163. [Google Scholar] [CrossRef]
  15. Leslie, L.M.; Le Marshall, J.F.; Morison, R.P.; Spinoso, C.; Purser, R.J.; Pescod, N.; Seecamp, R. Improved hurricane track forecasting from the continuous assimilation of high quality satellite wind data. Mon. Weather Rev. 1998, 126, 1248–1257. [Google Scholar] [CrossRef]
  16. Lim, A.H.N.; Jung, J.A.; Nebuda, S.E.; Daniels, J.M.; Tong, M.; Tallapragada, V. Hurricane Track and Intensity Forecasts Impact Assessment from the Assimilation of Hourly Visible, Shortwave and Clear Air Water Vapor Atmospheric Motion Vectors in HWRF. Weather. Forecast. 2019, 34, 177–198. [Google Scholar] [CrossRef]
  17. Schmit, T.J.; Griffith, P.; Gunsor, M.; Daniels, J.; Goodman, S.; Lebair, W. A Closer Look at the ABI on GOES-R. Bull. Am. Meteorol. Soc. 2017, 98, 681–698. [Google Scholar] [CrossRef]
  18. Bresky, W.; Daniels, J.; Bailey, A.; Wanzong, S. New Methods Towards Minimizing the Slow Speed Bias Associated with Atmospheric Motion Vectors (AMVs). J. Appl. Meteorol. Climatol. 2012, 51, 2137–2151. [Google Scholar] [CrossRef]
  19. Daniels, J.; Bresky, W.; Wanzong, S.; Velden, C.; Berger, H. GOES-R Advanced Baseline Imager (ABI) Algorithm Theoretical Basis Document for Derived Motion Winds; Version 2.5; NOAA NESDIS: College Park, MD, USA, 2012.
  20. Li, J.; Li, J.; Velden, C.; Wang, P.; Schmit, T.J.; Sippel, J. Impact of Rapid-Scan-Based Dynamical Information From GOES-16 on HWRF Hurricane Forecasts. J. Geophys. Res. Atmos. 2020, 125, e2019JD031647. [Google Scholar] [CrossRef]
  21. Lewis, W.E.; Velden, C.S.; Stettner, D. Strategies for Assimilating High-Density Atmospheric Motion Vectors into a Regional Tropical Cyclone Forecast Model (HWRF). Atmosphere 2020, 11, 673. [Google Scholar] [CrossRef]
  22. Stettner, D.; Velden, C.; Rabin, R.; Wanzong, S.; Daniels, J.; Bresky, W. Development of Enhanced Vortex-Scale Atmospheric Motion Vectors for Hurricane Applications. Remote Sens. 2019, 11, 1981. [Google Scholar] [CrossRef] [Green Version]
  23. Biswas, M.K.; Abarca, S.; Bernardet, L.; Ginis, I.; Grell, E.; Iacono, M.; Kalina, E.; Liu, B.; Liu, Q.; Marchok, T.; et al. Hurricane Weather Research Forecasting (HWRF) Model: 2018 Scientific Documentation. 2018. Available online: https://dtcenter.org/community-code/hurricane-wrf-hwrf/documentation (accessed on 24 June 2022).
  24. Chen, F.; Dudhia, J. Coupling an advanced land surface—Hydrology model with the Penn State—NCAR MM5 modeling system. Part I: Model description and implementation. Mon. Weather Rev. 2001, 129, 569–585. [Google Scholar] [CrossRef] [Green Version]
  25. Mitchell, K. The community Noah Land Surface Model (LSM). 2005. Available online: http://www.ral.ucar.edu/research/land/technology/lsm/noah/Noah_LSM_USERGUIDE_2.7.1.pdf (accessed on 2 May 2022).
  26. Iacono, M.J.; Delamere, J.S.; Mlawer, E.J.; Shephard, M.W.; Clough, S.A.; Collins, W.D. Radiative forcing by long-lived greenhouse gases: Calculations with the AER radiative transfer models. J. Geophys. Res. 2008, 113, D13103. [Google Scholar] [CrossRef]
  27. Rogers, E.; Black, T.; Ferrier, B.; Lin, Y.; Parrish, D.; DiMego, G. Changes to the NCEP Meso Eta Analysis and Forecast System: Increase in Resolution, New cloud microphysics, Modified Precipitation Assimilation, Modified 3DVAR Analysis. Technical Procedures Bulletin. 2001. Available online: http://www.emc.ncep.noaa.gov/mmb/mmbpll/eta12tpb/ (accessed on 2 May 2022).
  28. Ferrier, B.S.; Jin, Y.; Lin, Y.; Black, T.; Rogers, E.; DiMego, G. Implementation of a New Grid-Scale Cloud and Precipitation Scheme in the NCEP Eta Model. In Proceedings of the 19th Conference on Weather Analysis and Forecasting/15th Conference on Numerical Weather Prediction, San Antonio, TX, USA, 11 – 16 August 2002. [Google Scholar]
  29. Gopalakrishnan, S.G.; Marks, F., Jr.; Zhang, J.A.; Zhang, X.; Bao, J.-W.; Tallapragada, V. Study of the impacts of vertical diffusion on the structure and intensity of the tropical cyclones using the high-resolution HWRF system. J. Atmospheric Sci. 2013, 70, 524–541. [Google Scholar] [CrossRef]
  30. Arakawa, A.; Schubert, W.H. Interaction of a Cumulus Cloud Ensemble with the Large-Scale Environment, Part, I. J. Atmospheric Sci. 1974, 31, 674–701. [Google Scholar] [CrossRef] [Green Version]
  31. Biswas, M.K.; Carson, L.; Newman, K.; Bernardet, L.; Stark, D.; Kalina, E.; Grell, E.; Frimel, J. Community HWRF Users’ Guide V4.0a, 156 pp. 2018. Available online: https://dtcenter.org/community-code/hurricane-wrf-hwrf/documentation (accessed on 24 June 2022).
  32. Lu, X.; Wang, X.; Tong, M.; Tallapragada, V. GSI-based, continuously cycled, dual resolution hybrid ensemble-variational data assimilation system for HWRF: System description and experiments with Edouard (2014). Mon. Weather Rev. 2017, 145, 4877–4898. [Google Scholar] [CrossRef]
  33. Tong, M.; Sippel, J.; Tallapragada, V.; Liu, E.; Kieu, C.; Kwon, I.; Wang, W.; Liu, Q.; Ling, Y.; Zhang, B. Impact of Assimilating Aircraft Reconnaissance Observations on Tropical Cyclone Initialization and Prediction using Operational HWRF and GSI Ensemble-Variational Hybrid Data Assimilation. Mon. Weather Rev. 2018, 146, 4155–4177. [Google Scholar] [CrossRef]
  34. Holmlund, K. The utilization of statistical properties of satellite-derived atmospheric motion vectors to derive quality indicators. Weather Forecast. 1998, 13, 1093–1105. [Google Scholar] [CrossRef]
  35. Le Marshall, J.; Rea, A.; Leslie, L.; Seecamp, R.; Dunn, M. Error Characterization of Atmospheric Motion Vectors. Aust. Meteorol. Mag. 2004, 53, 123–131. [Google Scholar]
  36. Daniels, J.; Key, J.; Bresky, W.; Bailey, A.; Allegrino, R.; Wanzong, S.; Carr, J.; Madani, H.; Velden, C.; Santek, D.S.D.; et al. Expanding NOAA’s Atmospheric Motion Vector (AMV) Capabilities Toolbox. In Proceedings of the Presentation Given at 15th International Winds Workshop, Virtual, 12–16 April 2021. [Google Scholar]
  37. Tallapragada, V.; Kieu, C.; Kwon, Y.; Trahan, S.; Liu, Q.; Zhang, Z.; Kwon, I. Evaluation of storm structure from the operational HWRF model during 2012 implementation. Mon. Weather. Rev. 2014, 142, 4308–4325. [Google Scholar] [CrossRef]
  38. Heidinger, A. A Naïve Bayesian Cloud Mask Delivered to NOAA Enterprise, Algorithm Theoretical Basis Document; Version 1.2; NOAA NESDIS: College Park, MD, USA, 2016.
Figure 1. Domain coverage for HWRF data assimilation and forecasts. The parent domain is 77.2° by 77.2° with its center determined based on the initial location of the storm’s position and the 72-h forecast from NHC or the JTWC. The two nested domains are 17.8° by 17.8° and 5.9° by 5.9°. Resolution of outer, middle, and inner domains are 13.5 km, 4.5 km, and 1.5 km, respectively. Data assimilation is applied to ghost d02 and d03 and they have the same spatial resolution as the nested domains. They have larger domain coverage (28° by 28° and 15° by 15°).
Remotesensing 14 03068 g001
Figure 2. Flow diagram of a self-cycled HWRF hybrid variational system. Blue shaded boxes indicate components from NCEP global system (GFS).
Remotesensing 14 03068 g002
Figure 3. Density plots of QI (left) or PCT1(right) verses speed and vector departure (observation—first guess) for GOES-16 IR hourly AMV type. The red line indicates the threshold cutoff used currently.
Remotesensing 14 03068 g003
Figure 4. Proposed profile of observational wind error as a function of pressure used for IR-,CTWV-, SWIR-, CAWV-, and VIS-type AMVs (red), rawinsonde is in black and the control (H220) is in blue. Also plotted are the root-mean-square error (RMSE) from comparing GOES-16 AMVs with rawinsonde derived by the data provider.
Remotesensing 14 03068 g004
Figure 5. Percentage of observations assimilated in HWRF ghost d02 domain for each AMV type per cycle (a) with QI > 80% and PCT1 < 0.04 check and (b) without QI > 80% and PCT1 < 0.04 check for Hurricane Michael.
Remotesensing 14 03068 g005
Figure 6. Impact on IR AMVs due to changes in QC procedures and error profile on (left) the mean AMV normalized speed departure from the background/analysis (dashed) and the standard deviation of the AMV normalized vector difference from the background/analysis (solid) binned at every 50 hPa and (right) the corresponding number of observations assimilated. Statistics are calculated from the entire life cycle of 2020 Tropical Storm Cristobal. (a) Statistics are derived from hourly and 15 min AMVs separately and (b) statistics for a different experiment. CTRL is the current setting used in the 2020 operational HWRF. AMV1 only assimilated hourly AMVs with new QCs and error profile. AMV2 assimilates both hourly and 15 min AMVs using new QCs and error profile.
Remotesensing 14 03068 g006
Figure 7. Spatial coverage of IR AMVs for a single assimilation cycle from 2019 Hurricane Dorian on 1 September 2019 at 12 UTC for two HWRF assimilation domains. (a) AMVs above 600 hPa for hourly and 15 min AMVs. (b) AMVs below 600 hPa for hourly and 15 min AMVs. Height of the AMVs are color coded in hPa. ”X” indicates the center of the storm defined by NHC’s best track.
Remotesensing 14 03068 g007
Figure 8. First guess wind speed (kts) in black contours and u-component wind (kts) analysis increment (analysis—first guess) in color shades. (a) 250 hPa isobaric level. (b) Meridional cross section of the inner core domain taken through the center of the storm (marked with an “x”) defined by the NHC best track at 26.5 oN, 76.5 oW for Hurricane Dorian at 12 UTC on 1 September 2019 for (top) CTRL, (center) AMV1 and (bottom) AMV2.
Remotesensing 14 03068 g008
Figure 9. First guess temperature [K] in black contours and temperature analysis increment (analysis—first guess) in color shades [K]. (a) 500 hPa isobaric level. (b) Meridional cross section of the inner core domain taken through the center of the storm defined by the NHC best track at 26.5 oN, 76.5 oW for Hurricane Dorian at 12 UTC on 1 September 2019 for (top) CTRL, (center) AMV1 and (bottom) AMV2.
Remotesensing 14 03068 g009
Figure 10. Forecast of (a) track, (b) intensity and (c) minimum center for a single assimilation cycle from 2019 Hurricane Dorian on 1 September 2019 at 12 UTC.
Remotesensing 14 03068 g010
Figure 11. Verification statistics for the 2018 and 2019 hurricane seasons in the Atlantic Ocean for control (red) and experiment AMV1 (green). AMV1 includes SWIR and VIS AMVs. It also uses the new QCs and error profiles. Panel (a) is wind speed error measured using maximum sustained 10 m winds [m/s], (b) is wind speed bias [m/s], (c) is pressure error [hPa], (d) is track error [km], (e) is along-track bias [km] and (f) is across-track bias [km]. Squares (circles) indicate statistical significance at the 95% (90%) confidence level based on a paired t-test with adaptive serial correlation. The number of samples used in deriving these statistics is shown in secondary axis.
Remotesensing 14 03068 g011
Figure 12. Verification statistics for the 2019 and 2020 hurricane seasons in the Atlantic Ocean for control (red) and experiment AMV2 (green). AMV2 assimilates hourly SWIR and VIS as well as high-temporal AMVs for all five wind types. It also uses the new QCs and error profiles. Panel (a) is wind speed error measured using maximum sustained 10 m winds [m/s], (b) is wind speed bias [m/s], (c) is track error [km], (d) is across track bias [km], (e) is radius of tropical storm-force (RTSF) wind error [km], and (f) is radius of hurricane-force (RHF) wind error [km]. Squares (circles) indicate statistical significance at the 95% (90%) confidence level based on a paired t-test with adaptive serial correlation. The number of samples used in deriving these statistics is shown in the secondary axis.
Remotesensing 14 03068 g012
Figure 13. Verification statistics for the 2020 hurricane seasons in the Eastern Pacific Ocean for control (red) and experiment AMV2 (green). AMV assimilates hourly SWIR and VIS as well as high-temporal AMVs for all five wind types. It also uses the new QCs and error profiles. Panel (a) is track error [km], (b) is cross track bias [km], (c) is minimum central pressure [hPa], (d) radius of hurricane-force (RHF) wind error [km], (e) is intensity error measured using maximum sustained 10 m winds [m/s] and (f) is intensity bias [m/s]. Squares (circles) indicate statistical significance at the 95% (90%) confidence level based on a paired t-test with adaptive serial correlation. The number of samples used in deriving these statistics is shown in the secondary axis.
Remotesensing 14 03068 g013
Table 1. GOES-16 and 17 imager spectral channels used to derive the different AMV types.
AMVABI BandCentral Wavelength (μm)CloudClear-Sky Water VaporABI Image
Spatial Resolution (km)
AMV Spatial
Resolution (km)
VIS20.64X 0.57.5
SWIR73.9X 2.030
WV86.2X
WV96.9 X
WV107.3 X
IR1411.2X 38
Table 2. List of assimilation experiments conducted.
Experiment NameAMV Wind Type UsedOther Changes
CTRLHourly IR, CTWV and CAWV AMVsH220 settings
AMV1Hourly IR, CTWV, CAWV, SWIR and VIS AMVsProposed new QCs, error profile and gross check ratio
AMV2Hourly and 15 min IR, CTWV, CAWV, SWIR and VIS AMVsProposed new QCs, error profile and gross check ratio
Table 3. List of current and proposed QCs and gross ratios for HWRF.
CurrentProposed
Gross check ratio of 1.3 for IR, CTWV and 2.5 for CAWV, SWIR and VISGross check ratio of 3.5 for IR, CTWV, CAWV, SWIR and VIS
QI > 80%No QI check
0.04 < PCT1 < 0.5 for IR, CTWV, VIS and SWIR AMVs.PCT1 < 0.5 for IR, CTWV. VIS and SIWR AMVs
Blacklisting of IR AMVs 400–800 hPa.Blacklisting of IR AMVs 400–600 hPa.
Publisher’s Note: MDPI stays neutral with regard to jurisdictional claims in published maps and institutional affiliations.

