Article

Drought Assessment on Vegetation in the Loess Plateau Using a Phenology-Based Vegetation Condition Index

1
College of Geographical Science, Shanxi Normal University, Taiyuan 030031, China
2
College of Geographical Science, Northeast Normal University, Changchun 130024, China
*
Author to whom correspondence should be addressed.
Remote Sens. 2022, 14(13), 3043; https://doi.org/10.3390/rs14133043
Submission received: 25 April 2022 / Revised: 15 June 2022 / Accepted: 21 June 2022 / Published: 24 June 2022
(This article belongs to the Special Issue Remote Sensing for Drought Monitoring and Forecasting)

Abstract

:
Frequent droughts induced by climate warming have caused increasing impacts on the vegetation of the Loess Plateau (LP). However, the effects of drought on vegetation are highly dependent on when the drought occurs and how long it lasts during the growing season. Unfortunately, most of the existing drought indices ignore the differences in the drought effects on different vegetation growth stages. In this study, we first established a phenology-based vegetation condition index, namely weighted vegetation condition index (WVCI), which accounts for the differences in vegetation sensitivity to drought by assigning specific weights to different phenological stages of vegetation. Then, we used the WVCI to reveal the temporal and spatial variations in vegetative drought from 2001 to 2019 over the LP from the aspects of drought frequency, trend and relative deviation. The results showed that (1) the LP experienced frequent droughts during the study period, but mainly mild and moderate droughts. The drought frequencies decreased from southeast to northwest, and extreme droughts rarely occurred in mountainous areas and plains. (2) The droughts in most areas of the LP tended to ease, and only a few areas in the Hetao Plain, Ningxia Plain and Fenwei Plain showed an increasing trend of drought. (3) After 2012, the departure percentage of WVCI in most areas of the LP was positive, indicating above-average vegetation conditions. (4) Compared with the well-established vegetation condition index, the WVCI proved to have the ability to monitor and assess vegetative drought on an annual scale in the LP. As a result, our research could help develop and implement drought-resistance and disaster-prevention measures on the LP.

Graphical Abstract

1. Introduction

Drought is one of the most complex and severe natural disasters, mainly caused by a lack of precipitation and intense evaporation, especially in semi-arid and arid regions [1]. Drought is not only an important factor leading to the deterioration of ecosystems and the environment but also an important obstacle to food security and economic-social development. According to the recently released report “Climate Change 2021: Natural Science Basis” [2], it has been found that the 50 years since 1970 have been the warmest in the past 2000 years. Under the background of global warming and drying, drought disasters show an increasing trend in frequency, intensity and impact in recent decades across many regions worldwide [3,4,5,6].
Standardized drought indices are often used to quantify drought events. These indices can be classified into two types based on data from meteorological stations or satellites. The station-based drought indices consider meteorological factors (precipitation, evaporation, soil moisture, etc.), such as the Palmer drought severity index (PDSI) [7], standardized precipitation index (SPI) [8], and standardized precipitation evapotranspiration index (SPEI) [9], etc. These drought indices are excellent at assessing drought conditions near meteorological stations. Still, they fall short of describing and monitoring regional-scale drought trends, particularly in areas with few meteorological stations or a high degree of considerable geographic variability [10,11]. The satellite-based drought indices make it possible to monitor vegetation growth conditions on a large spatial scale. These drought indices consider the surface vegetation coverage, such as the normalized difference vegetation index (NDVI) [12], vegetation condition index (VCI) [13] and temperature vegetation dryness index (TVDI) [14], etc. Among these proxies, the World Meteorological Organization (WMO) recommends VCI for assessing droughts (i.e., the impact, duration and intensity of droughts) in a variety of places around the world [15,16,17,18,19], because it has the strengths of easy calculation, not requiring in-site data, and can deliver near real-time data at a high spatial resolution anywhere in the globe [20], and its dependability has been validated by several studies [17,18,19,20,21].
The Loess Plateau (LP) is located in northwestern China. It has been one of the most important agricultural areas in China for thousands of years, and currently benefits 8.7% of the total population of China [22,23]. However, the frequent droughts in the region increase the risk of natural disasters, and severely threaten agricultural production [24]. Furthermore, the water shortage restraint has hindered the healthy and sustainable development of the ecological environment of the LP, and the uneven distribution of precipitation throughout the year also makes the LP suffer from severe soil erosion [25,26], which may bring many negative effects on nature, such as decreased agriculture productivity and water pollution. To control soil erosion, a number of scientists and policymakers support intensive vegetation over large areas, despite the fact that this could increase transpiration and exacerbate water scarcity [26]. With global warming, the mean climate (annual mean temperature has a significant upward trend, but annual precipitation has no significant downward trend [27,28,29] and extreme climate (the longest duration of a heat wave and the threshold value of hot days have an upward trend, but the number of rainstorm days has a downward trend) [30,31,32] on the LP have changed. The comprehensive effects of climate change and human activities lead to more complex drought conditions in the Loess Plateau [23].
Most of the previous studies involving spatiotemporal analysis of droughts in the LP were based on meteorological factors, such as precipitation and temperature [33,34,35,36,37,38]. Wang et al. [36] explored the temporal-spatial variations in drought on the LP based on SPI and SPEI, and discussed the correlation between drought index and atmospheric circulation. Li et al. [37] employed SPI to analyze the characteristics of regional meteorological droughts and their linkage with the southern oscillation index throughout the LP. Sun and Ma [38] estimated the PDSI based on monthly precipitation and temperature from 53 meteorological stations in the LP, and pointed out that precipitation had a key influence in the inter-annual variation in the PDSI. In addition, a few scholars have employed VCI to monitor the drought conditions and proved its applicability on the LP. For example, Li et al. [11] demonstrated that VCI is superior to SPI for the real-time monitoring of agricultural droughts on the LP. Li et al. [39] pointed out that the VCI index has advantages in monitoring agricultural drought in the Shaanxi Province. However, their studies ignored the differences in the effects of drought on key phenological stages of vegetation growth. As the study by Wang et al. [40] found, when drought strikes at an earlier point in the crop growth cycle, it has a greater influence on crop yields than when it occurs later. Surveys such as that conducted by Walz et al. [41] showed that the effects of drought on the initial and middle stages of vegetation growth were greater than those at the end of vegetation growth. In India, another study by Das et al. [42] pointed out that the impact of drought on agriculture varies depending on when it happens and how long it lasts. Hence, Graw et al. [4] developed a weighted linear combination (WLC) method to account for crop growing stages vulnerable to drought, and they concluded that the WLC was more accurate for assessing drought severity than yearly median VCI values over the vegetation growing season in the Eastern Cape Province, South Africa. Therefore, it is necessary to carry out a comprehensive assessment on vegetative drought over the LP, accounting for the timing of drought occurrence during the growing season.
The primary objective of this study was to present a detailed spatiotemporal analysis of vegetative drought using a phenological-based vegetation condition index on the LP. The specific objectives include the following: (1) establishing a weighted vegetation condition index (WVCI) using VCI by combining phenological parameters; (2) identifying the spatial pattern of the key phenological parameters; (3) exploring the characteristics of vegetative drought from the aspects of drought frequency, trend and relative deviation; (4) validating the suitability of the WVCI for monitoring vegetative drought by comparing it to the well-established VCI. The basic process of the present research is shown in Figure A1.

2. Materials and Methods
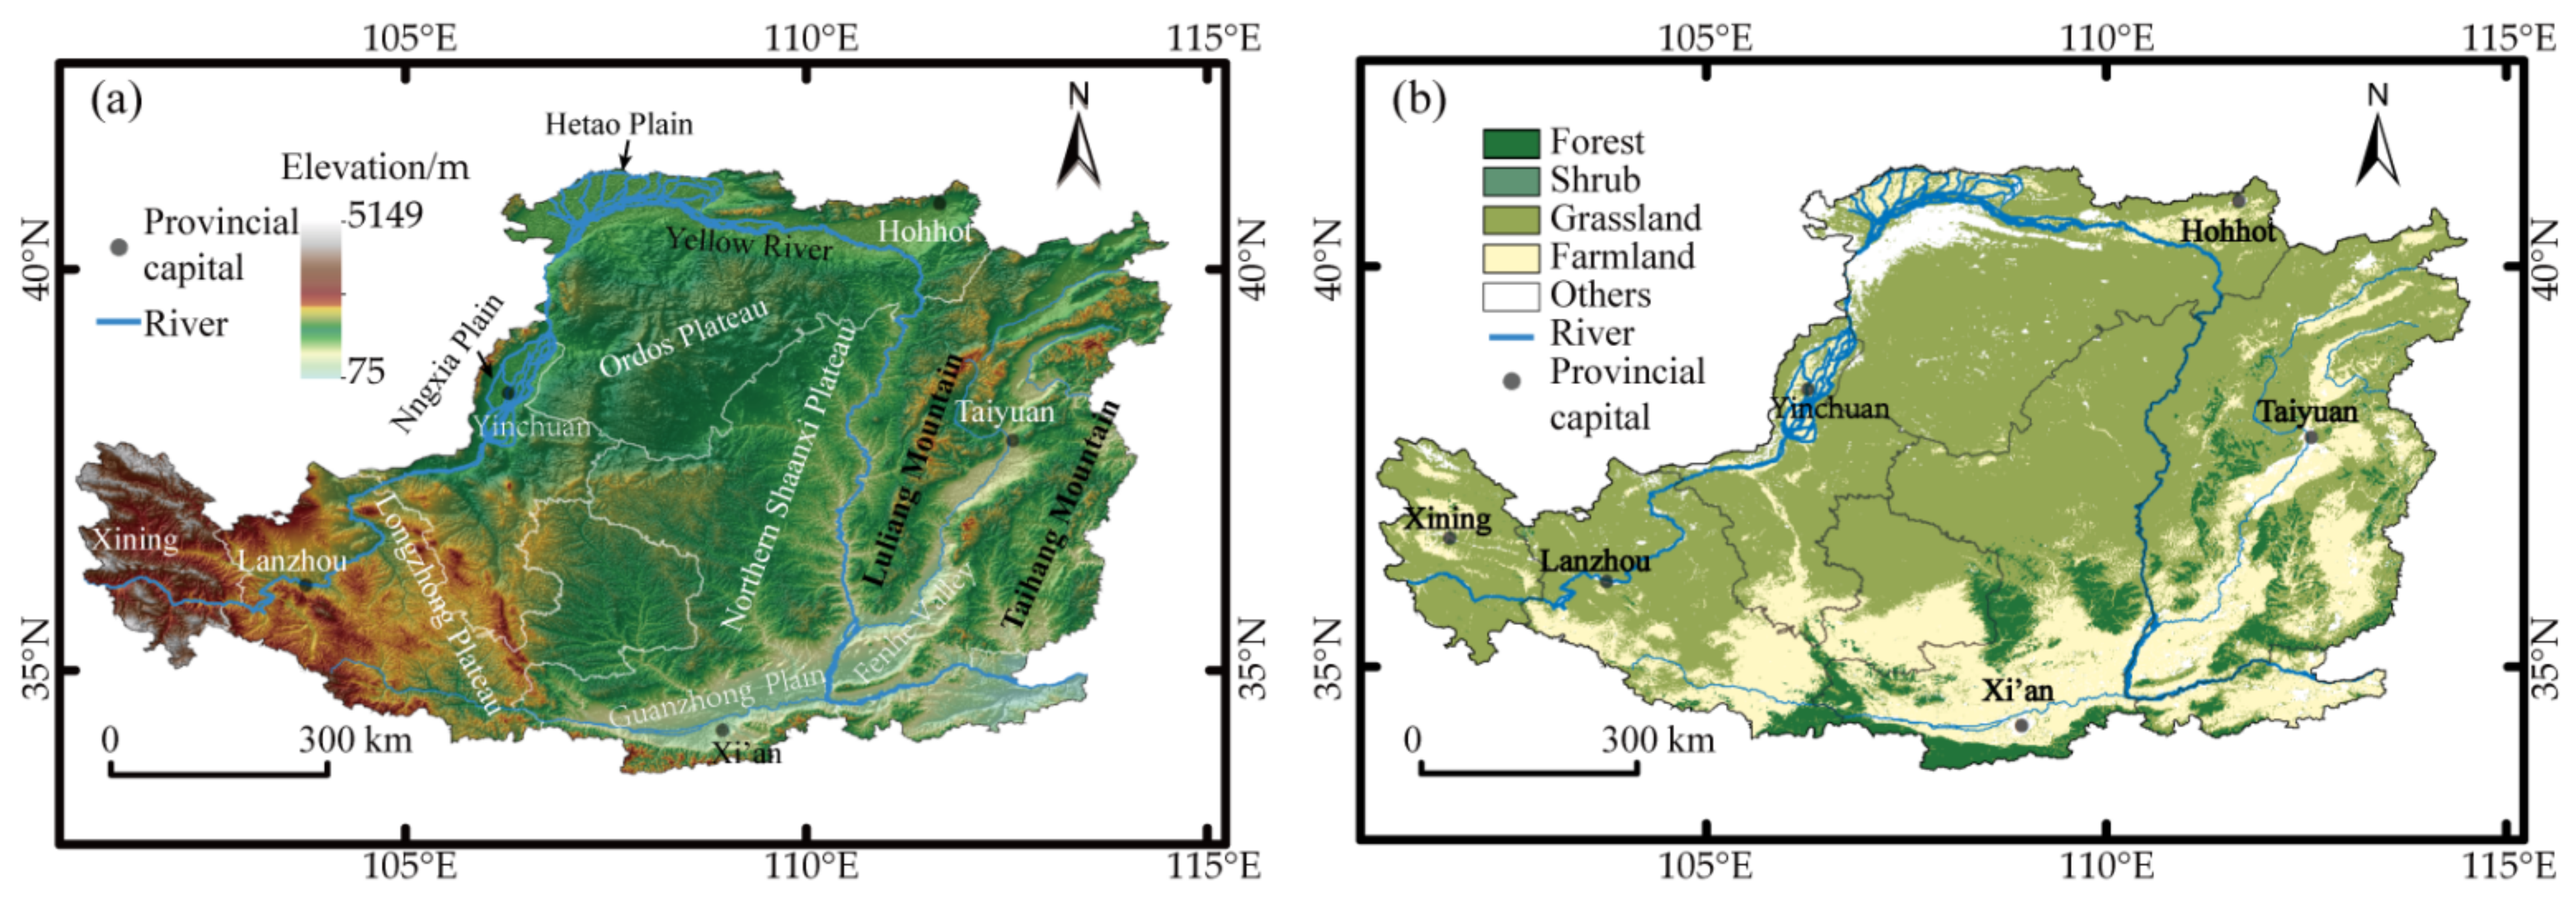
2.1. Study Area

The LP is situated between 33°43′ N and 41°16′ N latitude and 100°54′ E and 114°33′E longitude. It stretches from the Taihang Mountains in the east to the Riyue Mountains in the west, with the Yinshan Mountains in the north and the Qinling Mountains in the south as its borders [34]. It covers an area of approximately 6.24 × 10⁵ km2, including seven provinces (autonomous regions), namely Inner Mongolia, Shanxi, Henan, Shaanxi, Ningxia, Gansu and Qinghai. The elevation ranges from 75 m in the southeast to 5149 m a.s.l. in the northwest (Figure 1a). The climatic zone varies from a semi-humid monsoon climate zone in the southeast to an arid climate zone in the northwest, due to numerous geographical factors, including latitude and longitude, atmospheric circulation, and terrain. In general, the average annual temperature increases gradually from 3.6 °C in the northwest to 14.3 °C in the southeast, while the annual precipitation increases from 200 mm to 750 mm in a similar direction [23]. Influenced by the climate distribution, vegetation on the LP is spread out in strips from southeast to northwest, with the primary vegetation types being forest, shrub, grassland and farmland, respectively (Figure 1b) [43].

2.2. Data Acquisition
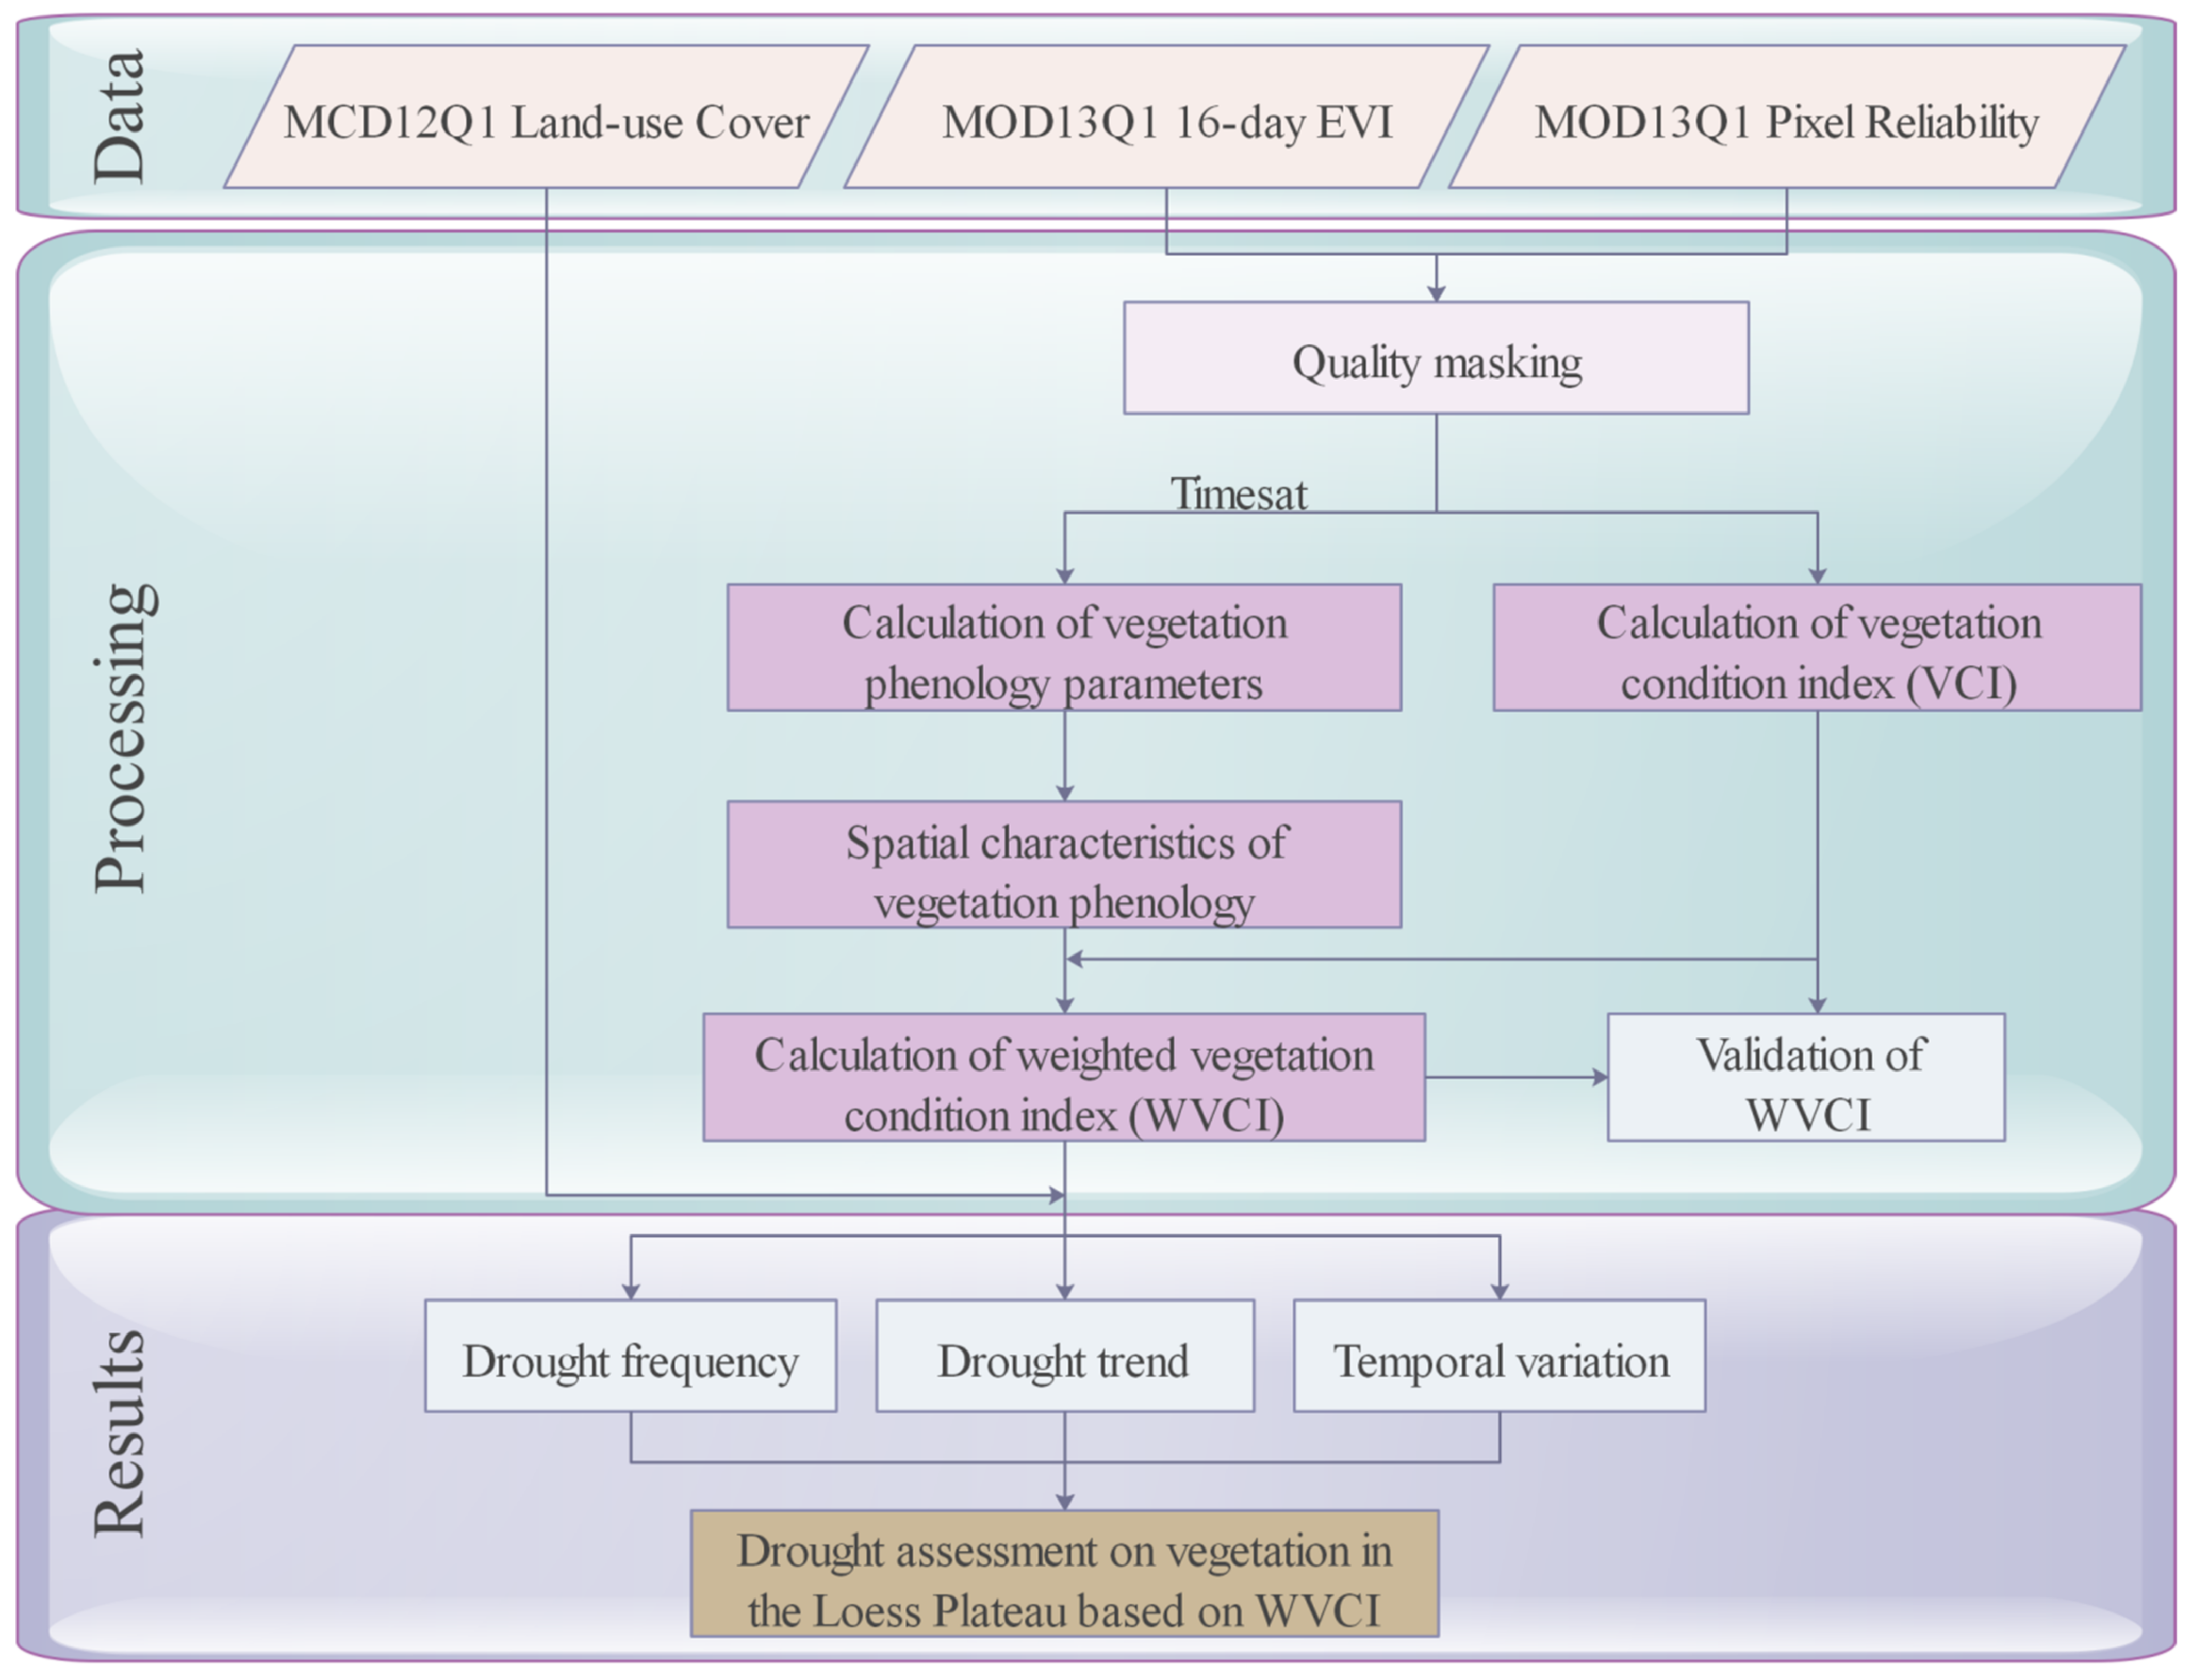
Compared to NDVI, the enhanced vegetation index (EVI) is less susceptible to atmospheric noise and soil background, and less saturated in dense vegetation [44,45]. Therefore, this study selected MODIS/EVI to extract the key phenological metrics of vegetation and calculate VCI values in the LP. The MODIS/EVI data sets from 2001 to 2019 were derived from the online data pool at the NASA EOSDIS Land Processes Distributed Active Archive Center (LP DAAC), USGS/Earth Resources Observation and Science (EROS) Center, Sioux Falls, South Dakota (http://lpdaacsvc.cr.usgs.gov/appeears/, accessed on 4 December 2020), with 16-day temporal resolution and 250 m spatial resolution. In order to further mask out the pixels impacted by atmospheric interferences, such as clouds as well as snow and ice cover, the pixel reliability quality assurance layer of MOD13Q1 was used.
The MODIS land-use cover data (MCD12Q1) for the year 2019 was also collected from http://lpdaacsvc.cr.usgs.gov/appeears/ (accessed on 4 December 2020), with 500 m spatial resolution. The MODIS land-use covers were categorized into the following four primary land cover classes (Figure 1b): forest, shrub, grassland, and farmland. This study assumed that the effects of land cover changes on vegetation ecosystems were negligible because the vegetation might be relatively stable over short periods of around ten years at regional or global scales [46]. In addition, the MCD12Q1 product was resampled from a spatial resolution of 500 m to 250 m to match the MODIS/EVI data using the nearest neighbor method, which works well with discrete data in comparison with the bilinear interpolation and the cubic convolution interpolation methods [47,48] because it can maintain and does not destroy the gray values of the original image [49]. In this paper, the land-use data have two main purposes. One is to mask out non-vegetation areas, and the other is to distinguish different vegetation types affected by drought. The land-use data are not involved in the calculation of the WVCI, so changes in its resolution have no substantial impact on the accuracy of the drought results.
The Shuttle Radar Topography Mission (SRTM) dataset with 90 m spatial resolution was achieved at Loess Plateau SubCenter, National Earth System Science Data Center, National Science and Technology Infrastructure of China (http://loess.geodata.cn, accessed on 8 November 2020). The SRTM dataset was only utilized to discover the topographic distribution of the LP (Figure 1a).

2.3. Methods

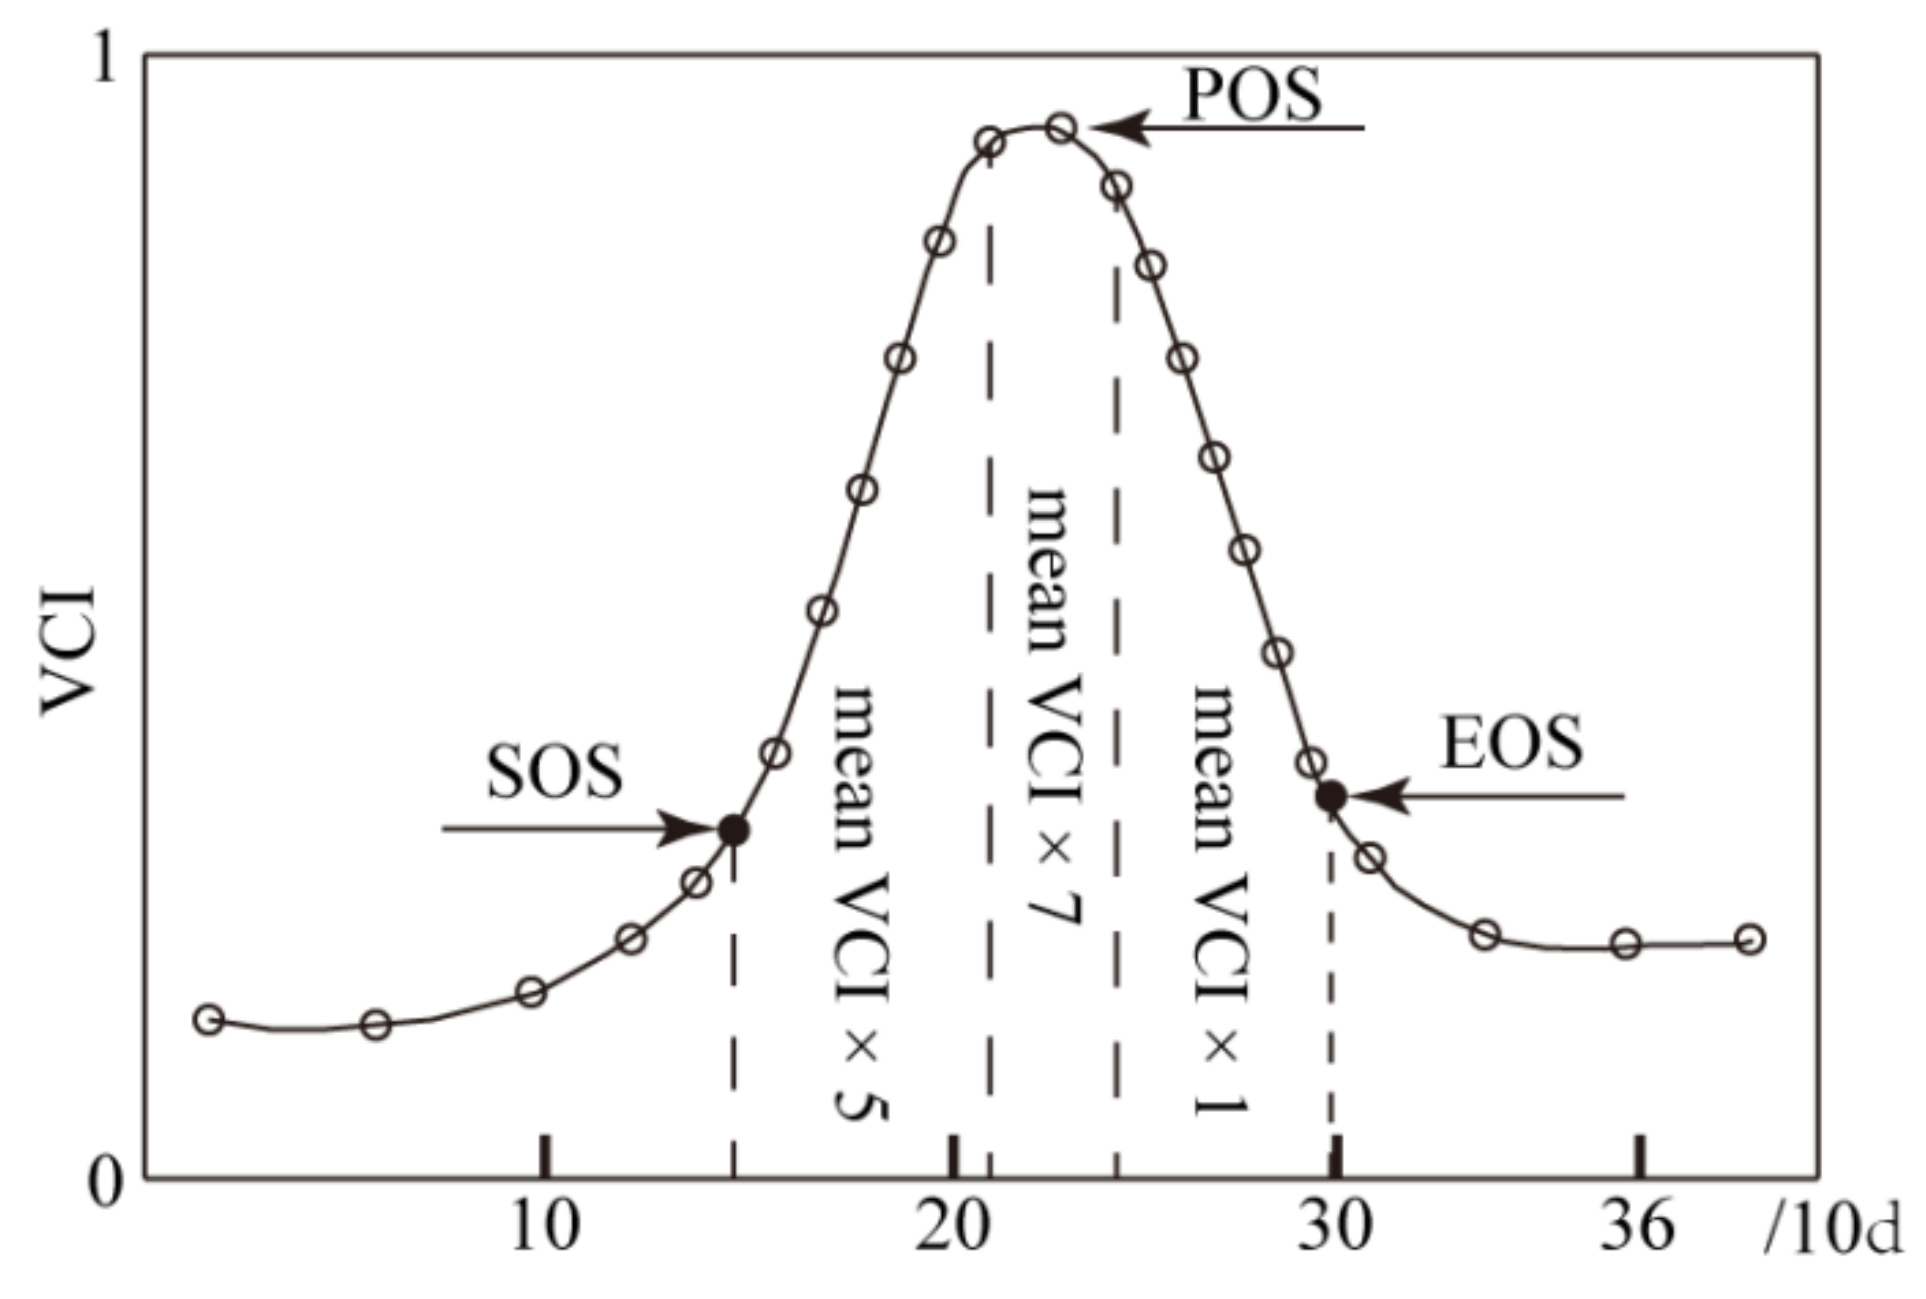
2.3.1. Data Smoothing and Phenology Extraction

Although the MODIS/EVI time-series data have been processed by the maximum value synthesis, there are still influences from clouds, aerosols, and other noise, which may cause the EVI time-series to change irregularly. Therefore, before extracting the vegetation phenology parameters, one needed to smooth the EVI time-series data to further remove the effects of noise. Relevant studies [50,51] have confirmed that the Savitzky–Golay filtering method performs best in most situations when de-noising time-series vegetation index data from various satellite sensors. Therefore, the EVI time-series were reconstructed using the Savitzky–Golay method here.
There are a variety of phenological extraction methods available. The most frequently used are threshold, moving average, maximum ratio, and dynamic threshold. Among these methods, the dynamic threshold approach can be adjusted dynamically in response to the difference between the research regions to eliminate the effects of soil background and vegetation type. Here, we designated the start of the growth season (SOS) as the point at which the EVI amplitude surpassed 20% of the current EVI amplitude (the difference between the maximum and the minimum), while the time point at which EVI fell to 80% of its current amplitude was designated as the end of the growth season (EOS) [52]. Furthermore, the peak of the growth season (POS) was defined as the date on which the greatest EVI was observed during the growing season [53]. The ratios of SOS and EOS have been verified by Pei et al. [43] based on the phenology recorded in the field. All the phenological metrics were extracted through Timesat (version 3.3, available from https://web.nateko.lu.se/timesat/timesat.asp, accessed on 10 December 2020), developed by Jönsson and Eklundh [54]. In the case of a time-series spanning n years, it should be noted that the Timesat software will only provide seasonality parameters for the n-1 middle seasons. To obtain the whole set of phenological parameters from 2001 to 2019, we duplicated the time-series images in 2001 and 2019, and added them to the beginning and end of the entire time-series images, respectively.

2.3.2. Vegetation Condition Index

Different from the EVI, which directly measures vegetation growth state, the VCI reflects how many differences there are between vegetation status and background value in a given area and can identify drought conditions based on local climate and natural background conditions. It has the potential to mitigate the effects of geographical, climatic and soil factors [17,55]. Therefore, VCI is frequently used to diagnose drought and quantify its onset, severity, duration, and effect on vegetation [56]. In this work, the VCI was applied to create and validate the WVCI. The VCI was computed as the following equation:
VCI i = EVI i EVI min EVI max EVI min × 100
where EVI i is the ith smoothed 16-day EVI value of the pixel in a specific period, EVI max and EVI min are the multi-annual maximum and minimum, respectively, calculated for each pixel during 2001–2019.

2.3.3. Weighted Vegetation Condition Index

Drought has a greater influence on vegetation growth during POS, as well as between SOS and POS, compared to the senescence stage [41]. Therefore, it is necessary to assign distinct weights to different phenological stages of vegetation so as to account for changes in the susceptibility of vegetation to drought at various periods of its growth [4]. The calculation for the proposed index consists of the following five main steps: (1) calculating multi-year averages of the key phenological parameters SOS, POS and EOS pixel by pixel; (2) screening out the raw VCI images in the vegetation growing season every year according to the average SOS and EOS; (3) dividing the selected VCI images in each year into the following three individual groups depending on their timely position: (a) from SOS to 16 days before POS, (b) during POS, and (c) from 16 days after POS to EOS; (4) averaging the VCI images in each group separately; and (5) merging the three mean VCI images obtained in step (4) using the weight five for group (a), seven for group (b), and one for group (c), respectively (see Figure 2), and one WVCI layer remained for each year. The calculation of WVCI can be expressed as follows:
WVCI i = m e a n ( VCI i a v e ( a ) × 5 + VCI i a v e ( b ) × 7 + VCI i a v e ( c ) × 1 )
where VCI i a v e ( a ) , VCI i a v e ( b ) and VCI i a v e ( c ) are the average VCI value for groups (a), (b) and (c) in a specific year i, respectively. m e a n is the mean function. The values of WVCI vary from 0 to 100, with lower values indicating worse vegetation growth and greater levels of drought. It should be worth mentioning that the weights applied in the WVCI were created following a review of the literature [4,41] and collaboration with local experts.

2.3.4. Drought Frequency

According to the drought classification criteria published in the literature [41,57], vegetative droughts were classified into five grades, as indicated in Table 1. Then, the various grades of drought frequency were estimated using Equation (3).
f = n N × 100 %
where f denotes the drought frequency, n represents the number of distinct grades of drought throughout the study period, and N denotes the entire duration of the study period (19 years in this paper).

2.3.5. Trend Analysis

The Theil–Sen slope [58], which is not sensitive to missing values and outliers, was employed to estimate the rate of change in WVCI at the pixel level. The Theil–Sen slope calculation is shown in Equation (4). Meanwhile, the Mann–Kendall method was used to test the significance of variation trends (for more information, see Mann [59]).
β = Median ( WVCI k WVCI i k i ) ,       k > i
where β is the rate of change, WVCI i and WVCI k are the ith and kth values after sorting, respectively, and median is the median function. A value of β > 0 indicates that the WVCI in the growing season tends to increase, and the degree of drought slows down; otherwise, the WVCI value in the growing season tends to decrease and the degree of drought intensifies.

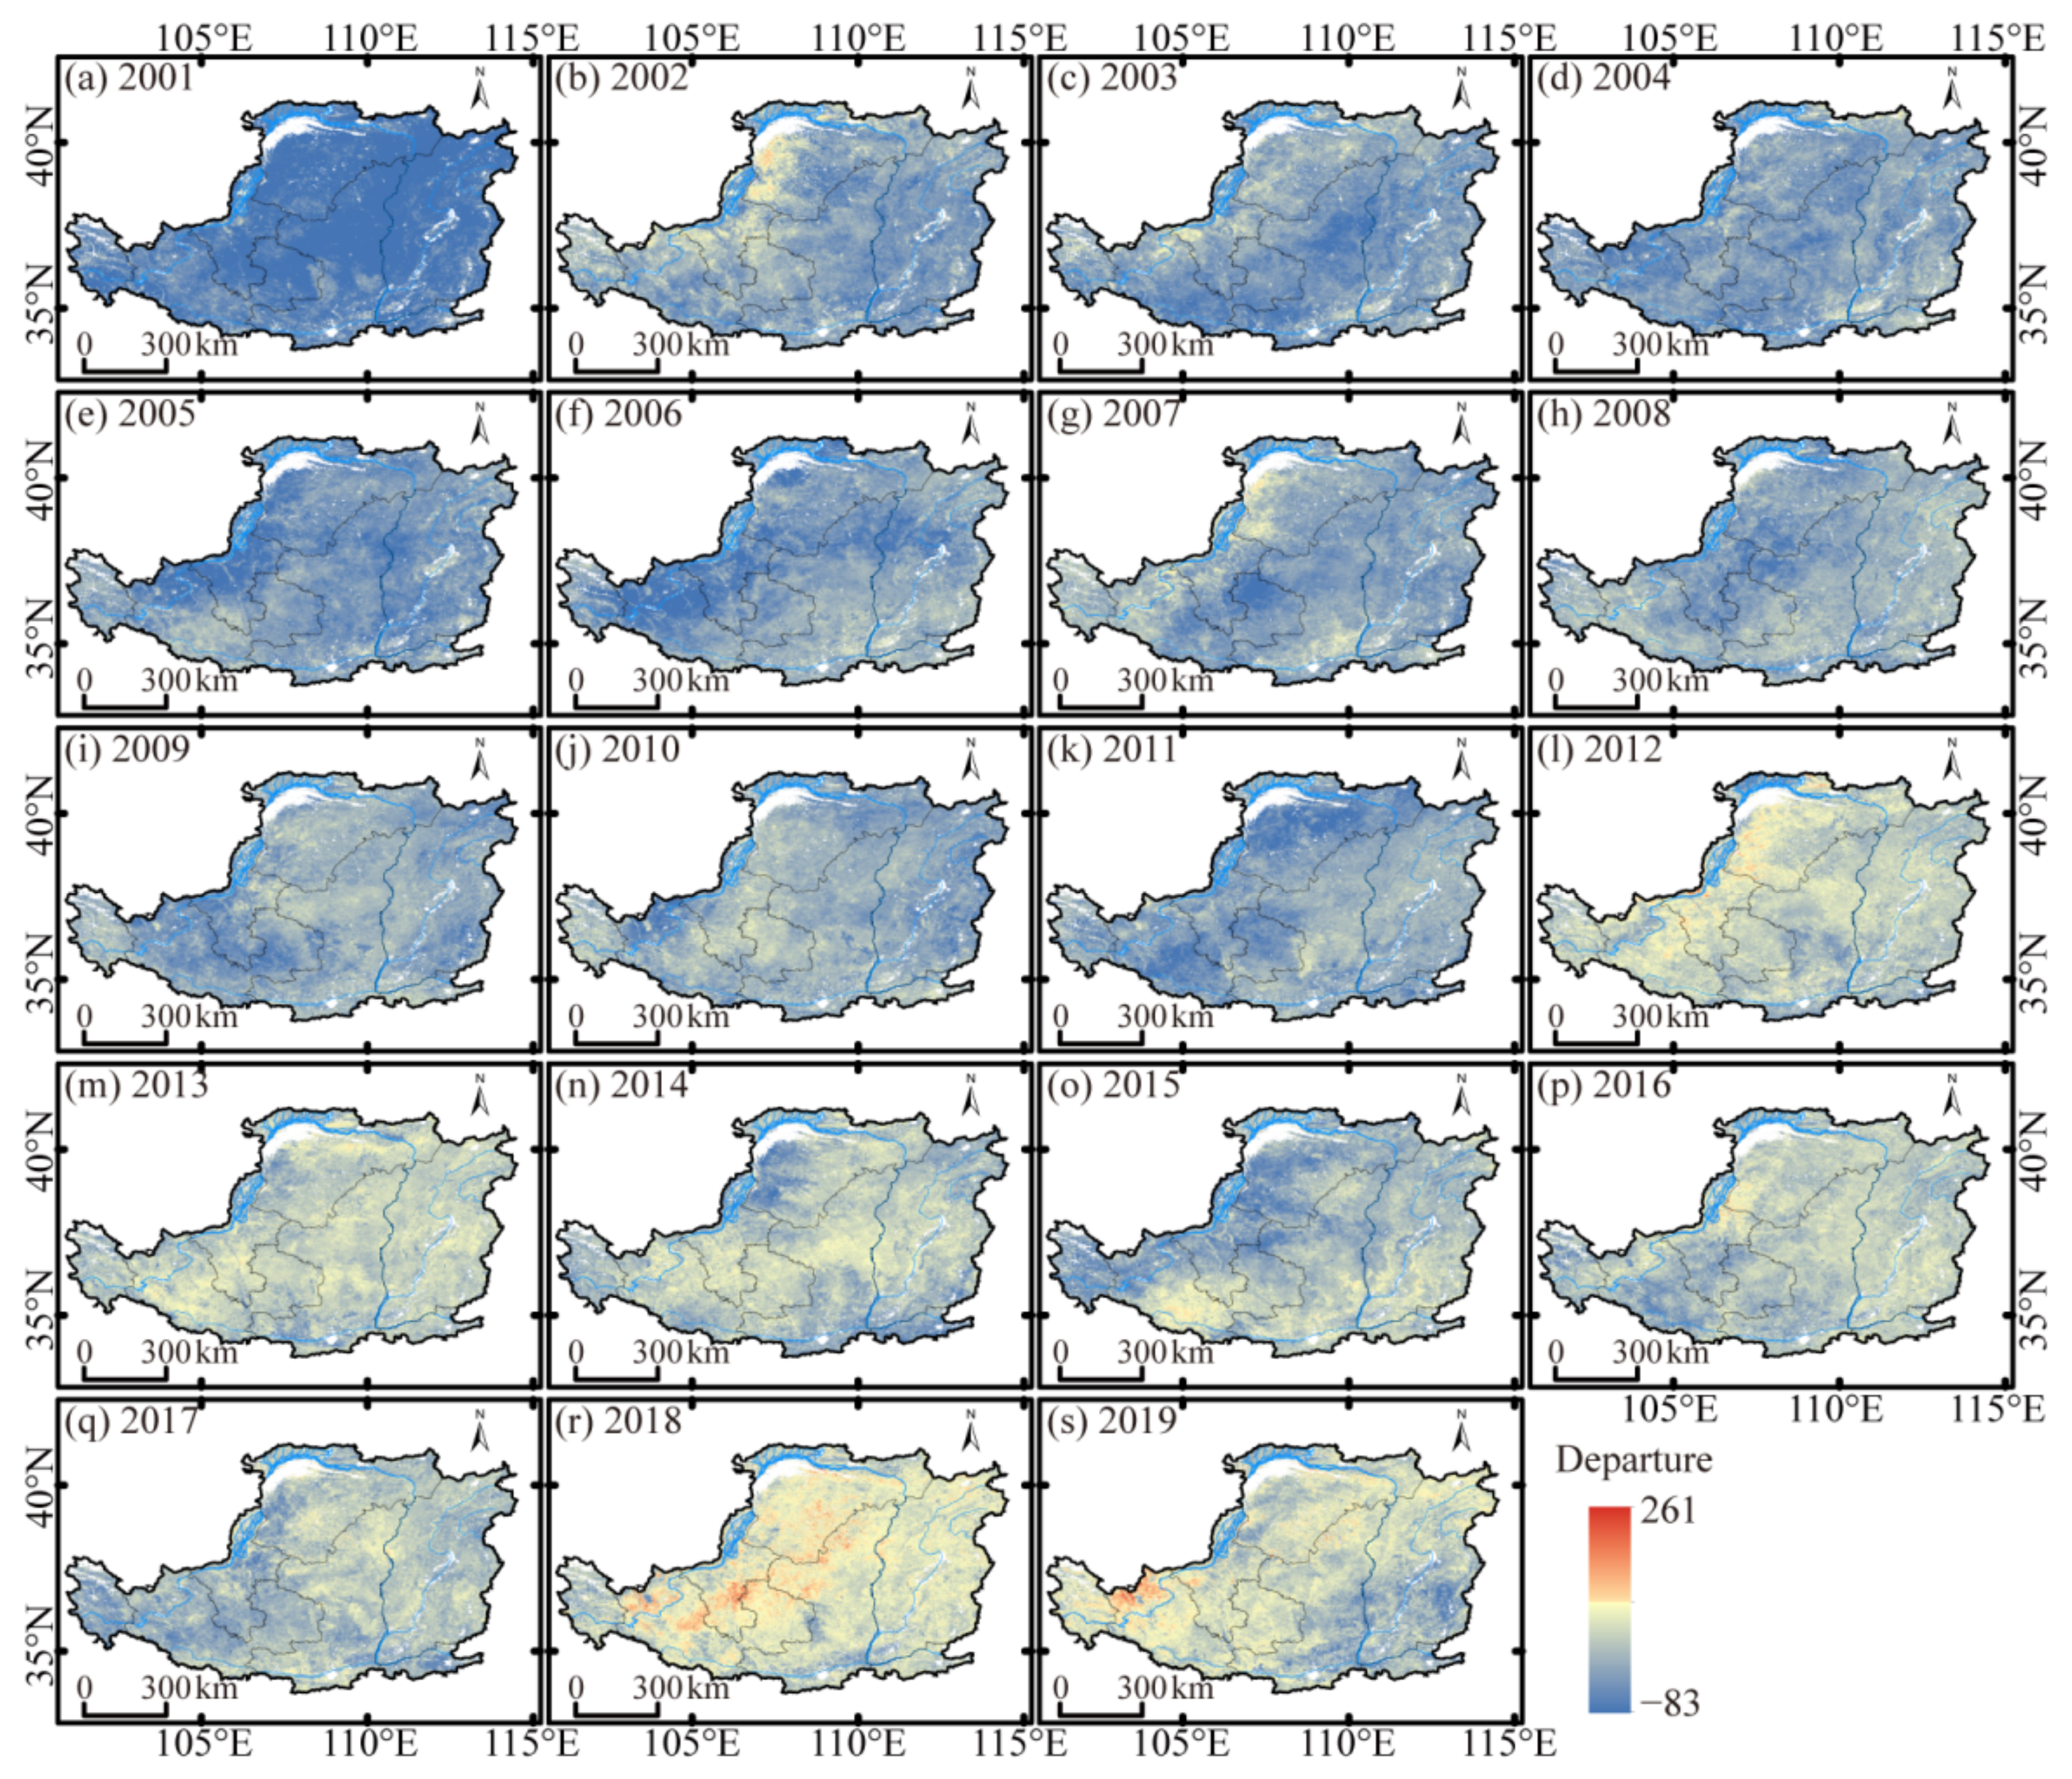
2.3.6. Departure Analysis

The departure percentage (D), computed using Equation (5), was employed to analyze temporal variations in the WVCI.
D i = ( WVCI i - WVCI ¯ ) / WVCI ¯ × 100
where D i is the D value of the pixel in a specific year i, WVCI i is the WVCI value of the pixel in a specific year i, and WVCI ¯ is the mean WVCI value during the period from 2001 to 2019. If D i < 0, it indicates that soil moisture is relatively deficient and vegetation conditions are worse than average, and vice versa [17].

2.3.7. Validation of the WVCI

Ideally, the WVCI should be compared with drought impact data to determine its usefulness for monitoring vegetative drought [20,42]. Due to the scarcity of these data, this paper employed Pearson correlation coefficient to test the relationship between the WVCI and the VCI for proving the effectiveness of the WVCI in assessing the drought conditions across the LP. However, Pearson correlation coefficient is a parametric test. It can measure the linear relationship between two variables, but requires that both variables are normally distributed. We had a small sample size (only 19 years of data), so a Shapiro–Wilk test [60] was performed to determine the normality of VCI and WVCI separately. The calculation formula of Pearson correlation coefficient was as follows:
R WVCI , VCI = i = 1 N ( WVCI i WVCI ¯ ) ( VCI i VCI ¯ ) i = 1 N ( WVCI i WVCI ¯ ) 2 i = 1 N ( VCI i VCI ¯ ) 2
where R WVCI , VCI is the Pearson correlation coefficient between the WVCI and the VCI for each pixel. VCI i is the VCI value of the pixel in a specific year i, and VCI ¯ is the mean VCI value during the period from 2001 to 2019. The meanings of the other variables are the same as in the above formulas. The Shapiro–Wilk tests and Pearson correlation coefficients were calculated for each pixel using the statistics package in R statistical software and the t-test was used to check the significance of the correlation coefficient [17]. Under the premise of normal distribution of time series, if the correlation coefficient between the WVCI and the VCI is positive and the p-value is less than 0.05, it is thought that there is a statistically significant link between them [17].

3. Results

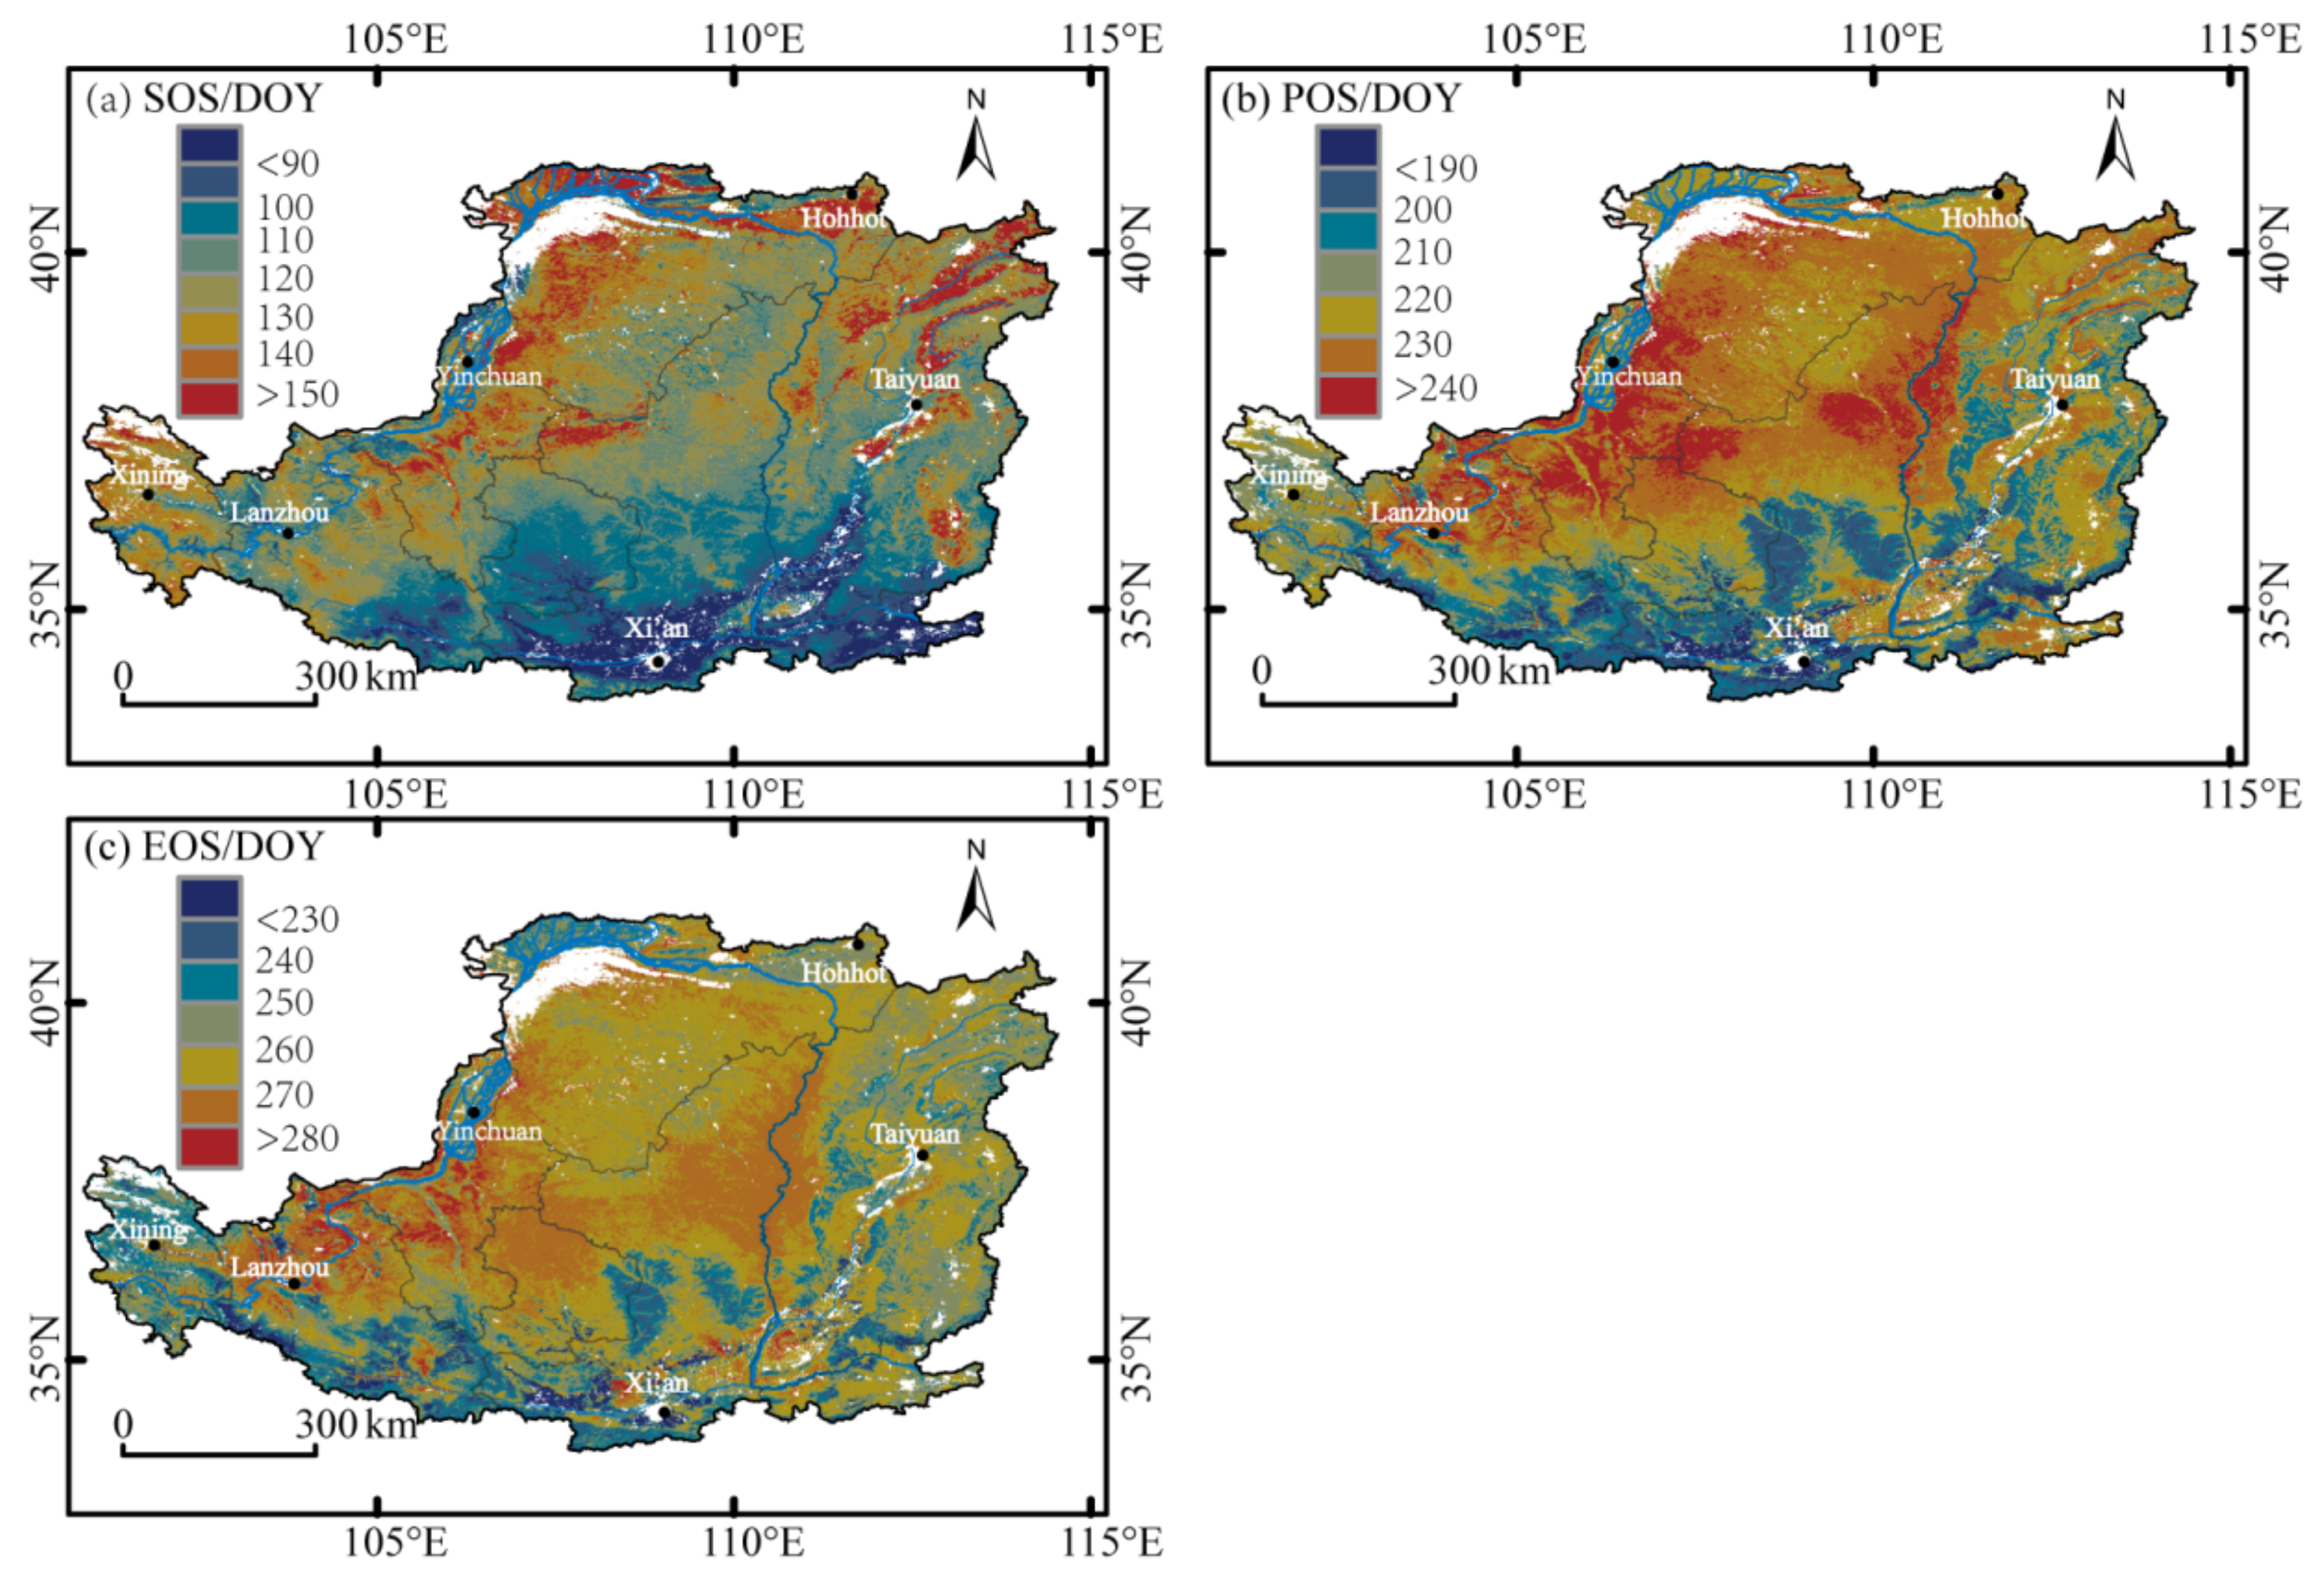
3.1. Spatial Patterns of Vegetation Phenology

According to the vegetation phenology extraction method described in Section 2.3.1, the spatial distributions of the SOS, POS and EOS were obtained from 2001 to 2019 in the LP. Based on the phenology parameters each year, we averaged the SOS, POS and EOS for the observation period (Figure 3). As indicated in Figure 3a, the SOS of the vegetation was predominantly spread in the range of the 90th–150th day of the year (DOY), accounting for about 86.85% of the study area. The areas with SOS earlier than the 90th DOY were mostly concentrated in the Guanzhong Plain and Fenhe Valley in the southern part of the LP, accounting for about 6.42% of the total pixels. The SOS of vegetation in northern Shanxi and the Helan mountainside was later than the 150th DOY, accounting for about 6.73%. In conclusion, vegetation began to grow earlier in the valley-plain locations with relatively warm and humid climates, while vegetation started to grow later in the northeast and northwest of the LP, due to relatively dry and cold climates. The SOS of vegetation on the LP generally showed the law of delaying from the Guanzhong Plain in the southern low-altitude areas to the Ordos Plateau in the northern high-altitude areas.
As observed from Figure 3b, the POS of the vegetation mainly ranged from the 200th to the 240th DOY (pixels accounted for approximately 84.93%), and its spatial distribution pattern was very similar to that of SOS. An earlier POS before the 200th DOY mainly occurred in the southern part of the LP and the earliest in the Guanzhong Plain. A later POS, occurring at the 220th–240th DOY, was mostly distributed within the northern LP. In general, the POS was gradually delayed from southeast to northwest.
The EOS mostly varied from the 240th to the 280th DOY, which takes up about 92.94% of the study area (Figure 3c). The earliest EOS mostly occurred in mountainous areas with forest land, including the Qinling Mountain in the southern LP, Riyue Mountain in the western LP, Jishi Mountain and Longshan Mountain in the southern Gansu Province, Ziwuling and Huanglong Mountain in ShaanxiProvince, as well as Luliang Mountain, Zhongtiao Mountain and Taihang Mountain in ShanxiProvince. The following areas were the Ningxia Plain and Hetao Plain in the northwest of the LP, probably because the crops had been harvested. The latest EOS, which occurred after the 270th DOY, was discovered mostly in the Longzhong Plateau and the Northern Shaanxi Plateau. Although there was no discernible spatial variation for the EOS, a gradual delay trend from the north to the south was still noted (Figure 3c).

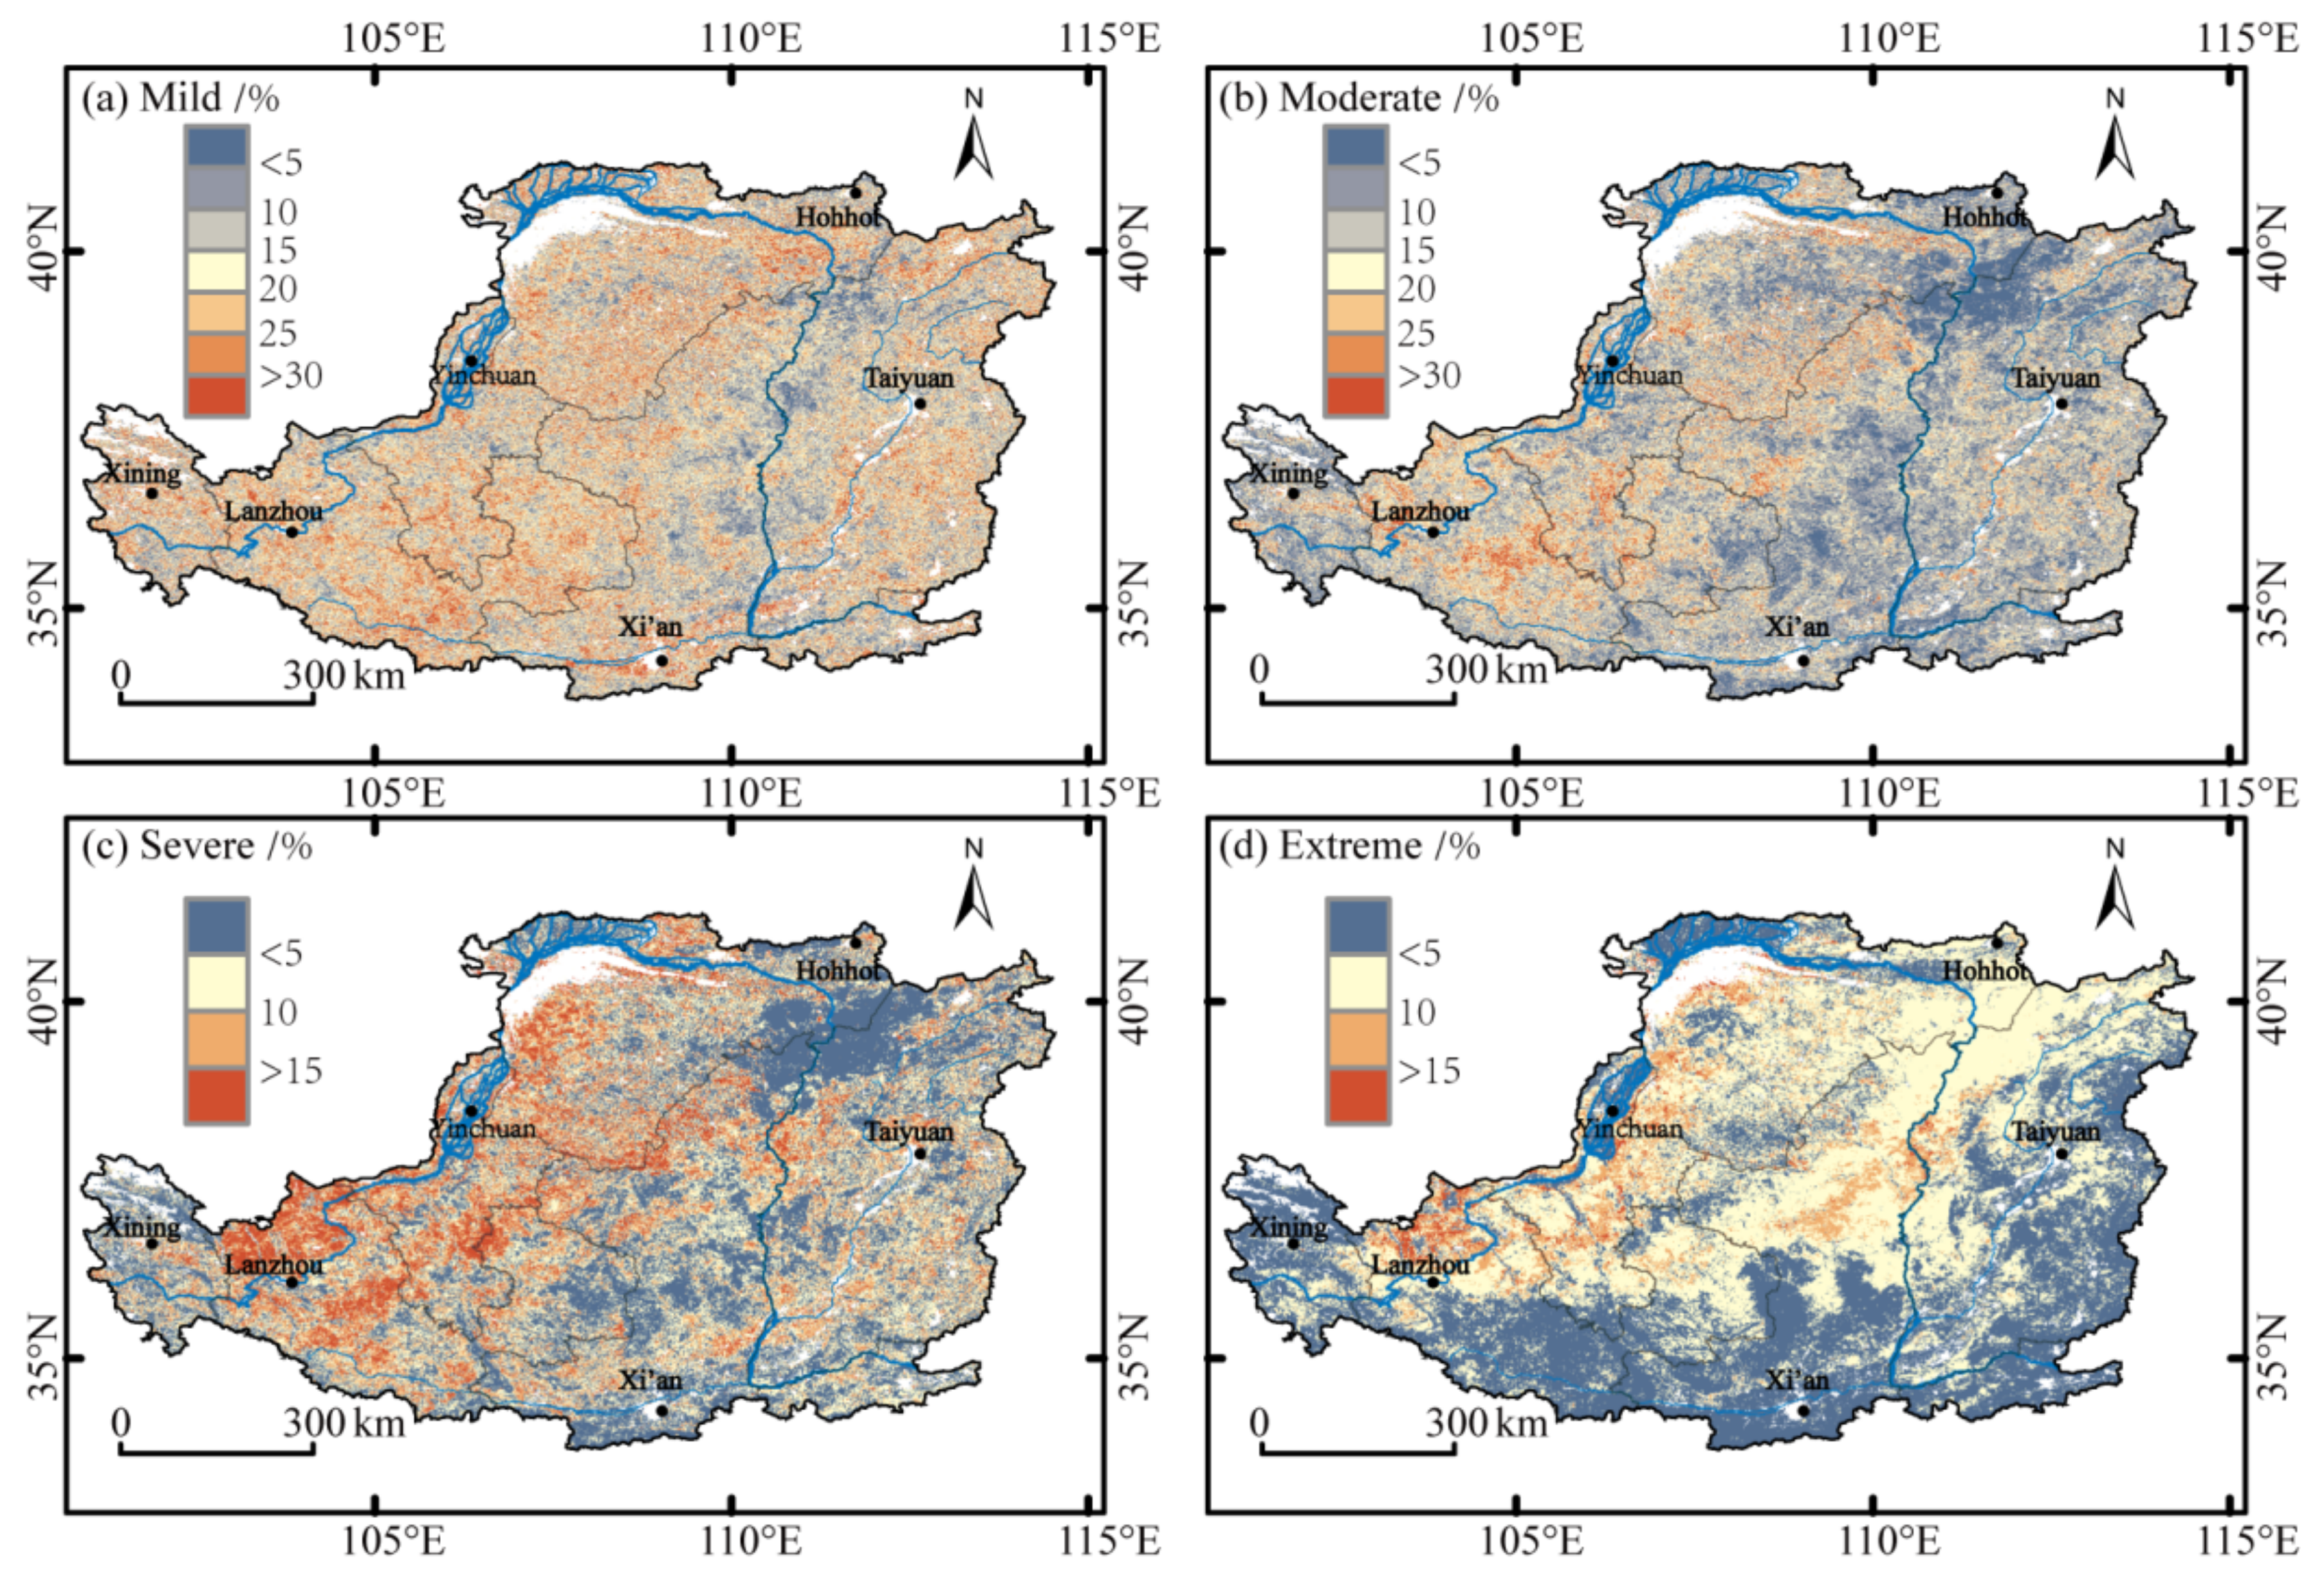
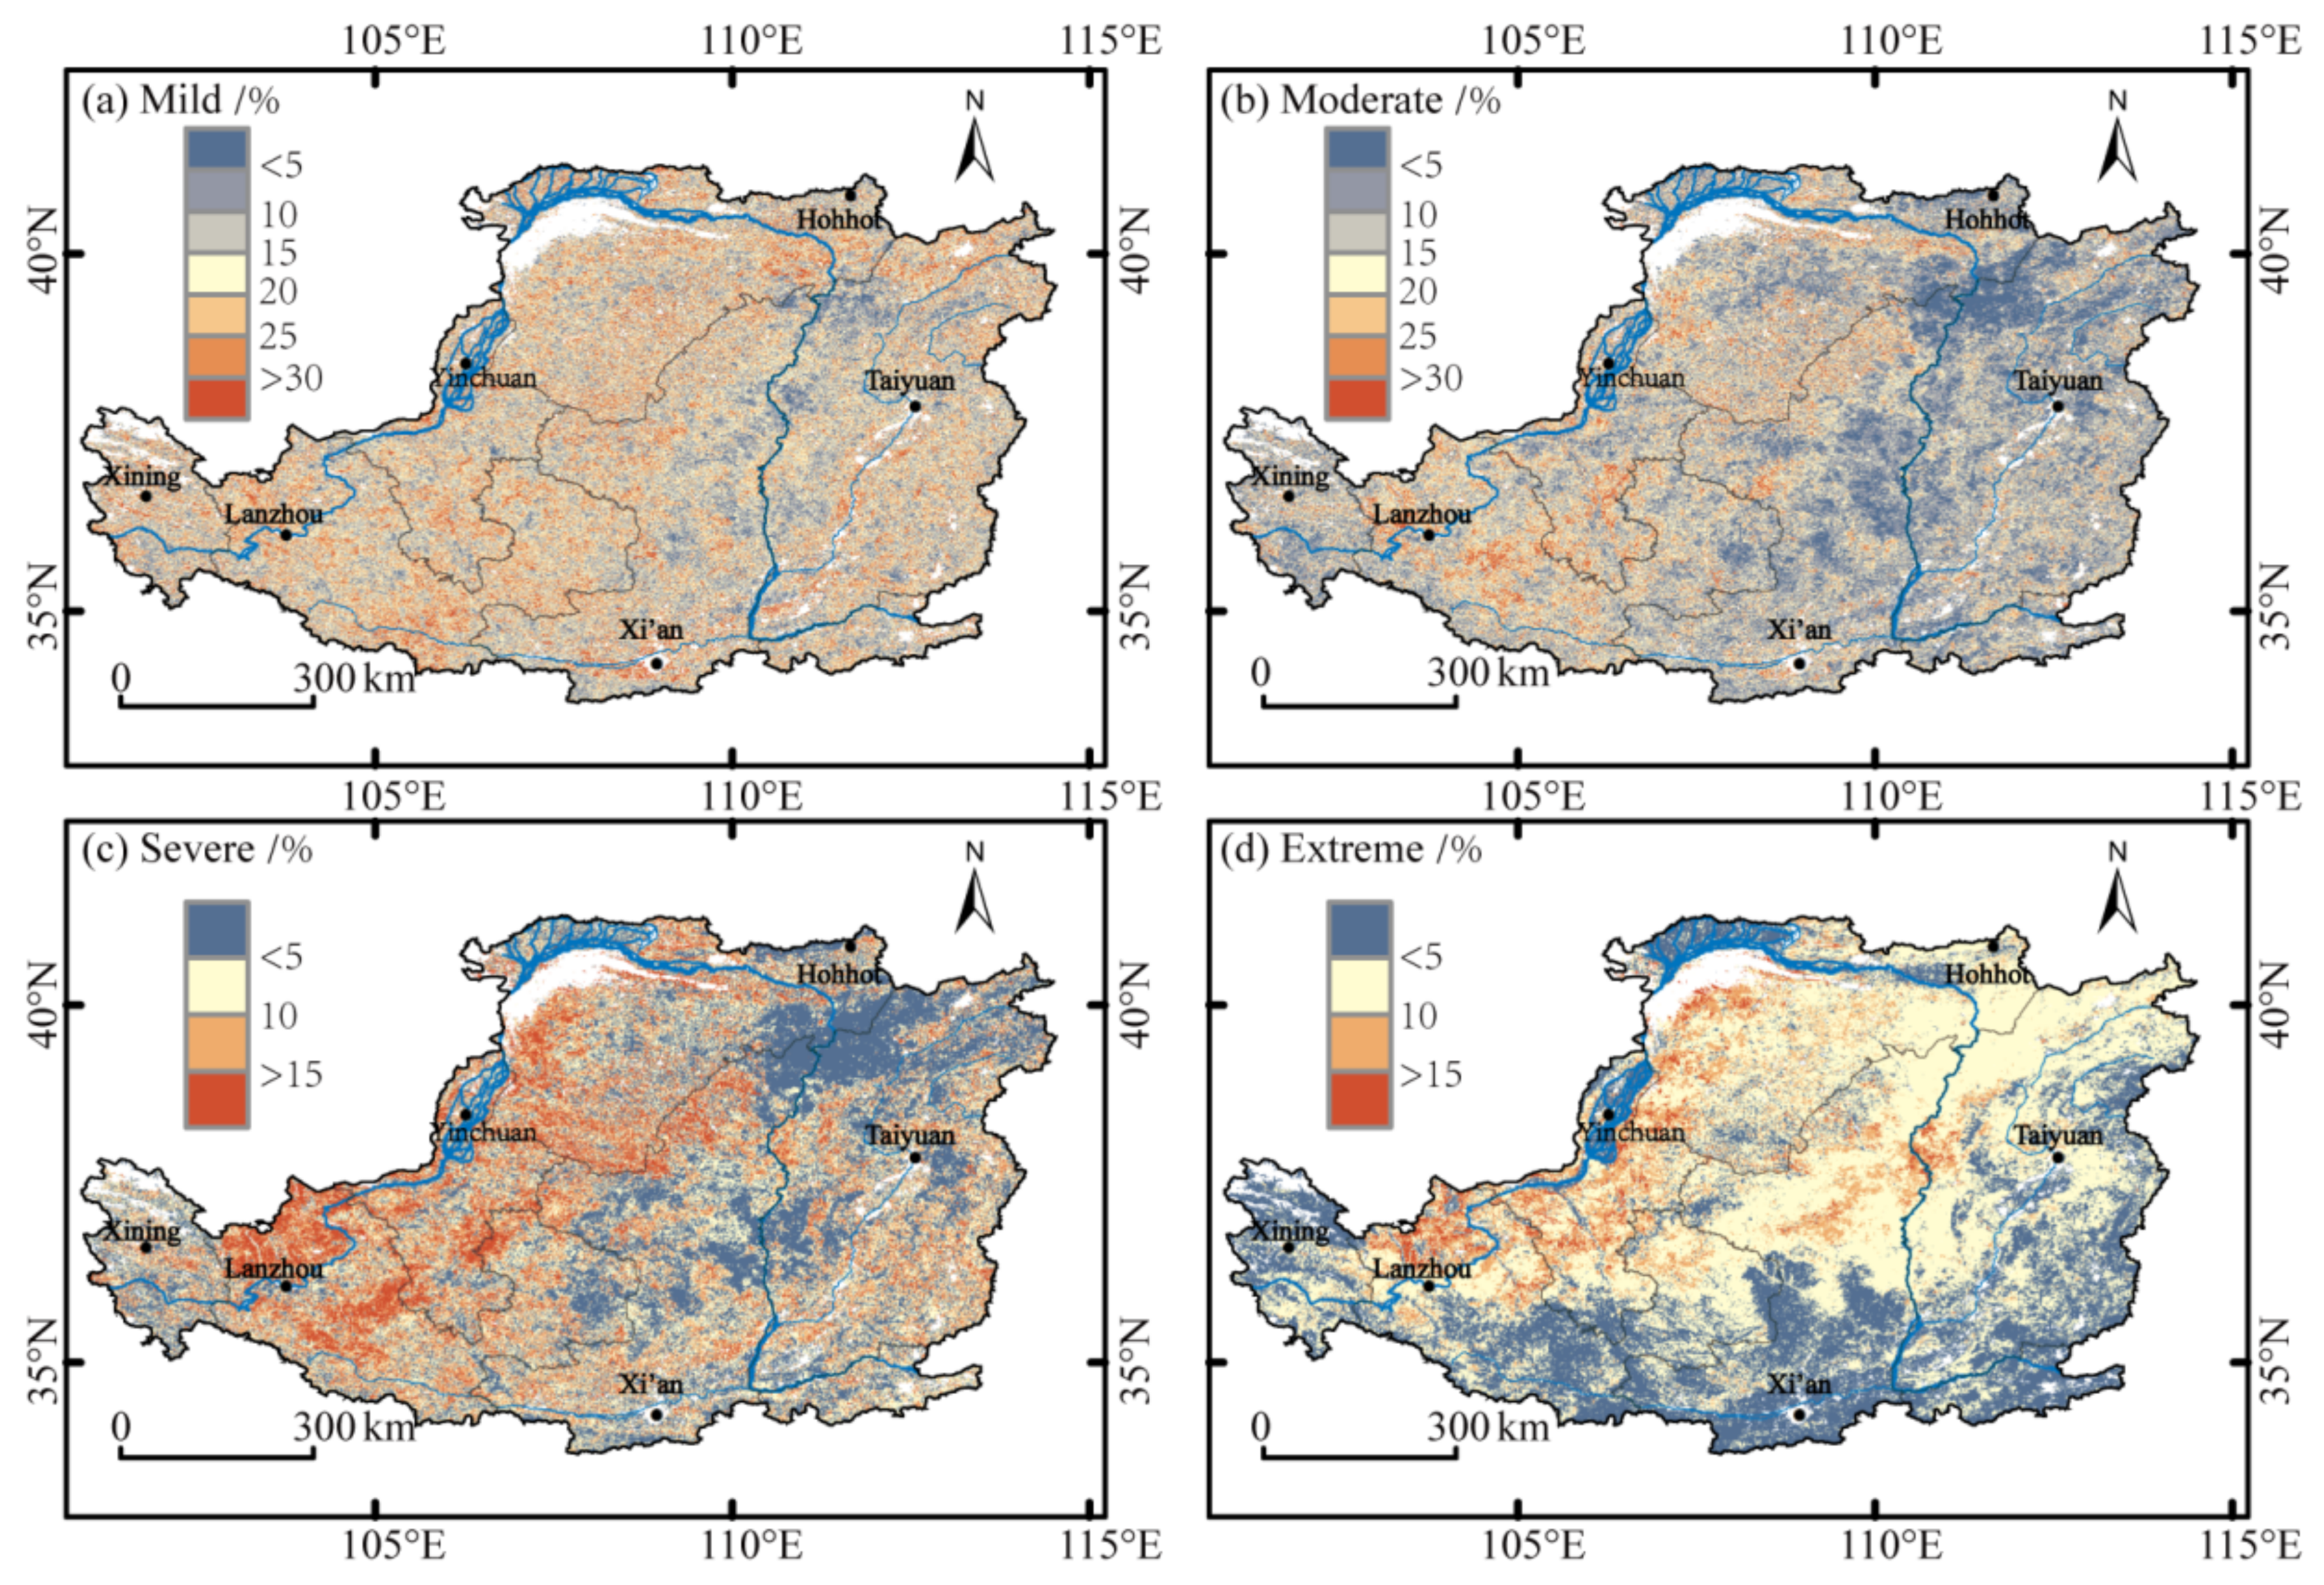
3.2. The Frequency Distribution of Droughts at Various Levels
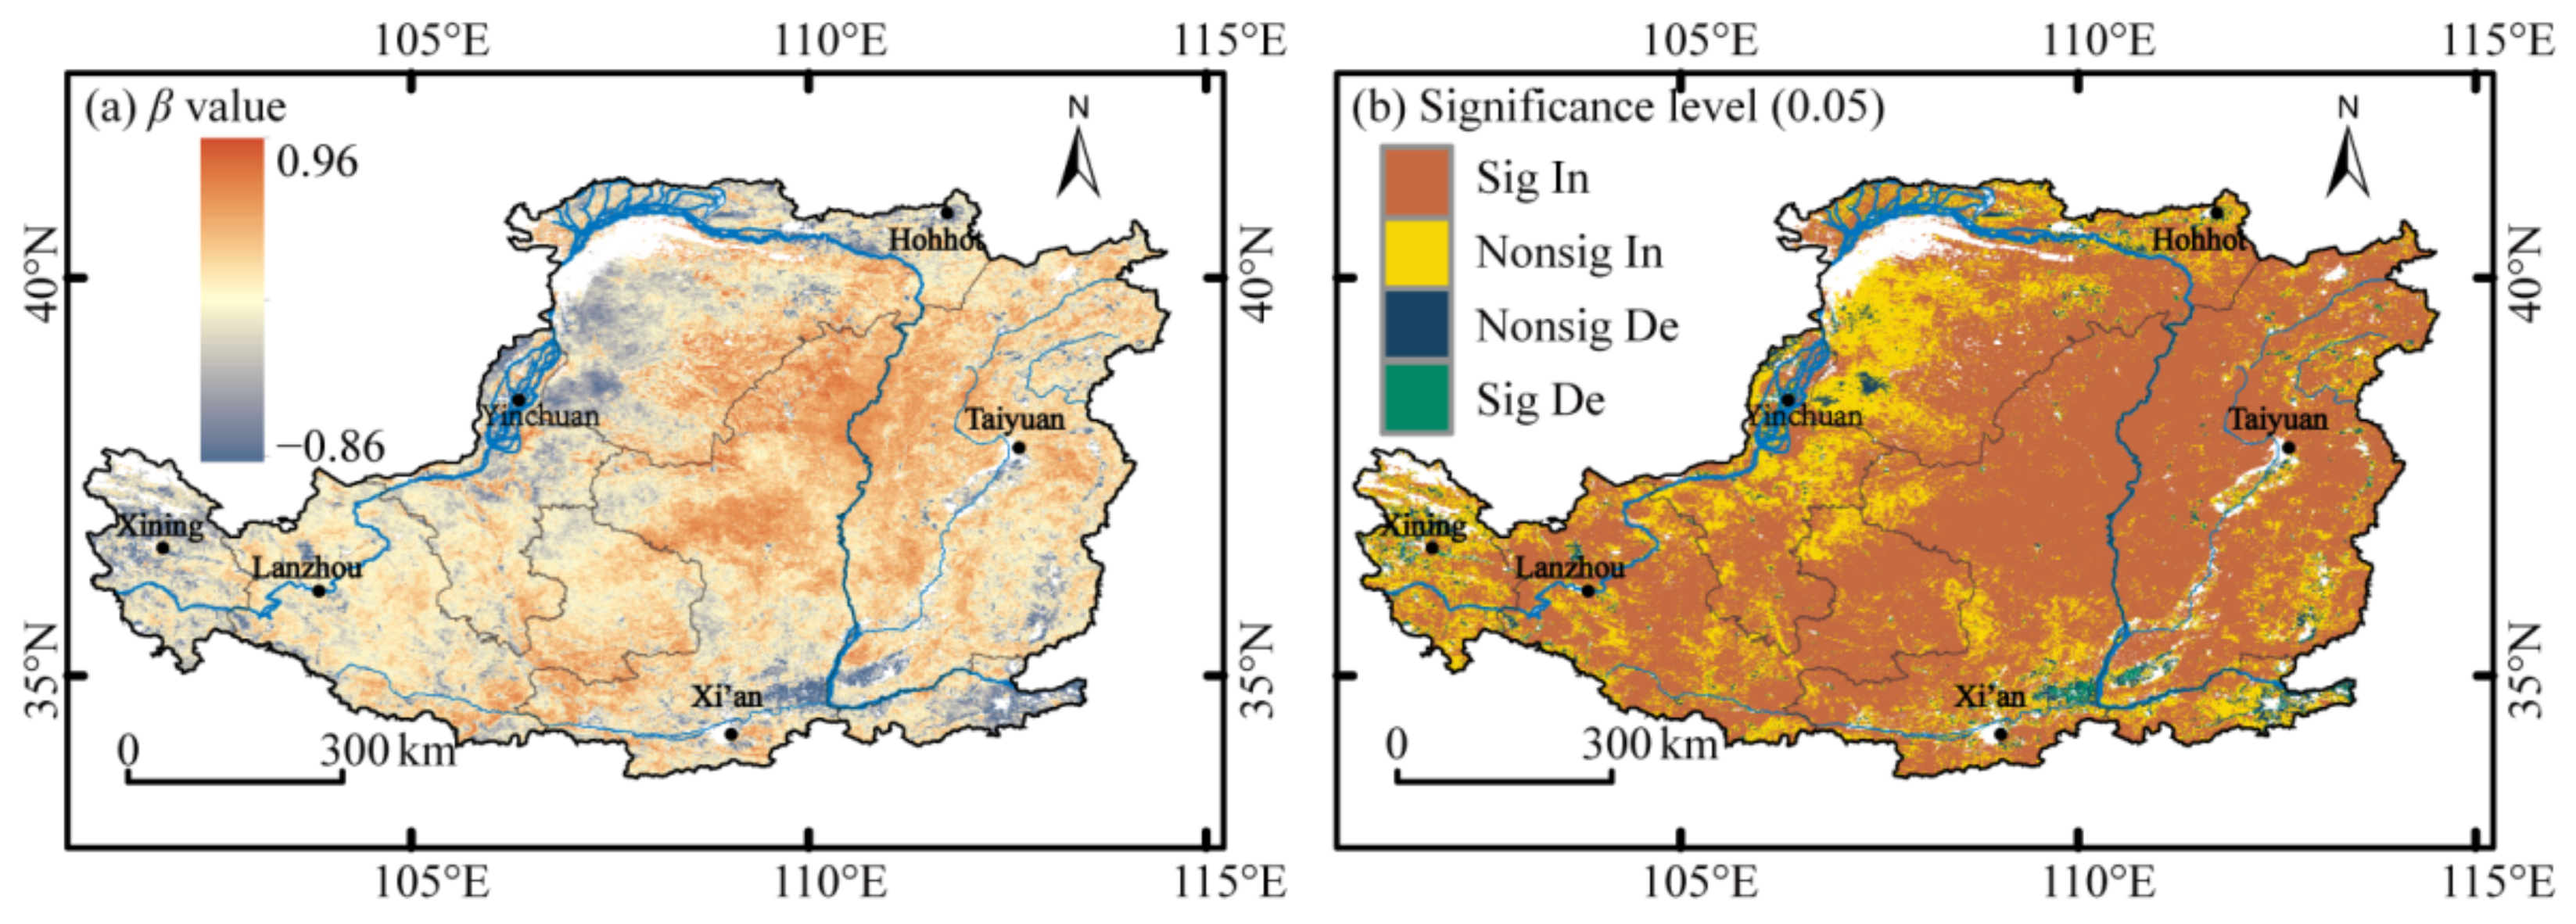
According to Table 1 and Equation (3), the spatial distributions of drought frequency for the four grades (mild, moderate, severe, and extreme) were calculated (Figure 4). As shown in Figure 4a, except for Luliang Mountain, the spatial pattern of the mild drought occurrence frequency was relatively uniform across the LP, and the drought frequencies were mostly between 5% and 25%. In other words, mild droughts occurred 1 to 4 times in most areas of the LP during 2001–2019. Compared to mild drought, the spatial pattern of the moderate drought occurrence frequency was more obvious (Figure 4b). The frequency in the western LP was considerably higher than that in the eastern LP. In particular, the higher frequency was mainly distributed on the Ordos Plateau, while the lower frequency was concentrated along the Yellow River. The areas with moderate drought frequency below 10% (1 time) accounted for about 40.09% of the total pixels, and the areas with that between 10% and 25% (2 to 4 times) accounted for about 52.63%. The spatial pattern of the severe drought frequency was roughly the same as that of the moderate drought frequency (Figure 4c). The areas without severe drought were mainly located in the central-northern parts of the Shanxi Province and the central part of the Shaanxi Province, while the severe drought frequencies were above 10% in the Longzhong Plateau, the central-southern Ningxia Province, and the Ordos Plateau. For the extreme drought frequency, there was a clear southeast–northwest gradient across the entire study area (Figure 4d). An approximate 37.73% of the LP did not experience extreme drought. The areas without extreme drought were primarily located in the southern and eastern parts of the LP, the Hetao Plain, the Ningxia Plain, and the Wushaoling Mountains. The extreme drought frequencies were mostly 5–10% (1 to 2 times) in the northwest of the LP, which were mostly situated in the mid-east of the Northern Shaanxi Plateau, the west of the Ordos Plateau, the central-southern part of Ningxia Province, and the north of the Longzhong Plateau, accounting for 59.96% of the total pixels. In general, the overall drought frequencies were high in the LP, but most droughts were mild and moderate, and the severe and extreme drought frequencies were relatively low.

3.3. Drought Trends

Figure 5 showed the spatial pattern of vegetative drought trends, which was divided into four categories by Mann–Kendall (significant increase, non-significant increase, significant decrease and non-significant decrease). Overall, the WVCI increased significantly at a rate of 0.42 a−1, which passed the significance test of α = 0.05. It means that the drought conditions generally tend to ease. However, there were obvious spatial differences in the trend variations in WVCI. The WVCI values in most areas of the LP showed an increasing trend, increasing in 95.18% of the total pixels and significantly increasing in 68.99% of the pixels. The areas with rapidly increasing WVCI values were mainly concentrated in the Luliang Mountain, the northern Shaanxi Plateau, the eastern Ordos Plateau, and the Liupan Mountain, with an average increase rate of more than 0.6 a−1. The regions with reduced WVCI value, accounting for approximately 4.82% of the total pixels, were primarily concentrated in the Hetao Plain, the west of Maowusu sandy land, the Ningxia Plain, the Wushaoling Mountain, the Fenwei Plain, and the surrounding areas of Zhengzhou city, where only 0.85% arrived at α = 0.05 significance level. It is worth mentioning that most regions with reduced WVCI values are the main grain-producing areas, and the increased drought risk will inevitably have a certain impact on the grain yield in these regions.

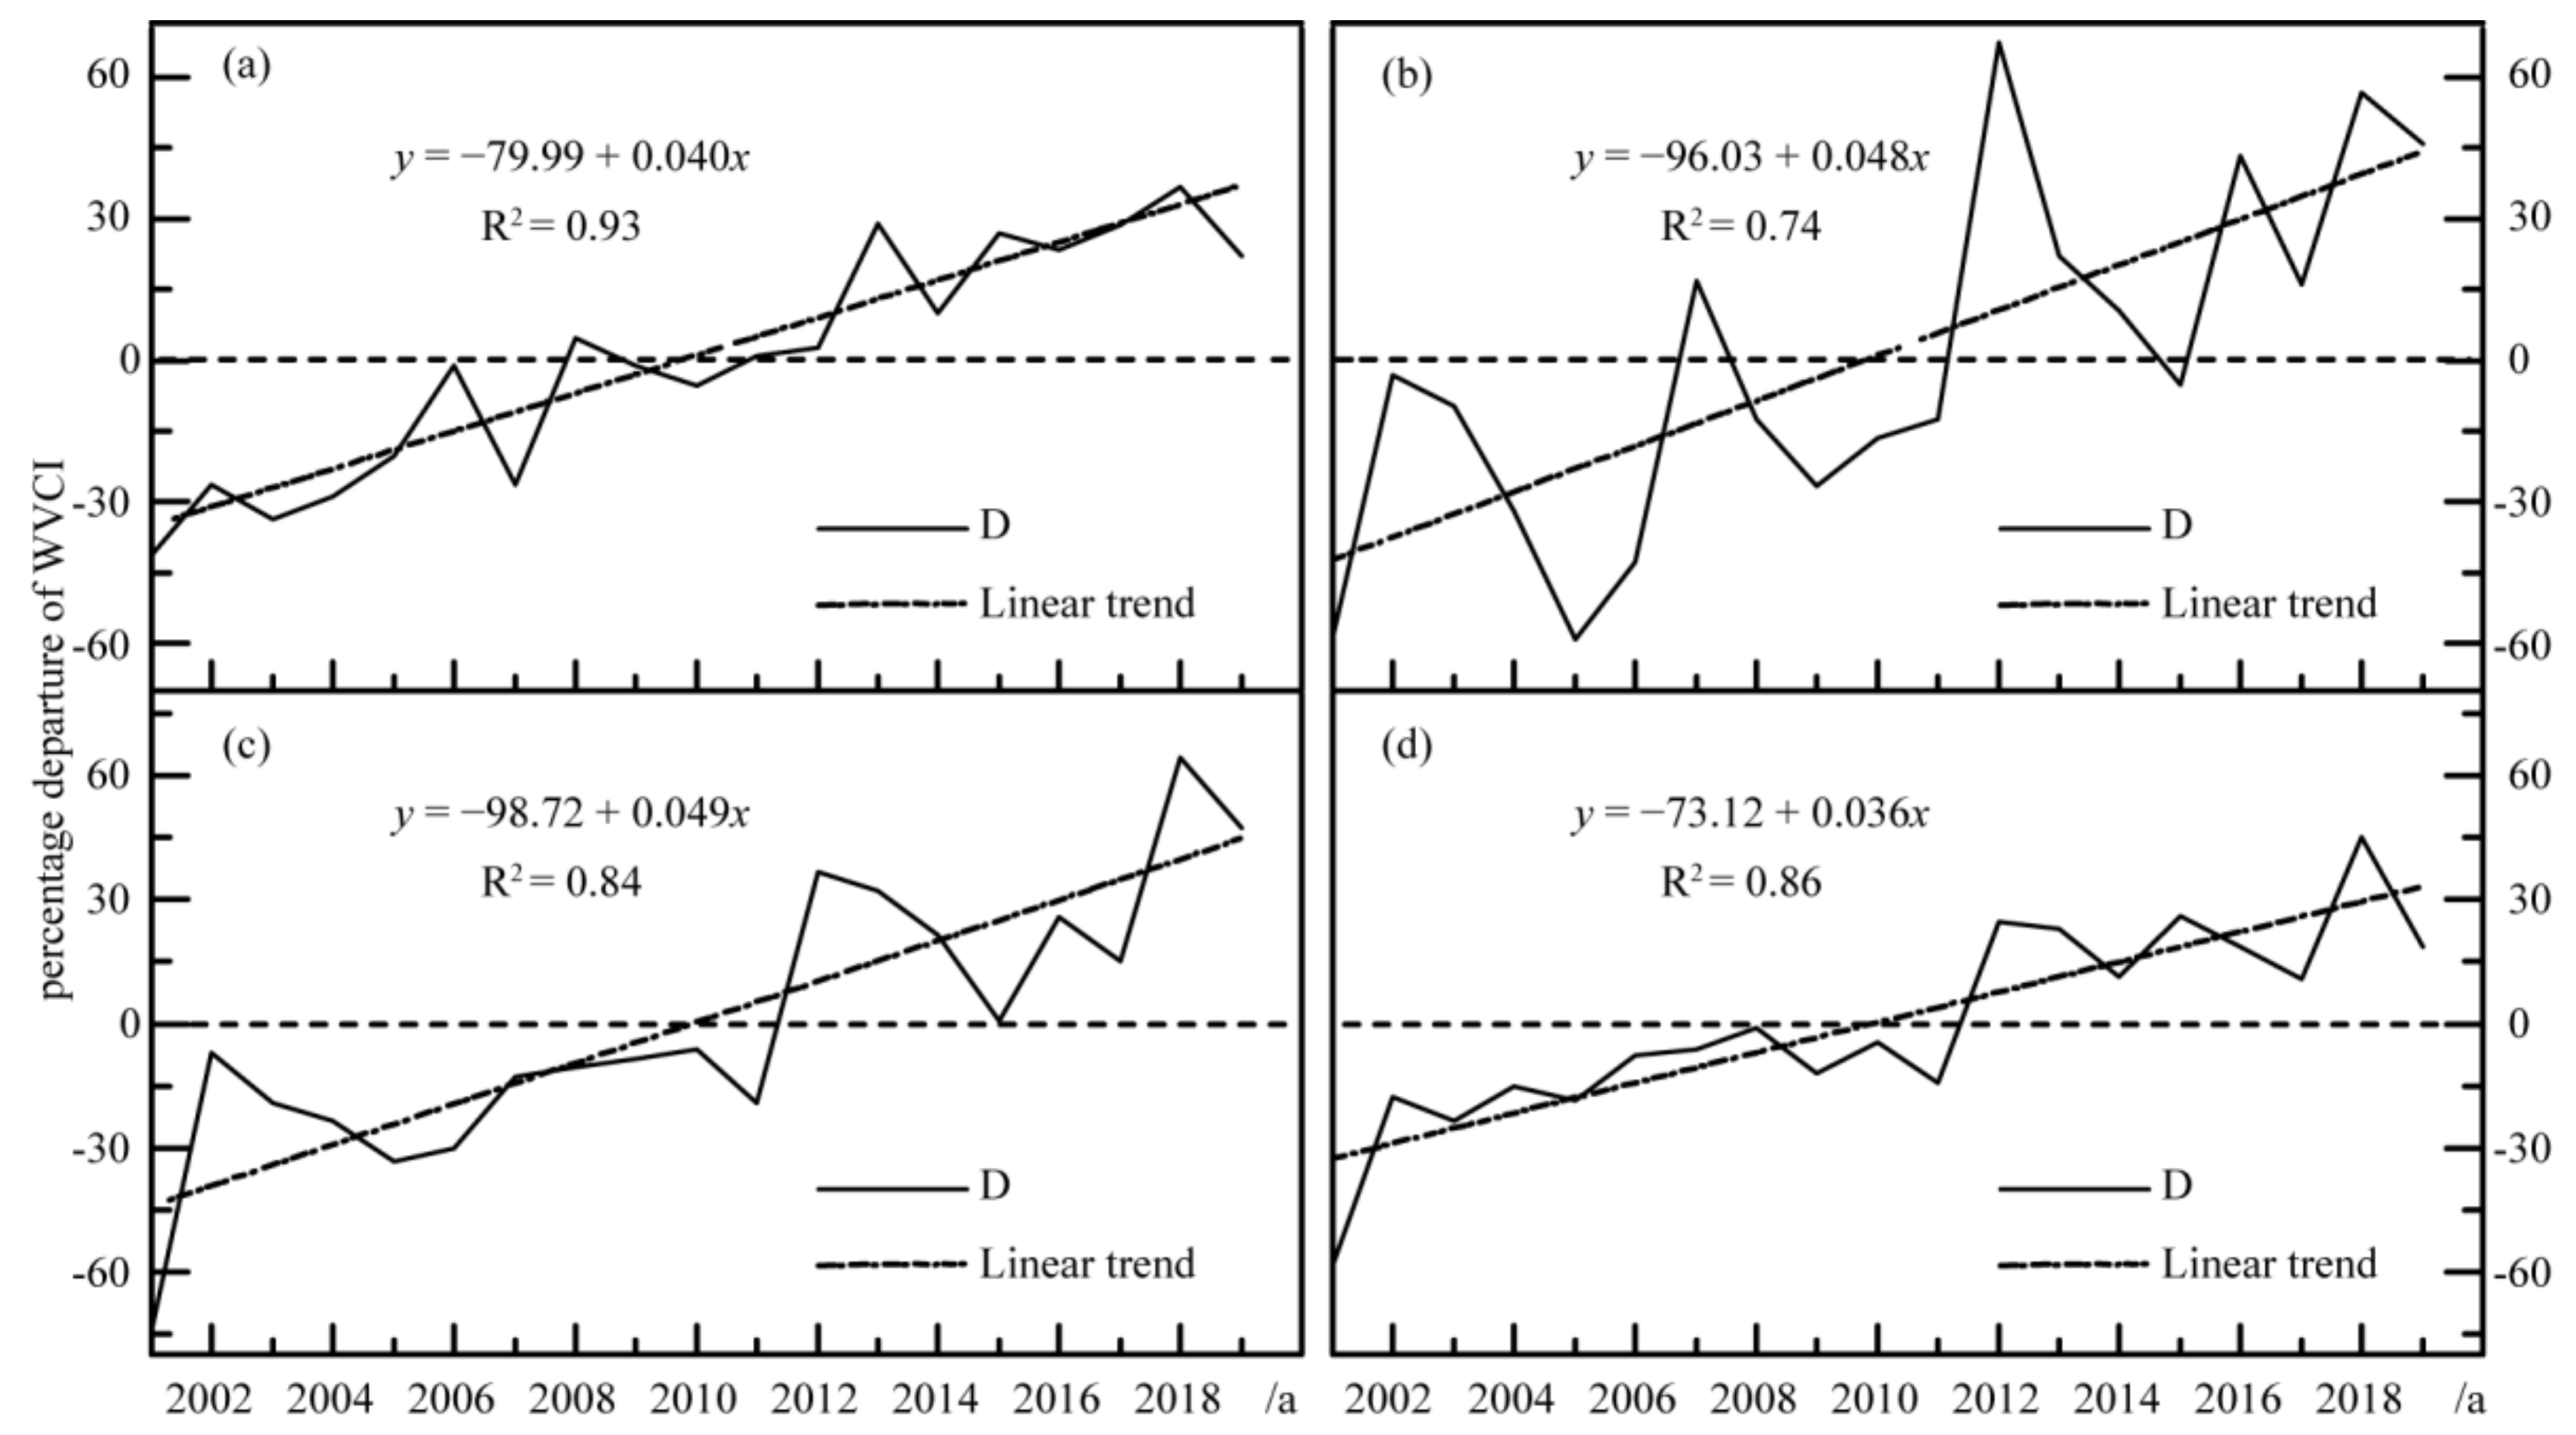
3.4. Temporal Variations in the WVCI

Trend analysis only reflects changes in long-term series, and cannot reflect the specific vegetation growth conditions of each pixel in a specific year. In order to further analyze the changes in the WVCI, we drew the spatial patterns of D value from 2001 to 2019 and the temporal variations in D value for various vegetation types according to Equation (5). In 2001, the LP suffered from severe droughts in spring and summer [61]. The D value in most areas of the LP was less than 0 (Figure 6a), and the vegetation conditions were worse than average. It can also be observed from Figure 7 that the D values were the minimum in 2001 for various vegetation types. Since the Grain for Green Project started in 1999, the afforestation area increased rapidly, especially from 2001 to 2002 [62]. Therefore, the amplitude of the D value increased obviously on a broader area in 2002 (Figure 6b and Figure 7). From 2003 to 2004, the D values along the Yellow River were increasing (Figure 6c,d). In 2005, the LP suffered from another severe drought in spring and summer [61]. The soil moisture in the northwestern LP and the northern Shaanxi Plateau was relatively deficient, making it difficult to maintain normal vegetation growth (Figure 6e). With the emergency of the ecological effect of the Grain for Green Project, the vegetation conditions in mountainous areas of the LP had been gradually improving (as shown in Figure 6f–h), mainly including the Qinling Mountains, Luliang Mountains, and Taihang Mountains. From 2009 to 2010, the vegetation conditions in the central part of the LP, especially in Yan’an and Yulin where ecological projects were implemented, were becoming evidently better. In the summer of 2011, a severe drought occurred in the LP [61]. As a result, the drought in the Ordos Plateau and the Longzhong Plateau worsened, and the vegetation growth conditions deteriorated. After 2012, the WVCI values in most areas of the LP were greater than the mean value (Figure 6i–s), meaning that the vegetation conditions were above-average. In conclusion, the range of D values greater than 0 increased gradually in the LP from 2001 to 2019, especially after 2012, and the D values of the four vegetation types all showed a fluctuating upward trend, which indicated that the vegetation conditions had been gradually improved and the vegetative droughts had been gradually alleviated. The results also verified the conclusions in Section 3.3. from another aspect.

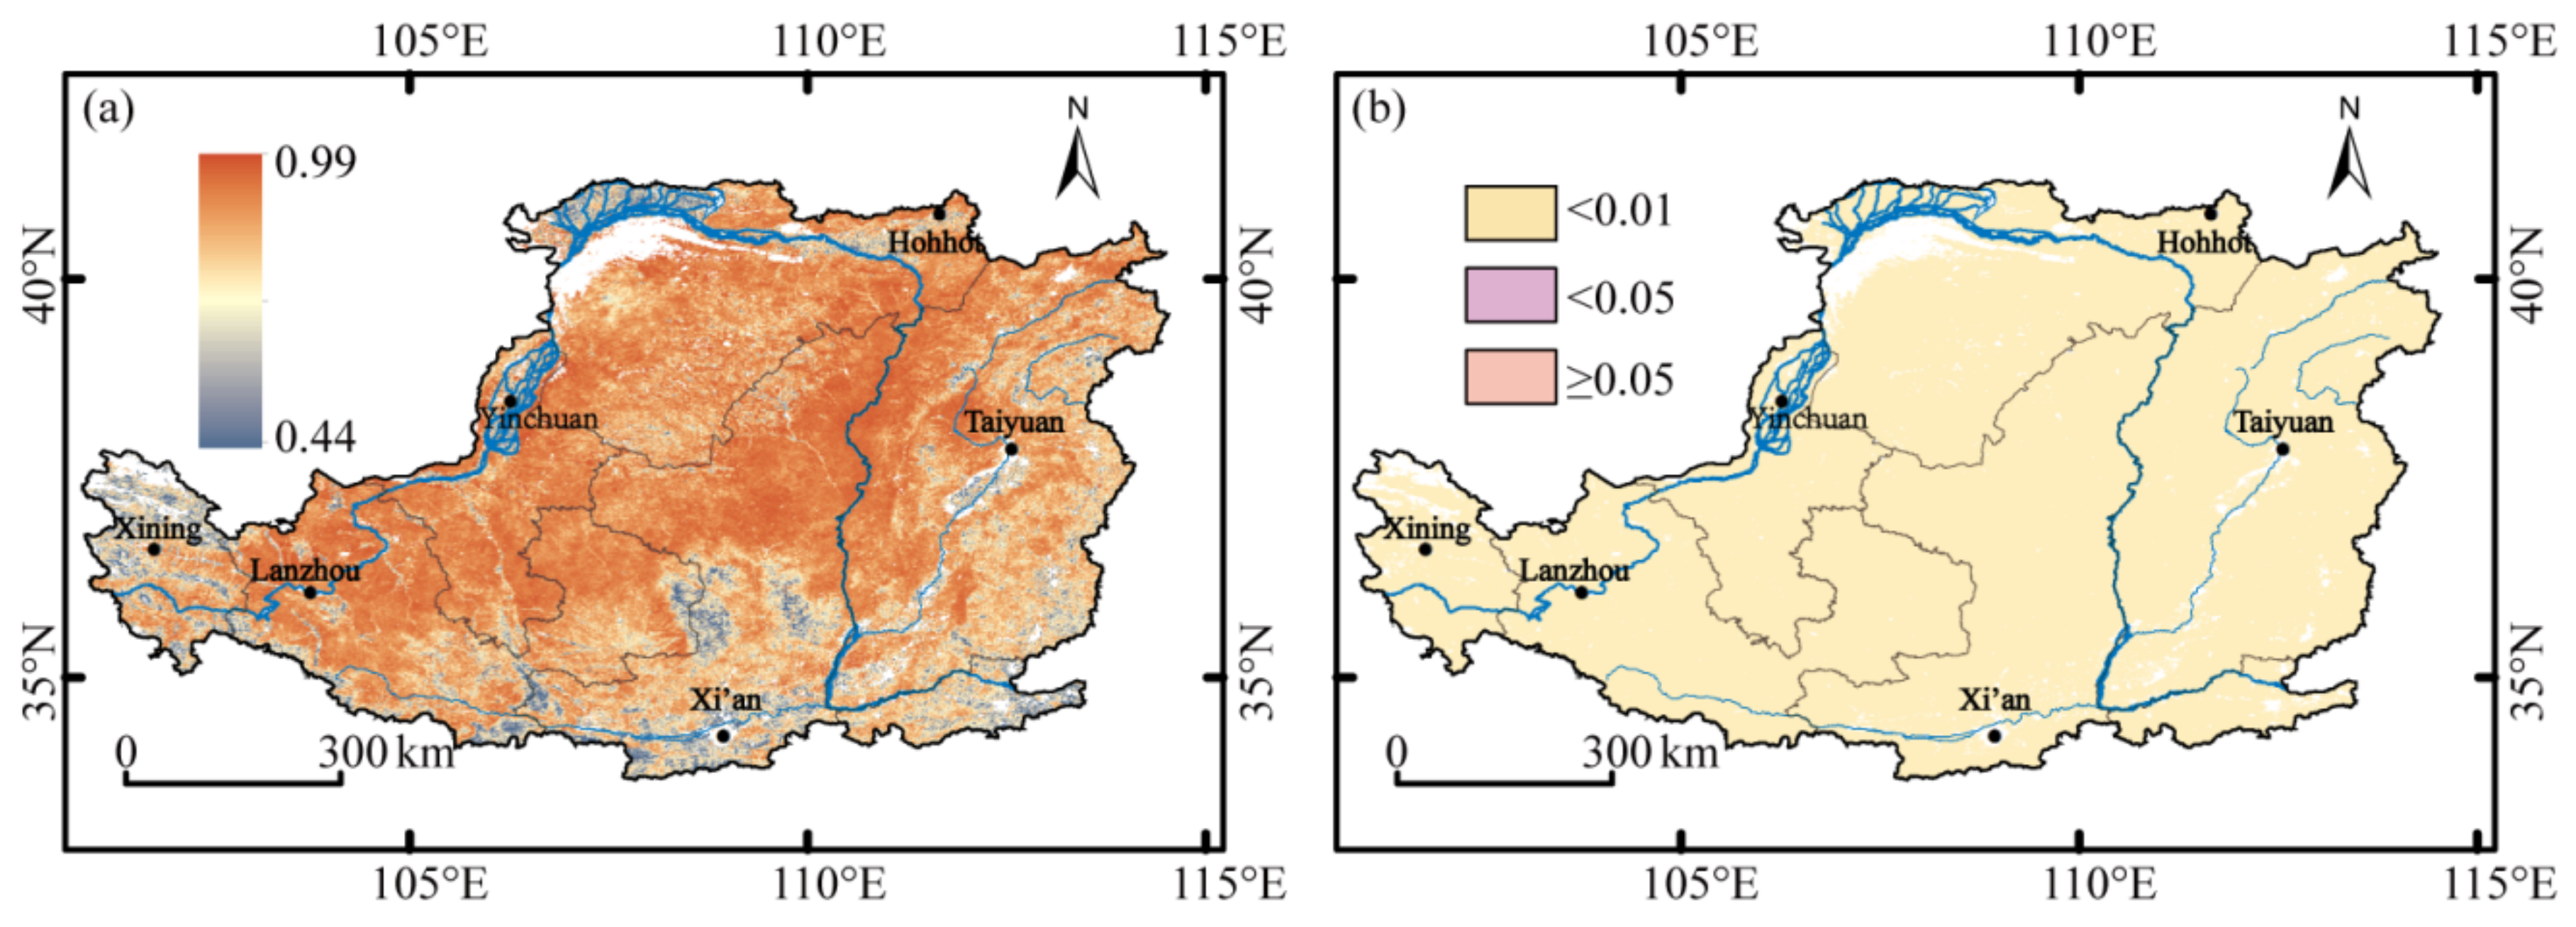
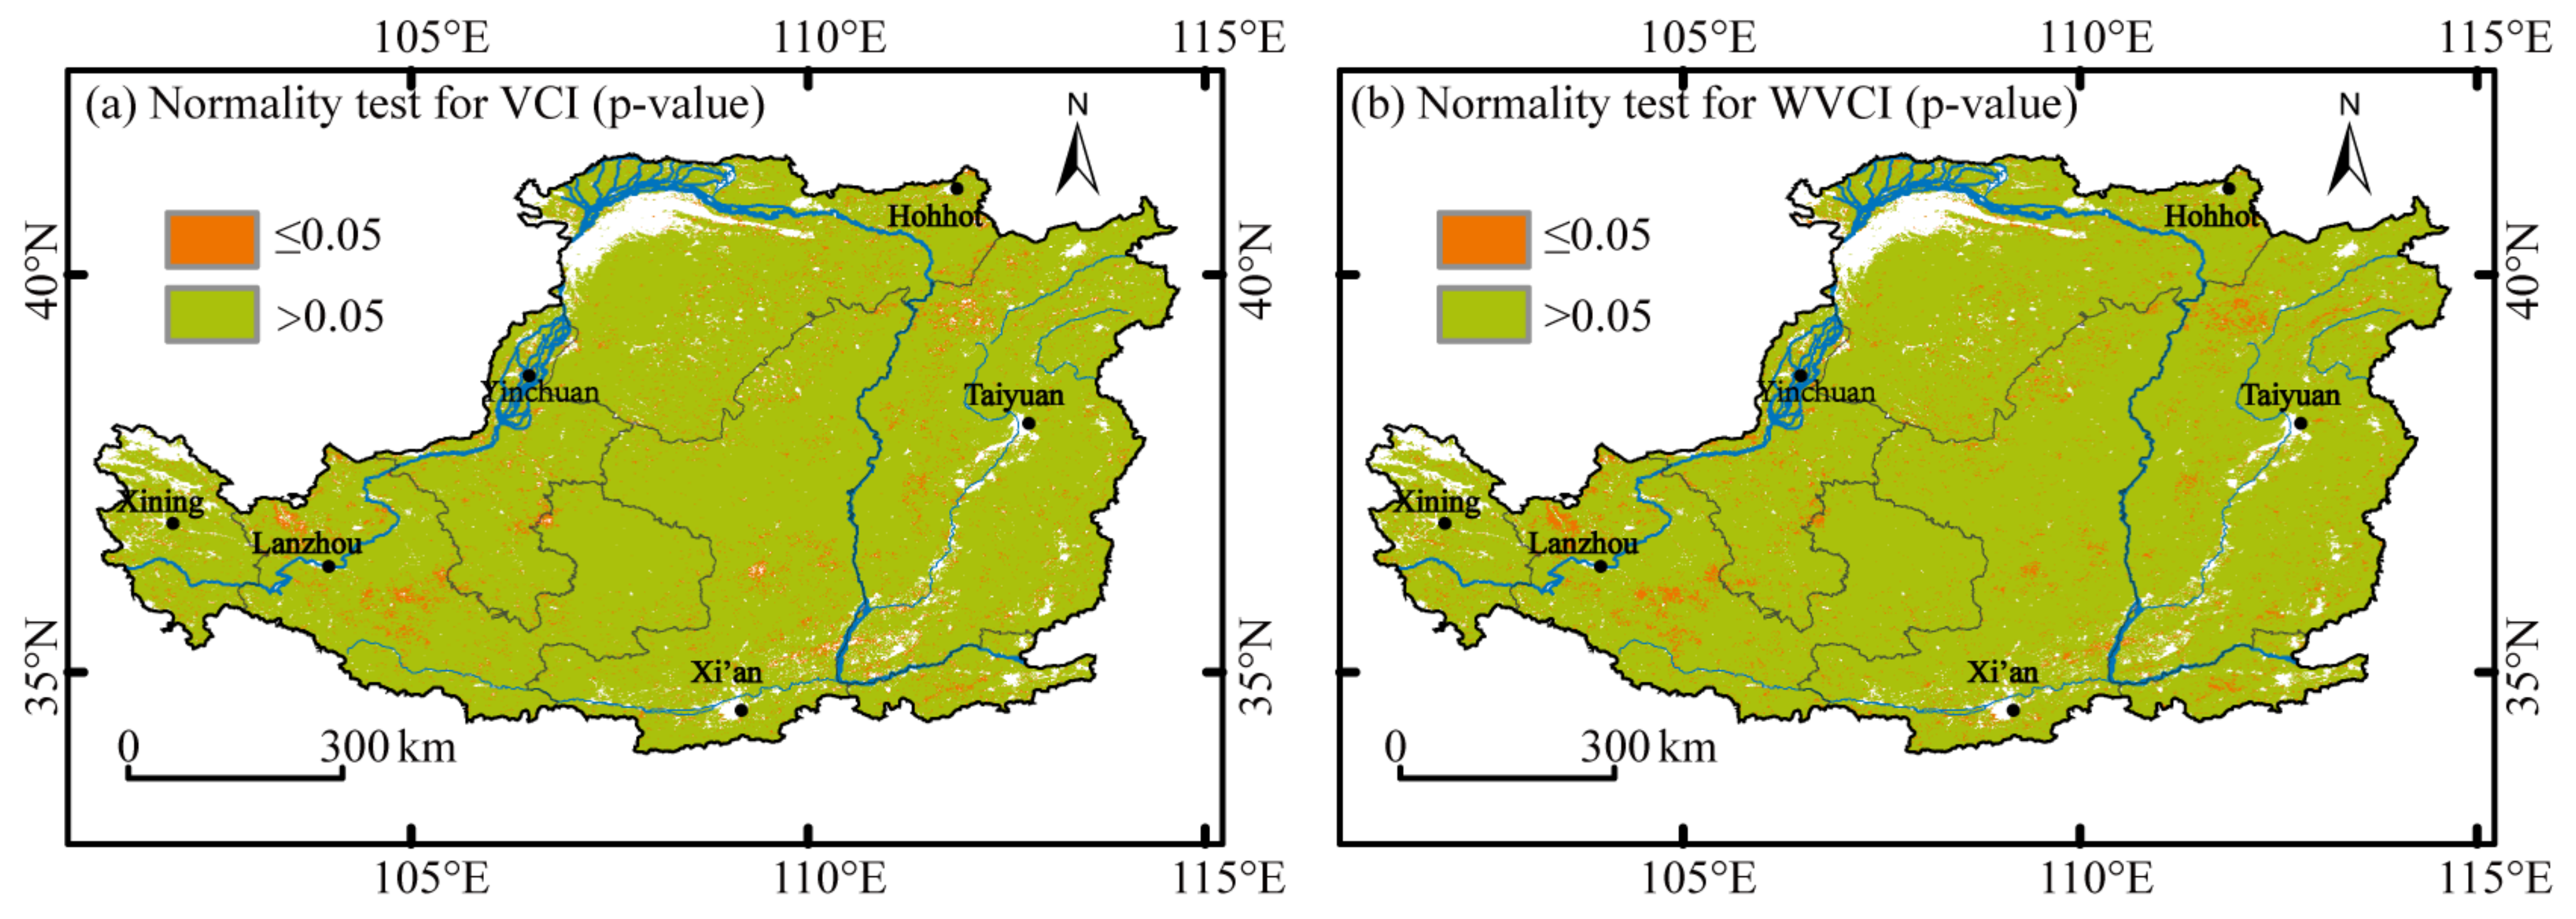
3.5. Relationship between WVCI and VCI

The VCI has been extensively used for vegetative drought monitoring in various regions around the world [15,16,17,18,19]. Therefore, correlations between WVCI and VCI were calculated to assess the effectiveness of WVCI in drought monitoring [63]. The results of the Shapiro–Wilk test for VCI and WVCI revealed that approximately 95.01% of the VCI values and about 94.61% of the WVCI values did not show evidence of non-normality (see Figure A2). Based on this outcome, the Pearson correlation coefficients between VCI and WVCI could be considered to be statistically meaningful. The correlation coefficients and the p-value between the WVCI and the VCI for the growing periods from 2001 to 2019 were illustrated in Figure 8. As observed in Figure 8a, all the correlation coefficients between WVCI and VCI were positive, with the lowest value being 0.44 and the spatially averaged correlation coefficient was 0.96. A p-value of less than 0.05 accounted for 1,028,114 pixels (1,028,118 pixels in total), of which 1,028,102 pixels were less than 0.01 and only 4 pixels were greater than 0.05 (Figure 8b). In addition, the correlation coefficients for various vegetation types between WVCI and VCI have also been calculated during the growing seasons from 2001 to 2019 (Table 2). It can be observed that the higher correlations corresponded to shrub and grassland, while the relatively weaker were observed for forest and farmland. According to Figure 1b and Figure 8a, we can also obtain the same results. The mean correlation coefficients for various vegetation types between WVCI and VCI were all significant at the 0.01 level. It means that the WVCI is strongly correlated with the VCI overall. Thus, it can be concluded that the phenology-based WVCI has the ability to effectively monitor and assess the vegetative drought across the LP.

4. Discussion

4.1. Comparison of Research Results Based on the WVCI and Other Drought Indices

The evaluation of long-term drought in the vegetation growing season can serve as a guide for formulating and implementing early warning and drought resistance strategies for vegetative drought. Taking WVCI as the drought indicator in this research, we investigated the temporal and spatial variations in drought in the vegetation growing season across the LP from the aspects of drought frequency, trend and relative deviation. The results showed that droughts occurred frequently in the LP, but mainly mild and moderate droughts. Drought frequency reduced as one moved from southeast to northwest, and the droughts tended to ease on the whole. The findings were mostly congruent with the conclusions drawn from the VCI [11] and PDSI [64] analyses of the temporal and spatial evolution of drought in the LP, but differed from those drawn from SPI [33] and SPEI [34,65] studies. This might be because the SPI/SPEI only measures the meteorological drought, but the VCI/WVCI reflects the comprehensive impacts of meteorological drought on vegetation, including precipitation, temperature, evaporation, vegetation type, and so on. The PDSI is similar to the VCI in that it takes temperature, humidity, evaporation and recharge rate into account [55]. As a result, VCI/WVCI can more accurately reflect the real impacts of drought on vegetation than SPI/SPEI. Comparing Figure 4 with Figure 9, we found that the drought frequencies of various grades calculated based on VCI were consistent with the results based on WVCI in spatial distribution, but the range of severe drought and extreme drought monitored based on VCI was slightly smaller than that based on WVCI. As observed from the mean values of drought frequency, there were minor differences between the mean drought frequencies of mild drought and moderate drought based on VCI/WVCI, which were 15.71%/15.12% and 10.61%/10.97%, respectively. The mean drought frequency differences of severe drought and extreme drought were slightly larger, which were 5.52%/6.37% and 3.22%/4.07%, respectively. Therefore, the ability of WVCI may be better than VCI in detecting severe drought and extreme drought.

4.2. Vegetation Growth Conditions

Climatic factors, such as drought, precipitation and temperature, are the main driving forces affecting vegetation change in the LP [61,66]. The dynamic evolution of vegetation conditions in the growth season was consistent with the incidence of drought in the LP [61]. The spatial distribution of vegetation conditions varied over time (Figure 6). The average value of WVCI in 2001–2011 was lower than that in normal years, especially in the years 2001, 2005 and 2011 (Figure 7). The reason might be that the LP suffered from severe spring and summer droughts in 2001 and 2005, and a strong summer drought in 2011 [61]. In addition, the Grain of Green Project also had an important impact on the dynamic change in vegetation. Sun et al. [67] showed that the afforestation area in the LP increased from 3 × 10⁴ km2 in 1999 to 5.9 × 10⁴ km2 in 2006, and the NDVI indicated a general rising trend, particularly in Yan’an and Yulinin of the northern Shaanxi province. Zhao et al. [61] found that the vegetation coverage and the cumulative afforestation area in the LP had a substantial association. Thus, the Grain of Green Project, which began in 1999, may be regarded as playing a significant role in the rise in WVCI during the vegetation growing season from 2001 to 2019.

4.3. Factors Affecting WVCI Performance

The phenological metrics (SOS, POS and EOS) were used to divide the growth stages of vegetation, so as to generate WVCI by linearly combining the mean values of VCI at different growth stages. In this work, the dynamic thresholds of SOS and EOS in the LP were set to 20% and 80% of the EVI amplitude, respectively. The reliability of the thresholds has been verified by some scholars [43,68] and phenological data recorded by ground stations [68]. However, due to inconsistent data sources and time periods, the multi-year average SOS and EOS values obtained by various scholars showed some differences in space. The spatial patterns of the multi-year average SOS and EOS in this study were consistent with the results of most scholars [43,68,69,70], but EOS was slightly different from their results in the size of the value. Studies by many scholars [51,71,72] have shown that the SOS of vegetation in the LP tends to advance, EOS tends to delay, and the growing season becomes longer. As a result, the differences and variations in phenological parameters may lead to the deviations in WVCI to a certain extent.
In this research, the seasonality parameter, which determines the number of growth seasons in one year, was set to 1 in the software TimeSat 3.3. A value 1 of the parameters will force the program to treat all data as if there is one season per year [73]. In other words, when we used TimeSat 3.3 to discriminate the SOS and the EOS, we did not separately consider the impact of summer harvest on EVI, so that both natural vegetation and agricultural vegetation were considered to have one growing season per year. However, double growing seasons occur in many parts of the world, including the parts of the southeastern Loess Plateau. For example, there is a winter-wheat and summer maize rotation planting structure in Guanzhong Plain and Fenhe Valley, so the EVI values will have double peaks within a year. The areas where the SOS of vegetation is earlier than the 90th DOY pointed out in our study are likewise mostly located in these two regions (Figure 3a). This is because winter-wheat starts to turn green from the end of February to the beginning of March. However, the EOS of vegetation in these two areas is determined by the maturity date of summer maize. This implies that the WVCI is only suitable for a single crop when it is used to assess the drought of agricultural vegetation.

5. Conclusions

The phenology-based WVCI is derived from the well-established VCI, which is a worldwide drought index; therefore, WVCI can also be used for drought monitoring and assessment globally. A similar approach has also been used by Graw et al. [4] to classify drought severity on vegetation production annually in the Eastern Cape Province of South Africa between 2000 and 2017. However, due to its inherent property of WVCI calculation, it is only suitable for annual drought analysis on vegetation.
This study attempted to reveal the spatial and temporal variations in vegetative droughts over the LP using the WVCI from the aspects of drought frequency, trend and relative deviation, and assess the drought monitoring performance of the WVCI by comparing the estimates with VCI. The major findings included the following: (1) the LP experienced frequent droughts during the study period, but mainly mild and moderate droughts. The drought frequencies decreased from southeast to northwest, and extreme droughts rarely occurred in mountainous areas and plains. (2) The droughts in most areas of the LP tended to ease, and only a few areas in the Hetao Plain, Ningxia Plain and Fenwei Plain showed an increasing trend of drought. (3) After 2012, the vegetation conditions in most parts of the LP were better than average. (4) Compared with VCI, the WVCI proved to have the ability to monitor and assess vegetative drought in the LP. The findings may aid water resource managers in improving the accuracy of large-scale regional drought assessments and making drought relief policies to reduce the influence of drought in the study area.
In addition, a mandatory prerequisite for WVCI should be noted. We did not account for the influence of farming systems when extracting phenological parameters in the current study. Thus, both natural vegetation and agricultural vegetation are considered to have one growing season per year. Consequently, if WVCI is used to evaluate the drought of various vegetation at the same time, this index is only appropriate for the single crop areas in the middle and high latitudes. If not, partition processing is recommended. In the following steps, we will focus on the application of WVCI in agricultural vegetation, taking into consideration the effect of farming systems, as well as the adjustment of weights for various vegetation growth stages, so as to further verify the applicability and reliability of WVCI around the world.

Author Contributions

Conceptualization, M.L. and G.W.; methodology, M.L.; software, C.G.; validation, M.L. and S.Z.; formal analysis, S.Z.; investigation, M.L.; resources, C.G.; data curation, C.G.; writing—original draft preparation, M.L.; writing—review and editing, S.Z.; visualization, C.G.; supervision, G.W.; project administration, G.W.; funding acquisition, M.L. All authors have read and agreed to the published version of the manuscript.

Funding

This research was funded by the Basic Research Project of Shanxi Province, grant number 20210302123326.

Data Availability Statement

The MODIS/EVI data sets and MODIS land-use cover data are derived from the online data pool at the NASA EOSDIS Land Processes Distributed Active Archive Center (LP DAAC), USGS/Earth Resources Observation and Science (EROS) Center, Sioux Falls, South Dakota (http://lpdaacsvc.cr.usgs.gov/appeears/, accessed on 4 December 2020). The Shuttle Radar Topography Mission (SRTM) dataset with 90 m spatial resolution was obtained from Loess Plateau SubCenter, National Earth System Science Data Center, National Science and Technology Infrastructure of China (http://loess.geodata.cn, accessed on 8 November 2020). The original datasets used in our study are all freely available to download and public use. The datasets generated during the current study are available from the corresponding author on reasonable request.

Acknowledgments

We wish to express our gratitude to the USGS for supplying MODIS data and the National Earth System Science Data Center of China for supplying SRTM data. We also gratefully acknowledge Jönsson and Eklundh for providing the Timesat software.

Conflicts of Interest

The authors declare no conflict of interest.

Appendix A

Figure A1. Overview of the workflow in this study.
Remotesensing 14 03043 g0a1
Figure A2. p-values of the Shapiro–Wilk test for normality of (a) VCI and (b) WVCI separately. If the p-value > 0.05, it denotes that the Shapiro–Wilk test does not show evidence of non-normality. Otherwise, the Shapiro–Wilk test indicates that the distribution of time series departs from normality.
Remotesensing 14 03043 g0a2

References

  1. Ding, Y.; Xu, J.; Wang, X.; Cai, H.; Zhou, Z.; Sun, Y.; Shi, H. Propagation of meteorological to hydrological drought for different climate regions in China. J. Environ. Manag. 2021, 283, 111980. [Google Scholar] [CrossRef] [PubMed]
  2. IPCC. AR6 Climate Change 2021: The Physical Science Basis; Cambridge University Press: Cambridge, UK, 2021. [Google Scholar]
  3. Han, L.; Zhang, Q.; Jia, J.; Wang, Y.; Huang, T. Drought severity, frequency, duration and regional differences in China. J. Des. Res. 2019, 39, 1–10. [Google Scholar] [CrossRef]
  4. Graw, V.; Ghazaryan, G.; Schreier, J.; Gonzalez, J.; Abdel-Hamid, A.; Walz, Y.; Dall, K.; Post, J.; Jordaan, A.; Dubovyk, O. Timing is everything–drought classification for risk assessment. IEEE J. Sel. Top. Appl. Earth Obs. Remote Sens. 2020, 13, 428–433. [Google Scholar] [CrossRef]
  5. Prudhomme, C.; Giuntoli, I.; Robinson, E.L.; Clark, D.B.; Arnell, N.W.; Dankers, R.; Fekete, B.M.; Franssen, W.; Gerten, D.; Gosling, S.N. Hydrological droughts in the 21st century, hotspots and uncertainties from a global multimodel ensemble experiment. Proc. Natl. Acad. Sci. USA 2014, 111, 3262–3267. [Google Scholar] [CrossRef] [Green Version]
  6. Spinoni, J.; Naumann, G.; Carrao, H.; Barbosa, P.; Vogt, J. World drought frequency, duration, and severity for 1951–2010. Int. J. Climatol. 2014, 34, 2792–2804. [Google Scholar] [CrossRef] [Green Version]
  7. Palmer, W.C. Meteorological Drought; U.S. Department of Commerce, Office of Climatology, U.S. Weather Bureau: Washington, DC, USA, 1965. [Google Scholar]
  8. McKee, T.B.; Doesken, N.J.; Kleist, J. The relationship of drought frequency and duration to time scales. In Proceedings of the 8th Conference on Applied Climatology, Anaheim, CA, USA, 17–22 January 1993; pp. 179–184. [Google Scholar]
  9. Vicente-Serrano, S.M.; Beguería, S.; López-Moreno, J.I. A multiscalar drought index sensitive to global warming: The standardized precipitation evapotranspiration index. J. Clim. 2010, 23, 1696–1718. [Google Scholar] [CrossRef] [Green Version]
  10. Jiao, W.; Zhang, L.; Chang, Q.; Fu, D.; Cen, Y.; Tong, Q. Evaluating an enhanced vegetation condition Index (VCI) based on VIUPD for drought monitoring in the Continental United States. Remote Sens. 2016, 8, 224. [Google Scholar] [CrossRef] [Green Version]
  11. Li, M.; Ge, C.; Deng, Y.; Wang, G.; Chai, X. Meteorological and agricultural drought characteristic and their relationship across the Loess Plateau. Sci. Geogr. Sin. 2020, 40, 2105–2114. [Google Scholar] [CrossRef]
  12. Tucker, C.J.; Choudhury, B.J. Satellite remote sensing of drought conditions. Remote Sens. Environ. 1987, 23, 243–251. [Google Scholar] [CrossRef]
  13. Kogan, F.N. Application of vegetation index and brightness temperature for drought detection. Adv. Space Res. 1995, 15, 91–100. [Google Scholar] [CrossRef]
  14. Sandholt, I.; Rasmussen, K.; Andersen, J. A simple interpretation of the surface temperature/vegetation index space for assessment of surface moisture status. Remote Sens. Environ. 2002, 79, 213–224. [Google Scholar] [CrossRef]
  15. Kogan, F.N. Droughts of the late 1980s in the United States as derived from NOAA polar-orbiting satellite data. Bull. Am. Meteorol. Soc. 1995, 76, 655–668. [Google Scholar] [CrossRef] [Green Version]
  16. Kuri, F.; Murwira, A.; Murwira, K.S.; Masocha, M. Predicting maize yield in Zimbabwe using dry dekads derived from remotely sensed vegetation condition index. Int. J. Appl. Earth Obs. Geoinf. 2014, 33, 39–46. [Google Scholar] [CrossRef]
  17. Baniya, B.; Tang, Q.; Xu, X.; Haile, G.G.; Chhipi-Shrestha, G. Spatial and temporal variation of drought based on satellite derived vegetation condition index in Nepal from 1982–2015. Sensors 2019, 19, 430. [Google Scholar] [CrossRef] [Green Version]
  18. Liang, L.; Sun, Q.; Luo, X.; Wang, J.; Zhang, L.; Deng, M.; Di, L.; Liu, Z. Long-term spatial and temporal variations of vegetative drought based on vegetation condition index in China. Ecosphere 2017, 8, e01919. [Google Scholar] [CrossRef]
  19. Qian, X.; Liang, L.; Shen, Q.; Sun, Q.; Zhang, L.; Liu, Z.; Zhao, S.; Qin, Z. Drought trends based on the VCI and its correlation with climate factors in the agricultural areas of China from 1982 to 2010. Environ. Monit. Assess. 2016, 188, 639. [Google Scholar] [CrossRef] [PubMed]
  20. Quiring, S.M.; Ganesh, S. Evaluating the utility of the vegetation condition index (VCI) for monitoring meteorological drought in Texas. Agric. For. Meteorol. 2010, 150, 330–339. [Google Scholar] [CrossRef]
  21. Jain, S.K.; Keshri, R.; Goswami, A.; Sarkar, A. Application of meteorological and vegetation indices for evaluation of drought impact: A case study for Rajasthan, India. Nat. Hazards 2010, 54, 643–656. [Google Scholar] [CrossRef]
  22. Kong, D.; Miao, C.; Borthwick, A.G.L.; Duan, Q.; Liu, H.; Sun, Q.; Ye, A.; Di, Z.; Gong, W. Evolution of the Yellow River Delta and its relationship with runoff and sediment load from 1983 to 2011. J. Hydrol. 2015, 520, 157–167. [Google Scholar] [CrossRef] [Green Version]
  23. Wu, J.; Miao, C.; Zheng, H.; Duan, Q.; Lei, X.; Li, H. Meteorological and hydrological drought on the Loess Plateau, China: Evolutionary characteristics, impact, and propagation. J. Geophys. Res. Atmos. 2018, 123, 11, 569–511, 584. [Google Scholar] [CrossRef]
  24. Han, Z.; Huang, Q.; Huang, S.; Leng, G.; Bai, Q.; Liang, H.; Wang, L.; Zhao, J.; Fang, W. Spatial-temporal dynamics of agricultural drought in the Loess Plateau under a changing environment: Characteristics and potential influencing factors. Agric. Water Manag. 2021, 244, 106540. [Google Scholar] [CrossRef]
  25. Zhao, G.; Mu, X.; Wen, Z.; Wang, F.; Gao, P. Soil erosion, conservation, and eco-environment changes in the Loess Plateau of China. Land Degrad. Dev. 2013, 24, 499–510. [Google Scholar] [CrossRef]
  26. Yan, R.; Zhang, X.; Yan, S.; Chen, H. Estimating soil erosion response to land use/cover change in a catchment of the Loess Plateau, China. Int. Soil Water Conserv. Res. 2018, 6, 13–22. [Google Scholar] [CrossRef]
  27. Cui, Y.; Pan, C.; Liu, C.; Luo, M.; Guo, Y. Spatiotemporal variation and tendency analysis on rainfall erosivity in the Loess Plateau of China. Hydrol. Res. 2020, 51, 1048–1062. [Google Scholar] [CrossRef]
  28. Wang, Q.; Fan, X.; Qin, Z.; Wang, M. Change trends of temperature and precipitation in the Loess Plateau region of China, 1961–2010. Glob. Planet. Change 2012, 92, 138–147. [Google Scholar] [CrossRef]
  29. Gu, C.; Mu, X.; Gao, P.; Sun, W.; Zhao, G. Characteristics of temporal variation in precipitation and temperature in the Loess Plateau from 1961 to 2014. J. Arid Land Resour. Environ. 2017, 31, 136–143. [Google Scholar] [CrossRef]
  30. Sun, Q.; Miao, C.; Duan, Q.; Wang, Y. Temperature and precipitation changes over the Loess Plateau between 1961 and 2011, based on high-density gauge observations. Glob. Planet. Change 2015, 132, 1–10. [Google Scholar] [CrossRef]
  31. Sun, C.; Huang, G.; Fan, Y.; Zhou, X.; Lu, C.; Wang, X. Drought occurring with hot extremes: Changes under future climate change on Loess Plateau, China. Earth’s Future 2019, 7, 587–604. [Google Scholar] [CrossRef] [Green Version]
  32. Zhao, G.; Zhai, J.; Tian, P.; Zhang, L.; Mu, X.; An, Z.; Han, M. Variations in extreme precipitation on the Loess Plateau using a high-resolution dataset and their linkages with atmospheric circulation indices. Theor. Appl. Climatol. 2018, 133, 1235–1247. [Google Scholar] [CrossRef]
  33. Li, M.; Deng, Y.; Ge, C.; Wang, G.; Chai, X. Characteristics of meteorological drought across the Loess Plateau and their linkages with large-scale climatic factors during 1961–2017. Ecol. Environ. Sci. 2020, 29, 2231–2239. [Google Scholar] [CrossRef]
  34. Liu, Z.; Wang, Y.; Shao, M.; Jia, X.; Li, X. Spatiotemporal analysis of multiscalar drought characteristics across the Loess Plateau of China. J. Hydrol. 2016, 534, 281–299. [Google Scholar] [CrossRef]
  35. Gao, X.; Zhao, Q.; Zhao, X.; Wu, P.; Pan, W.; Gao, X.; Sun, M. Temporal and spatial evolution of the standardized precipitation evapotranspiration index (SPEI) in the Loess Plateau under climate change from 2001 to 2050. Sci. Total Environ. 2017, 595, 191–200. [Google Scholar] [CrossRef]
  36. Wang, J.; Sun, C.; Zheng, Z.; Li, X. Drought characteristics of the Loess Plateau in the past 60 years and its relationship with changes in atmospheric circulation. Acta Ecol. Sin. 2021, 41, 5340–5351. [Google Scholar] [CrossRef]
  37. Li, M.; Cao, F.; Wang, G.; Chai, X.; Zhang, L. Evolutional characteristics of regional meteorological drought and their linkages with southern oscillation index across the Loess Plateau of China during 1962–2017. Sustainability 2020, 12, 7237. [Google Scholar] [CrossRef]
  38. Sun, C.; Ma, Y. Effects of non-linear temperature and precipitation trends on Loess Plateau droughts. Quat. Int. 2015, 372, 175–179. [Google Scholar] [CrossRef]
  39. Li, X.; Yang, L.; Nie, H.; Ren, L.; Hu, S.; Yang, Y. Assessment of temporal and spatial dynamics of agricultural drought in Shaanxi Province based on vegetation condition index. Chin. J. Ecol. 2018, 37, 1172–1180. [Google Scholar] [CrossRef]
  40. Wang, R.; Cherkauer, K.; Bowling, L. Corn response to climate stress detected with satellite-based NDVI time series. Remote Sens. 2016, 8, 269. [Google Scholar] [CrossRef] [Green Version]
  41. Walz, Y.; Min, A.; Dall, K.; Duguru, M.; de Leon, J.-C.V.; Graw, V.; Dubovyk, O.; Sebesvari, Z.; Jordaan, A.; Post, J. Monitoring progress of the Sendai Framework using a geospatial model: The example of people affected by agricultural droughts in Eastern Cape, South Africa. Prog. Disaster Sci. 2020, 5, 100062. [Google Scholar] [CrossRef]
  42. Das, P.K.; Das, R.; Das, D.K.; Midya, S.K.; Bandyopadhyay, S.; Raj, U. Quantification of agricultural drought over Indian region: A multivariate phenology-based approach. Nat. Hazards 2020, 101, 255–274. [Google Scholar] [CrossRef]
  43. Pei, T.; Ji, Z.; Chen, Y.; Wu, H.; Hou, Q.; Qin, G.; Xie, B. The sensitivity of vegetation phenology to extreme climate indices in the Loess Plateau, China. Sustainability 2021, 13, 7623. [Google Scholar] [CrossRef]
  44. Bai, Y.; Gao, J.; Zhang, B. Monitoring of crops growth based on NDVI and EVI. Trans. Chin. Soc. Agric. Mach. 2019, 50, 153–161. [Google Scholar] [CrossRef]
  45. Kang, Y.; Özdoğan, M.; Zipper, S.C.; Román, M.O.; Walker, J.; Hong, S.Y.; Marshall, M.; Magliulo, V.; Moreno, J.; Alonso, L.; et al. How universal is the relationship between remotely sensed vegetation indices and crop leaf area index? A global assessment. Remote Sens. 2016, 8, 597. [Google Scholar] [CrossRef] [PubMed] [Green Version]
  46. Luo, Z.; Yu, S. Spatiotemporal variability of land surface phenology in China from 2001–2014. Remote Sens. 2017, 9, 65. [Google Scholar] [CrossRef] [Green Version]
  47. Broxton, P.D.; Zeng, X.; Scheftic, W.; Troch, P.A. A MODIS-based global 1-km maximum green vegetation fraction dataset. J. Appl. Meteorol. Climatol. 2014, 53, 1996–2004. [Google Scholar] [CrossRef]
  48. Fu, Y.; He, H.S.; Hawbaker, T.J.; Henne, P.D.; Zhu, Z.; Larsen, D.R. Evaluating k-nearest neighbor (kNN) imputation models for species-level aboveground forest biomass mapping in Northeast China. Remote Sens. 2019, 11, 2005. [Google Scholar] [CrossRef] [Green Version]
  49. Liang, D.; Zuo, Y.; Huang, L.; Zhao, J.; Teng, L.; Yang, F. Evaluation of the consistency of MODIS land cover product (MCD12Q1) based on Chinese 30 m GlobeLand30 datasets: A case study in Anhui province, China. ISPRS Int. J. Geo-Inf. 2015, 4, 2519–2541. [Google Scholar] [CrossRef] [Green Version]
  50. Geng, L.; Ma, M.; Wang, X.; Yu, W.; Jia, S.; Wang, H. Comparison of eight techniques for reconstructing multi-satellite sensor time-series NDVI data sets in the Heihe River basin, China. Remote Sens. 2014, 6, 2024–2049. [Google Scholar] [CrossRef] [Green Version]
  51. Li, Y.; Qin, Y.; Ma, L.; Pan, Z. Climate change: Vegetation and phenological phase dynamics. Int. J. Clim. Chang. Strateg. Manag. 2020, 12, 495–509. [Google Scholar] [CrossRef]
  52. Peng, H.; Xia, H.; Chen, H.; Zhi, P.; Xu, Z. Spatial variation characteristics of vegetation phenology and its influencing factors in the subtropical monsoon climate region of southern China. PLoS ONE 2021, 16, e0250825. [Google Scholar] [CrossRef]
  53. Gong, Z.; Kawamura, K.; Ishikawa, N.; Goto, M.; Wulan, T.; Alateng, D.; Yin, T.; Ito, Y. MODIS normalized difference vegetation index (NDVI) and vegetation phenology dynamics in the Inner Mongolia grassland. Solid Earth 2015, 6, 1185–1194. [Google Scholar] [CrossRef] [Green Version]
  54. Jönsson, P.; Eklundh, L. TIMESAT—A program for analyzing time-series of satellite sensor data. Comput. Geosci. 2004, 30, 833–845. [Google Scholar] [CrossRef] [Green Version]
  55. Liang, L.; Qiu, S.; Yan, J.; Shi, Y.; Geng, D. VCI-based analysis on spatiotemporal variations of spring drought in China. Int. J. Environ. Res. Public Health 2021, 18, 7967. [Google Scholar] [CrossRef] [PubMed]
  56. Gidey, E.; Dikinya, O.; Sebego, R.; Segosebe, E.; Zenebe, A. Analysis of the long-term agricultural drought onset, cessation, duration, frequency, severity and spatial extent using vegetation health index (VHI) in Raya and its environs, Northern Ethiopia. Environ. Syst. Res. 2018, 7, 13. [Google Scholar] [CrossRef] [Green Version]
  57. Zhao, X.; Xia, H.; Pan, L.; Song, H.; Niu, W.; Wang, R.; Li, R.; Bian, X.; Guo, Y.; Qin, Y. Drought monitoring over Yellow River basin from 2003–2019 using reconstructed MODIS land surface temperature in Google Earth Engine. Remote Sens. 2021, 13, 3748. [Google Scholar] [CrossRef]
  58. Sen, P.K. Estimates of the regression coefficient based on Kendall’s tau. J. Am. Stat. Assoc. 1968, 63, 1379–1389. [Google Scholar] [CrossRef]
  59. Mann, H.B. Nonparametric tests against trend. Econometrica 1945, 13, 245–259. [Google Scholar] [CrossRef]
  60. Shapiro, S.S.; Wilk, M.B. An analysis of variance test for normality (complete samples). Biometrika 1965, 52, 591–611. [Google Scholar] [CrossRef]
  61. Zhao, A.; Zhang, A.; Liu, J.; Feng, L.; Zhao, Y. Assessing the effects of drought and “Grain for Green” program on vegetation dynamics in China’s Loess Plateau from 2000 to 2014. Catena 2019, 175, 446–455. [Google Scholar] [CrossRef]
  62. Zhao, A.; Zhang, A.; Liu, H.; Liu, Y.; Wang, H.; Wang, D. Spatiotemporal variation of vegetation coverage before and after implementation of Grain for Green project in the Loess Plateau. J. Nat. Resour. 2017, 32, 449–460. [Google Scholar] [CrossRef]
  63. Shen, Z.; Zhang, Q.; Singh, V.P.; Sun, P.; Song, C.; Yu, H. Agricultural drought monitoring across Inner Mongolia, China: Model development, spatiotemporal patterns and impacts. J. Hydrol. 2019, 571, 793–804. [Google Scholar] [CrossRef]
  64. Zhang, B.; Wu, P.; Zhao, X.; Wang, Y.; Wang, J.; Shi, Y. Drought variation trends in different subregions of the Chinese Loess Plateau over the past four decades. Agric. Water Manag. 2012, 115, 167–177. [Google Scholar] [CrossRef]
  65. Hou, Q.; Pei, T.; Chen, Y.; Ji, Z.; Xie, B. Variations of drought and its trend in the Loess Plateau from 1986 to 2019. Chin. J. Appl. Ecol. 2021, 32, 649–660. [Google Scholar] [CrossRef]
  66. Xin, Z.; Xu, J.; Zheng, W. Spatiotemporal variations of vegetation cover on the Chinese Loess Plateau (1981–2006): Impacts of climate changes and human activities. Sci. China Ser. D Earth Sci. 2008, 51, 67–78. [Google Scholar] [CrossRef]
  67. Sun, W.; Song, X.; Mu, X.; Gao, P.; Wang, F.; Zhao, G. Spatiotemporal vegetation cover variations associated with climate change and ecological restoration in the Loess Plateau. Agric. For. Meteorol. 2015, 209, 87–99. [Google Scholar] [CrossRef]
  68. Ji, Z.; Pei, T.; Chen, Y.; Qin, G.; Hou, Q.; Xie, B.; Wu, H. Vegetation phenology change and its response to seasonal climate changes on the Loess Plateau. Acta Ecol. Sin. 2021, 41, 6600–6612. [Google Scholar] [CrossRef]
  69. Xie, B.; Qin, Z.; Wang, Y.; Chang, Q. Monitoring vegetation phenology and their response to climate change on Chinese Loess Plateau based on remote sensing. Trans. Chin. Soc. Agric. Eng. 2015, 31, 153–160. [Google Scholar] [CrossRef]
  70. Li, Q.; Zhang, C.; Ren, Z. Analysis of temporal and spatial variation of vegetation phenology in the Loess Plateau. Sci. Agric. Sin. 2016, 49, 4352–4365. [Google Scholar] [CrossRef]
  71. Wang, H.; Liu, G.; Li, Z.; Ye, X.; Wang, M.; Gong, L. Driving force and changing trends of vegetation phenology in the Loess Plateau of China from 2000 to 2010. J. Mt. Sci. 2016, 13, 844–856. [Google Scholar] [CrossRef] [Green Version]
  72. Wang, Y.; Luo, Y.; Shafeeque, M. Interpretation of vegetation phenology changes using daytime and night-time temperatures across the Yellow River basin, China. Sci. Total Environ. 2019, 693, 133553. [Google Scholar] [CrossRef] [PubMed]
  73. Eklundha, L.; Jönsson, P. TIMESAT 3.3 with Seasonal Trend Decomposition and Parallel Processing Software Manual; Lund University: Lund, Sweden, 2017. [Google Scholar]
Figure 1. Topographic map (a) and vegetation type map (b) of the Loess Plateau.
Remotesensing 14 03043 g001
Figure 2. Schematic diagram for weighted vegetation condition index (WVCI) calculation.
Remotesensing 14 03043 g002
Figure 3. Spatial pattern of the annual mean values for the (a) start of the growing season (SOS), (b) peak of the growing season (POS) and (c) end of the growing season (EOS) of the four vegetation types in the LP from 2001 to 2019. ‘DOY’ is the abbreviation for ‘day of the year’.
Remotesensing 14 03043 g003
Figure 4. Spatial pattern of drought frequencies for various drought grades during the vegetation growing period according to WVCI values across the Loess Plateau. (a) Occurrence frequency of mild drought; (b) occurrence frequency of moderate drought; (c) occurrence frequency of severe drought; (d) occurrence frequency of extreme drought.
Remotesensing 14 03043 g004
Figure 5. Trend and significance of the growing-season WVCI in the Loess Plateau from 2001 to 2019. (a) Growing-season WVCI trend; (b) significance of growing-season WVCI trend. ‘Sig In’, ‘Nonsig In’, ‘Sig De’ and ‘Nonsig De’ are abbreviations for ‘significant increase’, ‘non-significant increase’, ‘significant decrease’ and ‘non-significant decrease’, respectively.
Remotesensing 14 03043 g005
Figure 6. Spatial pattern of the departure percentage of WVCI across the Loess Plateau from 2001 to 2019.
Remotesensing 14 03043 g006
Figure 7. Temporal variation in D time series for the (a) forest, (b) shrub, (c) grassland and (d) farmland in the Loess Plateau from 2001 to 2019. ‘D’ represents the departure percentage of WVCI.
Remotesensing 14 03043 g007
Figure 8. Spatial distribution of the Pearson correlation coefficient (a) and the p-value (b) between WVCI and VCI for the entire growing season from 2001 to 2019.
Remotesensing 14 03043 g008
Figure 9. Spatial pattern of drought frequencies for various drought grades during vegetation growing period according to VCI values across the Loess Plateau. (a) Occurrence frequency of mild drought; (b) occurrence frequency of moderate drought; (c) occurrence frequency of severe drought; (d) occurrence frequency of extreme drought.
Remotesensing 14 03043 g009
Table 1. Drought classification according to VCI/WVCI values.
Drought Grade No DroughtMild DroughtModerate DroughtSevere DroughtExtreme Drought
VCI/WVCI value>4030~4020~3010~20<10
Table 2. Mean correlation coefficients between WVCI and VCI for various vegetation types throughout the growth season between 2001 and 2019.
Vegetation TypeForestShrubGrasslandFarmland
Correlation coefficient0.930.970.970.95
Publisher’s Note: MDPI stays neutral with regard to jurisdictional claims in published maps and institutional affiliations.

