Abstract
Sea ice mapping plays an integral role in ship navigation and meteorological modeling in the polar regions. Numerous published studies in sea ice classification using synthetic aperture radar (SAR) have reported high classification rates. However, many of these focus on numerical results based on sample points and ignore the quality of the inferred sea ice maps. We have designed and implemented a novel SAR sea ice classification algorithm where the spatial context, obtained by the unsupervised IRGS segmentation algorithm, is integrated with texture features extracted by a residual neural network (ResNet) and, using regional pooling, classifies ice and water. This algorithm is trained and tested on a published dataset and cross-validated using leave-one-out (LOO) strategy, obtaining an overall accuracy of 99.67% and outperforming several existing algorithms. In addition, visual results show that this new method produces sea ice maps with natural ice–water boundaries and fewer ice and water errors.
1. Introduction
Sea ice covers about 12% of the oceans on Earth [1]. In high latitude and polar regions, sea ice reduces the heat exchange between the sea and the atmosphere, regulating the global climate [2]. As the global temperature has been rising in the past decades, sea ice thickness has reduced dramatically [3]. Melting ice poses a significant impact on the ecosystem and meteorology in the Arctic region. Meanwhile, exploring shipping routes and marine resource becomes attractive in the summer season [4]; therefore, monitoring sea ice distribution and how it changes in the life span is essential.
Synthetic aperture radar (SAR) [5] is a reliable method to monitor sea ice because SAR imagery can be acquired day and night under any type of weather condition. Popular satellites deployed for analyzing sea ice are the Sentinel-1 mission (operated by the European Space Agency) and RADARSAT system (RADARSAT-2 and RADARSAT Constellation Mission (RCM), operated by the Canadian Space Agency). Ice agencies from different nations, e.g., the Canadian Ice Service (CIS), the National Ice Agency, and the Norwegian Ice Service, process SAR data and produce ice charts manually. With the expanding data volume received from recently launched SAR satellites [6,7], the demand for automated sea ice classification systems is growing.
A typical sea ice classification system usually consists of two parts. First, handcrafted features are extracted from each pixel. Second, an appropriate classifier is trained on the feature set and predicts each pixel’s label in the scene. For the first step, originally only backscattering intensities were used to distinguish sea ice and water [8]; however, the non-stationarity caused by weather conditions (e.g., wind speed and melting ponds on ice surface [9,10,11]) and satellite’s infrastructure (e.g., incidence angle effect [12,13,14] and speckle noise [15,16,17]), make it not possible to solely use backscatter for operational sea ice classification tasks. Meanwhile, studies [18,19,20] reported high classification accuracy by utilizing polarimetric features. Gill and Yackel [21] extracted polarimetric parameters from quad-polarized RADARSAT-2 imagery using different decomposition methods. K-means and maximum likelihood classifiers were adopted to discriminate different types of first-year ice. Although quad-polarized SAR imagery shows enormous potential in classifying sea ice, the narrow swath, which is on the order of 50 km, does not have sufficient coverage for operational sea ice monitoring that utilizes swaths in the range 400–500 km. Dabboor et al. [22] trained a random forest (RF) classifier using 23 simulated compact polarimetric (CP) features extracted from quad-polarimetric (QP) data to classify first-year and multi-year ice. Ghanbari et al. [23] also used simulated CP features derived from QP data to classify different ice types. Even though the classification accuracy achieved by CP features is lower than that of QP features, the wider swath (350 km for RCM) of CP data makes it a better data source for operational sea ice monitoring.
Since major national sea ice agencies favor imagery with large area coverage for operational use, dual-polarization imagery with a 500 km swath has become the main data source for sea ice mapping in the past decade [24]. In addition to backscatter intensities, textural features extracted using the gray level co-occurrence matrix (GLCM) [25] can be used to enhance the feature description for sea ice discrimination [26,27]. Clausi [28] explored the classification performance of using different GLCM measurements. The study showed that the classification accuracy was not always rising with the increasing grey levels of quantization. Li et al. [29] proposed an unsupervised method to classify ice and water. The HV scene was segmented into homogeneous regions using a modified watershed algorithm. Then, the Otsu threshold was applied to distinguish the homogeneous regions, which were chosen as training samples. An support vector machine was trained on GLCM features and tested on 728 Sentinel-1 extra-wide images. Lyu et al. [30] extracted GLCM features and trained a random forest to separate sea ice from water in RCM data.
Deep learning has recently been introduced to remote sensing because of its phenomenal achievement in the computer vision domain. The classification results that use features learned by deep learning models are usually comparable, sometimes superior to those using traditional engineered features [31]. The convolutional neural network (CNN), a particular deep learning structure, has been widely adopted in sea ice classification recently [32,33,34,35,36]. Ren et al. [37] proposed a two-step deep learning model named (DAU-Net) to discriminate between sea ice and open water. A residual neural network (ResNet) was deployed to extract features from input SAR imagery. Then, a fully connected U-Net integrated with a dual-attention mechanism ingested the learned featured map and produced an ice–water classification result. The model was trained on 15 dual-polarized scenes and tested on the other three. The DAU-Net improved the intersection over union (IoU) compared with the original U-Net. Junhwa et al. [38] used long- and short-term memory (LSTM) to capture temporal relation between SAR images. A deep learning model consisting of encoders, LSTMs, and decoders were developed to predict sea ice. The model used a novel perceptual loss function and accurately predicted sea ice concentration.
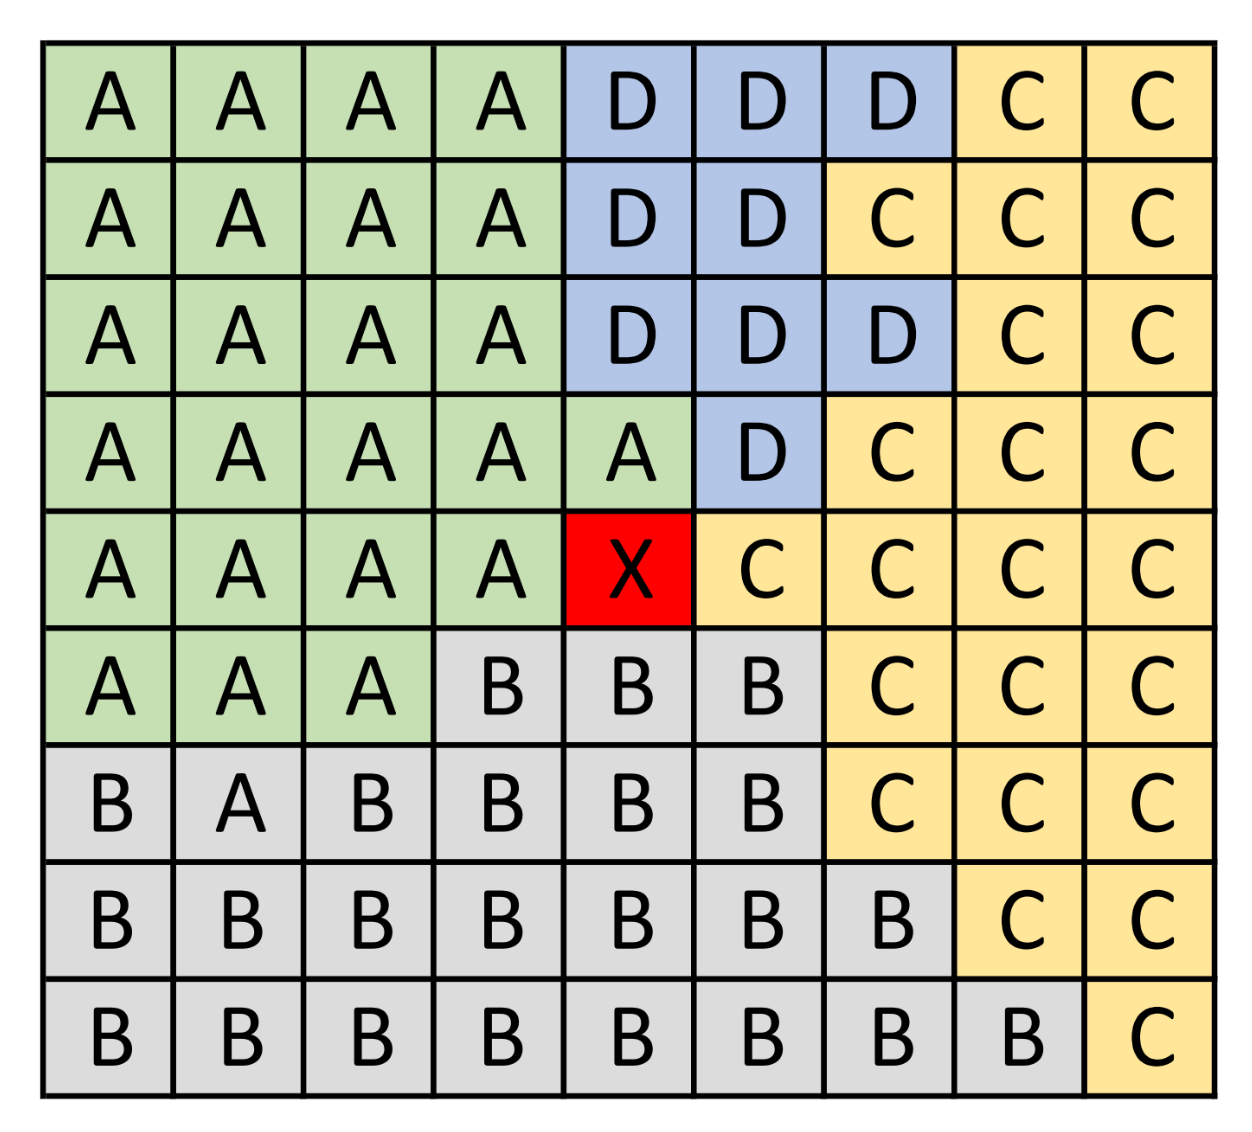
However, most deep-learning-based studies compare their methods with benchmark deep learning models or traditional classifiers with the input of backscattering intensity. The advantages of using the learned feature (deep learning) compared with engineered features (e.g., GLCM) have not been sufficiently investigated. Moreover, boundaries between sea ice and water, which are well presented in ice charts, are usually corroded in the classification results [23]. Since pixel-level ground truth is scarce, the performance of the sea ice classification method is generally trained and evaluated based on sample points rather than the whole scene. Many studies prefer to select samples from regions with high concentration and no boundary to ensure the quality and quantity of the training data. The classifiers can not learn the characteristics of the ice–water boundary based on limited samples. Furthermore, both CNN- and GLCM-based methods extract features using sliding windows, and in each window, all pixels inside contribute to describing the features of the center pixel. Figure 1 depicts a extreme case for learning window-based feature. It is a 9-by-9 image path used to extract the feature of center pixel “X”. “A”, “B”, “C”, and “D” represent the other four classes. Although the path is designed to learn features of pixel “X”, it extracts the features derived from its neighbor, class “A”, “B”, “C”, and “D”, rather than itself. The features derived from mixed classes confuse the classifier and lead to classification errors [39].
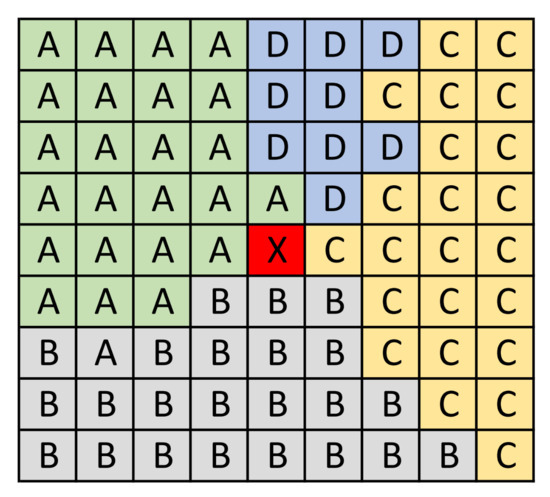
Figure 1.
Example of a image patch for feature extraction. “X” is the center pixel that needs to be extracted features. “A”, “B”, “C”, and “D” are four different classes.
This study aims to develop a robust machine learning system that produces sea ice–water maps result with pixel-level labels and well-preserved ice–water boundaries. Since the residual neural networks have shown promising results in remote sensing, we apply them to extract spatial information about sea ice and water. Meanwhile, the iterative region growing with semantics (IRGS) [40], a segmentation algorithm that is specially designed to deal with remote sensing data, is utilized to determine ice–water boundary by learning the contextual feature. The two methods are integrated by a novel region-pooling layer to classify sea ice in SAR imagery. The following are the main contributions of this work.
- We propose a novel end-to-end sea ice–water classification system based on a deep learning model using SAR imagery. One of the major attractions of the proposed system is that it can generate a pixel-level classification result while the fine boundaries between ice and water are well preserved.
- We explore the classification capability of a deep learning model with different input and patch sizes. The results obtained by the deep learning model with different hyper-parameters provide a baseline reference for future work.
- We extensively evaluate the performance of the proposed model and compare it with two benchmark methods and two reference methods. The results show that our model outperforms these methods of comparison both numerically and visually.
2. Data
2.1. The RADARSAT-2 ScanSAR Wide Mode Dataset
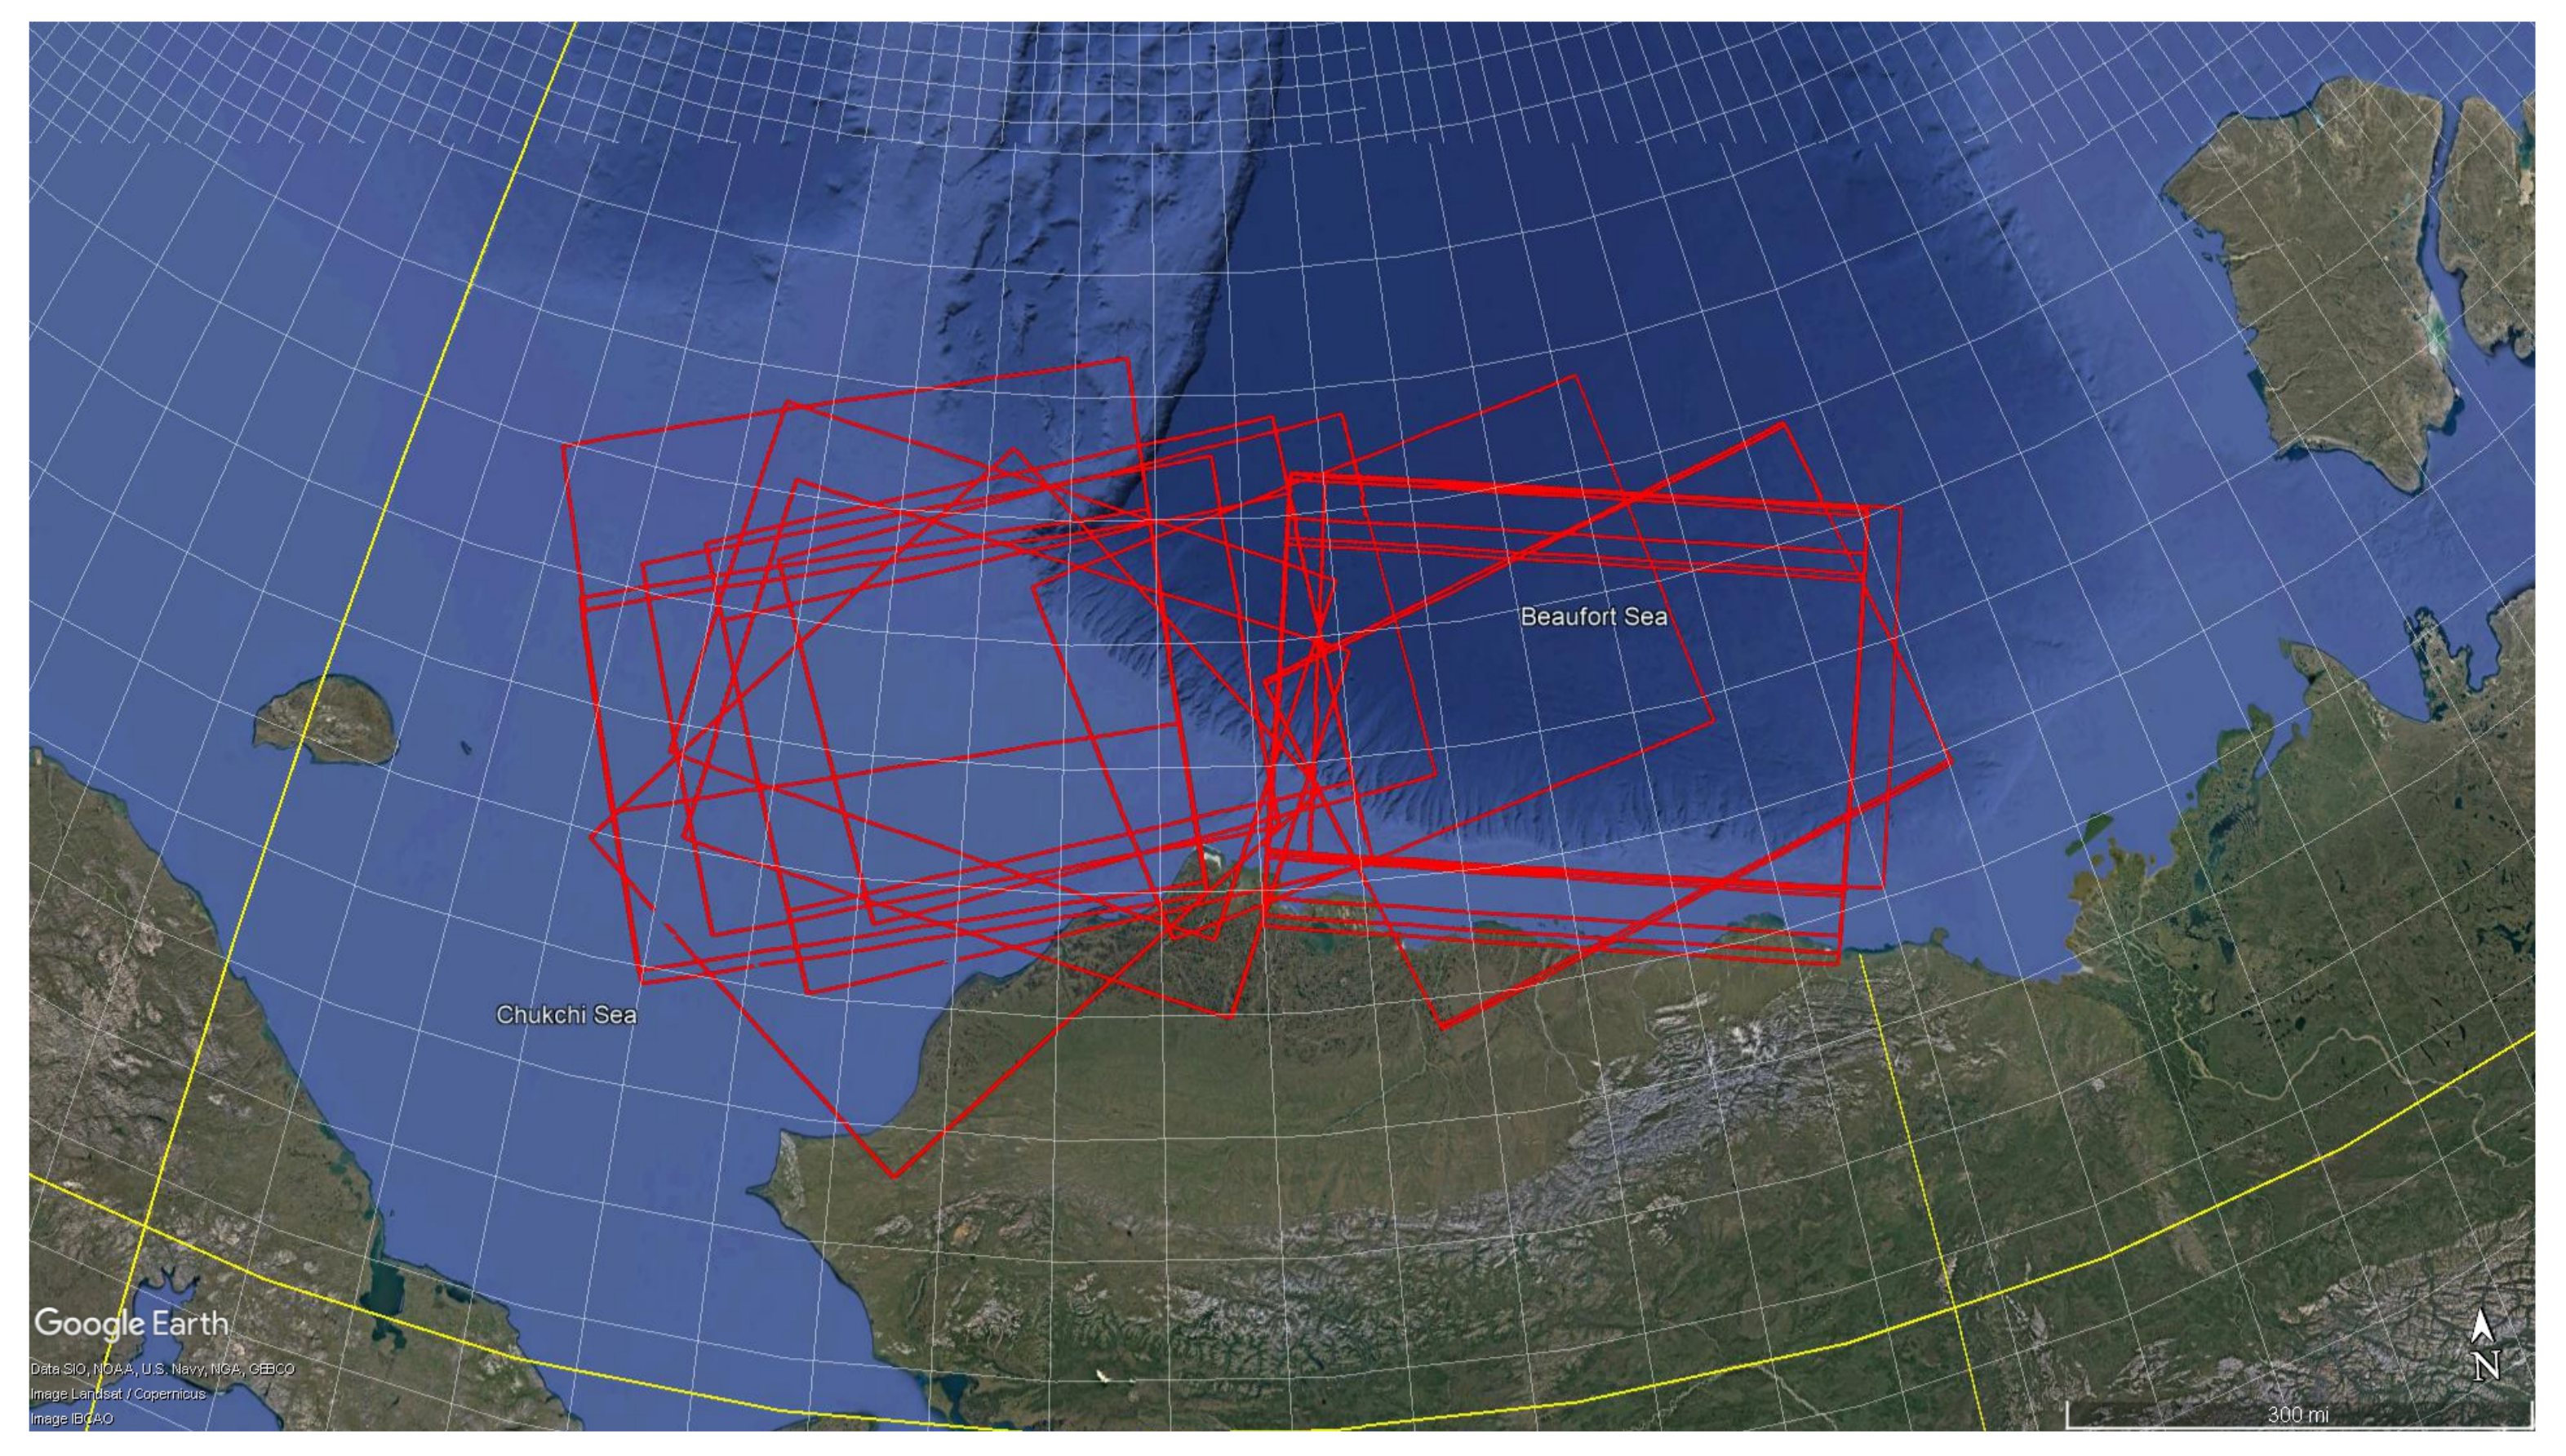
The dataset used in this paper to train and validate the proposed method contains 21 scenes at different locations over the Beaufort Sea in 2010. The Beaufort Sea can be considered as a marginal sea of the Arctic Ocean located north of Canada and Alaska. Figure 2 shows the geographical distribution of the dataset. Each scene was captured under ScanSAR wide beam mode and consisted of HH and HV polarizations from both ascending and descending satellite passes. Table 1 lists the scene ID, acquisition time, ascending or descending orbit, and incidence angle range of the scenes in the dataset. The average image size is around 10,500 by 10,000 pixels with a spatial resolution of 50 by 50 m. The nominal swath width is 500 km in both range and azimuth direction, and the incidence angle varies from 19.50 to 49.48 degrees. The 21 scenes were acquired from April through December under various ice–water conditions. Canadian Ice Service (CIS) acquired these images for manual interpretation and generating ice charts in 2010. This is the same dataset used by Leigh et al. [41] and Jiang et al. [42].
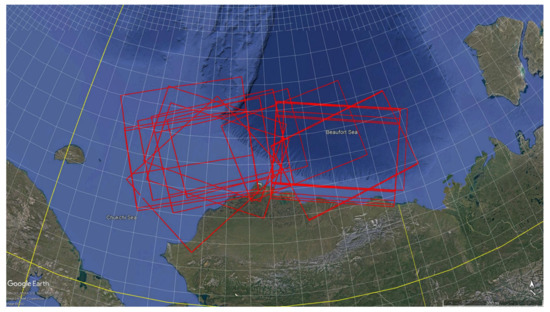
Figure 2.
Location of the Beaufort Sea. Footprints of the 21 RADARSAT-2 scenes used in this work are shown in yellow.

Table 1.
List of SAR scenes used in this work.
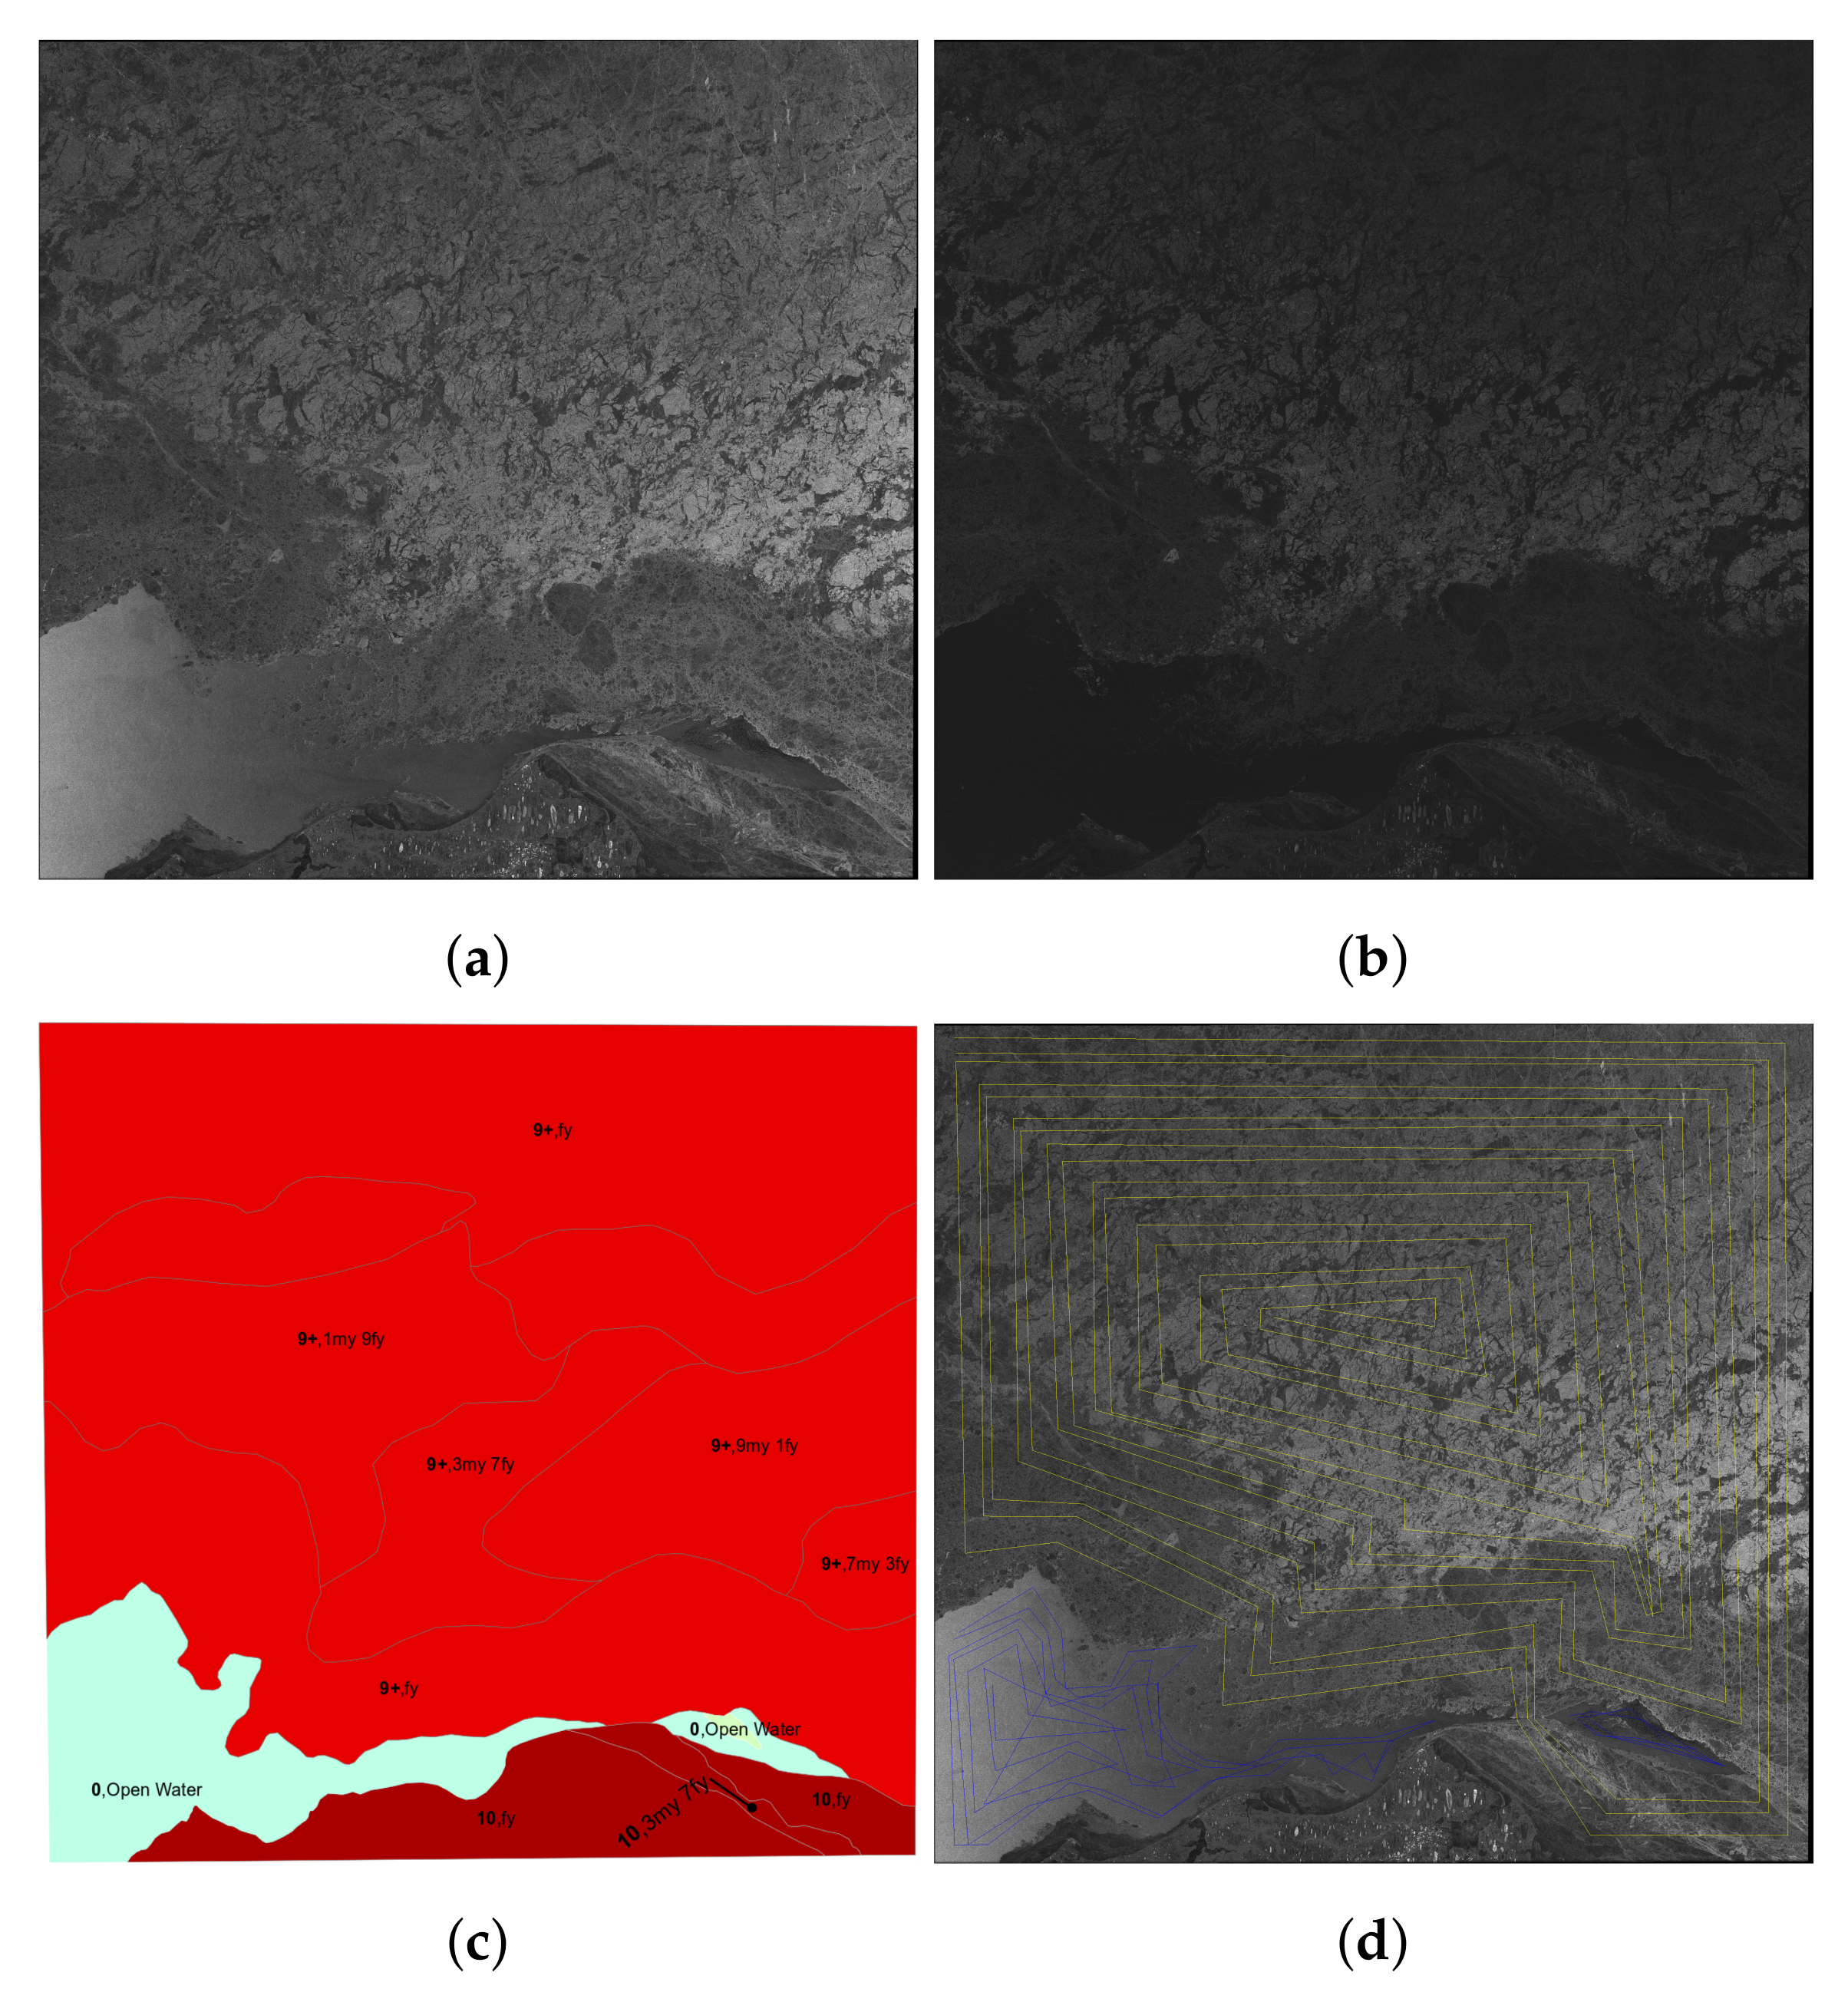
An example scene of the dataset, which was taken on 24 May 2010, is shown in Figure 3. This scene contains first-year ice, multi-year ice, water, and land. Both HH and HV are displayed, and HV is less sensitive to the incidence angle effect compared with HH. The first-year ice presented at the top of the scene appears visually different than that at the bottom. The water shows decreasing backscattering in the horizontal direction in the scene. There is another open water area that appears at the bottom right corner.
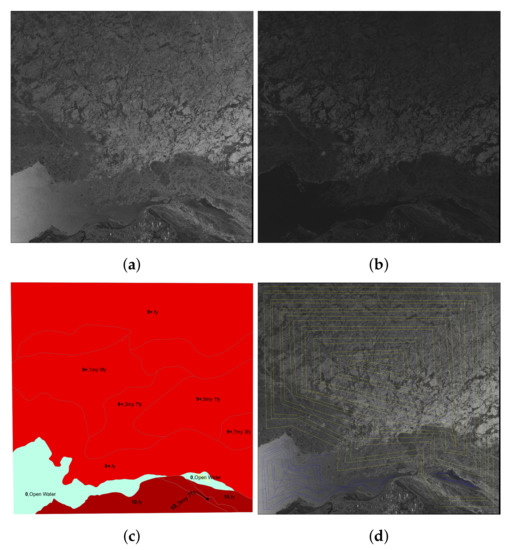
Figure 3.
An example scene in the dataset. The scene was acquired on 24 May 2020. (a) HH polarization. (b) HV polarization. (c) Ice chart. (d) Sample points on poly-lines used for training and testing. ice: yellow, water: blue.
2.2. Data Pre-Processing
The pre-processing of the dataset used in this study includes radiometric calibration, down-sampling, and normalization. The first step is a fundamental processing to reduce the incidence angle effect before applying other pre-processing.
The RADARSAT-2 radiometric calibration uses a lookup table of beta, gamma, and sigma to calculate sigma naught, which is defined as follows [43]:
where d is the pixel intensity with a range from 0 to 255. , , and are noise scaling, linear conversion, and offset, respectively. is the noise as a function of range r. Sigma naught is the calibrated backscatter coefficient and expressed decibels (dBs). Unlike passive sensors, images acquired by SAR sensors are usually contaminated by a multiplicative noise called speckle noise. Speckle noise is caused by the infrastructure of the SAR platform and interferes with the backscatter captured in SAR imagery [44]. Many studies use filters, e.g., the Lee filter, to remove speckle noise; however, applying the Lee filter does degrade the ice–water boundary information, which is crucial for sea ice–water classification. Hence, no speckle noise filter is utilized in this study.
Each image is approximately 10,500 by 10,000 pixels with a nominal pixel spacing of m. A 4-by-4 average pooling is applied to the images in the dataset to reduce computational cost and runtime. The downsampled image size is around 2600 by 2500. The new 200 m pixel size is still adequate for producing sea ice classification maps with far more details than the ice charts interpreted by human experts [41].
Compared with HH, HV imagery usually has a much lower signal-to-noise ratio. Since the output of each layer in a deep learning model depends on the input value, the gradient descent trends to update some weights much faster than others if the scales of input channels vary; therefore, normalizing input features to a similar scale helps accelerate learning speed and produce faster convergence. For training and testing the proposed deep learning model, the backscattering intensities of all input scenes are normalized to the range of 0 to 1 using the corresponding minimum and maximum [36].
2.3. Dataset for Training and Validation
Pixel-level ground truth is important for training supervised models; however, one of the biggest challenges in sea ice classification is the lack of reliable labeled samples. The most common reference data source the ice chart released by CIS. Figure 3c shows an ice chart over Beaufort Sea from 24 May 2010. There are two steps involved in producing sea ice charts. First, the trained operators break down the scene into defined regions called ‘polygons’. Then, each polygon is interpreted based on the ice concentration and visually recognized sea ice types. For example, the text “9+, 1my, 9fy” on the polygon indicates that the overall ice concentration in this polygon is more than 90%, with 10% multi-year ice and 90% first-year ice for ice coverage.
To ensure the quality of the training data, an experienced CIS ice analyst helped to draw sophisticated ice charts for our dataset. Since ResNet requires massive labeled data to learn the characteristics of sea ice and open water, we make our best efforts to obtain labeled samples using an efficient approach. Poly-lines with different colors (yellow for ice and blue for water) are drawn over homogeneous regions across the whole scene. Each point on these poly-lines is considered a labeled sample point. Figure 3d demonstrates the ground truth used in this study. The sea ice and open water samples with different backscattering and texture will contribute to the generalization of the classification model. To reduce the spatial correlation of the samples in the dataset, only 20% of pixels are randomly selected from the ground truth for training and testing. The number of labeled samples used in this study is listed in Table 2. If the scene contains only one class, the number of samples for each of the other classes is zero.

Table 2.
Number of labeled samples used in this study.
Although using a dataset that contains hundreds of scenes to evaluate the method’s performance is attractive, some studies [29,45] only employ a small portion of the dataset for numerical testing due to the lack of detailed ground truth. Moreover, the results in the article published by Zhang et al. [46] indicate that the classification accuracy follows a similar distribution for consecutive years. Since our dataset covers a whole year of sea ice life span, it is sufficient to assess the proposed method [47].
The commonly used evaluation criterion is classification accuracy. Most studies prefer to train and test on the same scene or shuffle the training dataset and select specific portions for training, validating, and testing; however, using samples from the same scene for both training and testing shows a tendency for higher classification accuracy because data in the same scene shared similar characteristics. This evaluation criterion usually causes lower classification accuracy in the operational task since the backscattering of sea ice and water can vary from scene to scene. To ensure the generalization of the proposed method and implement a fair evaluation, we adopt a leave-one-out (LOO) strategy for cross-validation [48]. When evaluating the performance in one scene, the model is trained using the samples from all other scenes in the dataset. This process repeats until all the scenes have been tested. The proposed method has been trained and tested 21 times in this study to obtain the overall accuracy.
3. Method
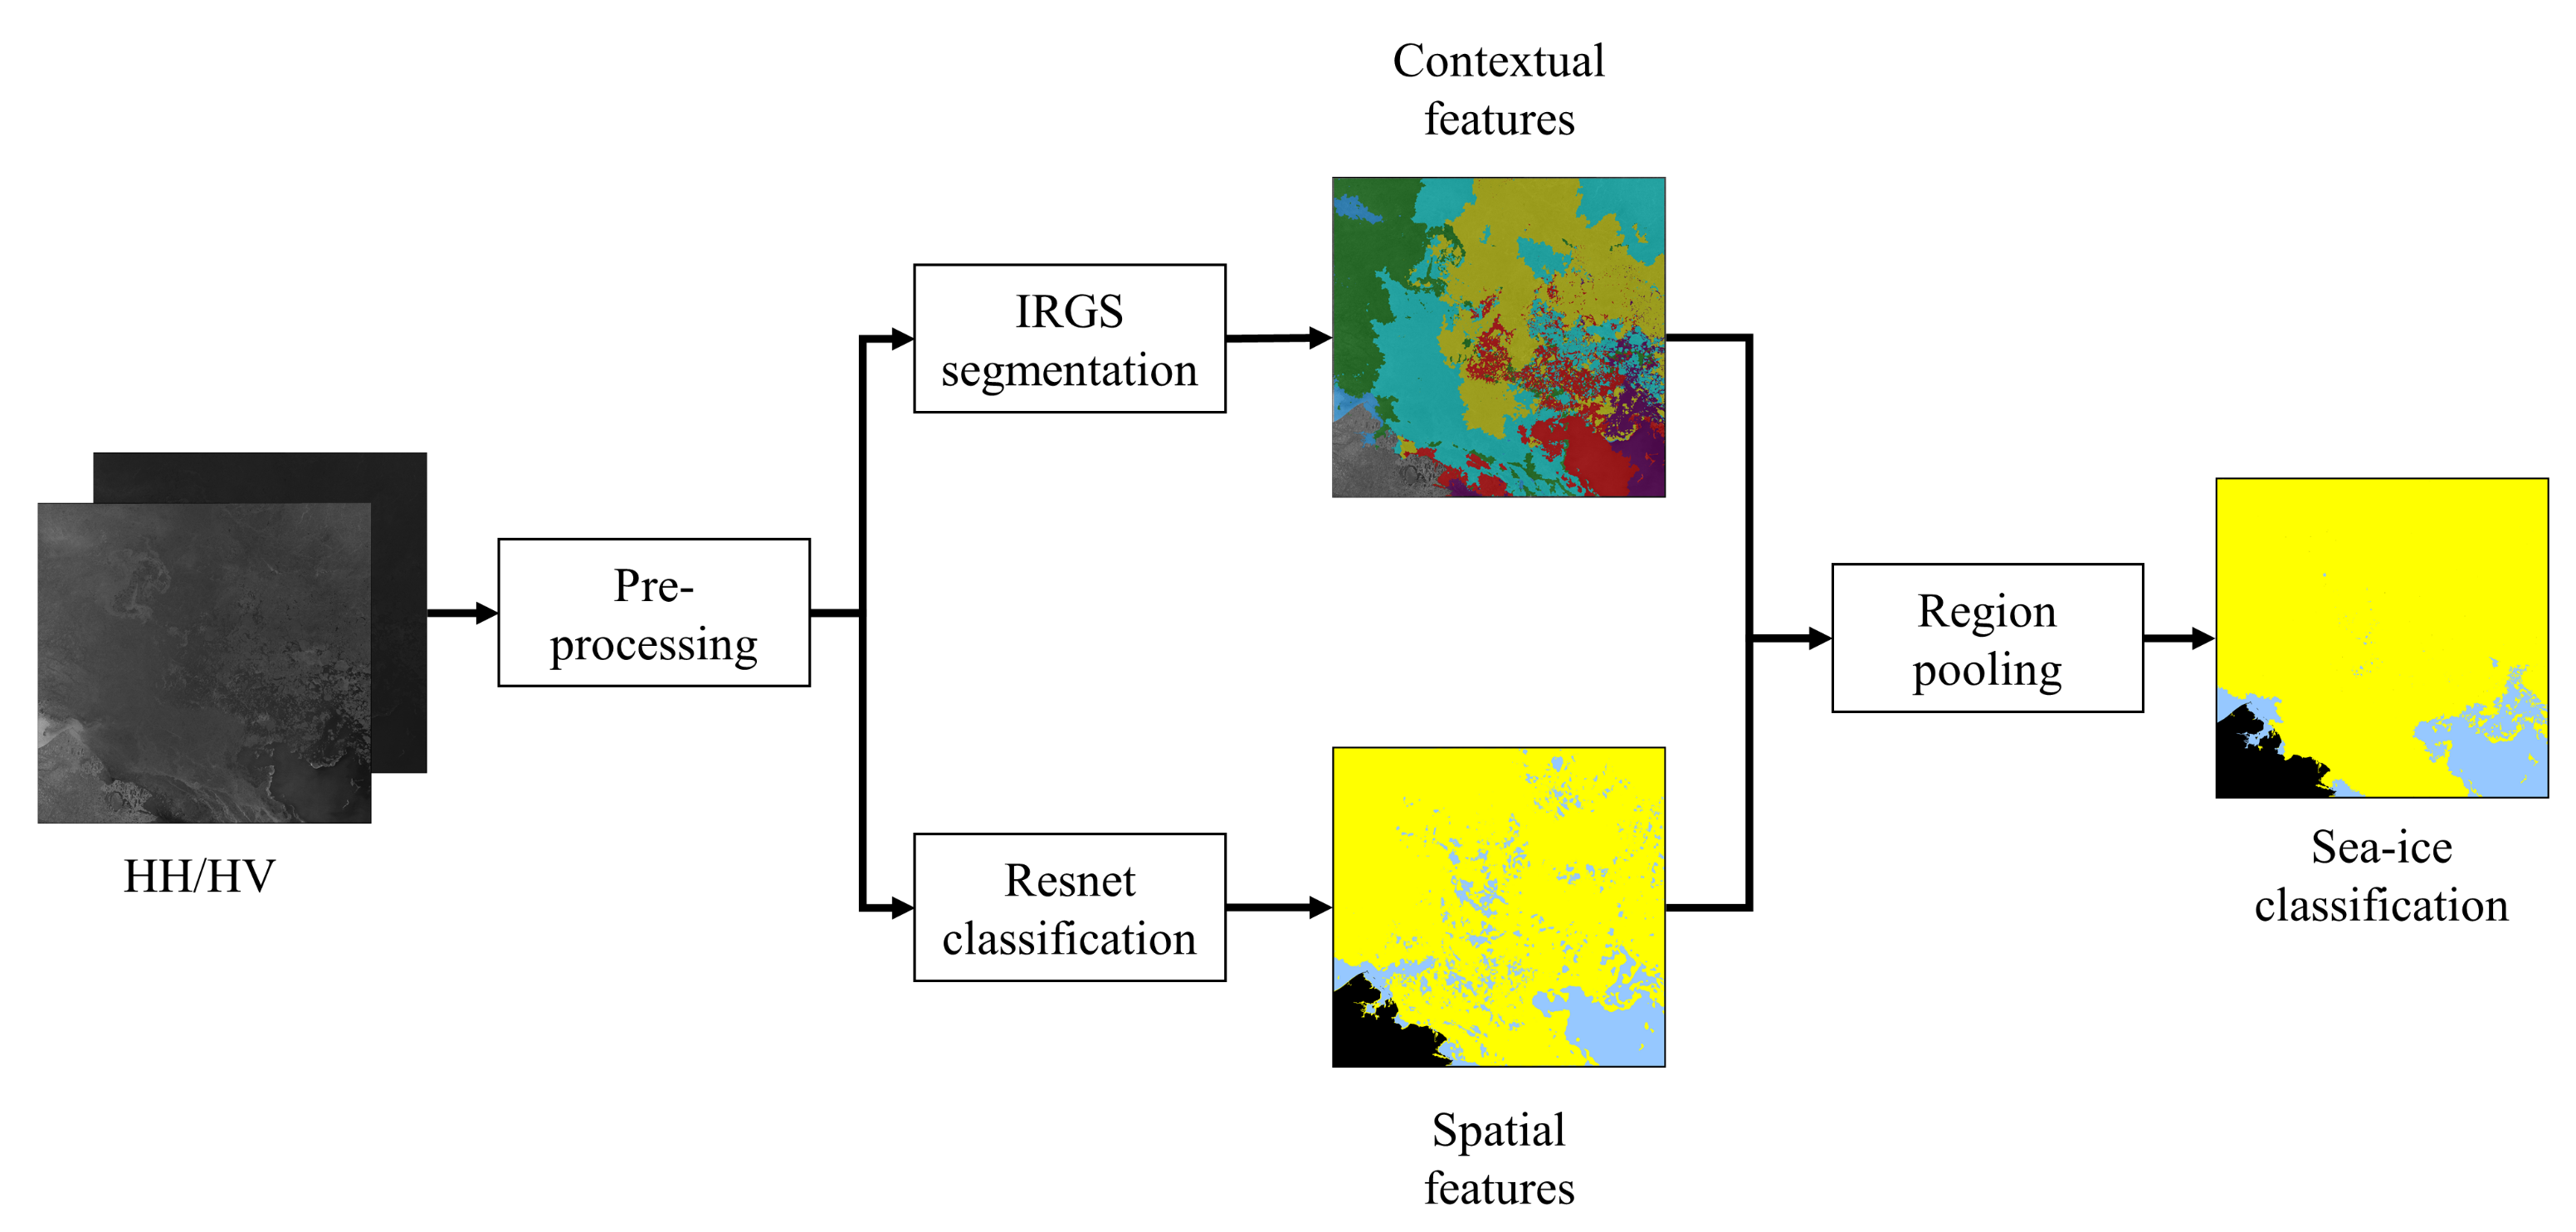
The architecture of the proposed sea ice classification model consists of two main parts, the iterative region growing with semantics (IRGS) segmentation and ResNet labeling. Figure 4 shows the framework of the model, which is named as IRGS-ResNet. The input HH and HV images are first processed for radiometric calibration and down-sampling. Then, the contextual information is extracted by IRGS using the pre-processed images, while the spatial features are learned by ResNet. Finally, the contextual and spatial information are combined based on a novel regional pooling layer.
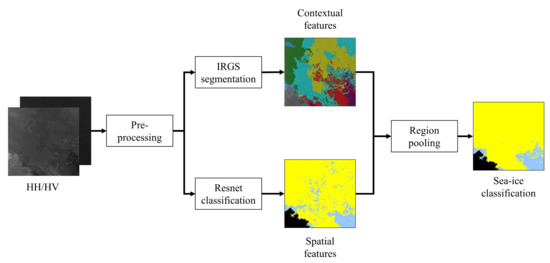
Figure 4.
Flow diagram of the proposed IRGS-ResNet for sea ice classification method in this study.
3.1. Unsupervised Model for Segmentation
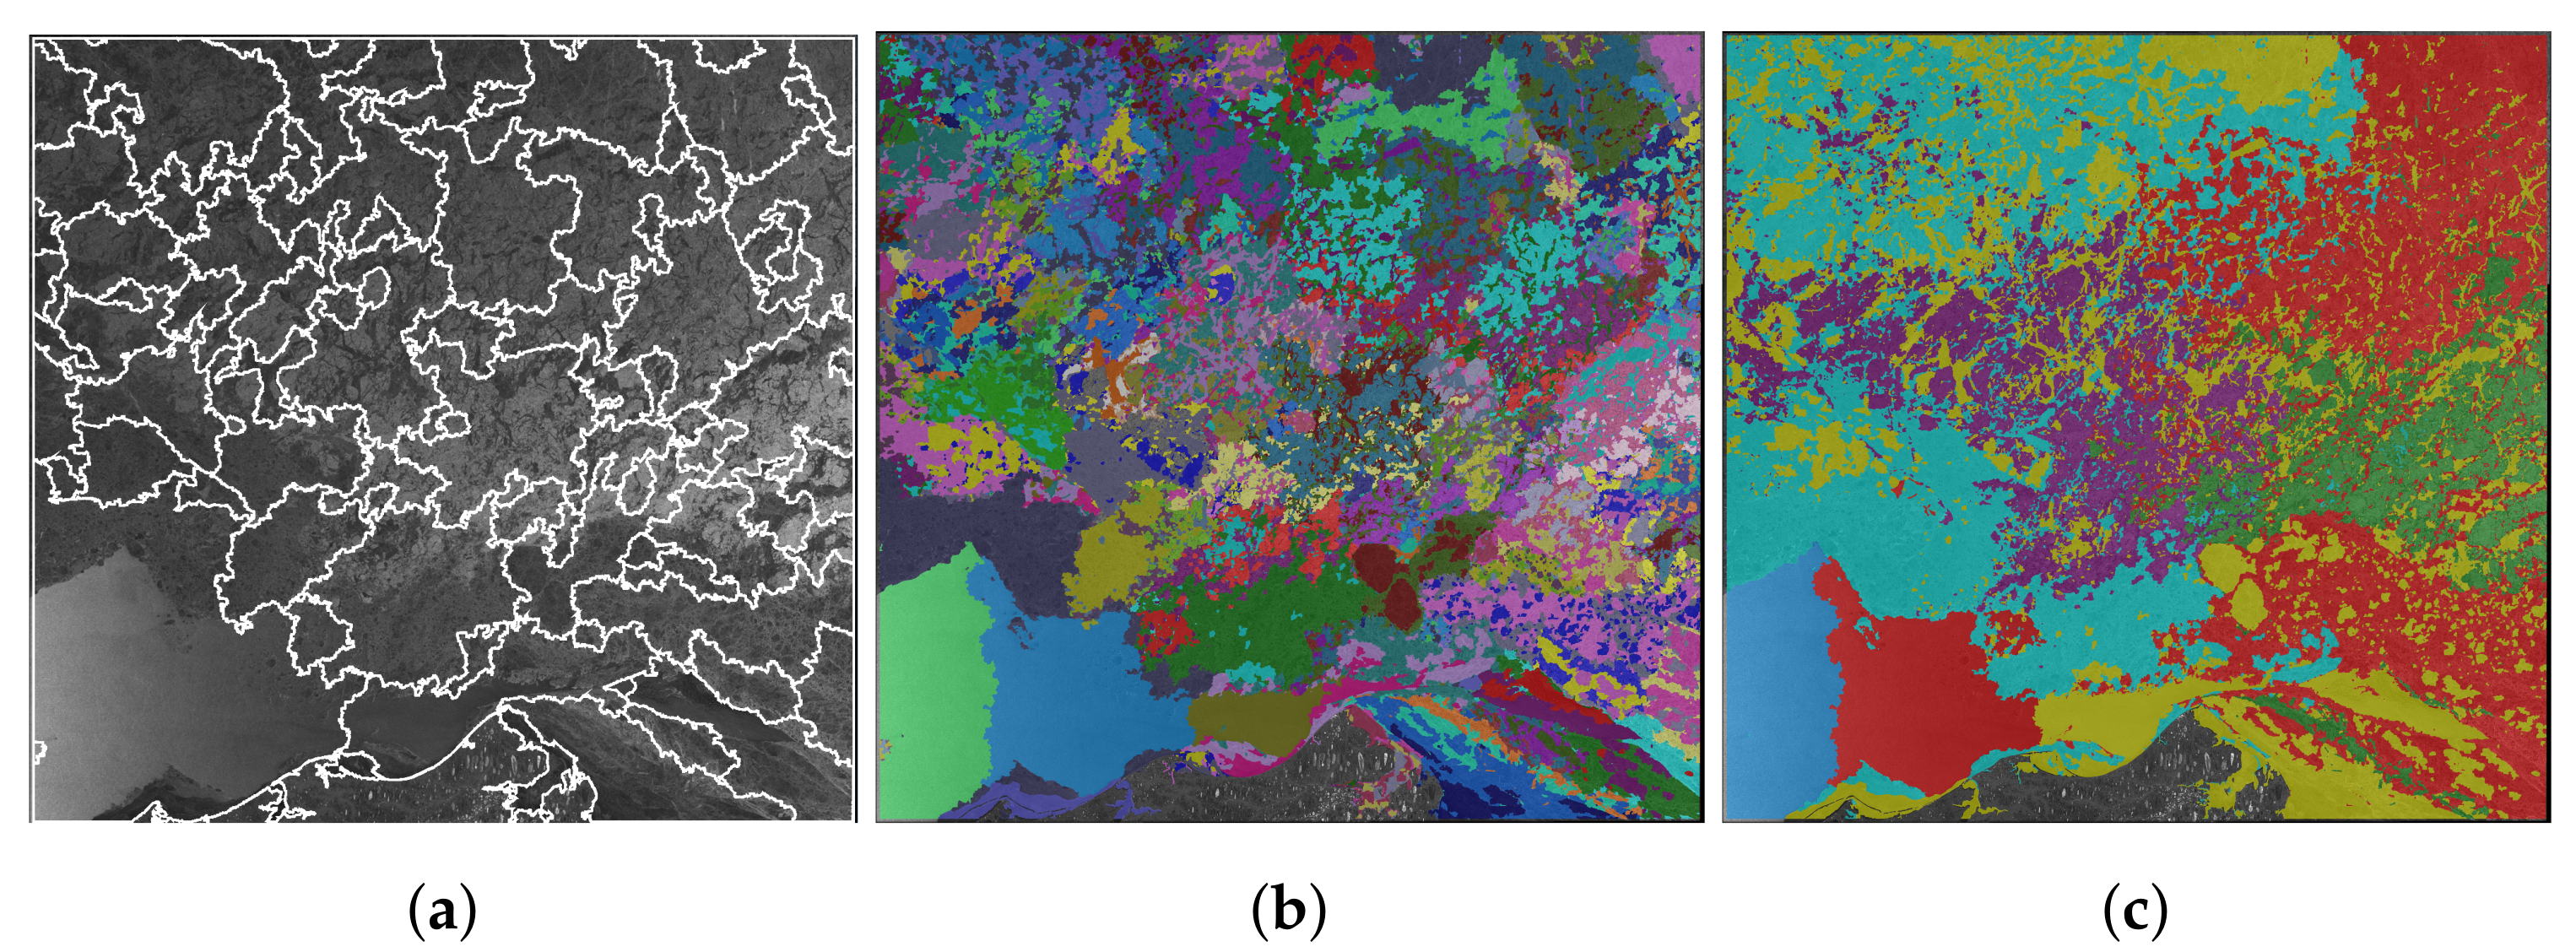
Markov random fields (MRFs) and conditional random fields (CRFs) are popular image segmentation methods because of their ability to model contextual information. The IRGS algorithm, which is based on an MRF, is developed to provide a reliable segmentation approach for remote sensing imagery. In this study, we apply IRGS with a strategy called ‘glocal’ [41] to learn contextual information and preserve ice–water boundaries. Figure 5 shows the essential steps of IRGS. The first step is oversegmenting the scene. Since HV images have a lower signal-to-noise ratio and are less sensitive to incidence angle variant compared with HH images, only HV images involve this step. First, 144 seeds are set in the center of each grid of a 12-by-12 grid net. A watershed algorithm segments the image based on the seeds. The regions in the segmentation result shown in Figure 5a are named as autopolygons. Then, a modified watershed algorithm is applied to oversegment the autopolygons. A region adjacent graph (RAG) is constructed on the segmentation in an autopolygon. The RAG is designed to minimize the following energy function:
where is the unary potential and is the pairwise potential in the MRF models. In IRGS, represents Gaussian statistics for regions generated by the initial watershed segmentation, while accounts for edge strength between cliques (connected regions). Figure 5b depicts the the result of this step. Afterward, a RAG built on the whole scene minimizes the energy function again to produce the final segmentation result, which is shown in Figure 5c. Since the energy function is minimized locally (in each auto) first and then globally (the whole scene), this segmentation strategy is called “glocal”.
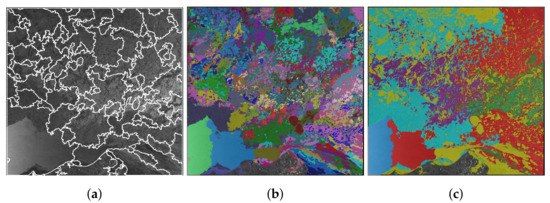
Figure 5.
Steps of IRGS using the glocal strategy for the scene from 24 May 2010 (scene ID 20100524_034756). (a) Autopolygons overlays on the HH scene. (b) Local segmentation result. (c) Glocal segmentation result.
3.2. Deep Learning Model for Labeling
3.3. Framework of Ice–Water Classification
A typical CNN consists of the input layer, hidden layer(s), and output layer [49]. The output of each layer is the input of the next layer for both forward and backward propagation. Unlike conventional artificial neural networks, CNN has multiple hidden layers, including convolutional (ConV) layers, activation layers, pooling layers, and fully connected (FC) layers. The convolutional layers extract features from the input using multiple kernels of different sizes. Then, the learned features pass through activation and pooling layers for non-linearization and compression. The fully connected layer maps all learned high-level features to sample space before the final classification.
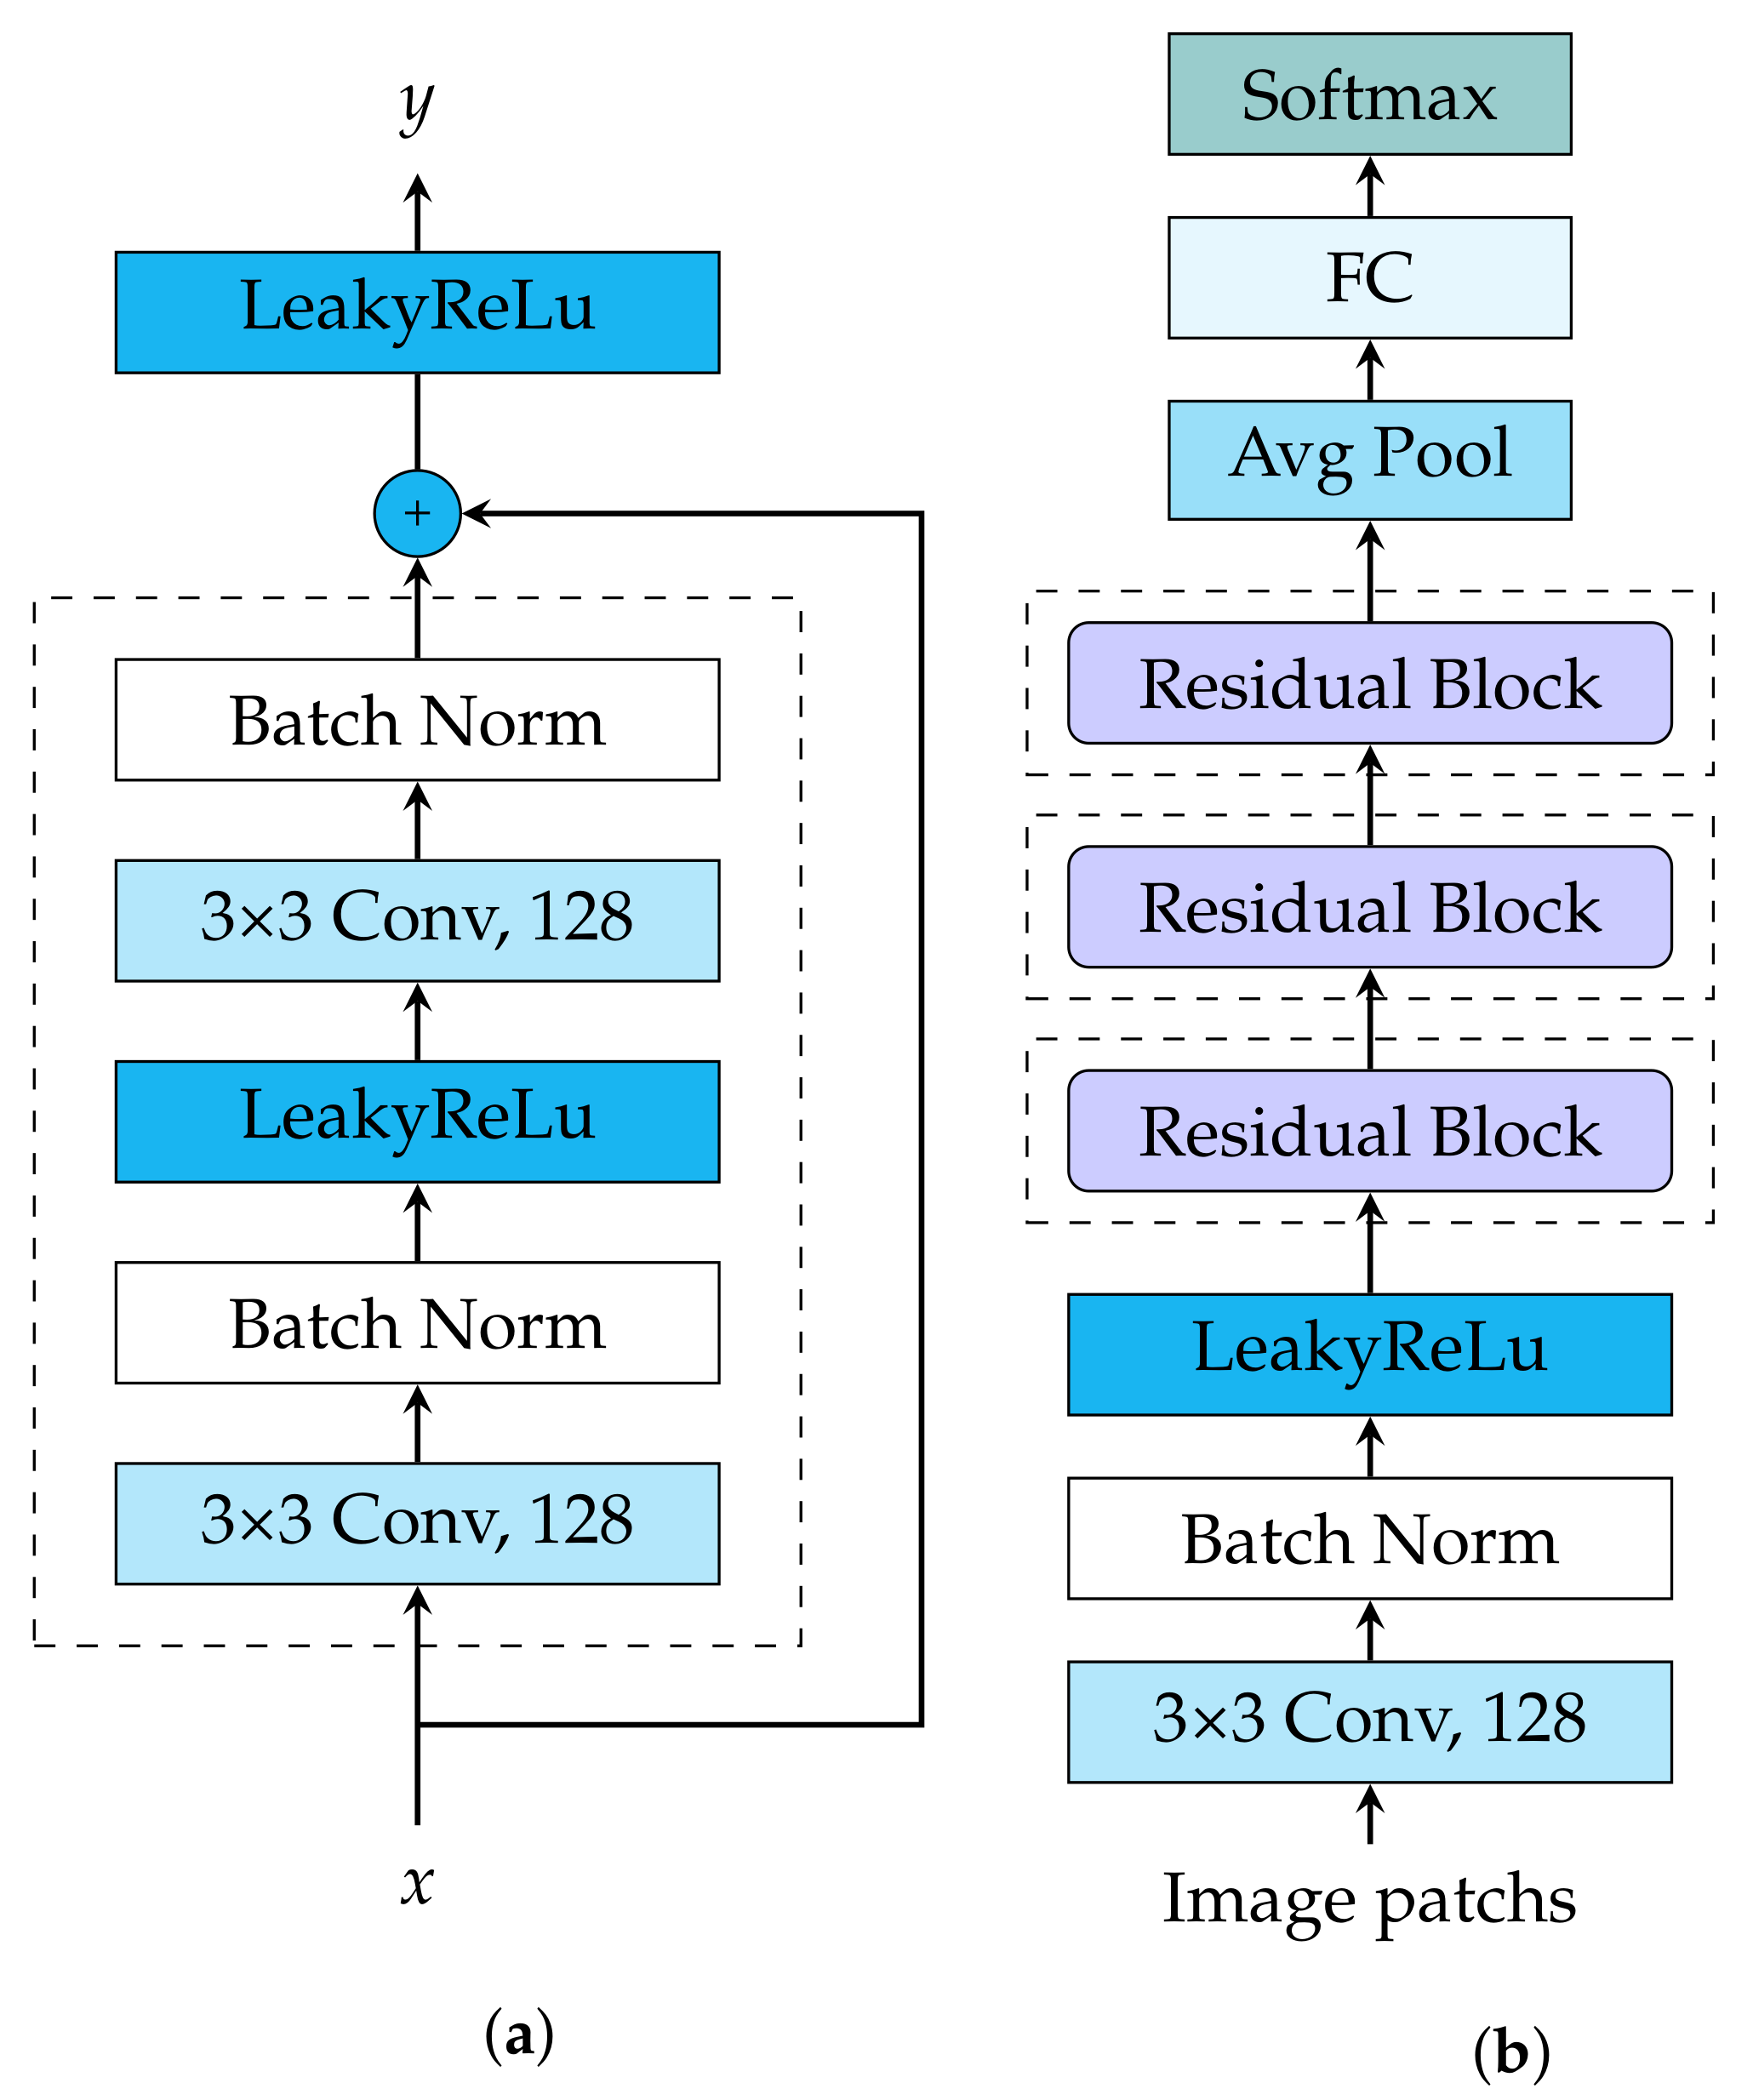
However, as the network’s depth goes deeper, the gradients might accumulate in backpropagation, leading to extensive updates to the weights, causing an unstable network. This phenomenon is called exploding gradient. Similarly, if the gradients become smaller in back propagation, it will approach zero eventually, and the model cannot converge to global optimal. This occurrence is called exploding gradient. To resolve these degradation problems in CNN, ResNet was developed by introducing residual block [50]. Figure 6 shows the architecture of ResNet used in this study, which consists of 8 layers. All convolutional layers in the model share the same hyper-parameters: the kernel size is , the stride is 1, and the number of kernels is 128. Batch normalization (BN) [51] is deployed in each layer after the convolution operation to normalize the output and improve the training efficiency. According to the empirical results reported by the study [52], a leaky rectified linear unit (Leaky ReLu) with is selected as the activation function for our model.
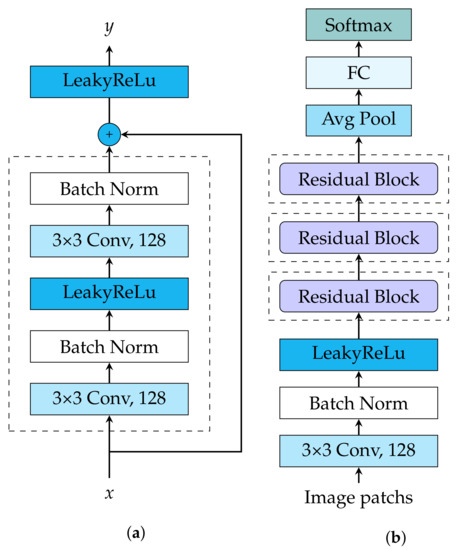
Figure 6.
(a) A residual block. (b) ResNet architecture used in this study.
Three residual blocks follow the initial convolutional layer. As the main characteristic of ResNet models, the identity mapping added by shortcuts in the residual block is depicted in Figure 6a. Let x and y represent the input and output of the block. The residual block is defined as follows:
where and are the convolution operation, learned weights and bias of ith layer. The block has two convolutional layers, and each layer has 128 kernels with the size of . The block requires the channel number of input x is equal to that of , so they can pass the additive layer and send it to the activation function. If the dimensions are not the same, a 1 convolutional layer with the weight of is added on the shortcut to change the dimension of x. The weights of each layer are initialized using the method proposed by He et al. [53]. Adam optimizer [54] is adopted for updating weights. The learning rate, the weight decay, and betas are set as 0.0001, 0, and [0.9, 0.999], respectively.
We select the cross-entropy cost function for the loss function for the model, where it is described follows:
where M is the number of the classes, is the expected output, is the predict output of a softmax layer. Since this study focuses on classifying sea ice and open water, the loss function can be simplified into (5):
3.4. Regional Pooling Layer
By performing IRGS segmentation, each region in the result is treated as a homogeneous unit and contains only one class; however, the regions are only labeled with arbitrary classes. The ResNet model learns the spatial features of the scene and produces classification results. When comparing the segmentation with the classification result, ice–water boundaries are well preserved in the former, while the latter obtained pixel-level labels. To combine the advantages of the two models, we propose an energy function to integrate the results from the segmentation and classification, which is defined as follows:
where R is a homogeneous region in the segmentation result. i and w are pixels with labels of ice and water determined by ResNet, where . represents the number of pixels assigned to ice an represents the number of pixels assigned to water. and are softmax output for i and w.
The energy function is deployed into a regional pooling layer. Y, the label of R, is determined by E. When , , otherwise , and all the pixels in the region are assigned the label Y.
3.5. Comparative Methods
To further evaluate the performance of the proposed model for distinguishing sea ice and open water, we employ two benchmark methods widely used in machine learning studies and two referenced methods specially designed for sea ice classification from published papers for comparison. The two benchmark methods are ResNet, which is also an essential component of IRGS-ResNet, and random forest.
Referenced method 1: Leigh et al. [41] designed and implemented the SVM-IRGS for sea ice–water classification. SVM-IRGS is based on an MRF and adopts pixel labels predicted by SVM to modify the unary potential. A cross-validated feature selection is applied to the original feature set that includes GLCM features, backscattering intensities, and local averages and maximums to reduce over-fitting and improve computational efficiency. The 28 selected features are applied to train the SVM.
Referenced method 2: Hoekstra et al. [55] proposed the IRGS-RF model for distinguishing lake ice and water in SAR imagery. The model first oversegments the scene into homogeneous regions. Then, an RF classifier is used to assign labels to each region. The RF is trained using 162 GLCM features and ten backscattering features.
4. Results and Discussion
In order to evaluate the performance of IRGS-ResNet presented in this study, we compared IRGS-ResNet with RF, ResNet, SVM-IRGS, and IRGS-R. The experiments were assessed with accuracy for each scene in the dataset. The accuracy is defined as follows.
where and are the numbers of true-positive and false-negative samples, and N is the total number of samples. The overall accuracy for each method is calculated using all samples in the dataset.
The experiments were run on a computer with the following configuration: INTEL Core i5-6600K CPU, 32-GB RAM, NVIDIA GeForce GTX 1080 GPU, and Windows 10 operating system. The average training time is 4–5 h under such configuration. It takes 15 min to produce a sea ice map for each SAR scene, in which 2–3 min for segmenting SAR imagery, 10 for predicting pixel-level labels using ResNet, and 2–3 min for regional pooling and producing the final sea ice map.
4.1. Classification Accuracy
ResNet is selected as a benchmark method in this article, and IRGS-ResNet also relies on the spatial information learned by ResNet; therefore, optimizing the ResNet model is essential. We investigate different setups for the ResNet to achieve the best classification accuracy. Overall accuracy is achieved based on the LOO approach, while other accuracies without specific indication are obtained using the whole dataset.
The backscattering in SAR imagery is determined by the dielectric properties and surface roughness of sea ice/water and the backscattering mechanism. HH polarization generally provides more information to describe sea ice types compared with HV polarization; however, HV polarization is less sensitive to speckle noise and is able to classify different ice types [45]; therefore, how the polarization mechanism affects the performance of the deep learning model is investigated in this study. We exploit the different combinations of polarized images as the input of the ResNet model. Image patches extracted on HH, HV, and HH/HV are applied to evaluate the classifier’s performance. Table 3 shows the validation accuracy using an image patch size of . As the results indicate, the HV scene achieves better classification accuracy than the HH scene when the only polarized image is applied. The highest overall accuracy is 98.65%, which is obtained by combining HH and HV polarization for the image patch. Hence, both HH and HV scenes are used as the input of ResNet and IRGS-ResNet in the following experiments.

Table 3.
Overall accuracy of ResNet using different polarization combination, HH, HV, and HH/HV. The patch size is .
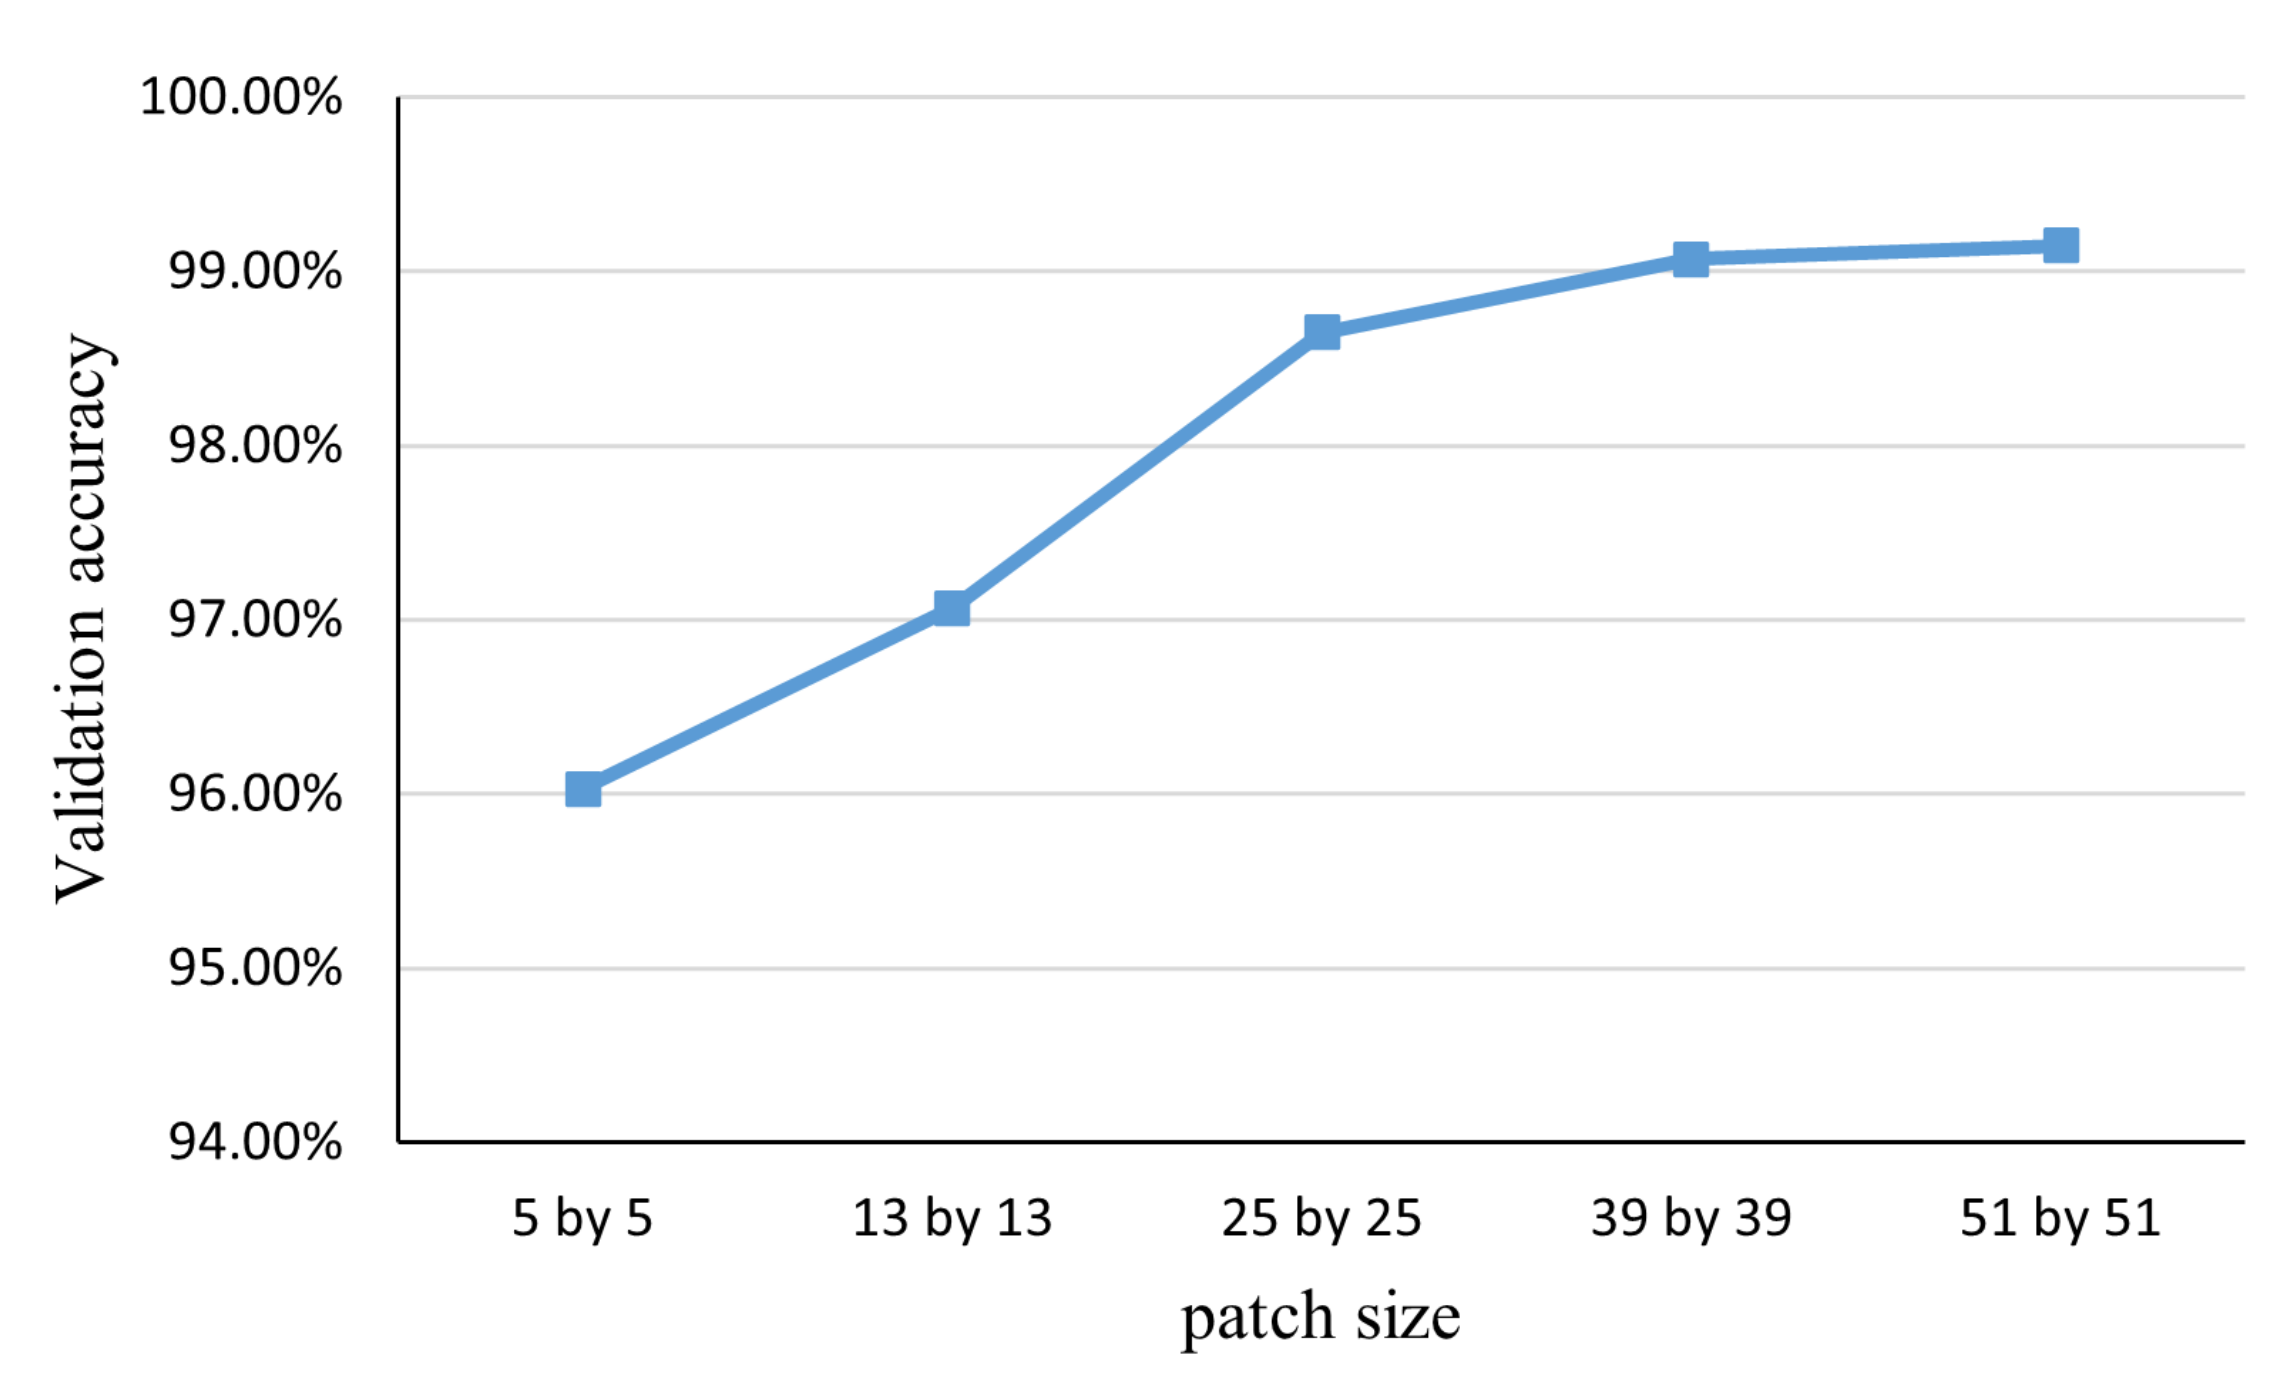
After the architecture of ResNet has been decided, the receptive field of the model is determined by the input patch size. A Large patch size can capture more spatial information that contributes to feature maps than a small one, but it may contain mixed ice types and water that confuse the classifier. We consider using different patch sizes of , , , , and pixels to evaluate the performance of ResNet. Figure 7 shows the validation accuracy using different patch sizes. In general, the accuracy increases with larger patch size; however, the benefit of using the patch size of is limited. First, a patch covers an area of 10,200 by 10,200 m. Such extensive coverage may capture both sea ice and water that would be expected to cause classification errors at the boundaries between different ice types and open water. Moreover, a large patch size requires more computation to process. For example, the patch only improves the accuracy by 0.42% compared with the patch with doubled running time; therefore, after balancing the trade-off between patch size and classification performance, the smaller patches (, , and ) are selected for further comparison.
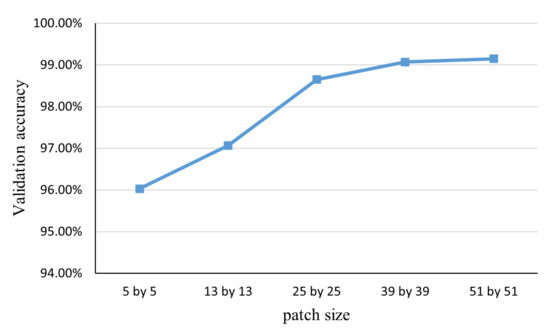
Figure 7.
Validation accuracy using patch size of , , , , and .
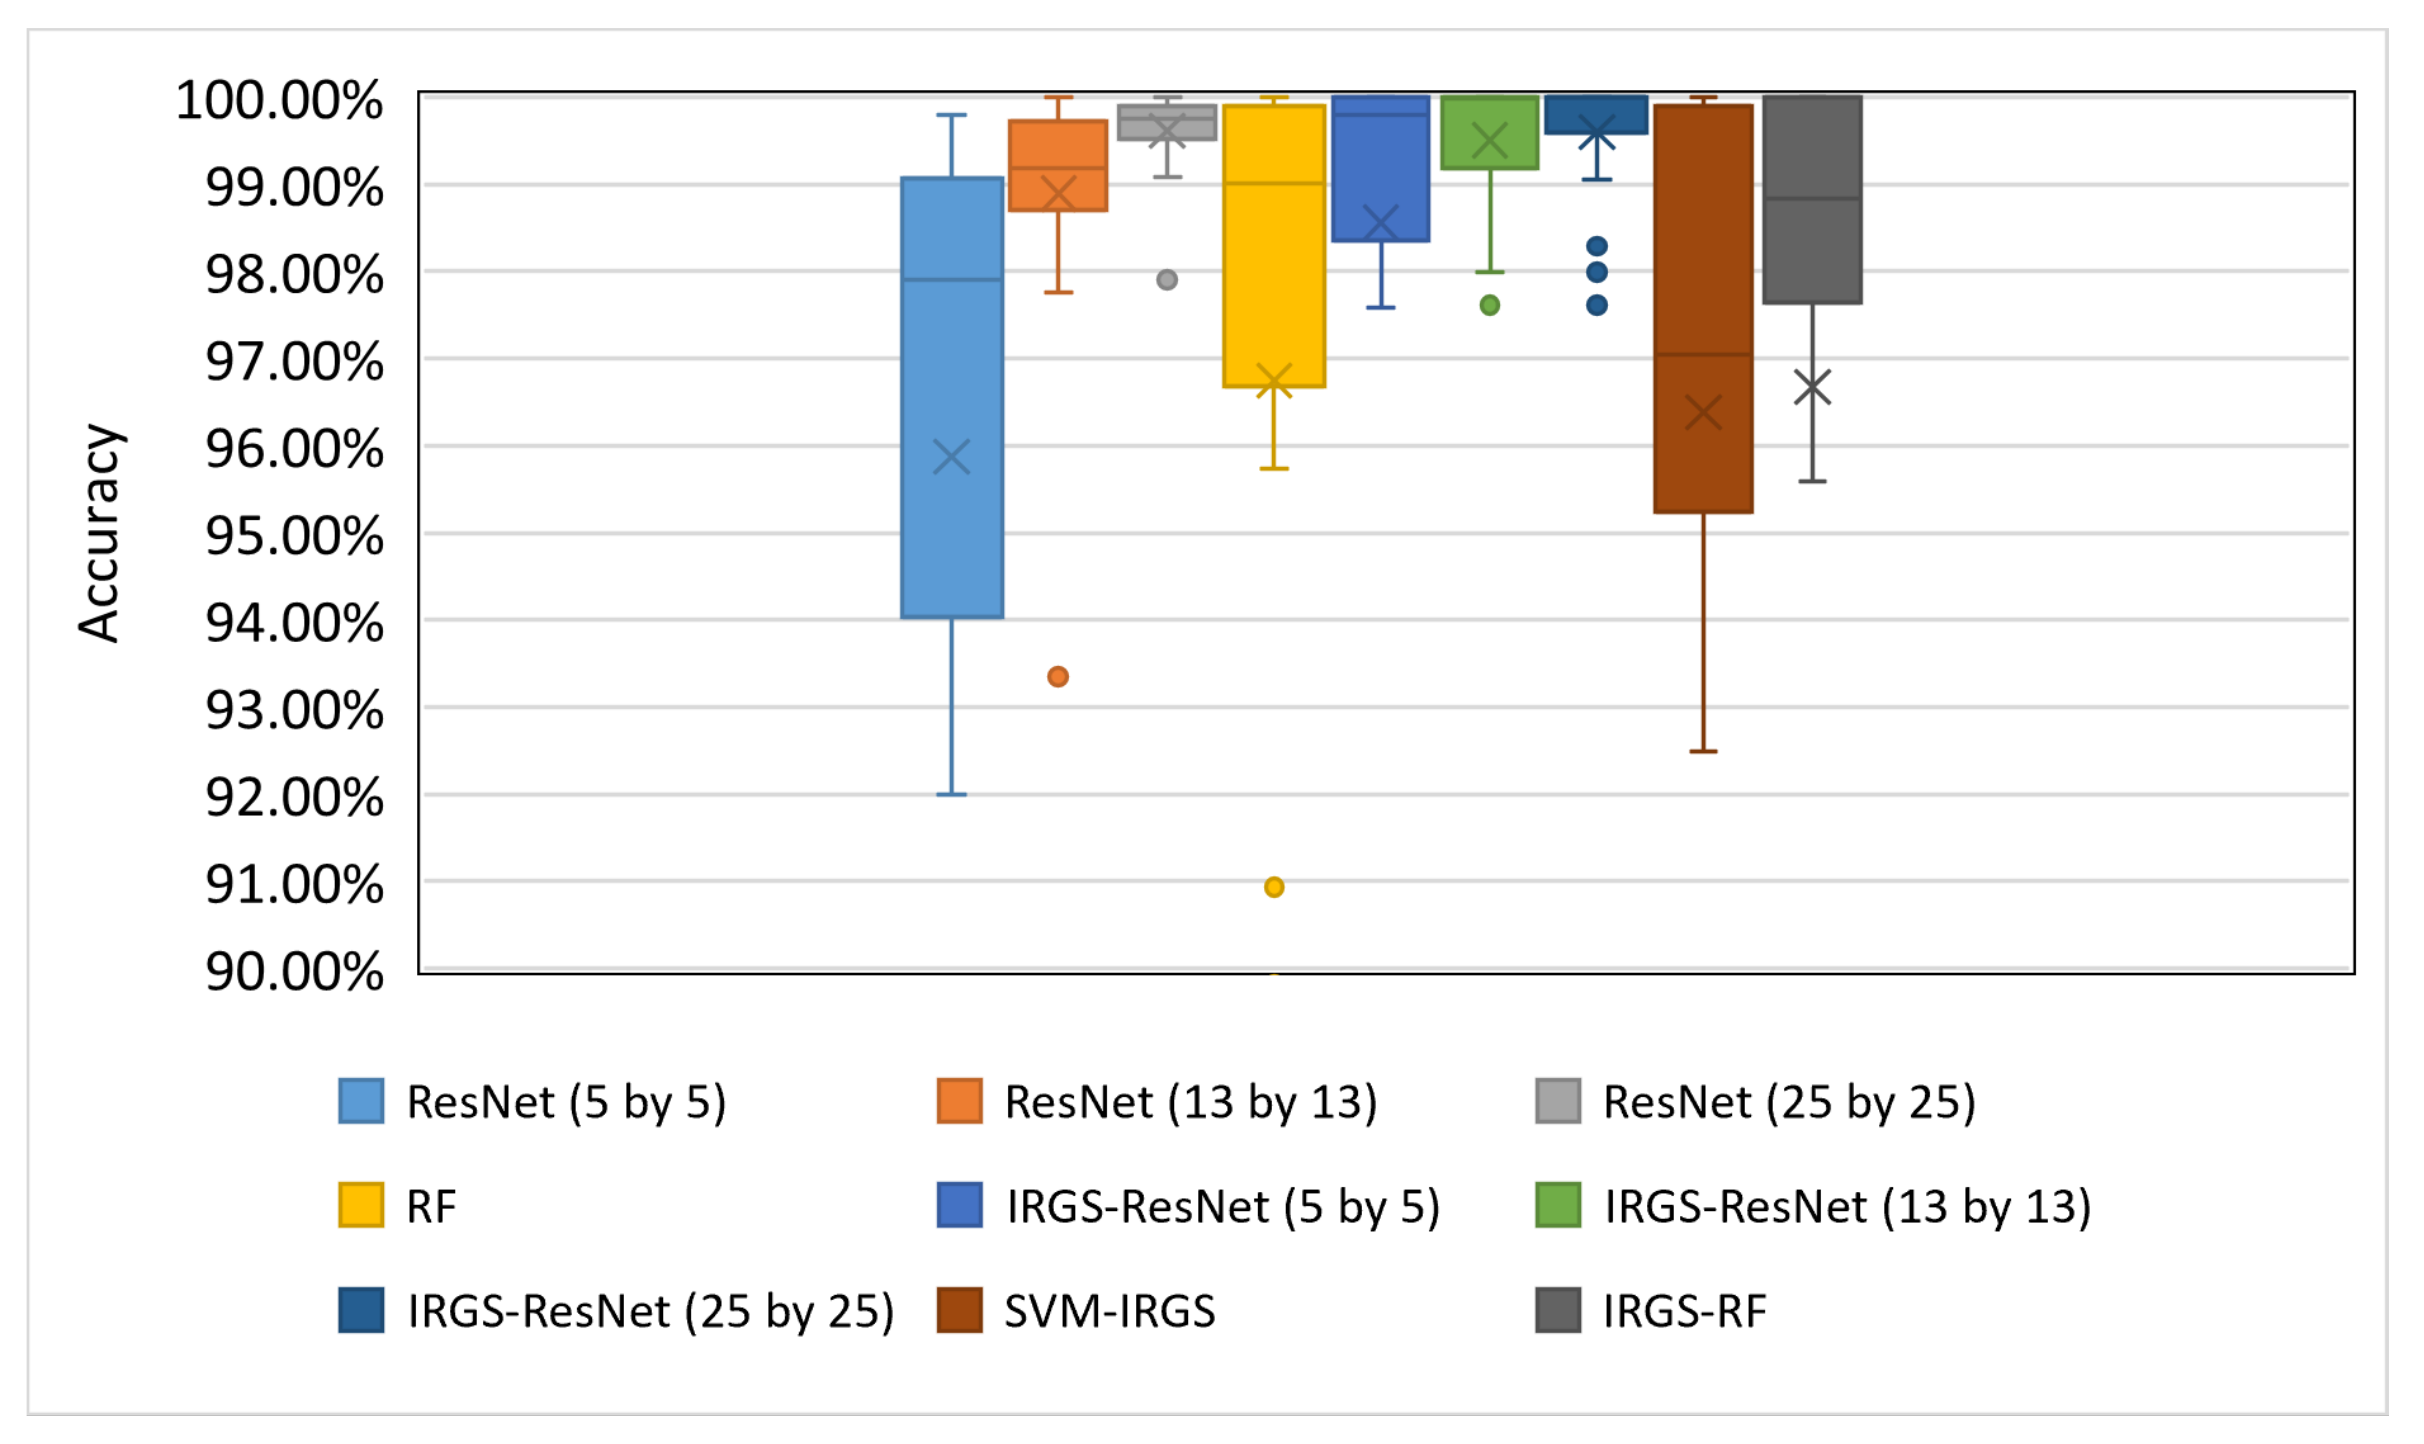
The proposed IRGS-ResNet and comparative methods can be sorted into two categories: single model and combined model. ResNet and RF are pixel-wise classifiers that belong to the single-model category. In contrast, IRGS-ResNet, SVM-IRGS, and IRGS-RF are constructed by using both segmentation and labeling and are defined as combined models. Table 4 shows classification accuracy for each scene and overall accuracy using the aforementioned methods. The highest classification accuracy obtained for each scene is highlighted. If several methods achieve the same highest accuracy, no one will be highlighted for this scene. Among the single-model category, although RF achieves 96.19% accuracy and outperforms ResNet with patch, the overall performance of ResNet has higher accuracy. For example, ResNet using a patch size obtained a surprisingly high accuracy of 99.65%. For more complex models, the classification accuracy of SVM-IRGS and IRGS-RF achieved are consistent with the experimental results reported in the original studies [41,55]. IRGS-ResNets improve the overall accuracy by 1.86%, 0.39%, and 0.02% compared with ResNets using patch size of , , and . Though the improvement accomplished by IRGS-ResNets is not impressive in terms of overall accuracy, the classification results predicted by IRGS-ResNets are the runner-up for classification accuracy consistency among all methods in this study. Figure 8 shows the box and whisker plot of the distribution of classification accuracy obtained by these models for all 21 scenes. ResNet ( patch), RF IRGS-ResNet ( patch), SVM-IRGS, and IRGS-RF struggle with several challenging scenes, while IRGS-ResNets achieve the best classification accuracy with minimum variance.

Table 4.
Classification accuracy for 21 scenes using ResNet (patch size , , and ), RF, IRGS-ResNet (patch size , , and ), SVM-IRGS, and IRGS-RF.
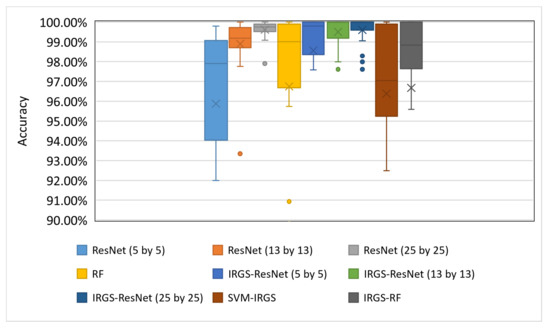
Figure 8.
The distribution of classification accuracy obtained by IRGS-ResNet and comparative methods for all 21 scenes shown in the box plot. Outliers are represented by dots, and “X” is the mean value. Several outliers in ResNet (), RF IRGS-ResNet (), SVM-IRGS, and IRGS-RF are ignored for the layout of the plot.
4.2. Ice–Water Maps
Although the differences in numerical accuracy between IRGS-ResNet and the comparative methods are marginal, the robust performance of the proposed method could not be entirely depicted using the numerical result, which is computed based on limited, high confidence samples. To complement the classification accuracies (based on a small set of samples), it is prudent to assess the results on the entire scene visually.
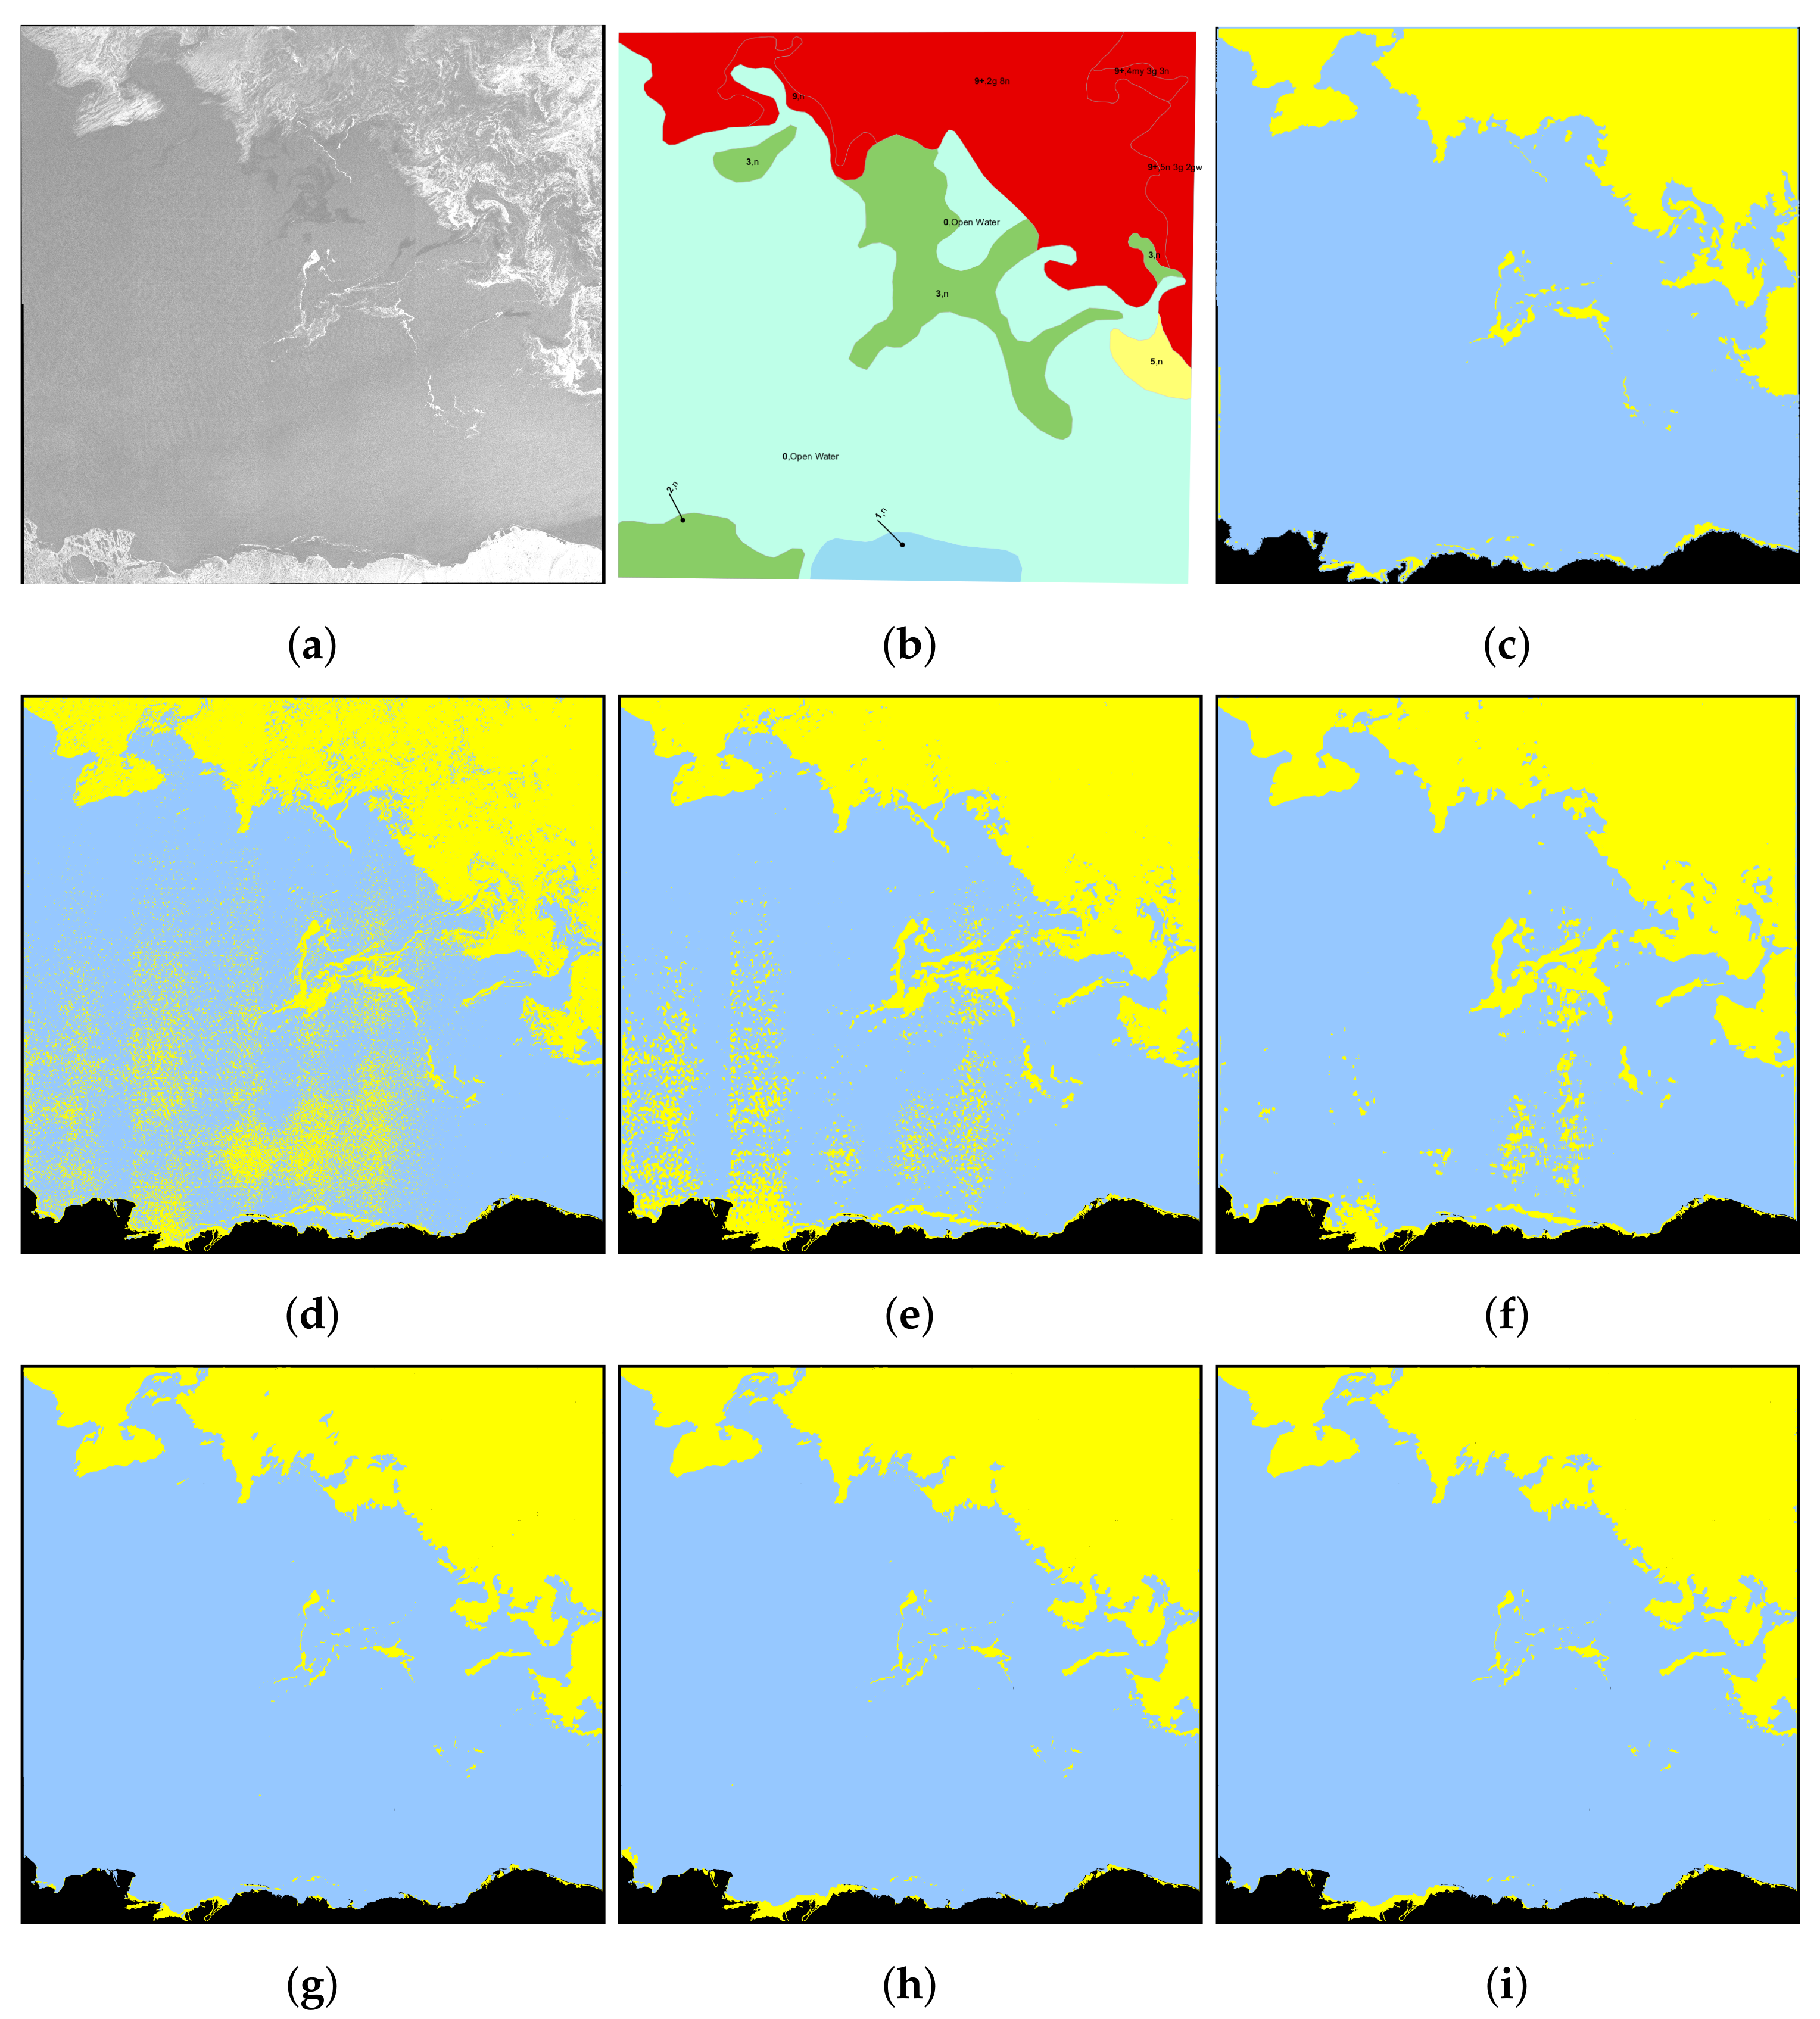
The scene results acquired on 3 October 2010, displayed in Figure 9, deliver a visual example of full scene classification that could be deployed for operational use. The HV image is contaminated by noticeable inter-scan banding, a common artifact presented in SAR imagery captured under ScanSAR mode [56]. Due to the scanning mechanism, the antenna of the SAR system transmits and receives multiple beams to obtain a wide swath under ScanSAR mode; however, the backscattering of these beams is different near the borders between scans due to temporal variants of the antenna pattern. These variants appear on the SAR imagery as inter-scan banding artifacts and cause the inconsistency of backscattering across the whole scene. Figure 9d–f illustrate that all three ResNets have reduced classification accuracy derived from inter-scan banding artifact. The ResNets are confused by the artifacts and misclassified sea ice as open water. With increasing patch size, the negative impact associated with the banding artifact is visually reduced. SVM-IRGS overcomes this problem by combining segmentation with labeling; however, there are still some water errors presenting around the ice–water boundary.
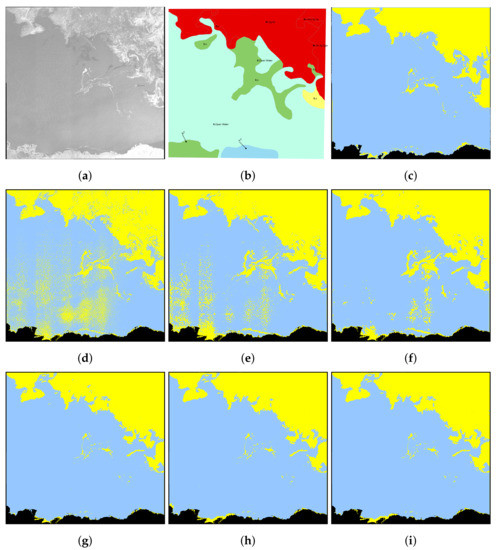
Figure 9.
Classification results of 3 October 2010 (scene ID 20101003_163324. Training). Water (blue), ice (yellow), and land mask (black). (a) HH polarization. (b) Ice chart. (c) SVM-IRGS: 96.65%. (d) ResNet with the patch size 5: 92.87%. (e) ResNet with the patch size 13: 99.10%. (f) ResNet with the patch size 25: 99.63%. (g) IRGS-ResNet with the patch size 5: 99.96%. (h) IRGS-ResNet with the patch size 13: 100.00%. (i) IRGS-ResNet with the patch size 25: 100.00%.
The improvement achieved by IRGS-ResNet is significant. Classification errors associated with the banding artifact are mitigated, and the ice–water boundaries retain the naturally occurring details. Since a patch cannot capture sufficient spatial extent, many water classification errors appear in the top-middle of the scene (Figure 9d). IRGS-ResNets correct these water errors by introducing contextual information learned from IRGS segmentation. The water errors presented in the results of SVM-IRGS are also refined in those of IRGS-ResNets. The highest classification accuracy for this scene is 100.00% achieved by IRGS-ResNet using and patch.
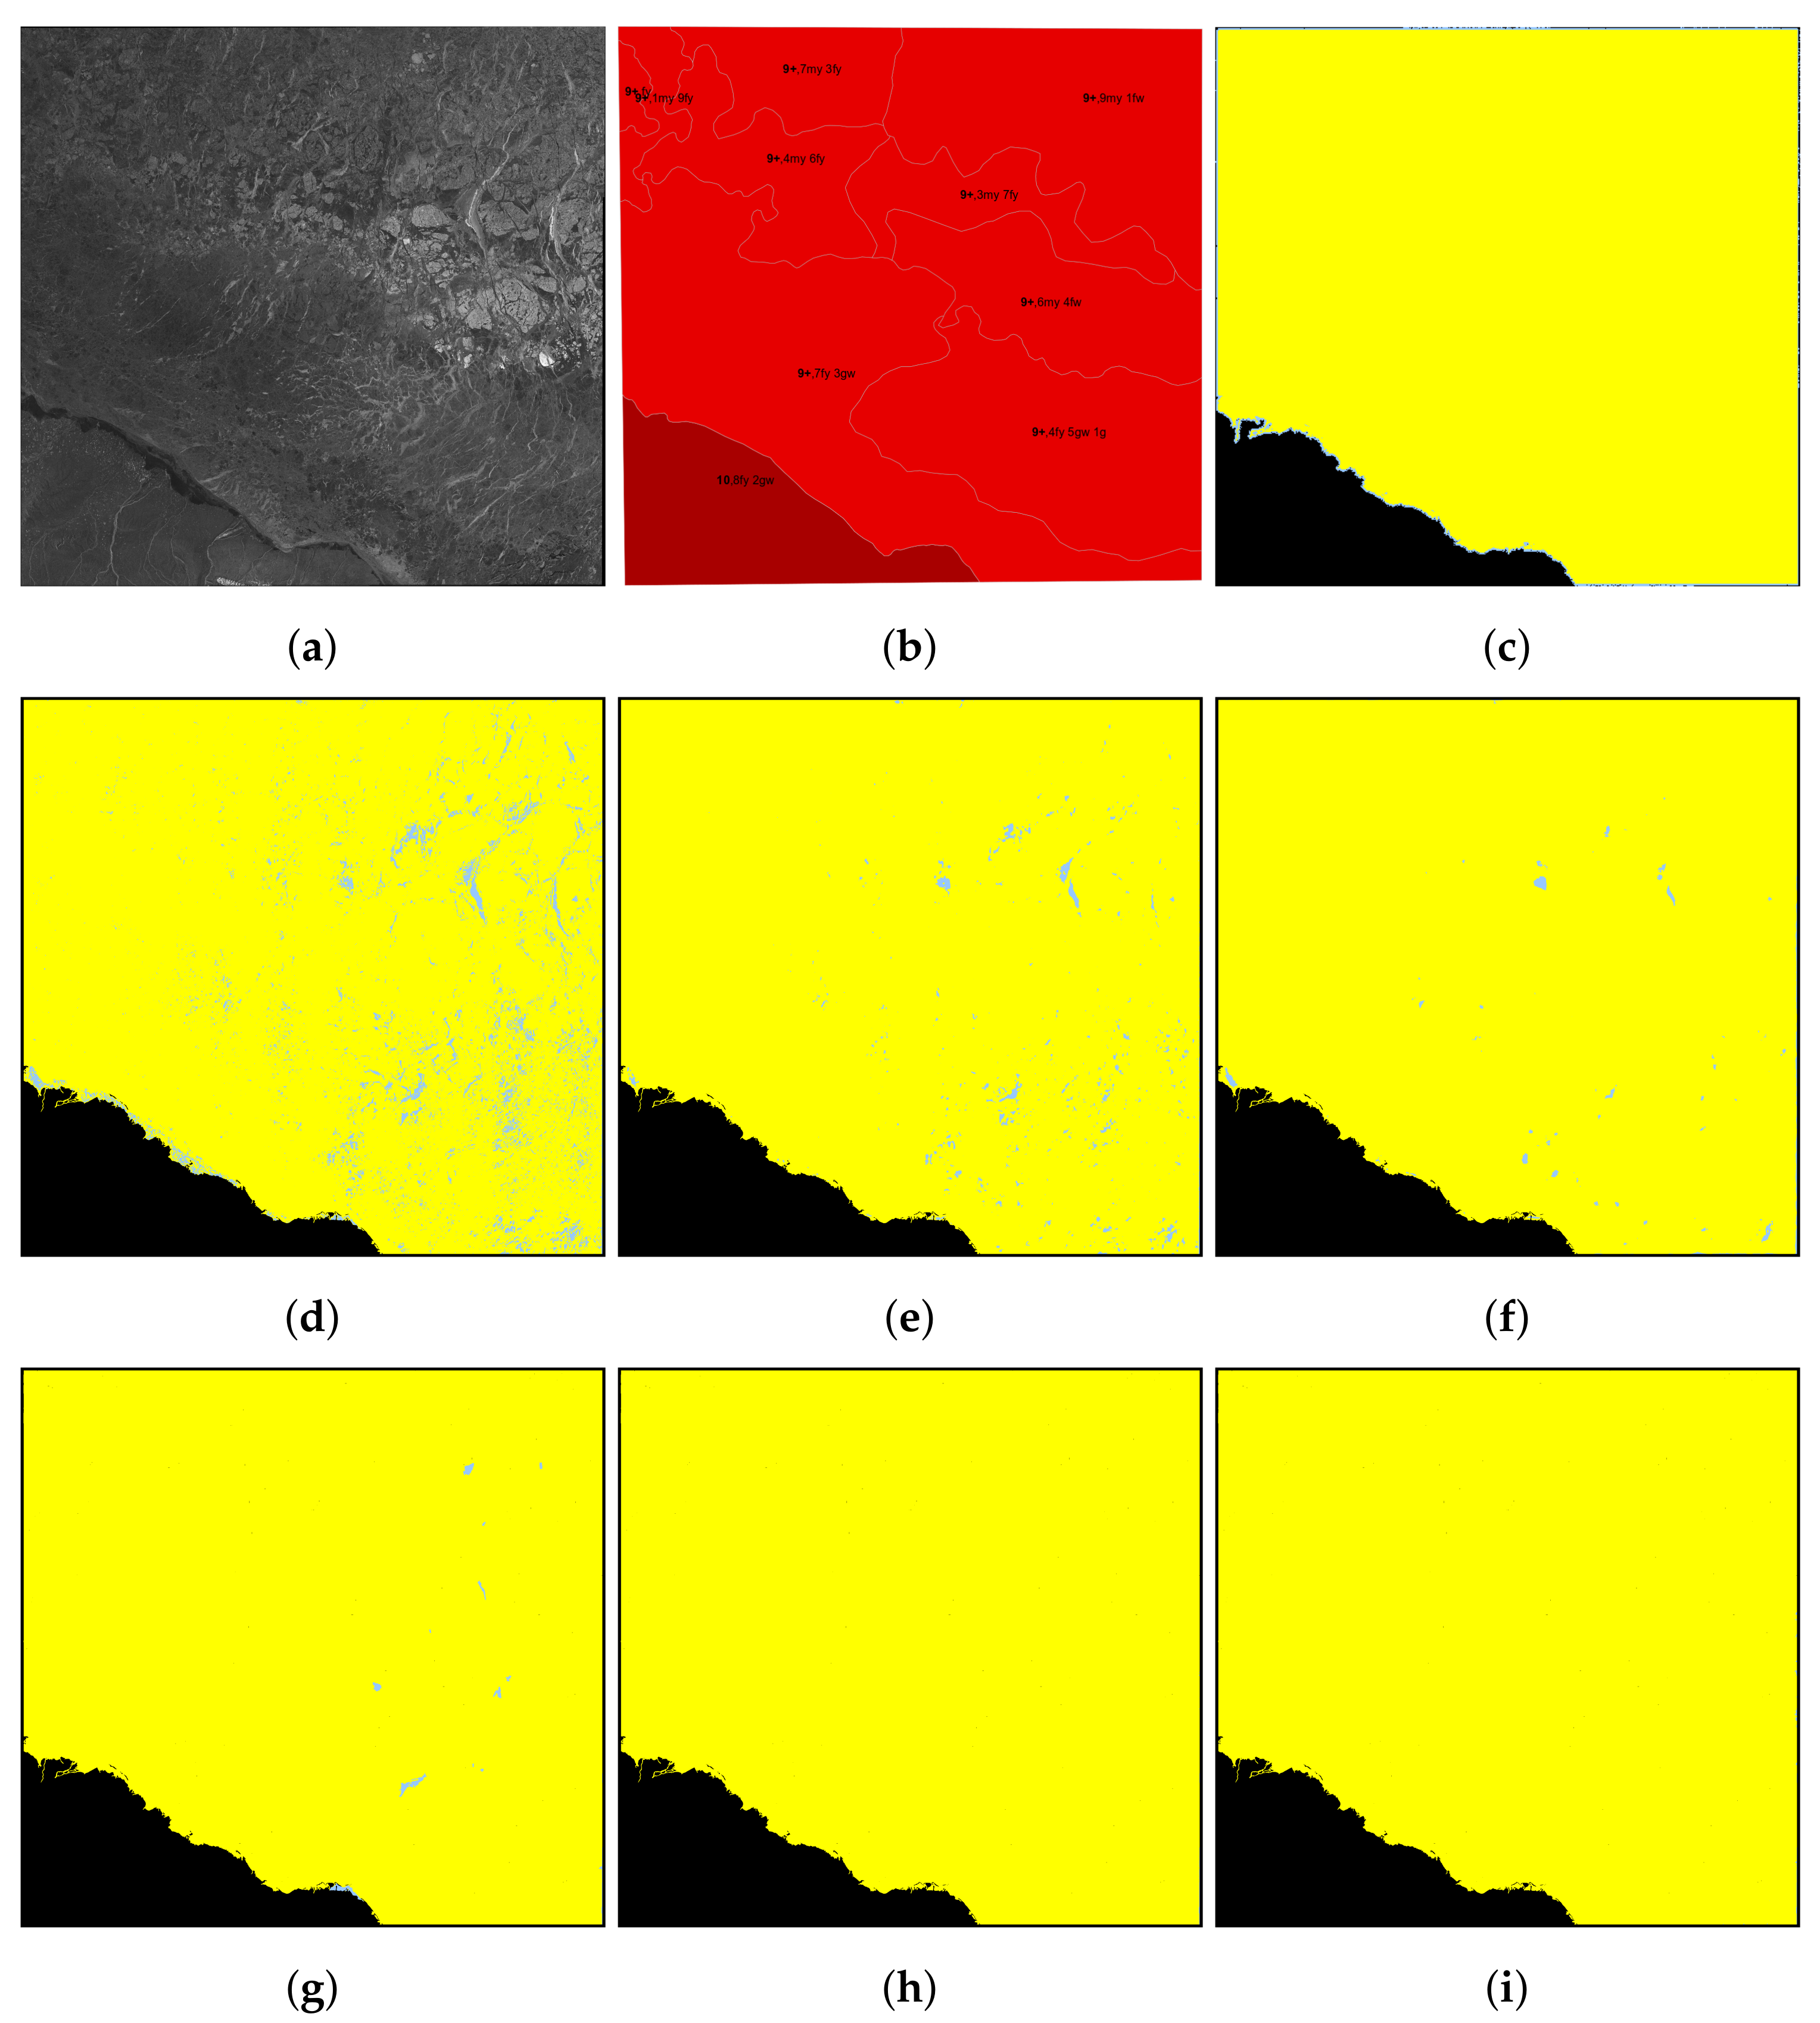
An example from the ice freeze-up season acquired on 14 December 2020 is shown in Figure 10 where only ice and land appear in the scene. Although different ice types, young (grey and grey-white) ice, first-year ice, and multi-year, are presented, this is the least challenging scene in the dataset. Since the scene was captured in December, the ice condition was not stable, and frictions and fissures appeared across the whole scene. ResNets fail to classify the leads containing newly formed sea ice among multi-year ice because the new ice formations have a similar texture to water and their backscatter is lower compared to the surrounding ice. ResNet with a patch size of obtains the lowest accuracy due to the limited spatial extent. As the patch increases, the classification errors are rectified; however, there are still water errors residual in the ice map produced by ResNet with a patch size of . On the contrary, the proposed IRGS-ResNet eliminates all water errors successfully using patch sizes of and . Similar classification results are also obtained in some other scenes, e.g., scene ID 20101120_163324, 20101206_015139.
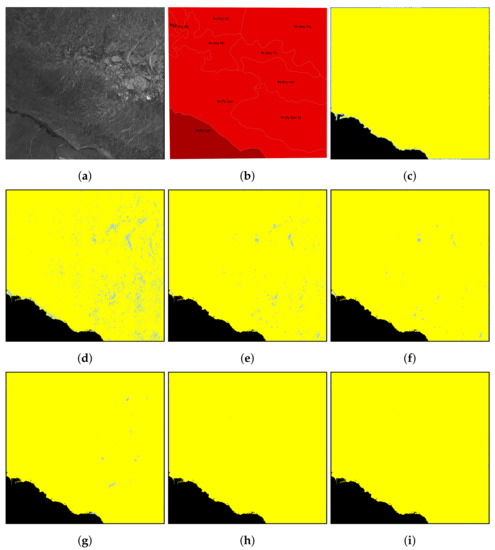
Figure 10.
Classification results of 14 December 2010 (scene ID 20101214_025725). Water (blue), ice (yellow), land mask (black). (a) HH polarization. (b) Ice chart. (c) SVM-IRGS: 100.00%. (d) ResNet with the patch size 5: 95.63%. (e) ResNet with the patch size 13: 99.07%. (f) ResNet with the patch size 25: 99.77%. (g) IRGS-ResNet with the patch size 5: 100.00%. (h) IRGS-ResNet with the patch size 13: 100.00%. (i) IRGS-ResNet with the patch size 25: 100.00%.
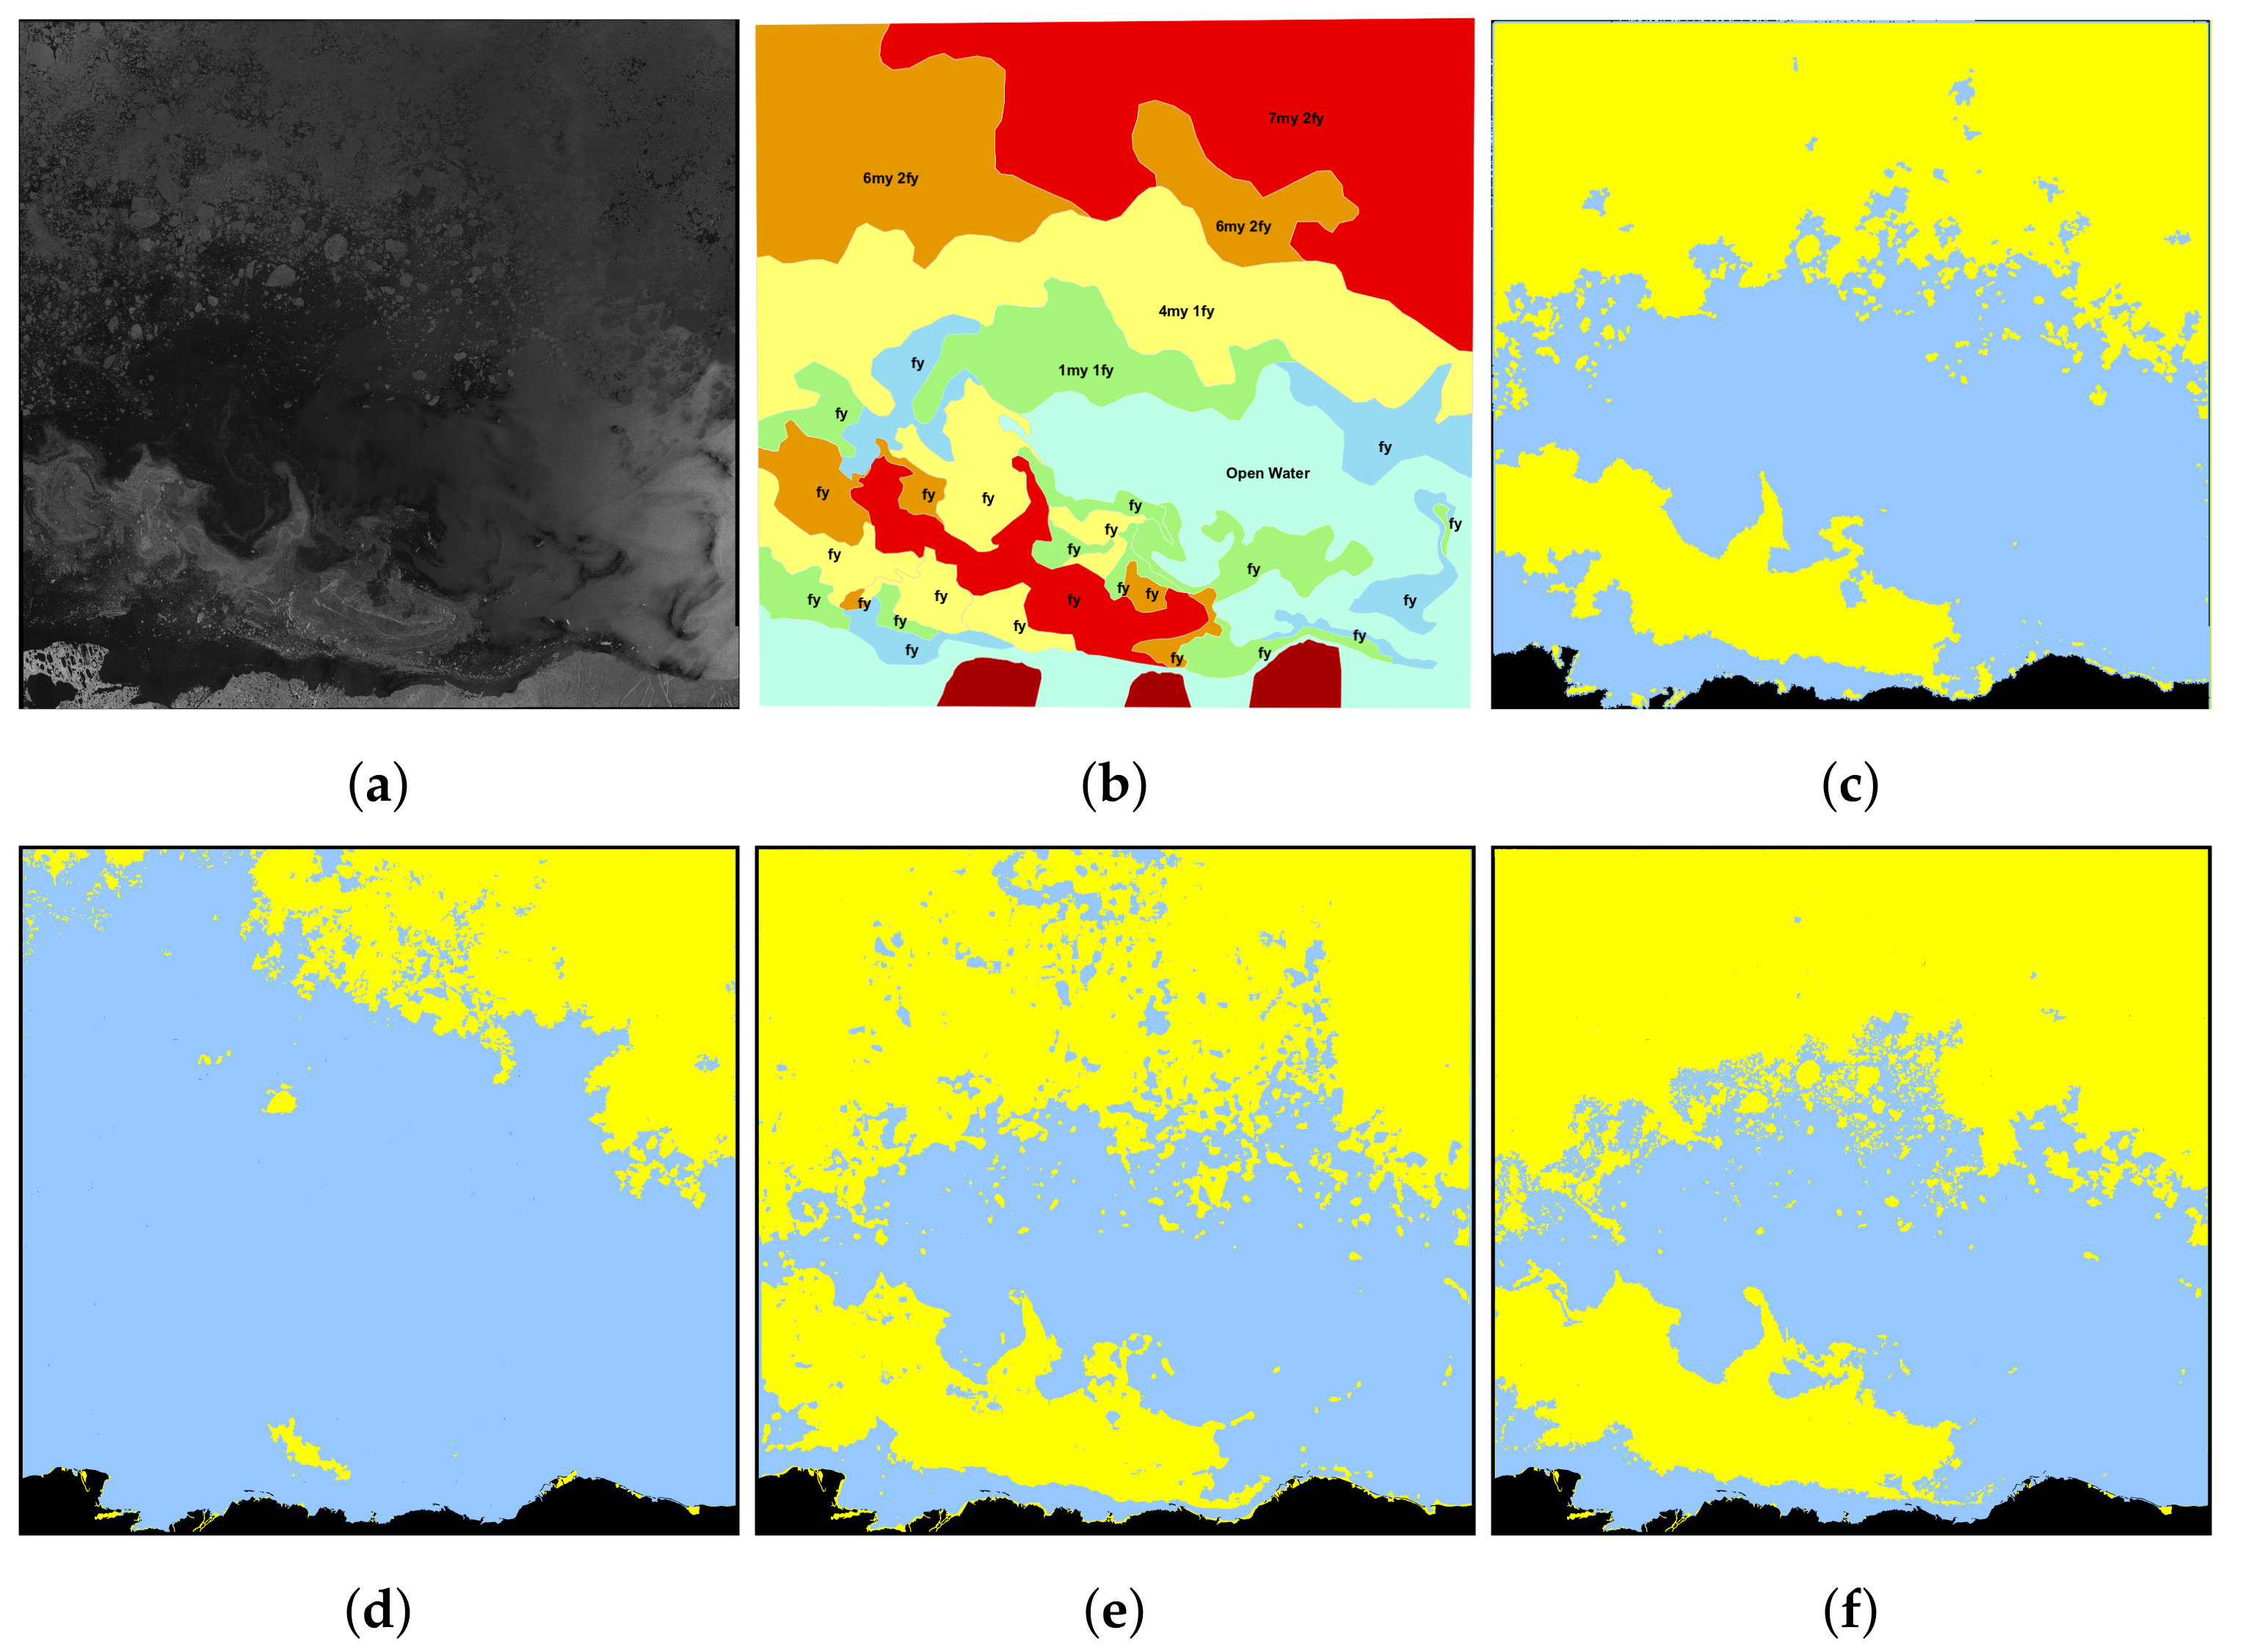
Classifying sea ice during the melt seasons is usually the most challenging time in the life span of sea ice. Figure 11 depicts the classification results of the scene acquired on 30 July 2020. Since the patch size of achieves the best results in both visual interpretation and overall accuracy, only ResNet and IRGS-ResNet using the patch size of are presented in the figure. Both sea ice and open water show significantly inconsistent appearances across the whole scene, posing challenges to classification with high accuracy. The texture of sea ice in the scene is degraded by melting and looks similar to open water; therefore, the multi-year ice presented in the upper left corner is misclassified as open water by IRGS-RF. Again, The IRGS-ResNet is robust to these intra- and inter-class variances and achieves the highest classification accuracy of 100%.
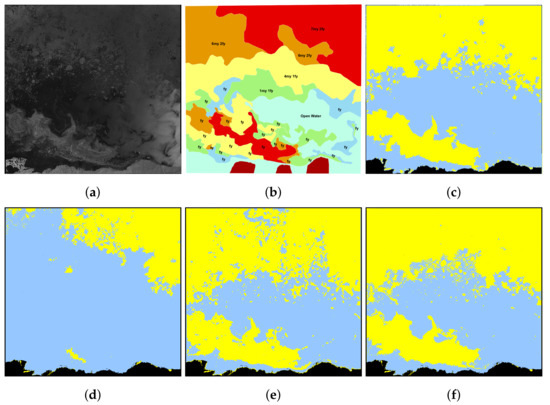
Figure 11.
Classification results of 30 July 2010 (scene ID 20100730_162908. Testing). Water (blue), ice (yellow), land mask (black). (a) HH polarization. (b) Ice chart. (c) SVM-IRGS: 93.05%. (d) IRGS-RF: 73.34%. (e) ResNet with the patch size 25: 99.58%. (f) IRGS-ResNet with the patch size 25: 100.00%.
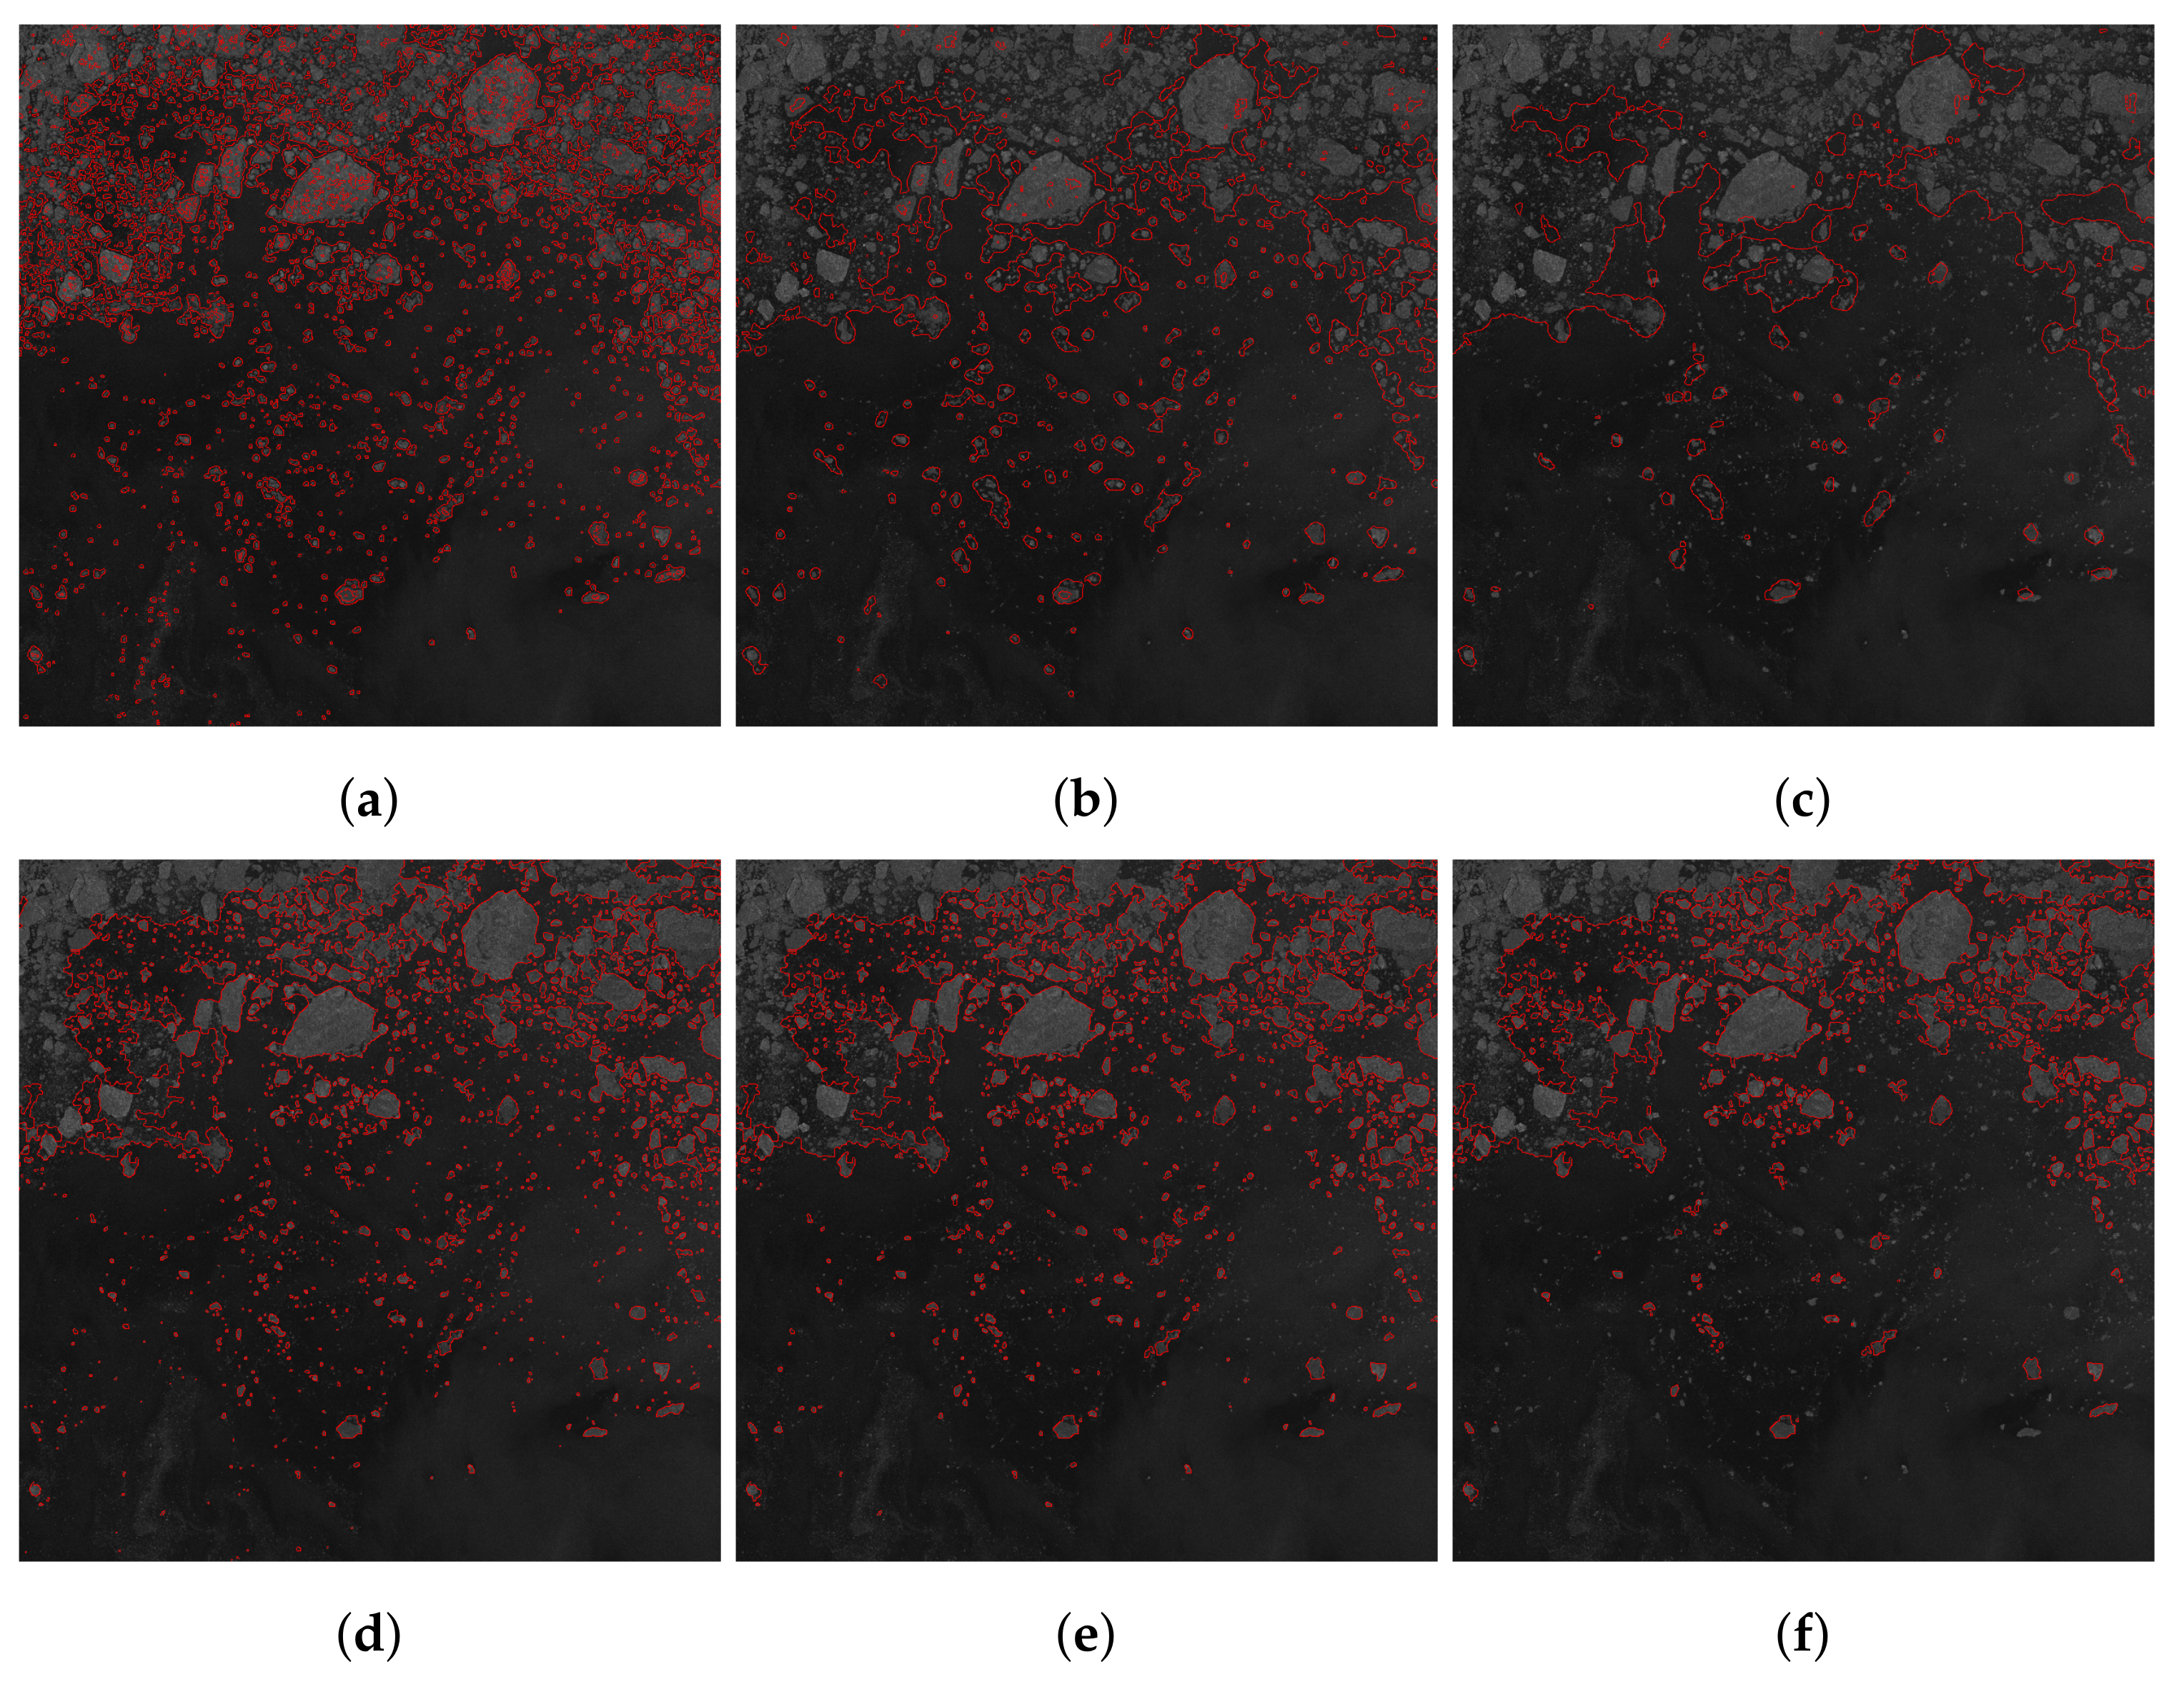
Boundary preservation is also critical for ice–water classification. Figure 12 displays a region of interest extracted from Figure 11, and the boundaries between sea ice and open water are highlighted in red. Although ResNet with a patch size of detects the outlines of big ice floes, numerous water errors appear inside these floes, and noise-like ice errors are also present in open water. As the patch size increases, these classification errors are mitigated, but the boundaries between small ice floes and water are ignored by ResNet. In contrast, the proposed IRGS-ResNet shows consistent performance in detecting ice–water boundaries through different patch sizes.
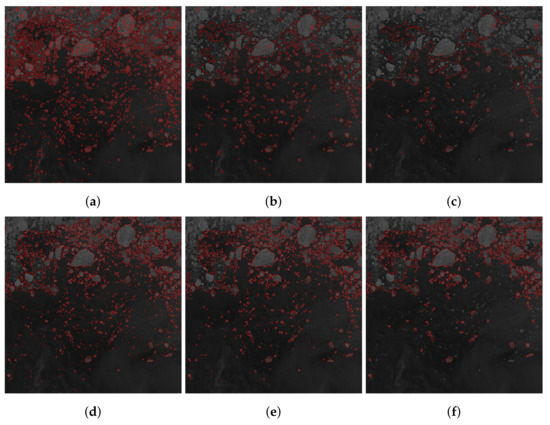
Figure 12.
Highlighted ice–water boundary of 30 July 2010 (scene ID 20100730_162908). (a) ResNet with the patch size 5. (b) ResNet with the patch size 13. (c) ResNet with the patch size 25. (d) IRGS-ResNet with the patch size 5. (e) IRGS-ResNet with the patch size 13. (f) IRGS-ResNet with the patch size 25.
In general, although ice errors caused by the banding artifact and water errors caused by the complex backscattering are observed in the sea ice maps produced by ResNets, the overall accuracy still outperforms the methods for comparison. The proposed IRGS-ResNets achieve the highest classification accuracy of 99.67%. Even though the numerical improvement is neglectable, the contribution of IRGS-ResNet can be demonstrated in generating sea ice maps: the ice–water boundary is refined and the ice and water errors are corrected.
5. Conclusions
The robust and automatic IRGS-ResNet classification method is proposed in this paper to classify sea ice and open water. A regional pooling layer is applied to combine the unsupervised IRGS segmentation and supervised pixel-wise ResNet labeling, both of which are state-of-the-art methods in remote sensing. The performance of the IRGS-ResNet is evaluated on 21 RADARSAT-2 scenes of the Beaufort Sea from 2010 with two benchmark methods and two referenced methods for comparison.
For single-model classifiers, ResNet with the patch size of performs better than others with an overall accuracy of 99.65%. The results indicate that the deep learning model generally outperforms the traditional RF classifier when trained on sufficient labeled data. The classification accuracy achieved by ResNet even surpasses the combined-model SVM-IRGS and IRGS-RF. Based on the impressive performance of the ResNets, the IRGS-ResNets improve the overall accuracy to 99.67% using patch.
Since the numerical accuracy is calculated using limited labeled samples and could not fully demonstrate the performance of the proposed method, the sea ice maps generated by IRGS-ResNet are also assessed by visual analysis. According to visual inspection, the noise-like ice errors caused by inter-scan banding are suppressed, and the ice–water boundaries are refined with natural details. The water errors in ResNet’s results are also ameliorated. In spite of the robust performance achieved by the proposed IRGS-ResNet, some limitations exist. First, the IRGS-ResNet is only tested for ice–water classification due to limited labels of sea ice types. It will be evaluated for distinguishing different sea ice types in future work. Second, only local relation is considered for regional pooling. The global relation between regions should take into account for better classification performance.
Author Contributions
Conceptualization, M.J., D.A.C. and L.X.; Methodology, M.J., D.A.C. and L.X.; Software, M.J., D.A.C. and L.X.; Validation, M.J.; Formal analysis, M.J.; Investigation, M.J.; Resources, D.A.C. and L.X.; Data curation, M.J.; Writing—original draft preparation, M.J.; Writing—review and editing, D.A.C. and L.X.; Visualization, M.J.; Supervision, D.A.C. and L.X.; Project administration, M.J.; Funding acquisition, D.A.C. and L.X. All authors have read and agreed to the published version of the manuscript.
Funding
This research was funded by the Natural Sciences and Engineering Research Council of Canada (NSERC) under Grant RGPIN-2017-04869, Grant DGDND-2017-00078, Grant RGPAS2017-50794, and Grant RGPIN-2019-06744.
Data Availability Statement
The RADARSAT-2 dataset used in this article is copyright of MacDonald, Dettwiler and Associates Limited (MDA) and not publicly accessible at this time. However, the authors are discussing with MDA to release the dataset for research purposes.
Acknowledgments
The authors would like to thank MDA for providing the 21-scene RADARSAT images and ice analyst D. Isaacs for providing the corresponding ground truth.
Conflicts of Interest
The authors declare no conflict of interest.
References
- Kwok, R. Arctic sea ice thickness, volume, and multiyear ice coverage: Losses and coupled variability (1958–2018). Environ. Res. Lett. 2018, 13, 105005. [Google Scholar] [CrossRef]
- Bobylev, L.P.; Miles, M.W. Sea Ice in the Arctic Paleoenvironments. In Sea Ice in the Arctic; Springer: Berlin/Heidelberg, Germany, 2020; pp. 9–56. [Google Scholar] [CrossRef]
- Stroeve, J.C.; Serreze, M.C.; Holland, M.M.; Kay, J.E.; Malanik, J.; Barrett, A.P. The Arctic’s rapidly shrinking sea ice cover: A research synthesis. Clim. Chang. 2012, 110, 1005–1027. [Google Scholar] [CrossRef] [Green Version]
- Khon, V.C.; Mokhov, I.; Latif, M.; Semenov, V.A.; Park, W. Perspectives of Northern Sea Route and Northwest Passage in the twenty-first century. Clim. Chang. 2010, 100, 757–768. [Google Scholar] [CrossRef]
- Zakhvatkina, N.; Smirnov, V.; Bychkova, I. Satellite SAR data-based sea ice classification: An overview. Geosciences 2019, 9, 152. [Google Scholar] [CrossRef] [Green Version]
- White, L.; Millard, K.; Banks, S.; Richardson, M.; Pasher, J.; Duffe, J. Moving to the RADARSAT constellation mission: Comparing synthesized compact polarimetry and dual polarimetry data with fully polarimetric RADARSAT-2 data for image classification of peatlands. Remote Sens. 2017, 9, 573. [Google Scholar] [CrossRef] [Green Version]
- De Lisle, D.; Iris, S.; Arsenault, E.; Smyth, J.; Kroupnik, G. RADARSAT Constellation Mission status update. In Proceedings of the EUSAR 2018, 12th European Conference on Synthetic Aperture Radar, Aachen, Germany, 4–7 June 2018; VDE: Berlin, Germany, 2018; pp. 1–5. [Google Scholar]
- Dierking, W. Mapping of Different Sea Ice Regimes Using Images From Sentinel-1 and ALOS Synthetic Aperture Radar. IEEE Trans. Geosci. Remote Sens. 2010, 48, 1045–1058. [Google Scholar] [CrossRef]
- Holland, P.R.; Kwok, R. Wind-driven trends in Antarctic sea-ice drift. Nat. Geosci. 2012, 5, 872–875. [Google Scholar] [CrossRef]
- Anderson, H.S.; Long, D.G. Sea ice mapping method for SeaWinds. IEEE Trans. Geosci. Remote Sens. 2005, 43, 647–657. [Google Scholar] [CrossRef] [Green Version]
- Scheuchl, B.; Caves, R.; Cumming, I.; Staples, G. Automated sea ice classification using spaceborne polarimetric SAR data. IGARSS 2001. Scanning the Present and Resolving the Future. In Proceedings of the IEEE 2001 International Geoscience and Remote Sensing Symposium (Cat. No. 01CH37217), Sydney, Ausralia, 9–13 July 2001; Volume 7, pp. 3117–3119. [Google Scholar] [CrossRef] [Green Version]
- Makynen, M.; Manninen, A.T.; Simila, M.; Karvonen, J.A.; Hallikainen, M.T. Incidence angle dependence of the statistical properties of C-band HH-polarization backscattering signatures of the Baltic Sea ice. IEEE Trans. Geosci. Remote Sens. 2002, 40, 2593–2605. [Google Scholar] [CrossRef]
- Lang, W.; Zhang, P.; Wu, J.; Shen, Y.; Yang, X. Incidence angle correction of SAR sea ice data based on locally linear mapping. IEEE Trans. Geosci. Remote Sens. 2016, 54, 3188–3199. [Google Scholar] [CrossRef]
- Mahmud, M.S.; Geldsetzer, T.; Howell, S.E.; Yackel, J.J.; Nandan, V.; Scharien, R.K. Incidence angle dependence of HH-polarized C-and L-band wintertime backscatter over Arctic sea ice. IEEE Trans. Geosci. Remote Sens. 2018, 56, 6686–6698. [Google Scholar] [CrossRef]
- Gao, F.; Wang, X.; Gao, Y.; Dong, J.; Wang, S. Sea ice change detection in SAR images based on convolutional-wavelet neural networks. IEEE Geosci. Remote Sens. Lett. 2019, 16, 1240–1244. [Google Scholar] [CrossRef]
- Wenbo, W.; Yusong, W.; Xue, D.; Xiaotong, J.; Yida, K.; Xiangli, W. Sea ice classification of SAR image based on wavelet transform and gray level co-occurrence matrix. In Proceedings of the 2015 Fifth International Conference on Instrumentation and Measurement, Computer, Communication and Control (IMCCC), Qinhuangdao, China, 18–20 September 2015; pp. 104–107. [Google Scholar] [CrossRef]
- De Gelis, I.; Colin, A.; Longépé, N. Prediction of categorized Sea Ice Concentration from Sentinel-1 SAR images based on a Fully Convolutional Network. IEEE J. Sel. Top. Appl. Earth Observ. Remote Sens. 2021, 14, 5831–5841. [Google Scholar] [CrossRef]
- Singha, S.; Johansson, M.; Hughes, N.; Hvidegaard, S.M.; Skourup, H. Arctic Sea Ice Characterization Using Spaceborne Fully Polarimetric L-, C-, and X-Band SAR With Validation by Airborne Measurements. IEEE Trans. Geosci. Remote Sens. 2018, 56, 3715–3734. [Google Scholar] [CrossRef]
- Moen, M.A.; Anfinsen, S.N.; Doulgeris, A.P.; Renner, A.; Gerland, S. Assessing polarimetric SAR sea-ice classifications using consecutive day images. Ann. Glaciol. 2015, 56, 285–294. [Google Scholar] [CrossRef] [Green Version]
- Ressel, R.; Singha, S. Comparing near coincident space borne C and X band fully polarimetric SAR data for Arctic sea ice classification. Remote Sens. 2016, 8, 198. [Google Scholar] [CrossRef] [Green Version]
- Gill, J.P.; Yackel, J.J. Evaluation of C-band SAR polarimetric parameters for discrimination of first-year sea ice types. Can. J. Remote Sens. 2012, 38, 306–323. [Google Scholar] [CrossRef]
- Dabboor, M.; Montpetit, B.; Howell, S. Assessment of the high resolution SAR mode of the RADARSAT constellation mission for first year ice and multiyear ice characterization. Remote Sens. 2018, 10, 594. [Google Scholar] [CrossRef] [Green Version]
- Ghanbari, M.; Clausi, D.A.; Xu, L.; Jiang, M. Contextual classification of sea-ice types using compact polarimetric SAR data. IEEE Trans. Geosci. Remote Sens. 2019, 57, 7476–7491. [Google Scholar] [CrossRef]
- Li, F.; Clausi, D.A.; Xu, L.; Wong, A. ST-IRGS: A region-based self-training algorithm applied to hyperspectral image classification and segmentation. IEEE Trans. Geosci. Remote Sens. 2017, 56, 3–16. [Google Scholar] [CrossRef]
- Soh, L.K.; Tsatsoulis, C. Texture analysis of SAR sea ice imagery using gray level co-occurrence matrices. IEEE Trans. Geosci. Remote Sens. 1999, 37, 780–795. [Google Scholar] [CrossRef] [Green Version]
- Murashkin, D.; Spreen, G.; Huntemann, M.; Dierking, W. Method for detection of leads from Sentinel-1 SAR images. Ann. Glaciol. 2018, 59, 124–136. [Google Scholar] [CrossRef] [Green Version]
- Wang, B.; Xia, L.; Song, D.; Li, Z.; Wang, N. A Two-Round Weight Voting Strategy-Based Ensemble Learning Method for Sea Ice Classification of Sentinel-1 Imagery. Remote Sens. 2021, 13, 3945. [Google Scholar] [CrossRef]
- Clausi, D.A. An analysis of co-occurrence texture statistics as a function of grey level quantization. Can. J. Remote Sens. 2002, 28, 45–62. [Google Scholar] [CrossRef]
- Li, X.M.; Sun, Y.; Zhang, Q. Extraction of sea ice cover by Sentinel-1 SAR based on support vector machine with unsupervised generation of training data. IEEE Trans. Geosci. Remote Sens. 2020, 59, 3040–3053. [Google Scholar] [CrossRef]
- Lyu, H.; Huang, W.; Mahdianpari, M. Sea Ice Detection From the RADARSAT Constellation Mission Experiment Data. In Proceedings of the 2021 IEEE Canadian Conference on Electrical and Computer Engineering (CCECE), Virtual, 12–17 September 2021; pp. 1–4. [Google Scholar] [CrossRef]
- Maggiori, E.; Tarabalka, Y.; Charpiat, G.; Alliez, P. Convolutional neural networks for large-scale remote-sensing image classification. IEEE Trans. Geosci. Remote Sens. 2016, 55, 645–657. [Google Scholar] [CrossRef] [Green Version]
- Han, Y.; Liu, Y.; Hong, Z.; Zhang, Y.; Yang, S.; Wang, J. Sea Ice Image Classification Based on Heterogeneous Data Fusion and Deep Learning. Remote Sens. 2021, 13, 592. [Google Scholar] [CrossRef]
- Zhang, T.; Yang, Y.; Shokr, M.; Mi, C.; Li, X.M.; Cheng, X.; Hui, F. Deep Learning Based Sea Ice Classification with Gaofen-3 Fully Polarimetric SAR Data. Remote Sens. 2021, 13, 1452. [Google Scholar] [CrossRef]
- Boulze, H.; Korosov, A.; Brajard, J. Classification of sea ice types in Sentinel-1 SAR data using convolutional neural networks. Remote Sens. 2020, 12, 2165. [Google Scholar] [CrossRef]
- Asadi, N.; Scott, K.A.; Komarov, A.S.; Buehner, M.; Clausi, D.A. Evaluation of a Neural Network With Uncertainty for Detection of Ice and Water in SAR Imagery. IEEE Trans. Geosci. Remote Sens. 2020, 59, 247–259. [Google Scholar] [CrossRef]
- Song, W.; Li, M.; Gao, W.; Huang, D.; Ma, Z.; Liotta, A.; Perra, C. Automatic Sea-Ice Classification of SAR Images Based on Spatial and Temporal Features Learning. IEEE Trans. Geosci. Remote Sens. 2021. [Google Scholar] [CrossRef]
- Ren, Y.; Li, X.; Yang, X.; Xu, H. Development of a Dual-Attention U-Net Model for Sea Ice and Open Water Classification on SAR Images. IEEE Geosci. Remote Sens. Lett. 2021, 19, 1–5. [Google Scholar] [CrossRef]
- Chi, J.; Bae, J.; Kwon, Y.J. Two-Stream Convolutional Long-and Short-Term Memory Model Using Perceptual Loss for Sequence-to-Sequence Arctic Sea Ice Prediction. Remote Sens. 2021, 13, 3413. [Google Scholar] [CrossRef]
- Jobanputra, R.; Clausi, D.A. Preserving boundaries for image texture segmentation using grey level co-occurring probabilities. Pattern Recognit. 2006, 39, 234–245. [Google Scholar] [CrossRef]
- Yu, Q.; Clausi, D.A. IRGS: Image segmentation using edge penalties and region growing. IEEE Trans. Pattern Anal. Mach. Intell. 2008, 30, 2126–2139. [Google Scholar] [CrossRef]
- Leigh, S.; Wang, Z.; Clausi, D.A. Automated ice–water classification using dual polarization SAR satellite imagery. IEEE Trans. Geosci. Remote Sens. 2014, 52, 5529–5539. [Google Scholar] [CrossRef]
- Jiang, M.; Clausi, D.A.; Xu, L. Sea Ice Mapping of RADARSAT-2 Imagery by Integrating Spatial Contexture with Textural Features. IEEE J. Sel. Topics Appl. Earth Observ. Remote Sens. 2021, unpublished. [Google Scholar]
- Luscombe, A. RADARSAT-2 SAR image quality and calibration operations. Can. J. Remote Sens. 2004, 30, 345–354. [Google Scholar] [CrossRef]
- Choi, H.; Jeong, J. Speckle noise reduction technique for SAR images using statistical characteristics of speckle noise and discrete wavelet transform. Remote Sens. 2019, 11, 1184. [Google Scholar] [CrossRef] [Green Version]
- Lohse, J.; Doulgeris, A.P.; Dierking, W. Mapping sea-ice types from Sentinel-1 considering the surface-type dependent effect of incidence angle. Ann. Glaciol. 2020, 61, 260–270. [Google Scholar] [CrossRef]
- Zhang, Y.; Zhu, T.; Spreen, G.; Melsheimer, C.; Huntemann, M.; Hughes, N.; Zhang, S.; Li, F. Sea ice and water classification on dual-polarized Sentinel-1 imagery during melting season. Cryosphere Discuss. 2021, 1–26. [Google Scholar] [CrossRef]
- Wang, Y.R.; Li, X.M. Arctic sea ice cover data from spaceborne SAR by deep learning. Earth Syst. Sci. Data Discuss 2020, 2020, 1–30. [Google Scholar] [CrossRef]
- Wong, T.T. Performance evaluation of classification algorithms by k-fold and leave-one-out cross validation. Pattern Recognit. 2015, 48, 2839–2846. [Google Scholar] [CrossRef]
- Krizhevsky, A.; Sutskever, I.; Hinton, G.E. Imagenet classification with deep convolutional neural networks. Adv. Neural Inf. Process. Syst. 2012, 25. [Google Scholar] [CrossRef]
- He, K.; Zhang, X.; Ren, S.; Sun, J. Deep residual learning for image recognition. In Proceedings of the IEEE Conference on Computer Vision and Pattern Recognition (CVPR), Las Vegas, NV, USA, 27–30 June 2016; pp. 770–778. [Google Scholar]
- Ioffe, S.; Szegedy, C. Batch normalization: Accelerating deep network training by reducing internal covariate shift. In Proceedings of the International Conference on Machine Learning, PMLR, Lille, France, 6–11 July 2015; pp. 448–456. [Google Scholar]
- Xu, B.; Wang, N.; Chen, T.; Li, M. Empirical evaluation of rectified activations in convolutional network. arXiv 2015, arXiv:1505.00853. [Google Scholar]
- He, K.; Zhang, X.; Ren, S.; Sun, J. Delving deep into rectifiers: Surpassing human-level performance on imagenet classification. In Proceedings of the IEEE International Conference on Computer Vision, Santiago, Chile, 7–13 December 2015; pp. 1026–1034. [Google Scholar]
- Kingma, D.P.; Ba, J. Adam: A method for stochastic optimization. arXiv 2014, arXiv:1412.6980. [Google Scholar]
- Hoekstra, M.; Jiang, M.; Clausi, D.A.; Duguay, C. Lake Ice-Water Classification of RADARSAT-2 Images by Integrating IRGS Segmentation with Pixel-Based Random Forest Labeling. Remote Sens. 2020, 12, 1425. [Google Scholar] [CrossRef]
- Zhang, L.; Liu, H.; Gu, X.; Guo, H.; Chen, J.; Liu, G. Sea Ice Classification Using TerraSAR-X ScanSAR Data With Removal of Scalloping and Interscan Banding. IEEE J. Sel. Topics Appl. Earth Observ. Remote Sens. 2019, 12, 589–598. [Google Scholar] [CrossRef]
Publisher’s Note: MDPI stays neutral with regard to jurisdictional claims in published maps and institutional affiliations. |
© 2022 by the authors. Licensee MDPI, Basel, Switzerland. This article is an open access article distributed under the terms and conditions of the Creative Commons Attribution (CC BY) license (https://creativecommons.org/licenses/by/4.0/).

