
A Robust Strategy for Large-Size Optical and SAR Image Registration


Abstract
:
1. Introduction
2. Motivation and Contribution
3. Methodology
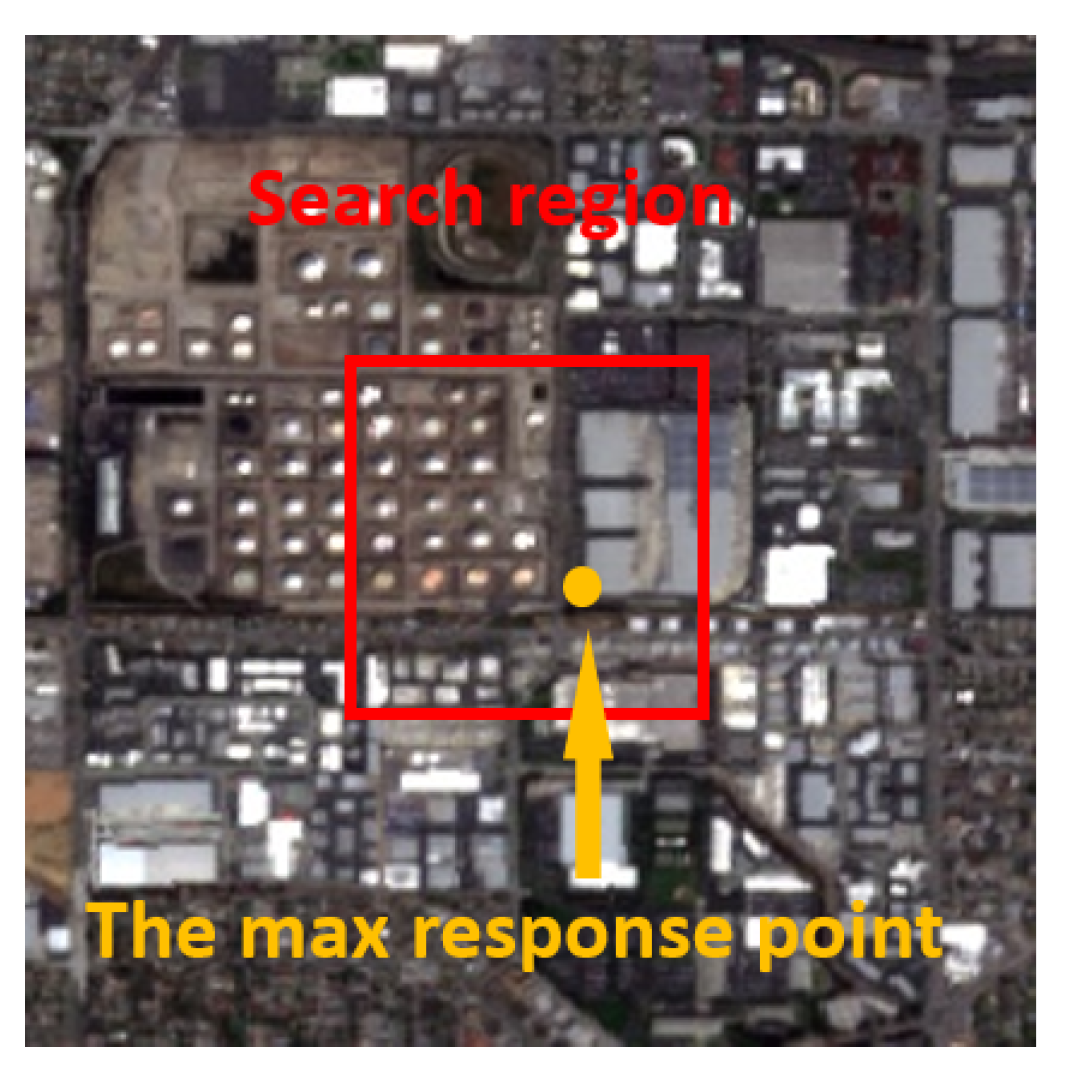
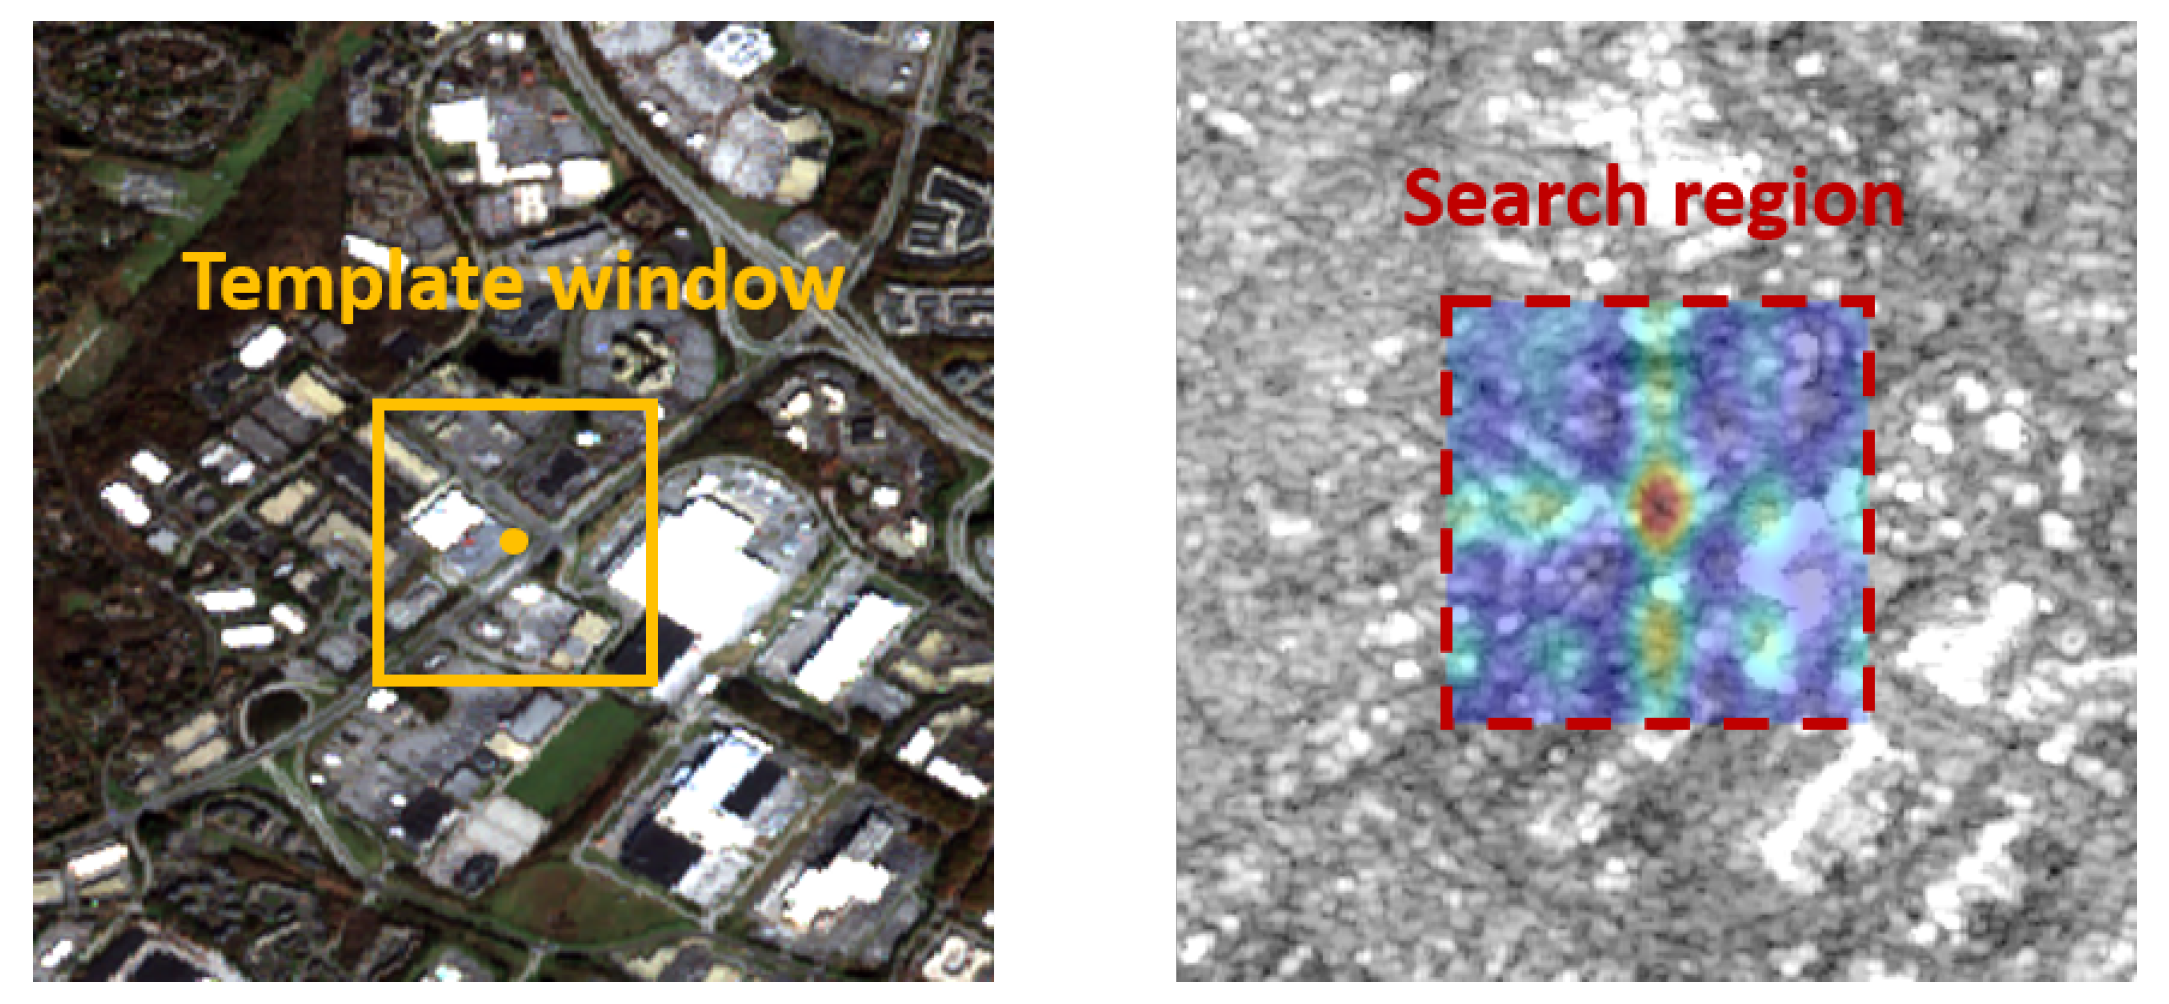
3.1. The Similarity Map
3.2. The One-Class SVM
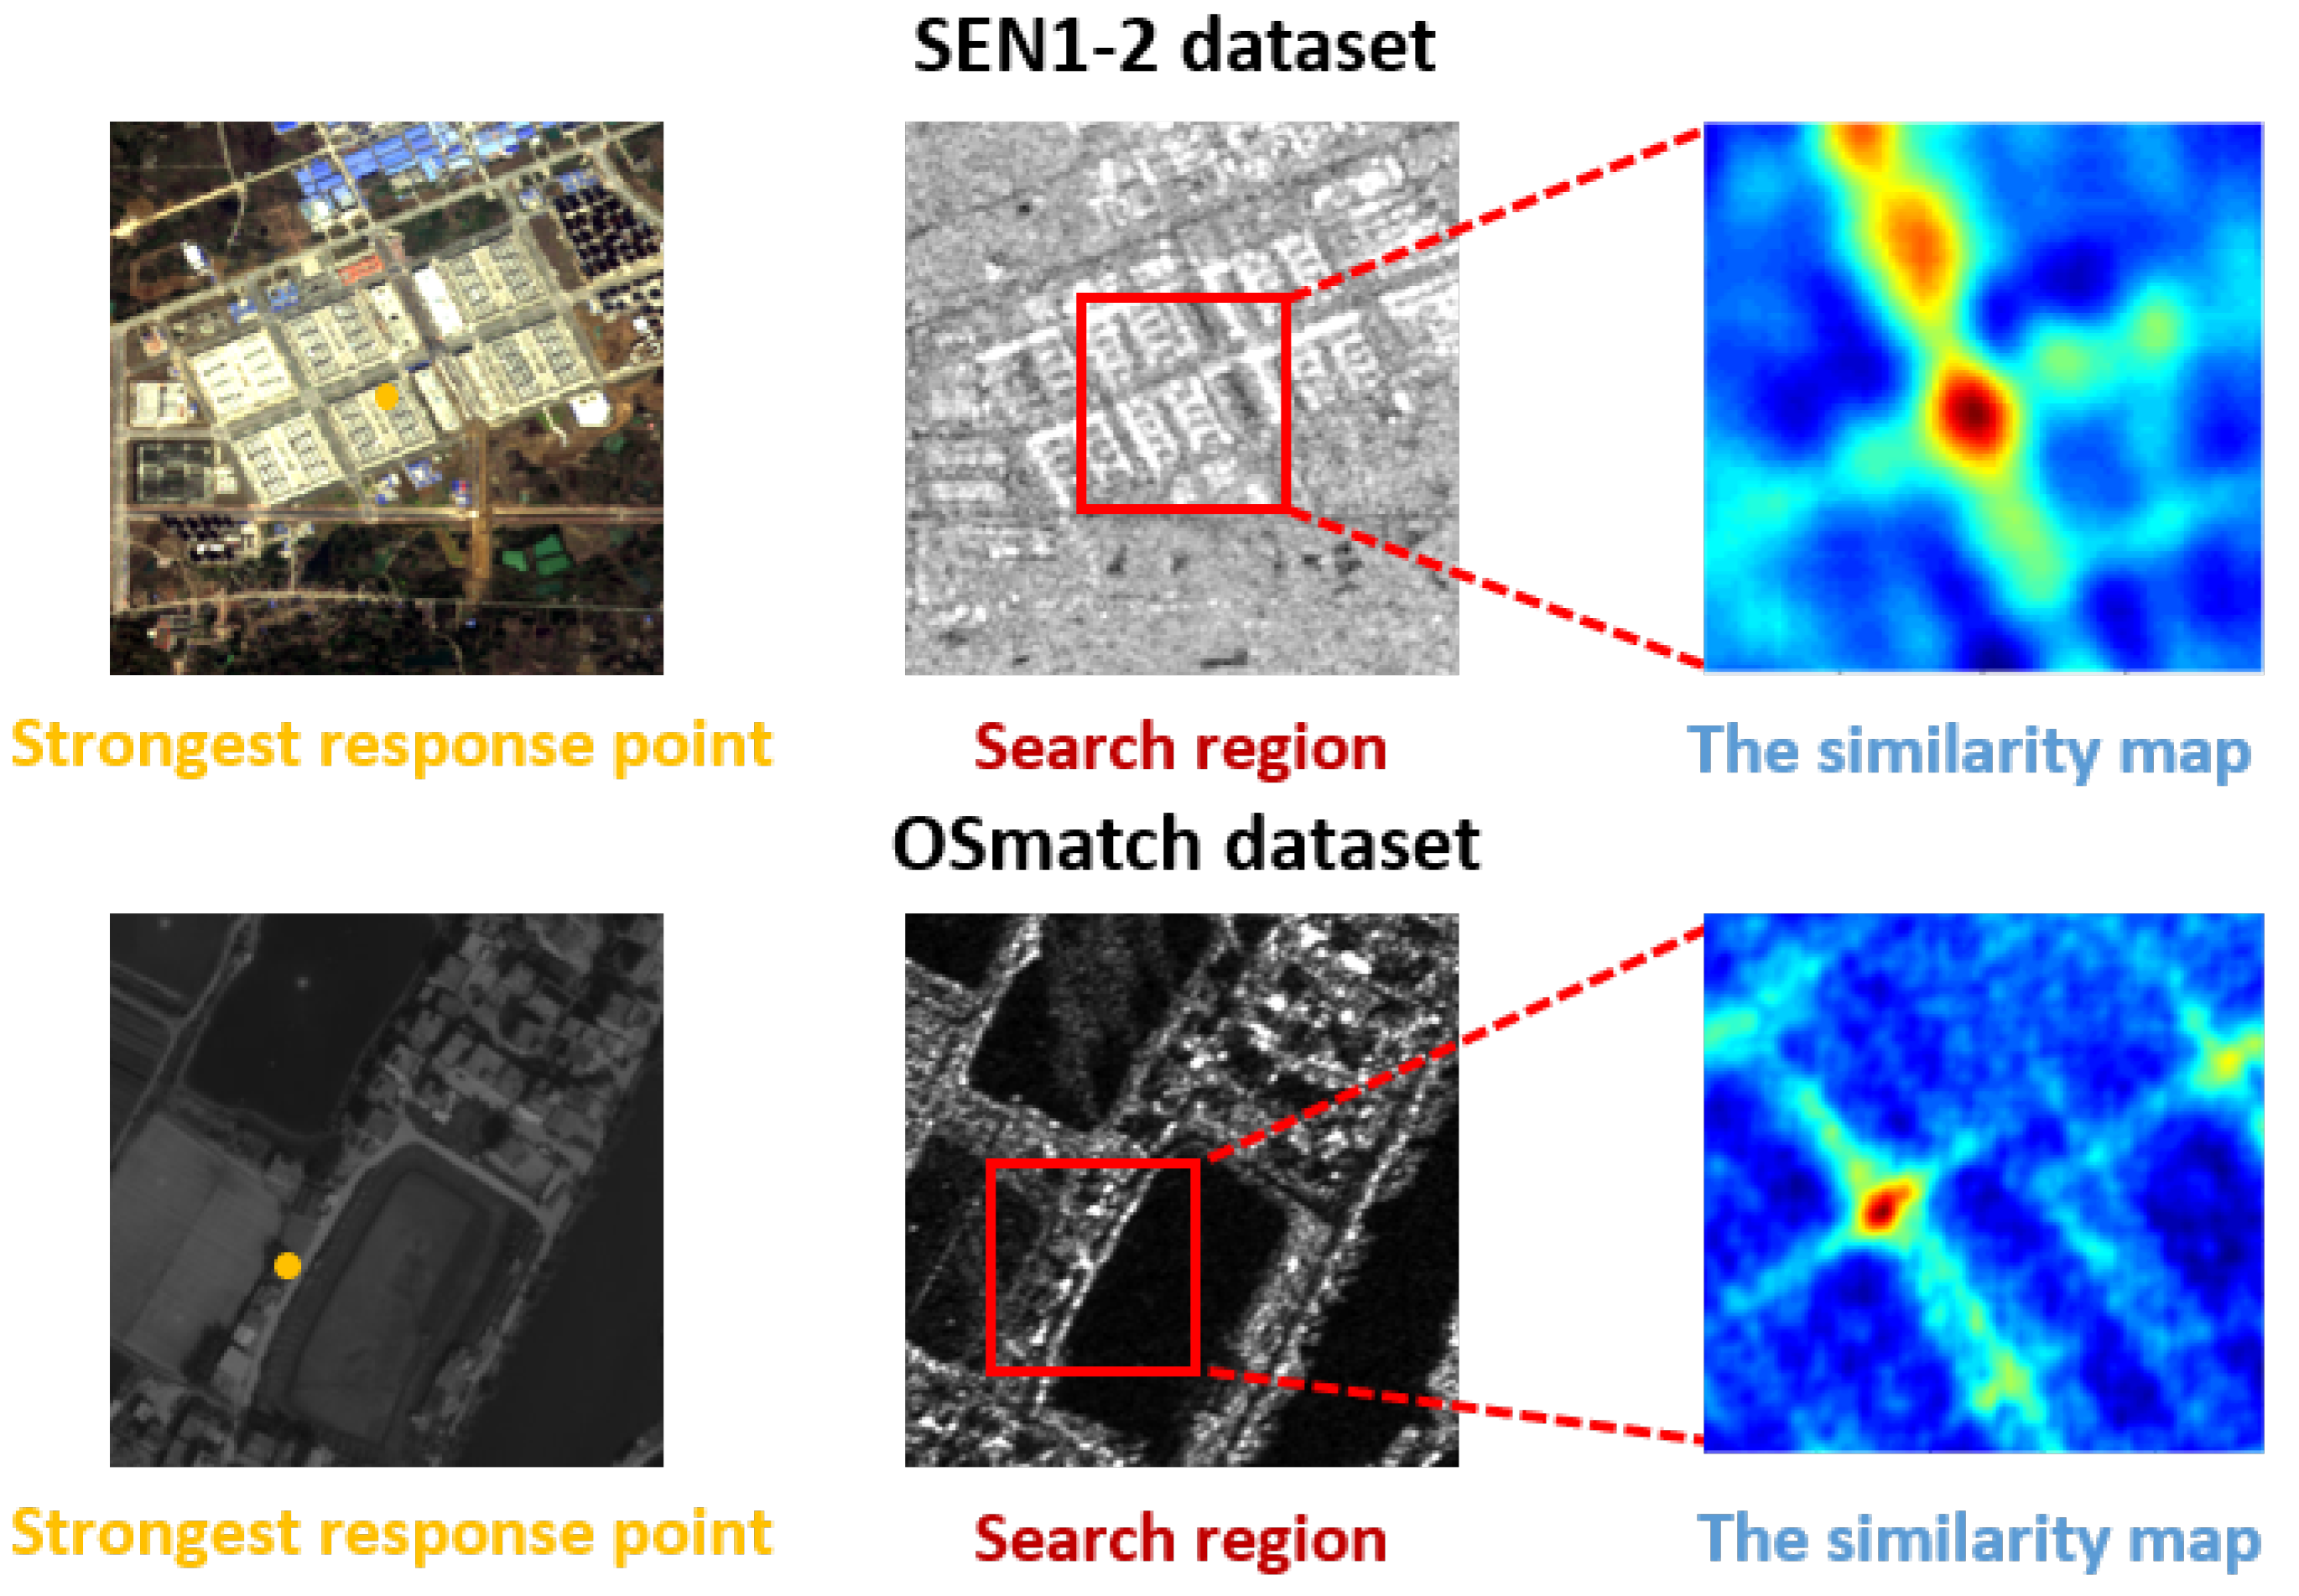
3.3. The Creation of the Similarity Dataset
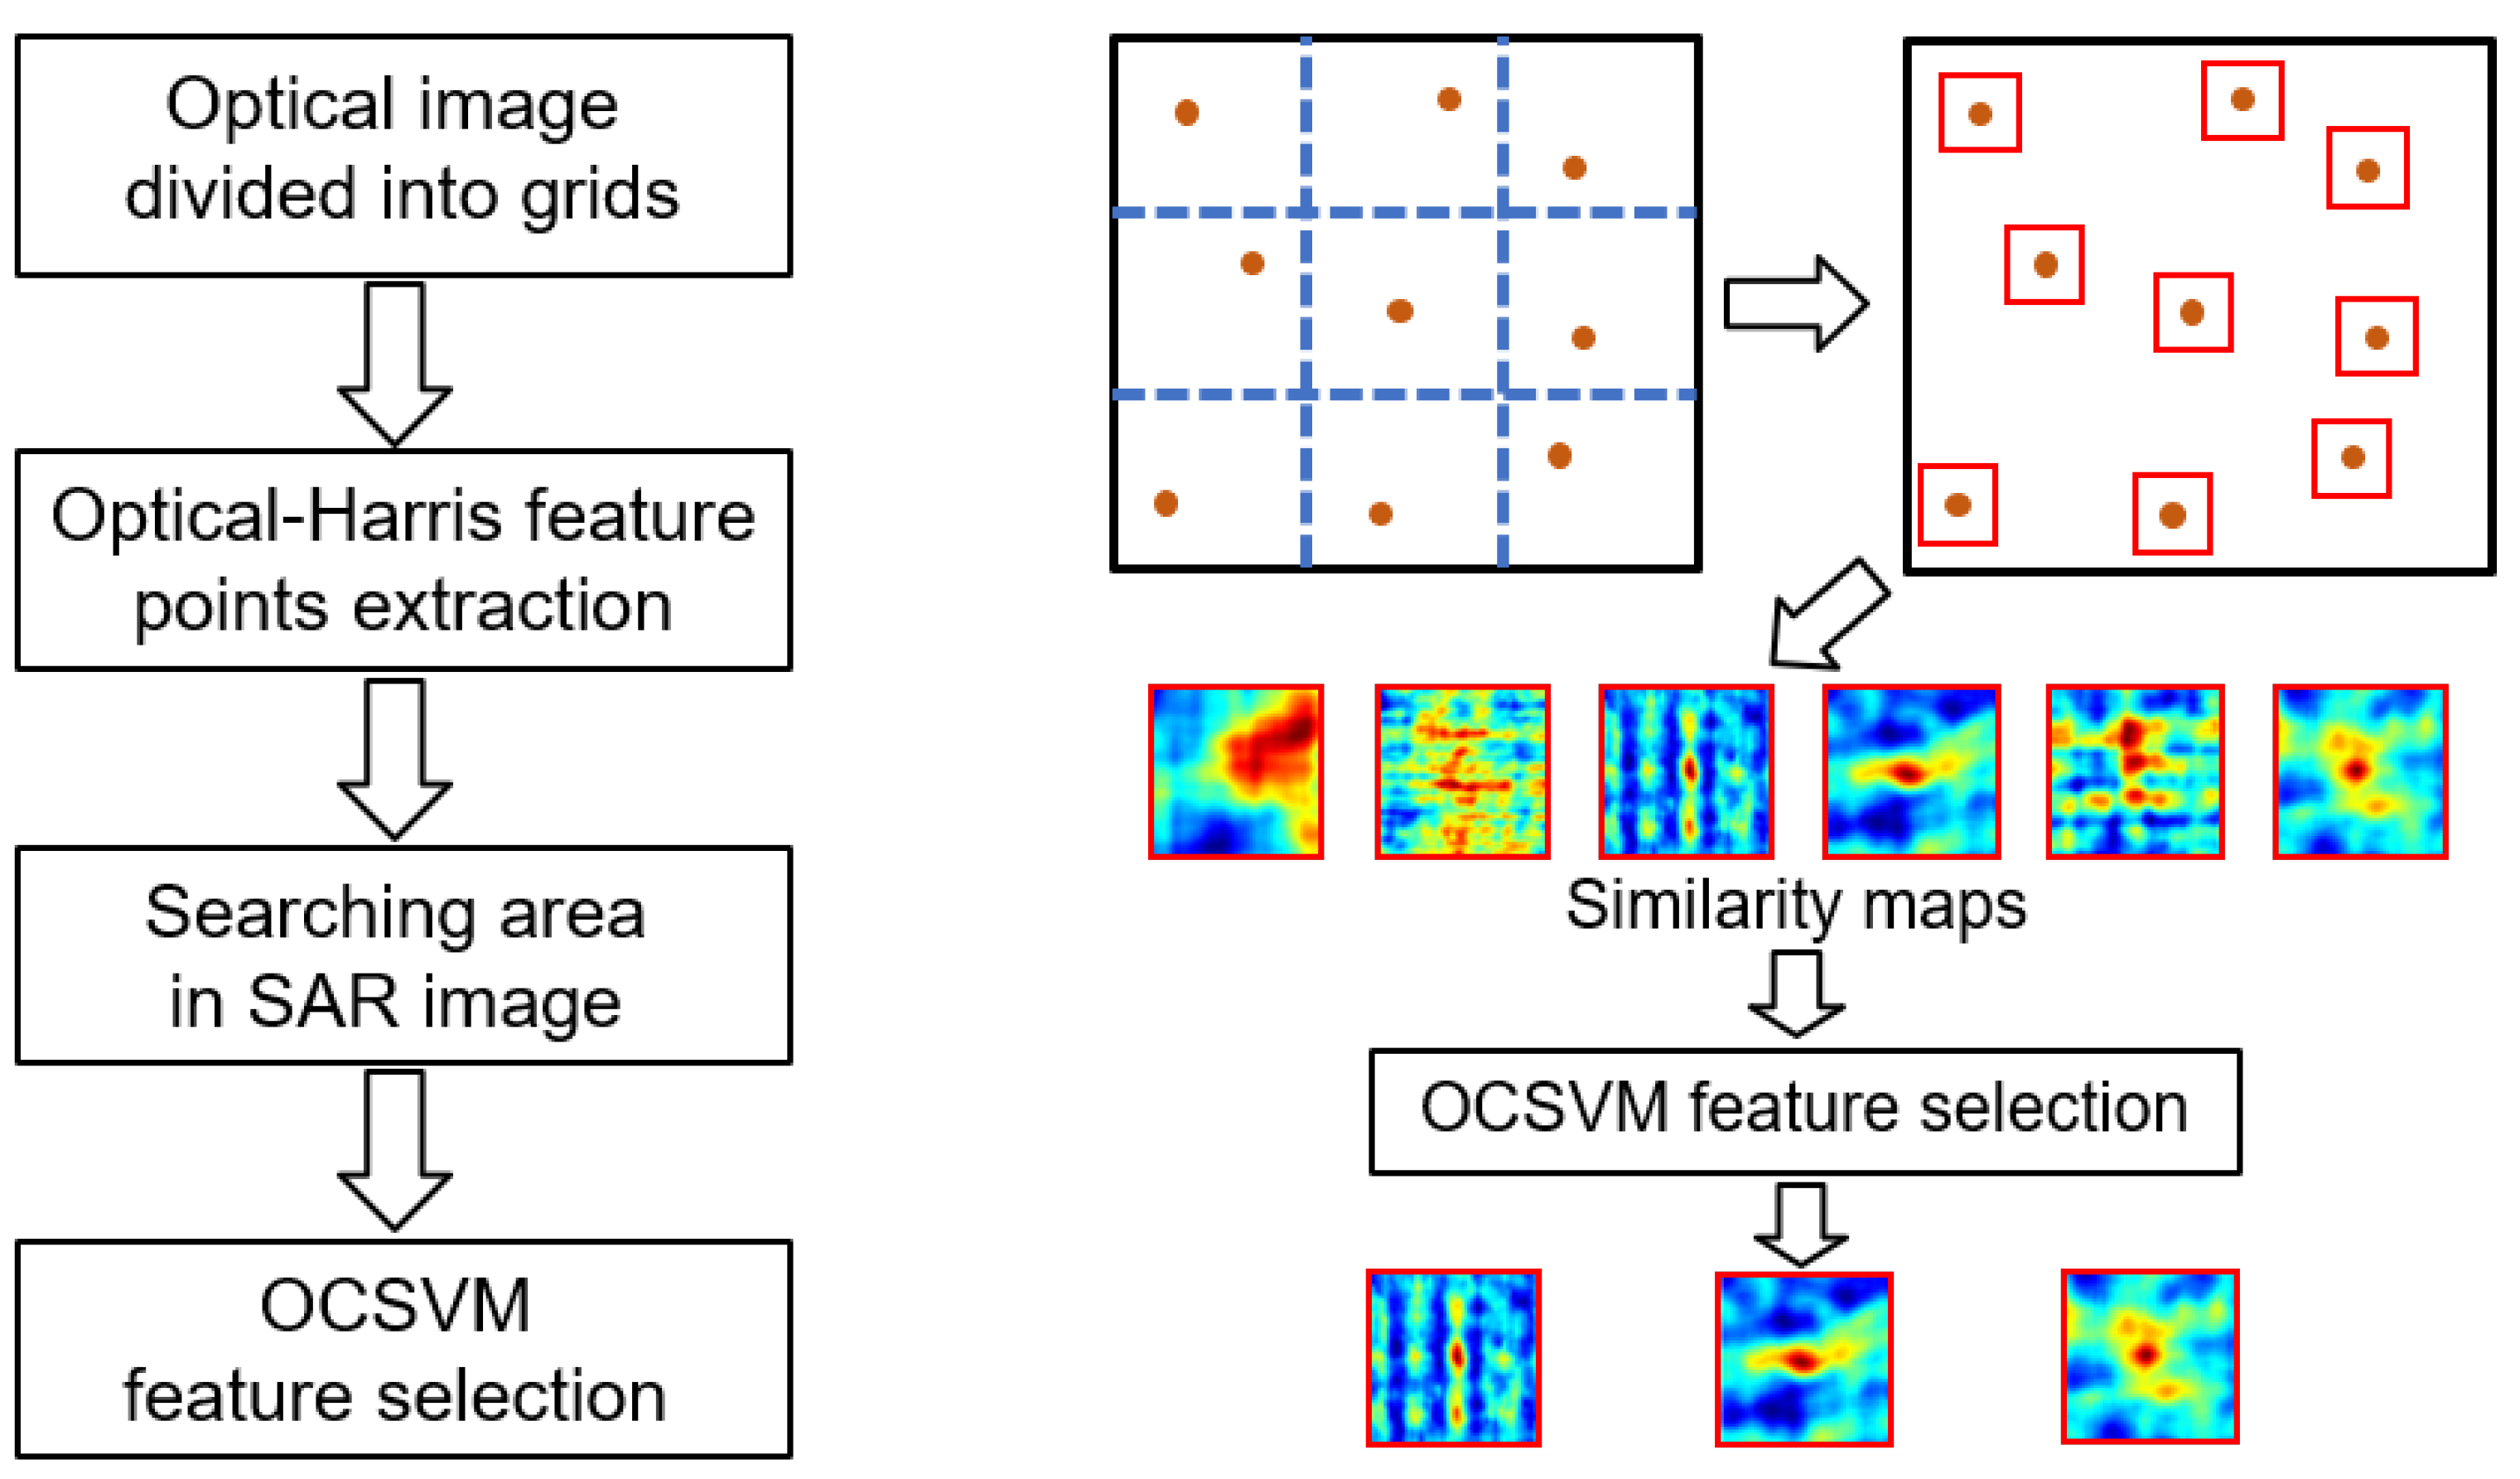
3.4. The Proposed Strategy
4. Experiments and Evaluation
4.1. Experiment of the One-Class SVM in Dataset
4.1.1. Experimental Data
4.1.2. Evaluation Criteria
4.1.3. Experimental Analysis
4.2. Experiment of the Proposed Strategy
4.2.1. Experiment Data
4.2.2. Evaluation Criteria
4.2.3. Experimental Analysis
5. Conclusions
Author Contributions
Funding
Data Availability Statement
Conflicts of Interest
References
- Kulkarni, S.; Rege, P. Pixel Level Fusion Techniques for SAR and Optical Images: A Review. Inf. Fusion 2020, 59, 13–29. [Google Scholar] [CrossRef]
- Li, X.; Wang, T.; Zhang, G.; Jiang, B.; Zhao, Y. Planar Block Adjustment for China’s Land Regions with LuoJia1-01 Nighttime Light Imagery. Remote Sens. 2019, 11, 2097. [Google Scholar] [CrossRef] [Green Version]
- Wang, T.; Li, X.; Zhang, G.; Lin, M.; Deng, M.; Cui, H.; Jiang, B.; Wang, Y.; Zhu, Y.; Wang, H.; et al. Large-Scale Orthorectification of GF-3 SAR Images without Ground Control Points for China 2019 Land Area. IEEE Trans. Geosci. Remote Sens. 2022, 60, 5221617. [Google Scholar] [CrossRef]
- Song, S.; Jin, K.; Zuo, B.; Yang, J. A novel change detection method combined with registration for SAR images. Remote Sens. Lett. 2019, 10, 669–678. [Google Scholar] [CrossRef]
- Niangang Jiao, F.W.; You, H.; Liu, J.; Qiu, X. A generic framework for improving the geopositioning accuracy of multi-source optical and SAR imagery. ISPRS J. Photogramm. Remote Sens. 2020, 169, 377–388. [Google Scholar] [CrossRef]
- Kai, L.; Xueqing, Z. Review of Research on Registration of SAR and Optical Remote Sensing Image Based on Feature. In Proceedings of the 2018 IEEE 3rd International Conference on Signal and Image Processing (ICSIP), Shenzhen, China, 13–15 July 2018; pp. 111–115. [Google Scholar] [CrossRef]
- Fan, J.; Wu, Y.; Li, M.; Liang, W.; Cao, Y. SAR and Optical Image Registration Using Nonlinear Diffusion and Phase Congruency Structural Descriptor. IEEE Trans. Geosci. Remote Sens. 2018, 56, 5368–5379. [Google Scholar] [CrossRef]
- He, C.; Fang, P.; Xiong, D.; Wang, W.; Liao, M. A Point Pattern Chamfer Registration of Optical and SAR Images Based on Mesh Grids. Remote Sens. 2018, 10, 1837. [Google Scholar] [CrossRef] [Green Version]
- Li, J.; Hu, Q.; Ai, M. RIFT: Multi-Modal Image Matching Based on Radiation-Variation Insensitive Feature Transform. IEEE Trans. Image Process. 2020, 29, 3296–3310. [Google Scholar] [CrossRef]
- Xiang, Y.; Wang, F.; You, H. OS-SIFT: A Robust SIFT-Like Algorithm for High-Resolution Optical-to-SAR Image Registration in Suburban Areas. IEEE Trans. Geosci. Remote Sens. 2018, 56, 3078–3090. [Google Scholar] [CrossRef]
- Feng, R.; Du, Q.; Li, X.; Shen, H. Robust registration for remote sensing images by combining and localizing feature- and area-based methods. ISPRS J. Photogramm. Remote Sens. 2019, 151, 15–26. [Google Scholar] [CrossRef]
- Suri, S.; Reinartz, P. Mutual-Information-Based Registration of TerraSAR-X and Ikonos Imagery in Urban Areas. IEEE Trans. Geosci. Remote Sens. 2010, 48, 939–949. [Google Scholar] [CrossRef]
- Li, Z.; Mahapatra, D.; Tielbeek, J.A.W.; Stoker, J.; van Vliet, L.J.; Vos, F.M. Image Registration Based on Autocorrelation of Local Structure. IEEE Trans. Med. Imaging 2016, 35, 63–75. [Google Scholar] [CrossRef] [PubMed]
- Lowe, D.G. Distinctive Image Features from Scale-Invariant Keypoints. Int. J. Comput. Vis. 2004, 2, 91–110. [Google Scholar] [CrossRef]
- Dalal, N.; Triggs, B. Histograms of oriented gradients for human detection. In Proceedings of the 2005 IEEE Computer Society Conference on Computer Vision and Pattern Recognition (CVPR’05), San Diego, CA, USA, 20–26 June 2005; Volume 1, pp. 886–893. [Google Scholar] [CrossRef] [Green Version]
- Ye, Y.; Shan, J.; Hao, S.; Bruzzone, L.; Qin, Y. A local phase based invariant feature for remote sensing image matching. ISPRS J. Photogramm. Remote Sens. 2018, 142, 205–221. [Google Scholar] [CrossRef]
- Kovesi, P. Phase congruency: A low-level image invariant. Psychol. Res. 2000, 64, 136–148. [Google Scholar] [CrossRef]
- Ye, Y.; Shan, J.; Bruzzone, L.; Shen, L. Robust Registration of Multimodal Remote Sensing Images Based on Structural Similarity. IEEE Trans. Geosci. Remote Sens. 2017, 55, 2941–2958. [Google Scholar] [CrossRef]
- Ye, Y.; Bruzzone, L.; Shan, J.; Bovolo, F.; Zhu, Q. Fast and Robust Matching for Multimodal Remote Sensing Image Registration. IEEE Trans. Geosci. Remote Sens. 2019, 57, 9059–9070. [Google Scholar] [CrossRef] [Green Version]
- Li, J.; Hu, Q.; Ai, M. Robust Feature Matching for Remote Sensing Image Registration Based on Lq-Estimator. IEEE Geosci. Remote Sens. Lett. 2016, 13, 1989–1993. [Google Scholar] [CrossRef]
- Fischler, M.A.; Bolles, R.C. Random Sample Consensus: A Paradigm for Model Fitting with Applications to Image Analysis and Automated Cartography. In Readings in Computer Vision; Fischler, M.A., Firschein, O., Eds.; Readings in Computer Vision, Morgan Kaufmann: San Francisco, CA, USA, 1987; pp. 726–740. [Google Scholar] [CrossRef]
- Wu, Y.; Ma, W.; Gong, M.; Su, L.; Jiao, L. A Novel Point-Matching Algorithm Based on Fast Sample Consensus for Image Registration. IEEE Geosci. Remote Sens. Lett. 2015, 12, 43–47. [Google Scholar] [CrossRef]
- Liu, Z.; An, J.; Jing, Y. A Simple and Robust Feature Point Matching Algorithm Based on Restricted Spatial Order Constraints for Aerial Image Registration. IEEE Trans. Geosci. Remote Sens. 2012, 50, 514–527. [Google Scholar] [CrossRef]
- Ma, J.; Zhao, J.; Tian, J.; Yuille, A.L.; Tu, Z. Robust Point Matching via Vector Field Consensus. IEEE Trans. Image Process. 2014, 23, 1706–1721. [Google Scholar] [CrossRef] [PubMed] [Green Version]
- Li, X.; Hu, Z. Rejecting Mismatches by Correspondence Function. Int. J. Comput. Vision 2010, 89, 1–17. [Google Scholar] [CrossRef]
- Ma, J.; Zhao, J.; Zhou, Y.; Tian, J. Mismatch removal via coherent spatial mapping. In Proceedings of the 2012 19th IEEE International Conference on Image Processing, Orlando, FL, USA, 30 September–3 October 2012; pp. 1–4. [Google Scholar] [CrossRef]
- Myronenko, A.; Song, X. Point Set Registration: Coherent Point Drift. IEEE Trans. Pattern Anal. Mach. Intell. 2010, 32, 2262–2275. [Google Scholar] [CrossRef] [PubMed] [Green Version]
- Habib, A.; Al-Ruzouq, R. Semi-automatic registration of multi-source satellite imagery with varying geometric resolutions. Photogramm. Eng. Remote Sens. 2004, 71, 325–332. [Google Scholar] [CrossRef] [Green Version]
- Hu, Z. Line Based SAR and Optical Image Automatic Registration Method. In Proceedings of the 2010 Chinese Conference on Pattern Recognition (CCPR), Chongqing, China, 21–23 October 2010; pp. 1–5. [Google Scholar] [CrossRef]
- Sui, H.; Xu, C.; Liu, J.; Hua, F. Automatic Optical-to-SAR Image Registration by Iterative Line Extraction and Voronoi Integrated Spectral Point Matching. IEEE Trans. Geosci. Remote Sens. 2015, 53, 6058–6072. [Google Scholar] [CrossRef]
- Bentoutou, Y.; Taleb, N.; Kpalma, K.; Ronsin, J. An automatic image registration for applications in remote sensing. IEEE Trans. Geosci. Remote Sens. 2005, 43, 2127–2137. [Google Scholar] [CrossRef]
- Xu, C.; Sui, H.; Li, H.; Liu, J. An automatic optical and SAR image registration method with iterative level set segmentation and SIFT. Int. J. Remote Sens. 2015, 36, 3997–4017. [Google Scholar] [CrossRef]
- Huo, C.; Pan, C.; Huo, L.; Zhou, Z. Multilevel SIFT Matching for Large-Size VHR Image Registration. IEEE Geosci. Remote Sens. Lett. 2012, 9, 171–175. [Google Scholar] [CrossRef]
- Fan, Z.; Zhang, L.; Liu, Y.; Wang, Q.; Zlatanova, S. Exploiting High Geopositioning Accuracy of SAR Data to Obtain Accurate Geometric Orientation of Optical Satellite Images. Remote Sens. 2021, 13, 3535. [Google Scholar] [CrossRef]
- Li, Z.; Zhang, H.; Huang, Y. A Rotation-Invariant Optical and SAR Image Registration Algorithm Based on Deep and Gaussian Features. Remote Sens. 2021, 13, 2628. [Google Scholar] [CrossRef]
- Perera, P.; Oza, P.; Patel, V.M. One-Class Classification: A Survey. arXiv 2021, arXiv:2101.03064. [Google Scholar]
- Schmitt, M.; Hughes, L.H.; Zhu, X.X. The SEN1-2 Dataset for Deep Learning in SAR-Optical Data Fusion. arXiv 2018, arXiv:1807.01569. [Google Scholar] [CrossRef] [Green Version]
- Xiang, Y.; Tao, R.; Wang, F.; You, H. Automatic Registration of Optical and SAR Images VIA Improved Phase Congruency. In Proceedings of the IGARSS 2019—2019 IEEE International Geoscience and Remote Sensing Symposium, Yokohama, Japan, 28 July–2 August 2019; pp. 931–934. [Google Scholar] [CrossRef]


| v | 0.01 | 0.05 | 0.08 | 0.1 | 0.15 | 0.2 | 0.25 | 0.3 | 0.35 | 0.4 | 0.45 | 0.5 | |
|---|---|---|---|---|---|---|---|---|---|---|---|---|---|
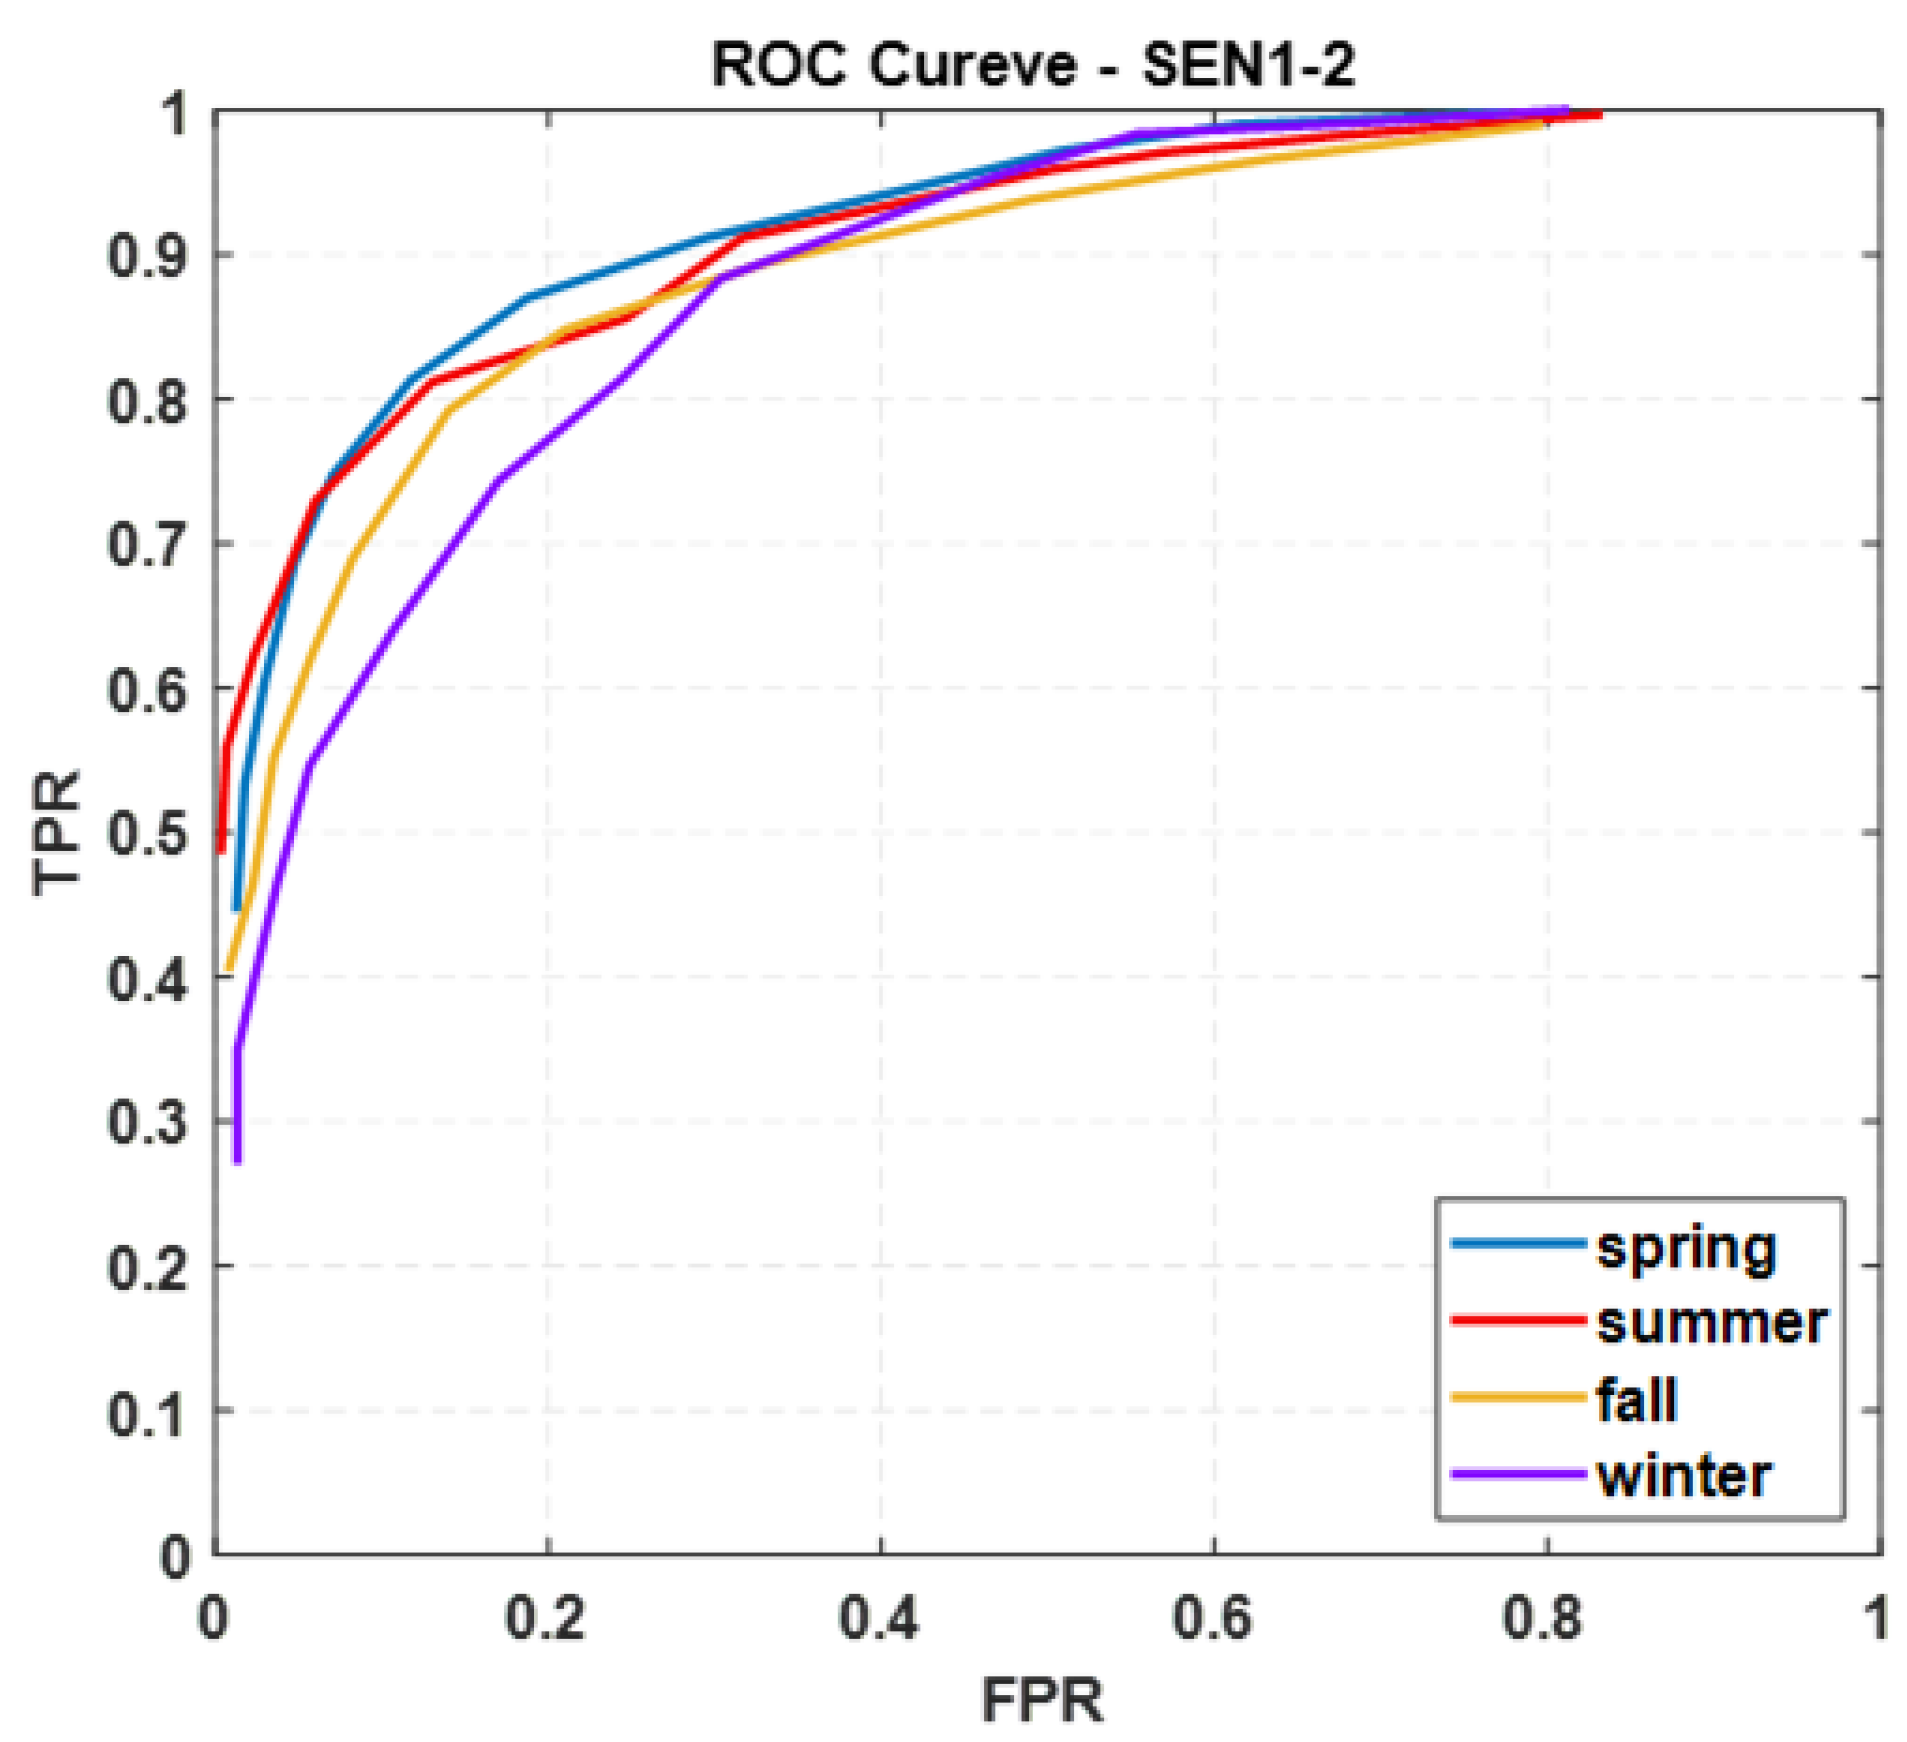
| Spring | TPR | 1 | 0.99 | 0.97 | 0.96 | 0.91 | 0.87 | 0.81 | 0.75 | 0.69 | 0.61 | 0.53 | 0.45 |
| FPR | 0.78 | 0.62 | 0.51 | 0.46 | 0.30 | 0.19 | 0.12 | 0.07 | 0.05 | 0.03 | 0.02 | 0.01 | |
| Summer | TPR | 1 | 0.98 | 0.97 | 0.96 | 0.91 | 0.86 | 0.81 | 0.73 | 0.67 | 0.62 | 0.56 | 0.49 |
| FPR | 0.83 | 0.68 | 0.57 | 0.50 | 0.32 | 0.25 | 0.13 | 0.06 | 0.04 | 0.02 | 0.01 | 0 | |
| Fall | TPR | 0.99 | 0.97 | 0.96 | 0.94 | 0.90 | 0.85 | 0.79 | 0.69 | 0.62 | 0.55 | 0.46 | 0.40 |
| FPR | 0.80 | 0.63 | 0.58 | 0.49 | 0.33 | 0.21 | 0.14 | 0.08 | 0.06 | 0.04 | 0.02 | 0.01 | |
| Winter | TPR | 1 | 0.99 | 0.98 | 0.95 | 0.88 | 0.81 | 0.74 | 0.64 | 0.55 | 0.46 | 0.35 | 0.27 |
| FPR | 0.81 | 0.67 | 0.55 | 0.47 | 0.30 | 0.24 | 0.17 | 0.11 | 0.06 | 0.04 | 0.01 | 0.01 | |
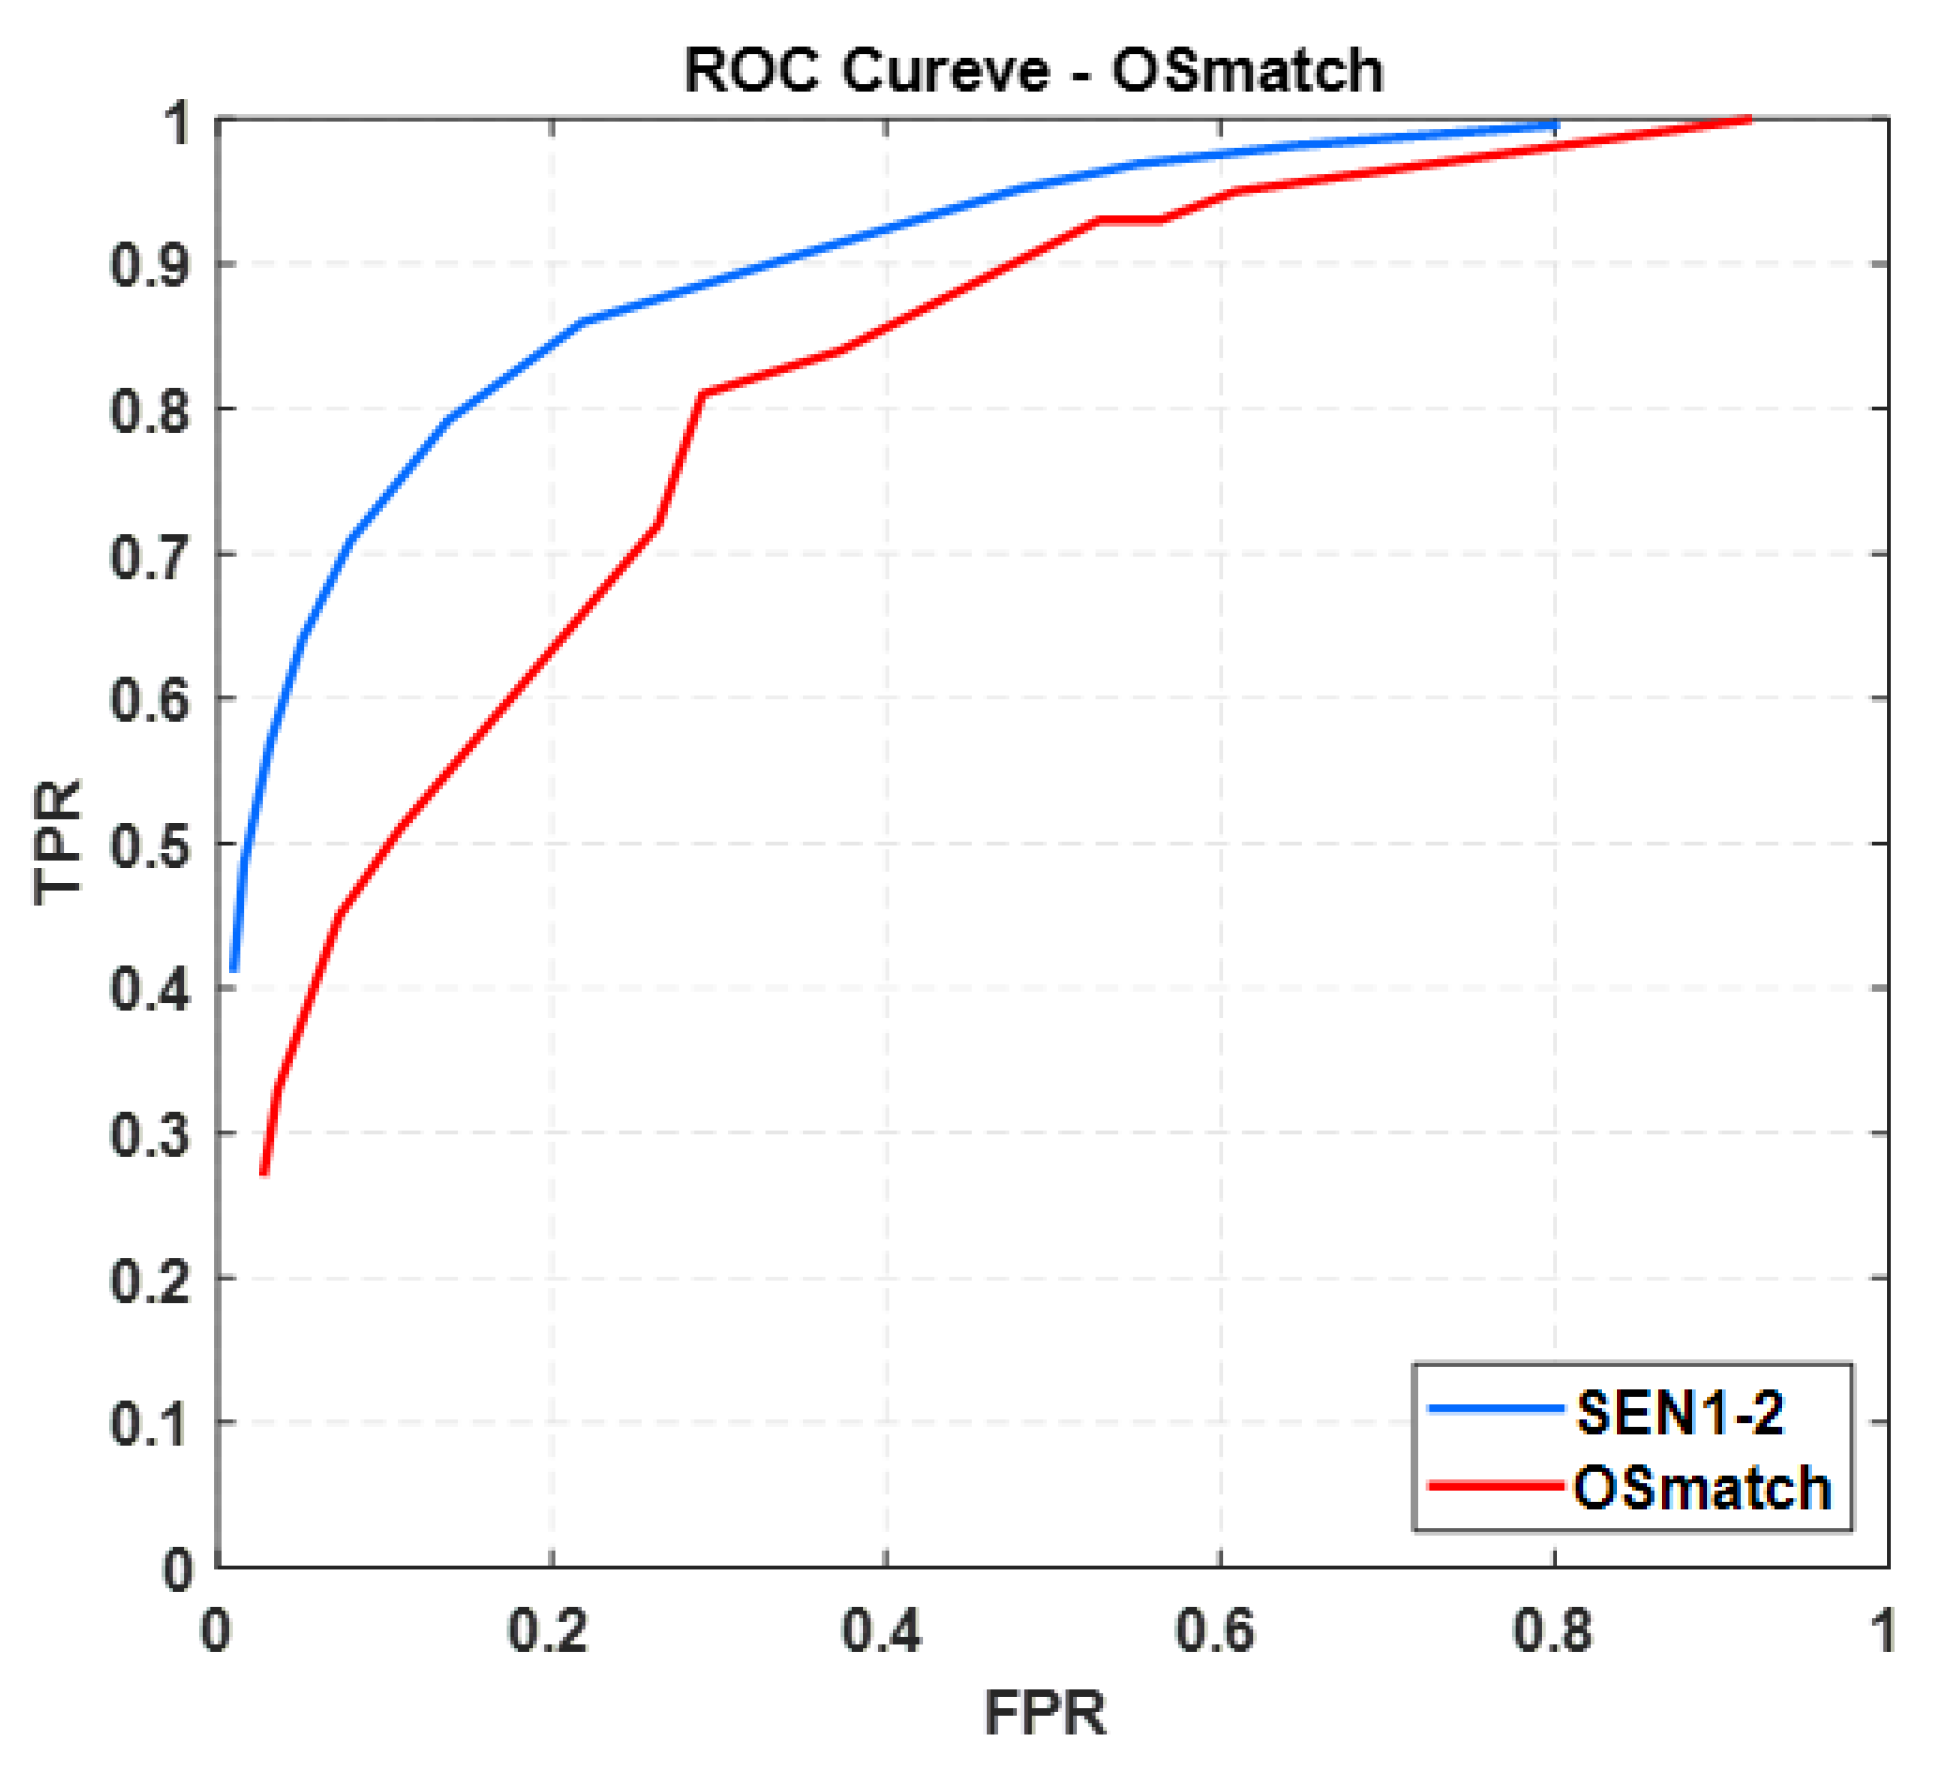
| OSmatch | TPR | 1 | 0.95 | 0.93 | 0.93 | 0.84 | 0.81 | 0.72 | 0.62 | 0.51 | 0.45 | 0.33 | 0.27 |
| FPR | 0.92 | 0.61 | 0.56 | 0.53 | 0.37 | 0.29 | 0.19 | 0.11 | 0.07 | 0.04 | 0.02 | 0.01 |
| No. | Image Pair | Resolution | Size (Pixels) | Date | Characteristics |
|---|---|---|---|---|---|
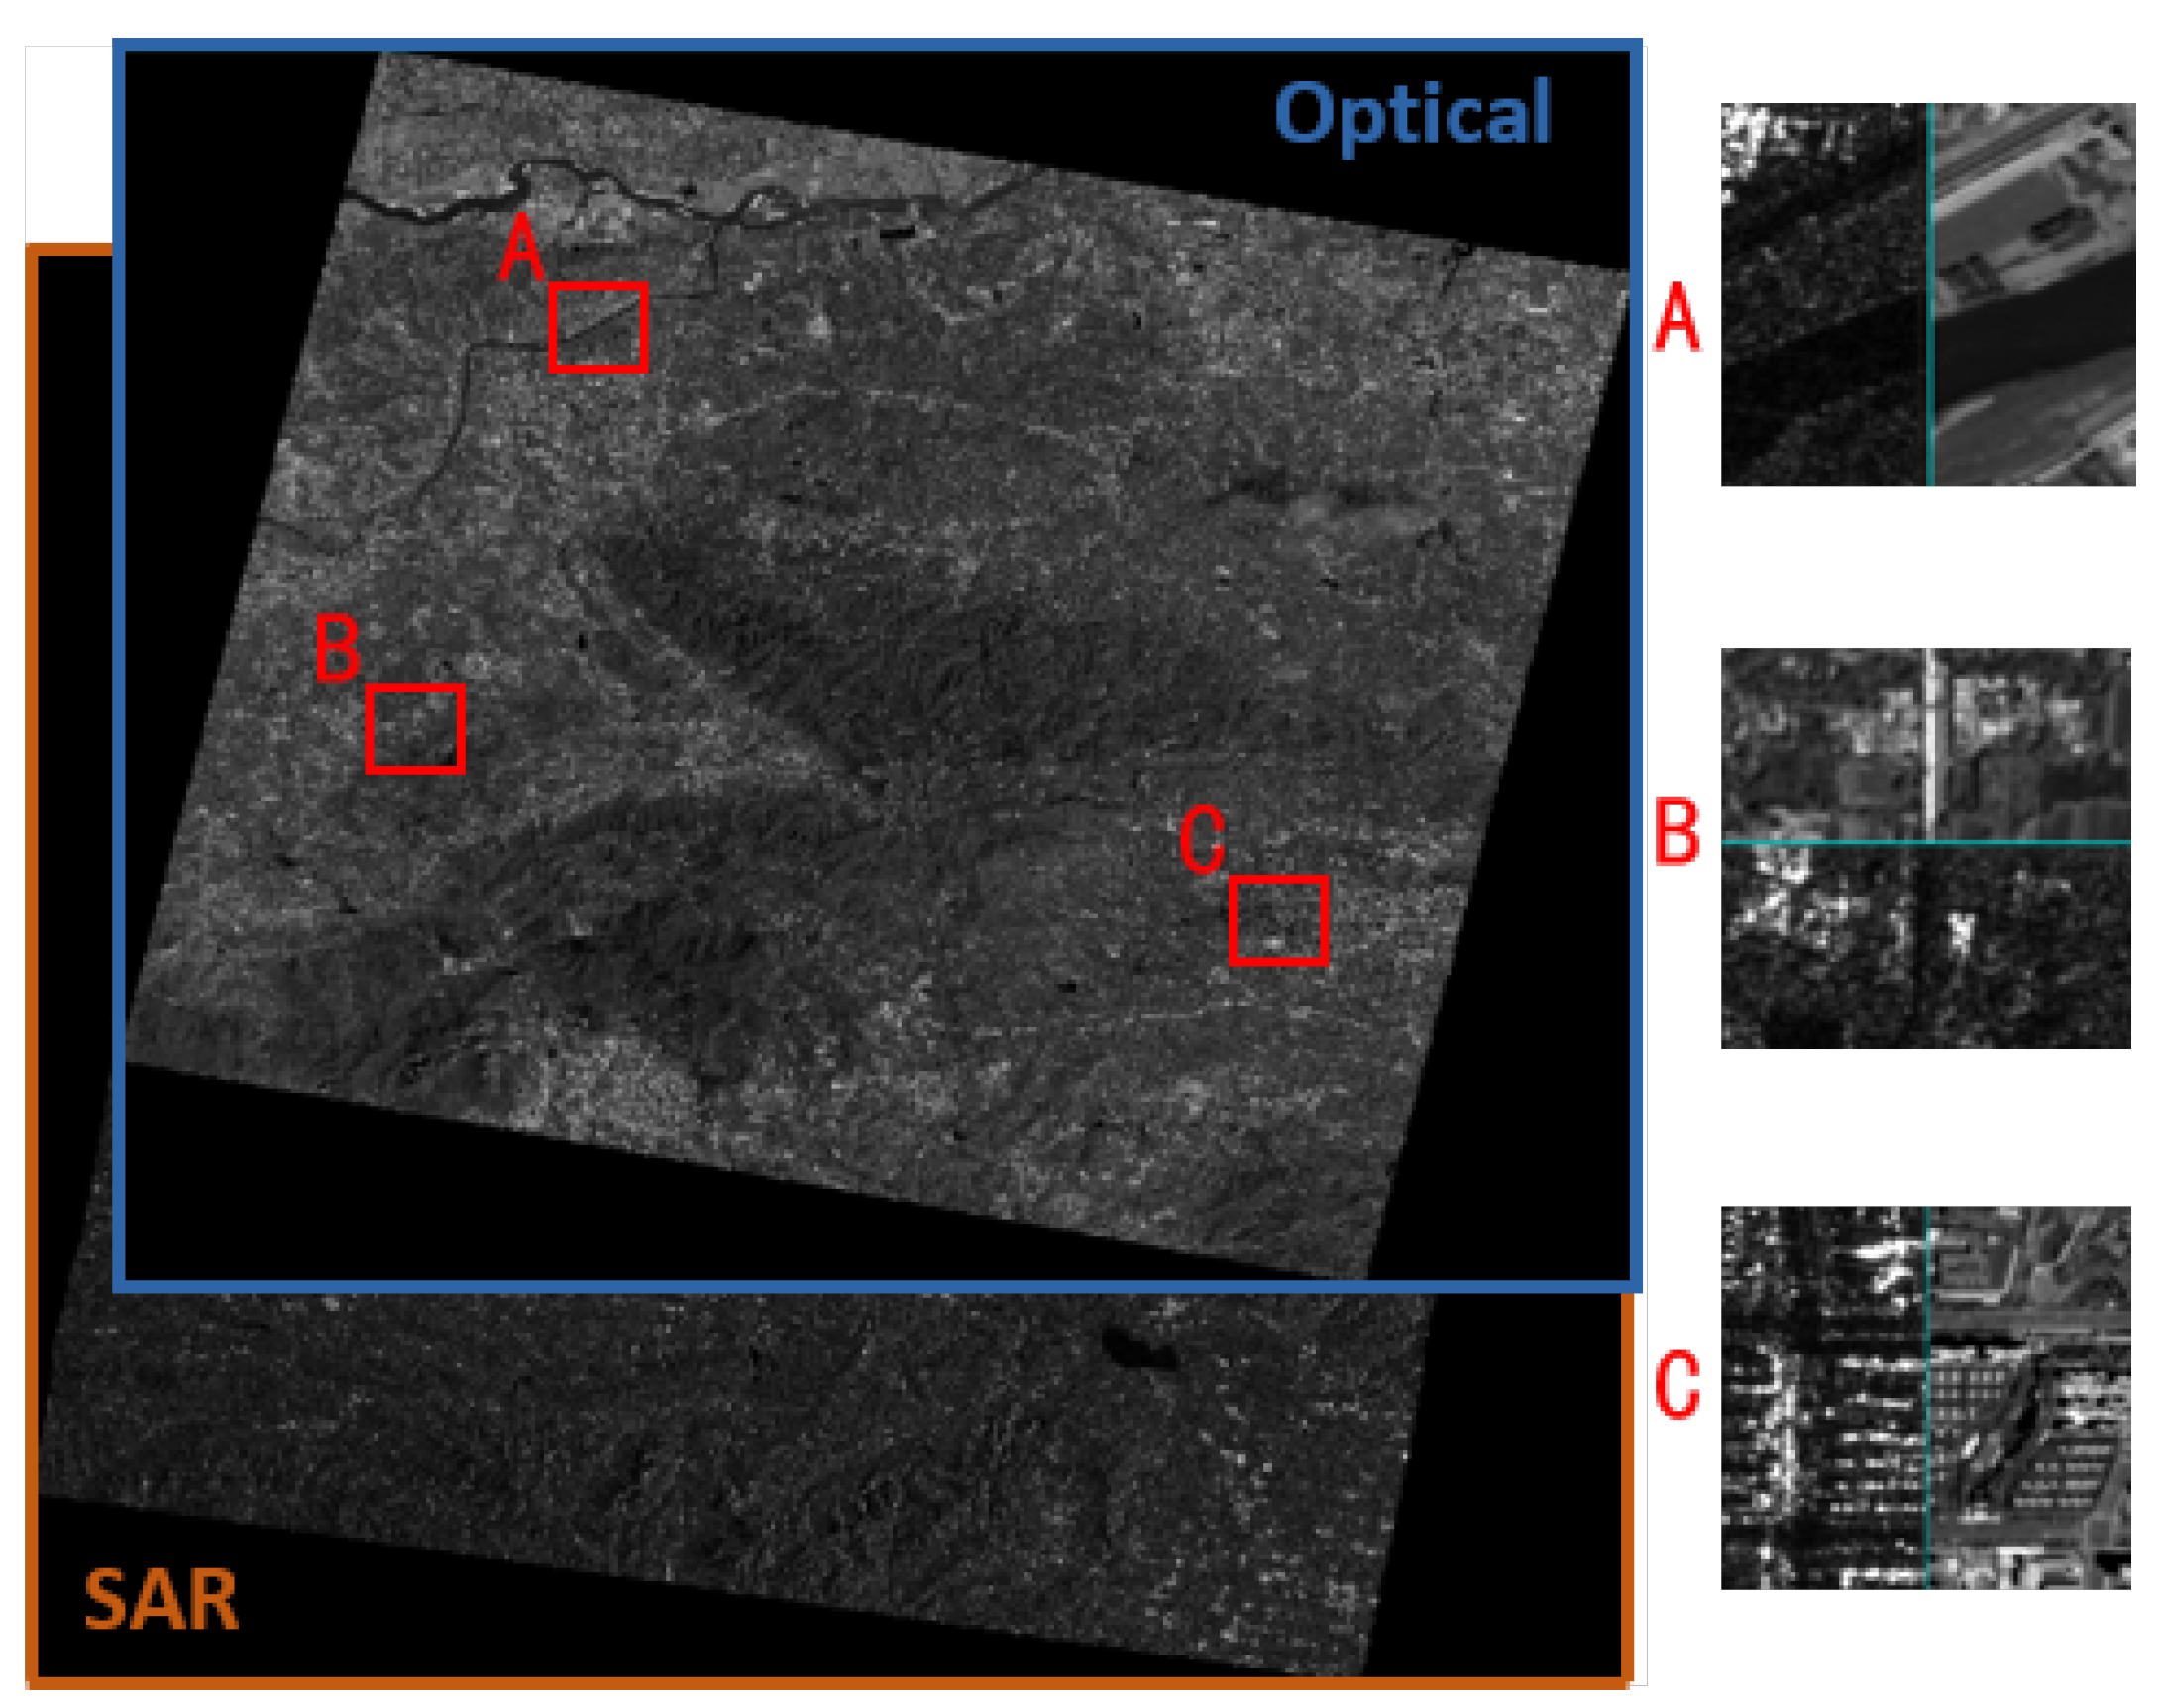
| A | GF-7 (optical) | 0.8 m | 13,301 × 11,637 | 06/2021 | High resolution images over urban areas, |
| GF-3 (SAR) | 3 m | 18,734 × 16,204 | 06/2018 | temporal differences of 36 months (see Figure 11) | |
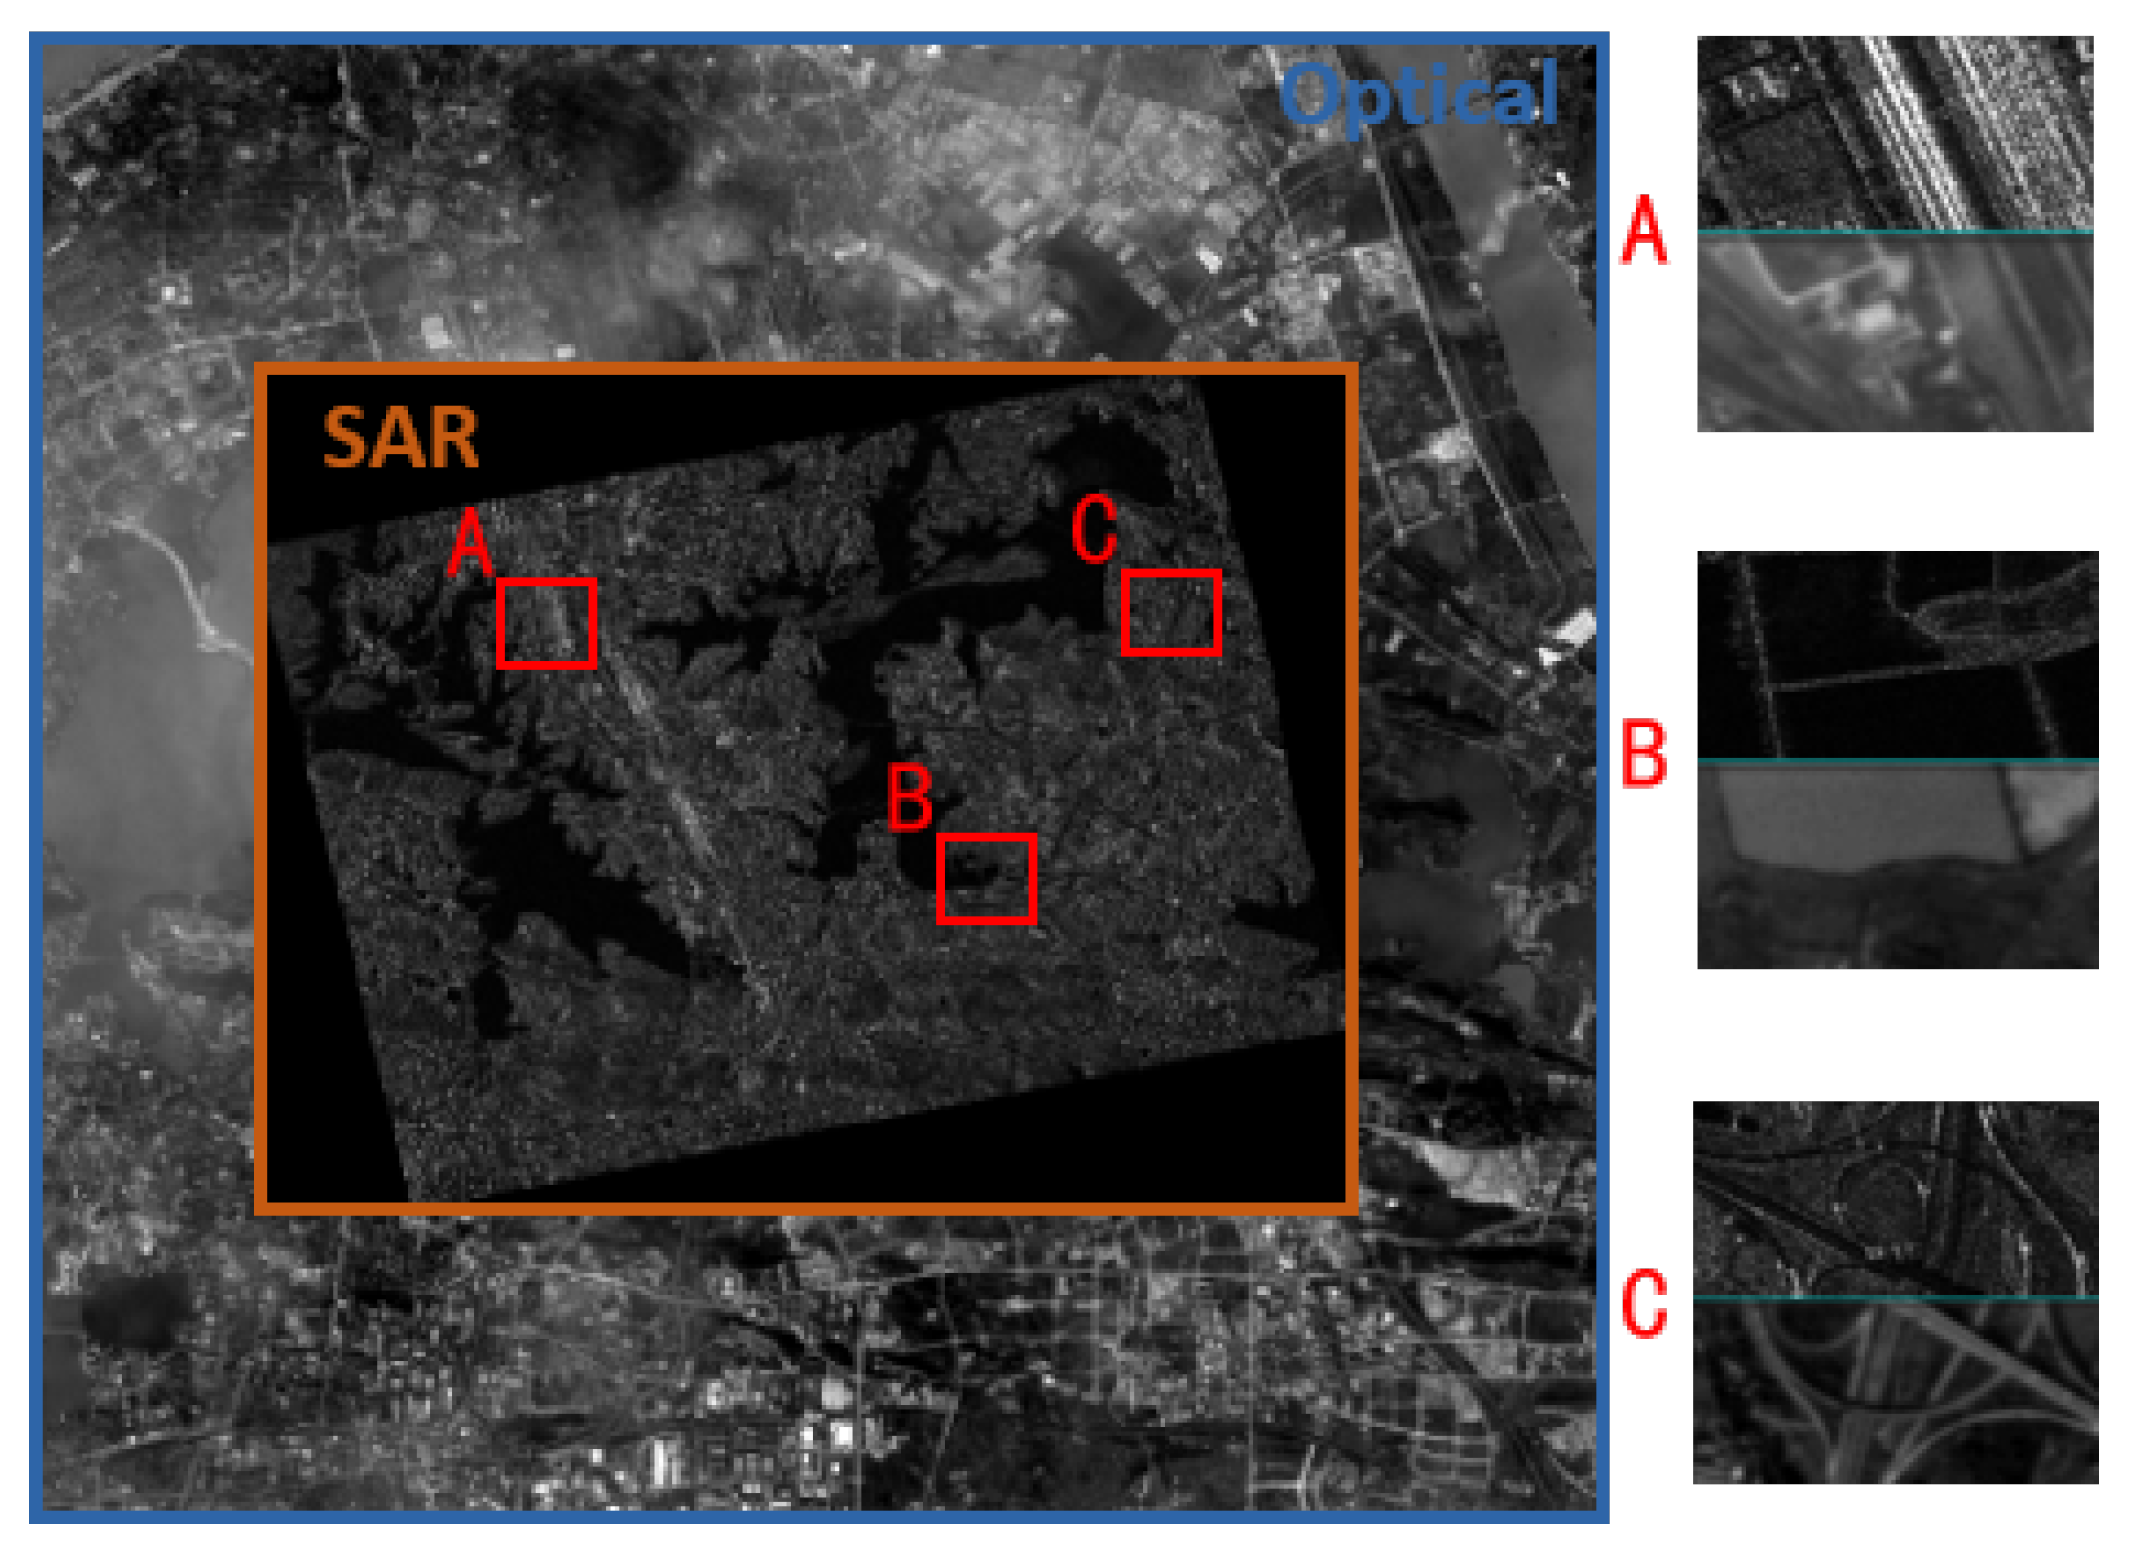
| B | GF-1 (optical) | 2 m | 13,928 × 12,145 | 10/2016 | High resolution images over urban areas |
| GF-3 (SAR) | 3 m | 13,902 × 12,125 | 09/2018 | including rivers, lakes and island (see Figure 12) | |
| C | ZY-3 (optical) | 2 m | 13,928 × 12,145 | 11/2017 | High resolution images over mountain areas, |
| GF-3 (SAR) | 3 m | 13,902 × 12,125 | 04/2019 | significant radiation differences (see Figure 13) | |
| D | GF-2 (optical) | 1 m | 27,141 × 23,631 | 06/2018 | High resolution images over urban areas, |
| GF-3 (SAR) | 3 m | 5459 × 3939 | 01/2019 | Fog interferes with the optical image (see Figure 14) |
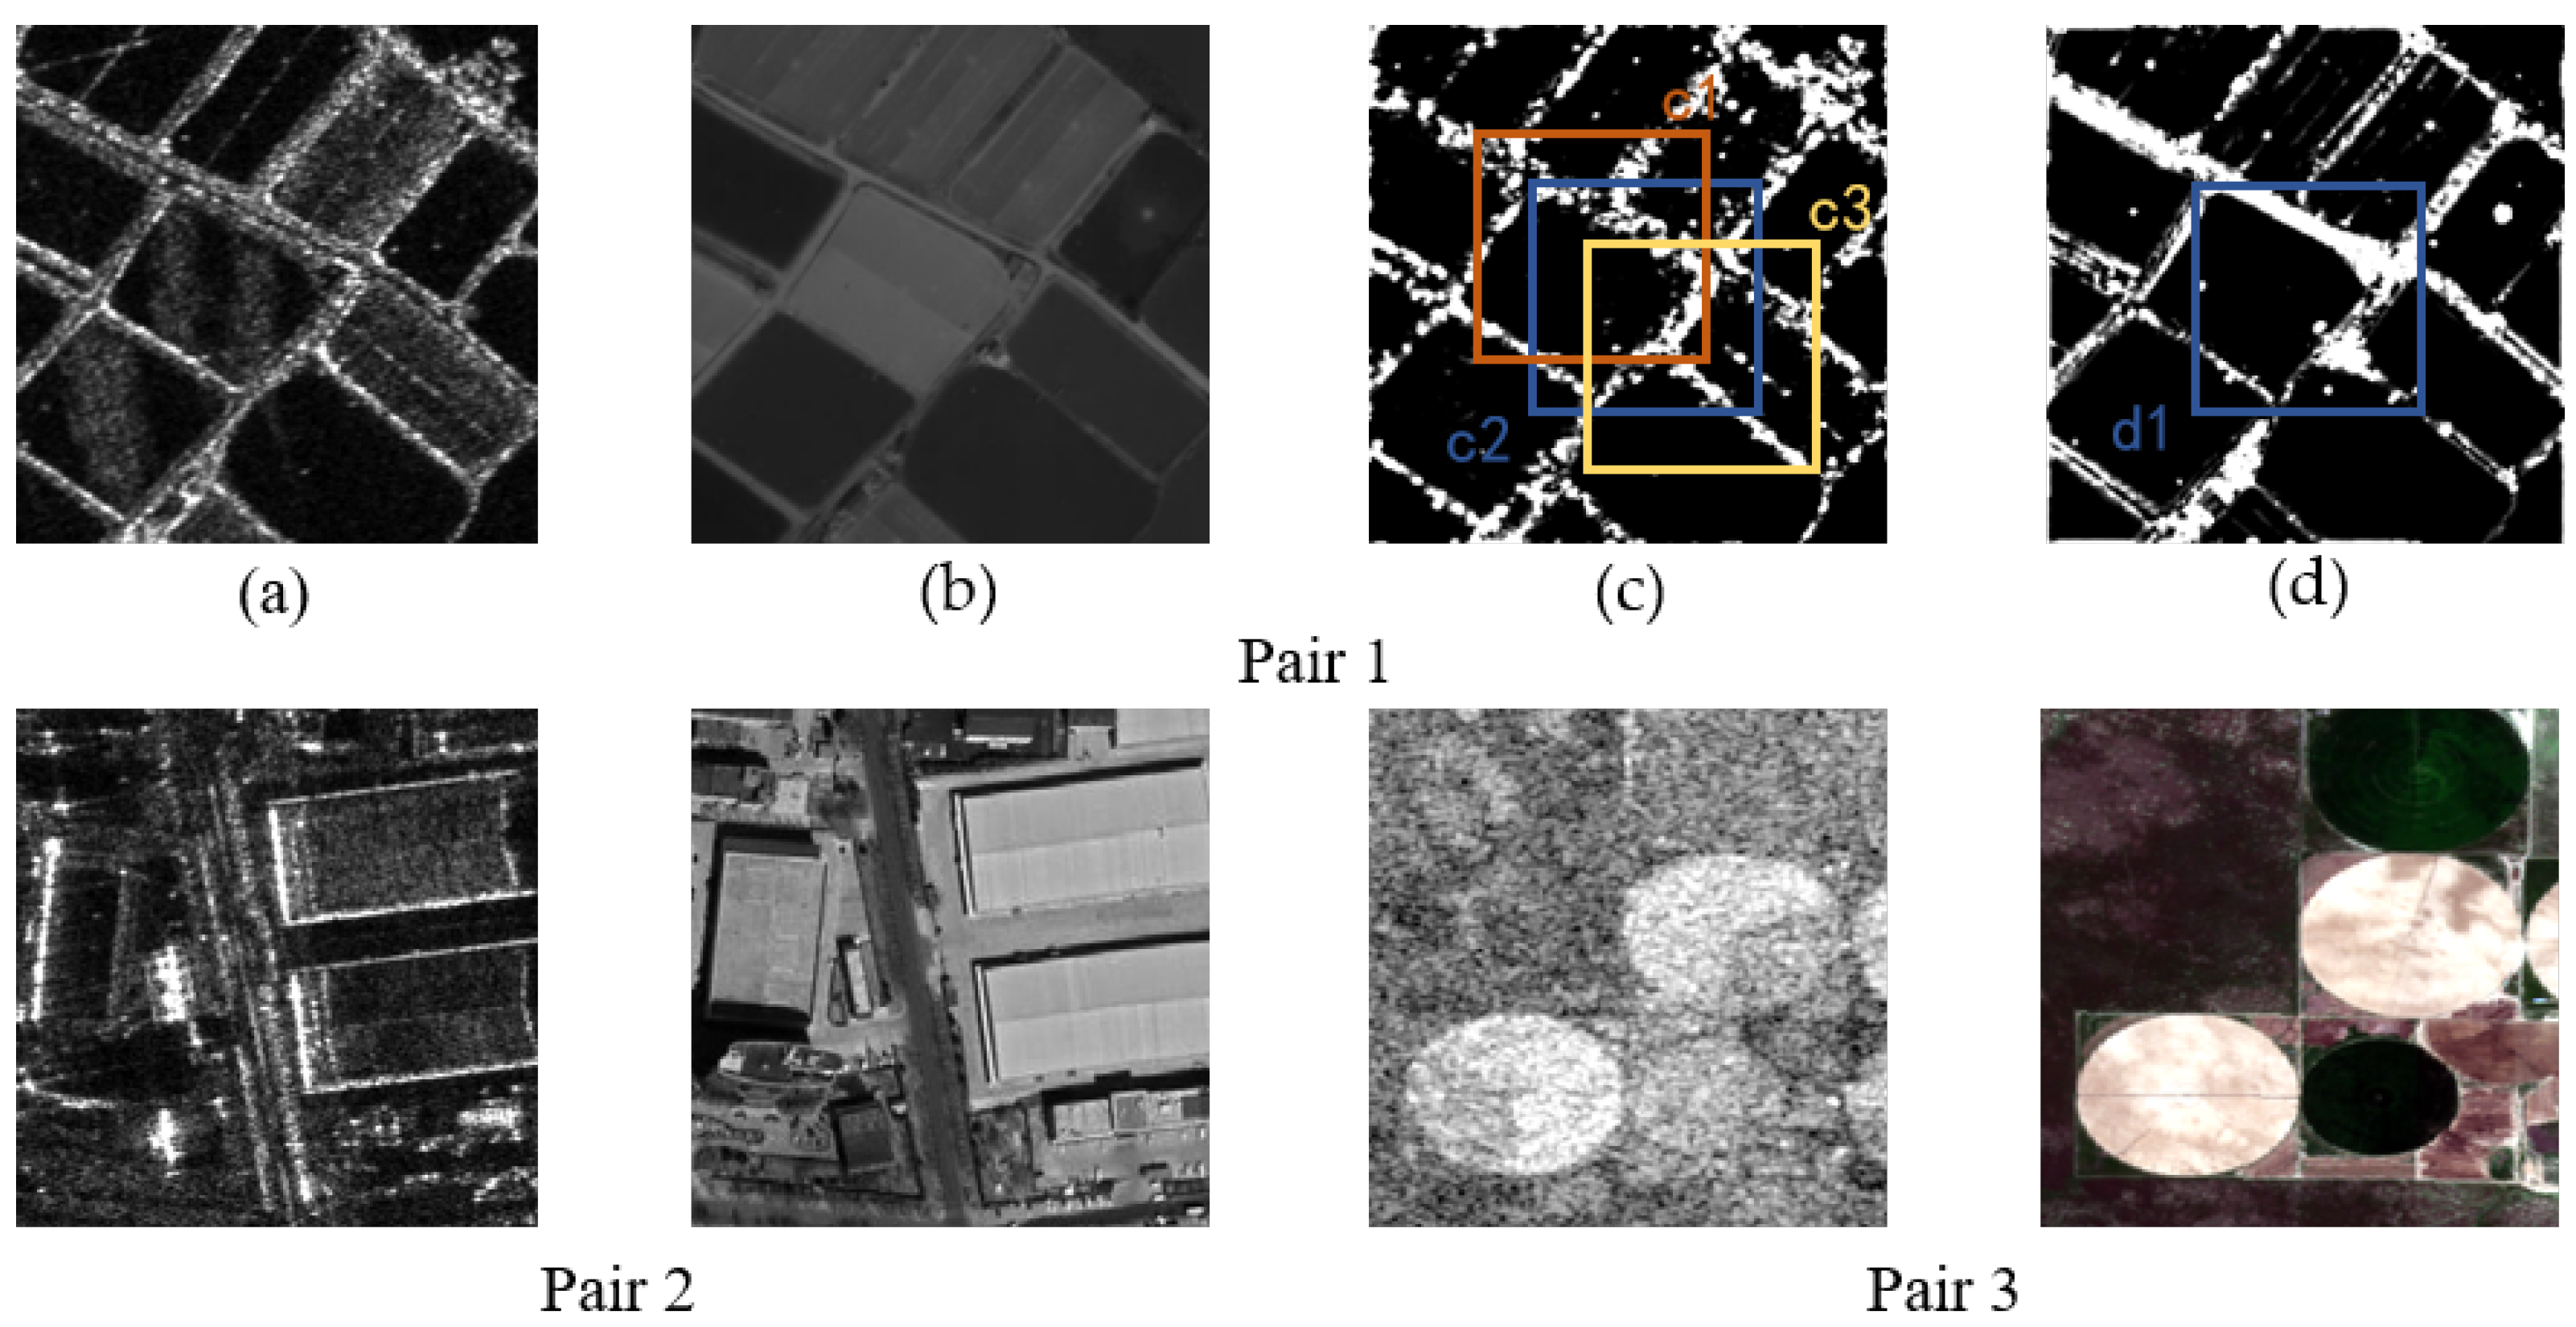
| SSIM | (a, b) | (c, d) | (c1, d1) | (c2, d1) | (c3, d1) |
|---|---|---|---|---|---|
| Pari 1 | 0.21 | 0.95 | 0.91 | 0.94 | 0.91 |
| Pari 2 | 0.33 | 0.91 | 0.88 | 0.91 | 0.86 |
| Pari 3 | 0.18 | 0.73 | 0.81 | 0.89 | 0.85 |
| Method | N0 | NCM | RMSE | NIM | RIM | |
|---|---|---|---|---|---|---|
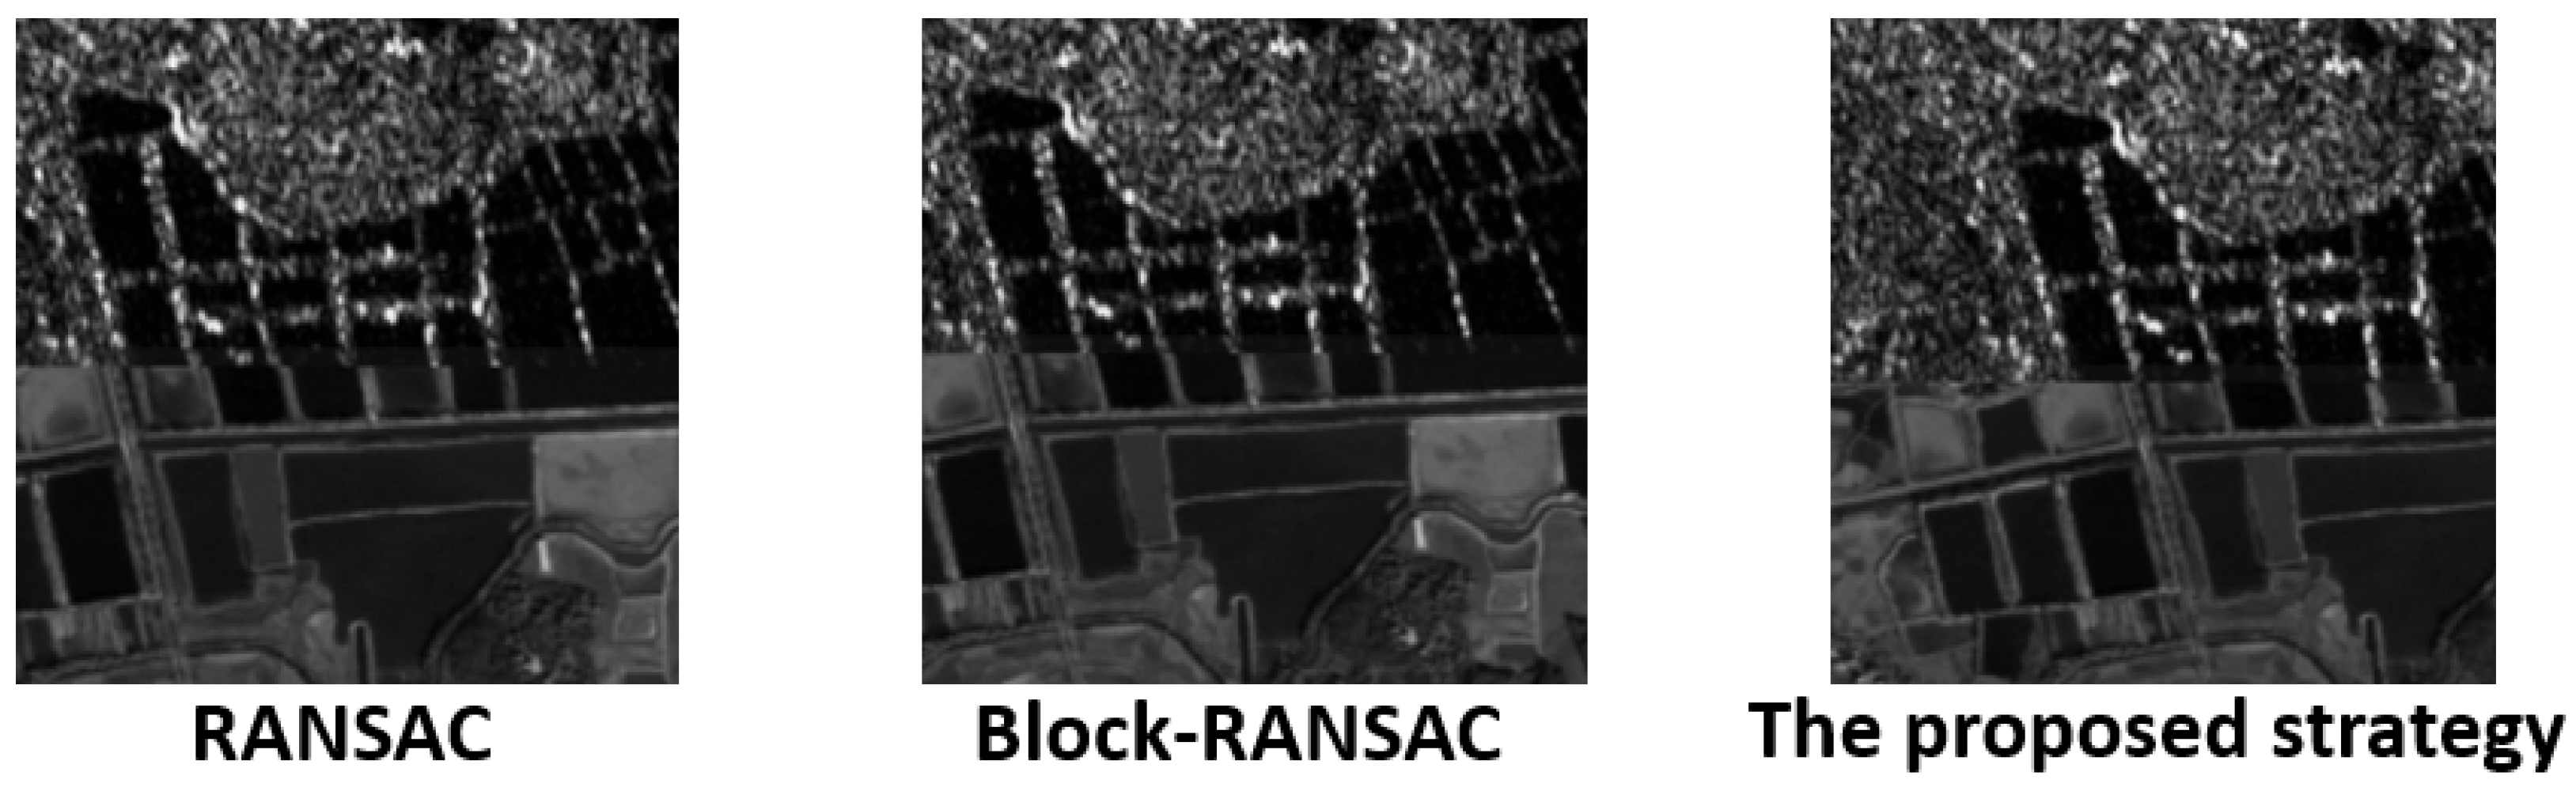
| Pair A | RANSAC | 18 | 17 | 1.10 | 9 | 50% |
| Block-RANSAC | 38 | 35 | 7.23 | 18 | 47% | |
| Our strategy | 31 | 31 | 18.27 | 24 | 81% | |
| Pair B | RANSAC | 78 | 77 | 1.17 | 38 | 48% |
| Block-RANSAC | 99 | 95 | 2.02 | 52 | 52% | |
| Our strategy | 91 | 90 | 7.51 | 70 | 76% | |
| Pair C | RANSAC | 30 | 28 | 1.05 | 13 | 43% |
| Block-RANSAC | 54 | 49 | 10.25 | 23 | 42% | |
| Our strategy | 89 | 86 | 25.50 | 61 | 69% | |
| Pair D | RANSAC | 15 | 15 | 1.08 | 5 | 33% |
| Block-RANSAC | 44 | 42 | 7.27 | 22 | 50% | |
| Our strategy | 41 | 41 | 35.40 | 28 | 68% |
Publisher’s Note: MDPI stays neutral with regard to jurisdictional claims in published maps and institutional affiliations. |
© 2022 by the authors. Licensee MDPI, Basel, Switzerland. This article is an open access article distributed under the terms and conditions of the Creative Commons Attribution (CC BY) license (https://creativecommons.org/licenses/by/4.0/).
Share and Cite
Li, Z.; Zhang, H.; Huang, Y.; Li, H. A Robust Strategy for Large-Size Optical and SAR Image Registration. Remote Sens. 2022, 14, 3012. https://doi.org/10.3390/rs14133012
Li Z, Zhang H, Huang Y, Li H. A Robust Strategy for Large-Size Optical and SAR Image Registration. Remote Sensing. 2022; 14(13):3012. https://doi.org/10.3390/rs14133012
Chicago/Turabian StyleLi, Zeyi, Haitao Zhang, Yihang Huang, and Haifeng Li. 2022. "A Robust Strategy for Large-Size Optical and SAR Image Registration" Remote Sensing 14, no. 13: 3012. https://doi.org/10.3390/rs14133012
APA StyleLi, Z., Zhang, H., Huang, Y., & Li, H. (2022). A Robust Strategy for Large-Size Optical and SAR Image Registration. Remote Sensing, 14(13), 3012. https://doi.org/10.3390/rs14133012