Article

A Robust Strategy for Large-Size Optical and SAR Image Registration

1
Department of Precision Instruments, Tsinghua University, Beijing 100083, China
2
Key Laboratory Photonic Control Technology, Ministry of Education, Tsinghua University, Beijing 100083, China
3
Department of Geomatics, School of Geosciences and Info-Physic, Central South University, Changsha 410000, China
*
Author to whom correspondence should be addressed.
Remote Sens. 2022, 14(13), 3012; https://doi.org/10.3390/rs14133012
Submission received: 8 June 2022 / Revised: 21 June 2022 / Accepted: 22 June 2022 / Published: 23 June 2022
(This article belongs to the Section Remote Sensing Image Processing)

Abstract

:
The traditional template matching strategy of optical and synthetic aperture radar (SAR) is sensitive to the nonlinear transformation between two images. In some cases, the optical and SAR image pairs do not conform to the affine transformation condition. To address this issue, this study presents a novel template matching strategy which uses the One-Class Support Vector Machine (SVM) to remove outliers. First, we propose a method to construct the similarity map dataset using the SEN1-2 dataset for training the One-Class SVM. Second, a four-step strategy for optical and SAR image registration is presented in this paper. In the first step, the optical image is divided into some grids. In the second step, the strongest Harris response point is selected as the feature point in each grid. In the third step, we use Gaussian pyramid features of oriented gradients (GPOG) descriptor to calculate the similarity map in the search region. The trained One-Class SVM is used to remove outliers through similarity maps in the fourth step. Furthermore, the number of improve matches (NIM) and the rate of improve matches (RIM) are designed to measure the effect of image registration. Finally, this paper designs two experiments to prove that the proposed strategy can correctly select the matching points through similarity maps. The experimental results of the One-Class SVM in dataset show that the One-Class SVM can select the correct points in different datasets. The image registration results obtained on the second experiment show that the proposed strategy is robust to the nonlinear transformation between optical and SAR images.

Graphical Abstract

1. Introduction

Optical and SAR image Registration aims to detect control points (CPs) between Optical and SAR images [1]. It can provide important application values in planar block adjustment [2,3], change detection [4], and high-precision geolocation [5]. However, the serious speckle noise, non-linear radiation distortions (NRD), and the non-rigid deformation relationship between the optical and SAR images pair make automatic registration between optical and SAR images challenging [6,7].
Points, lines, and regions are common properties used in image registration. According to the primitive properties of optical and SAR image registration, the matching strategies can be divided into three types: point-based, line-based, and segment-based strategies [8].
The optical and SAR point-based matching strategies are usually divided into four steps: feature detection, feature points matching, outlier removal, transformation, and resampling [9]. In this strategy, the feature points are assumed to be affine invariant [10]. Remote sensing image feature description methods are usually divided into two categories: intensity-based matching methods and feature-based matching methods [11]. Intensity-based matching methods including mutual information methods [12], normalized cross-correlation methods [13] link CPs between images using similarity measures. In contrast to intensity-based methods, feature-based matching methods, including scale-invariant feature transform (SIFT) [14] and histogram of oriented gradient (HOG) [15], are very popular methods to provide the feature descriptor using some invariant features. All of the above methods are sensitive to speckle noise and NRD. To improve the performance in optical and SAR image registration tasks, phase congruency (PC) [16] is introduced into some models such as local histogram of orientated phase congruency (LHOPC) [17] and histogram of oriented phase congruency (HOPC) [18]. When the optical and SAR image pairs only have an offset of a few pixels, HOPC and LHOPC have good performances.
There are a lot of outliers in matching point pairs. These outliers in the point set should be eliminated before using these points to estimate the geometrical transformation [19]. These outlier filtering methods can be roughly divided into two categories: parametric-based methods and nonparametric-based methods [20]. Parametric-based methods always use a hypothesize and verify model to fit an appropriate model. Random sample consensus (RANSAC) [21] is a famous parametric-based method, which randomly selects a sample from the consensus set to calculate the transformation parameters. The performance of RANSAC is robust when correct points are the majority. The performance of RANSAC deteriorates when outliers are the majority. In addition, if a lot of outliers can randomly fit a correspondence method well, the RANSAC method will become very time-consuming and obtain the wrong transformation model. The Fast sample consensus (FSC) [22] improves the sampling technique with RANSAC to make the algorithm faster. Restricted spatial order constraints (RSOC) [23] is proposed to remove outliers for registering aerial images with monotonous backgrounds. Non-parametric-based methods formulate the correspondences in the matching-points dataset by a mixture model by introducing explicit and hidden variables such as vector field consensus (VFC) [24], identifying correspondence function (ICF) [25], coherent spatial matching (CSM) [26], and coherence point drift (CPD) [27]. A vector field is used in VFC to estimate the consistency of correct correspondences after non-parametric geometric transformations. Diagnostic techniques and support vector machine are used in ICF to learn a correct correspondence function. CSM uses the thin-plate spline function to parameterize the coherent spatial mapping. CPD chooses the Gaussian mixture model to formulate the point registration problem. However, the computational complexity of these above outlier filters increases rapidly as the image size increases and the number of matching points increases.
The typical optical and SAR line-based matching strategy is usually divided into four steps: line segment extraction, line feature intersection, outlier removal, transformation, and resampling [28]. In this method, the feature points are found by intersecting lines. Hu [29] proposed a parameter fitting method based on a genetic algorithm, which improved the ability to search global maximum value. Sui [30] introduced the Voronoi diagram into spectral point matching to further enhance the matching accuracy between two sets of line intersections. This algorithm has strong robustness in the region with obvious line features. These line-based matching strategies can only work in areas with strong line features. However, line features will become fewer as the image becomes larger.
The classic optical and SAR region-based matching strategy is usually divided into four steps: region segment extraction, point feature extraction, iterative optimal, transformation, and resampling. In this method, an edge-based selection in the regional segment is involved to detect the corresponding CPs. Bentoutou [31] used Hu moment to characterize the local area of the image to achieve regional matching between SPOT image and SAR image. To avoid failed registration caused by poor image segmentation, iterative level set and SIFT (ILS-SIFT) [32] is proposed using level set segmentation to obtain conjugate features between optical and SAR images. However, region-based algorithms can only work well in areas such as farmland, rivers and lakes.
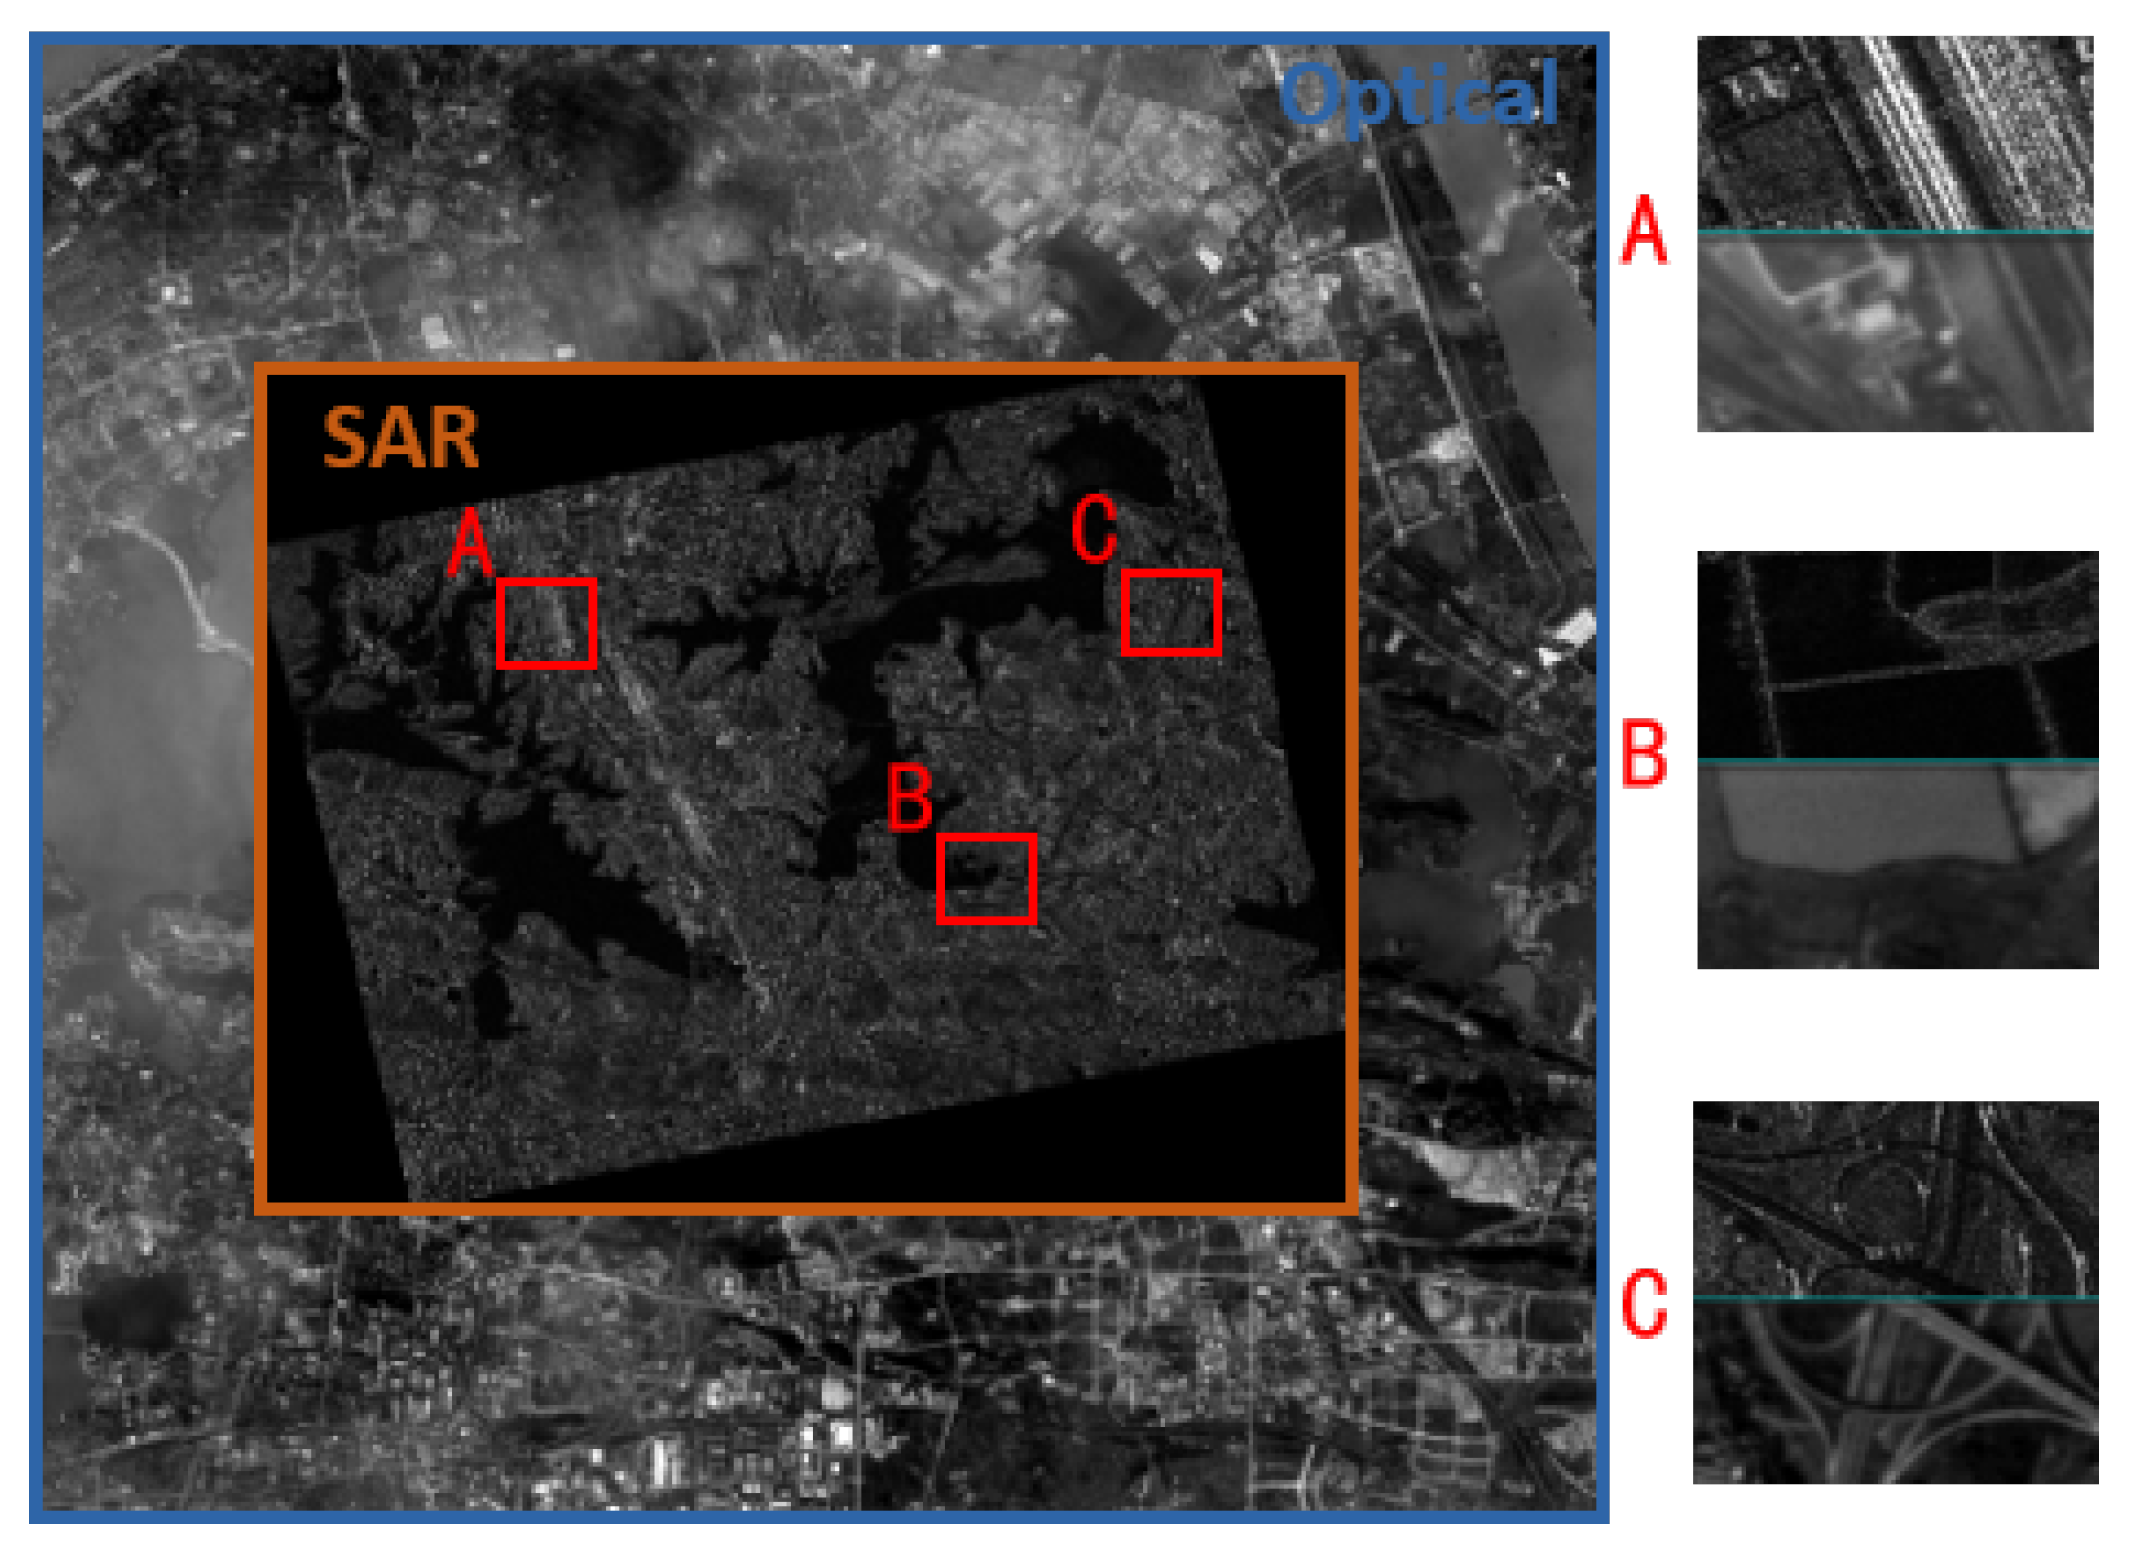
The above matching strategies can achieve good results in some specific scenes. These methods use the affine transformation model to remove outliers. Due to the difference in imaging modes and angles, optical and SAR image pair has a non-rigid deformation relationship. As the size of images increases, the nonlinear deformation between images becomes non-negligible and the affine transformation condition is not satisfied (see Figure 1). To solve the nonlinear deformation problem, the common method is to divide the large-size images into some small blocks and then match the corresponding block pairs [33]. However, the manual blocks do not reflect the real deformation relationship between the image pair, which can lead to mismatching. Fan [34] proposed a large-size image matching strategy based on image pyramids. However, this pyramid strategy still assumes that the two images satisfy the affine transformation condition. Therefore, an outliers elimination algorithm without a transformation model is needed.

2. Motivation and Contribution

In our recent works, we proposed an optical and SAR image matching method based on the Gaussian pyramid, which is invariant to illumination and speckle noise [35]. However, when we increased the image size in the experiment, the matching points do not increase significantly. Through comparison, we found the effect of descriptors was not bad, but a large number of correct matching points were deleted during the removal of outliers. Therefore, this paper aims to propose an optical and SAR image matching strategy that depends on the relationship between points to eliminate outliers.
The feature proposed in this paper is built in two stages. First, we combine the one-class classification [36] with template matching for the first time. We train the One-Class SVM based on the SEN1-2 dataset [37] and use the One-Class SVM to classify similarity maps. In this way, the process of eliminating outliers is not limited by the size of the point-set and the transformation model. Second, we propose a new optical and SAR image registration strategy based on a robust feature selection model, which uses the similarity map to predict the correct CPs. Our image matching strategy is not based on the relationship between point sets but the texture of the similarity map generated in the template matching process. This strategy can avoid the influence of nonlinear deformation of the optical and SAR image pair. The main contribution of our strategy is to solve the problem of outliers removal due to the non-rigid deformation relationship between optical and SAR images.
The remainder of this paper is organized as follows. Section 3 presents the proposed optical and SAR images strategy based on a robust feature selection model; Section 4 evaluates the performance of this strategy; Section 5 presents our conclusions and recommendations for future work.

3. Methodology

The proposed matching framework mainly consists of four steps: the similarity map, the One-Class SVM, the creation of training data, and the optical and SAR image registration strategy.

3.1. The Similarity Map

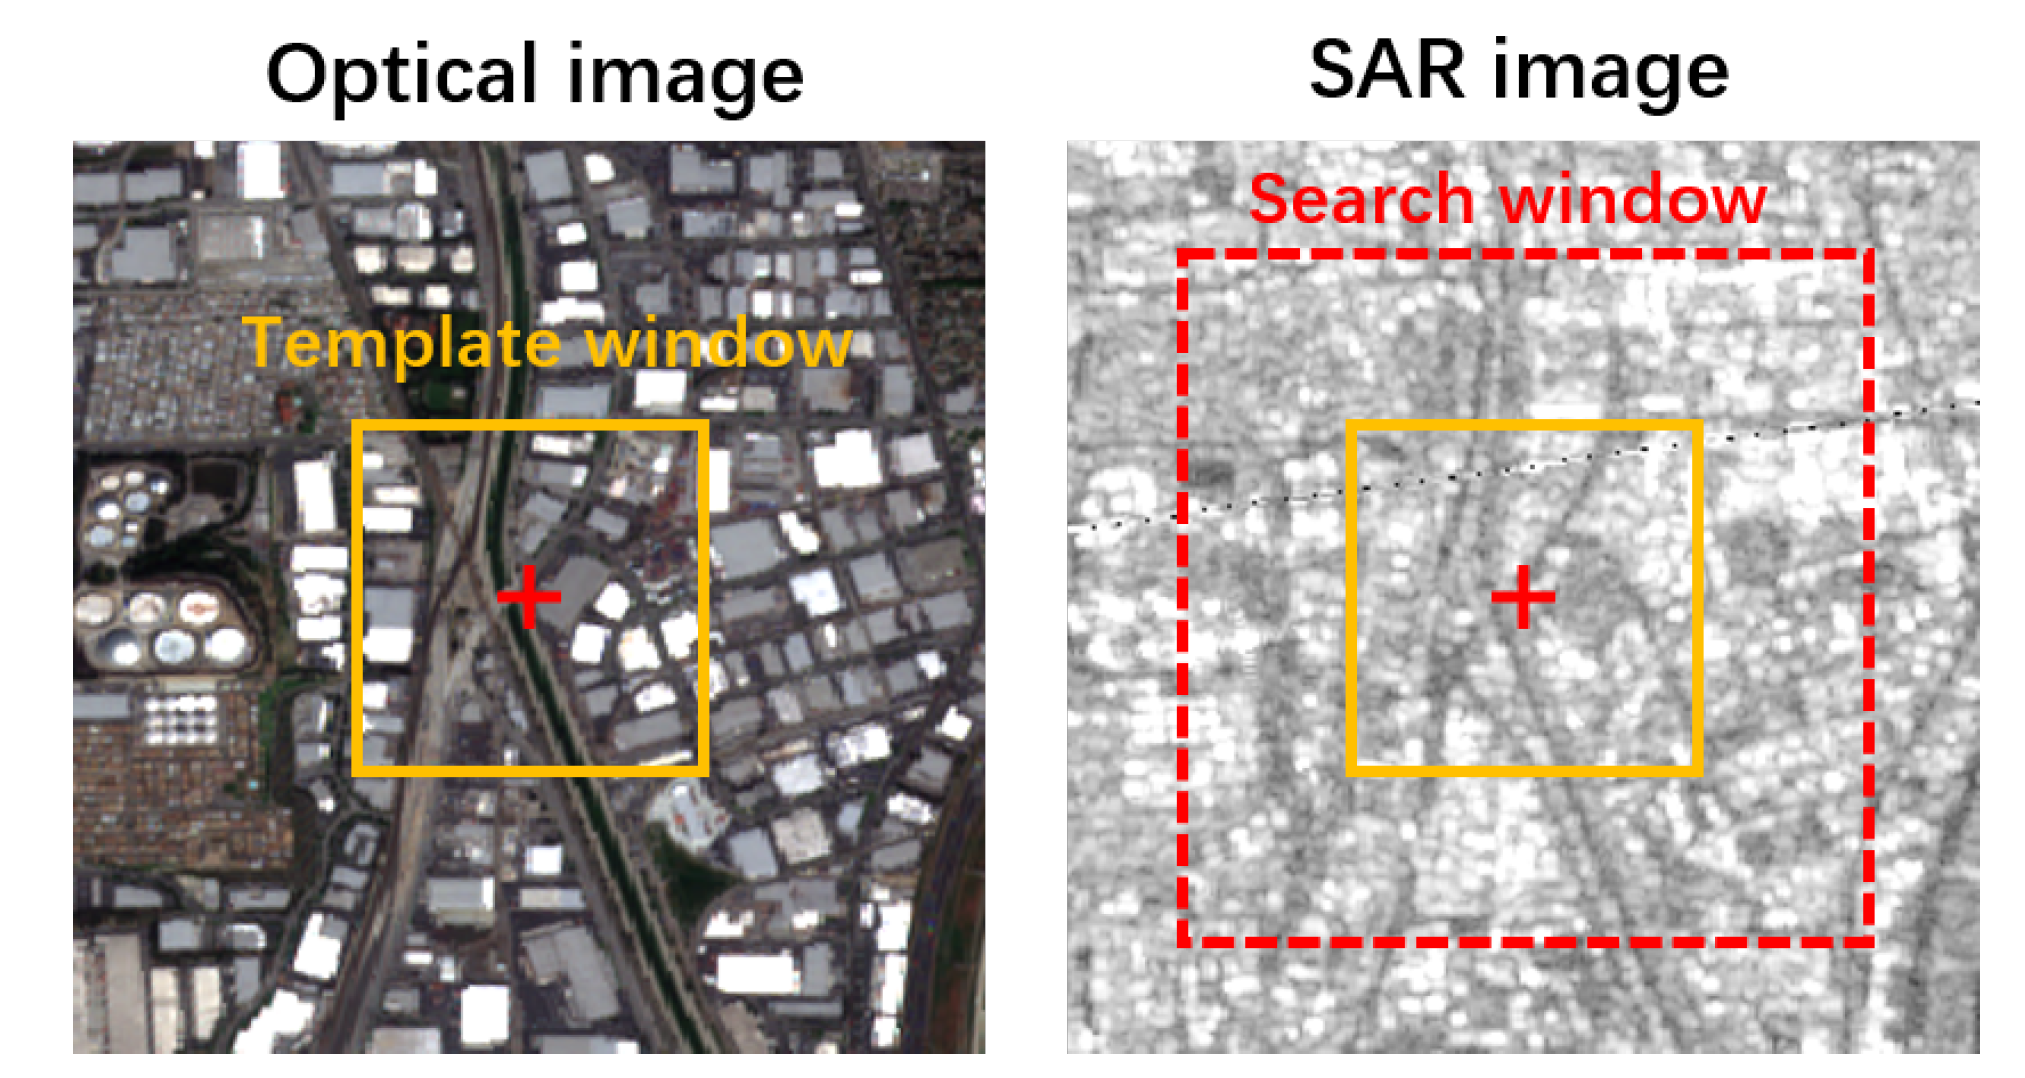
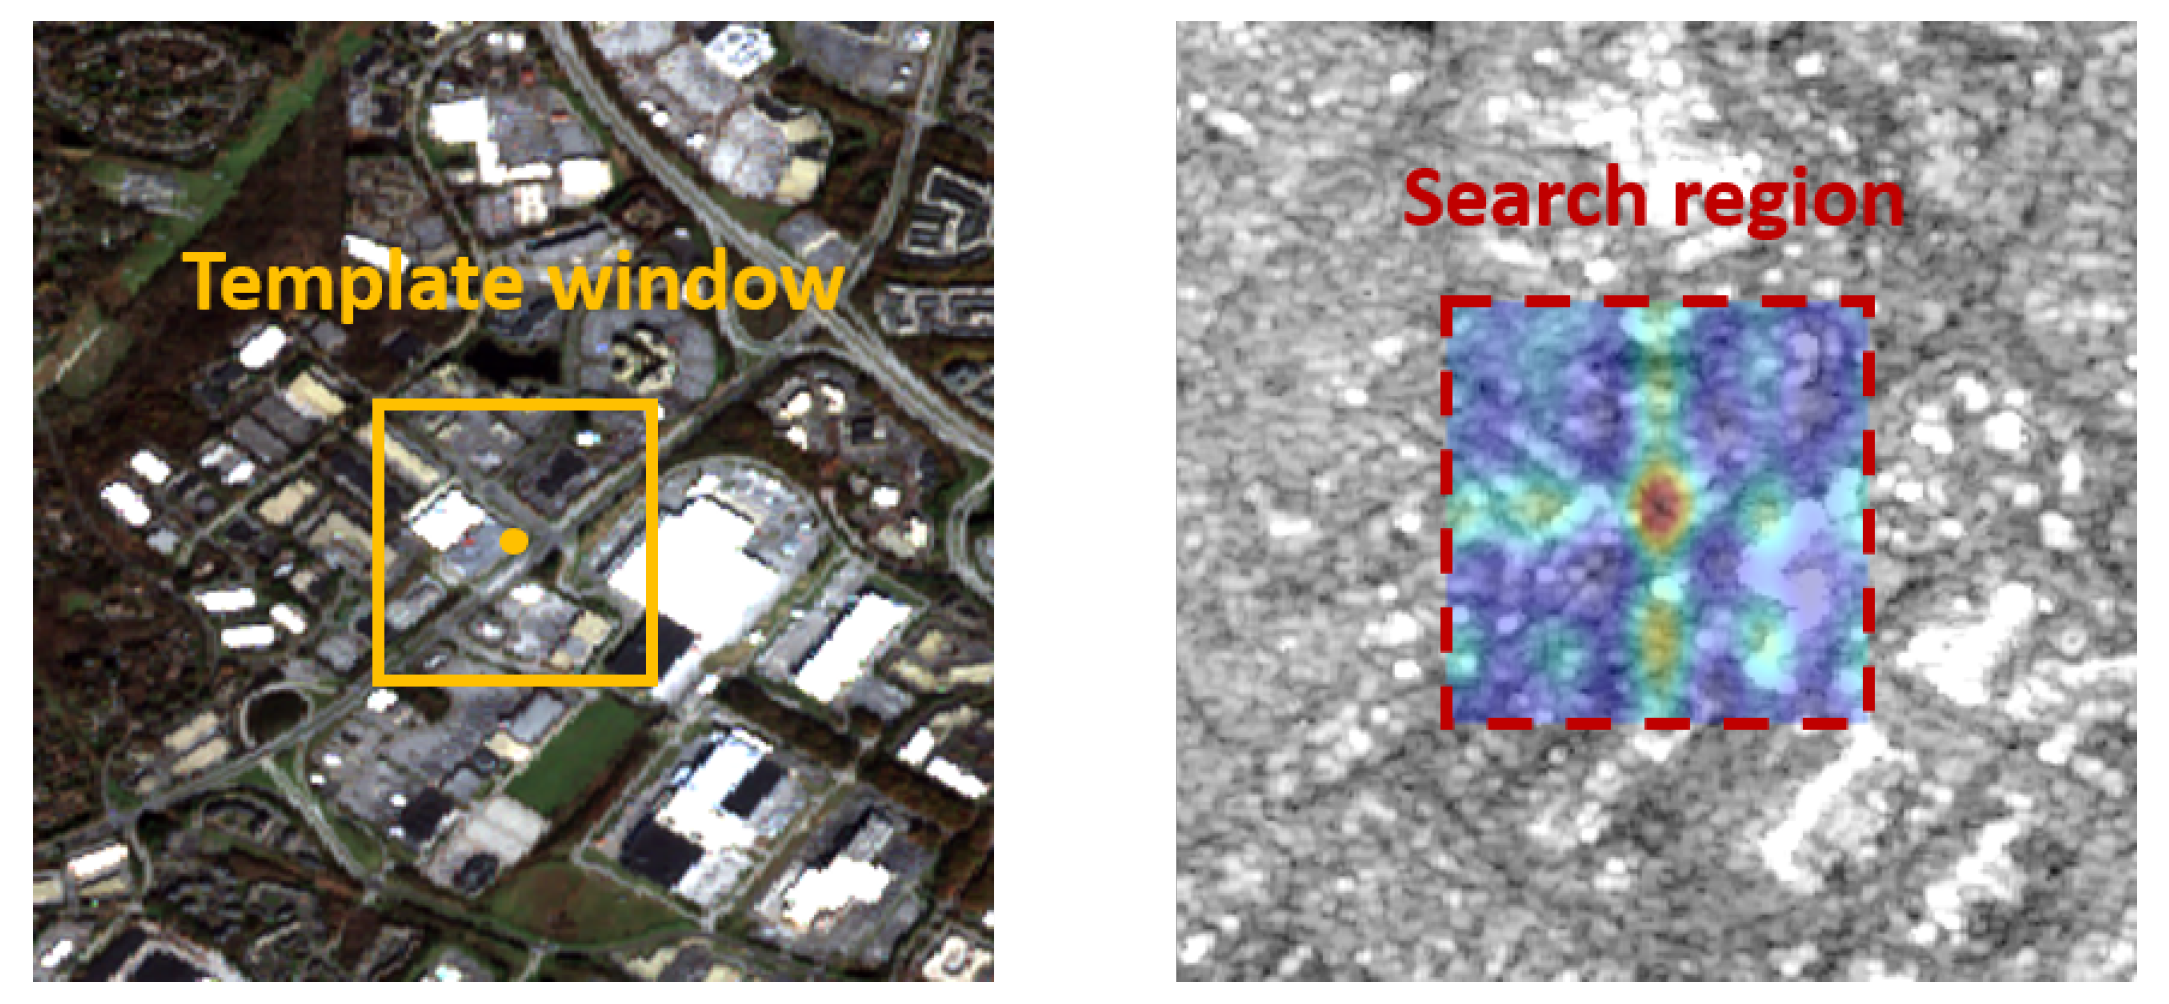
The similarity map is always used to testify the performance of the descriptor (see Figure 2). In the process of the template matching task, if the feature descriptor detects a table matching point, an extreme similarity value will appear in the similarity map. In contrast, if there is no outstanding extreme value in the similarity map, it proves that the image difference in the search region is large and cannot be accurately found the correct point because of nonlinear radiation difference or time difference. We use the normalized cross-correlation (NCC) of the descriptor as the similarity metric for this task.
d n c c = x = 1 n P A x P A ¯ P B x P B ¯ x = 1 n P A x P A ¯ 2 x = 1 n P B x P B ¯ 2 .
In the NCC formula, P A x and P B x are the feature descriptor between optical and SAR images when P A ¯ and P B ¯ are the means of P A x and P B x . d n c c is the NCC number which ranges from −1 to 1 where 1 means the most relevant between two feature descriptors.
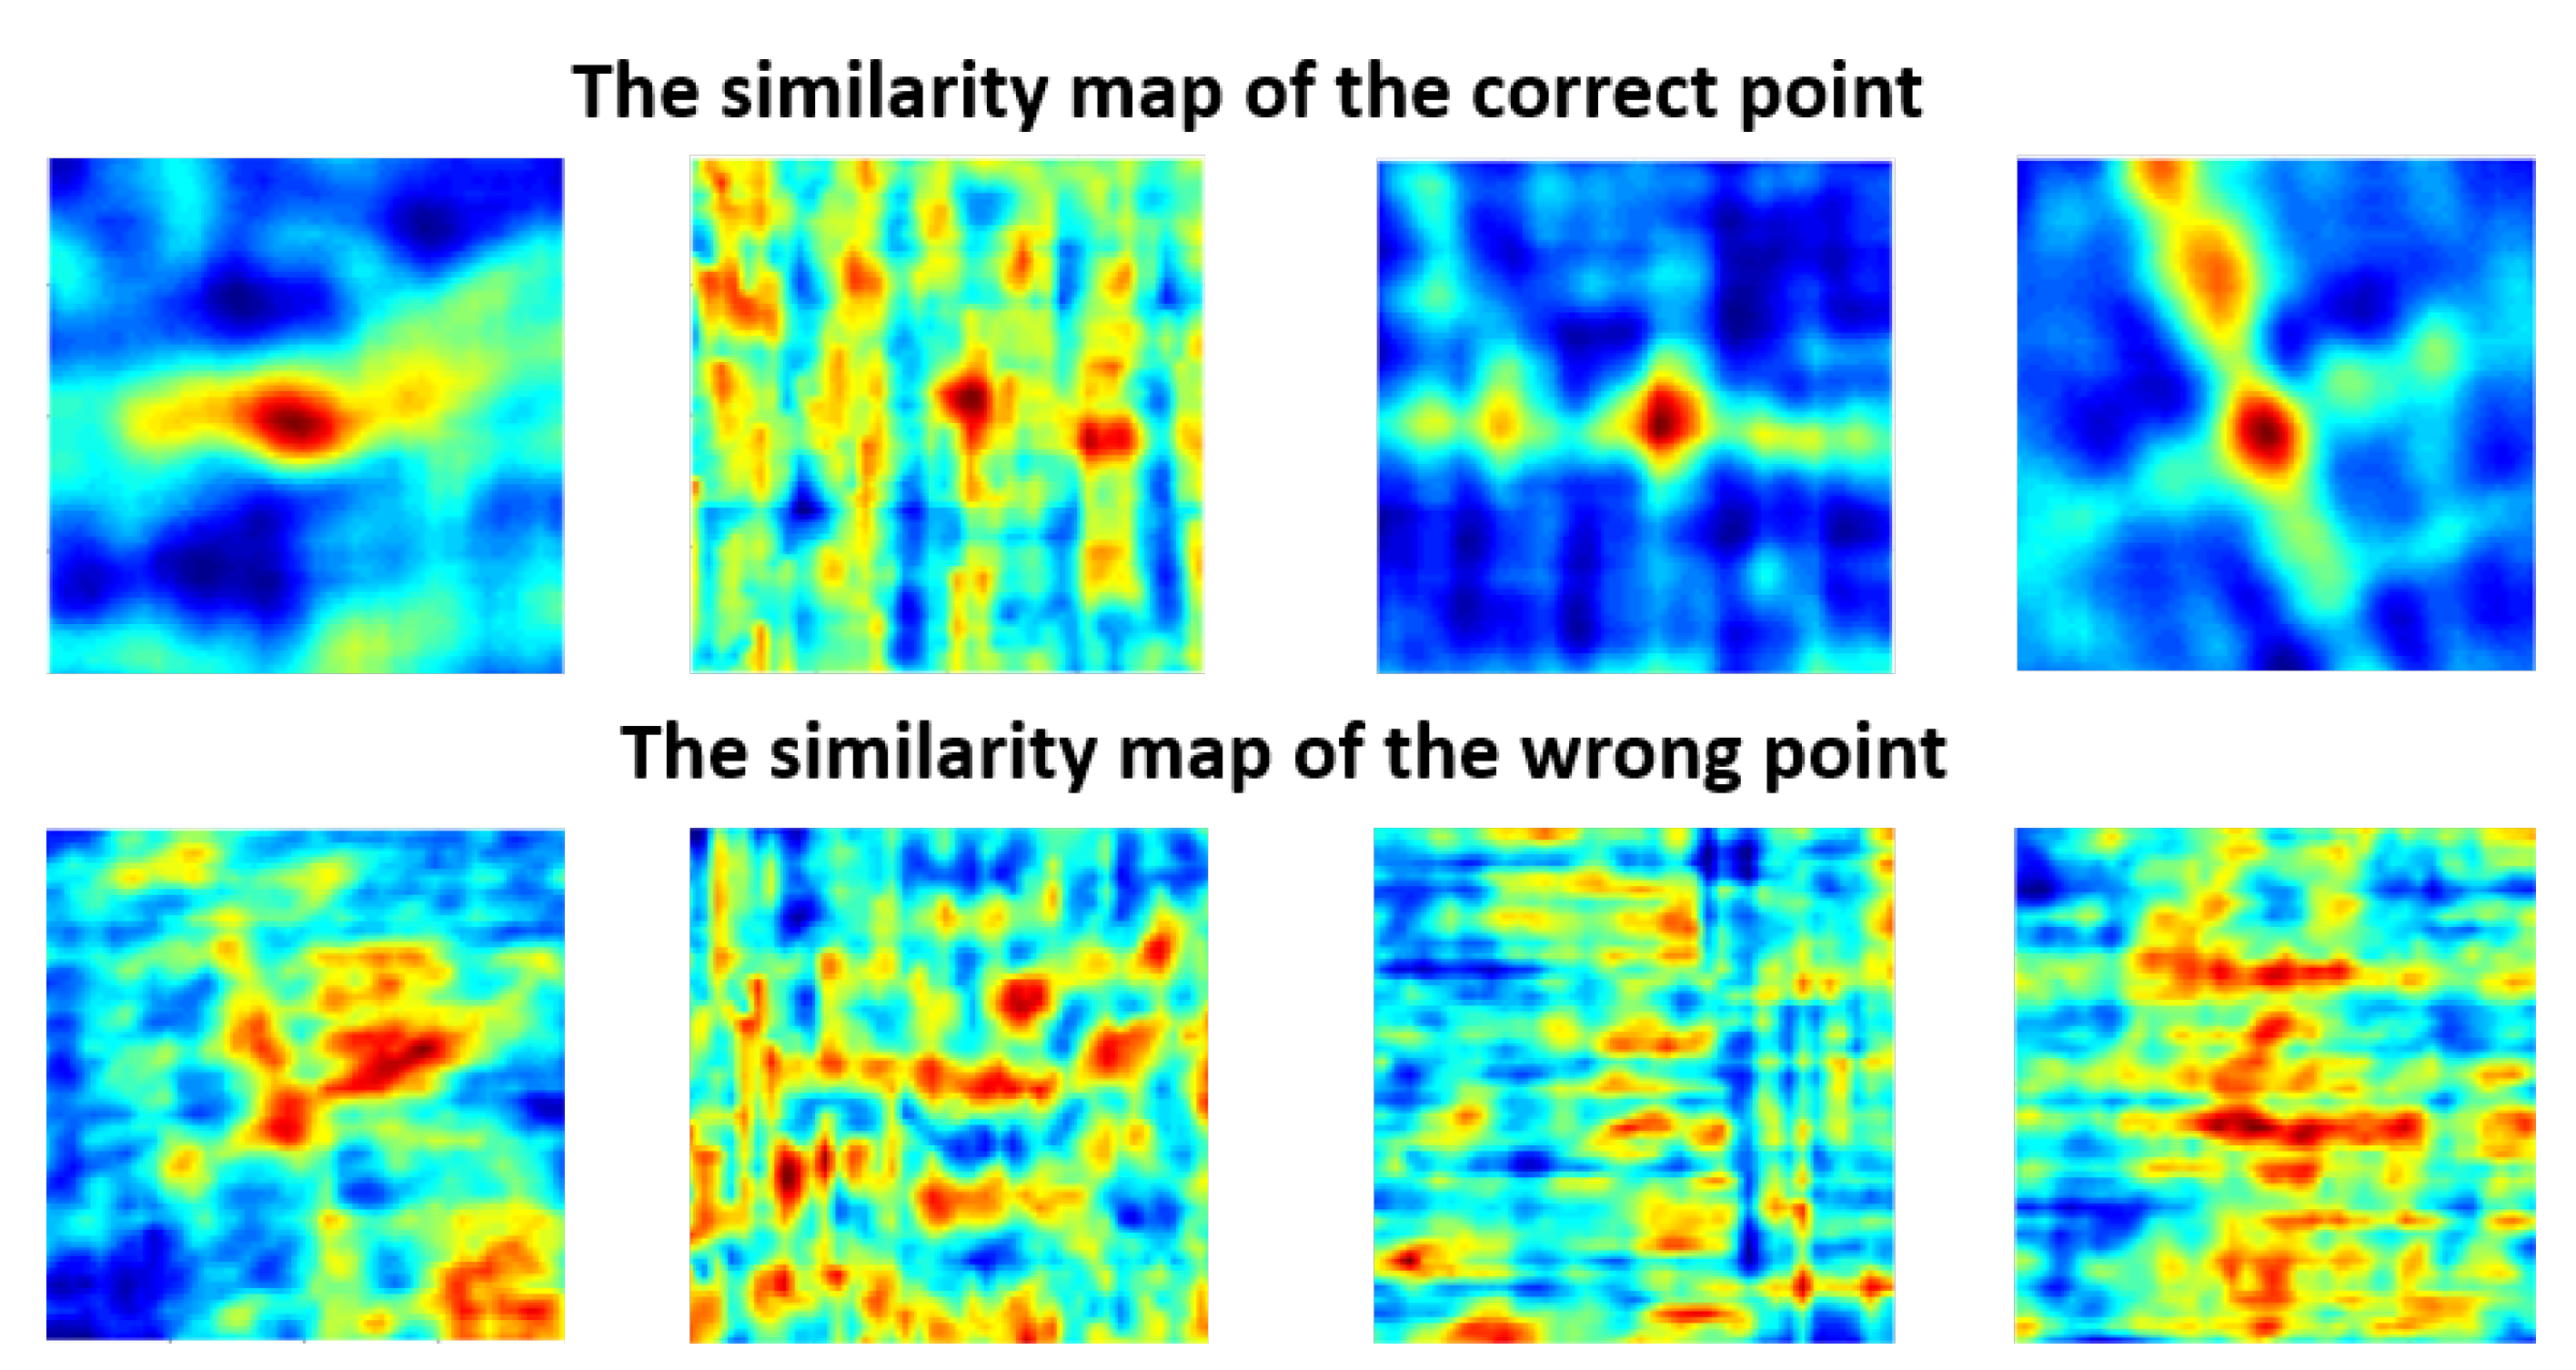
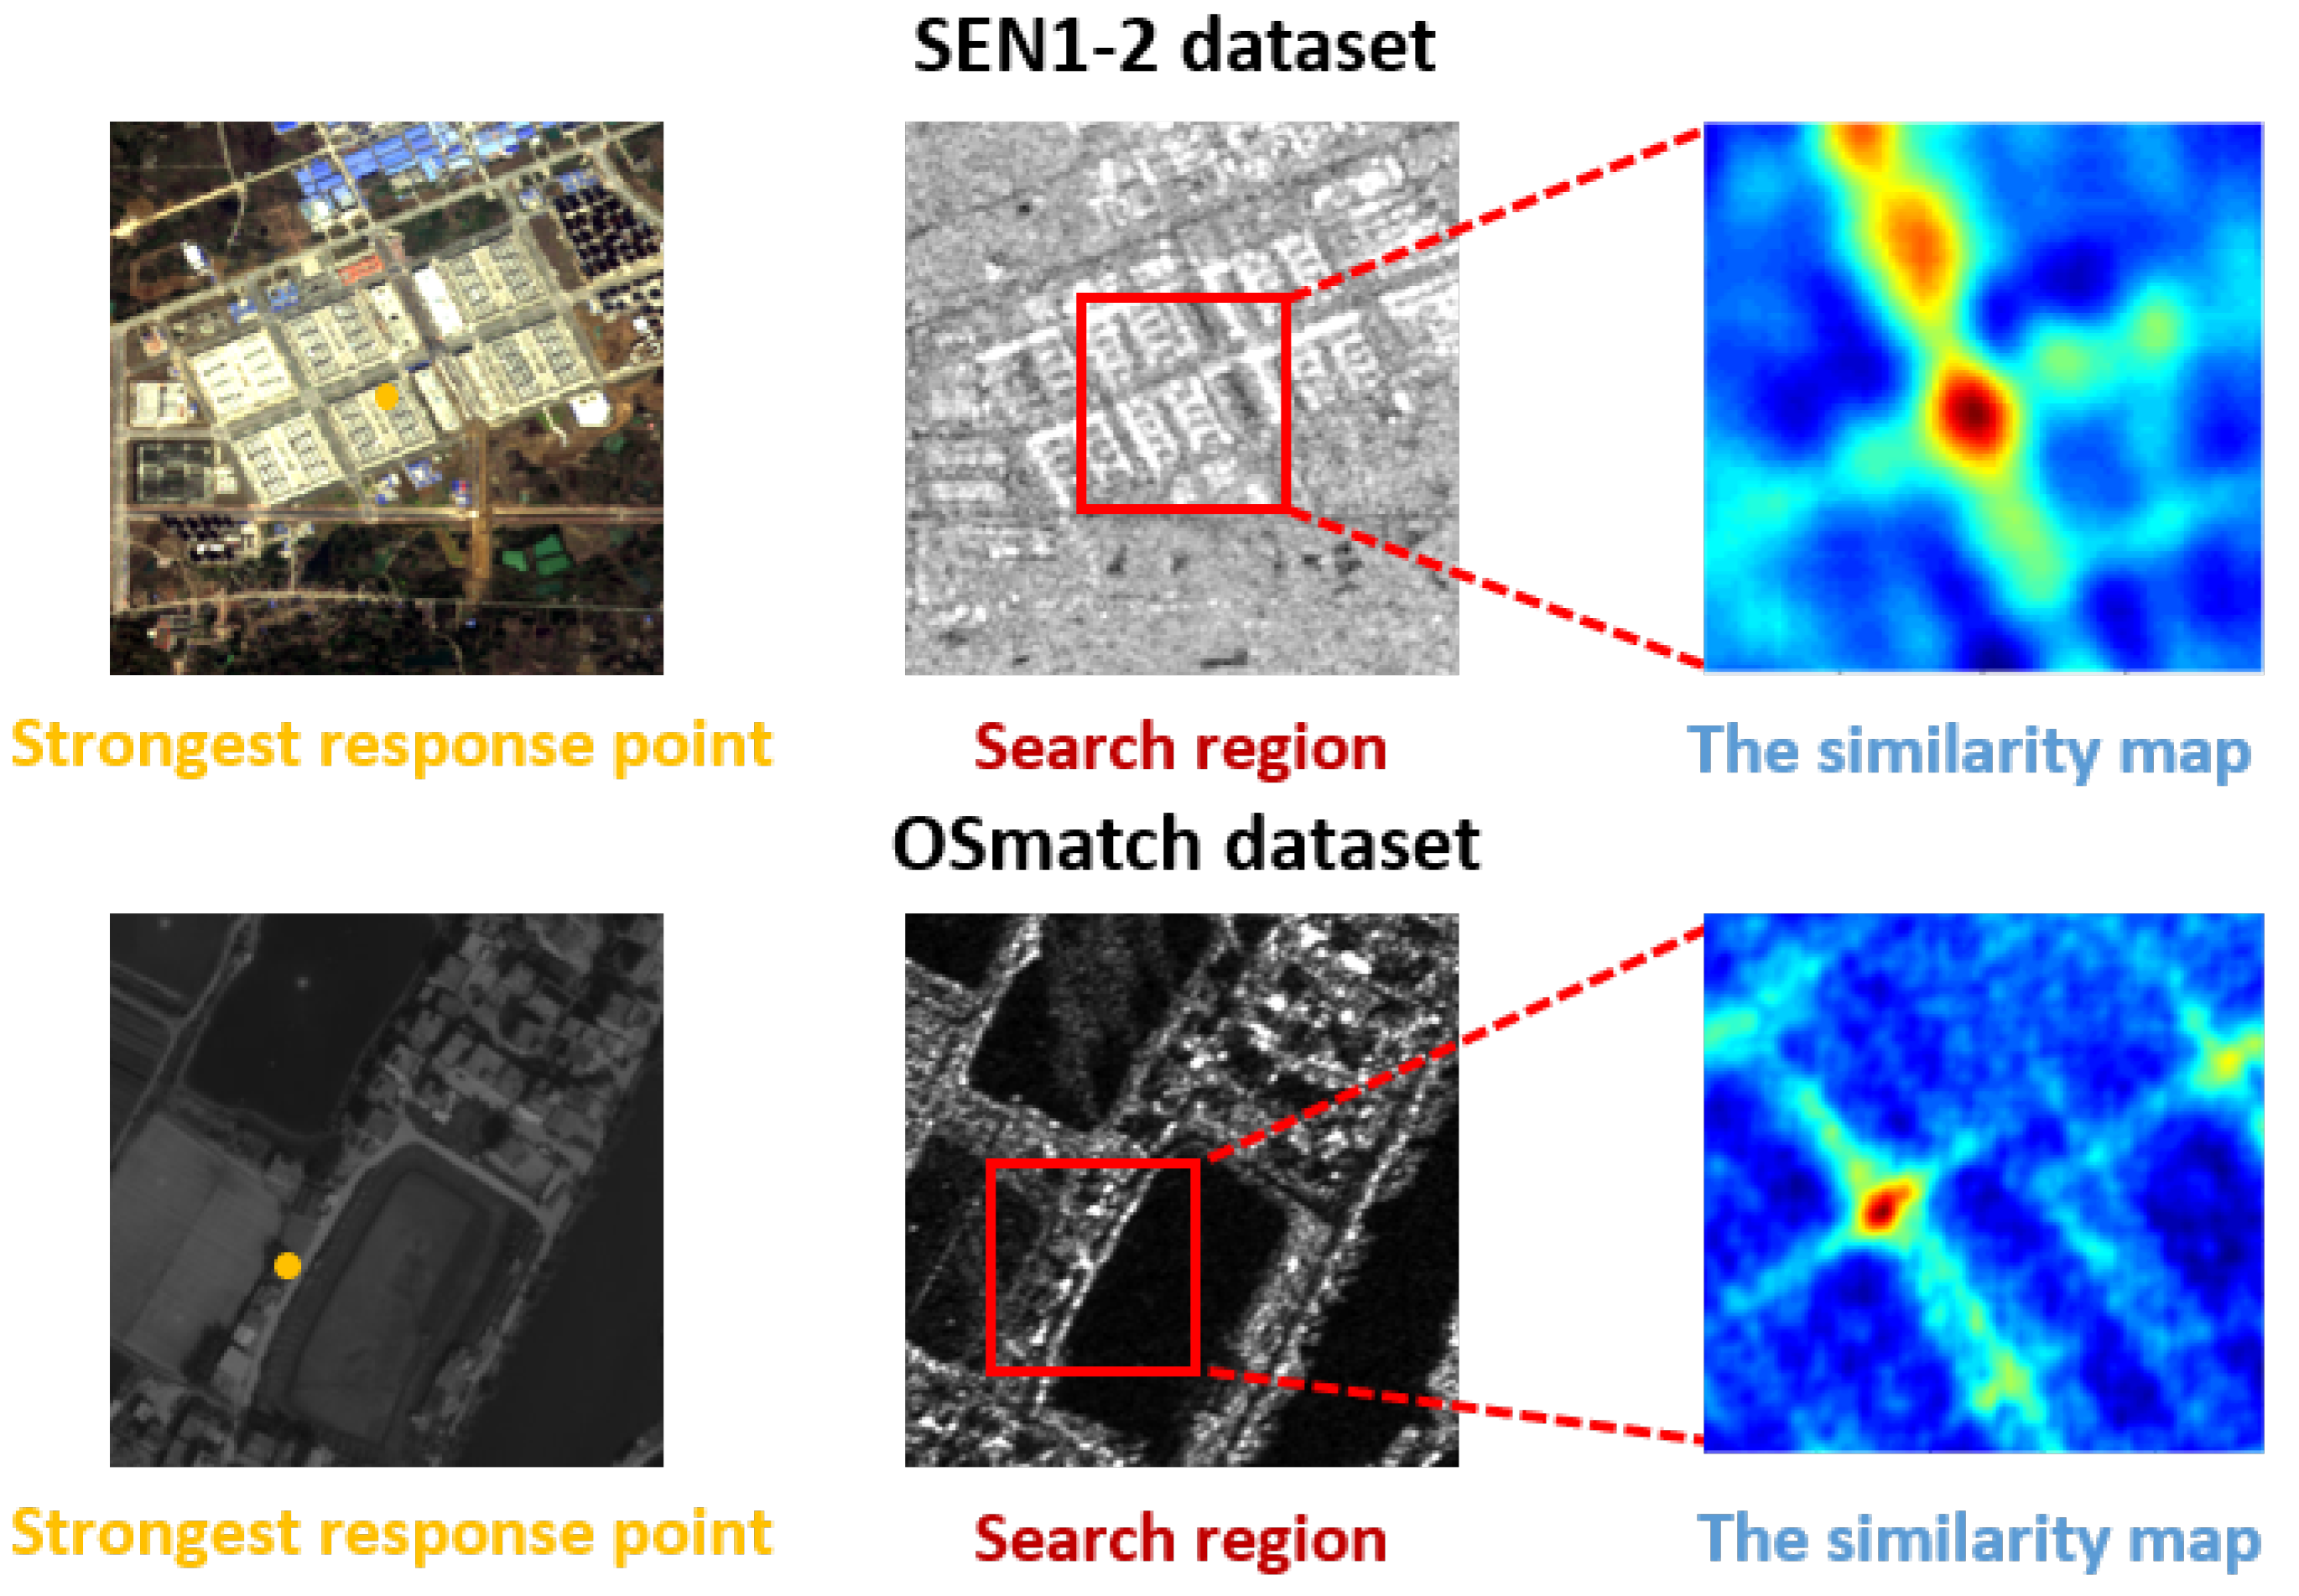
In our research, we find the texture of the similarity map is closely related to the success of matching. As shown in Figure 3, when the obvious feature similarity between the optical and SAR image pair is shown using the feature descriptor, concentrated peaks are usually formed relatively. When the obvious feature does not appear in the search region, the peak value will be randomly distributed. Assuming that the feature descriptors are isotropic, the shape of the similarity map will be correlated with the result of the optical and SAR image matching. Therefore, we can filter out the mismatch point by analyzing the texture of the similarity map.
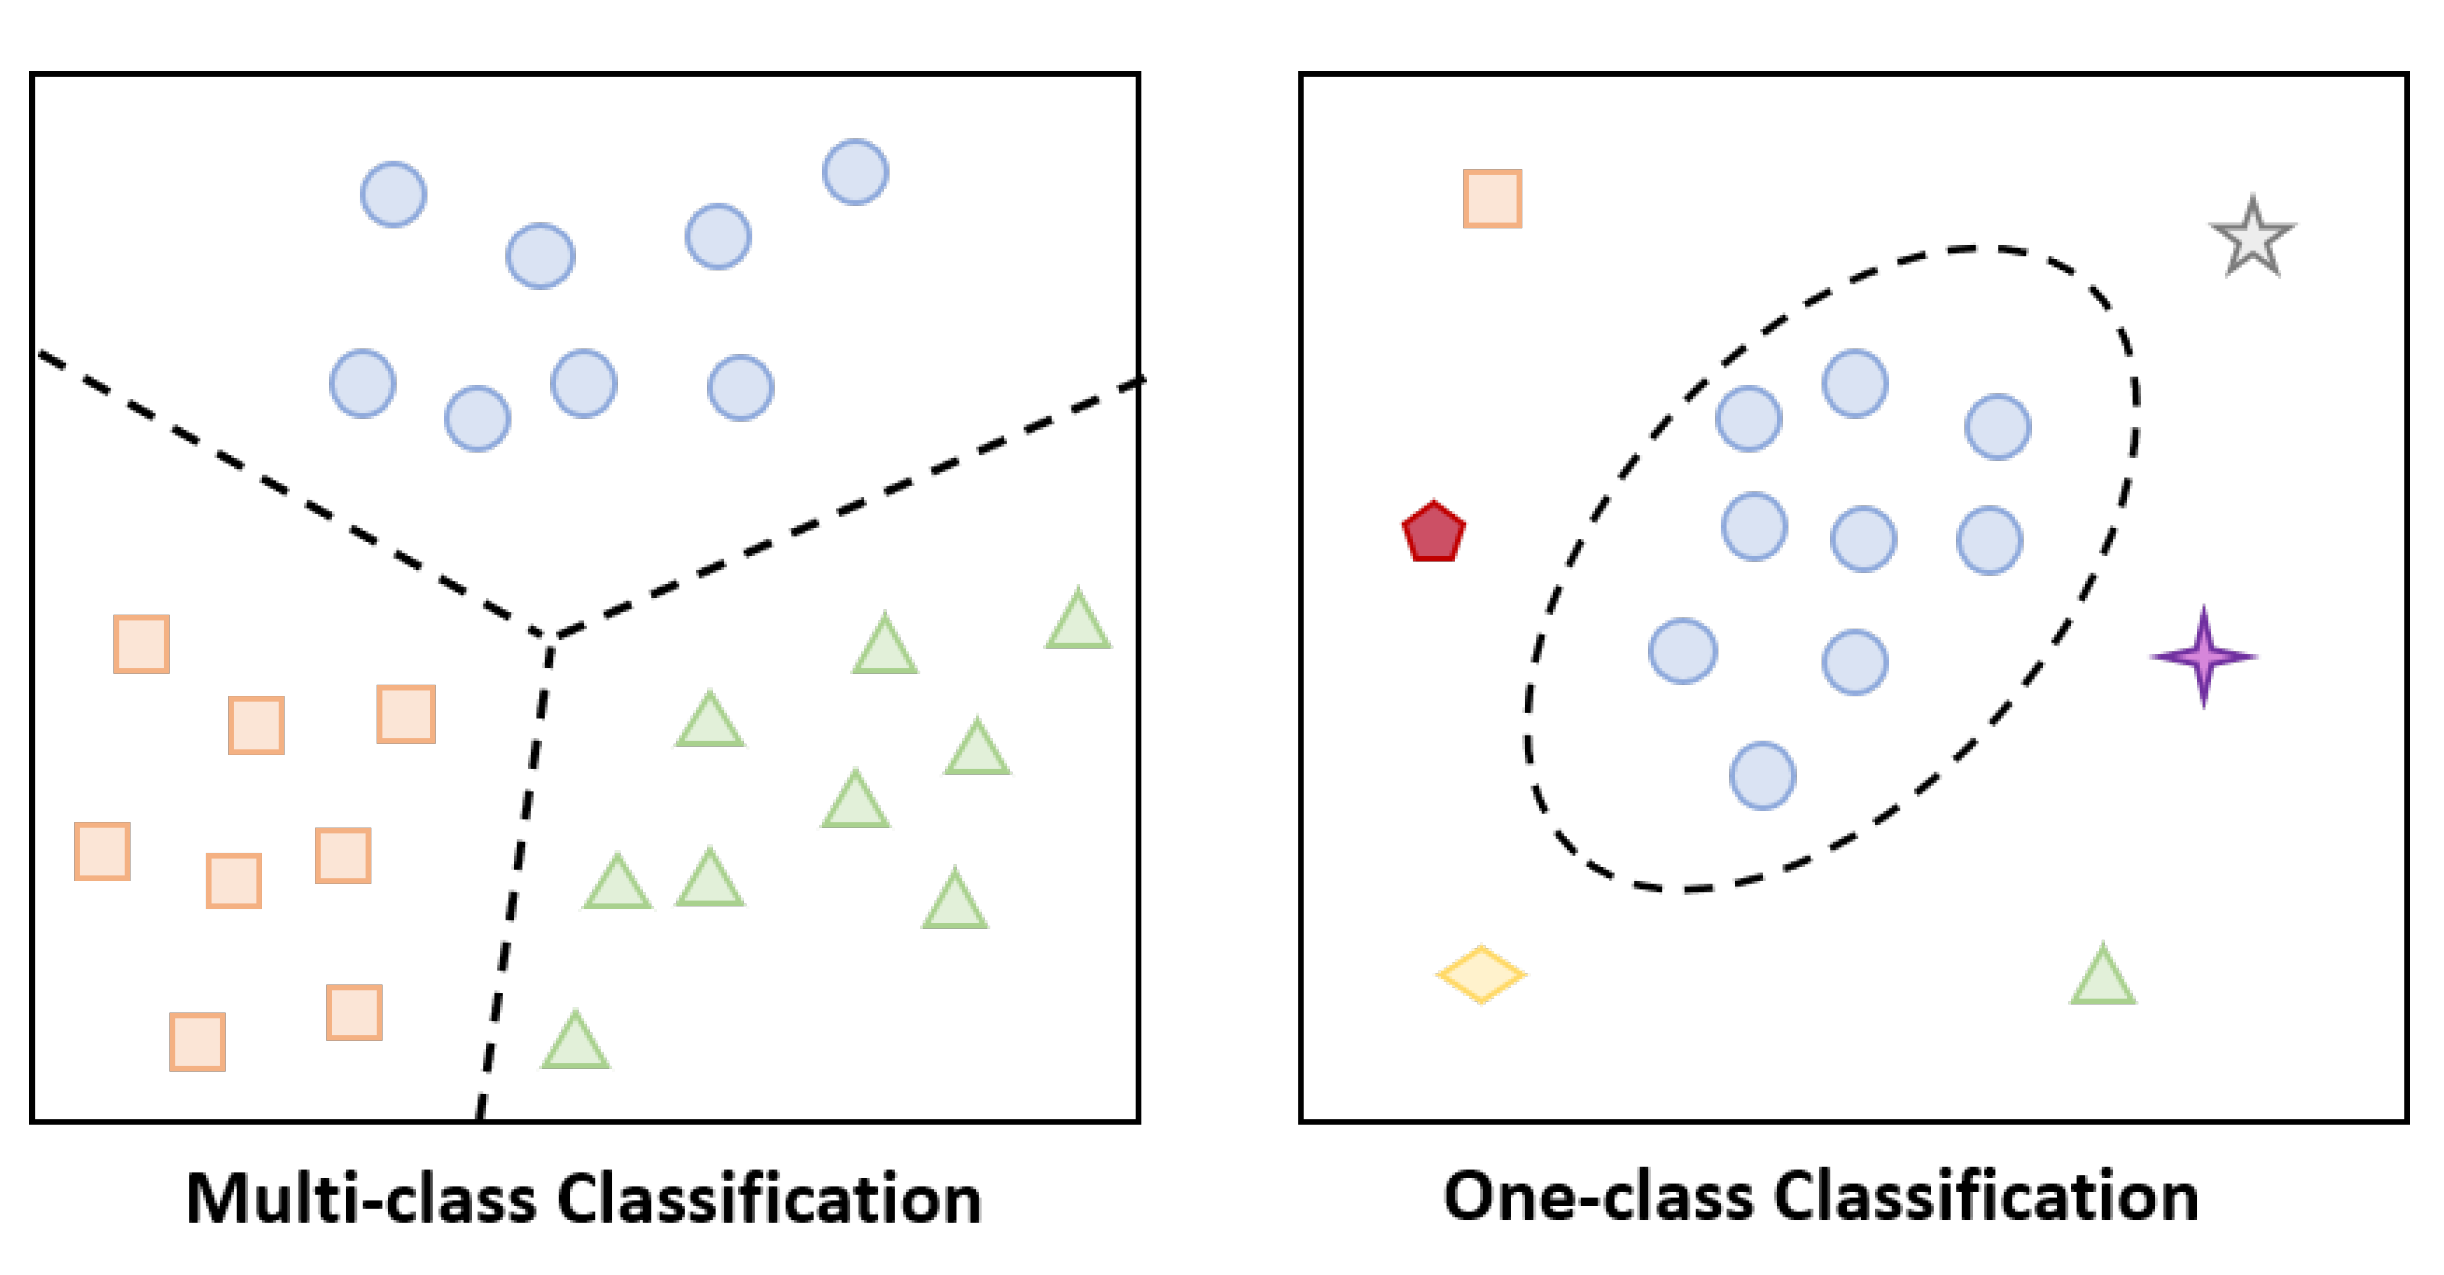
In our task, we need the algorithm to determine whether the peak value in the search region is a true match point. As shown in Figure 3, the similarity map of the correct point has the table feature and the similarity map of the wrong point is chaotic. In that case, we do not need to extract the features of the error matching points in this process. Because of the serious imbalance between positive and negative samples, the traditional multi-classification algorithm will cause the severe over-fitting phenomenon in our task. Therefore, we cannot use the multi-classification algorithm in this task.

3.2. The One-Class SVM

One-Class SVM is a special case of SVM formulation. In two-class classification, the hyper-plane defined by support vectors separates the two classes with the largest possible margin. In the case of one-class classification, we have only positively labeled data to train the support vectors (see Figure 4). In One-Class SVM (OCSVM), the hyperplane corresponding to the negative class is set to be the origin of the coordinate system. Positive data exists in the positive half-space of the hyper-plane. When slack variables are used to relax the constraint, the optimization objective can be expressed as:
min w , ξ , b 1 2 w 2 + 1 v N i ξ i b s . t . w , Φ x i b ξ i , ξ i 0
Here, the slack variable ξ i corresponds to the training data. In our case, ξ i is the vectorized similarity map. v 0 , 1 is a trade-off parameter. As v approaches 0, that means the upper boundaries on the Lagrange multipliers tend to infinity. In our case, the number of vs. is the percentage of negative samples. b is the bias term and N is number of training samples. Φ is a mapping function that maps x i to the kernel space where the kernel function K · , · is used to define dot products. After training a support vector machine, the class of the new sample X t e s t can be predict using the condition sgn w , Φ x i b .
Equation (2) can be solved using the Lagrange multipliers α i , β i 0 as follows:
L w , ξ , α , β = 1 2 w 2 + 1 v N i ξ i b i α i w , Φ x i b + ξ i i β i ξ i
Set the derivatives with respect to the primal variables w, ξ ,b equal to zero. It can be shown that:
w = i α i Φ x i ,
α i = 1 v l β i 1 v l , i α i = 1 .
Substituting Equations (4) and (5) into Equation (3), and using Equation (2), the dual optimization problem can be derived as:
min w , ξ , b 1 2 i j α i α j K x i , x j s . t . 0 α i 1 v N , i α i = 1
At the optimum, it can be shown that if α i , β i are nonzero and 0 α i 1 v N is satisfied we can recover the bias term by exploiting that for any such a, the corresponding pattern x i satisfies
b = w , Φ x i = j α j K x i , x j .
All patterns x i : i l , α i > 0 are called Support Vectors. The decision for any test similarity map x t that is vectorized as x t can be expressed in terms of the kernel function using the dual variables and vectorized training images as follows:
f x t = sgn i α i K x i , x t b

3.3. The Creation of the Similarity Dataset

The SEN1-2 dataset was produced by M. Schmitt et al. to research the Optical-SAR image registration. It is comprised of 282,384 SAR-optical patch-pairs with 10 m resolutions acquired by Sentinel-1 and Sentinel-2. In this section, we use the SEN1-2 dataset to create our similarity map dataset. Because the image pairs in the SEN1-2 dataset use the 30 m-SRTM-DEM and the ASTER DEM as high latitude to revise the image patch, we set the image pairs in the SEN1-2 dataset to standard values.
The SEN1-2 dataset has two advantages. The first advantage is that the dataset has the image of four seasons which can fully reflect the nonlinear distortion between optical and SAR images. The second advantage is that the dataset includes common scenes such as farmland, lakes, mountains, towns and roads. The radiation differences caused by different sensors in optical and SAR images can be fully reflected. To simulate the real template matching process, the basic process consists of three steps.
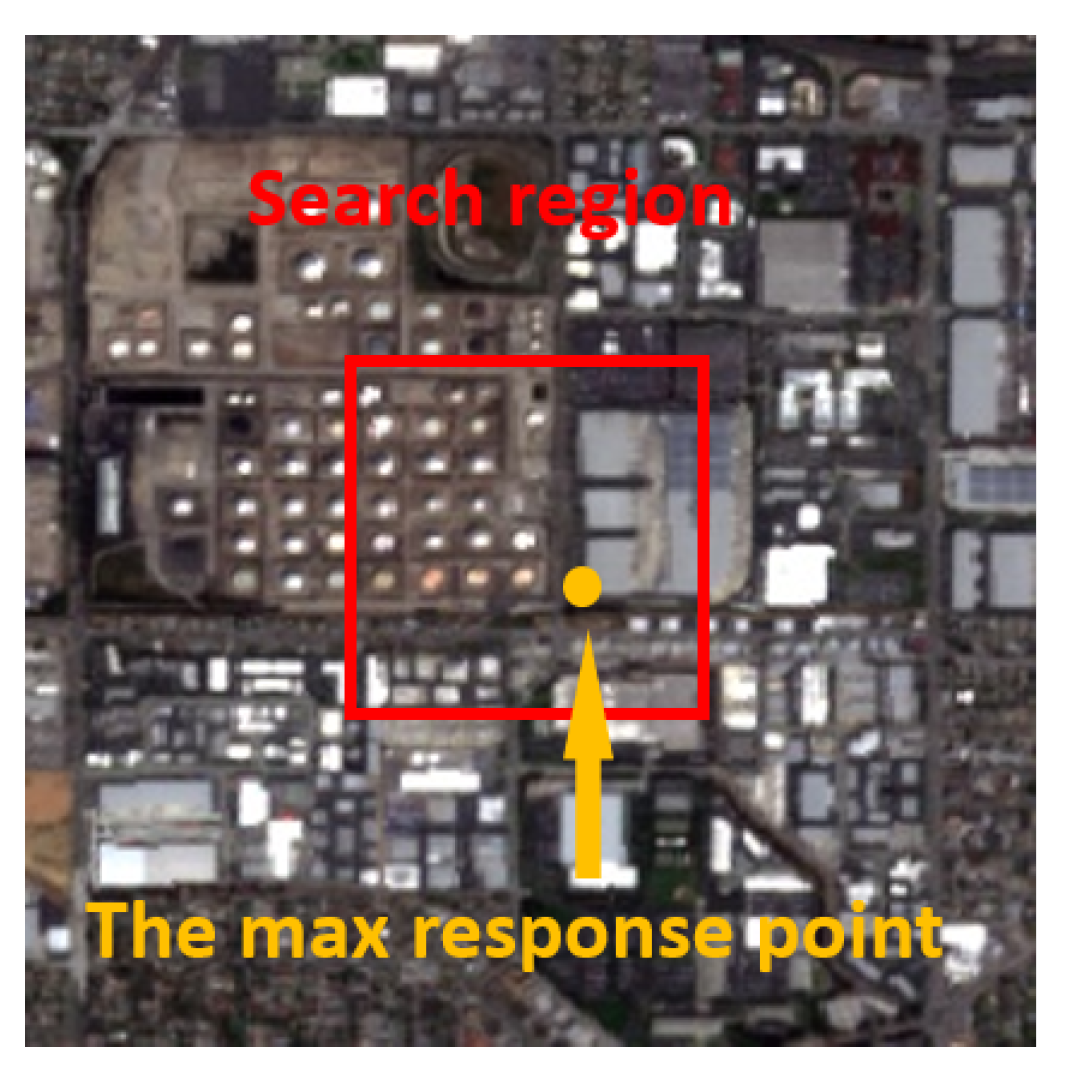
First, the Harris response of the optical image is calculated in the image pair. As shown in Figure 5, if the maximum value of the Harris response lies within the search region, the optical and SAR image pair passes this selecting. If the Harris strongest point is not within the search region, this image pair will be discarded. Only 9183 image pairs passed the first round of selection.
Second, the GPOG descriptor is used to calculate the similarity maps of the SAR image in the 9183 image pairs. In the similarity map, the maximum response point is taken as the matching point. The matching point of the SAR image is compared with the strongest Harris response point extracted from the optical image. If the error in both X and Y directions is less than 3 pixels, this similarity map will pass this round of selecting (see Figure 6). If the error is greater than three pixels, the similarity map is placed in the negative sample. Only 2684 image pairs passed the second round of selection.
Third, in the second step, there are always some unstable extreme points in the right region. It is necessary to remove the unstable similarity maps manually. The similarity maps with good shape are screened out and put into the positive sample. Although some positive samples will be abandoned in this step, the stable form of the similarity map is helpful to improve the performance of the model. Finally, 2300 image pairs are selected to form positive samples.

3.4. The Proposed Strategy

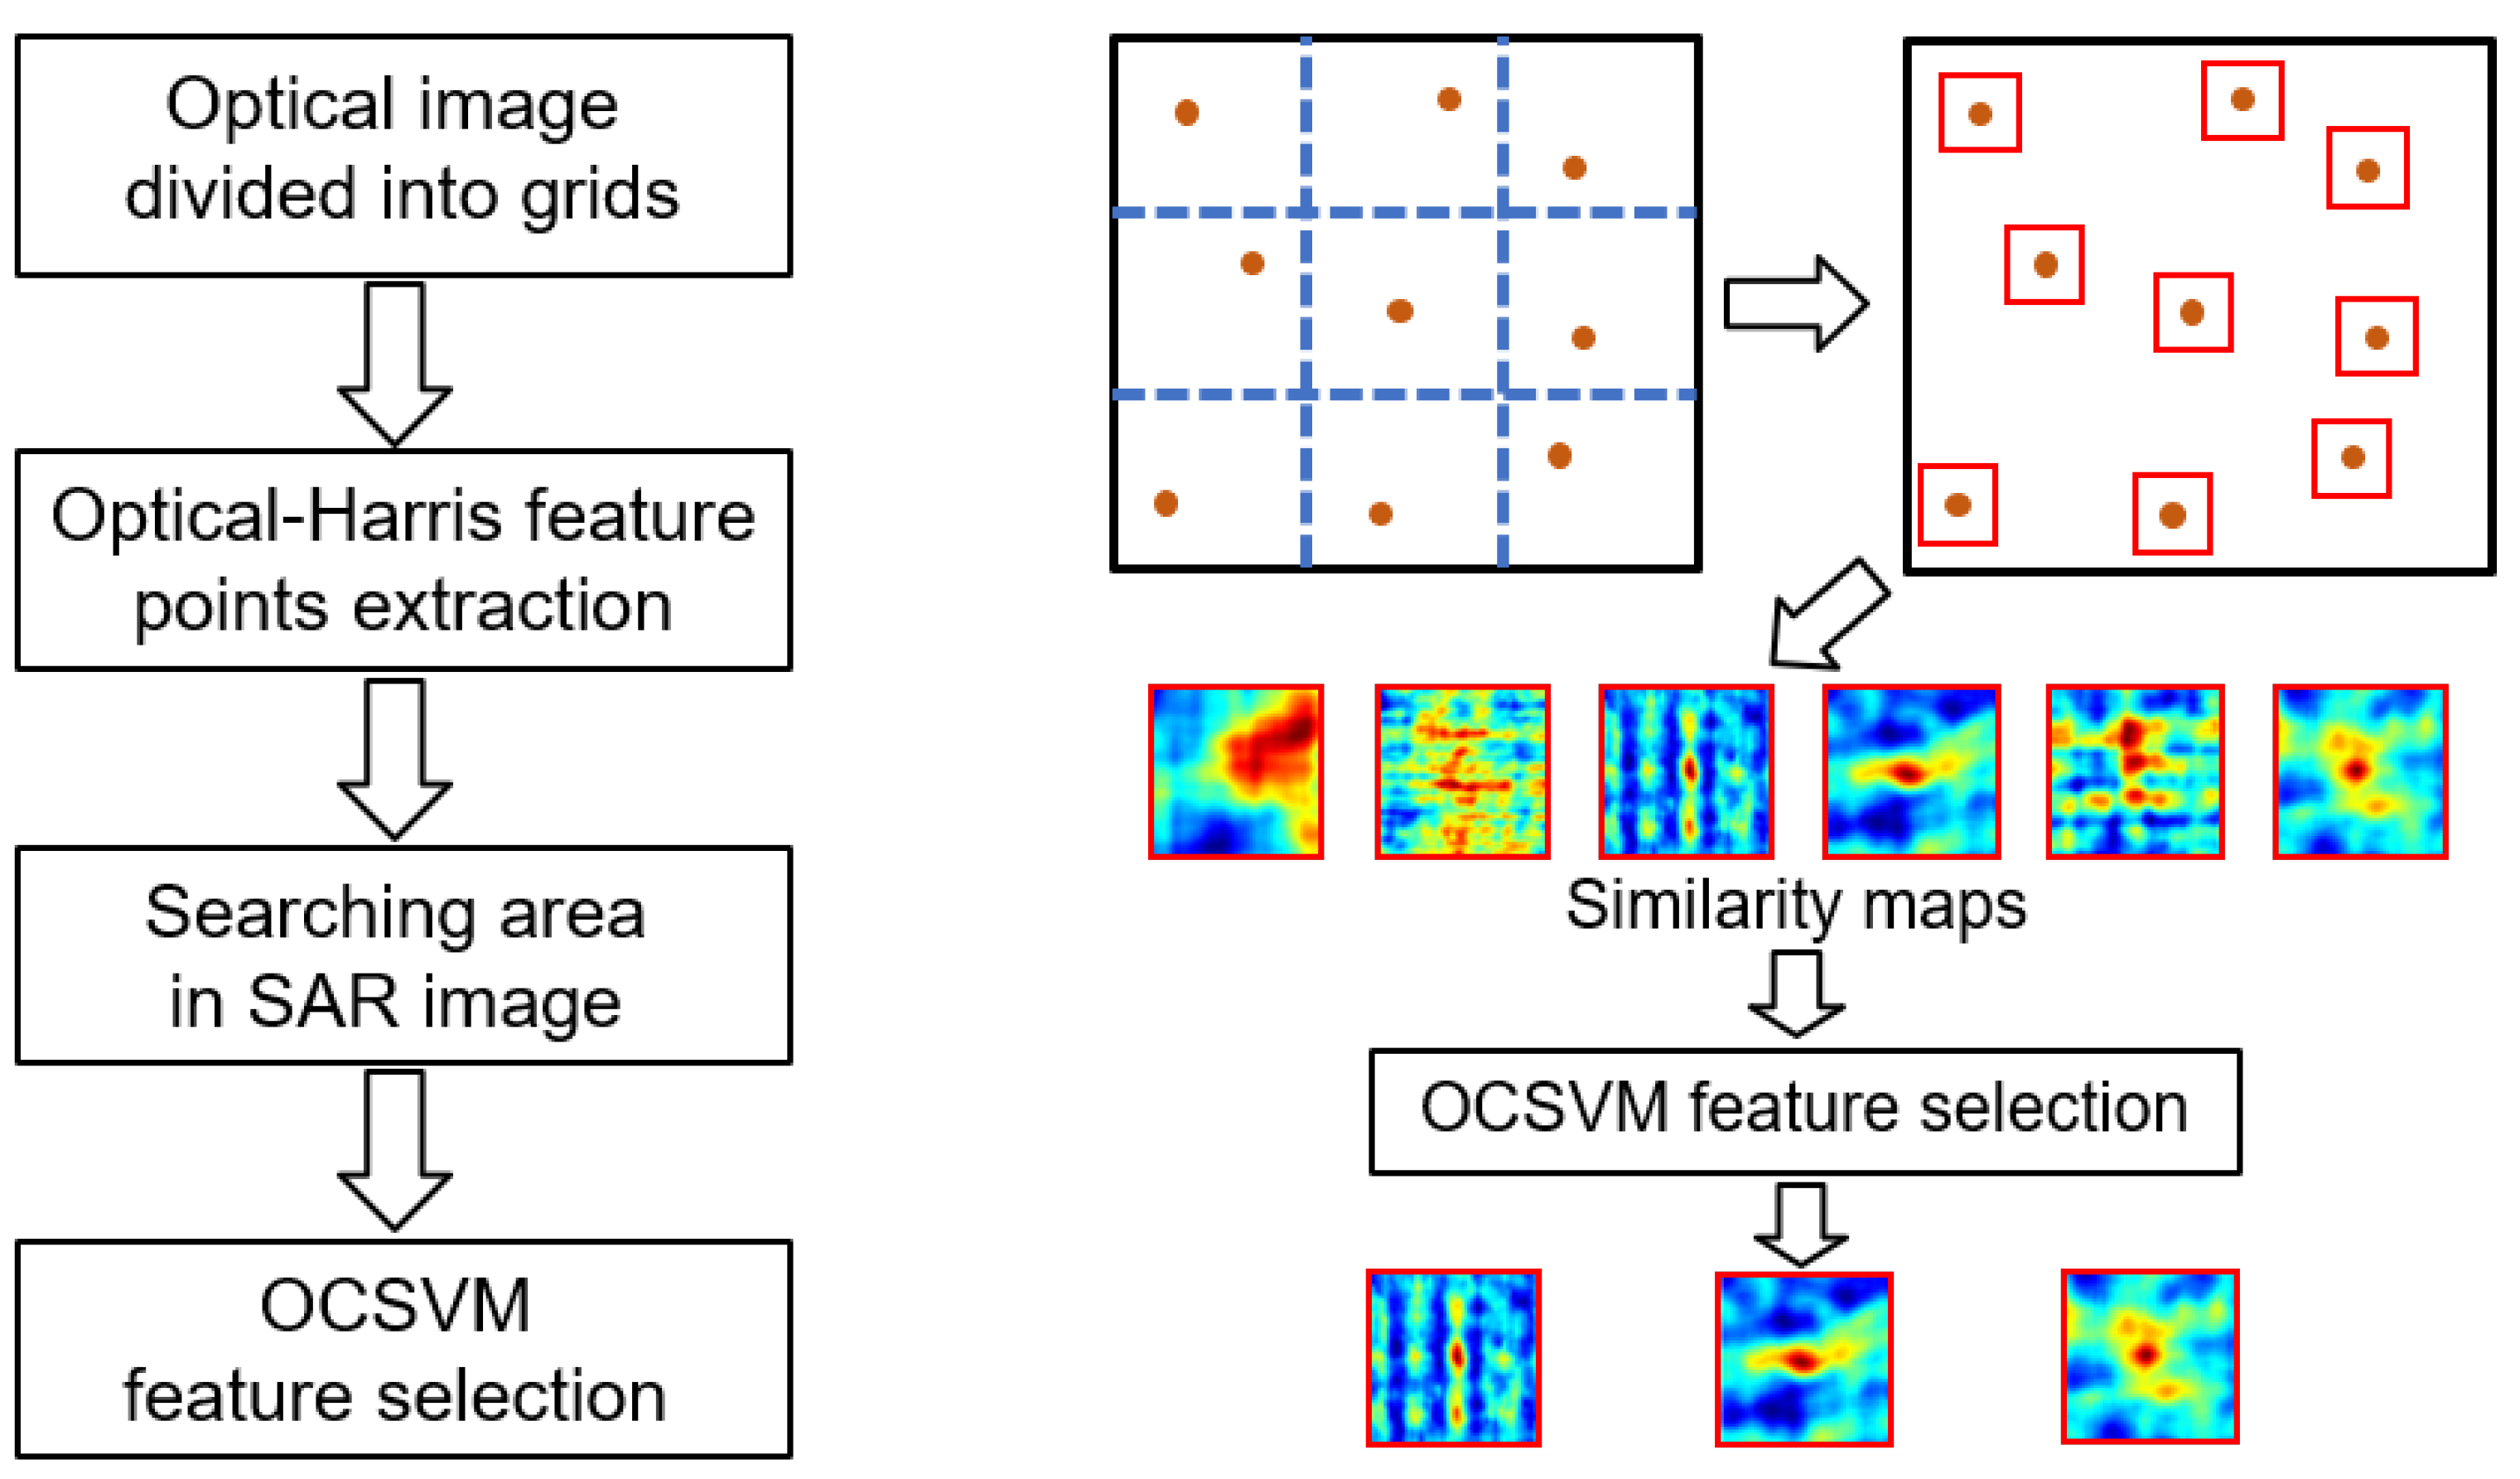
In this section, we put forward a new framework for optical and SAR image registration. Our optical and SAR image registration strategy consists of four steps (see Figure 7). First, we find the overlap between the optical and SAR images. Then we divide the optical image into vertical and horizontal grids. The strongest Harris response points are extracted from each grid of the optical image as feature points. We find the SAR feature points corresponding to the optical feature points by geographic information. The similarity map is calculated by centering on the SAR feature point in the SAR image. Similarity maps from the SAR feature points are input into trained One-Class SVM to filter out outliers. The specific steps are as follows:
First, we read the metadata of the optical and SAR image pair to find the overlapping ground areas and project the four corners onto the ground. Only the optical image with overlapping ground areas is retained as computing areas. If there are overlaps between the two ground coverings, we deem these two images overlapped; otherwise, there is no overlap between these two images. The available optical image of the computing area is collected to be divided into some grids. The horizontal and vertical grids divide the target optical image into some small pieces. The Harris response is calculated in each grid. We use the Harris response maximum point as a virtual control point for each grid. Since the feature selection method cannot guarantee the uniform distribution of virtual control points in the overlapping ground area, the rasterization method is necessary for our strategy. If we do not rasterize the images or extract multiple feature points in each grid, the feature points will be too concentrated.
Second, to obtain the similarity map, we find the coordinate of the feature point of the optical image in the SAR image. The size of the search area is related to the positioning accuracy of the optical and SAR images pair. If the positioning accuracy of the image pair is higher, the search region can be adjusted to be smaller. On the other hand, if the positioning accuracy of the image pair is low, the search area should be appropriately expanded. The correct match point should be guaranteed to appear in the search region. As long as the feature descriptor is strong enough to resist nonlinear radiation and the speckle noise in SAR images, the single-peak structure will be generated in the search region.
Third, similarity maps generated in the SAR image are input into the previously trained One-class SVM. In this step, One-Class SVM will distinguish between the correct match points and the false match points using a hyperplane. In the process of feature selection, the false match points with poor performance in the similarity map are filtered. The correct match points with good performance in the similarity map are received. The fundamental difference between the feature selecting algorithm and the RANSAC algorithm is that there is no preset transform model for the optical and SAR images pair.
Finally, the correct point reserved by One-Class SVM is taken as the final matching point of template matching output.

4. Experiments and Evaluation

A set of experiments is designed to evaluate the performance of the One-Class SVM used in the feature selection and the performance of the proposed strategy. We first test the One-Class SVM on the SEN1-2 dataset and OSmatch dataset [38]. Then we demonstrate the performance of the proposed strategy using some optical and SAR satellite images. In this experiment, we propose two new metrics (NIM and RIM) to evaluate the performance of the strategy used in the large image registration. This experiment can demonstrate the abilities of the proposed strategy.

4.1. Experiment of the One-Class SVM in Dataset

The One-Class SVM is tested on SEN1-2 and OSmatch datasets to evaluate its performance in the feature selection. A set of image pairs covering different seasons and scenes was selected for testing in the SEN1-2 dataset. A set of high-resolution image pairs are selected in the OSmatch dataset compared with the SEN1-2 dataset. In the OSmatch dataset, the optical sensor is the Google Earth platform’s panchromatic camera, which has an image resolution of 1m. The 1-m SAR images in the OSmatch dataset is generated using GF-3 spotlight mode. In comparison, the 3 m resolution SAR images of the SEN1-2 dataset were obtained from 5 m resolution Sentinel-1 C-band images by downsampling. The experimental data, evaluation criterion and experimental results follow in the next section.

4.1.1. Experimental Data

Figure 8 shows samples of the test dataset. We selected 400 positive samples and 100 negative samples from the SEN1-2 dataset as a training dataset. To test the performance of trained One-Class SVM in the SEN1-2 dataset, we selected 600 positive and 400 negative samples in the spring dataset, 400 positive and 300 negative samples in the summer dataset, 500 positive and 400 negative samples in the fall dataset, and 300 positive and 300 negative samples in the winter dataset. To detect the effect of image resolution on the similarity map, we selected 200 positive and 200 negative samples in OSmatch dataset as a supplementary test dataset.

4.1.2. Evaluation Criteria

The One-Class classifiers are evaluated by a test dataset containing positive and negative samples. Therefore, the testing procedure of One-Class SVM is analogous to binary classifiers/detectors. The majority of previous works have used Receiver Operating Characteristics (ROC) curve to report the performance of the one-class classification. According to the combination of real class and One-Class SVM prediction class, the positive and negative datasets can be divided into four cases: true positive (TP), false positive (FP), true negative (TN) and false-negative (FN). The ROC curve represents the relationship between the false positive rate (FPR) and the true positive rate (TPR). They are defined as:
T P R = T P T P + F N
F P R = F P T N + F P

4.1.3. Experimental Analysis

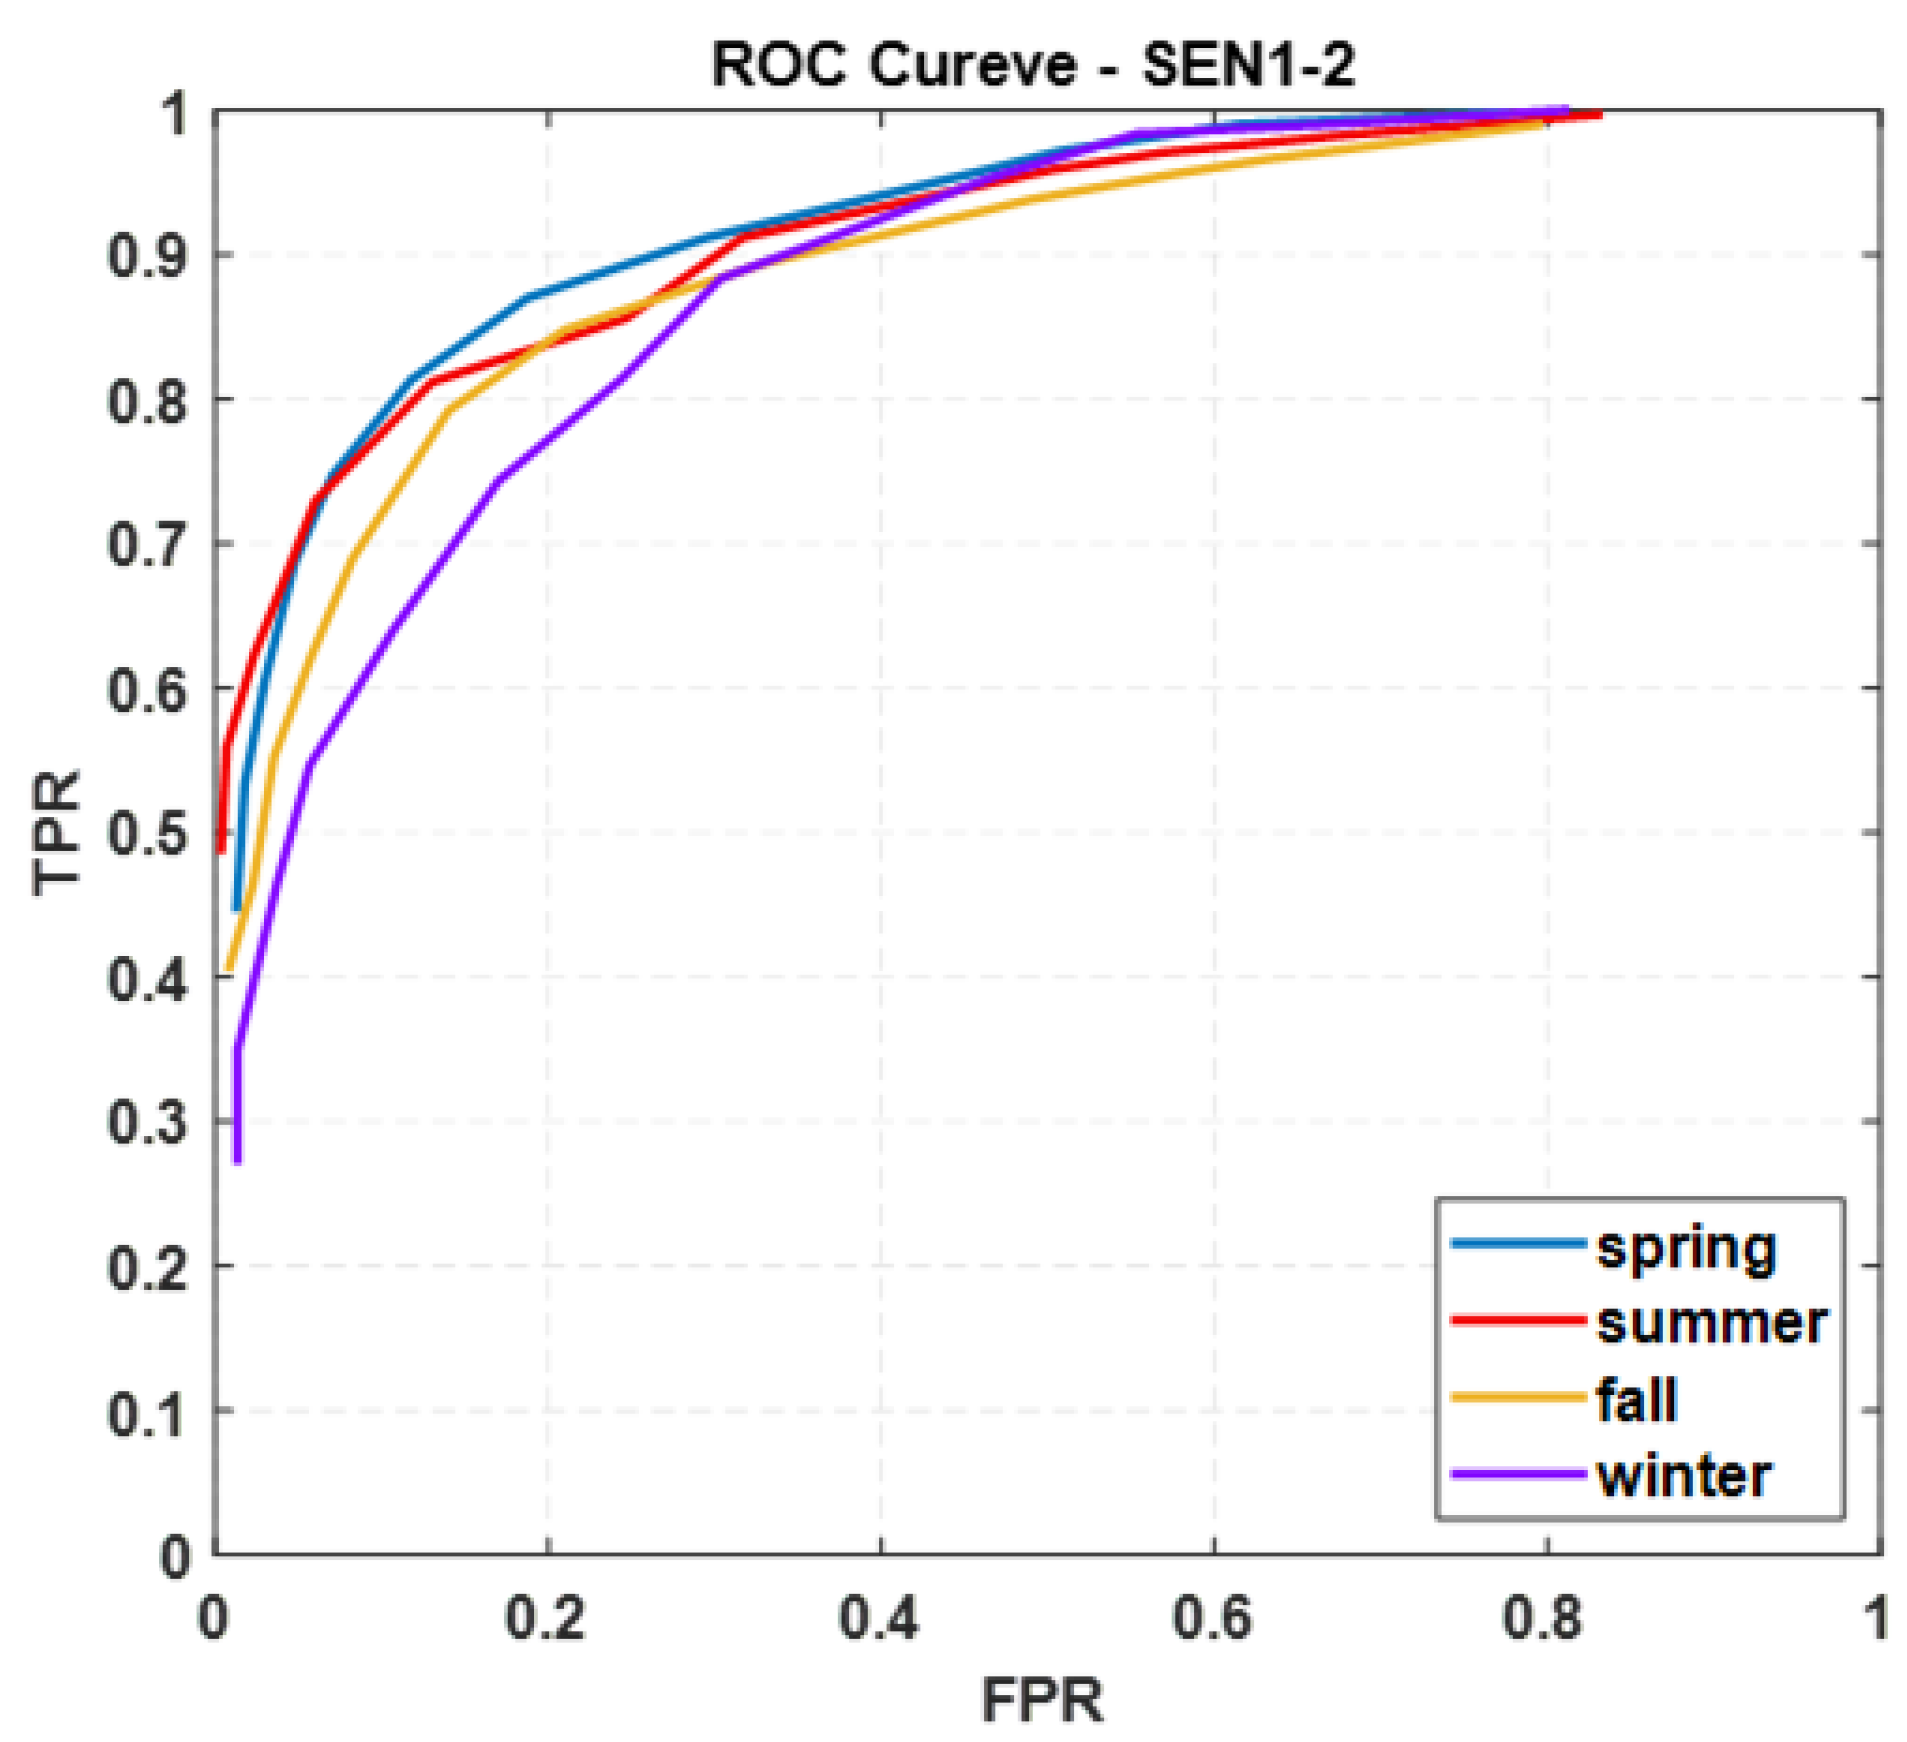
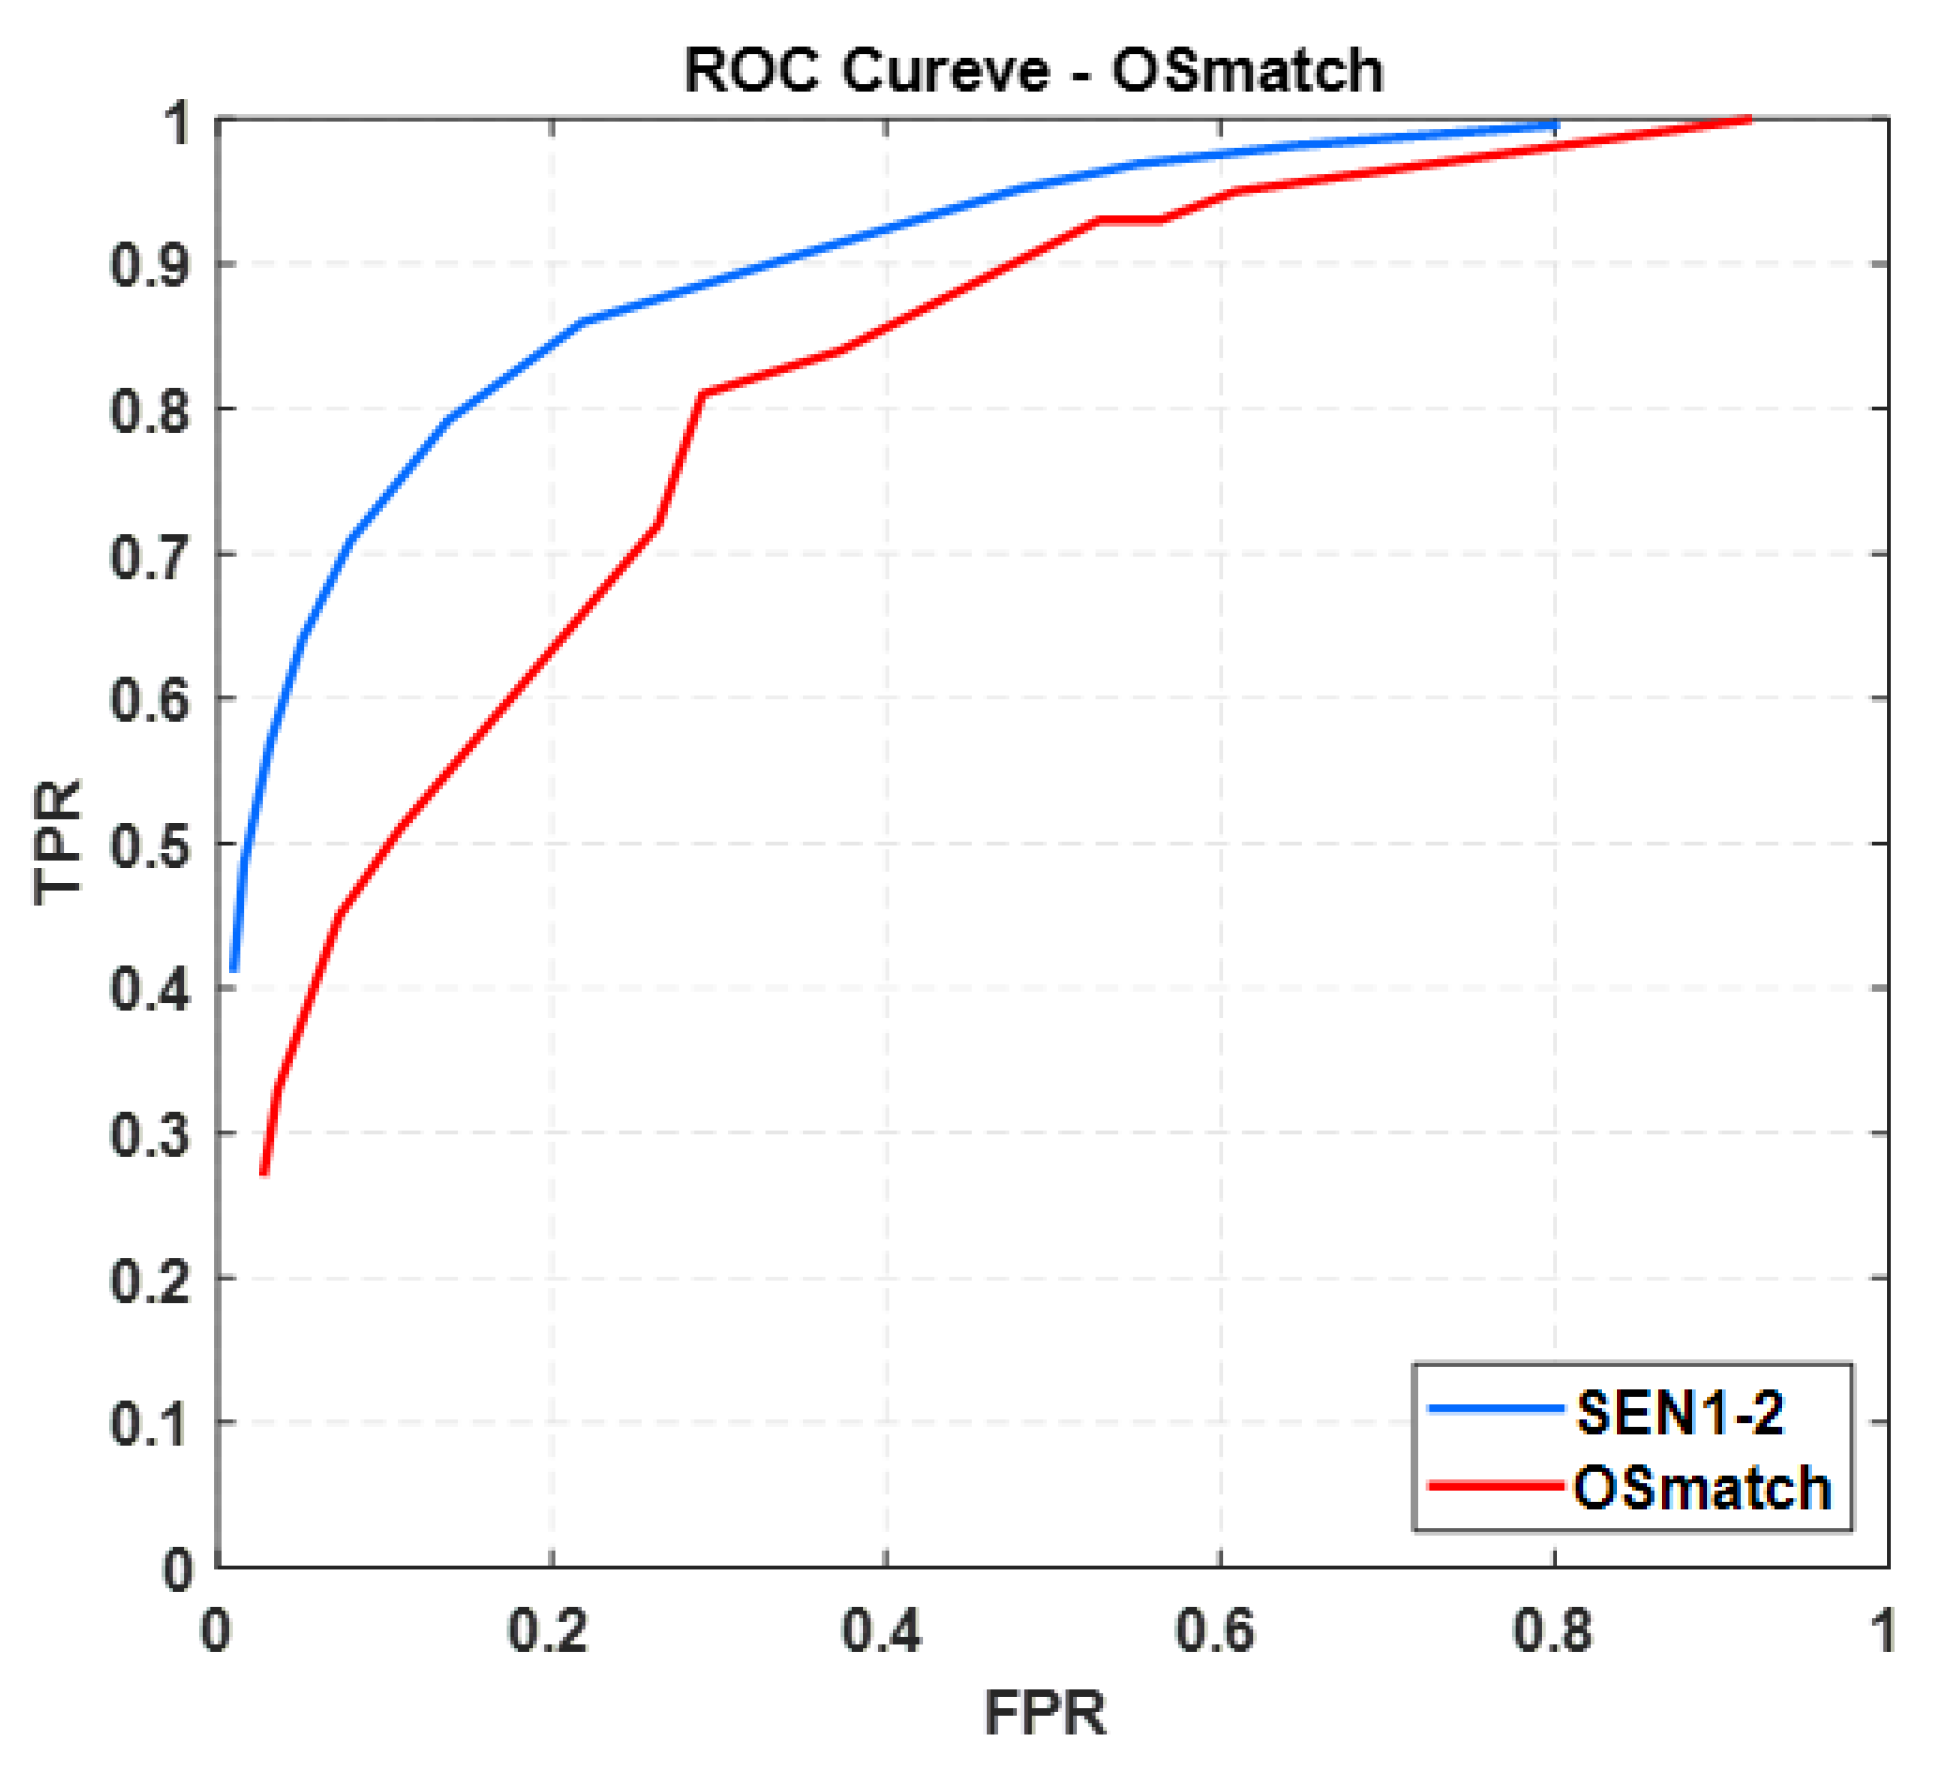
By adjusting the value of v in Formula (2) from 0.01 to 0.5, we obtained the TPR and FPR values of One-Class SVM in the dataset under different thresholds and drew the ROC curve. As shown in Figure 9 and Table 1, the performance of the trained One-Class SVM in the four sub-datasets of the SEN1-2 dataset can be obtained through the ROC curve. In the training dataset, the proportion of negative samples is 0.2, and the proportion of positive samples is 0.8. When the threshold of the classifier is set to 0.2, the TPR of the classifier can reach more than 0.8 in the four datasets. The TPR of spring, summer and fall datasets can reach more than 0.85, which proves that a correct point can be successfully selected only from the similarity map of the template region. The TPR of winter dataset is slightly worse because the surface radiation changes obviously in winter, which has a certain influence on the texture structure of the image. In general, the One-Class SVM has the robustness to radiation changes.
Rather than increasing TPR, we want FPR to be small in practical applications. Therefore, we recommend adjusting the threshold vs. to 0.3 and reducing the FPR to below 0.1 when actually using the One-Class SVM to select similarity maps.
With the SEN1-2 dataset as training data and OSmatch dataset as test data, the feature selection performance of the One-Class SVM is slightly degraded (see Figure 10). The performance of the SEN1-2 dataset is the sum of the results of four seasons. Different resolutions result in different texture structures of images in the search region. The difference in texture structure is reflected in the similarity map in that the single peak is steeper and harder to distinguish from the noise signals. However, the feature selecting accuracy of One-Class SVM in the OSmatch dataset can also be above 0.8. In general, the classifier still has a certain robustness to the change in image resolution, although the change in image resolution has a certain impact on the feature selecting accuracy of One-Class SVM.

4.2. Experiment of the Proposed Strategy

To evaluate the performance of strategy, we compared this strategy with the RANSAC algorithm and block-RANSAC algorithm. In the block-RANSAC algorithm, the non-rigid deformation can be fitted by cutting the large-size image into some small blocks. We divided the overlapping part of the optical and SAR image pair into 30 × 20 grids. The strongest Harris response was selected as the feature point for each grid. In the block-RANSAC algorithm, we cut the image into 2 × 2 grids and used the RANSAC algorithm to remove the wrong points in each grid. According to the matched points, the warp image is resampled by Delaunay triangulation method. The point set filtered by One-Class SVM was compared with the point set filtered by the other methods. The experimental data, evaluation criterion, and experimental results follow in the next section.

4.2.1. Experiment Data

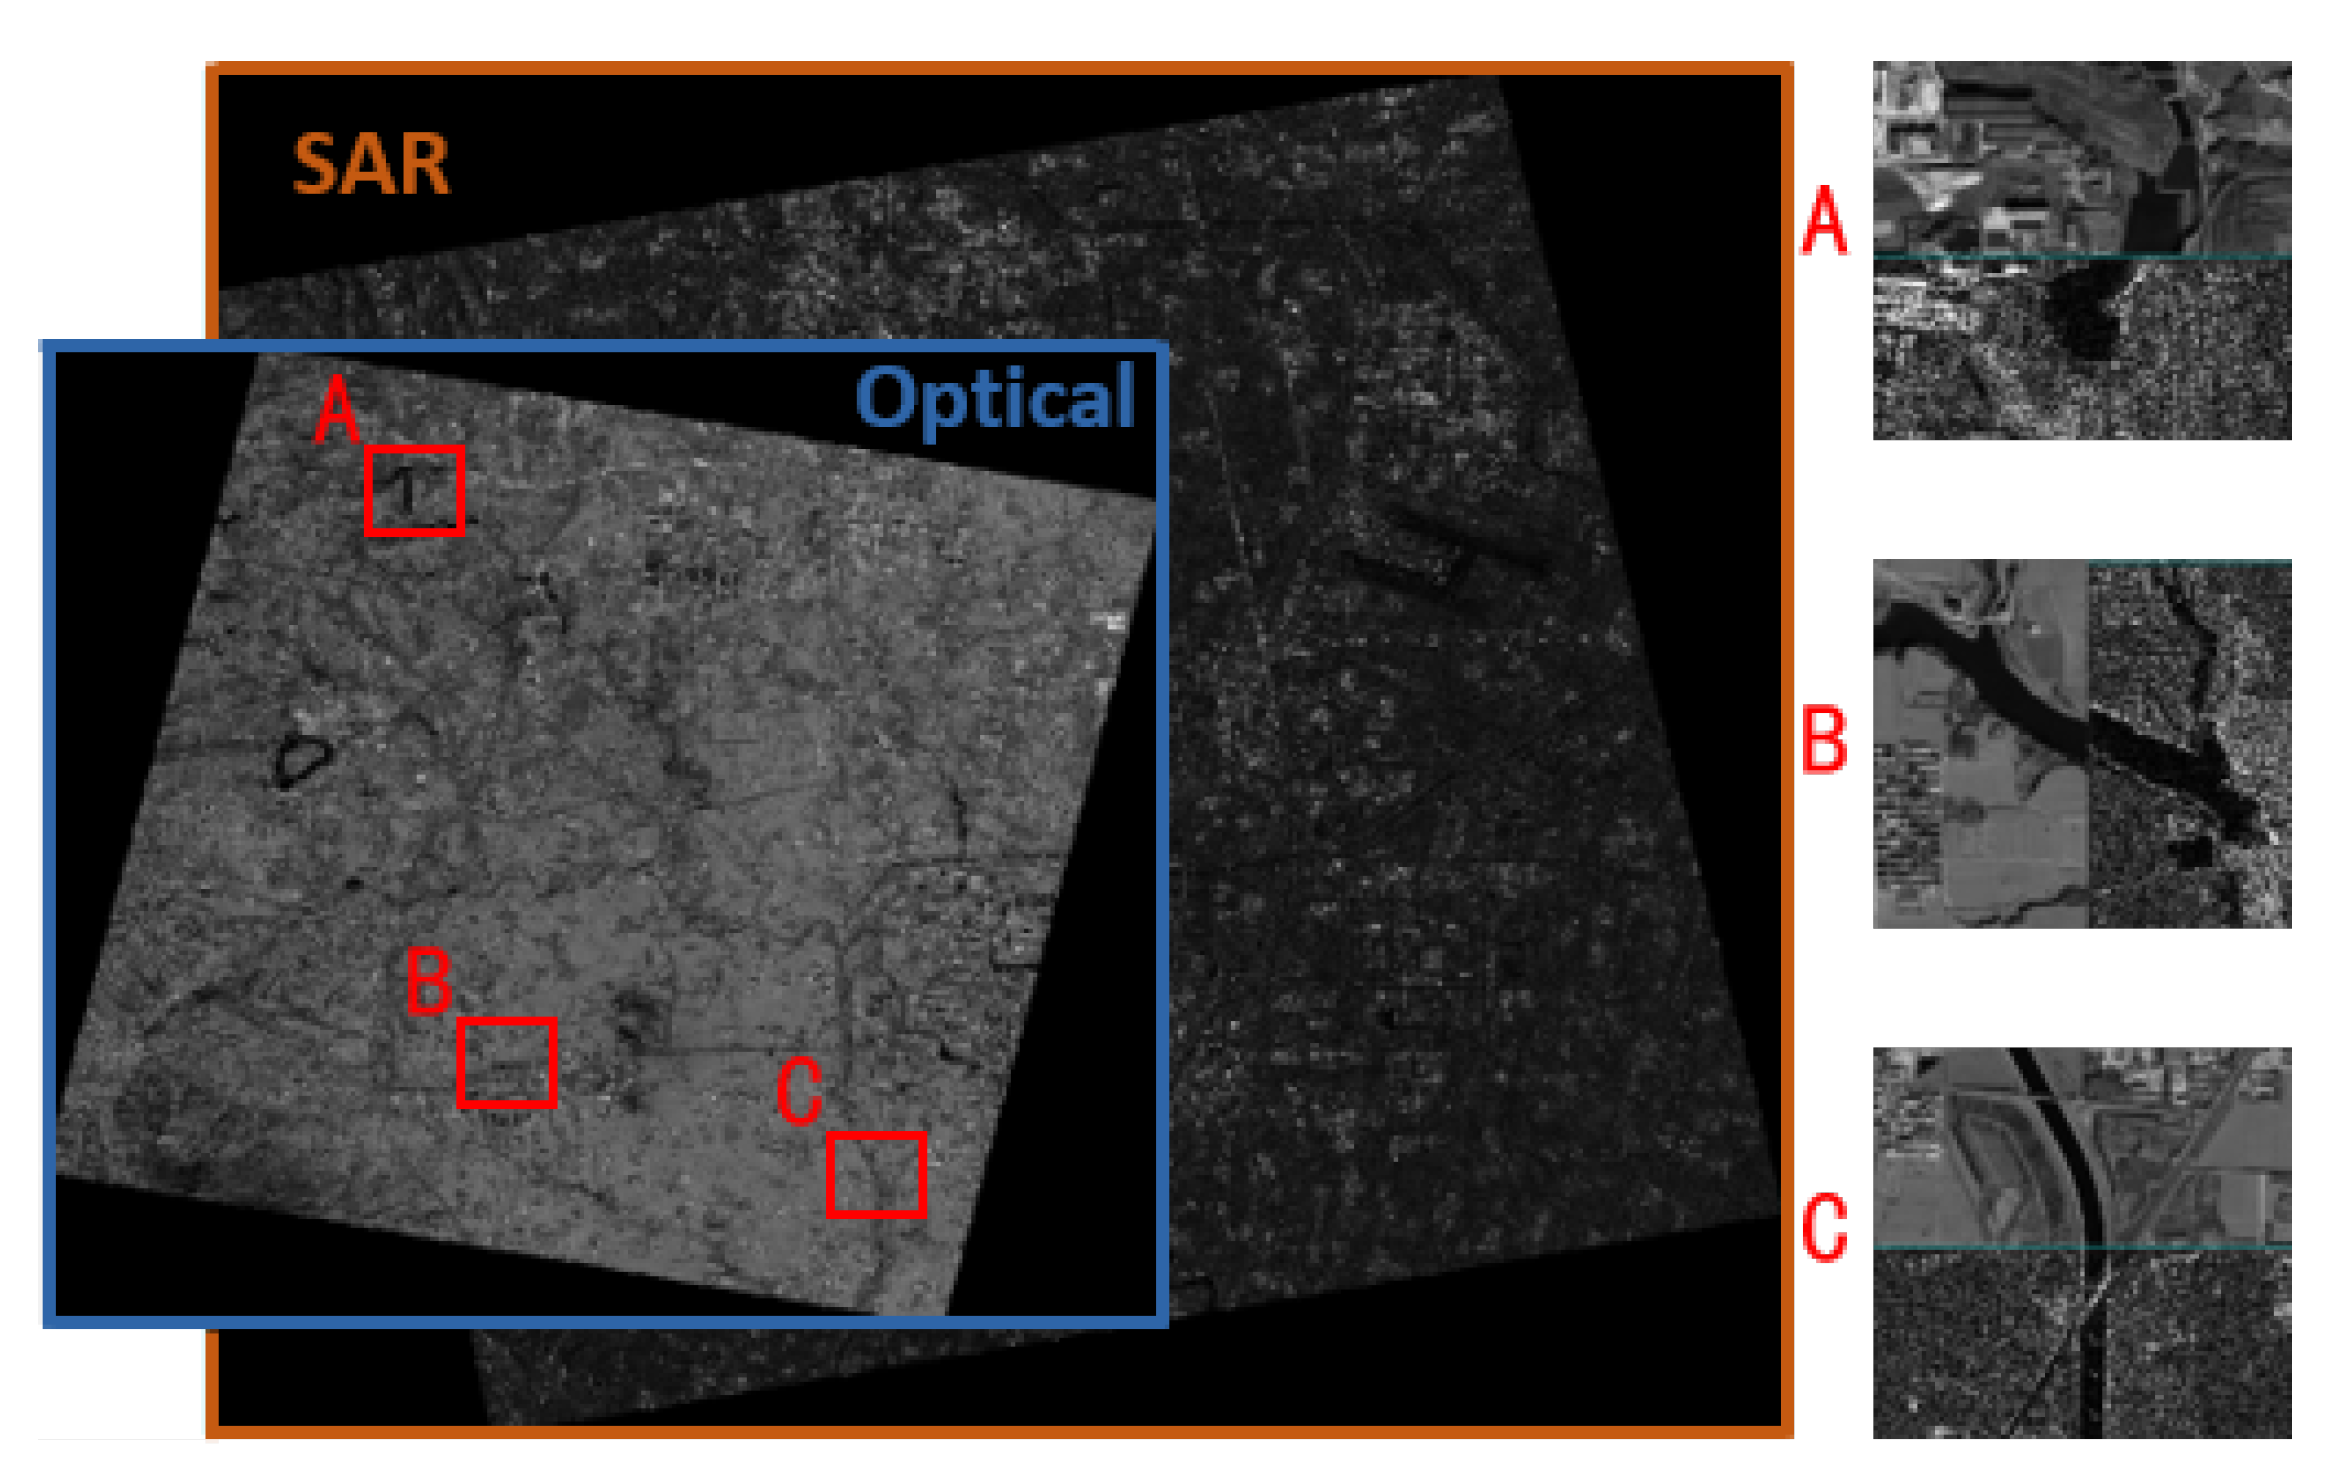
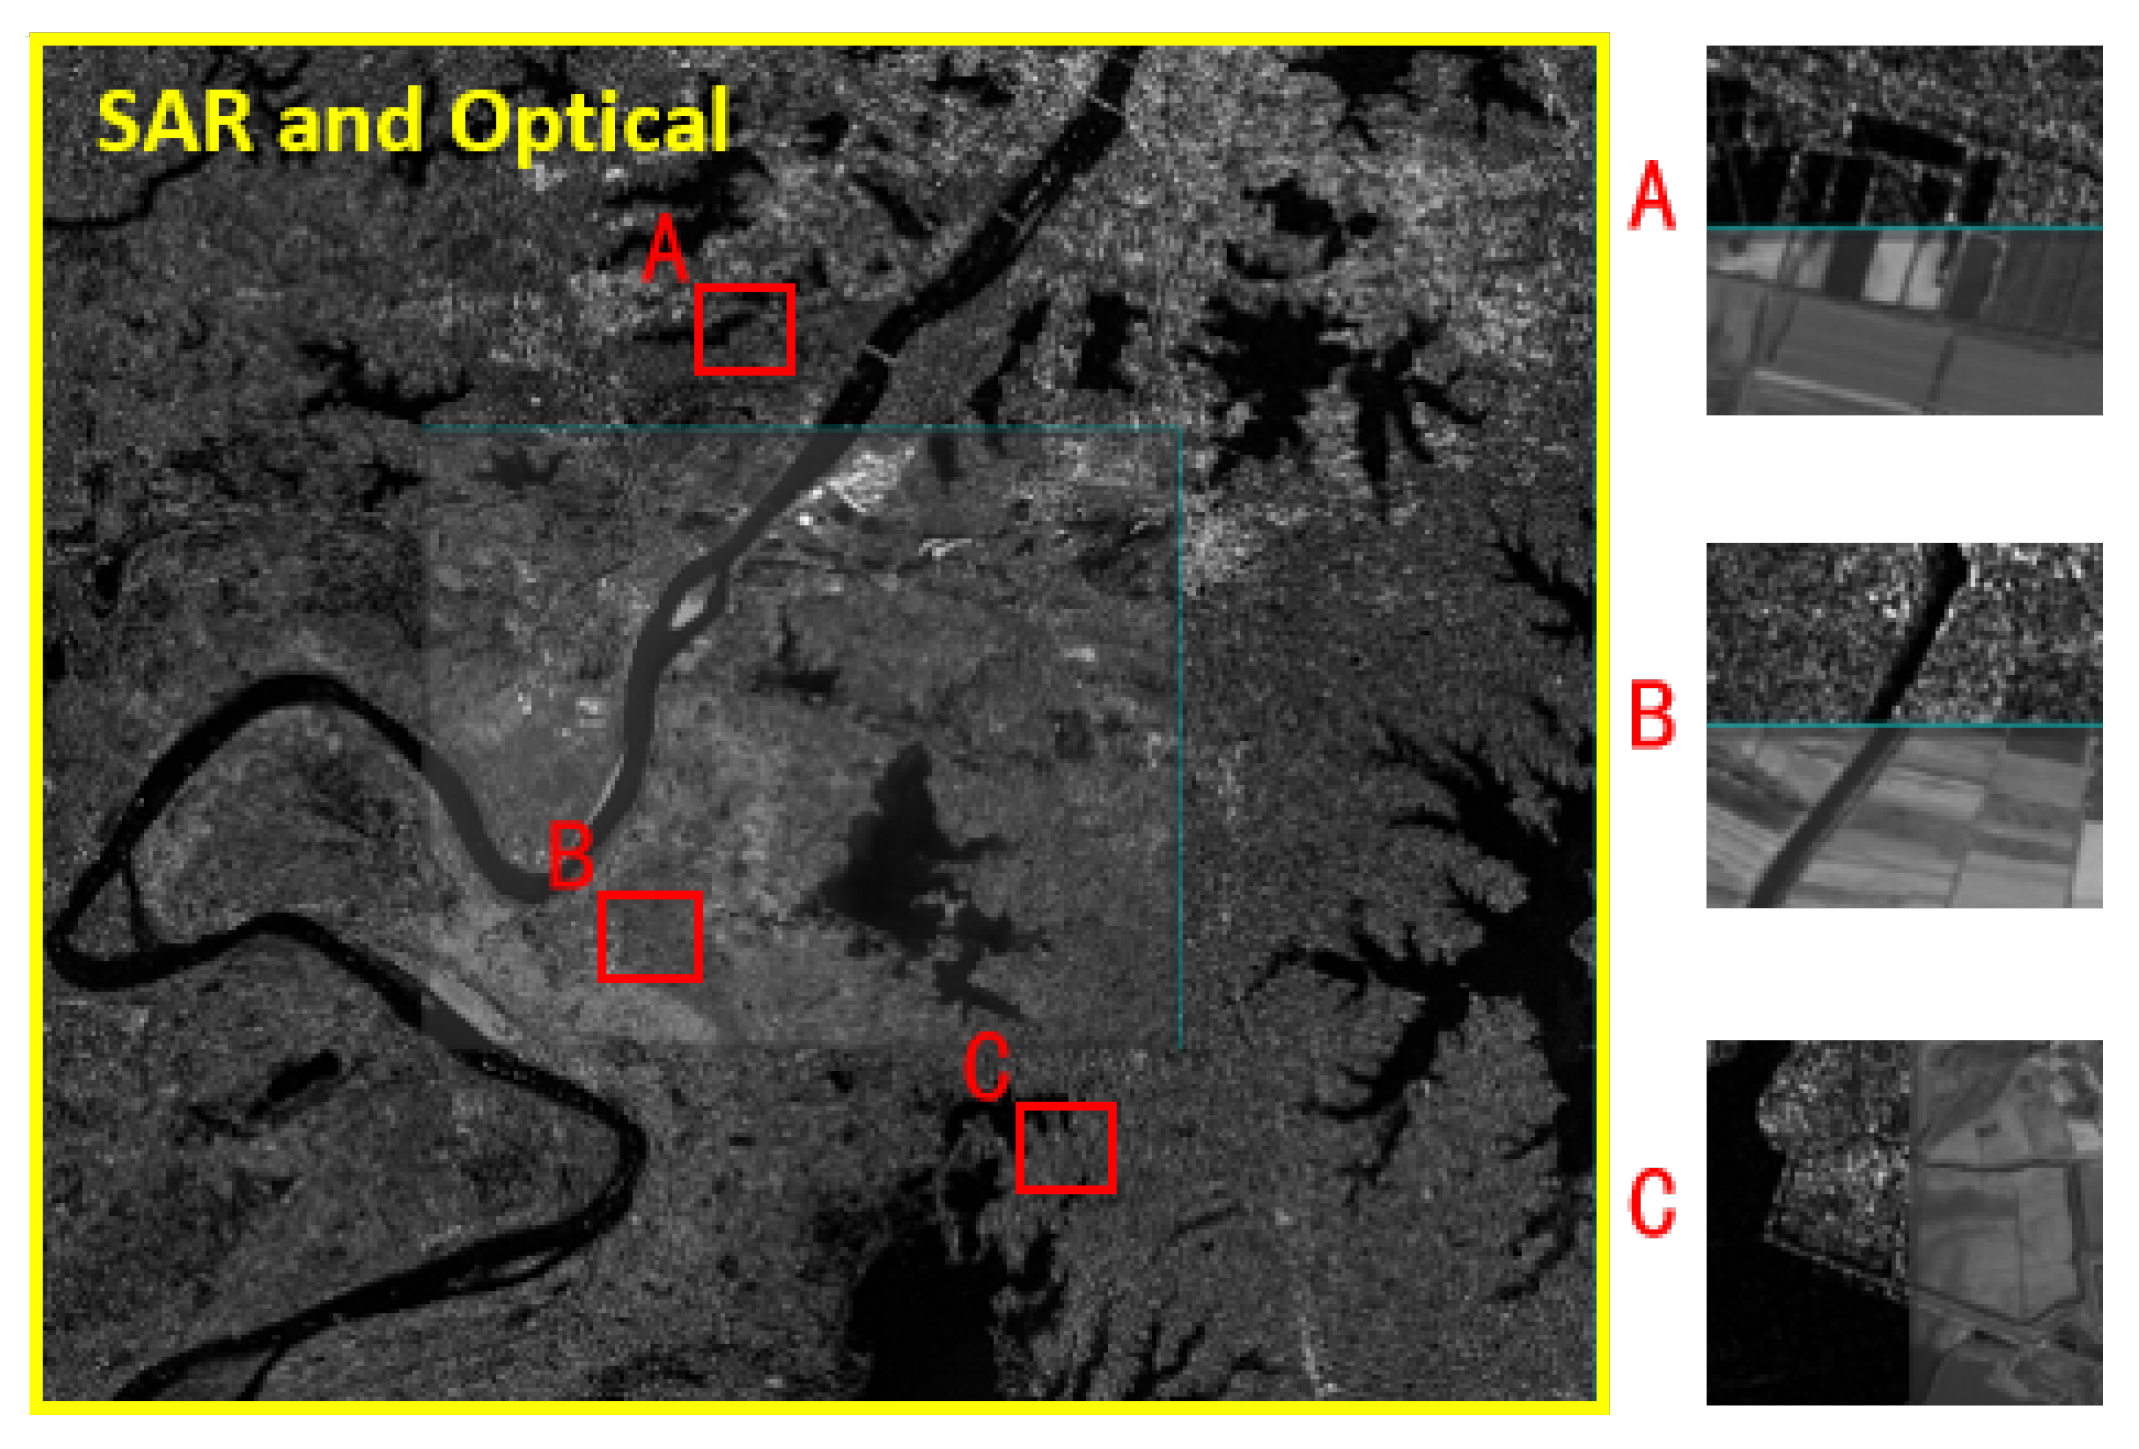
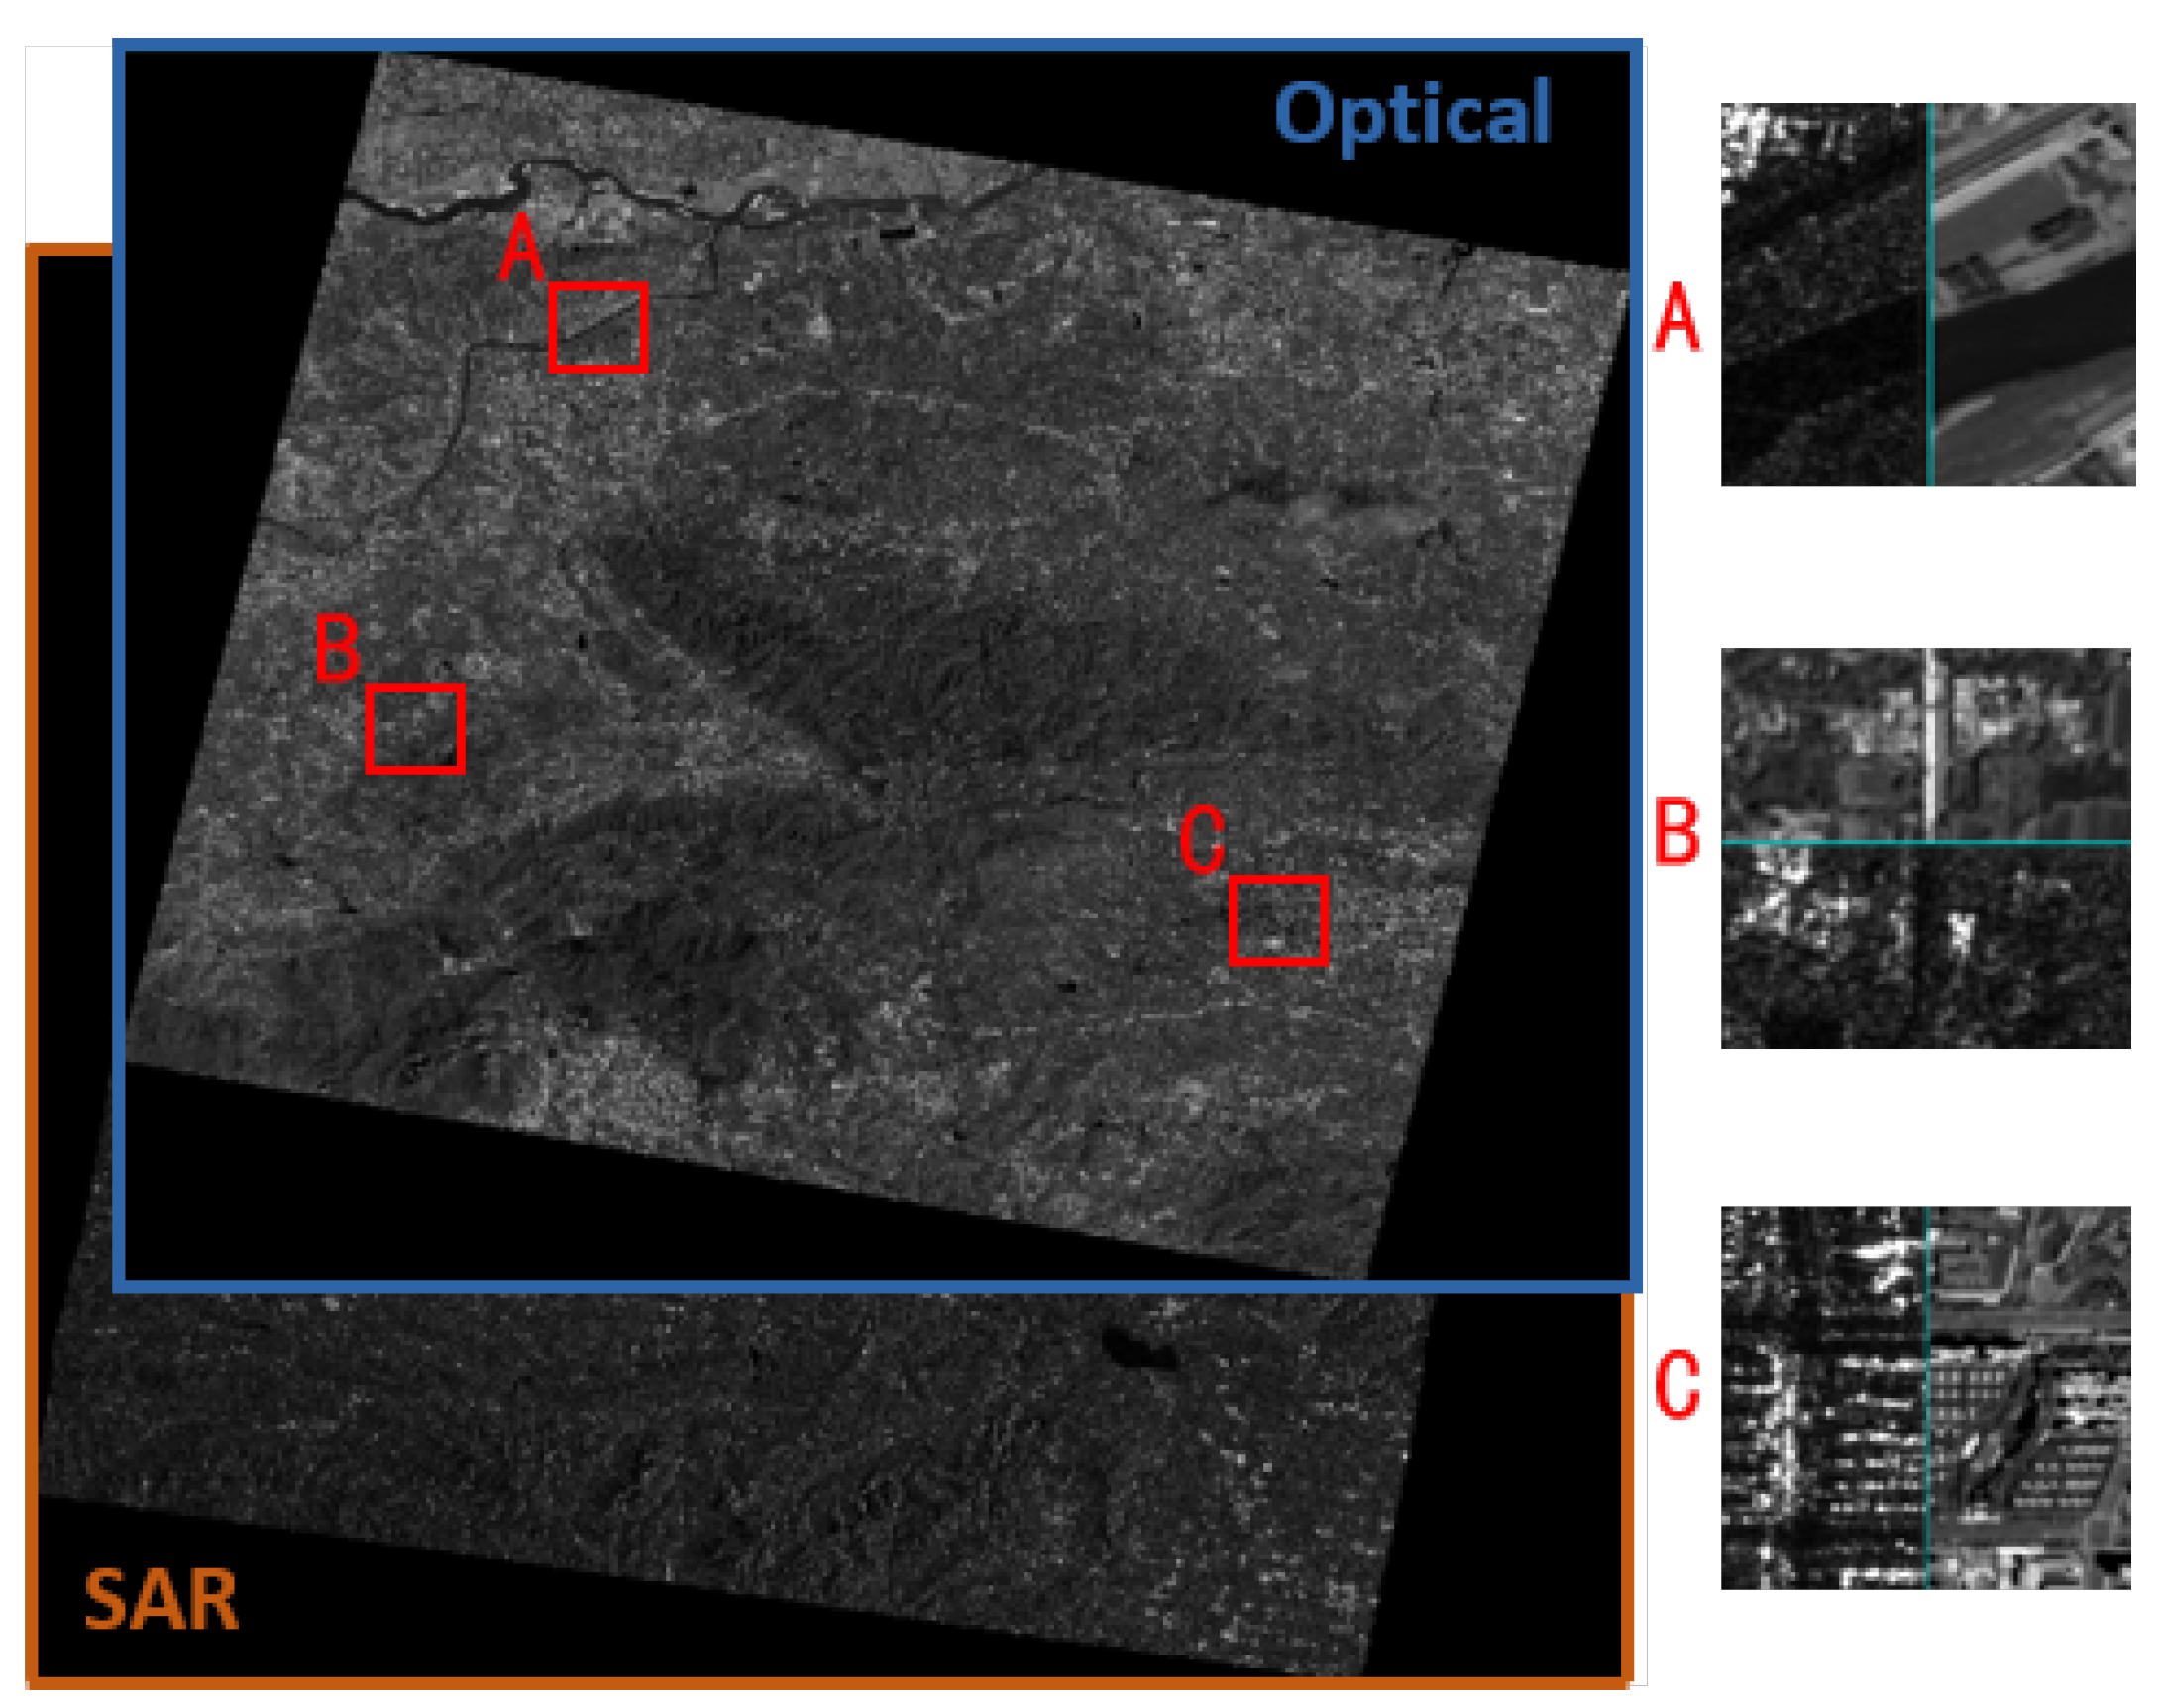
The proposed strategy is tested in this experiment using real optical and SAR satellite images. The optical images are generated by four sensors (GF7, GF1, ZY03, GF2) and the SAR images are generated by GF3. With the increase of image resolution, the geometric relation between optical and SAR images is difficult to conform with the affine transformation conditions. In this case, we chose four pairs of images with a resolution better than 3 m in this experiment. These data include urban areas, mountainous areas, rural areas, and bodies of water such as lakes and rivers. Figure 11, Figure 12, Figure 13 and Figure 14 shows the four pairs of images, and Table 2 provides the descriptions for all the test data.

4.2.2. Evaluation Criteria

In this experiment, the performance of the optical and SAR image registration strategy is evaluated in four ways. First, we use a classical evaluation criterion named the number of correct matches (NCM). The NCM is the number of match points after removing false match points. Using this criterion, we can intuitively analyze the advantages and disadvantages of various matching strategies. The second method is an objective and quantitative measure named Root mean square error (RMSE), which can measure the correlation of the image registration, and it is defined as the following equation:
R M S E = 1 N 0 i = 1 N 0 T x 1 i , y 1 i x 2 i , y 2 i 2
N 0 is the number of the matched point pairs x 1 i , y 1 i and x 2 i , y 2 i in the image pair. T is the transformation matrix computed by the whole matched points in the image pair.
In general, RMSE is used to evaluate the ability of the point set to conform with a particular model. When the image size is small, RMSE can be used to approximate the ability of the registration algorithm. As the image size increases, RMSE will fail due to the increase of nonlinear distortion.
To objectively reflect the improvement of image matching affected by correct matching points, we introduce structural similarity (SSIM) to measure the variation of image matched by control points, and is defined as the following equation:
SSI M x , y = 2 μ x μ y + c 1 2 σ x y + c 2 μ x 2 + μ y 2 + c 1 σ x 2 + σ y 2 + c 1
where μ x and μ y are the mean of I x and I x ; σ x 2 and σ y 2 are the variances of I x and I x ; c 1 = k 1 L 2 and c 2 = k 2 L 2 is the constant used to maintain stability; L is the dynamic range of pixel values; k 1 = 0.01 and k 2 = 0.03 . However, as shown in Figure 15, due to the interference of the speckle noise of SAR image, SSIM of optical and SAR images cannot reflect the correlation. We reduce the speckle noise by extracting phase congruency (PC) from the image.
Given an input image I x , y , its convolution results E n o x , y and O n o x , y with log Gabor even-symmetric G n o e and odd-symmetric G n o o wavelets in scale n and orientation o can be regarded as
E n o x , y , O n o x , y = I x , y G n o e , I x , y G n o o
Then, the amplitude A n o x , y and phase φ n x , y are given by
A n o x , y = E n o x , y 2 + O n o x , y 2
φ n x , y = a r c tan 2 E n o x , y , O n o x , y
Considering the noise compensation term T o , the final PC model is:
P C x , y = o n W 0 x , y A n o x , y Δ Φ n o x , y T o o n A n o x , y + ε
where W 0 x , y is a weighting function; ε is a small constant; Δ Φ n o x , y is a more sensitive phase deviation function defined as
A n o x , y Δ Φ n o x , y = E n o x , y φ ¯ e x , y + O n o x , y φ ¯ o x , y E n o x , y φ ¯ o x , y + O n o x , y φ ¯ e x , y
where,
φ ¯ e x , y = o n E n o x , y o n E n o x , y ψ x , y ψ x , y
φ ¯ o x , y = o n O n o x , y o n O n o x , y ψ x , y ψ x , y
ψ x , y = o n E n o x , y 2 + o n O n o x , y 2
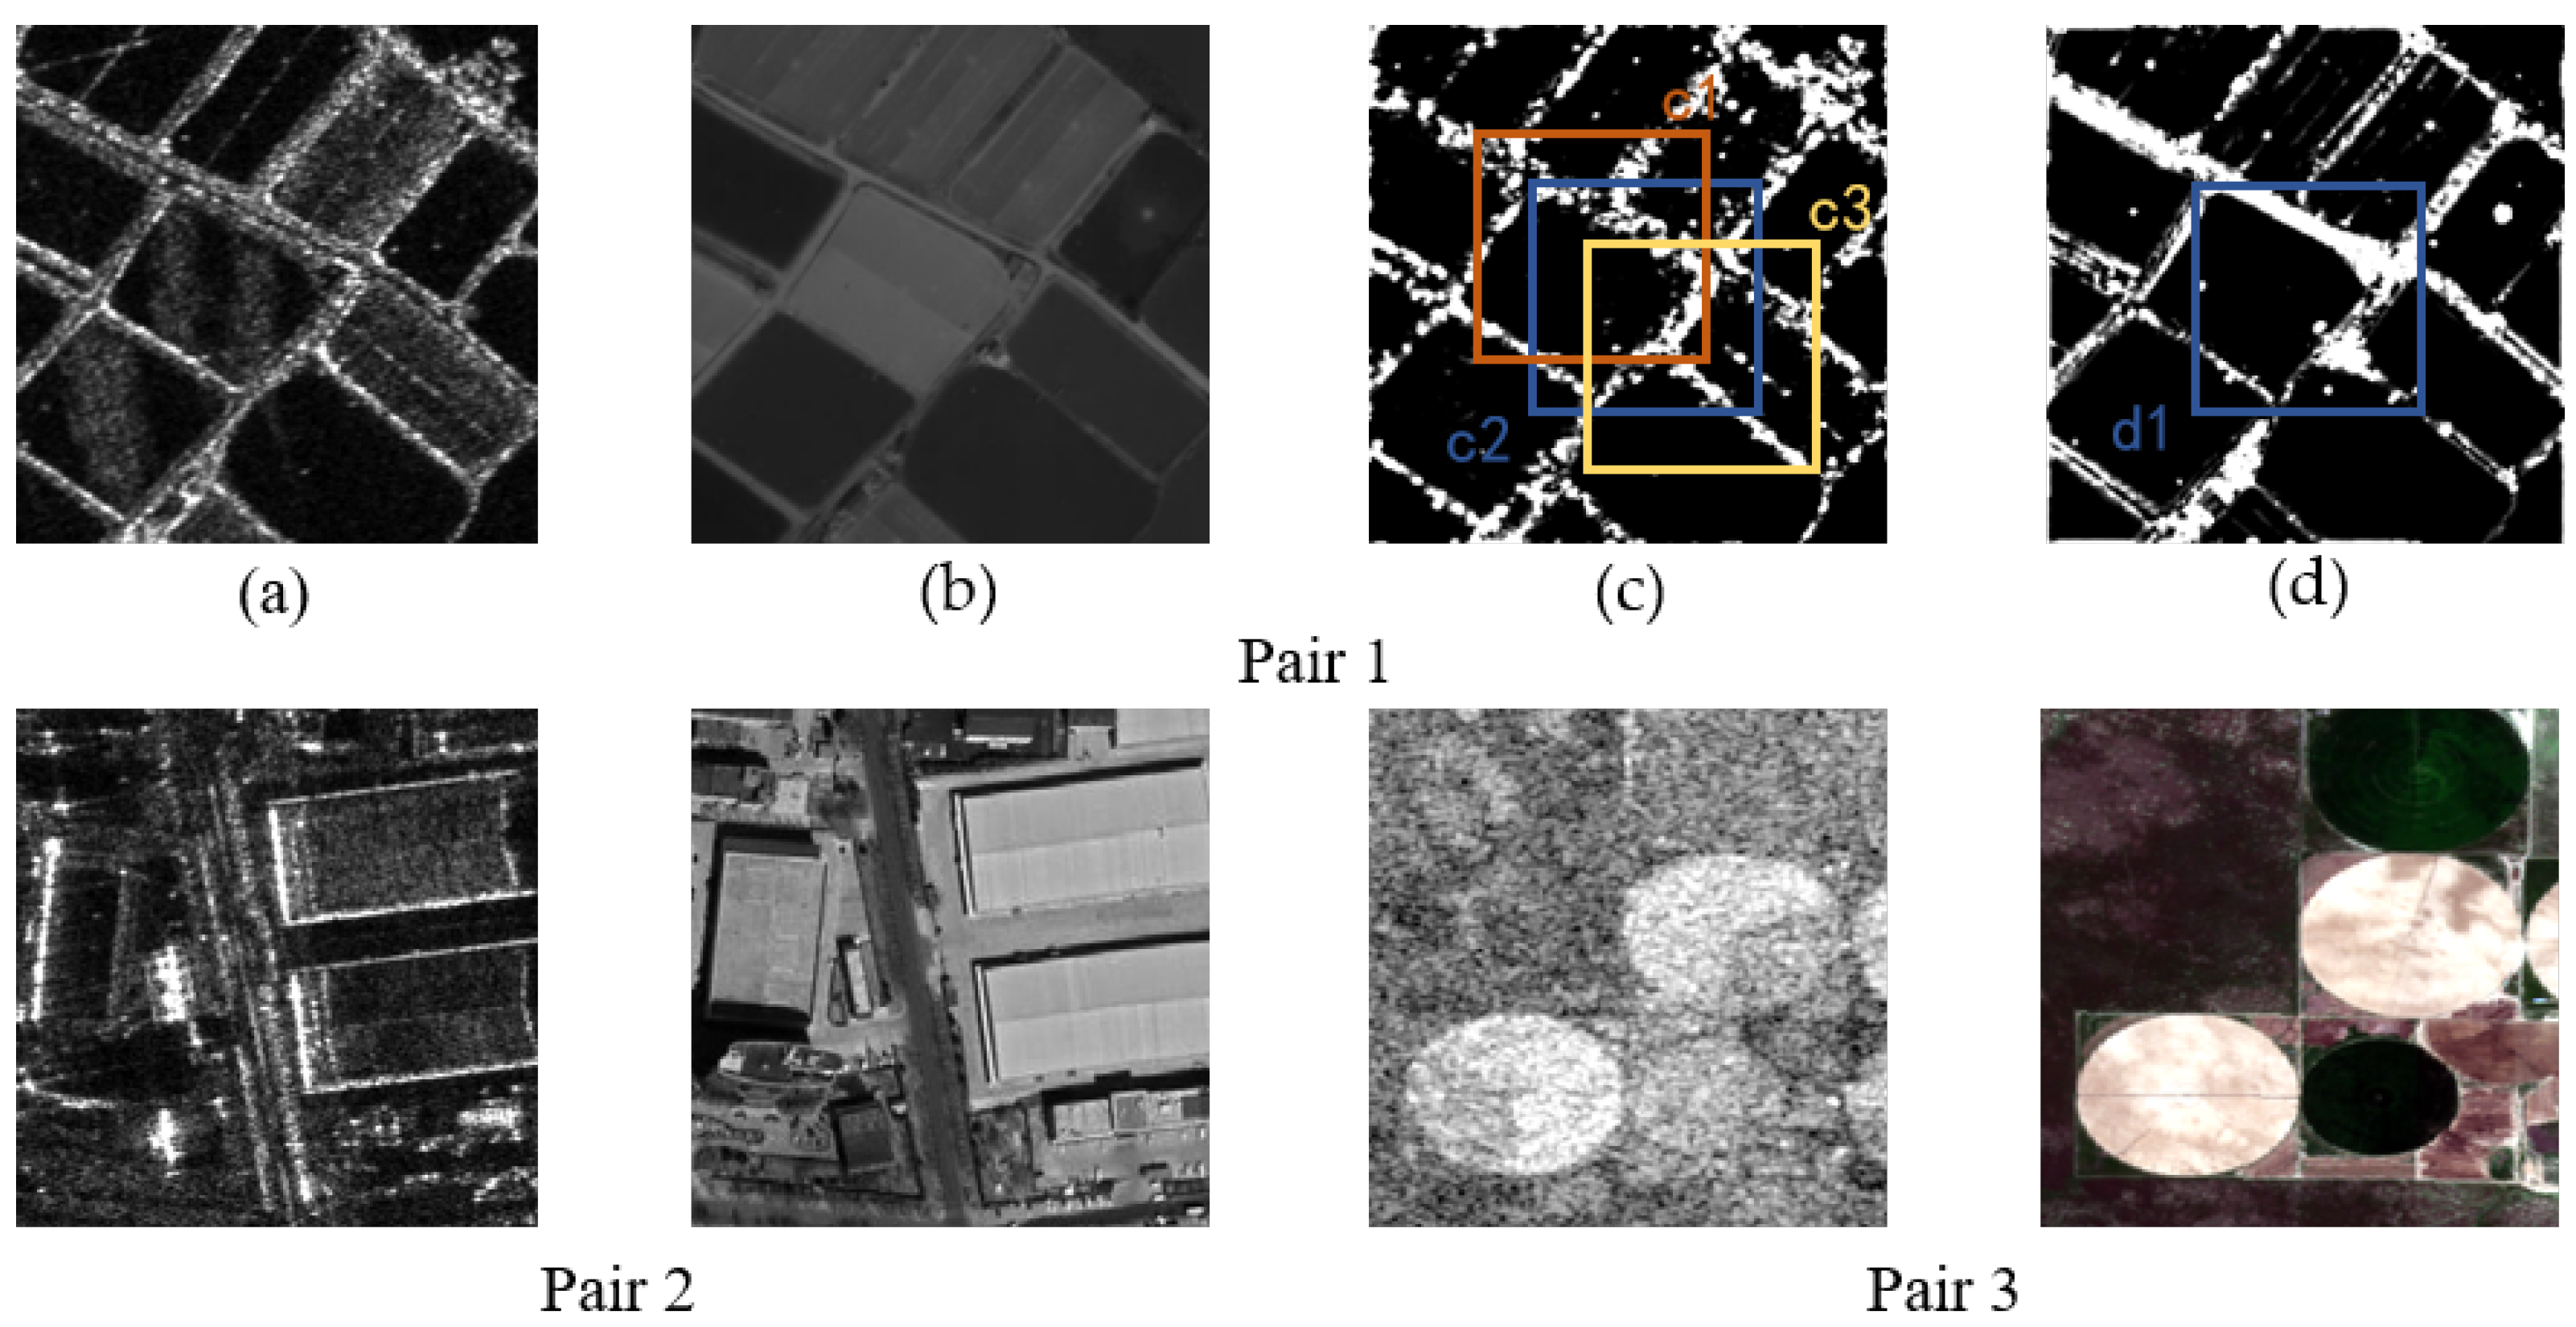
SSIM is calculated for the image pair in Figure 15, and then the results are shown in Table 3. Extracting PC from optical and SAR images and then calculating SSIM can better reflect image similarity. In Figure 15c, c2 is in the center of the image with a size of 100 × 100 pixels. c1 moves 5 pixels to the left and 5 pixels to the up compared with c2, and c3 moves 5 pixels to the right and 5 pixels to the down compared with c2. It can be seen from Table 3 that SSIM P C is sensitive to image translation.
Based on the properties of SSIM P C , we proposed two image evaluation metrics: the number of improve matches (NIM) and the rate of improved matches (RIM). NIM is defined as the following equation:
N I M = i = 1 N 0 Π ( S S I M P C ( T ( w ( x 1 i , y 1 i ) ) , w ( x 2 i , y 2 i ) ) S S I M P C ( w ( x 1 i , y 1 i ) , w ( x 2 i , y 2 i ) ) )
where Π x is the indicator function which takes 1 and 0 when x is true and false; N 0 is the number of the matched point pairs; T is the transformation matrix; w is a window function. RIM is defined as following equation:
R I M = N I M N 0
If the correct transformation relationship between two images is found by the feature point set, at least the structural similarity of the image pairs near the feature points is improved compared to the original. Based on this assumption, NIM and RIM can reflect the contribution of matching points to improve image matching quality.

4.2.3. Experimental Analysis

As shown in Figure 11, the optical and SAR images pair does not conform to the affine transformation conditions. The details in Figure 16 and Table 4 show that the actual matching accuracy of the image is improved after block processing, which proves that there are a lot of nonlinear transformations between the large images pair. The proposed strategy extracts fewer feature points than with the block-RANSAC method because the single peak structure in the similarity map is only a sufficient and unnecessary condition for successful matching. By comparing NIM and RIM, the points filtered with our strategy can improve image matching quality significantly more than other algorithms. As shown in Figure 16, the proposed strategy can achieve the best matching effect in this test.
As shown in Figure 12, the image in pair B was taken at Wuhan, Hubei Province. The content of this image is mainly plain with a small elevation difference. Therefore, there are only a few pixels offset between optical and SAR images. The images pair satisfies the affine transformation condition. In this case, the RANSAC algorithm and block-RANSAC algorithm extract a similar number of feature points when the RMSE is small (see Table 4). The accuracy of matching points obtained by the proposed strategy is higher than the other two methods through NIM and RIM. As shown in Figure 17, the proposed strategy is better in detail.
As shown in Figure 13, the region in pair C is located in the mountainous area of Dengfeng City, Henan Province. The number of correct points extracted by the Block-RANSAC algorithm is three times more than the RANSAC algorithm (see Table 4), which proves that the nonlinear transformation between images is very serious. As shown in Figure 18, the points extracted by the RANSAC algorithm cannot reflect the nonlinear transformation of the image. The shortcoming of the Block-RANSAC algorithm is that artificial segmentation is not suitable for the condition of the image itself. The proposed strategy can find the corresponding relationship between the two images more accurately. The details and NIM can prove that the proposed strategy can find useful and correct matching points.
As shown in Figure 14, the area of this image pair is located in Wuhan, Hubei Province. Because the image is disturbed by cloud interference, the optical image quality is poor and the positioning accuracy is low. Due to the severe nonlinear transformation phenomenon, the RANSAC method cannot correctly find the deformation relationship of the optical and SAR images pair. Since the manual segmentation does not match the nonlinear distortion distribution of the image, the distribution of correct matching points does not change significantly even though the number of correct matching points increases after block processing (see Figure 19). As shown in Figure 19, because our strategy does not remove outliers according to the global transformation model, the proposed strategy can accurately find stable and correct points between the two images.
In addition, from the results of four groups of experiments, NIM and RIM are in good agreement with the subjective observation results. The advantage of our strategy is that it does not assume that the optical and SAR image pair conforms to the rigid transformation. Therefore, when the image pair has a serious nonlinear deformation, our strategy is more consistent with the real transformation relationship between images (see Figure 16, Figure 17, Figure 18 and Figure 19).

5. Conclusions

In this paper, we first propose an optical and SAR image matching strategy based on the feature selection. The proposed strategy removes outliers through similarity maps of matching points. Because we only have the feature of the correct matching points in the similarity maps, the One-Class SVM is used to select similarity maps. To train the One-Class SVM, we propose a method to make the similarity map dataset using the SEN1-2 dataset. 2300 positive similarity maps were selected as the dataset. Because this strategy does not assume the transformation relationship between images, it has strong robustness to nonlinear transformation between optical and SAR images.
To verify the effectiveness of the proposed strategy, two groups of experiments were conducted. To prove that the One-Class SVM can select the similarity map correctly, we first use the SEN1-2 dataset and OSmatch dataset to demonstrate the generalization capability of the One-Class SVM. Experimental results show that the success rate of One-Class SVM outlier rejection is higher than 80%, and the stable correct matching points can be selected. In the second experiment, we tested our strategy using four sets of optical and SAR images. To find the objective metrics that are in good agreement with subjective observations, we propose NIM and RIM metrics by comparing the similarity of the template region before and after matching. By comparing NIM and RIM, more than 68% of the points filtered with our strategy can improve image matching quality significantly. The experimental result shows the proposed strategy can effectively reduce the influence of nonlinear transformation between optical and SAR images and achieve a good matching effect.
Our large-size optical and SAR matching strategy can be applied to change detection, planar block adjustment, high-precision geolocation, and fusion of multi-sensor images. In our future work, we will test our strategy on more multi-sensor images with nonlinear deformation and improve the accuracy on the similarity map dataset.

Author Contributions

Z.L. was primarily responsible for conceiving the method and writing the source code and the paper. H.Z. designed the experiments and revised the paper. Y.H. and H.L. generated datasets and performed the experiments. All authors have read and agreed to the published version of the manuscript.

Funding

This research received no external funding.

Data Availability Statement

Not applicable.

Conflicts of Interest

The authors declare no conflict of interest.

References

  1. Kulkarni, S.; Rege, P. Pixel Level Fusion Techniques for SAR and Optical Images: A Review. Inf. Fusion 2020, 59, 13–29. [Google Scholar] [CrossRef]
  2. Li, X.; Wang, T.; Zhang, G.; Jiang, B.; Zhao, Y. Planar Block Adjustment for China’s Land Regions with LuoJia1-01 Nighttime Light Imagery. Remote Sens. 2019, 11, 2097. [Google Scholar] [CrossRef] [Green Version]
  3. Wang, T.; Li, X.; Zhang, G.; Lin, M.; Deng, M.; Cui, H.; Jiang, B.; Wang, Y.; Zhu, Y.; Wang, H.; et al. Large-Scale Orthorectification of GF-3 SAR Images without Ground Control Points for China 2019 Land Area. IEEE Trans. Geosci. Remote Sens. 2022, 60, 5221617. [Google Scholar] [CrossRef]
  4. Song, S.; Jin, K.; Zuo, B.; Yang, J. A novel change detection method combined with registration for SAR images. Remote Sens. Lett. 2019, 10, 669–678. [Google Scholar] [CrossRef]
  5. Niangang Jiao, F.W.; You, H.; Liu, J.; Qiu, X. A generic framework for improving the geopositioning accuracy of multi-source optical and SAR imagery. ISPRS J. Photogramm. Remote Sens. 2020, 169, 377–388. [Google Scholar] [CrossRef]
  6. Kai, L.; Xueqing, Z. Review of Research on Registration of SAR and Optical Remote Sensing Image Based on Feature. In Proceedings of the 2018 IEEE 3rd International Conference on Signal and Image Processing (ICSIP), Shenzhen, China, 13–15 July 2018; pp. 111–115. [Google Scholar] [CrossRef]
  7. Fan, J.; Wu, Y.; Li, M.; Liang, W.; Cao, Y. SAR and Optical Image Registration Using Nonlinear Diffusion and Phase Congruency Structural Descriptor. IEEE Trans. Geosci. Remote Sens. 2018, 56, 5368–5379. [Google Scholar] [CrossRef]
  8. He, C.; Fang, P.; Xiong, D.; Wang, W.; Liao, M. A Point Pattern Chamfer Registration of Optical and SAR Images Based on Mesh Grids. Remote Sens. 2018, 10, 1837. [Google Scholar] [CrossRef] [Green Version]
  9. Li, J.; Hu, Q.; Ai, M. RIFT: Multi-Modal Image Matching Based on Radiation-Variation Insensitive Feature Transform. IEEE Trans. Image Process. 2020, 29, 3296–3310. [Google Scholar] [CrossRef]
  10. Xiang, Y.; Wang, F.; You, H. OS-SIFT: A Robust SIFT-Like Algorithm for High-Resolution Optical-to-SAR Image Registration in Suburban Areas. IEEE Trans. Geosci. Remote Sens. 2018, 56, 3078–3090. [Google Scholar] [CrossRef]
  11. Feng, R.; Du, Q.; Li, X.; Shen, H. Robust registration for remote sensing images by combining and localizing feature- and area-based methods. ISPRS J. Photogramm. Remote Sens. 2019, 151, 15–26. [Google Scholar] [CrossRef]
  12. Suri, S.; Reinartz, P. Mutual-Information-Based Registration of TerraSAR-X and Ikonos Imagery in Urban Areas. IEEE Trans. Geosci. Remote Sens. 2010, 48, 939–949. [Google Scholar] [CrossRef]
  13. Li, Z.; Mahapatra, D.; Tielbeek, J.A.W.; Stoker, J.; van Vliet, L.J.; Vos, F.M. Image Registration Based on Autocorrelation of Local Structure. IEEE Trans. Med. Imaging 2016, 35, 63–75. [Google Scholar] [CrossRef] [PubMed]
  14. Lowe, D.G. Distinctive Image Features from Scale-Invariant Keypoints. Int. J. Comput. Vis. 2004, 2, 91–110. [Google Scholar] [CrossRef]
  15. Dalal, N.; Triggs, B. Histograms of oriented gradients for human detection. In Proceedings of the 2005 IEEE Computer Society Conference on Computer Vision and Pattern Recognition (CVPR’05), San Diego, CA, USA, 20–26 June 2005; Volume 1, pp. 886–893. [Google Scholar] [CrossRef] [Green Version]
  16. Ye, Y.; Shan, J.; Hao, S.; Bruzzone, L.; Qin, Y. A local phase based invariant feature for remote sensing image matching. ISPRS J. Photogramm. Remote Sens. 2018, 142, 205–221. [Google Scholar] [CrossRef]
  17. Kovesi, P. Phase congruency: A low-level image invariant. Psychol. Res. 2000, 64, 136–148. [Google Scholar] [CrossRef]
  18. Ye, Y.; Shan, J.; Bruzzone, L.; Shen, L. Robust Registration of Multimodal Remote Sensing Images Based on Structural Similarity. IEEE Trans. Geosci. Remote Sens. 2017, 55, 2941–2958. [Google Scholar] [CrossRef]
  19. Ye, Y.; Bruzzone, L.; Shan, J.; Bovolo, F.; Zhu, Q. Fast and Robust Matching for Multimodal Remote Sensing Image Registration. IEEE Trans. Geosci. Remote Sens. 2019, 57, 9059–9070. [Google Scholar] [CrossRef] [Green Version]
  20. Li, J.; Hu, Q.; Ai, M. Robust Feature Matching for Remote Sensing Image Registration Based on Lq-Estimator. IEEE Geosci. Remote Sens. Lett. 2016, 13, 1989–1993. [Google Scholar] [CrossRef]
  21. Fischler, M.A.; Bolles, R.C. Random Sample Consensus: A Paradigm for Model Fitting with Applications to Image Analysis and Automated Cartography. In Readings in Computer Vision; Fischler, M.A., Firschein, O., Eds.; Readings in Computer Vision, Morgan Kaufmann: San Francisco, CA, USA, 1987; pp. 726–740. [Google Scholar] [CrossRef]
  22. Wu, Y.; Ma, W.; Gong, M.; Su, L.; Jiao, L. A Novel Point-Matching Algorithm Based on Fast Sample Consensus for Image Registration. IEEE Geosci. Remote Sens. Lett. 2015, 12, 43–47. [Google Scholar] [CrossRef]
  23. Liu, Z.; An, J.; Jing, Y. A Simple and Robust Feature Point Matching Algorithm Based on Restricted Spatial Order Constraints for Aerial Image Registration. IEEE Trans. Geosci. Remote Sens. 2012, 50, 514–527. [Google Scholar] [CrossRef]
  24. Ma, J.; Zhao, J.; Tian, J.; Yuille, A.L.; Tu, Z. Robust Point Matching via Vector Field Consensus. IEEE Trans. Image Process. 2014, 23, 1706–1721. [Google Scholar] [CrossRef] [PubMed] [Green Version]
  25. Li, X.; Hu, Z. Rejecting Mismatches by Correspondence Function. Int. J. Comput. Vision 2010, 89, 1–17. [Google Scholar] [CrossRef]
  26. Ma, J.; Zhao, J.; Zhou, Y.; Tian, J. Mismatch removal via coherent spatial mapping. In Proceedings of the 2012 19th IEEE International Conference on Image Processing, Orlando, FL, USA, 30 September–3 October 2012; pp. 1–4. [Google Scholar] [CrossRef]
  27. Myronenko, A.; Song, X. Point Set Registration: Coherent Point Drift. IEEE Trans. Pattern Anal. Mach. Intell. 2010, 32, 2262–2275. [Google Scholar] [CrossRef] [PubMed] [Green Version]
  28. Habib, A.; Al-Ruzouq, R. Semi-automatic registration of multi-source satellite imagery with varying geometric resolutions. Photogramm. Eng. Remote Sens. 2004, 71, 325–332. [Google Scholar] [CrossRef] [Green Version]
  29. Hu, Z. Line Based SAR and Optical Image Automatic Registration Method. In Proceedings of the 2010 Chinese Conference on Pattern Recognition (CCPR), Chongqing, China, 21–23 October 2010; pp. 1–5. [Google Scholar] [CrossRef]
  30. Sui, H.; Xu, C.; Liu, J.; Hua, F. Automatic Optical-to-SAR Image Registration by Iterative Line Extraction and Voronoi Integrated Spectral Point Matching. IEEE Trans. Geosci. Remote Sens. 2015, 53, 6058–6072. [Google Scholar] [CrossRef]
  31. Bentoutou, Y.; Taleb, N.; Kpalma, K.; Ronsin, J. An automatic image registration for applications in remote sensing. IEEE Trans. Geosci. Remote Sens. 2005, 43, 2127–2137. [Google Scholar] [CrossRef]
  32. Xu, C.; Sui, H.; Li, H.; Liu, J. An automatic optical and SAR image registration method with iterative level set segmentation and SIFT. Int. J. Remote Sens. 2015, 36, 3997–4017. [Google Scholar] [CrossRef]
  33. Huo, C.; Pan, C.; Huo, L.; Zhou, Z. Multilevel SIFT Matching for Large-Size VHR Image Registration. IEEE Geosci. Remote Sens. Lett. 2012, 9, 171–175. [Google Scholar] [CrossRef]
  34. Fan, Z.; Zhang, L.; Liu, Y.; Wang, Q.; Zlatanova, S. Exploiting High Geopositioning Accuracy of SAR Data to Obtain Accurate Geometric Orientation of Optical Satellite Images. Remote Sens. 2021, 13, 3535. [Google Scholar] [CrossRef]
  35. Li, Z.; Zhang, H.; Huang, Y. A Rotation-Invariant Optical and SAR Image Registration Algorithm Based on Deep and Gaussian Features. Remote Sens. 2021, 13, 2628. [Google Scholar] [CrossRef]
  36. Perera, P.; Oza, P.; Patel, V.M. One-Class Classification: A Survey. arXiv 2021, arXiv:2101.03064. [Google Scholar]
  37. Schmitt, M.; Hughes, L.H.; Zhu, X.X. The SEN1-2 Dataset for Deep Learning in SAR-Optical Data Fusion. arXiv 2018, arXiv:1807.01569. [Google Scholar] [CrossRef] [Green Version]
  38. Xiang, Y.; Tao, R.; Wang, F.; You, H. Automatic Registration of Optical and SAR Images VIA Improved Phase Congruency. In Proceedings of the IGARSS 2019—2019 IEEE International Geoscience and Remote Sensing Symposium, Yokohama, Japan, 28 July–2 August 2019; pp. 931–934. [Google Scholar] [CrossRef]
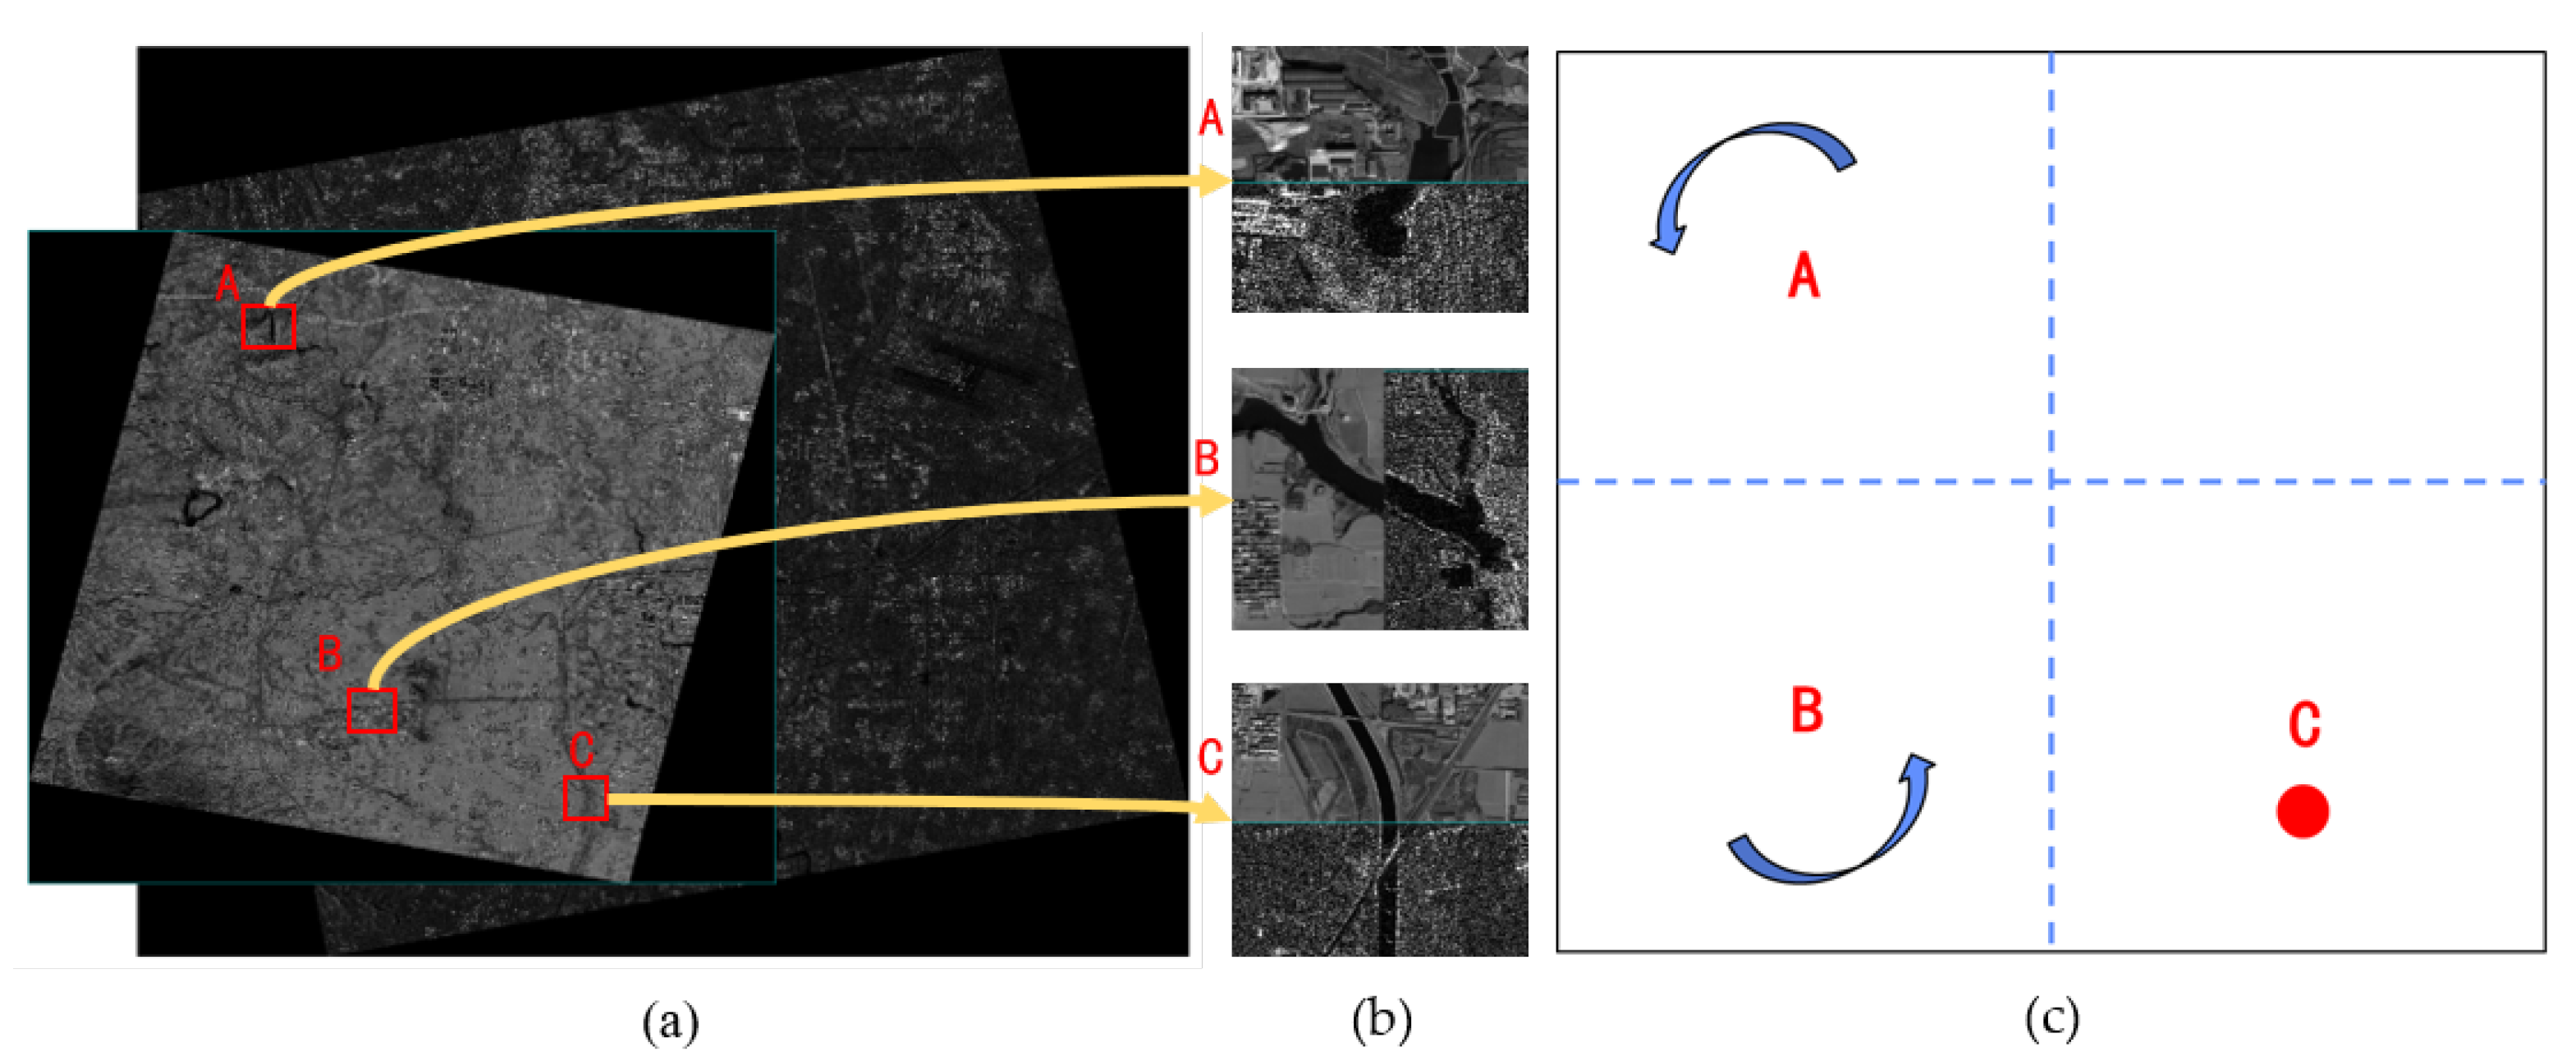
Figure 1. An example of the nonlinear deformation between optical and SAR images. (a) GF7 (visible), GF3 (SAR). (b) Details of the nonlinear deformation. (c) The transformer of the optical and SAR images pair. The image pair have a significant nonlinear deformation which is not satisfied the affine transformation.
Remotesensing 14 03012 g001
Figure 2. The process of the similarity map.
Remotesensing 14 03012 g002
Figure 3. Comparison of similarity maps by the correct point and the wrong point.
Remotesensing 14 03012 g003
Figure 4. Different forms of classification.
Remotesensing 14 03012 g004
Figure 5. The max Harris response in the search region.
Remotesensing 14 03012 g005
Figure 6. The similarity map of the correct point.
Remotesensing 14 03012 g006
Figure 7. The proposed optical and SAR image registration strategy.
Remotesensing 14 03012 g007
Figure 8. Samples of the test dataset.
Remotesensing 14 03012 g008
Figure 9. ROC curves deliverd on SEN1-2 dataset.
Remotesensing 14 03012 g009
Figure 10. ROC curves deliverd on OSmatch dataset.
Remotesensing 14 03012 g010
Figure 11. The pair A.
Remotesensing 14 03012 g011
Figure 12. The pair B.
Remotesensing 14 03012 g012
Figure 13. The pair C.
Remotesensing 14 03012 g013
Figure 14. The pair D.
Remotesensing 14 03012 g014
Figure 15. The test image pair for SSIM P C . (a) SAR image. (b) optical image. (c) PC response of SAR image. (d) PC response of optical image.
Remotesensing 14 03012 g015
Figure 16. Details of image transformation relationships detected by RANSAC, Block-RANSAC and the proposed strategy in pair A.
Remotesensing 14 03012 g016
Figure 17. Details of image transformation relationships detected by RANSAC, Block-RANSAC and the proposed strategy in pair B.
Remotesensing 14 03012 g017
Figure 18. Details of image transformation relationships detected by RANSAC, Block-RANSAC and the proposed strategy in pair C.
Remotesensing 14 03012 g018
Figure 19. Details of image transformation relationships detected by RANSAC, Block-RANSAC and the proposed strategy in pair D.
Remotesensing 14 03012 g019
Table 1. TPR and FPR results for One-Class SVM on SEN1-2 and OSmatch datasets.
v0.010.050.080.10.150.20.250.30.350.40.450.5
SpringTPR10.990.970.960.910.870.810.750.690.610.530.45
FPR0.780.620.510.460.300.190.120.070.050.030.020.01
SummerTPR10.980.970.960.910.860.810.730.670.620.560.49
FPR0.830.680.570.500.320.250.130.060.040.020.010
FallTPR0.990.970.960.940.900.850.790.690.620.550.460.40
FPR0.800.630.580.490.330.210.140.080.060.040.020.01
WinterTPR10.990.980.950.880.810.740.640.550.460.350.27
FPR0.810.670.550.470.300.240.170.110.060.040.010.01
OSmatchTPR10.950.930.930.840.810.720.620.510.450.330.27
FPR0.920.610.560.530.370.290.190.110.070.040.020.01
Table 2. Detailed description of test data for the experiment of the strategy.
No.Image PairResolutionSize (Pixels)DateCharacteristics
AGF-7 (optical)0.8 m13,301 × 11,63706/2021High resolution images over urban areas,
GF-3 (SAR)3 m18,734 × 16,20406/2018temporal differences of 36 months (see Figure 11)
BGF-1 (optical)2 m13,928 × 12,14510/2016High resolution images over urban areas
GF-3 (SAR)3 m13,902 × 12,12509/2018including rivers, lakes and island (see Figure 12)
CZY-3 (optical)2 m13,928 × 12,14511/2017High resolution images over mountain areas,
GF-3 (SAR)3 m13,902 × 12,12504/2019significant radiation differences (see Figure 13)
DGF-2 (optical)1 m27,141 × 23,63106/2018High resolution images over urban areas,
GF-3 (SAR)3 m5459 × 393901/2019Fog interferes with the optical image (see Figure 14)
Table 3. SSIM results.
SSIM(a, b)(c, d)(c1, d1)(c2, d1)(c3, d1)
Pari 10.210.950.910.940.91
Pari 20.330.910.880.910.86
Pari 30.180.730.810.890.85
Table 4. Registration results for all the test sets.
MethodN0NCMRMSENIMRIM
Pair ARANSAC18171.10950%
Block-RANSAC38357.231847%
Our strategy313118.272481%
Pair BRANSAC78771.173848%
Block-RANSAC99952.025252%
Our strategy91907.517076%
Pair CRANSAC30281.051343%
Block-RANSAC544910.252342%
Our strategy898625.506169%
Pair DRANSAC15151.08533%
Block-RANSAC44427.272250%
Our strategy414135.402868%
Publisher’s Note: MDPI stays neutral with regard to jurisdictional claims in published maps and institutional affiliations.