Abstract
Conventional energy detection is a robust method that is usually applied to underwater broadband acoustic signal processing for towed arrays. Due to its low resolution, the weak target detection performance of conventional energy detection is severely degraded in shallow sea environments with strong acoustical reverberation. Subband peak energy detection is an effective method to improve the display resolution of conventional energy detection. However, subband peak energy detection produces false alarms due to the presence of high sidelobe levels. In order to improve the underwater target detection performance, a deconvolved subband peak energy detection method for towed arrays is proposed in this paper. Compared with conventional beamforming, minimum-variance distortionless response with forward–backward averaging and diagonal loading algorithm and subband peak energy detection, the proposed method could robustly provide higher-resolution results and suppress the fake peaks induced by subband peak energy detection. The performance of the proposed method was evaluated with simulation results, and the sea experimental data processing results show that the proposed method is effective in engineering applications.
1. Introduction
Towed array sonars with a large number of acoustical sensors and large apertures are widely used for underwater weak signal detection [1], achieving high spatial resolution and signal amplification. Geometrically, a towed array sonar is a long flexible hose attached to the ship or the underwater vehicle with a connecting cable [2], as shown in Figure 1. During the motion of the tow vehicle, the sensors are thus subjected to hydrodynamic forces and under constant motion, and disorder of the array shape appears.
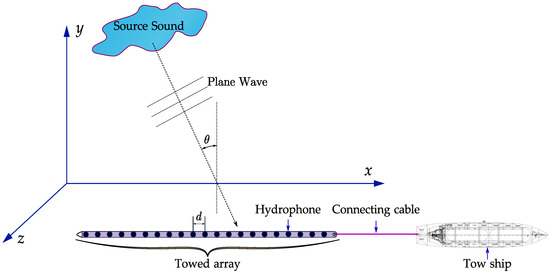
Figure 1.
Schematic diagram of a towed array sonar.
Conventional beamforming (CBF), also known as Bartlett [3], is the earliest spatial spectrum estimation technique. Because of its insensitivity to minor array shape uncertainty and ease of implementation, conventional beamforming has been frequently utilized in towed array sonar systems. Due to the inadequate resolution and high sidelobes level of conventional beamforming, the identification of low signal-to-noise ratio (SNR) signals in the presence of a noisy interferer using a towed array sonar is constrained [4]. Many adaptive beamforming methods have been developed to overcome the disadvantages of conventional beamforming such as the minimum-variance distortionless response (MVDR) and multiple signal classification (MUSIC) [3]. However, distortion of the array shape can cause significant degradation in the high-resolution beamforming process, resulting in convergence problems and artifacts [5]. To reduce the sensitivity to array shape disturbances of MVDR, Cox H. et al. proposed diagonal loading of the covariance matrix to improve the robustness of the MVDR [6]. Jian Li et al. proposed a doubly constrained robust Capon beamformer [7] by imposing a constant norm constraint and a spherical uncertainty set a constraint on the array steering vector. The computational complexity and time complexity of these constraint-based methods are high because they typically lack an analytical solution and must obtain the optimal solution through iteration. Another major challenge with high-resolution beamforming methods is the estimation of the sampling covariance matrix [8]. The signal covariance matrix is usually unknown in practice and must be determined in real time through the signal. As a result, as many snapshots as feasible are required to create the sampling covariance matrix that accurately represents the signal. For large arrays, such as the towed array, and in dynamic situations, due to the received signal model changing rapidly from snapshot to snapshot, only a few snapshots are available in a single session, resulting in the “snapshot deficiency” problem [9]. A class of algorithms that reduce the degree-of-freedom of the signal has been proposed to decrease the method’s reliance on snapshots such as dominant mode rejection [10] and cross-spectral eigenspace beamformers [11]. The problem is that these algorithms require a priori knowledge of the target number which is usually unknown. When the array manifold is conjugate symmetric, a centrohermitian constraint can be imposed on the sampling covariance matrix, that is, the forward–backward averaging technique. The forward–backward averaging technique can not only solve the snapshot deficiency problem, but can also provide computational benefits [12,13,14]. Another technique to deal with the snapshot deficiency problem is to match the time-varying model of signals. In [15], a signal subspace with a rapidly changing direction corresponded to multidimensional Slepian subspace by using an eigenvalue beamformer, and a high-resolution azimuth estimation result was achieved. Recently, a deconvolved conventional beamforming method was proposed based on the iteration of the CBF output [16]. Such a method can yield results with a narrow beamwidth and a low sidelobe level robust performance but at the cost of suppressing weak targets near strong interferers.
To lessen the impact of array disturbance, a tremendous number of array shape uncertainty estimation methods have been proposed, which can be classified into self-calibrating methods and calibrating source-dependent methods. For the self-calibrating method, the most common way is to place heading and depth measurement sensors at different points along the towed array, which provides localized horizontal and vertical information on the transverse displacements of the towed array sonar [17,18]. Alternatively, the positions can be determined by developing a water dynamical motion model of towed array [5,19,20]. Calibrating source-dependent method estimate array shapes can be conducted by processing known sound sources [21]. The disadvantages of these array shape estimation methods are that implementation is complicated, and the computational complexity is high, making real-time application difficult [22].
Another approach to enhancing the performance of spatial spectrum estimation is to exploit the broadband information of the signals. For a passive towed array sonar at low frequencies below 1000 Hz, broadband processing can be used for weak acoustic signal detection [1]. Methods such as conventional energy detection can be used to increase the array gain and narrow the beamwidth after the CBF process. Conventional energy detection can be defined as when the signal has a nonzero bandwidth, and the CBF output from the towed array can be incoherently averaged through the whole bandwidth to improve the performance of the beamforming results [23]. In shallow sea environments with strong acoustical reverberation, the acoustic energy of the target is weak, and the performance of conventional energy detection sharply decreases [24]. Subband peak energy detection (SPED) can be expected as a solution in such situations, and it can improve the display resolution of conventional energy detection [25]. SPED provides the possibility for detecting contacts of which the broadband signature will not be at minimum detectable levels but contain significant power in certain narrow spectral ranges. Although SPED can improve the direction resolution and provide better detection ability in real acoustic environments, SPED is still affected by its high sidelobe levels, and it generates false alarms [26]. To improve the performance of SPED, one can resort to upgrading the algorithms of energy detection or reducing the sidelobe levels of the beamformed output [27,28].
In this paper, a deconvolved subband peak energy detection (dCv-SPED) method is proposed to improve the performance of spatial-spectral estimation. A SPED algorithm is commonly used as a postprocessing algorithm for beamforming; however, the high-resolution deconvolution beamforming and SPED were treated as a joint problem in our work. Compared with SPED, the dCv-SPED algorithm makes full use of the prior information of the beam pattern by using deconvolution; the peak points obtained at different subbands are thereby more accurate and spikier. The advantages of the proposed method are summarized as follows:
- (1)
- It achieves high resolution with a low sidelobe level and overcomes the suppression of weak signals near strong interferers in deconvolution beamforming;
- (2)
- Such an algorithm can suppress the fake peak induced by SPED while retaining a low SNR signal detection capability;
- (3)
- It is insensitive to array perturbation and the snapshot deficiency problem.
This paper is organized as follows: the formulation of the problem is given in Section 2; Section 3 utilizes a simulation to study the performance of the proposed method, and the bearing time record results for 200–400 Hz broadband signals based on a towed array sonar is also introduced; Section 4 provides a conclusion of our research.
2. Methods
Consider a uniform linear array that has equally spaced hydrophones, with being their spacing. Sources at the far field of the array radiate narrowband acoustic signals with an angular direction The array receives these signals as the incident plane waves. The received signal in the frequency domain can be expressed as:
where is the frequency-domain snapshot vector of source signals; denotes the isotropic white noise snapshot. is an dimensional matrix that represents the composite array manifold corresponding to sources, defined by . The array manifold vector can also be defined in u-space as , where .
2.1. Conventional Beamforming
In order to estimate the direction of arrival, the spatial-spectral obtained by the CBF in u-space is given by:
where is the steering vector; denotes the average over snapshots; and H denotes the conjugate transpose. We assumed that no two signals were coherent, and the noise component at each sensor had a spectral height . Then, using ( is an identity matrix), we can rewrite Equation (2) as:
where the sinc function is given by ; f is the narrowband frequency; and is the sound speed. If the plane waves are broadband signals, the primarily frequency bins that we are interested in are , which can be rewritten as a spatial-spectral function of as:
The average spatial-spectral across the primarily frequency bins is obtained by:
2.2. MVDR-DL-FB Beamforming
In this subsection, we present an improved version of the MVDR algorithm, which is commonly used in towed array signal processing. Despite the fact that this algorithm has no relation to the algorithm proposed in this paper, we used it for performance comparison purposes. Based on the signal model above, the MVDR beamformer design is given by:
where is the covariance matrix and u is the desired signal direction in the u-space. Usually, the Lagrange multiplier method is used to solve the constrained minimization problem in Equation (6). The objective function to be minimized is:
where is the Lagrange multiplier. Determining the complex gradient of with respect to and letting it be zero, the optimal weight vector is:
According to the constraint conditions of Equation (6), and solving it gives:
Substituting Equation (9) into Equation (8), we can rewrite the optimal weight vector as:
Thus, the spatial-spectral in the u-space of the MVDR is obtained by:
By adjusting the weight factor, , the MVDR algorithm minimizes the total outputting power, while ensuring the outputting signal from the desired direction is distortionless.
In many situations, the covariance matrix, , is unknown and has to be estimated from multiple sample snapshots. Assuming we obtain copies of the array frequency-domain snapshots, say , we may use the sample covariance matrix as an estimate of . The estimation accuracy of has a major influence on the performance of the MVDR algorithm. While facing the snapshot deficiency problem, does not represent statistical characteristics of signals properly and, furthermore, causes an ill-conditioned problem for the matrix inverse. Assuming that the uniform linear array steering vector that we are dealing with is conjugate symmetric, say:
where * denotes a conjugate. is an exchange or reflection matrix represented by:
Then, we can introduce the forward–backward (FB) averaging technique to improve the snapshot deficiency problem by replacing with the forward–backward averaged sample covariance matrix, , as:
References [12,13,14] proved that forward–backward average brings a performance improvement and has computational advantages.
Manifold mismatch problems caused by array perturbations also deteriorate the behavior of the MVDR. In some mismatched cases, the MVDR beamformer nullifies the signal in the desired direction and leads to unacceptable performance loss. To deal with this problem, a technic called diagonal loading (DL) is adopted. Diagonal loading abates the sensitivity of the MVDR beamformer to array perturbations by adding a diagonal matrix to . Combining forward–backward and diagonal loading, a new covariance matrix is reconstructed as:
where is the loading versus, and it can be estimated by quadratic constraint:
where the range of the constraint value [7] is:
Initially, by using the equality constraint in Equation (16) and combining Equation (6), the objective function to be minimized is obtained as:
The solution in Equation (18) can be written as:
Reference [3] proves that the decreases with the increase in . Since the analytical solution of cannot be directly obtained, an iterative process can be used to solve the constraint equation:
with the initial value . The iterative process of Equation (20) is repeated and is calculated at each step until the constraint in Equation (16) is satisfied.
Thus, the spatial-spectral in the u-space of the MVDR-FB-DL is obtained by:
For broadband signals, the spatial-spectral can be estimated by the average beam power across primarily frequency bins such as in Equation (5).
2.3. Deconvolved Subband Peak Energy Detection (dCv-SPED) Beamforming
2.3.1. Formulations of SPED
Reconsider beamforming while the signal of interest is broadband. In Section 2.1, we simply averaged the beam power across frequency bins, the so-called conventional energy detection. Different from conventional energy detection, SPED only sums the beam peak across frequency bins. The first step of SPED is to estimate the floor of the beam power at each subband, say . This is conducted since the SNR is used as the energy value, defined by:
Ideally, . Suppose is estimated accurately, Equation (22) can be written as:
Then, the spatial-spectral of SPED in u-space is obtained as:
where:
Equations (24) and (25) ensure that only the energy at the peak accumulates across the subband. When there is a broadband signal coming from a certain azimuth in space, there should be some subband azimuth spectra that show local peak values at that azimuth. When there is only noise in a certain azimuth, although some subband azimuth spectra may show local peaks at that azimuth, these local peaks are random, and it is impossible for most subband azimuth spectra to show local peaks at the same azimuth. This property is called spatial coherence. By performing local peak accumulation, the spectral value of the signal azimuth is strengthened, and the noise spectral value of other azimuths is weakened; thus, the azimuth resolution can be improved, and the background level can be reduced.
SPED can be regarded as a frequency selection algorithm that selects the frequency of the beam response at the peak when the beam power is accumulated and discards the frequencies of those non-peak points. However, the extracted peaks cannot make full use of the prior information on the beam pattern; therefore, the extracted peaks have a large error. At the same time, when the broadband signal has a strong line spectrum, the peaks extracted from the sidelobes of the individual frequencies are difficult to suppress, resulting in false alarms.
2.3.2. Implementation of the dCv-SPED
To improve the performance of SPED, a deconvolution algorithm was introduced to obtain more accurate peaks while suppressing the sidelobes. Following the work of Yang [16], Equation (23) can be rewritten in the integral form as:
where is the source spatial distribution in u-space, and the beam pattern corresponding to frequency is given by:
Since can be regarded as the convolution of the beam pattern with the source spatial distribution, a method called deconvolution is applied to recover the source spatial distribution from . In our study, the deconvolution problem in Equation (26) was solved with a fast gradient projection method called the fast iterative shrinkage-thresholding algorithm [29].
Given as a point-spread function, the iterative procedure of the fast iterative shrinkage-thresholding algorithm is given by:
where the superscript () is the iteration number; is the Euclidean projection of variables onto the nonnegative orthant ; f is a convex function with a Lipschitz continuous gradient and a Lipschitz constant defined by ; is an intermediate step variable; is an auxiliary variable of . The fast iterative shrinkage-thresholding algorithm starts with initial values and .
By setting as the stopping criterion, the estimated source spatial distribution is . Then, is replaced by in Equation (25) to obtain:
and the spatial-spectral of the dCv-SPED can be expressed as:
The summarized steps of the dCv-SPED algorithm are listed in Algorithm 1. We applied numerical simulations and experimental data to illustrate the performance of the dCv-SPED.
| Algorithm 1. Summary of the dCv-SPED beamforming algorithm. |
| Given the received acoustic sensors data 1. Achieve spatial-spectral by conventional beamforming; 2. Estimate the noise floor to obtain using Equation (22); 3. Estimate the source spatial distribution by setting the stopping criterion P in Equation (28); 4. Obtain by Equation (18) and generate the spatial-spectral of the dCv-SPED using Equation (30). |
3. Results
3.1. Numerical Simulations
Now, the role of the dCv-SPED in the broadband spatial-spectral estimation of a uniform linear array is demonstrated, and its performance in the presence of array perturbations was studied using numerical examples. A uniform linear array with elements receiving signals with a frequency band of was considered. The number of snapshots processed was 32. The half-wavelength inter-element spacing of the uniform linear array was , where was the wavelength corresponding to the highest frequency, .
In the first simulation, the presence of signals with a strong line spectrum was considered first to examine the false alarm suppression and weak target detection ability of the dCv-SPED algorithm. Two ship noise signals arriving at the directions of [] and [] were generated. The SNRs of the two targets were 10 dB (at ) and 0 dB (at ). Figure 2 shows the spatial spectra estimated by CBF, SPED, MVDR-FB-FL, and dCv-SPED. In order to generate the same dynamic range, all spectra plots were normalized with the max value set at 0 dB. As shown in the figure, for the strong signal at , the beamwidth of the MVDR-FB-DL algorithm had the highest resolution, and its beamwidth was (measured at −3 dB point), followed by the dCv-SPED with a beamwidth . For the weak signal at , the dCv-SPED algorithm had the highest resolution, and its beamwidth was , followed by SPED with a beamwidth at . The dCv-SPED generated the highest dynamic range (target beam power in dB minus noise floor power in dB) of the weak target spatial spectra at , and its dynamic range was , followed by SPED with a dynamic range of . Compared with the SPED algorithm, dCv-SPED effectively suppressed the false peak caused by the SPED algorithm.
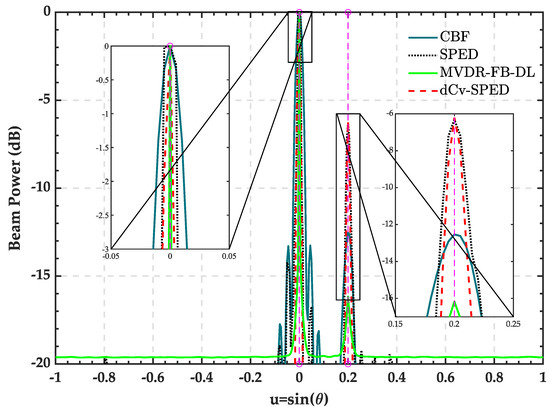
Figure 2.
Spatial spectra estimated by CBF, SPED, MVDR-FB-FL, and dCv-SPED.
In the second simulation, we investigated the root mean square error (RMSE) and resolution probability of the direction in the u-space of the two sources versus the input noise power using 200 Monte Carlo trials. Two ship noise signals arrived at the directions of [] and []. The power of the two targets was 20 dB (at 0°) and 0 dB (at ), respectively. The power of the noise varied in the interval dB. For each loop, the two most energetic peaks in the spatial spectrum were chosen as the estimated direction in the u-space, and , and the RMSE was:
Eventually, the RMSE was averaged across all 200 Monte Carlo trials. Figure 3 presents the RMSEs versus the input noise powers for the four algorithms. The dCv-SPED reached the lowest RMSE over the other algorithms for a noise power lower than 25 dB. The RMSE of all four algorithms decreased as the noise power decreased. The proposed algorithm achieved the minimum RMSE for a noise power below 10 dB, while the SPED algorithm achieved the minimum RMSE for a noise power below 5 dB. The CBF and MVDR-FB-DL had relatively high RMSEs. Figure 4 displays the probability of resolution versus noise power. We can say that a strong signal and a weak signal were successfully resolved if:
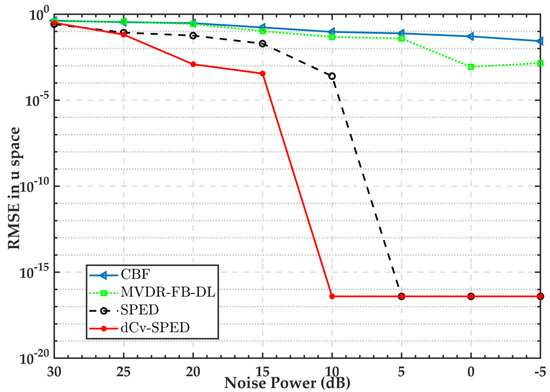
Figure 3.
Root mean square error of the estimated direction in u-space vs. noise power for the CBF, SPED, MVDR-FB-FL, and dCv-SPED.
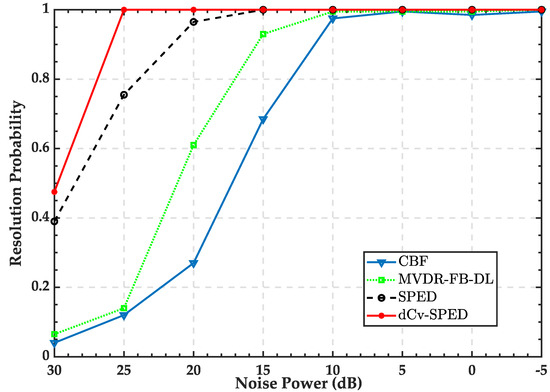
Figure 4.
Resolution probability vs. noise power for the CBF, SPED, MVDR-FB-FL, and dCv-SPED.
The probability resolution was computed by dividing the number of successful resolutions by the Monte Carlo trials. The resolution probability of all four algorithms increased as the noise power decreased. For noise power above 15 dB, the proposed algorithm obtained the highest resolution probability, and its resolution probability reached 1 at a noise power of 20 dB, while the SPED’s resolution probability reached 1 at a noise power of 15 dB. Figure 5 provides the spatial spectra estimated by the four algorithms when the noise was 10 dB. For the proposed algorithm, the two targets were clearly resolved, and the peak position at the weak target was accurate. The SPED algorithm could also resolve two targets, but the peaks’ position near weak targets was somewhat inaccurate, which was .
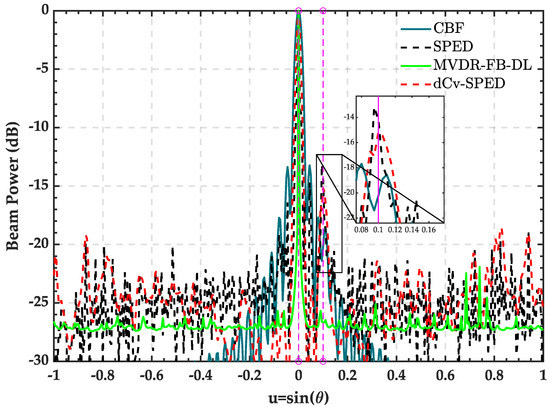
Figure 5.
Spatial spectra estimated by the CBF, SPED, MVDR-FB-FL, and dCv-SPED when the noise was 10 dB.
Next, the presence of array perturbations was considered. In towed array beamforming, the array shape is usually assumed as a uniform linear array, and the position of the array elements is known. However, in most situations, the array manifold is subject to random perturbations due to the flexible structure of the towed array. The ability to suppress and discriminate the interference of the beamforming algorithms decreased sharply. Therefore, it is important to study the performance of the algorithm under array disturbance.
For the third simulation, the actual and hypothetical array element positions are displayed in Figure 6. The position errors were determined by random perturbations in the x- and y-directions. We assumed the perturbation was statistically independent zero-mean Gaussian random variables with standard deviation , where It was assumed that the actual position of the array was unknown and beamformed according to a uniform linear array. The parameter setting of the receiving signals and noise was the same as in the first simulation.
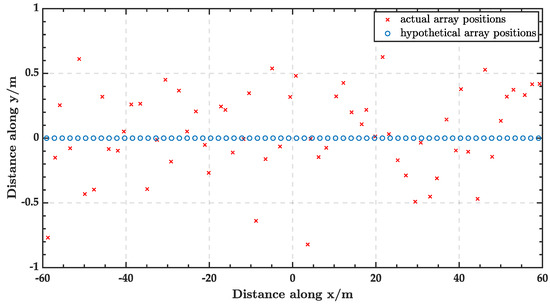
Figure 6.
Hypothetical and actual sensor positions of a ULA with 64 elements.
Figure 7 shows the spatial spectra estimated by the four algorithms under array perturbations. As the figure shows, the proposed algorithm provided the highest resolution for the spatial spectrum estimation of both strong and weak targets, and its beam width was and , respectively. When the array was perturbed, the beam widths of SPED for the strong and weak targets were and , close to those of the proposed algorithm, but SPED produced strong false alarms at approximately and . Due the array perturbations, the dynamic range and spectra resolution of the MVDR-FB-DL declined sharply. The explanation for this is that the MVDR was affected by the array perturbations, although the improved algorithms of the forward–backward averaging and diagonal loading were adopted to obtain spatial spectra, the cost was a decrease in the dynamic range, which led to the reduction in the weak target detection effect.
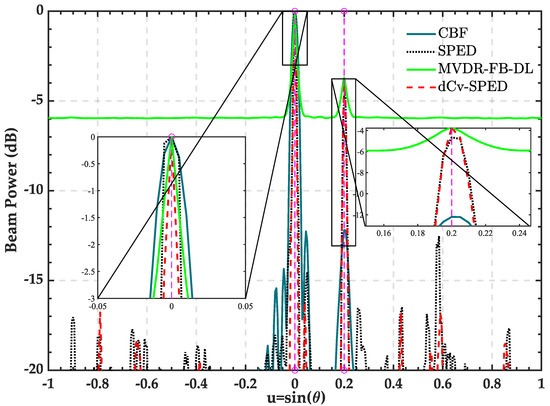
Figure 7.
Spatial-spectra estimated by the CBF, SPED, MVDR-FB-DL, and dCv-SPED under array perturbations.
In the final simulation, we evaluated the performance of the four algorithms in terms of RMSE and resolution probability when the array was perturbed. The signal and noise parameters were identical to those used in the second simulation, and the array perturbation parameters were identical to those used in the third simulation. Figure 8 presents the root mean square errors of the estimated direction in the u-space vs. noise power for the four algorithms under array perturbations. As shown in the figure, the effect of the array perturbation increased the RMSEs of the four algorithms. Below a 25 dB noise power, the dCv-SPED outperformed the other algorithms and reached the minimum RMSE for a noise power below 15 dB. Figure 9 provides the probability of resolution versus noise power under array perturbations. For noise power above 10 dB, the proposed algorithm reached the highest resolution probability, and its resolution probability reached 1 at a noise power of 20 dB, while SPED’s resolution probability reached 1 at a noise power of 10 dB. As Figure 10 shows, SPED’s performance was insufficient in that it may treat false peaks around strong targets as real targets; meanwhile, the poor performance of the CBF and MVDR-FB-DL was attributed to insufficient weak target detection performance under strong interference.
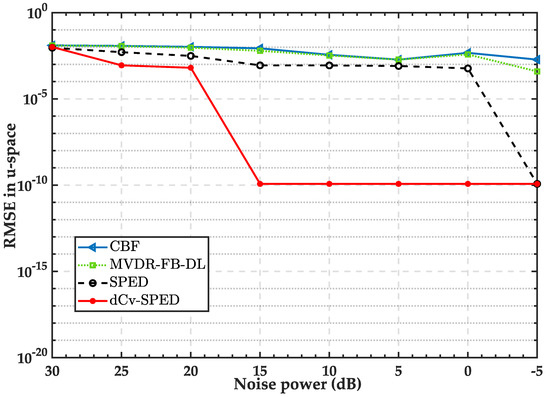
Figure 8.
Root mean square errors of the estimated direction in the u-space vs. noise power for the CBF, SPED, MVDR-FB-FL, and dCv-SPED under array perturbations.
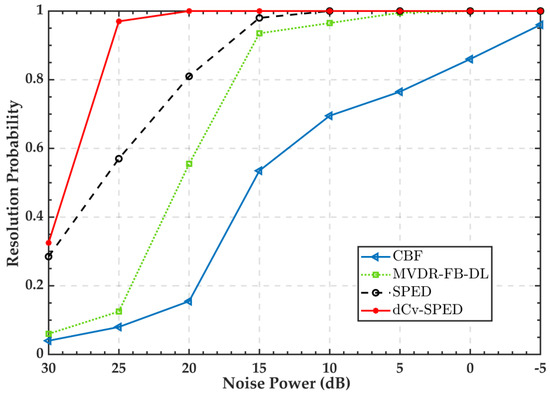
Figure 9.
Resolution probability vs. noise power for the CBF, SPED, MVDR-FB-FL, and dCv-SPED under array perturbations.
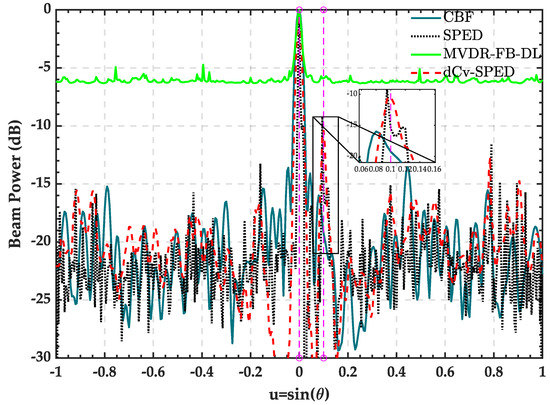
Figure 10.
Spatial-spectra estimated by the CBF, SPED, MVDR-FB-FL, and dCv-SPED under array perturbations when the noise was 10 dB.
3.2. Experiments
In this section, the dCv-SPED algorithm was evaluated with real data collected during a sea trial on 22 October 2017, in the east sea of China. The array had 32 elements uniformly spaced at 2 m (design frequency: 375 Hz). The acoustic source was located at 35 m below the sea’s surface, and the ship with the towed array was 2~3 km away from the acoustic source. The sampling frequency was 8 kHz. The time window length was 600 s, during which the acoustic source signal starting from at and several noise signals radiated by many ships were recorded. Twenty snapshots of the data were used for beamforming. The processing frequency band of the beamforming was 200–400 Hz. Figure 11 shows the bearing time records obtained by the CBF, SPED, MVDR-FB-FL, and dCv-SPED. It can be seen from the figure that the dCv-SPED improved the performance of the increased spatial resolution substantially; therefore, weak contact trajectories next to many strong targets could be detected. Compared to SPED, the dCv-SPED generated a clearer bearing time record with fewer false artifacts. In order to more clearly reflect the performance of the algorithms, we give the output of the beam power of the first second in Figure 12. The trajectories of the bearing time records indicate that there were three targets intersecting at the location marked by the ellipse in Figure 12. As can be seen from the figure, the SPED and dCv-SPED could effectively distinguish three close targets, while the other two algorithms could not. However, it can be seen from the labels in Figure 12c that SPED produced spurious peaks with respect to the sound source signal, while the proposed algorithm did not.
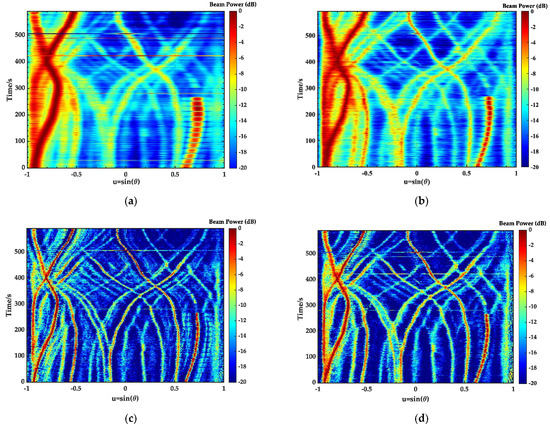
Figure 11.
Towed array sonar bearing the time record results from (a) CBF; (b) SPED; (c) MVDR-FB-FL; (d) dCv-SPED.
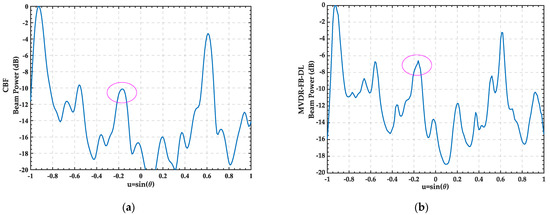
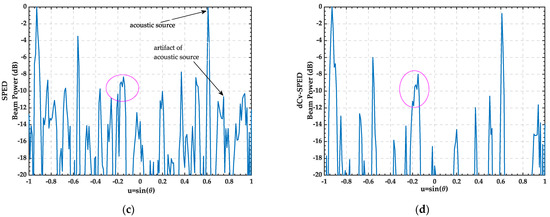
Figure 12.
Beam power outputs for the 1st second using (a) CBF; (b) SPED; (c) MVDR-FB-FL; (d) dCv-SPED. The red circle marks the area where the 3 targets intersecting.
4. Conclusions
In this paper, a robust algorithm, dCv-SPED, was proposed to obtain high-resolution and interference-free spatial spectra. Through the joint processing of deconvolution and frequency selection problems, the algorithm made full use of the prior information of the beam. The simulation results showed that the algorithm could accurately and stably estimate weak signals near strong interference. When the array was disturbed, the performance of the algorithm was slightly reduced, but it still had a higher resolution and anti-interference advantages than the traditional algorithm. Meanwhile, the proposed algorithm could effectively improve the dynamic range of the beam power for the weak target, which brought a better display effect for the bearing time record, which is beneficial to the discovery of the target of interest. Finally, experimental data were used to test the proposed algorithm. The results revealed strong performance characteristics that matched those obtained in the simulated data.
Author Contributions
Conceptualization, K.W. and A.Z.; methodology, K.W.; software, K.W. and J.H.; validation, C.Z., K.T. and A.Z.; formal analysis, A.Z.; investigation, K.W.; resources, J.H.; data curation, A.Z.; writing—original draft preparation, K.W.; writing—review and editing, C.Z.; visualization, K.T.; supervision, J.H.; project administration, A.Z.; funding acquisition, A.Z. All authors have read and agreed to the published version of the manuscript.
Funding
This research was funded by National Key Laboratory of Science and Technology on Underwater Acoustic Antagonizing, Science and Technology on Sonar Laboratory (Grant No. 614210902011906); the National Defense Foundation Strengthening Program Technology Field Fund Project (Grant No. 2020JCJQJJ126); the Fund Project of Key Laboratory of Underwater Measurement and Control Technology (Grant No. 6142407200106).
Acknowledgments
The authors would like to thank the reviewers for their valuable comments that improved this paper.
Conflicts of Interest
The authors declare no conflict of interest.
References
- Lemon, S.G. Towed-array history, 1917–2003. IEEE J. Ocean. Eng. 2004, 29, 365–373. [Google Scholar] [CrossRef]
- Massoud, A. Direction of Arrival Estimation in Passive Sonar Systems; Queen’s University: Kingston, ON, Canada, 2012. [Google Scholar]
- Van Trees, H.L. Optimum Array Processing: Part IV of Detection, Estimation, and Modulation Theory; John Wiley & Sons: New York, NY, USA, 2004. [Google Scholar]
- Douglass, A.S.; Song, H.; Dowling, D.R. Performance comparisons of frequency-difference and conventional beamforming. J. Acoust. Soc. Am. 2017, 142, 1663–1673. [Google Scholar] [CrossRef] [PubMed]
- Zheng, Z.; Yang, T.; Gerstoft, P.; Pan, X. Joint towed array shape and direction of arrivals estimation using sparse Bayesian learning during maneuvering. J. Acoust. Soc. Am. 2020, 147, 1738–1751. [Google Scholar] [CrossRef] [PubMed]
- Cox, H.; Zeskind, R.; Owen, M. Robust adaptive beamforming. IEEE Trans. Acoust. Speech Signal Process. 1987, 35, 1365–1376. [Google Scholar] [CrossRef] [Green Version]
- Li, J.; Stoica, P.; Wang, Z. Doubly constrained robust Capon beamformer. IEEE Trans. Signal Process. 2004, 52, 2407–2423. [Google Scholar] [CrossRef]
- Cox, H.; Pitre, R. Robust DMR and multi-rate adaptive beamforming. In Proceedings of the Conference Record of the Thirty-First Asilomar Conference on Signals, Systems and Computers (Cat. No. 97CB36136), Pacific Grove, CA, USA, 2–5 November 1997; Volume 1, pp. 920–924. [Google Scholar]
- Baggeroer, A.B.; Cox, H. Passive sonar limits upon nulling multiple moving ships with large aperture arrays. In Proceedings of the Conference Record of the Thirty-Third Asilomar Conference on Signals, Systems, and Computers (Cat. No. CH37020), Pacific Grove, CA, USA,, 24–27 October 1999; Volume 1, pp. 103–108. [Google Scholar]
- Owsley, N.L. Enhanced minimum variance beamforming. In Underwater Acoustic Data Processing; Springer: Dordrecht, The Netherland, 1989; pp. 285–291. [Google Scholar]
- Goldstein, J.S.; Reed, I.S. Reduced-rank adaptive filtering. IEEE Trans. Signal Process. 1997, 45, 492–496. [Google Scholar] [CrossRef]
- Ginolhac, G.; Forster, P.; Pascal, F.; Ovarlez, J.P. Exploiting persymmetry for low-rank space time adaptive processing. Signal Process. 2014, 97, 242–251. [Google Scholar] [CrossRef] [Green Version]
- Nitzberg, R. Application of maximum likelihood estimation of persymmetric covariance matrices to adaptive processing. IEEE Trans. Aerosp. Electron. Syst. 1980, AES-16, 124–127. [Google Scholar] [CrossRef]
- Zoltowski, M.D.; Silverstein, S.D.; Mathews, C.P. Beamspace root-MUSIC for minimum redundancy linear arrays. IEEE Trans. Signal Process. 1993, 41, 2502–2507. [Google Scholar] [CrossRef]
- Pezeshki, A.; Van Veen, B.D.; Scharf, L.L.; Cox, H.; Nordenvaad, M.L. Eigenvalue beamforming using a multirank MVDR beamformer and subspace selection. IEEE Trans. Signal Process. 2008, 56, 1954–1967. [Google Scholar] [CrossRef] [Green Version]
- Yang, T. Deconvolved conventional beamforming for a horizontal line array. IEEE J. Ocean. Eng. 2017, 43, 160–172. [Google Scholar] [CrossRef]
- Newhall, B.K.; Jenkins, J.; Dietz, J. Improved estimation of the shape of towed sonar arrays. In Proceedings of the 21st IEEE Instrumentation and Measurement Technology Conference (IEEE Cat. No. 04CH37510), Como, Italy, 18–20 May 2004; pp. 873–876. [Google Scholar]
- Odom, J.L.; Krolik, J. Heading and hydrophone data fusion for towed array shape estimation. In Proceedings of the Meetings on Acoustics ICA2013, Montreal, QC, Canada, 2–7 June 2013; p. 055081. [Google Scholar]
- Rogers, J.S.; Krolik, J.L. Time-varying spatial spectrum estimation with a maneuverable towed array. J. Acoust. Soc. Am. 2010, 128, 3543–3553. [Google Scholar] [CrossRef] [PubMed]
- Odom, J.L.; Krolik, J.L. Time-varying array shape estimation by mapping acoustic field directionality. In Proceedings of the 2012 Oceans, Hampton Roads, VA, USA, 14–19 October 2012; pp. 1–5. [Google Scholar]
- Li, C.; Jiang, J.; Duan, F.; Wang, X.; Ma, L.; Bu, L.; Sun, Z. Towed array shape estimation based on single or double near-field calibrating sources. Circuits Syst. Signal Process. 2019, 38, 153–172. [Google Scholar] [CrossRef]
- Zhu, C.; Fang, S.; Wu, Q.; An, L.; Luo, X.; Cao, H. A Time-Frequency Joint Time-Delay Difference Estimation Method for Signal Enhancement in the Distorted towed Hydrophone Array. Remote Sens. 2021, 13, 4586. [Google Scholar] [CrossRef]
- Captain, K.M.; Joshi, M.V. SNR wall for cooperative spectrum sensing using generalized energy detector. In Proceedings of the 2018 10th International Conference on Communication Systems & Networks (COMSNETS), Bengaluru, India, 3–7 January 2018; pp. 143–150. [Google Scholar]
- Hamid, U.; Qamar, R.A.; Waqas, K. Improvements in broadband processing of passive arrays for target detection in low SNR conditions. In Proceedings of the 2016 13th International Bhurban Conference on Applied Sciences and Technology (IBCAST), Islamabad, Pakistan, 12–16 January 2016; pp. 535–540. [Google Scholar]
- Bono, M.; Shapo, B.; McCarty, P.; Bethel, R. Subband Energy Detection in Passive Array Processing; Applied Research Labs, Texas University: Austin, TX, USA, 2000. [Google Scholar]
- Zetterberg, P. Peak-picking in spatial spectra. In Proceedings of the OCEANS 2021: San Diego–Porto, San Diego, CA, USA, 20–23 September 2021; pp. 1–7. [Google Scholar]
- Jomon, G.; Jojish, J.V.; Santhanakrishnan, T. MVDR Beamformer with Subband Peak Energy Detector for Detection and Tracking of Fast Moving Underwater Targets Using Towed Array Sonars. Acta Acust. United Acust. 2019, 105, 220–225. [Google Scholar] [CrossRef]
- Wang, Q.; Wang, L. An improved subband peak energy detection method. In Proceedings of the 2016 IEEE/OES China Ocean Acoustics (COA), Harbin, China, 9–11 January 2016; pp. 1–5. [Google Scholar]
- Lylloff, O.; Fernández-Grande, E.; Agerkvist, F.; Hald, J.; Tiana Roig, E.; Andersen, M.S. Improving the efficiency of deconvolution algorithms for sound source localization. J. Acoust. Soc. Am. 2015, 138, 172–180. [Google Scholar] [CrossRef] [PubMed] [Green Version]
Publisher’s Note: MDPI stays neutral with regard to jurisdictional claims in published maps and institutional affiliations. |
© 2022 by the authors. Licensee MDPI, Basel, Switzerland. This article is an open access article distributed under the terms and conditions of the Creative Commons Attribution (CC BY) license (https://creativecommons.org/licenses/by/4.0/).