Article

Coastal Erosion and Flooding Threaten Low-Lying Coastal Tracts at Lipari (Aeolian Islands, Italy)

1
Dipartimento Scienze Biologiche, Geologiche e Ambientali, Università di Bologna, P.za Porta S.Donato 1, 40126 Bologna, Italy
2
Istituto di Geologia Ambientale e Geoingegneria (IGAG), Consiglio Nazionale delle Ricerche, Struttura Congiunta DICEA, Via Eudossiana 18, 00184 Rome, Italy
3
Istituto Superiore per la Protezione e la Ricerca Ambientale (ISPRA), Via Brancati 48, 00144 Rome, Italy
4
Dipartimento Scienze della Terra, Università Sapienza di Roma, Piazzale Aldo Moro 5, 00185 Rome, Italy
5
Istituto Nazionale di Geofisica e Vulcanologia, Via di Vigna Murata 605, 00143 Rome, Italy
*
Author to whom correspondence should be addressed.
Remote Sens. 2022, 14(13), 2960; https://doi.org/10.3390/rs14132960
Submission received: 29 April 2022 / Revised: 9 June 2022 / Accepted: 19 June 2022 / Published: 21 June 2022

Abstract

:
Lipari is the largest and most populated island in the Aeolian Archipelago, a UNESCO site, and a highly frequented touristic destination. As in many other insular settings, the low-lying coastal stretches in the E and NE sectors of Lipari are locally exposed to coastal erosion and flooding, enhanced by subsidence effects leading to local sea level rise. Most of these coastal sectors appear critical, being narrow and increasingly threatened by the risk of permanent inundation and beach disappearance. In this study, this setting is placed in the wider context of the decadal evolution of the main beaches, analysed through a multidisciplinary approach, which includes remote sensing techniques (aero-photogrammetry, unmanned aerial vehicle survey, and satellite data), offshore geophysical surveys (high-resolution multibeam bathymetry), and field observations. The results show a variable interaction in space and time between natural and anthropogenic factors in the long- and mid-term evolution of the studied coastal areas. Considering that part of the local economy at Lipari depends on beach tourism, proper future management is required in the view of natural risk reduction and in the light of future climate changes and related impacts.

1. Introduction

The coasts of volcanic islands are extremely dynamic environments, where geomorphological processes commonly occur at high rates (often with alternating behaviour). In addition, these coasts are influenced by factors related to eruptive and volcano-tectonic activity, such as the local production of volcanigenic sediments, the occurrence of vertical land movements (VLMs), and the possible sudden rejuvenation of coastal tracts [1,2]. With the quiescence in volcanic activity, destructive processes may gradually take over and coastline retreat prevails [2]. In a manner similar to other non-volcanic contexts, active geomorphic processes at the coast reflect local geological factors (such as lithology and the rock resistance of outcropping units) and hydrodynamical aspects (local wave condition and storm occurrence and the degree of exposure of coastal tracts) and are dependent on the period of detection [3,4].
Lipari is the largest (total area of 38 km2) and the most populated island (about 12,400 inhabitants, with a population density of about 138 inhabitants per km2 [5]) in the volcanic Aeolian Archipelago (southern Tyrrhenian Sea, Italy; see Figure 1). Its subaerial volcanism developed >267 ka ago and lasted to the medieval ages [6,7]. Recent eruptive activity (8 to 1.2 ka ago) in the NE sector of the island produced the peculiar obsidian flows (the Rocche Rosse and Pomiciazzo lava flows in Figure 1) and the rhyolitic pumice successions, which have been exploited since prehistoric times [8]. The eastern coast of Lipari has been the seat of the widespread historical [9,10] and present settlements, which are also due to the touristic destination of the island. Since 2000, in fact, the Aeolian Archipelago has been a UNESCO site, and thanks to the peculiar volcanism of the area, the aesthetic quality of the landscape, and the pleasant climate, it attracts hundreds of thousands of visitors per year. The economy of Lipari is mainly based on tourism and fishing. Due to this, the buildings consist of a mix of those for residential and for commercial use [11]. Most of the ground floors of the residential buildings are dedicated to commercial activities, especially when connected with tourism on the harbours and beaches. Other types of buildings, such as churches, castles, monuments, and industrial sheds are also present on the island.
However, the waterfront of Lipari village and of other sites in the eastern and north-eastern coast of the island is increasingly exposed to flooding and coastal erosion, causing local damage to villages and infrastructure (Figure 2). To counteract the coastal retreat, defence structures have been locally adopted, but without definitive resolution [12]. Furthermore, coastal vulnerability in the area is enhanced by the occurrence of subsidence [13,14] and by the presence of active canyons offshore in the coastal belt. Their heads are very close to the coastline, at a depth of a few metres, and thus represent a major geohazard for the local communities due to possible retrogressive erosion and coastal failure occurrence [15,16]. This setting is increasingly threatened by the impacts of climate change, such as sea level rise and the occurrence of storm surge events, and there is the risk that these beaches may disappear in the future with the subsequent flooding of the coastal zone [17].
In this study, the evolution of the low-lying coastal stretches in the NE and E sectors of Lipari in recent decades was qualitatively analysed through a multidisciplinary approach, including remote sensing (historical aerial photographs and unmanned aerial vehicle, i.e., UAV-based aero-photogrammetry and satellite data) and offshore geophysical surveys (high-resolution multibeam bathymetry), integrated with field observations. The purpose of this research is: (i) to reconstruct the long- and mid-term evolution of the studied beaches; (ii) to identify the long-term patterns of coastal change, especially in those sectors where the interaction between the natural and anthropogenic processes is relevant to the coastal evolution; and (iii) to point out, among the most populated coastal sectors of Lipari, those areas which are more critical in the light of future climate changes and related impacts and to consider subsidence and local sea level trends.

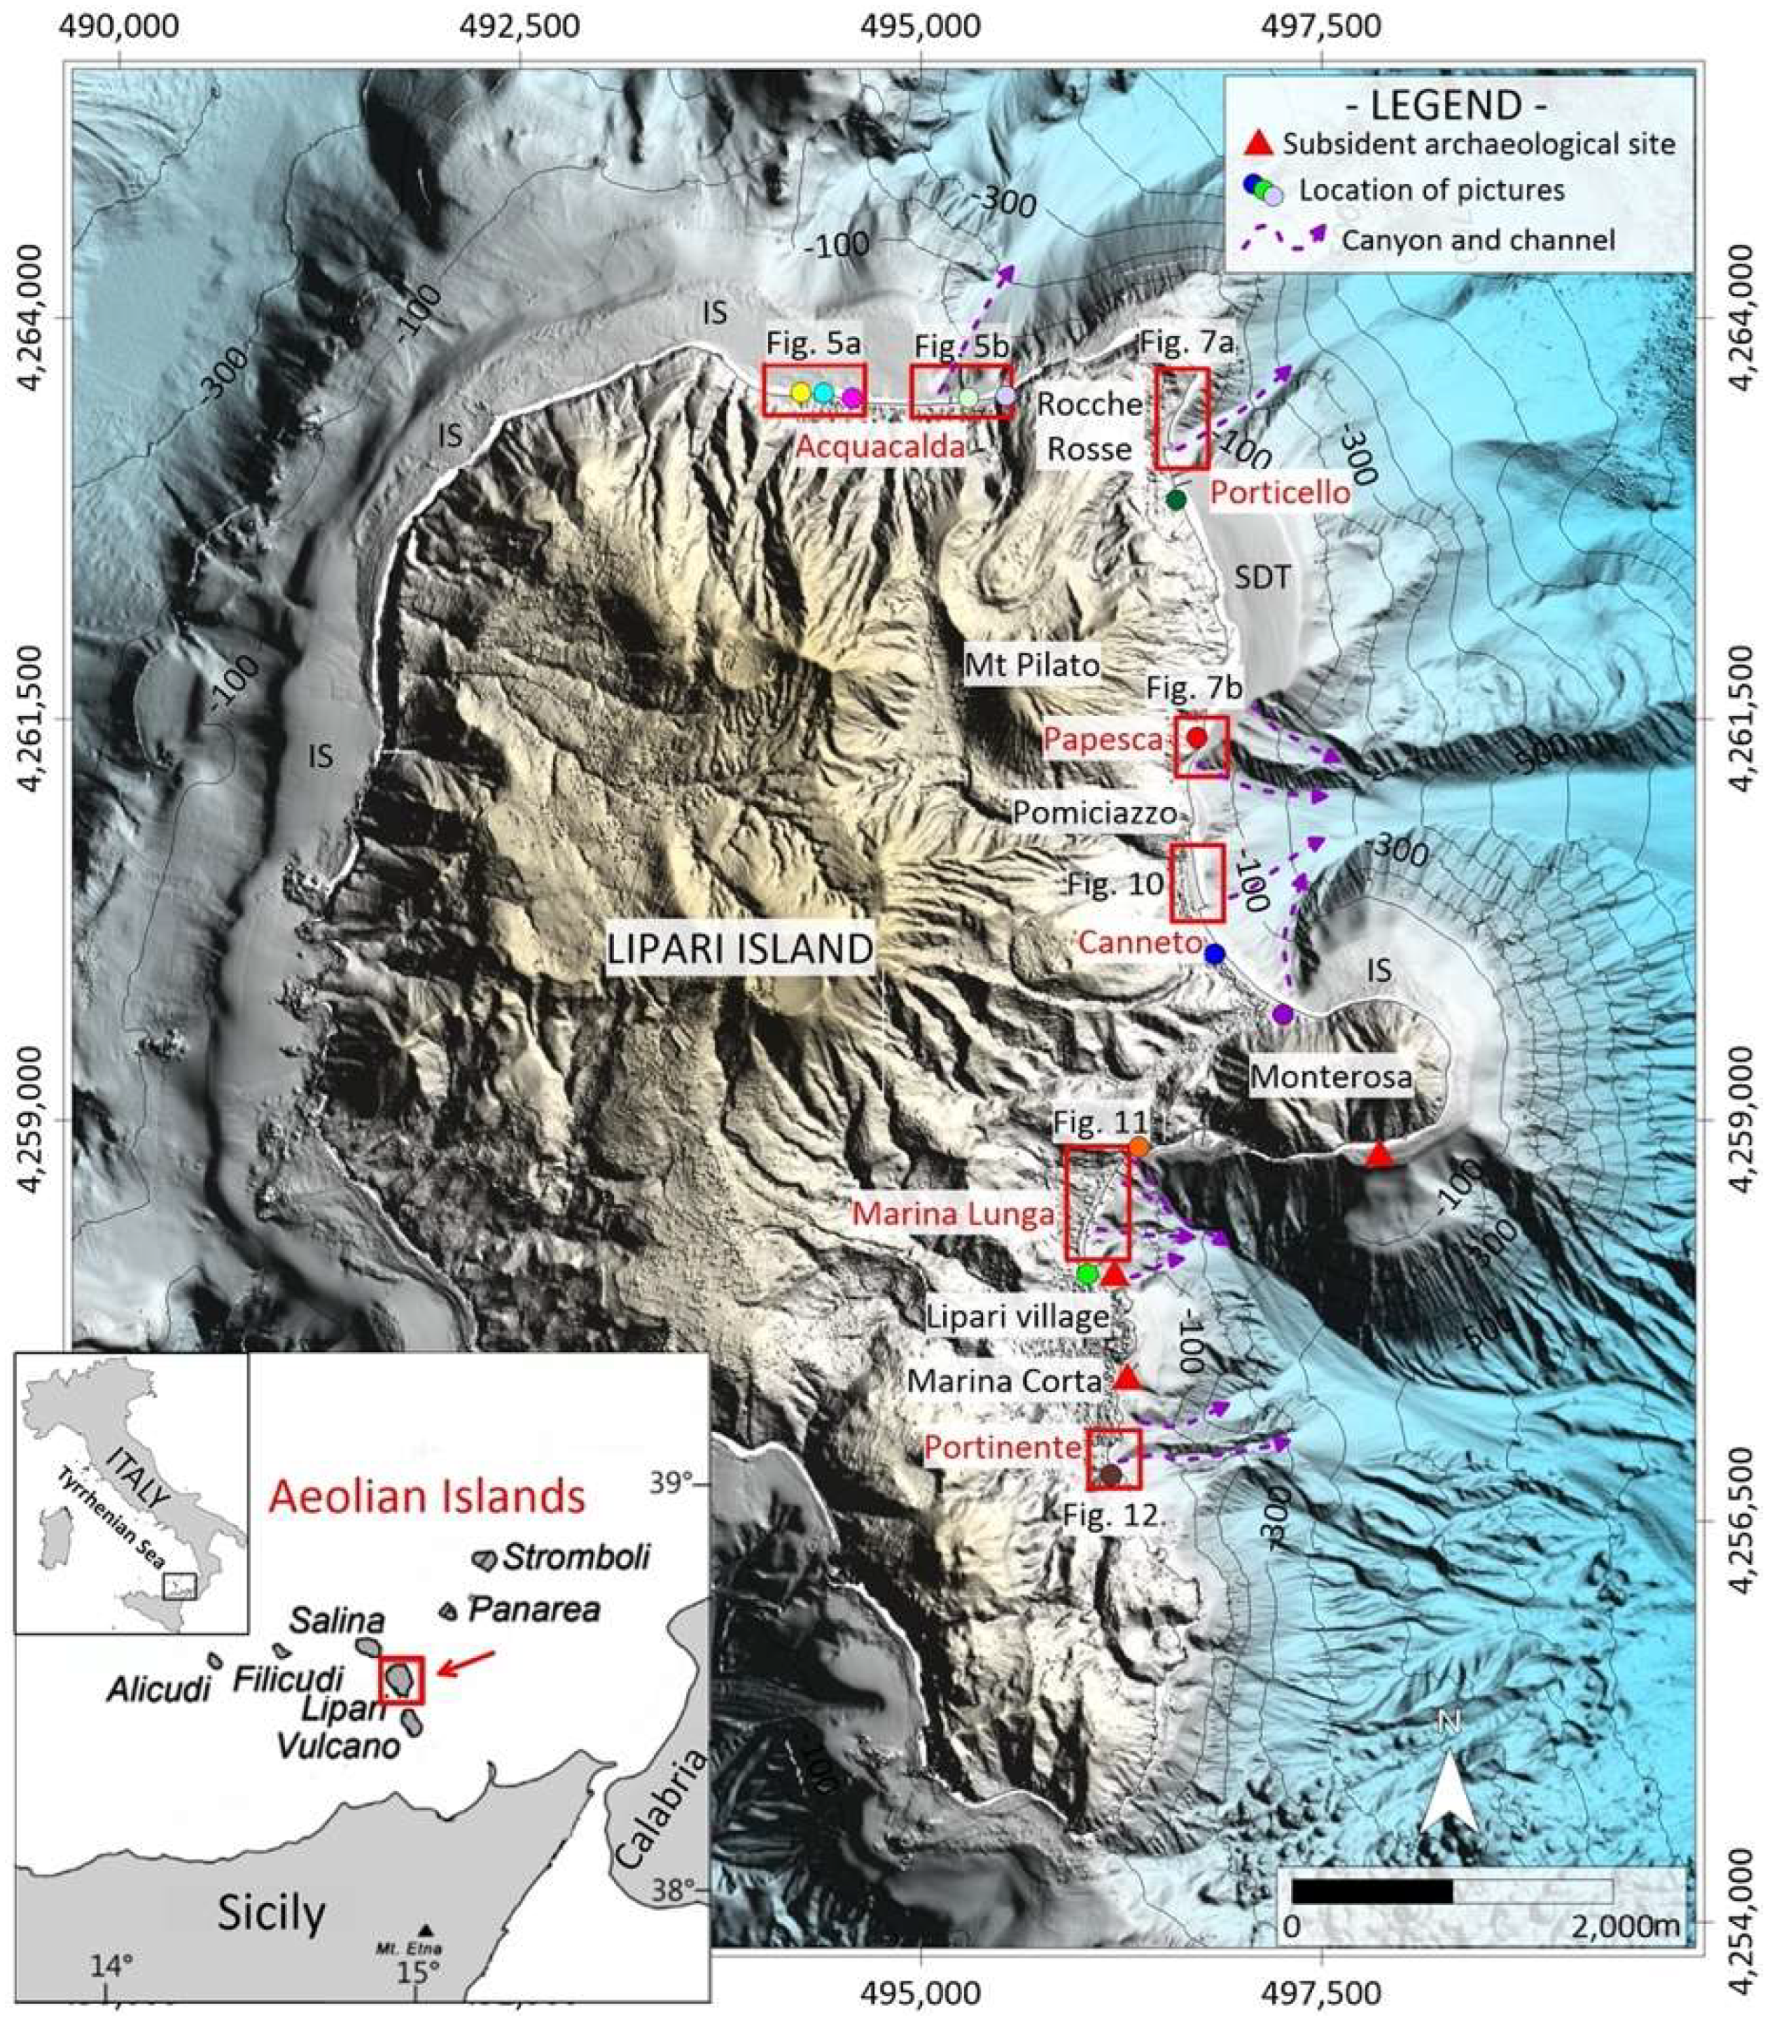
2. Geological and Oceanographic Setting

Lipari is a part of the Aeolian Archipelago, which is an arc-shaped volcanic structure made of seven islands; it is located in the southern Tyrrhenian Sea (Figure 1 inset) and is caused by subduction-related dynamics [18,19].
The island of Lipari is characterized by a rugged morphology up to 602 m in elevation and represents the emerged culmination of a mainly submarine volcanic complex, with its base at around a 1000/1300 m water depth (hereafter wd) [20]. Its volcanic history has been described on a stratigraphical and chronological basis by Forni et al. [7]. The older exposed volcanic centers are located along the western and north-western part of Lipari and, in the eastern side of the island, in the Monterosa promontory (Figure 1). These earlier volcanic units have subsequently been partly overlapped by younger pyroclastic deposits. The volcanism in the last 40–20 ka was located in the southern and north-eastern sectors of Lipari. During the last eruptive epoch (8.7 ka—AD 1220, see [7]), a composite dome-field was constructed in the north-eastern sector of Lipari through the widespread emission of the rhyolitic pumiceous successions of the Mt. Pilato cone (Figure 1) and viscous, obsidian-rich lava coulees (the last one, Rocche Rosse, dated at 1220 AD, reached the sea, where it is prolonged in the submarine sector, Figure 1).
The coastal and shallow water setting of Lipari reflects its eruptive history. A well-developed insular shelf (IS in Figure 1) is present along the western and north-western side of the island, while on the eastern and north-eastern side this feature is almost absent (apart from around Monterosa), in agreement with the occurrence of relatively young coasts in these sectors [21]. Pristine submarine lava flow morphologies are also visible down to c. 600 m wd in the NE submarine flank of Lipari (Figure 1), providing further evidence of the youth of this sector [20]. The different age and kind of eruptive products (lavas vs. pyroclastics) primarily control the coastal morphology and the beach development. The eastern coast of Lipari is divided by the E–W-oriented Monterosa promontory with cliffed coasts (Figure 1), while to the north and south of it, low-lying coasts are present and form narrow sandy/cobbly beaches (Porticello, Papesca, Canneto, Marina Lunga, and Portinente in Figure 1), alternating with rocky cliffs and headlands. The beach of Acquacalda is instead located on the northern coast of Lipari, west of Rocche Rosse (Figure 1). All these beaches were already present in historical maps and are also described by Luigi Salvatore d’Austria at the end of the 19th century [22], indicating that they are not of new formation. Their sediment supply can be attributed to the different drainage basins [23] that contribute to the feeding of these beaches with volcaniclastic sand and other material connected with the outcropping lithologies that, in the studied area, are pyroclastic rocks and lavas with rhyolitic, basaltic, and andesitic compositions. The surface runoff at Lipari is mostly related to an ephemeral stream network with seasonal activity [7], with dry conditions prevailing for much of the year. However, sudden flash-flood events occur locally in response to intensive rains, causing flows with a heavy sediment load which is able to reach the coast [24], as recently occurred at the Calandra creek in the northern part of Canneto [25,26]. This may result in a large accumulation at the coast and local, temporary shoreline advancements.

2.1. Subsidence and Relative Sea Level Change in the Coastal Sectors

Vertical land movements (hereafter, VLMs) play a decisive role in the local sea level change experienced at the coast (Relative Sea Level, hereafter RSL). On the geological time scale, the reconstruction of vertical land movements on Lipari Island is mostly based on geomorphological paleo-sea level markers such as raised marine terraces [27]. They indicate an average (uniform) uplift trend of 0.34 mm/yr for the last 124 ka, driven by purely tectonic processes affecting the sub-volcanic basement on a regional scale. In recent decades, the information on VLMs provided by geological evidence has been integrated with instrumental and archaeological–historical markers, supporting the occurrence of an inversion of the VLM trend causing the submergence of coastal sectors along the eastern coast of Lipari, at least in the last 2000 years. In detail, from the present depth of a submerged Roman pier, Anzidei et al. [14] estimated a subsidence rate of about 5.79 mm/yr for the last 2100 yrs in the Marina Lunga area (Figure 1 for location). Calanchi et al. [13] estimated an average subsidence rate of up to 10 mm/yr for the last century at the Marina Corta site (Figure 1), based on the gradual drowning of historical settlements, such as the small church of Anime del Purgatorio and the old Port offices [28]. Submerged historical settlements are also described on the southern coast of Monterosa ([29]; see Figure 1 for location). This evidence is supported by continuous Global Navigation Satellite System (GNSS) data collected in recent decades, which indicate a current subsidence trend with rates of up to 11 mm/yr in some sectors of Lipari Island [30,31]. Such high subsidence rates might be locally linked to seaward, deep-seated deformations in the coastal sectors where the retrogressive erosion of canyon heads has been documented [16].
With regard to the recent sea level variability at Lipari, the lack of any tide gauge (TG) prevents the continuous measurement of the local RSL on the island. All the closest TGs (i.e., Messina, Reggio Calabria; Ginostra, and Strombolicchio in very recent times) provide a discontinuous or too-short sea level time series [32] and are located in very different geological settings. Furthermore, as the TGs are attached to land they suffer from the contribution given by the local vertical land movements that appear different from one location to the other. The only possible data for reconstructing the sea level at the scale of the recent decades are thus provided by satellite altimetry (SA). Thus, we use this approach in our estimation of the recent sea level change at Lipari.

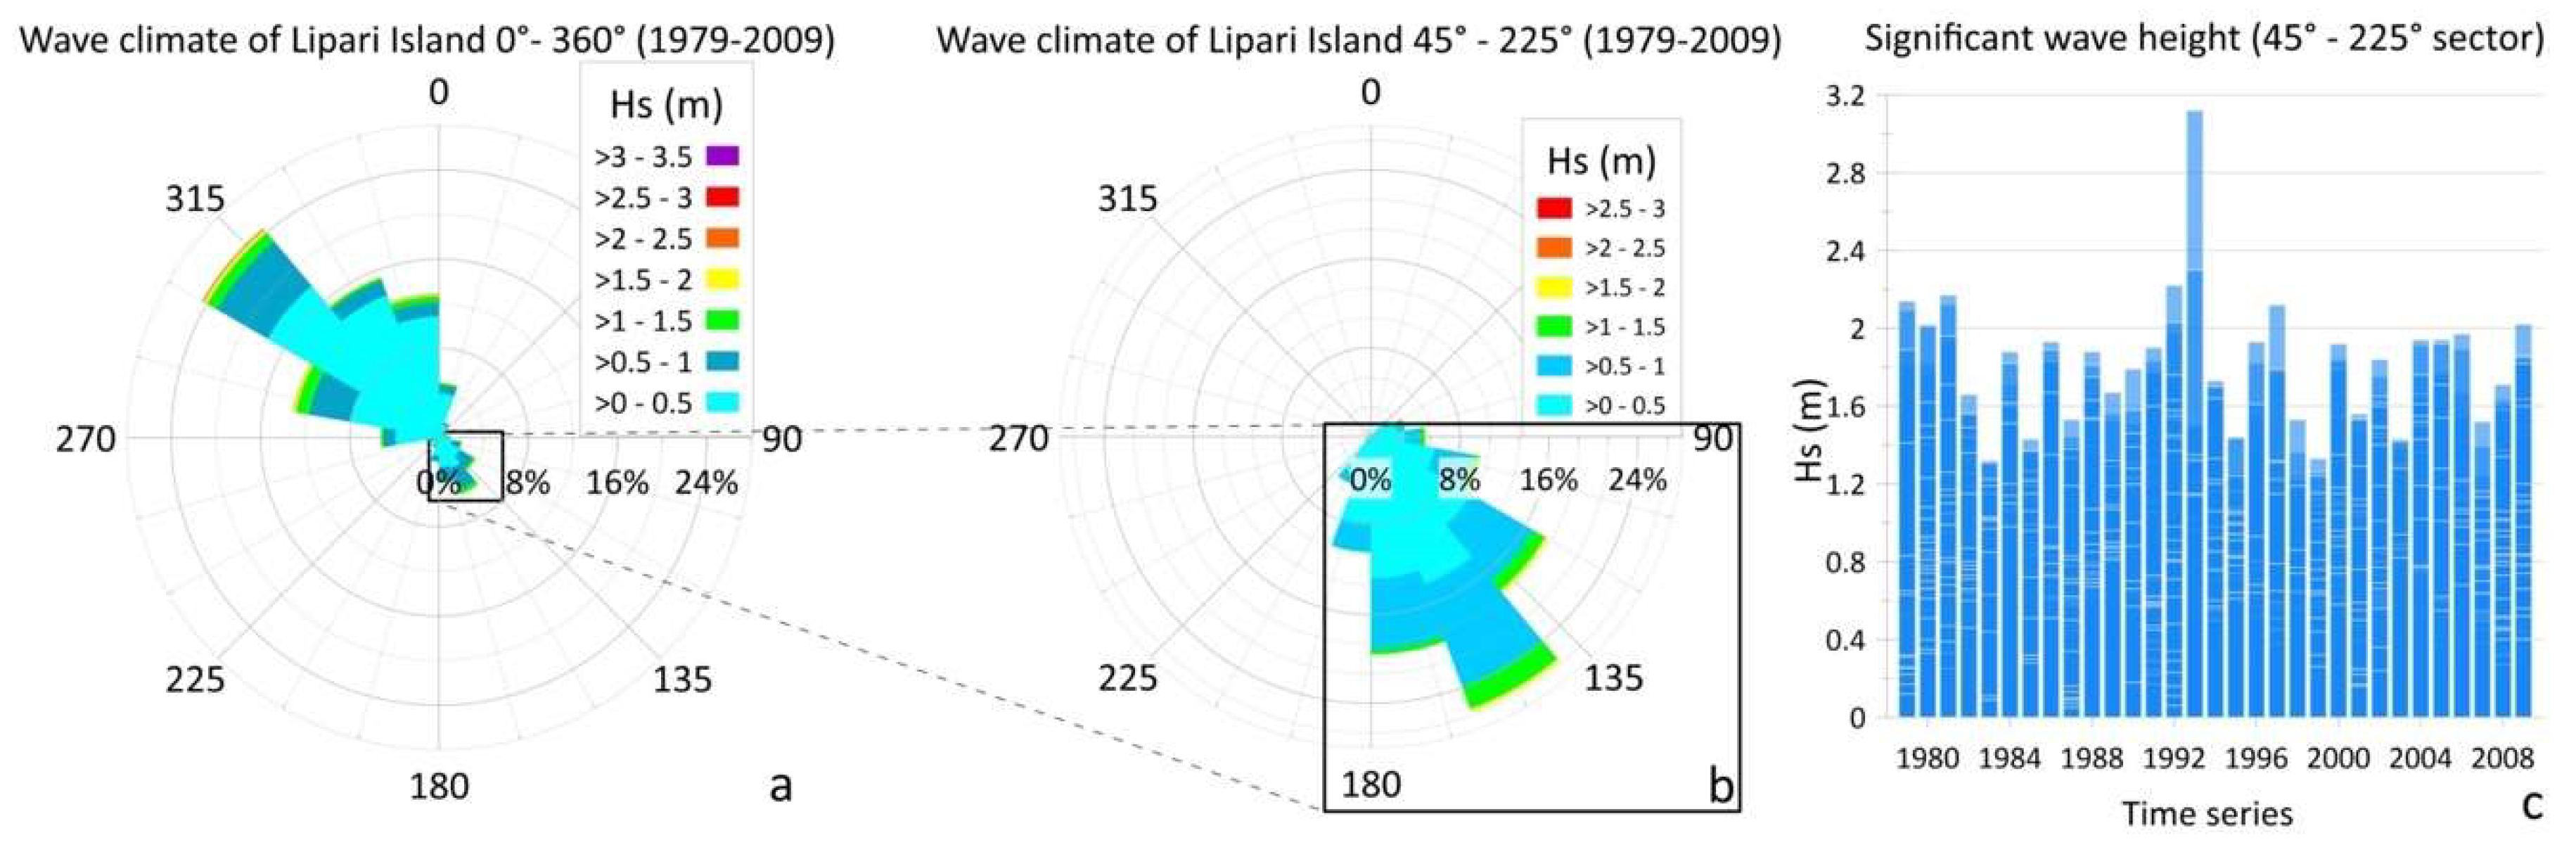
2.2. Wind and Wave Climate

The information regarding the wind conditions in the central Aeolian Islands in the last decades of the 20th century is reported by Cicala [33]. In the Aeolian Archipelago, winds coming from the NW and W are predominant; therefore, the most energetic wave approach is from the westerly directions. Storms from the Tyrrhenian Sea, in fact, struck the western coastlines of the islands with a fetch of c. 300 nautical miles. At Lipari, storms due to winds from the NW and W were recorded for 34% and 26% of the time, respectively, in the time frame of 1976–95; however, the related effects of wave erosion along the NW coastline are partly reduced by the shadow effect of the nearby Salina Island (Figure 1, inset). Storms from the SE (due to the Scirocco wind, about 11% of the time, [33]) and E (Levante and Grecale, 3% and 4% of the time, respectively) affect, in turn, the south-eastern and eastern coasts of Lipari, causing severe flooding and damages (Figure 2a,b) as most of the low-lying coasts are located on this side of the island and are exposed to this wave’s provenance. Storms from the N are less common (6% of the time according to [33]), but they can occasionally impact the northern Lipari coast with high energy (Figure 2c,d). Updated and more complete measurements on the wind and wave regime are not available, and this prevents any possible quantitative link between these processes and the observed coastal evolution.
Indications on the wave climate (wave directions and height) are provided by the model WAVEWATCH III [34] of NOAA (National Oceanic and Atmospheric Administration) on a 30-year time span, from 1979 through to 2009, for a point located to the east of Lipari (38.5 Lat. and 15.00 Long.). This model runs with the new NCEP Climate Forecast System Reanalysis Reforecast (CFSRR) 30-year homogeneous dataset of hourly ½° spatial resolution winds, to generate a wave climatology [35]. The data indicate a prevailing direction of the waves from the NW, with a maximum significant wave height of 3.5 m and a very minor frequency from the SE (Figure A1a). The storms from the latter provenance affect the eastern and southeastern sectors of Lipari Island, with maximum heights estimated at 2.5 m (exceptionally, 3 m) (Figure A1b,c). However, the occurrence of low-lying and subsident coastal areas here causes most human settlements to be particularly exposed to storm surges and flooding.

3. Materials and Methods

3.1. Coastline Evolution
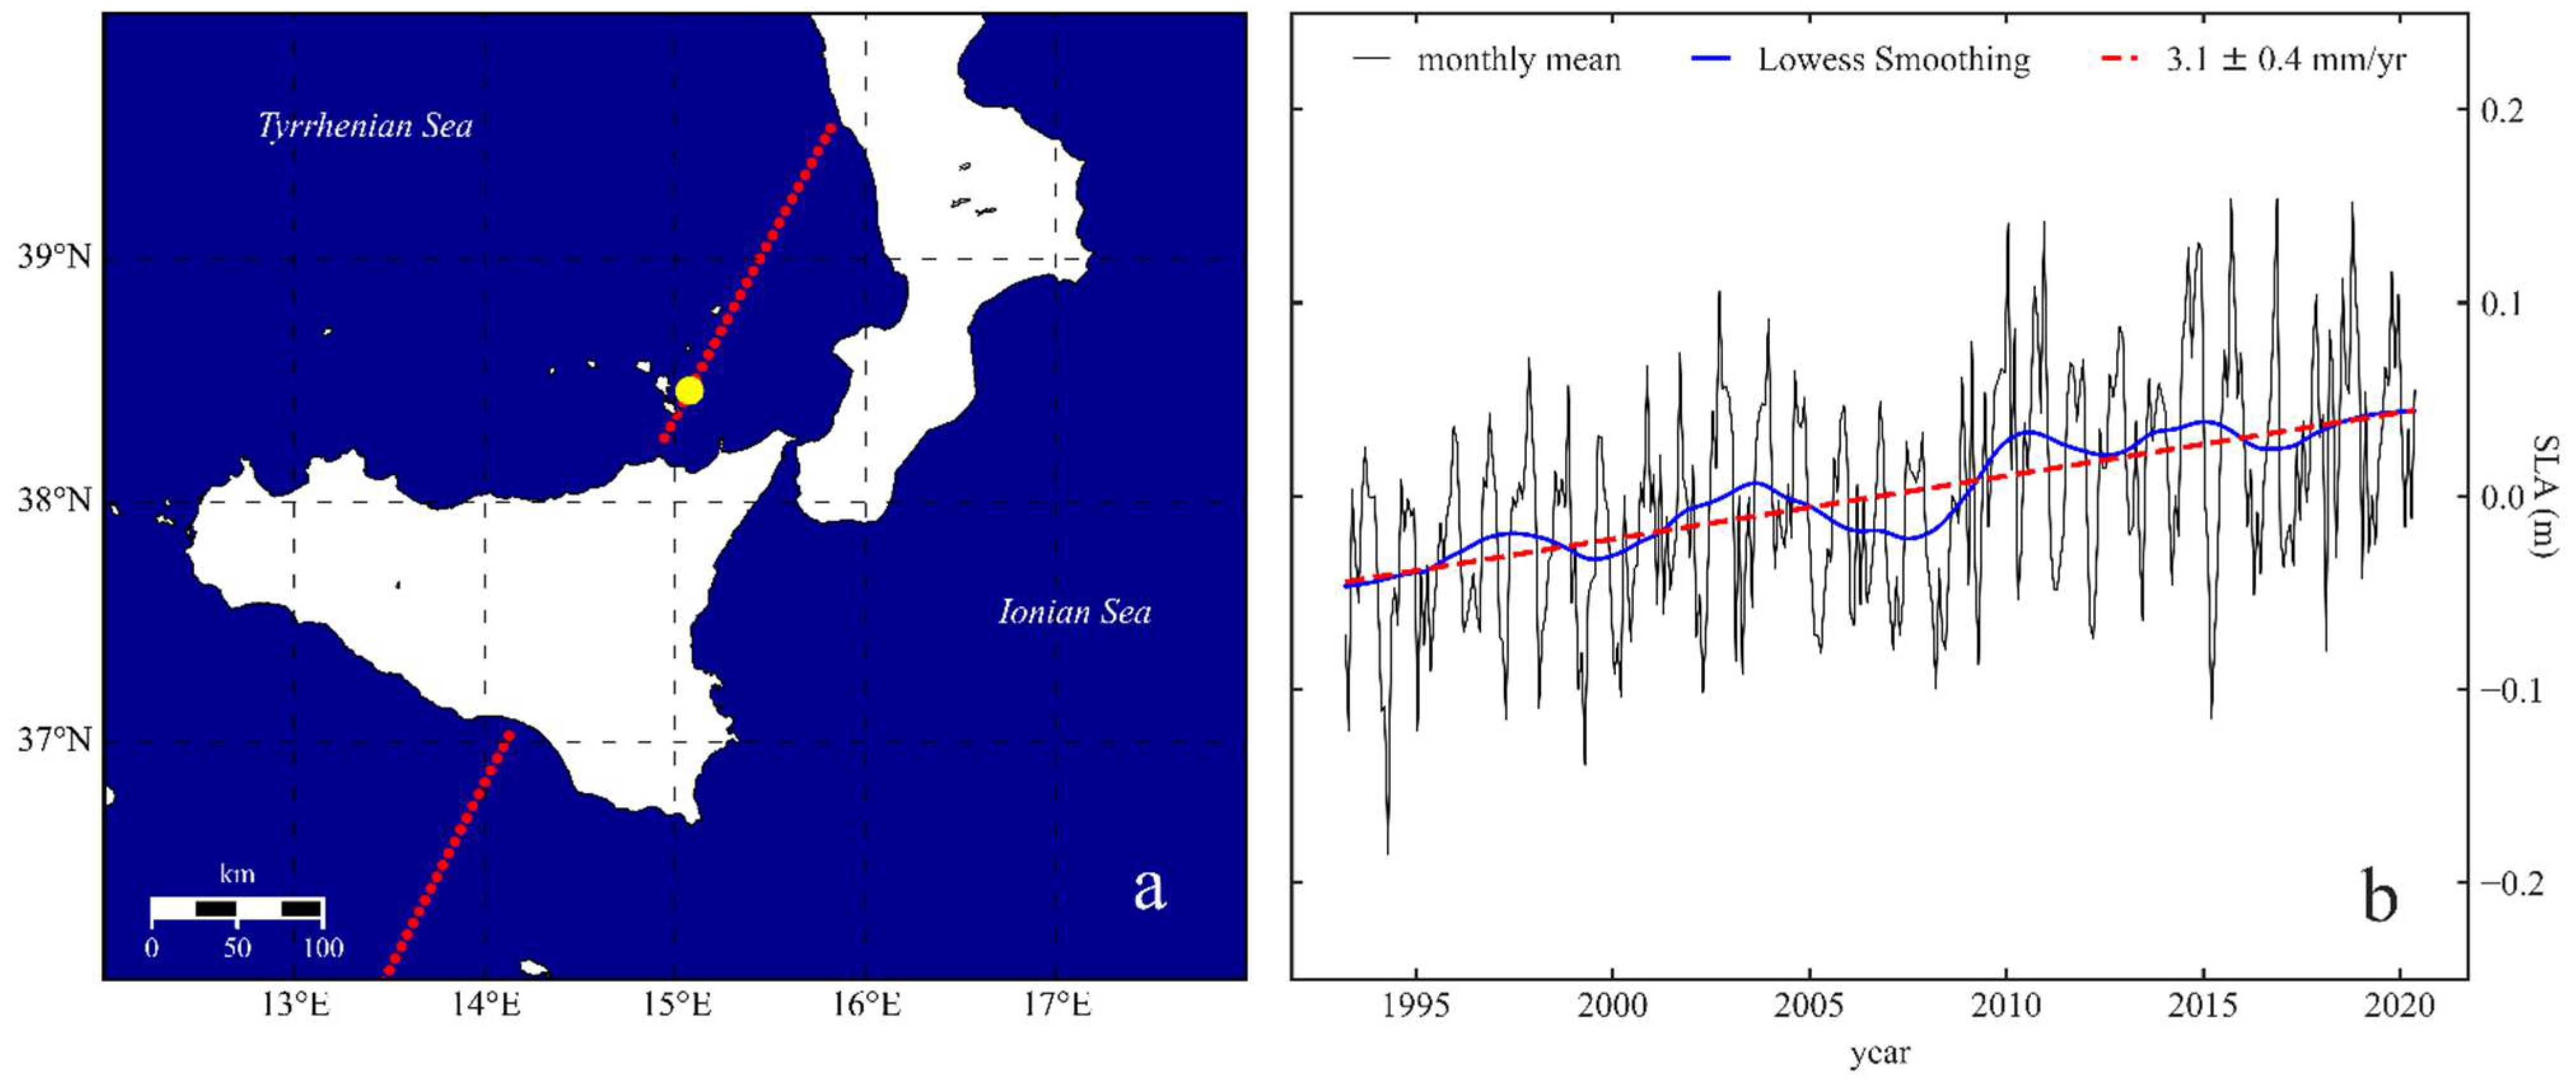
The multi-decadal coastline evolution of the NE and E low-lying sectors of Lipari has been analyzed based on historical aerial photographs from different sources (Table 1), dated from 1954 to 2013, with different scales and accuracy. These have been georeferenced in ArcGis 10.1, using as a reference the high-resolution orthophotos collected by UAV surveys in the frame of the Savemedcoasts and the INGV-DPC (Istituto Nazionale di Geofisica e Vulcanologia-Dipartimento di Protezione Civile) V3 projects. High-resolution orthomosaics were acquired in the Marina Lunga and Marina Corta coastal areas (2014) and in Acquacalda, Canneto, and Portinente (2017). During the UAV flights, several hundred aerial photos were collected from an elevation of about 70 m above the ground. The surveys included several tenths of the ground control points, measured by the GNSS-RTK technique to georeference the images and adjust the geometrical distortions. The processing was carried out by Agisoft Metashape® and PIX4D® software, leading to a resolution of about 2 cm/pixel for each one of the produced orthomosaics. The georeferencing of the aerial photographs, from which the shorelines were then digitized, was based on the identification of the ground control points (GCPs) in the locations that have not experienced topographic change in recent decades and the matching with the same points identified on the UAV-derived orthophoto. The number of used GCPs varied by image; those selected were primarily those close to the shoreline and/or corresponding to the edge of the fixed coastal structures. The errors associated with the georeferencing procedures (RMSE) were estimated as ranging from 0.3 to 2.7 m. While these values can be considered relatively high for some photographs when compared to the modern topographic data acquisition methods (e.g., LIDAR or GNSS), such uncertainties are considered acceptable given the long-term scale considered (i.e., multi-decadal) and the semi-quantitative/qualitative approach. We, in fact, do not focus on the possible short-term shoreline variability at the seasonal scale; we aim, rather, to identify long-term patterns of coastal change, necessarily averaged over decadal time intervals. To this purpose, the shorelines were digitized, and their displacements in the different time intervals were estimated with Digital Shoreline Analysis System (DSAS®, v.5.1), an open-source software realized by USGS (United States Geological Survey) that works in ESRI ArcMap as an add-in. The end point rate (EPR) was estimated along transects spaced at 10 m for the different time intervals, as the ratio of the distance between the two successive shorelines and the time elapsed between them [36]. The results are reported in Appendix A (Figure A2, Figure A3, Figure A4, Figure A5, Figure A6 and Figure A7). However, in the following maps we show only a limited number of shorelines, i.e., those resulting in more significant change for that specific coastal stretch in terms of horizontal displacements at the decadal scale.
To better understand the morphological setting of the beaches and generate the watersheds and river networks, we also used LIDAR data collected on 16 March 2008, provided by Ministero dell’Ambiente e della Tutela del Territorio e del Mare (MATTM). Specifically, to analyze the morphological features and reconstruct the high resolution DEMs, we used the strips raw data file (laz format) with an equidistance of the point cloud of about 0.4 m along the track and 0.7 m across the track. The point clouds were classified by means of the LIDAR module of the Global Mapper Pro 22.1 software, generating a digital surface model (DSM) at a 0.5 m resolution. Historical and present-day oblique photographs of the studied coastal areas were also collected where available, providing qualitative but useful indications on the coastal evolution at the decadal scale. Finally, direct observations in the field were carried out in November 2017 in most of the studied coastal areas, to check the present setting and geological–sedimentological characteristics of the beaches.
Observations on the shallow-water morphology of the studied coastal tracts are based on high-resolution multibeam bathymetric data, acquired in 2014 in the submarine portions of Lipari Island (between 0.5 and 150 m wd) by CNR-IGAG (Consiglio Nazionale delle Ricerche) and INGV in the frame of the INGV-DPC V3 project. These surveys were carried out in shallow-water areas with a six-meter-long boat, using a Teledyne Reson 7125 (400 kHz) multibeam system and GNSS-PPK positioning (see details of acquisition and processing in Bosman et al. [15]). A high-resolution digital elevation model (DEM) with a cell-size of 0.1 m in very shallow water (down to 40 m wd) to 0.5 m at greater depths (within 100 m wd) was produced and merged with the subaerial data (LIDAR), providing further information on the coastal setting and dynamics. Moreover, the backscatter intensity snippet data acquired with the same Teledyne Reson 7125 SV2 system were used for determining the seabed reflectivity through a bottom-detection application based on footprint time-series data. Backscatter intensity (BS) maps were created using the QPS FMGeocoder hydrographic software, after applying variable angle gain (AVG) and beam pattern correction to remove angular-dependent artifacts. Processing was carried out on selected areas of the canyon heads at Acquacalda, Porticello, and Portinente, generating backscatter mosaics with a resolution of 30 cm (Figure A8). These data provide information on the nature of the seafloor and on the active sedimentary processes, such as grain/debris flows.

3.2. Sea Level

Since the early 1990s, the sea surface height (SSH) has been measured from space using high-precision radar altimeters. This technique allows an estimate of local sea level changes in the reference system of the Earth’s center of mass and currently provides a time series which is over 28 years long. Satellite altimetry was originally optimized for the open ocean, and this led to some problems when the SSH was measured in coastal environments (up to about 20 km from the coast) as the data accuracy suffered from rapid degradation and distortion [37]. In order to overcome these issues, and following the huge interest that the coastal areas represent for populations and economies worldwide, a lot of effort has been made by the altimetry community throughout the last 15 years towards producing new products such as X-TRACK [38] and ALES [39] and achieving considerable progress in data processing [40,41], which has returned a strong improvement in a coastal altimetry data accuracy as close as possible to the coastline.
In this work, we used the X-TRACK regional product [42] as it is currently one of the most widely used and tested products for coastal applications, and it also provides a long time series (1993–2020) by combining data from the TOPEX/Poseidon (cycle 17), Jason-1, Jason-2, and Jason 3 (cycle 158) altimeter missions. This product was developed by the Center for Topographic studies of the Ocean and Hydrosphere (CTOH), reprocessed on a regional basis with the X-TRACK software [37,38,40] developed at LEGOS and provides a time series of 1 Hz (1 s), i.e., every ~7 km along the tracks of the satellite. According to the procedure of Birol et al. [38], the SSH values are adjusted with dedicated corrections, and a mean sea surface height (MSSH) is computed along the ground nominal track to obtain along-track sea level anomalies (SLAs).
We selected the three closest points to Lipari along the track 059 (enclosed within the yellow point in Figure 3a), located, respectively, ca. 4.5, 8.5, and 11 km away from the island’s eastern coast. The series were first stacked, and then, a monthly averaging was computed from the near 10-day sampling data in order to obtain an SLA time series (Figure 3b), representative of the local variability for the time span of March 1993–May 2020. To compute the linear trend over the considered period, the monthly series was first corrected for glacial isostatic adjustment (GIA) [43], and then the mean seasonal cycle was subtracted from the mean sea level; thus, the data autocorrelation in time was taken into account, following Zervas [44], in order to achieve a proper estimate of the trend and related error (3.1 ± 0.4 mm/yr; red dashed line in Figure 3b). Furthermore, in order to appreciate the non-linear variability in SLA, a low-pass filtered curve (Lowess smoothing) is plotted in Figure 3b (blue line).

4. Coastal Evolution in the Recent Decades
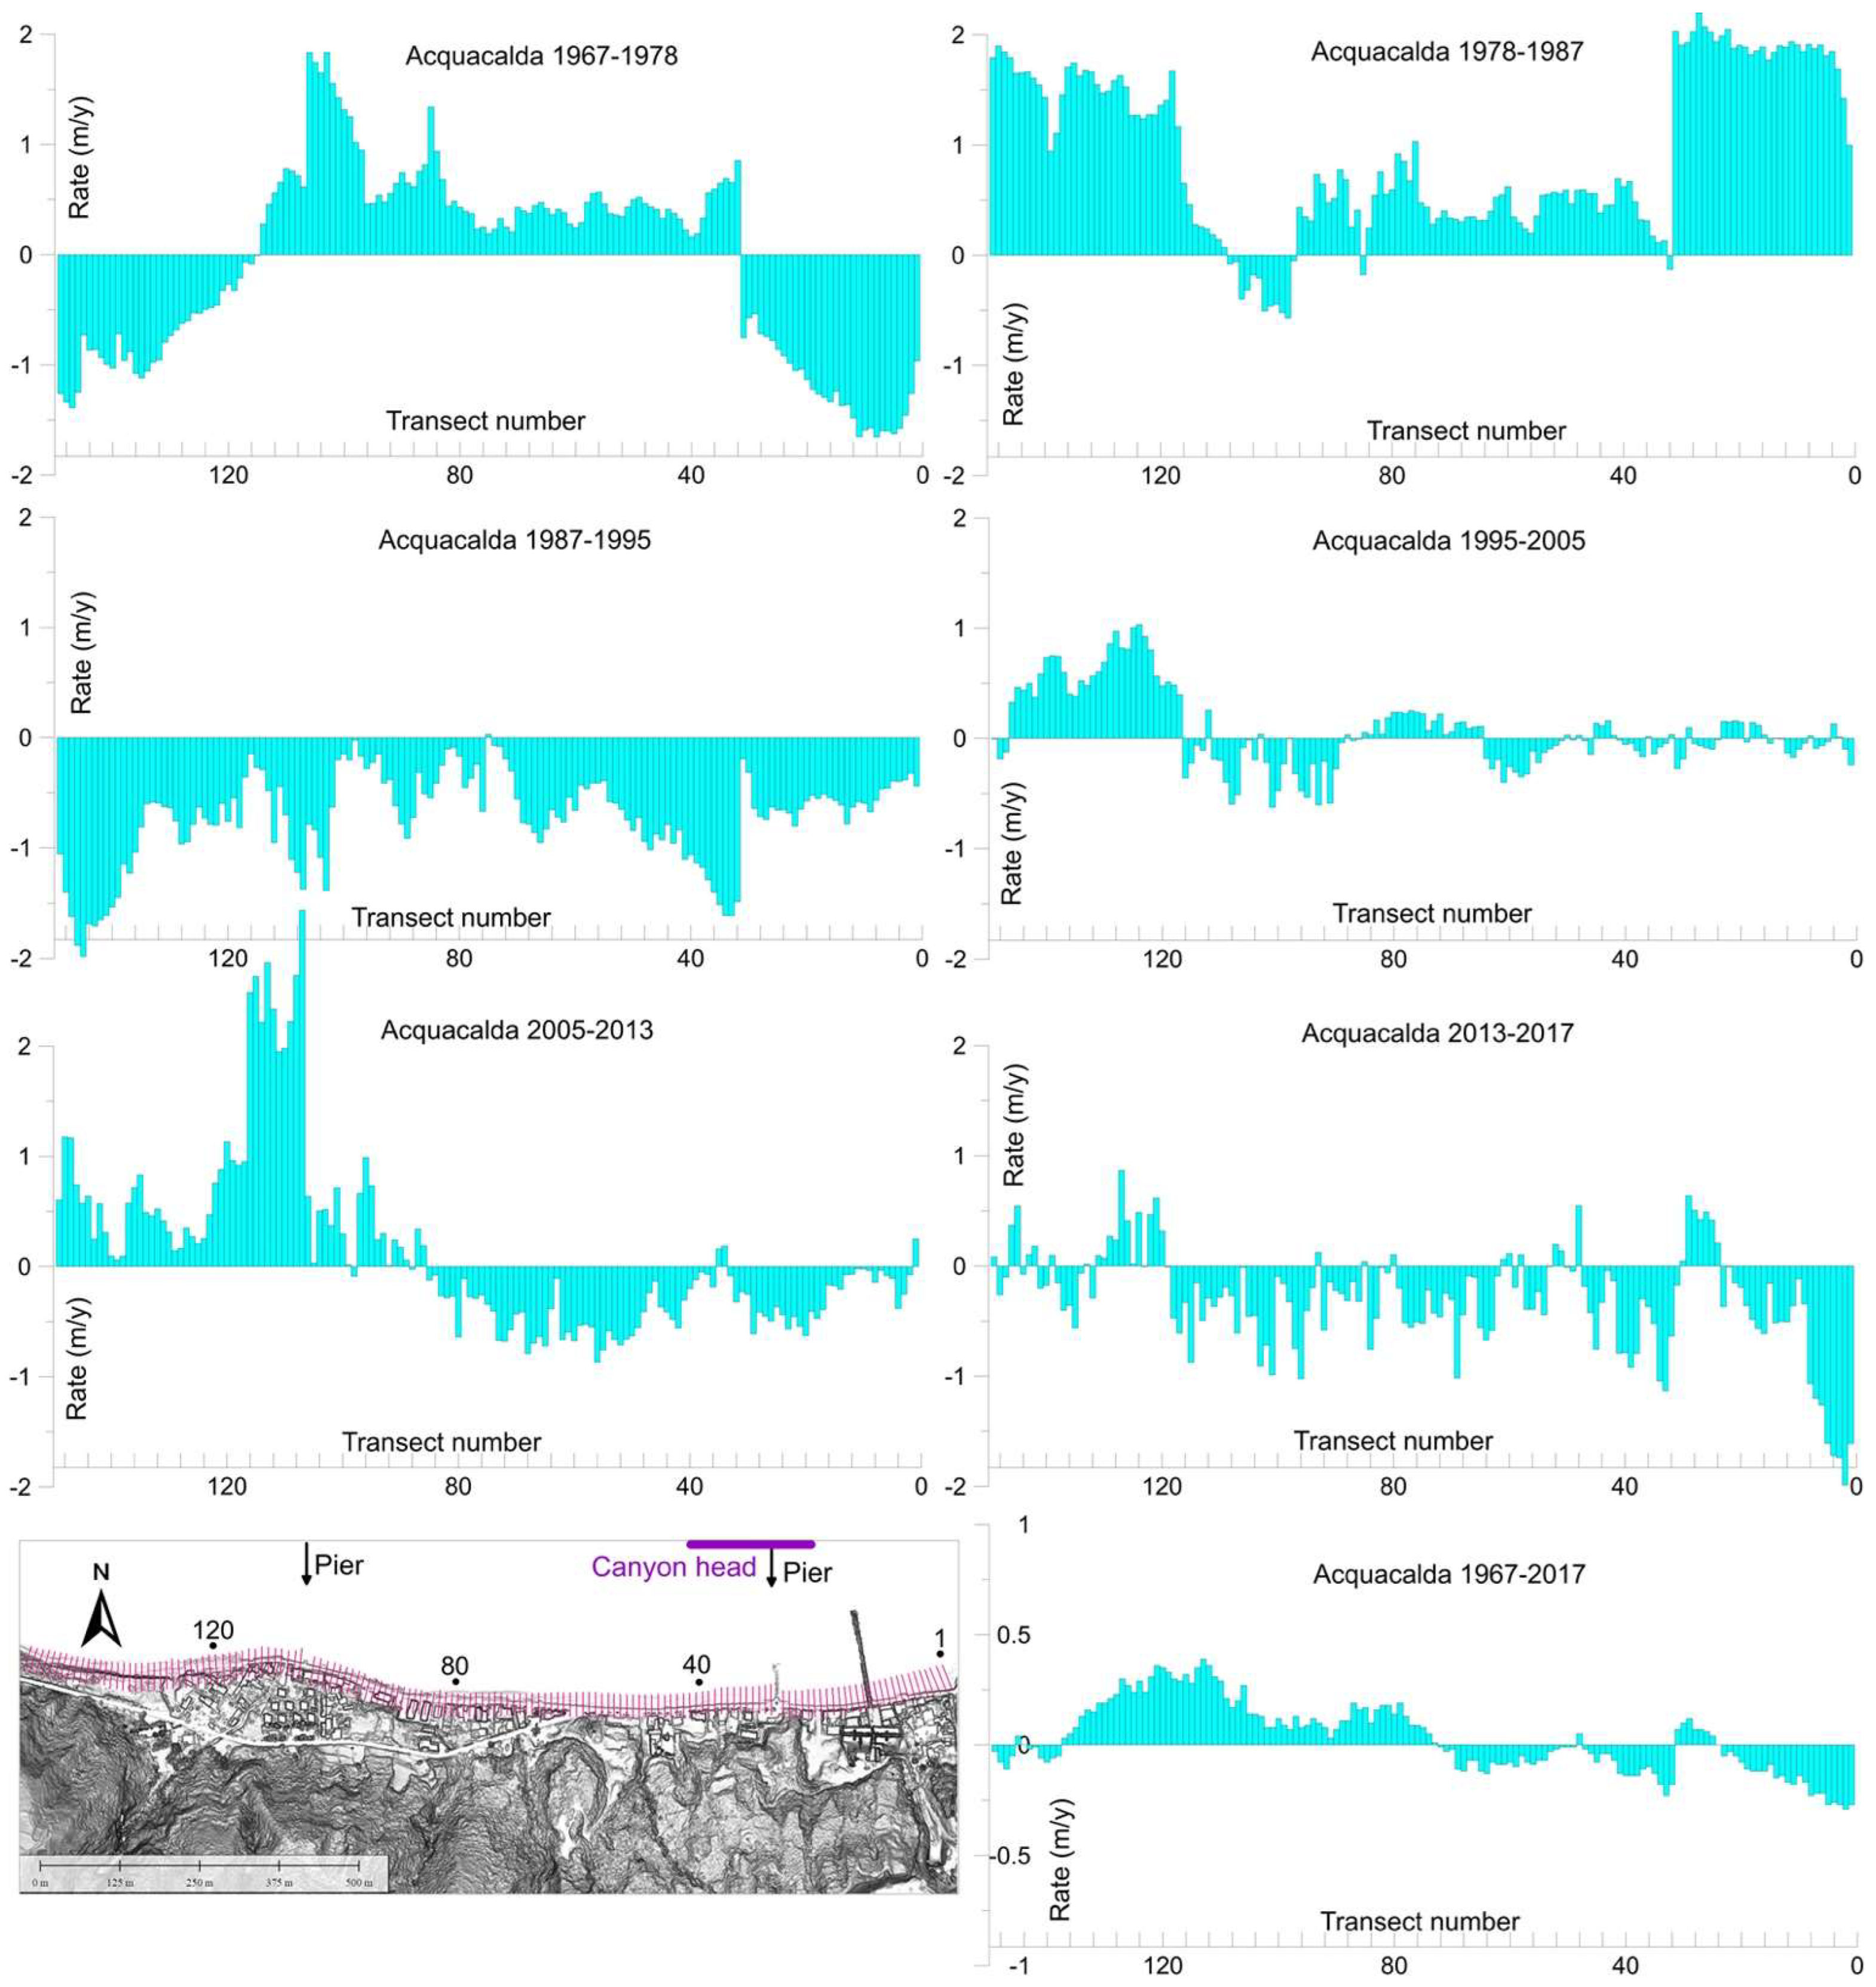
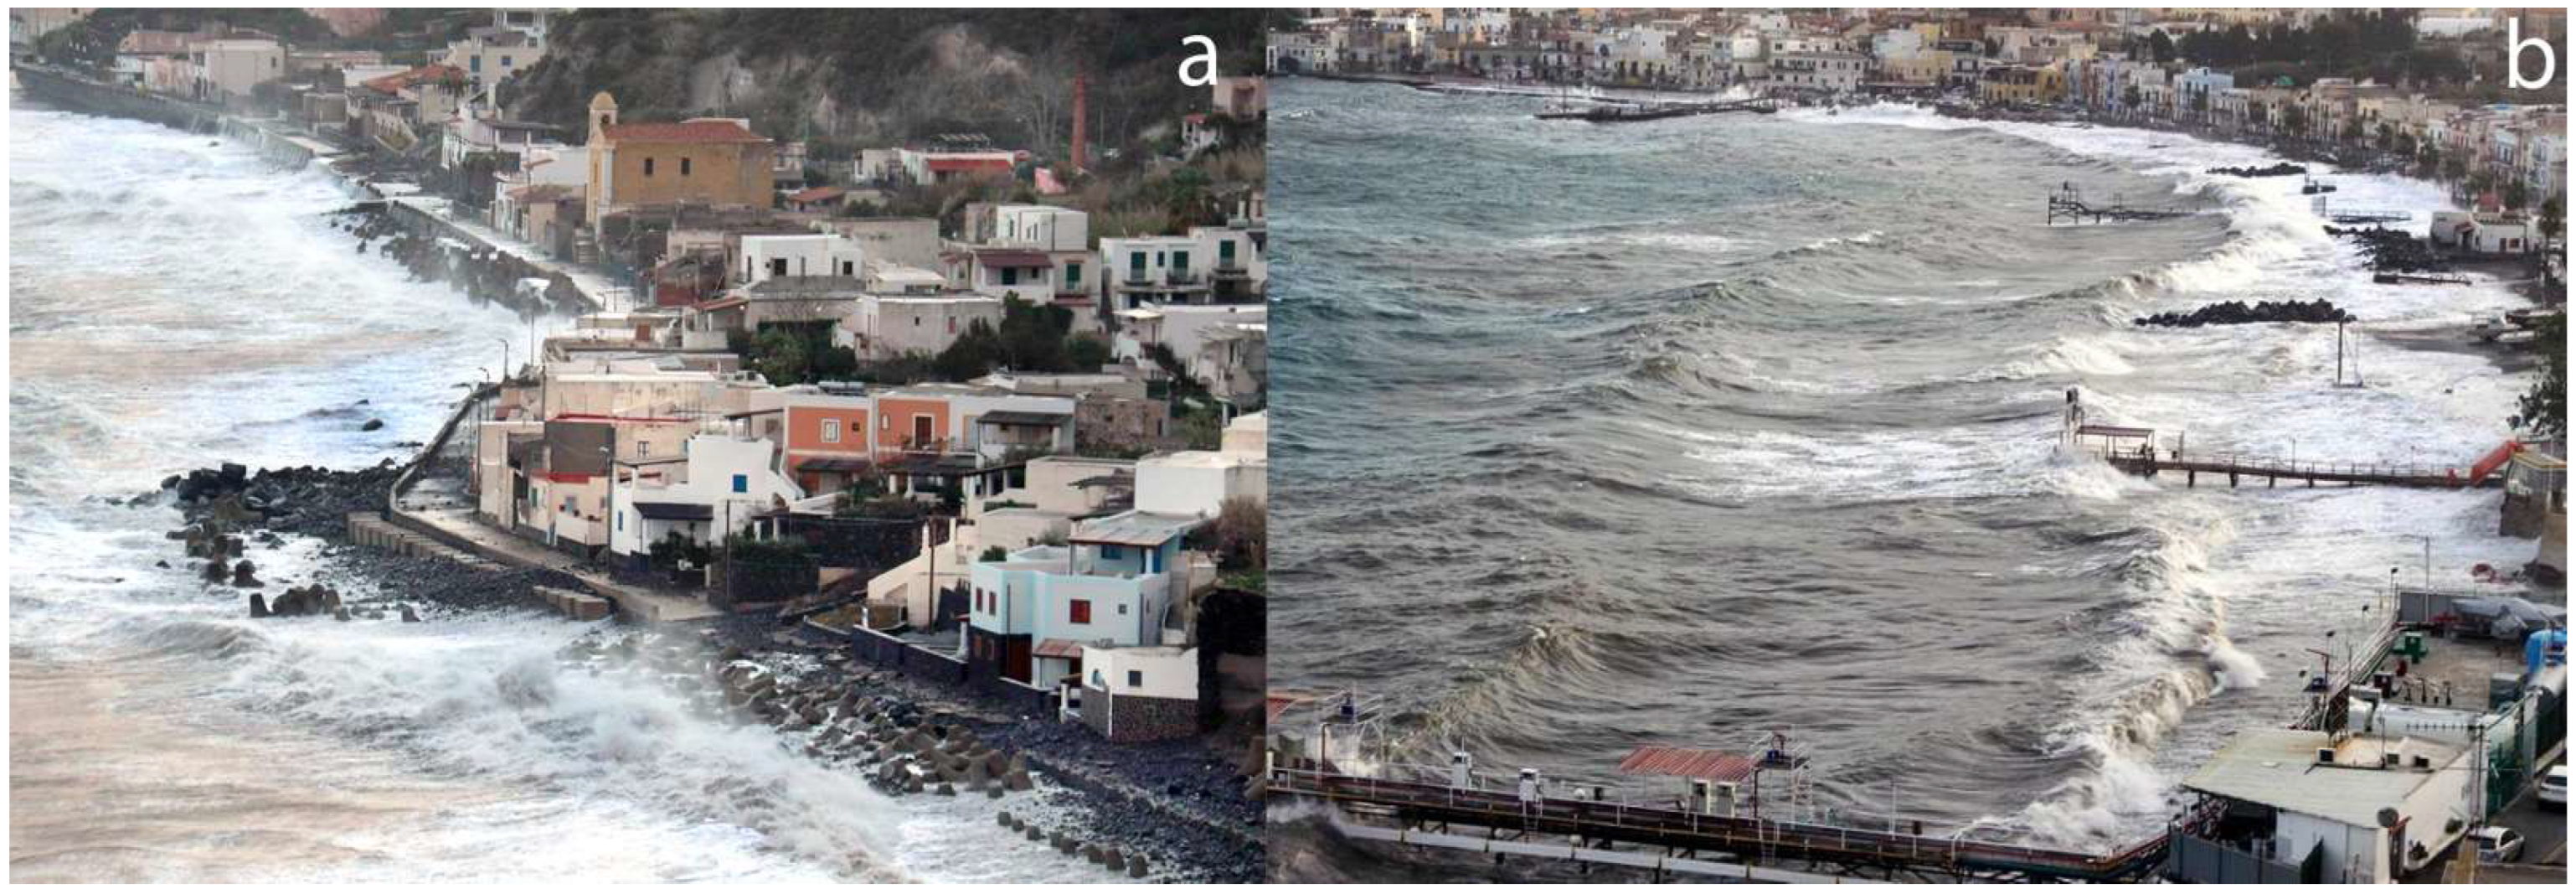
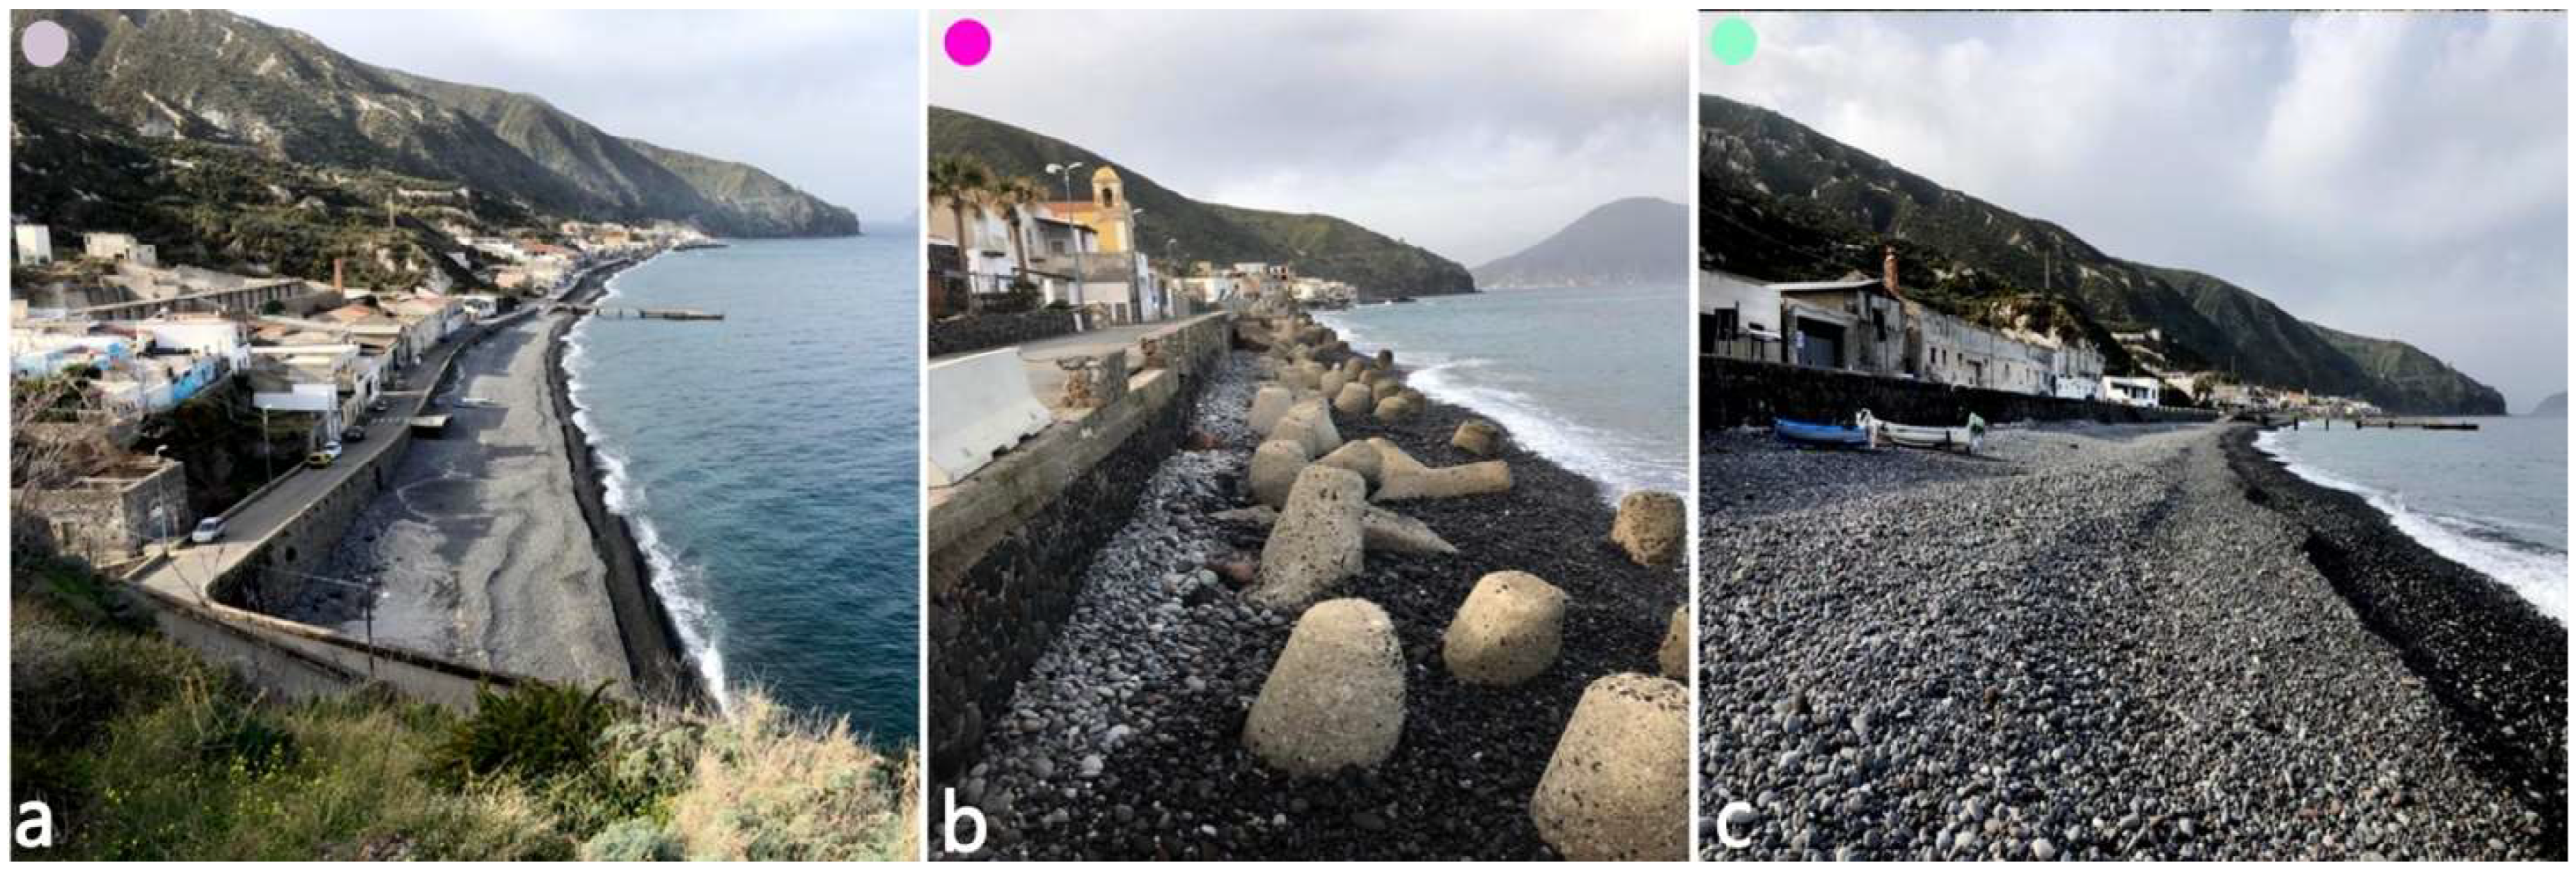
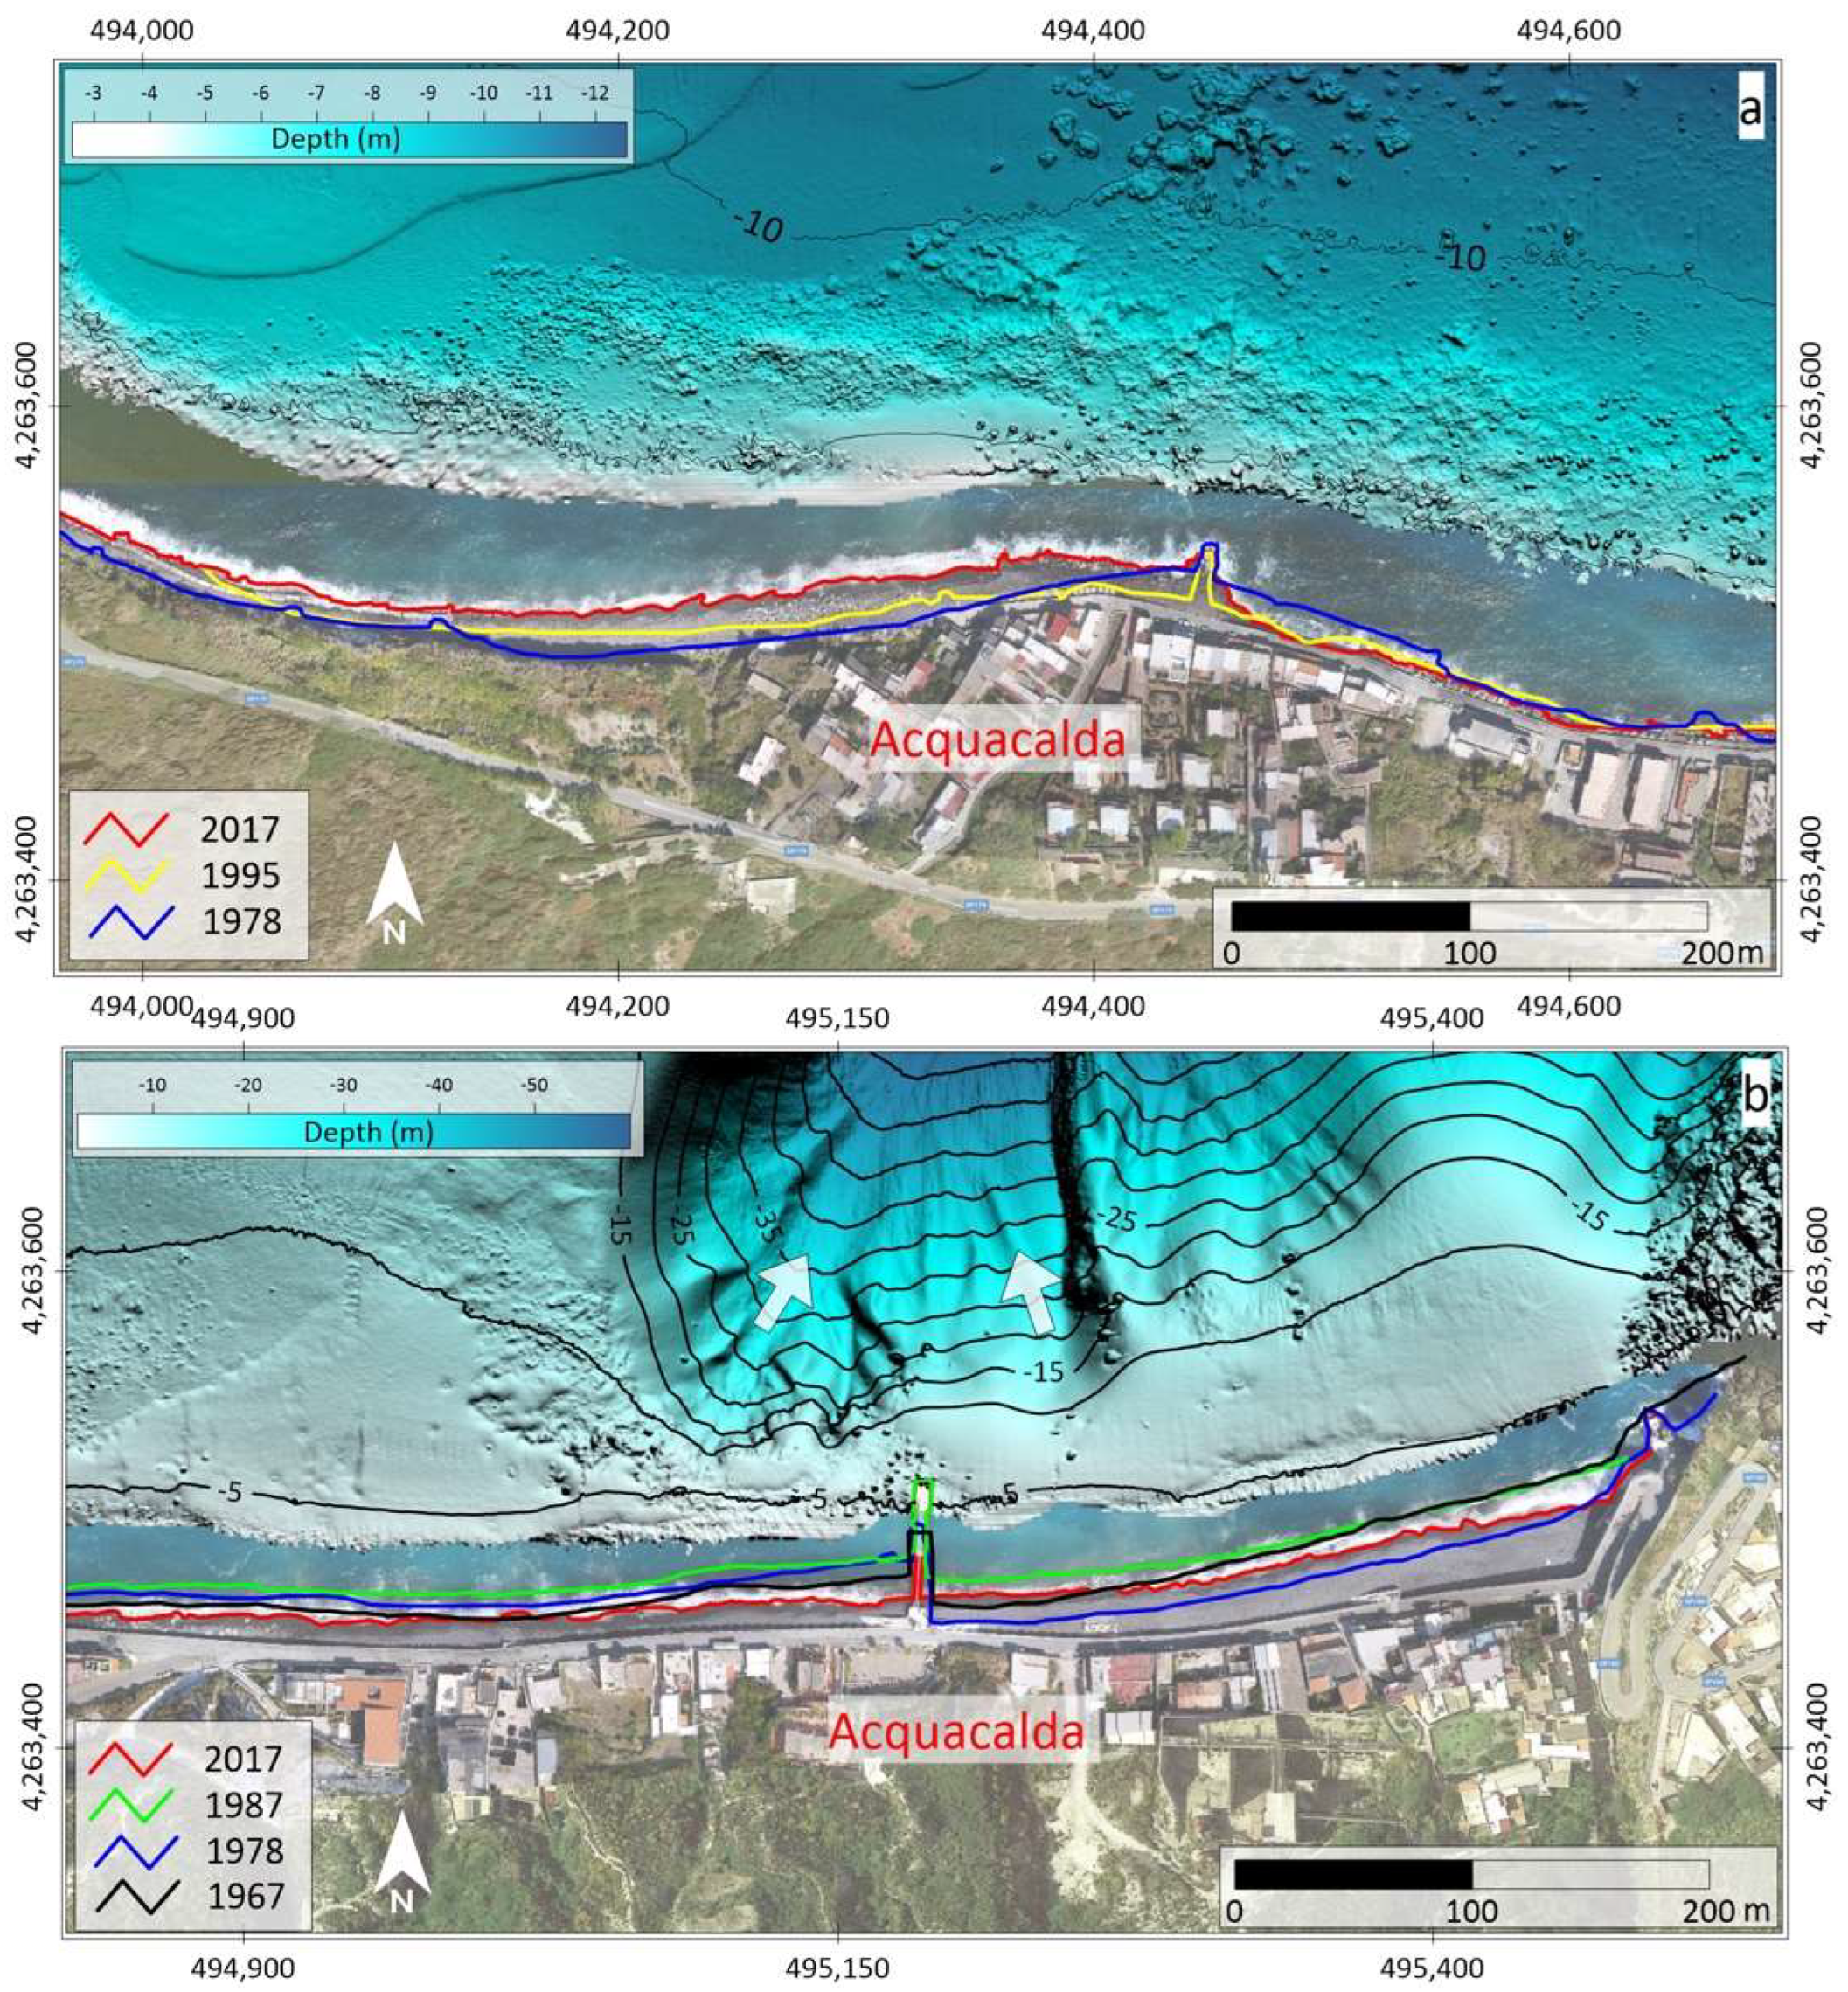
The multi-decadal evolution of the main beaches in the low-lying northern and eastern coastal tracts of Lipari has been qualitatively reconstructed through remote sensing and geophysical data, focusing on specific “key sectors”, for which the role of the interacting natural and anthropogenic effects can be better appreciated. Furthermore, the integration with the data on the nearshore, often neglected in coastal studies due to the difficulties in acquiring data in shallow water, provides additional, qualitative information on the offshore coastal dynamics.

4.1. Acquacalda

The Acquacalda beach is located on the northern coast of Lipari, west of the Rocche Rosse lava flow, in a wide bay extending for about 1500 m in an E–W direction (Figure 1 and Figure 4). The Acquacalda village develops along the coastal front (Figure 4 and Figure 5) and, due to the reduced extension of the beach, it is hurt by high-energy storms, such as that in December 2019, causing damage to the structures, (Figure 2c,d). The beach is mostly gravelly, with lava blocks and scoriae up to 15–20 cm in size, reflecting the lithology of the small drainage basins inland [23]. At the eastern edge of the beach (Figure 4c), abundant white pumice fragments are also observed. In this tract, in fact, a pumice quarry is located upslope with respect to the bay (Figure 6a), within a small hydrographic basin drained by a creek that feeds this coastal stretch.
The analyzed aerial photographs, since 1967, show a wide local variability of the shoreline position in space and time, with alternating advancement and retreat at rates commonly within 1–2 m/year (Figure A2). The main variations (from positive to negative rates and vice versa) are frequently observed in the correspondence of piers intercepting the longshore transport of sediment, which is here mostly directed from the west to the east, causing an offset in the coastline (Figure 5 and Figure A2). The overall shoreline variation in the time span of 1967–2017 (Figure A3) shows a slight net shoreline advancement in the western part of the bay, and a slight net shoreline retreat in the eastern part, both occurring at low average rates (below 0.4 m/year, Figure A2).
It is worth noting that, as is visible in the multibeam bathymetric map, the Acquacalda canyon is present in front of the western portion of the bay (Figure 1 and Figure 5b, white arrows) carving the nearshore into an articulated canyon head. This is incised to a minimum depth of less than 10 m, just 65 m away from the coast, and is prolonged in the offshore area to a depth over 300 m (Figure 1). The backscatter intensity map (Figure A8) suggests the occurrence of active channelized flows in the canyon head, transporting sediment from the nearshore to a higher depth. The convex shape of the bathymetric contours in front of the eastern edge of the beach suggests, instead, some marine deposition in correspondence with the wider beach located here (Figure 5b), which, however, shows a shoreline retreat in recent years (2017, with respect to 2013, see Figure A2) and, more generally, in the whole time span of 1967–2017.

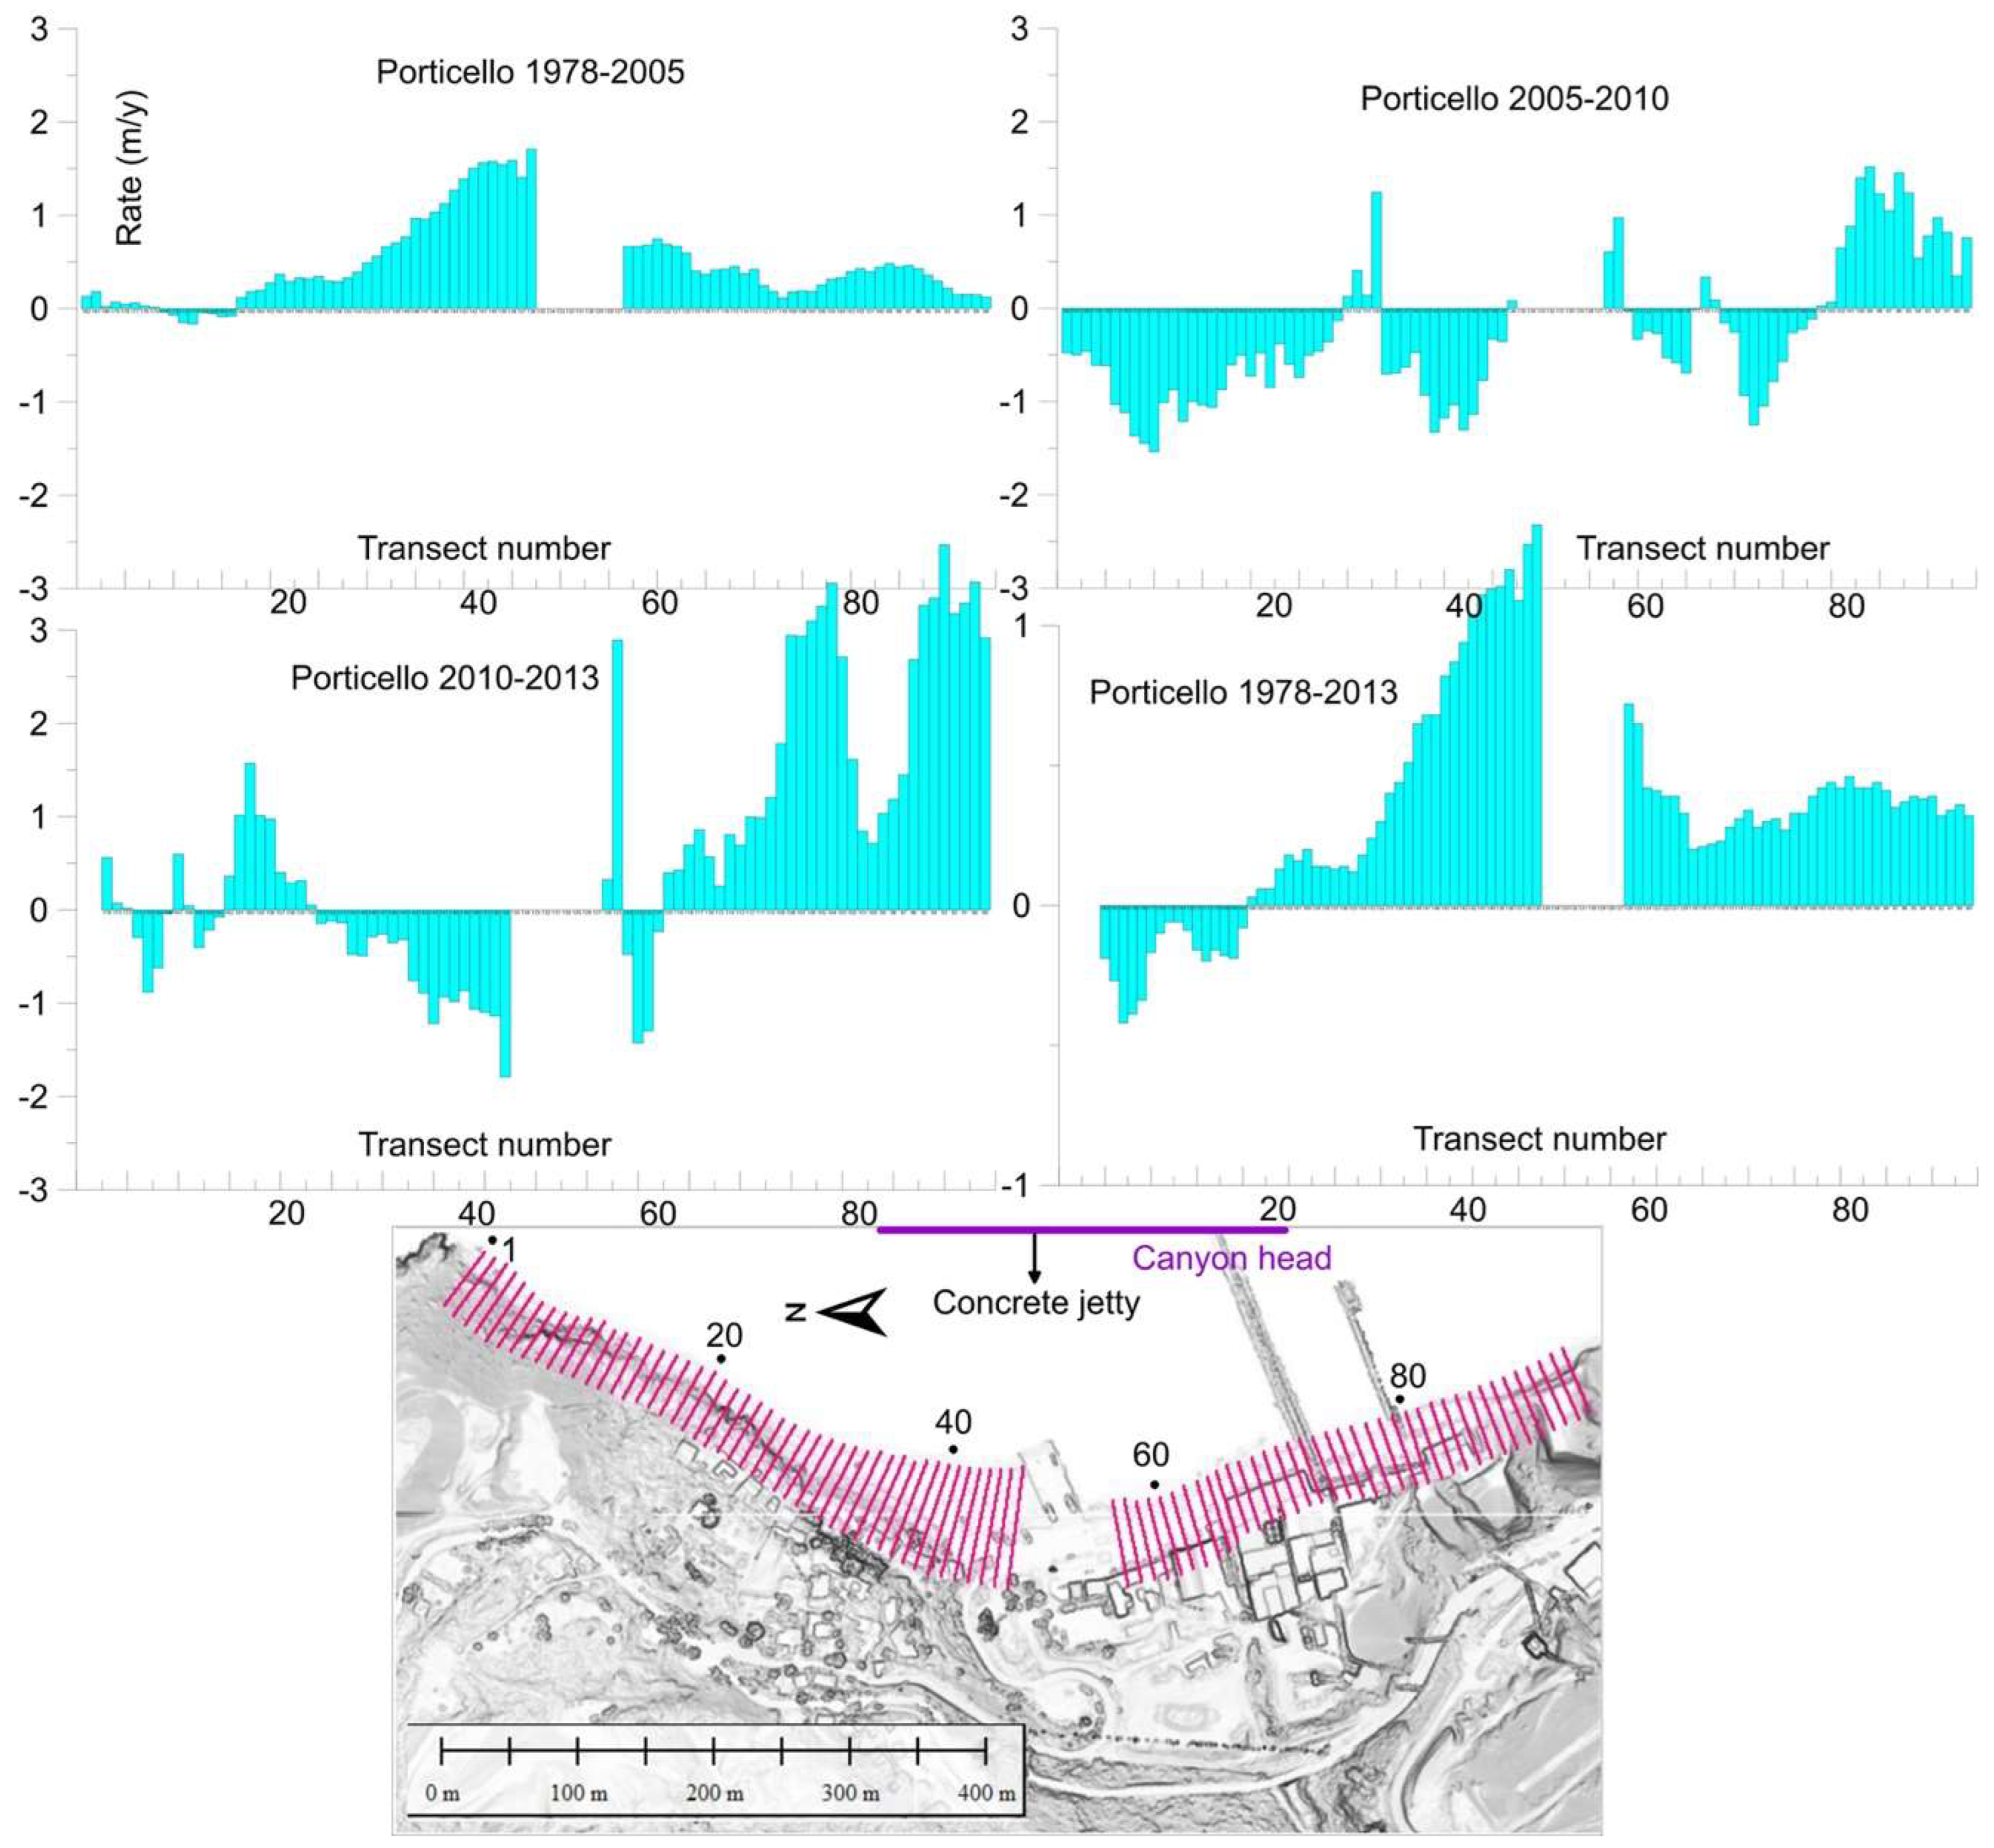
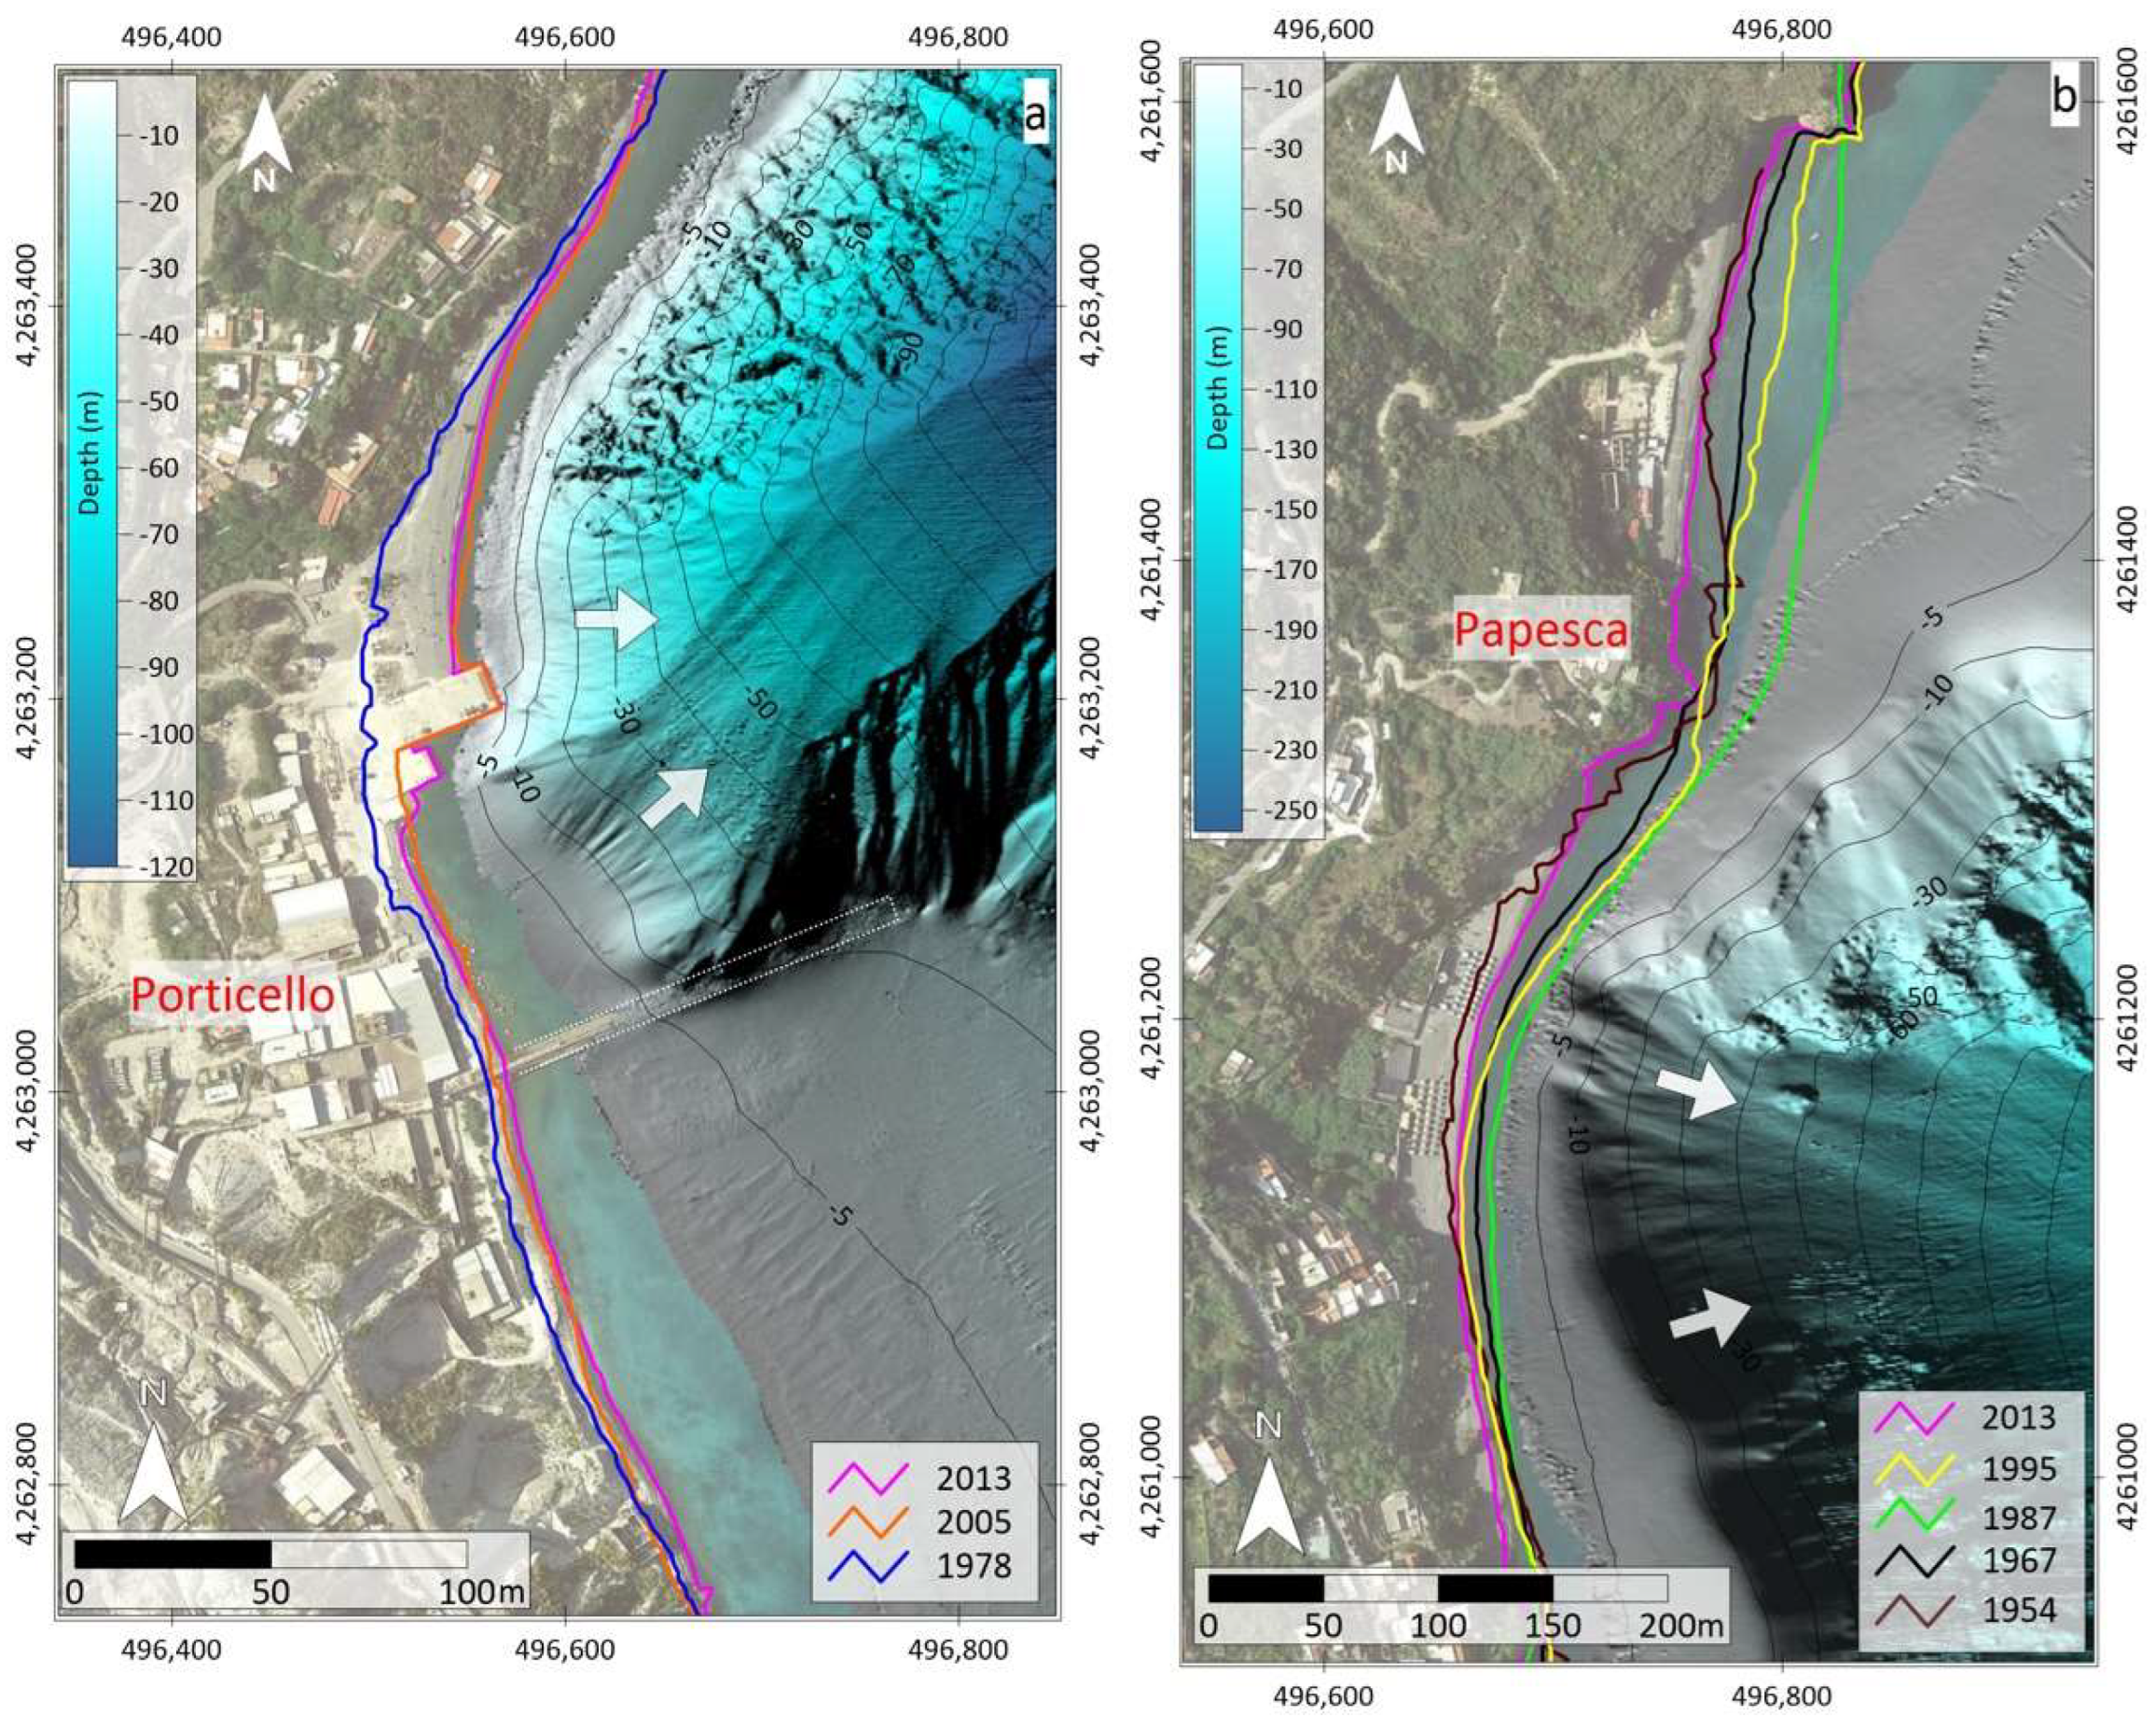
4.2. Porticello and Papesca
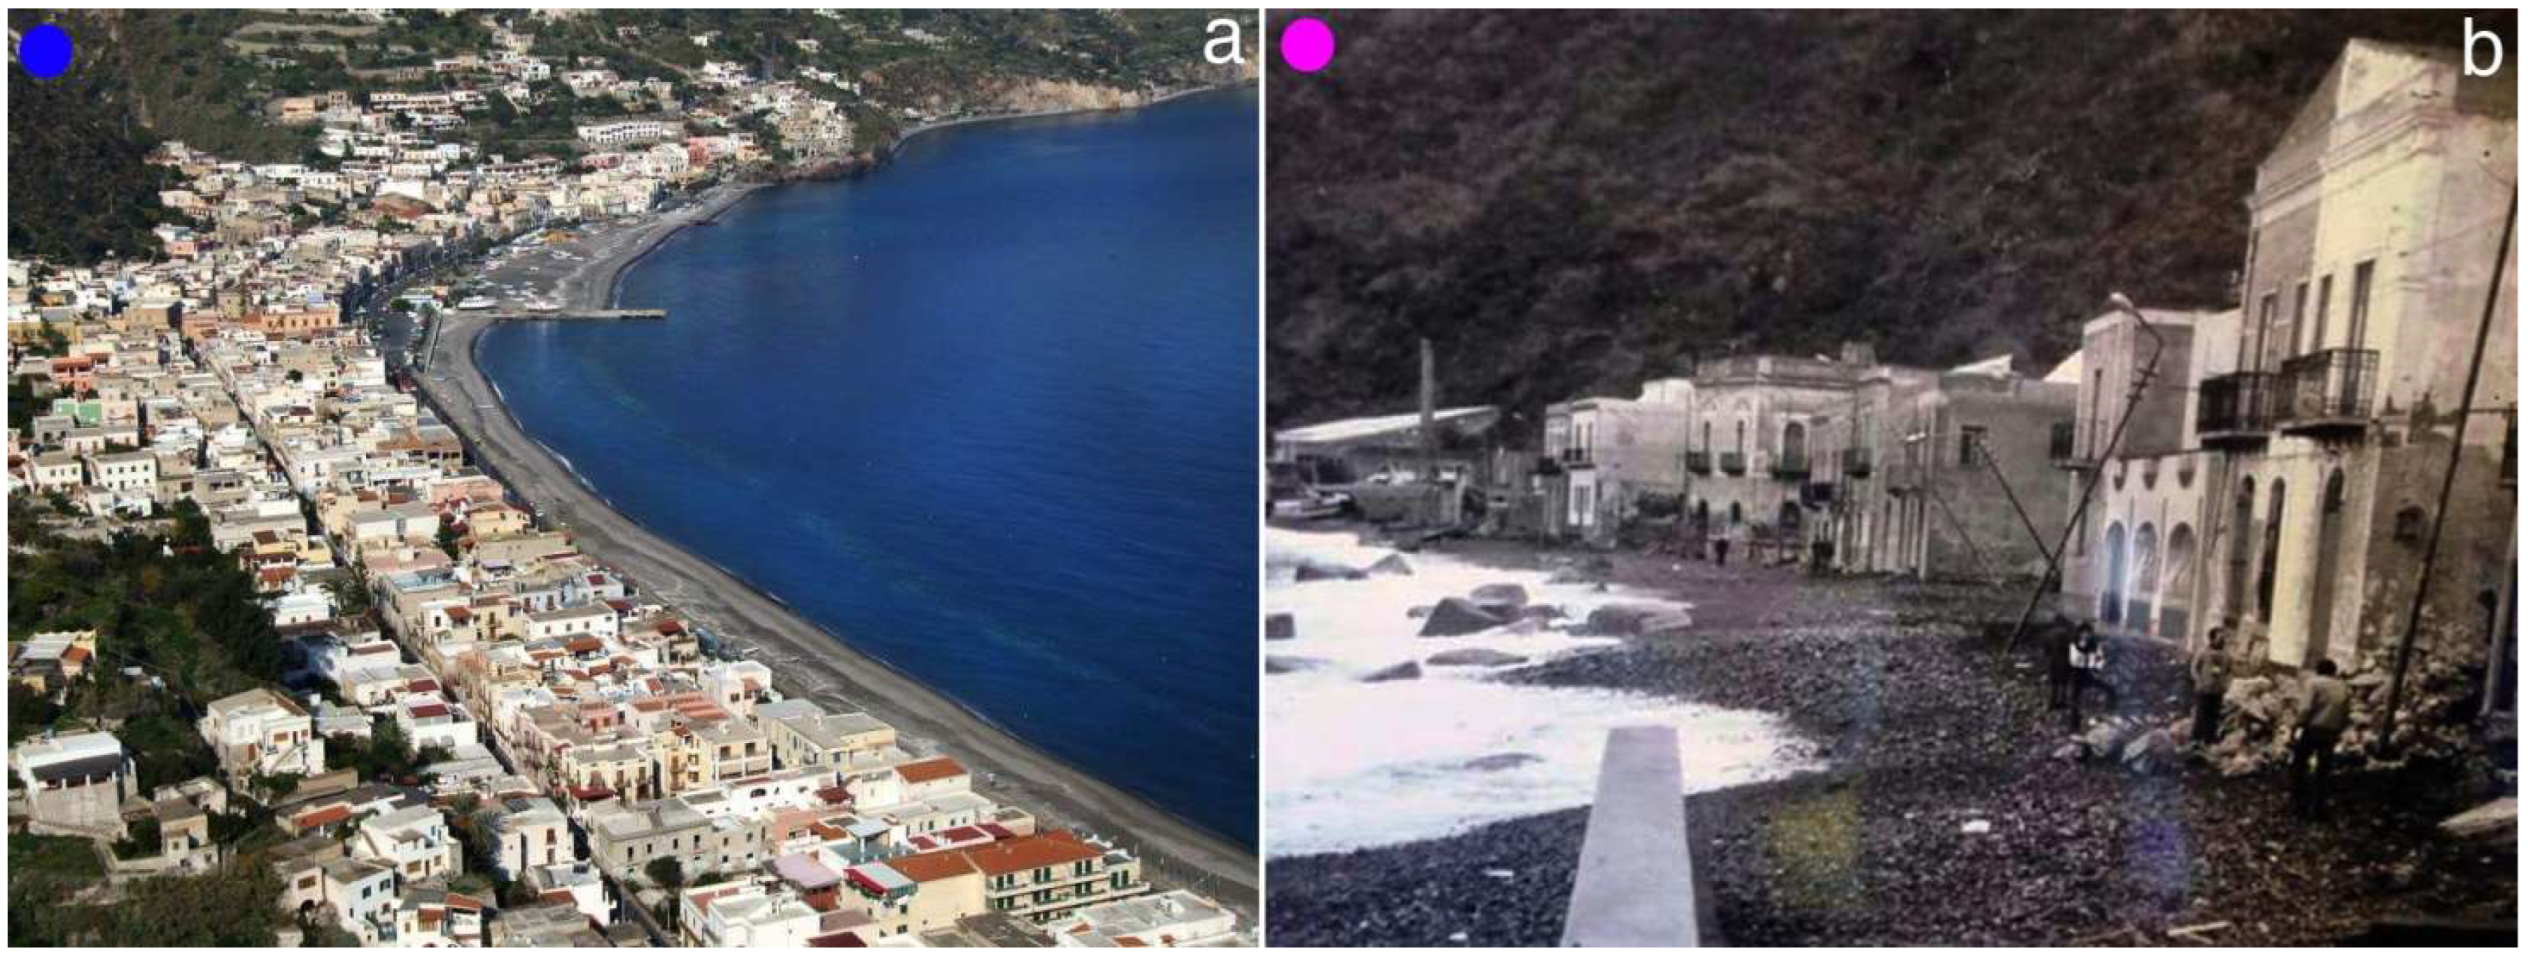
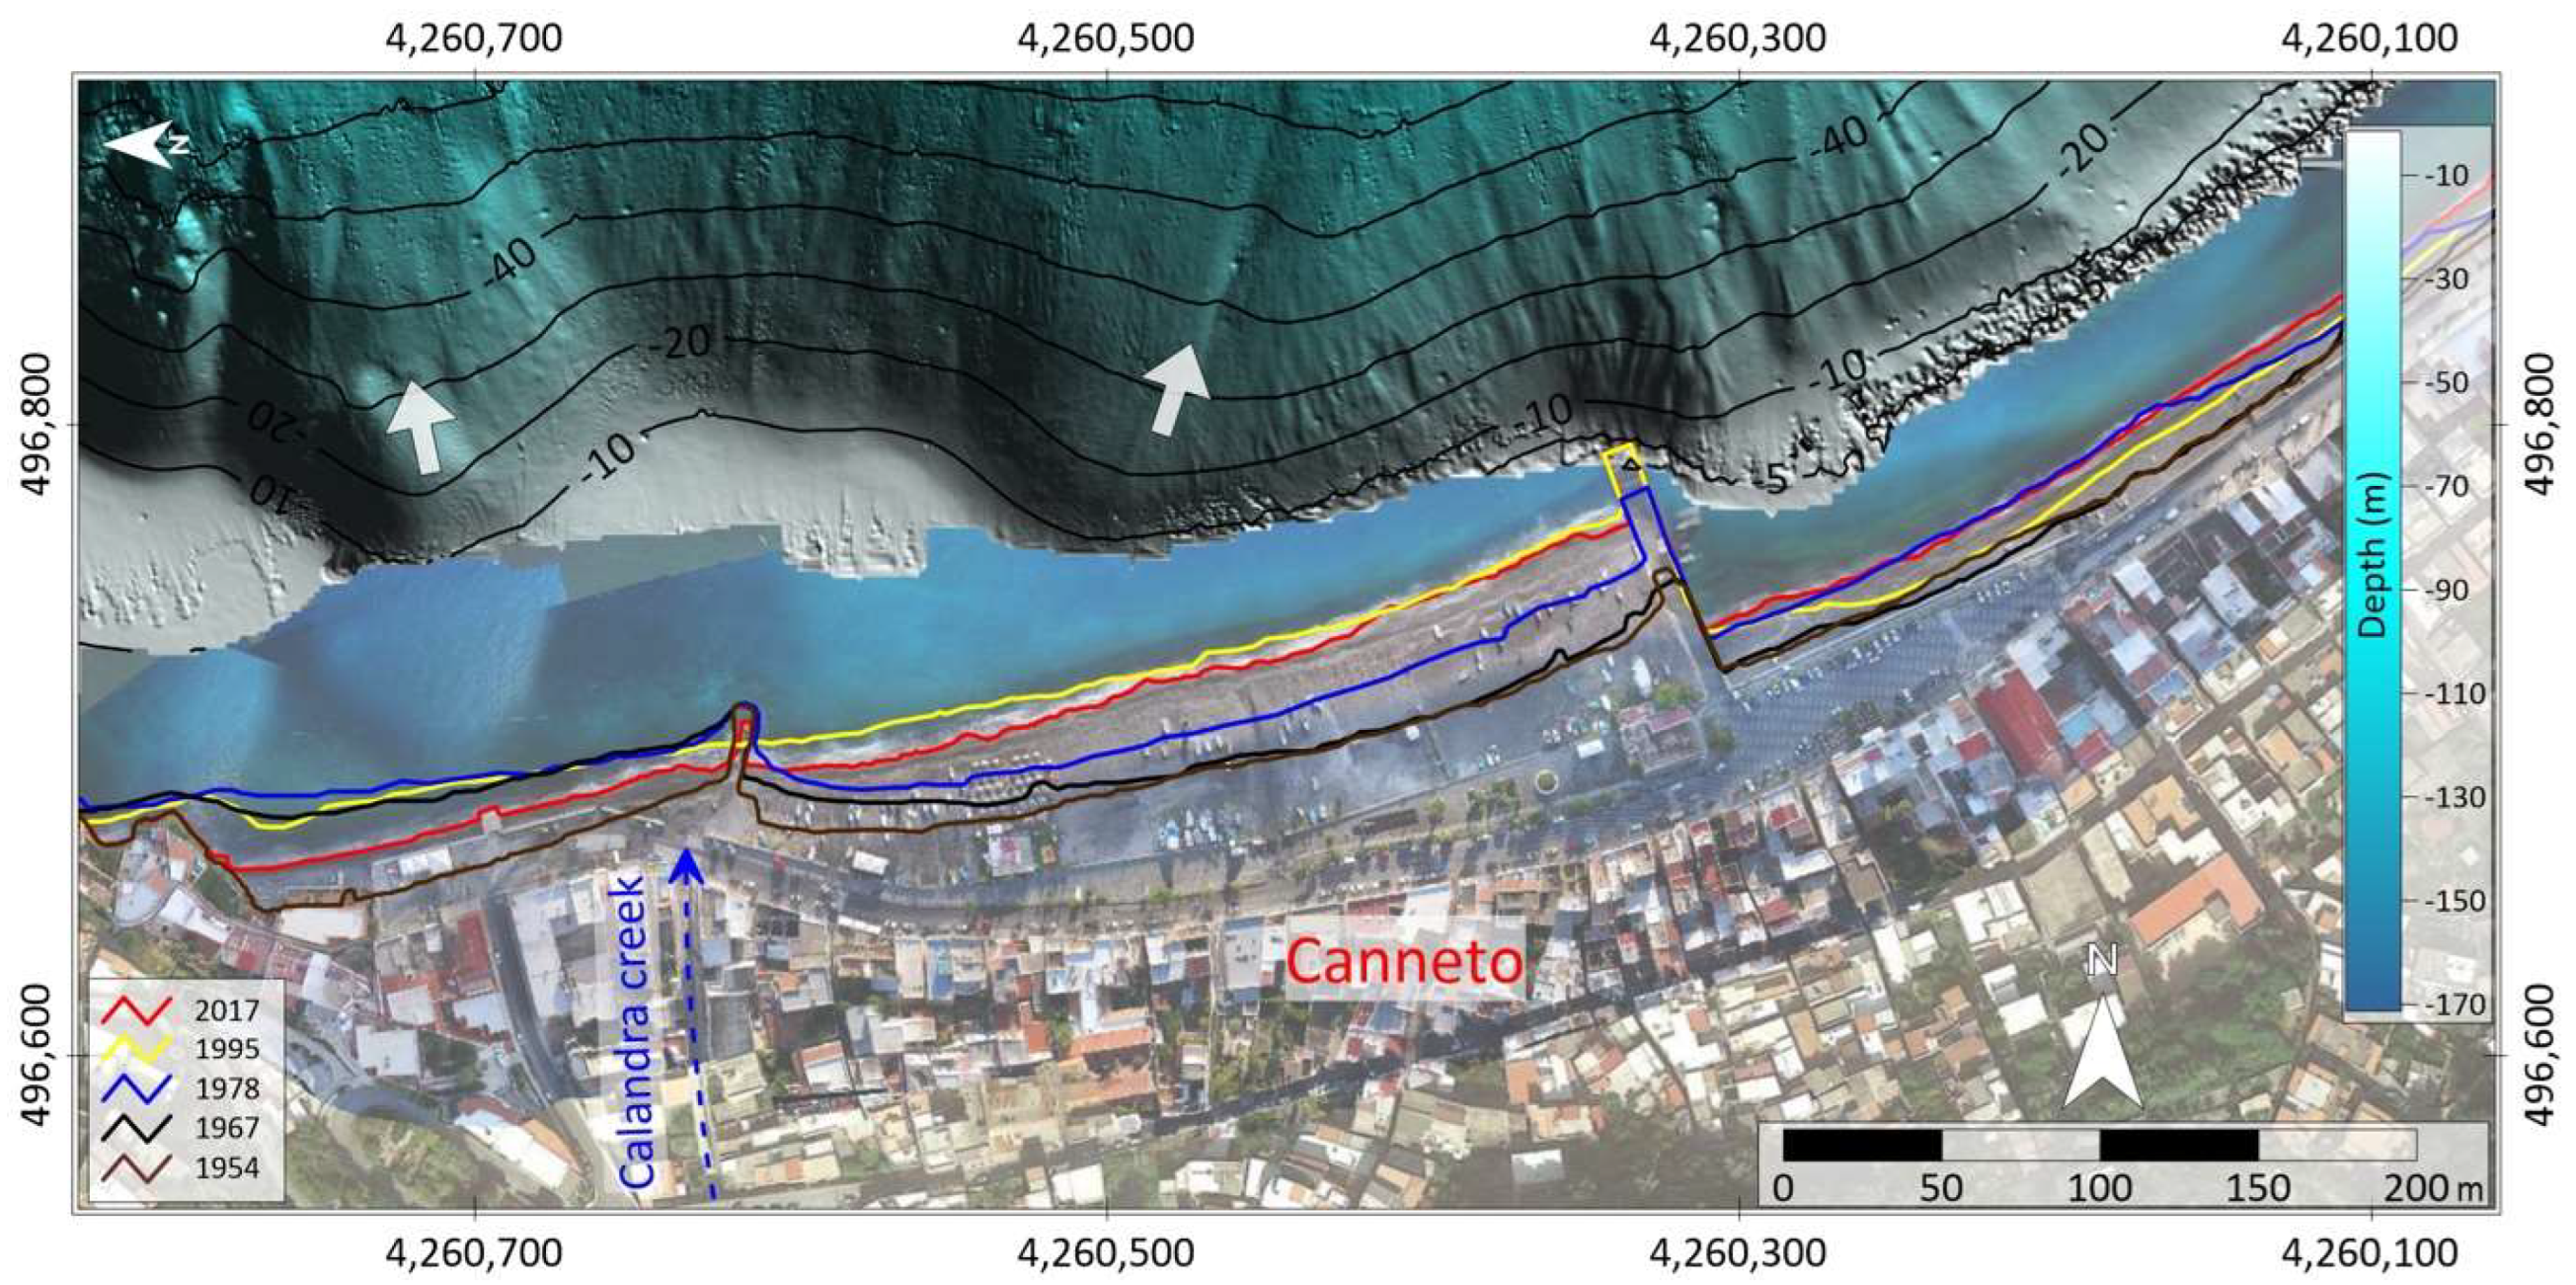
The coastal sector of Porticello, located south of the Rocche Rosse promontory (Figure 1 and Figure 6a), includes the coastal area at the foot of the main pumice quarry exploitation plant and some small pocket beaches alternating with rocky cliffs more to the south. The beaches in this sector are gravelly and sandy, with lava blocks and scoriae up to 15 cm in size, and are very rich in (cm-size or finer) white pumice fragments. The dominant lithology in this sector, in fact, is represented by pumice and obsidian detritus deriving from the erosion of the Mt. Pilato pumice cone and the Rocche Rosse and Pomiciazzo flows inland ([7,23]; Figure 1). During the recent period of the pumice quarry exploitation (since the second half of the 1950s), the excavation waste materials were largely accumulated at the coast, where they entered the sea, giving this coastal tract a very peculiar appearance (Figure 6 and Figure A9a) and also feeding the beaches in the downdrift coastal stretch. During the 1990s, most of the waste materials were partly moved inland for environmental reasons, and since then, a more reduced part of the pumice detritus has reached the sea; the pumice extraction has definitely ceased since the 2000s, as was requested for the entry of Lipari and the Aeolian Islands onto the World Heritage List [45].
One of the long boarding jetties built in front of the plant at the time of the most recent extraction activities (Figure A9a) is still present (Figure 6 and Figure 7a, dotted white line). However, it does not alter the coastline morphology here because it is open to waves and currents. About 100 m north of it, a concrete jetty, shorter but larger, appears instead to have controlled the local shoreline position on its updrift (northern) side for some hundred meters to the north (Figure 7a). After its emplacement, in fact, the coastline advanced here (see shoreline displacement from 1978–2005 in Figure A3), causing an offset with respect to the downdrift (southern) side and indicating that the prevalent longshore sediment drift direction here is from the north to the south. This trend inverted in more recent years (i.e., after 2005) but remained prevalent over the overall time frame of 1978–2013, with average rates over 1 m/yr (Figure A3). A generalized, more limited advancement is also visible in the shoreline to the south of the pier (Figure 7a and Figure A3).
In the submarine sector, the bathymetry shows a straight canyon head (Porticello canyon, Figure 1 and Figure 7a) in front of the beach. This feature is 300–400 m wide and its head is located at a very shallow depth (just −5 m), 40 m from the coast. The backscatter intensity map (Figure A8) suggests the occurrence of active channelized flows in the canyon head, transporting sediment from the nearshore to a higher depth, and likely reducing the sediment accumulation in the nearshore. Conversely, a wide and flat area is present in the shallow water (maximum depth around 15 m) to the south of the main pier (Figure 7a). It represents the summit part of a submarine depositional terrace (SDT in Figure 1), which is mainly fed by the accumulation of the abundant volcaniclastic material of the pumice quarry waste (giving the light blue color in the nearshore, see Figure 6a) that reached the sea and has been reworked by waves and currents.
More to the south, the two long, gravelly–sandy pocket beaches of Papesca extend on both sides of a rocky cliff (Figure 7b). They show a gradual and marked advance of the coastline from 1954 to 1967 and, particularly, from 1967 to 1987 for the northern sector and from 1978 to 1987 for the southern sector (at average rates of around 4 m/yr). This led to the merging of the two beaches in a unique, wide coastal belt (Figure 7b and Figure 8a,b). This advancement is probably due to the large pumice detritus supply that fed the beach in this period, when the pumice plant was active and the excavation waste materials reached the sea, being transported southward by longshore currents. The wider extension reached by the beach in the northern sector of Papesca, with respect to the southern one, is likely the consequence of the presence of a wide and flat top submarine depositional terrace in the shallow water (SDT in Figure 1) that favored the coastal progradation here (Figure 7b). In contrast, a canyon head is present more to the south, reaching a minimum depth of less than 5 m and a distance from the coast of 30–40 m (Figure 7b). It likely contributes to the subtraction of sediment from the nearshore, contrasting with the shoreline advancement here. A generalized shoreline retreat appears to occur after 1987, and even earlier in the northern sector of Papesca (Figure 7b and Figure A4), with average retreat rates up to over 3 m/yr until 2005. Then, the retreat rates markedly decreased to values around 1 m/yr between 2005 and 2013 (Figure A4), and in the shoreline of 2013, the two beaches appear to be again divided by a rocky cliff (Figure 7b and Figure 8c). This retreat can be addressed as being due to the reduction in the pumice detritus supply from the end of the 1980s to the beginning of the 2000s. Nowadays, only the local accumulation of pumice is present on the beach ridges and in the backshore (Figure 8c).

4.3. Canneto

North of the Monterosa promontory, the wide, arc-shaped Canneto bay is opened to the east for a total length of about 1600 m (Figure 1). The village of Canneto developed all along the bay (Figure 9a) and is particularly exposed to the effects of storm surges in its southern sector (Figure 9b). The beach of Canneto is gravelly–sandy and is made of volcaniclastic materials, reflecting the lithology of the respective hydrographic basins (lava, scoriae, and distal rhyolitic pumiceous deposits; [23]). This coastal tract, in fact, receives some sediment input from inland through small creeks with a torrential regime (such as the Calandra creek, see location in Figure 10) draining the inland areas; in correspondence with the flash-flood events, abundant sediment sporadically reaches the coast, giving way to local shoreline advancements of tens of meters and causing severe damage to the infrastructure (Figure A9b; [25,26]). Pumice fragments, floating and transported by waves, are present on the beach mostly in the central-southern part of the bay, both as patches and concentrated on beach ridges and the berm (Figure A10a,b). Comparing the 0/−1 ø (1–2 mm) grain-size fraction of the beach foreshore sediment from the northern side to the middle part to the southern side of the Canneto beach, the downdrift enrichment in the lighter pumice fraction is evident (Figure A10c), indicating hydraulic selection from the prevalent southward direction of the littoral drift.
Further, clear evidence of the southward-directed littoral drift is represented by the effects of the transversal human-made structures, such as the main concrete pier constructed in the 1960s and 1970s in the middle of the bay, intercepting the north-to-south-directed littoral drift. This effect was still more evident in the following decades, when this structure was prolonged, giving way to a marked coastline offset between the up- and downdrift sides (Figure 9a). The reconstructed shorelines show a localized beach advancement updrift, with maximum values of 30 m between the 1954 and 1967 shorelines (the rates locally were over 2 m/yr; Figure A5) in the northernmost part of the Canneto bay, with respect to a small pier located here (Figure 10). Further shoreline advancement is observed from 1967 to 1995 in the sector encompassed between this and the main pier, where an offset of over 50 m is visible on the shoreline between the updrift and downdrift sectors (Figure 9a and Figure 10). The southern part of the bay in these time intervals experienced, instead, alternating advancement and retreat (Figure A5). After 1995, the coastline was quite stable in the updrift side of the main pier, but it has retreated about 20 m in the northernmost sector of Canneto beach, especially since 2005. Conversely, to the south of the main pier a gradual shoreline stabilization/advancement is observed in the shorelines after 1995 (Figure 10 and Figure A5). Here, further coastal defense structures were adopted to protect the beach from storms due to easterly winds (Greco and Levante) that flooded the waterfront. After the storm of January 1981, one of the most impacting in recent decades, a set of submerged breakwaters made of tetrapods was settled down in front of the beach (Figure 9a; [10]). This structure locally stabilized the shoreline in the following years (Figure A5), although this defense intervention failed to protect the coast from further relevant storm events [10].
In the submarine sector of the bay, a 2 km-wide, articulated canyon head almost completely encompasses the bay in the offshore area (Canneto canyon; Figure 1). It is affected by several slide scars, suggesting the occurrence of active retrogressive processes ([16]). The canyon head is carved up to a very shallow depth (about 5 m wd) and is locally only some tens of meters away from the coast (Figure 10). However, the canyon seems not to markedly affect the coastal evolution, as testified by the general stability/coastal advancement in the Canneto bay in the overall period of 1954–2017, which is probably partly maintained by the presence of piers and defense structures (Figure A5).

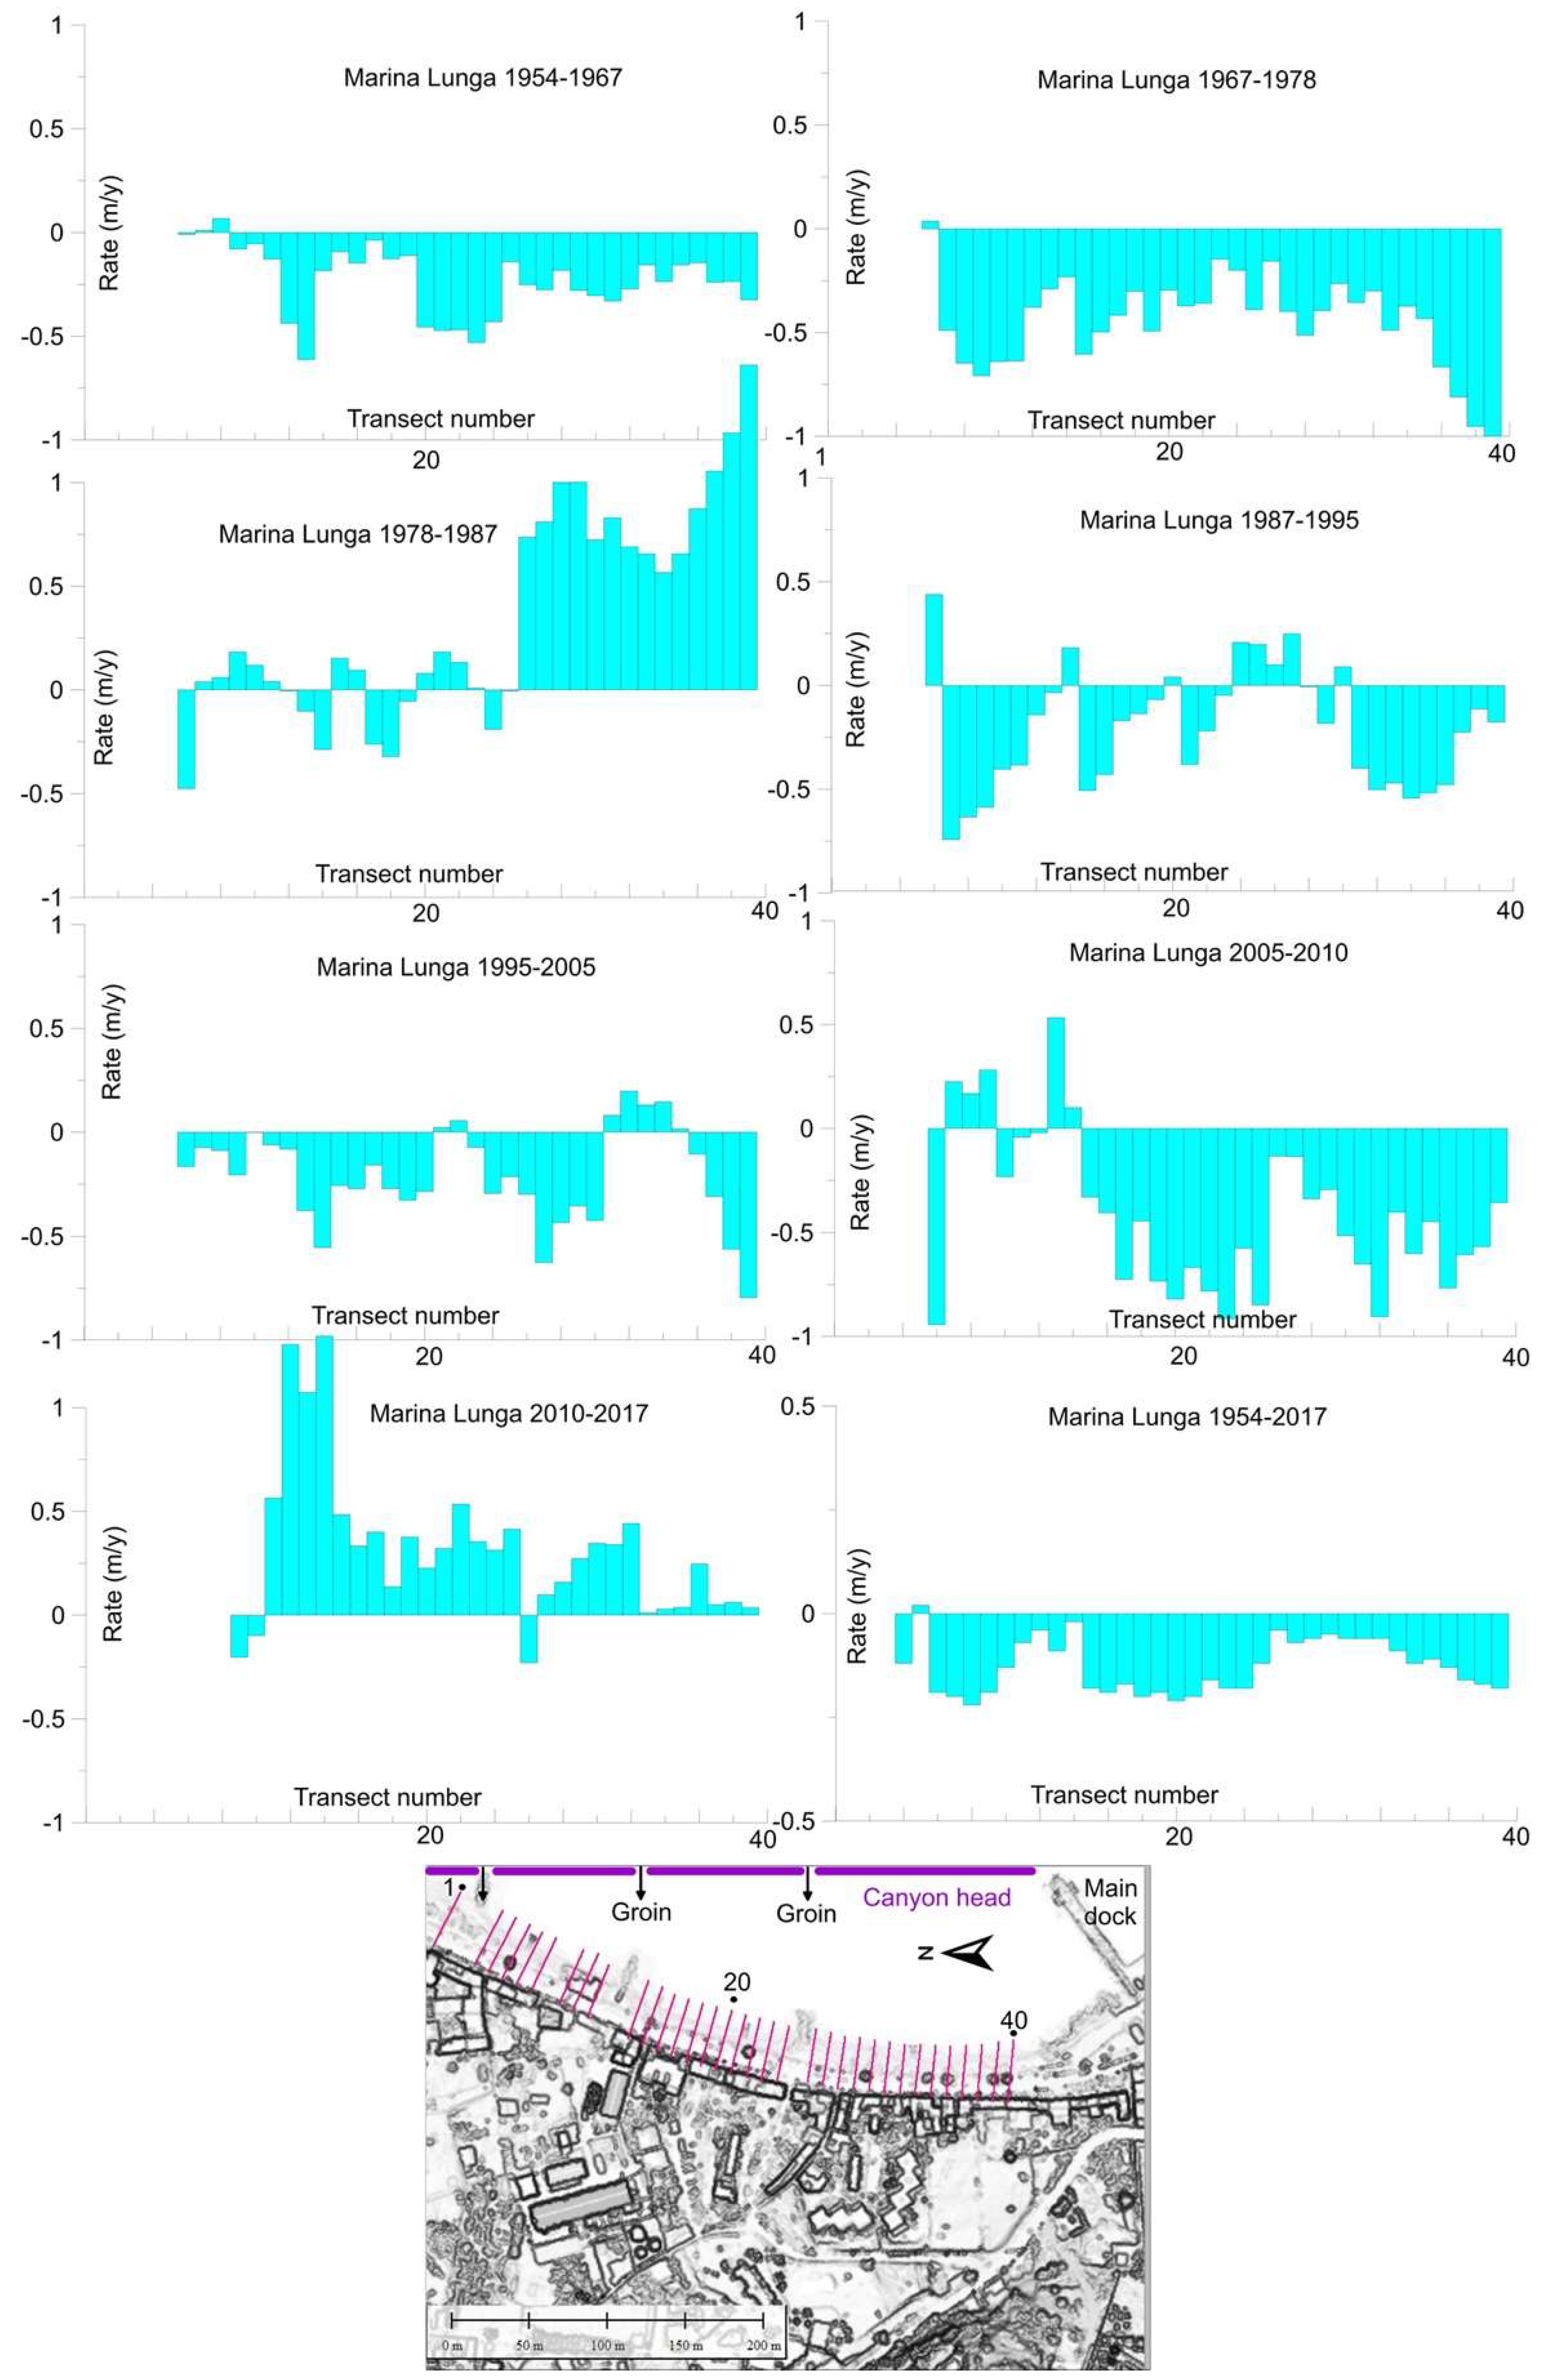
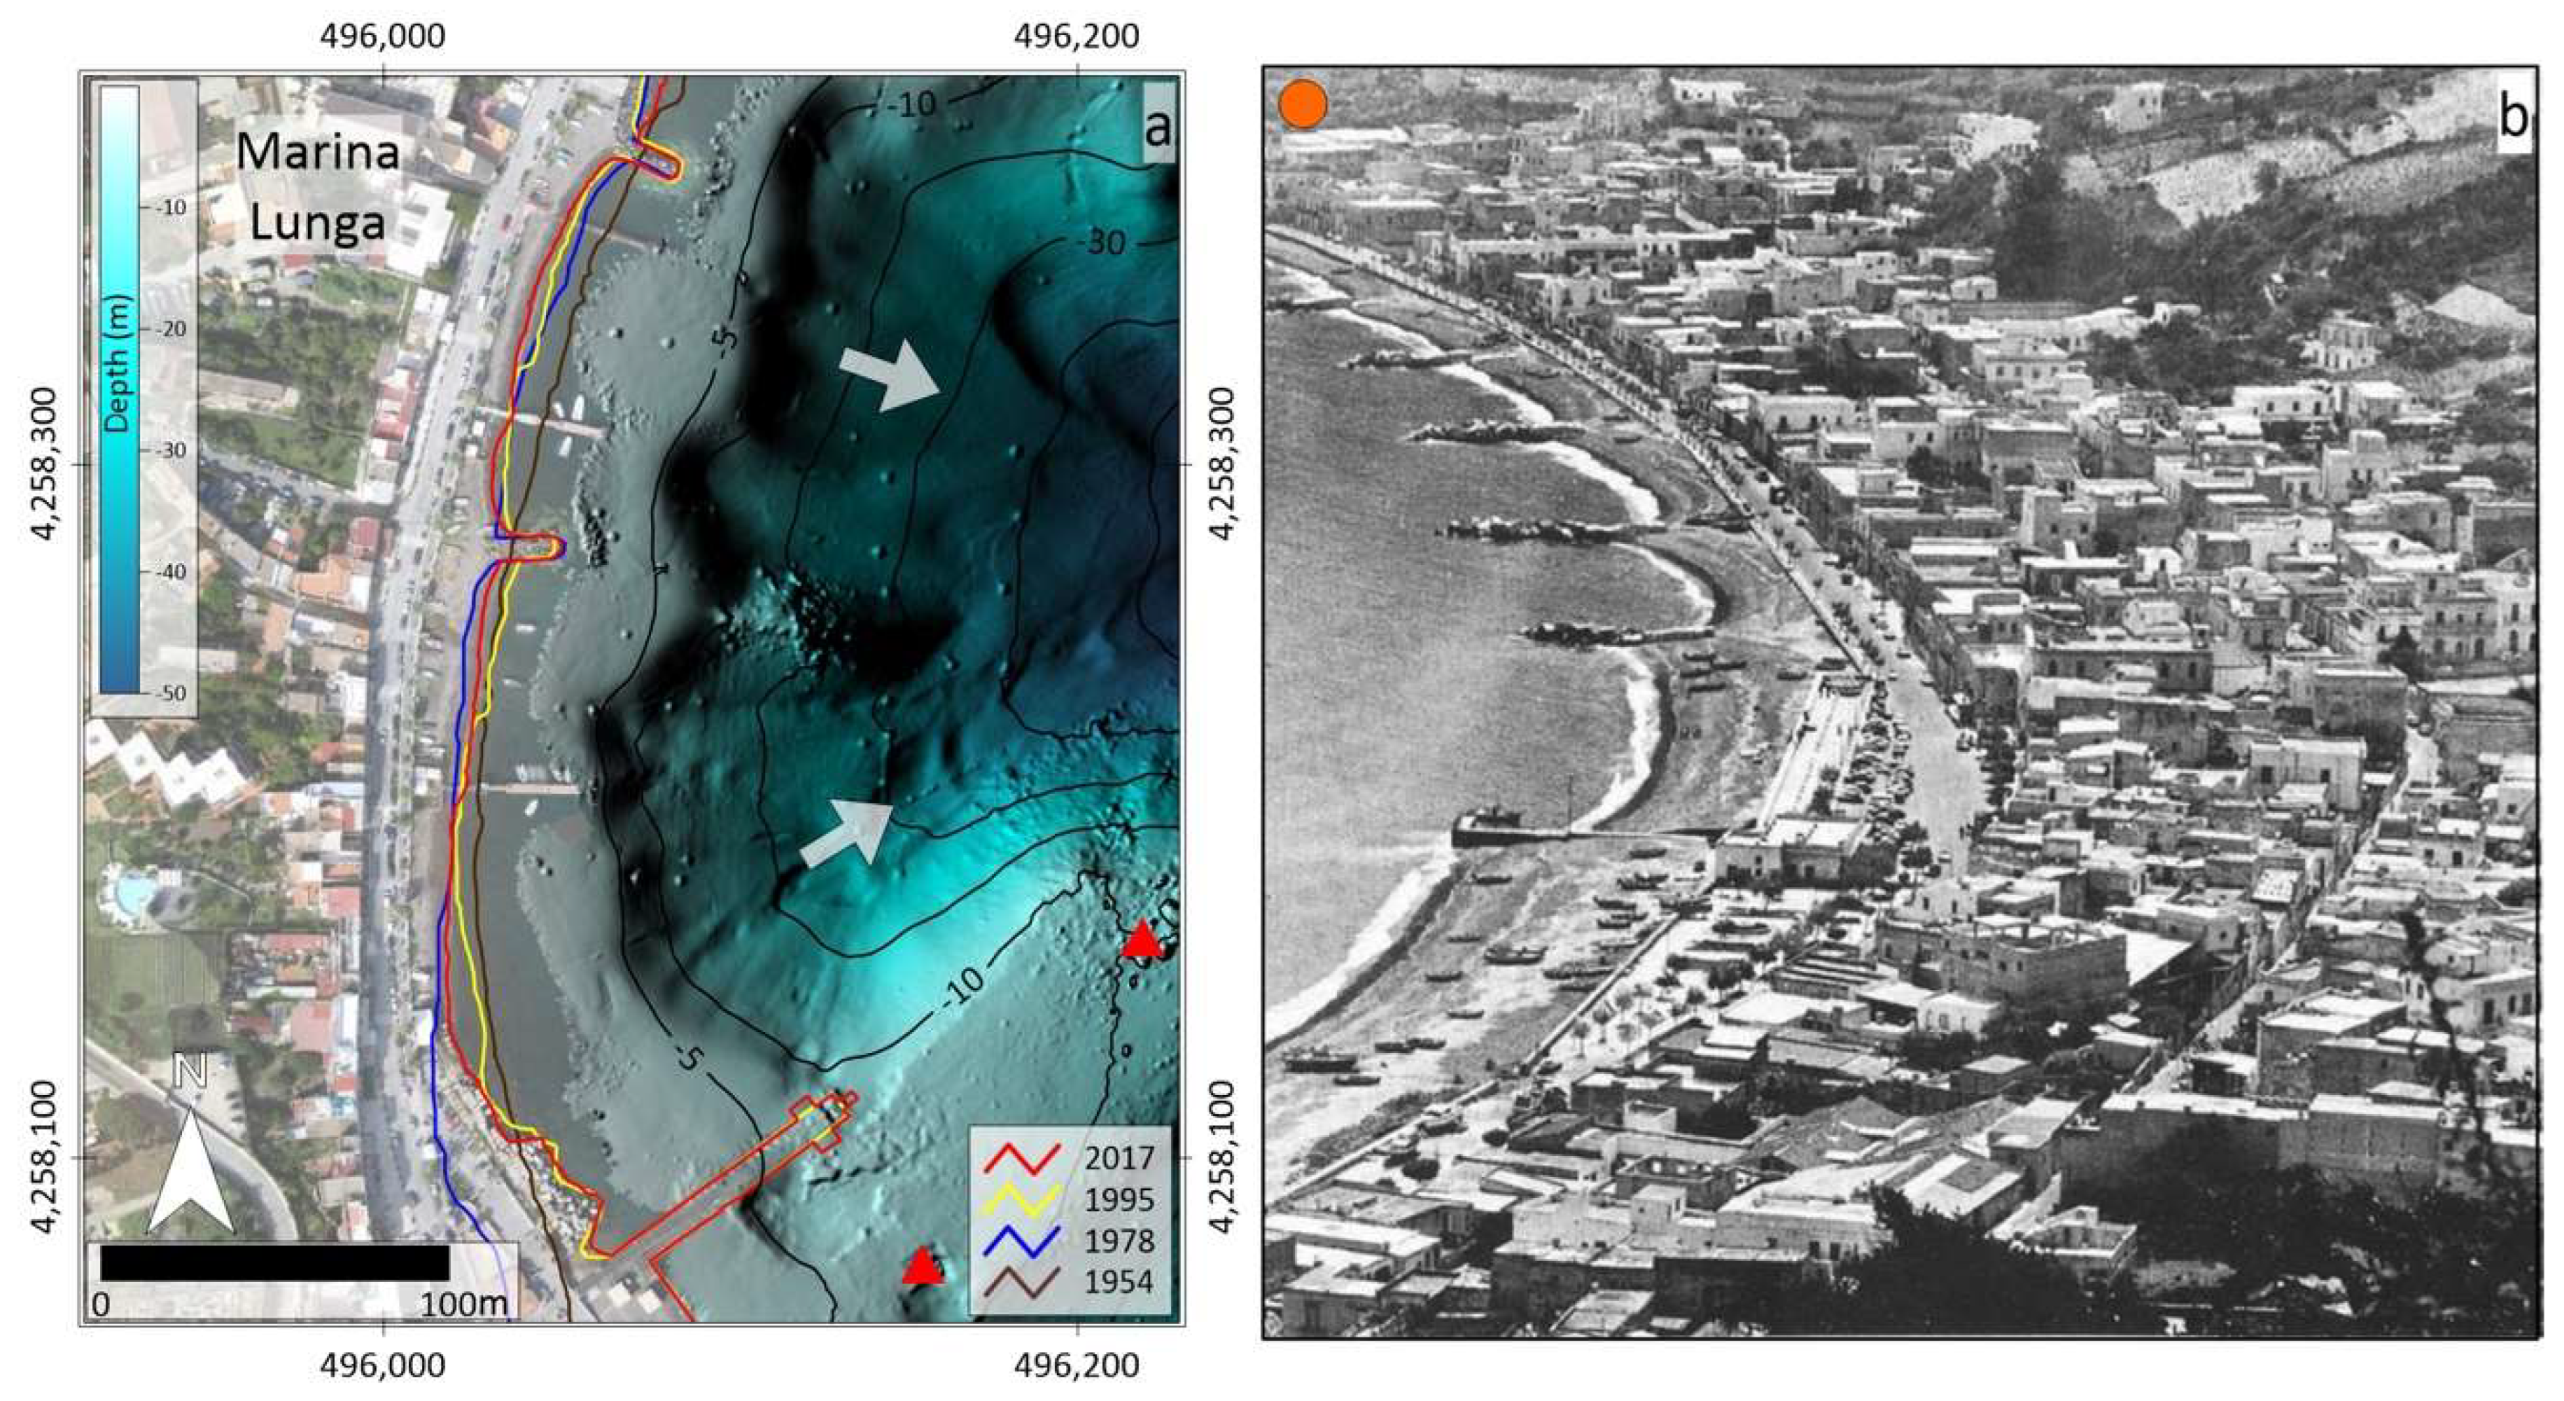
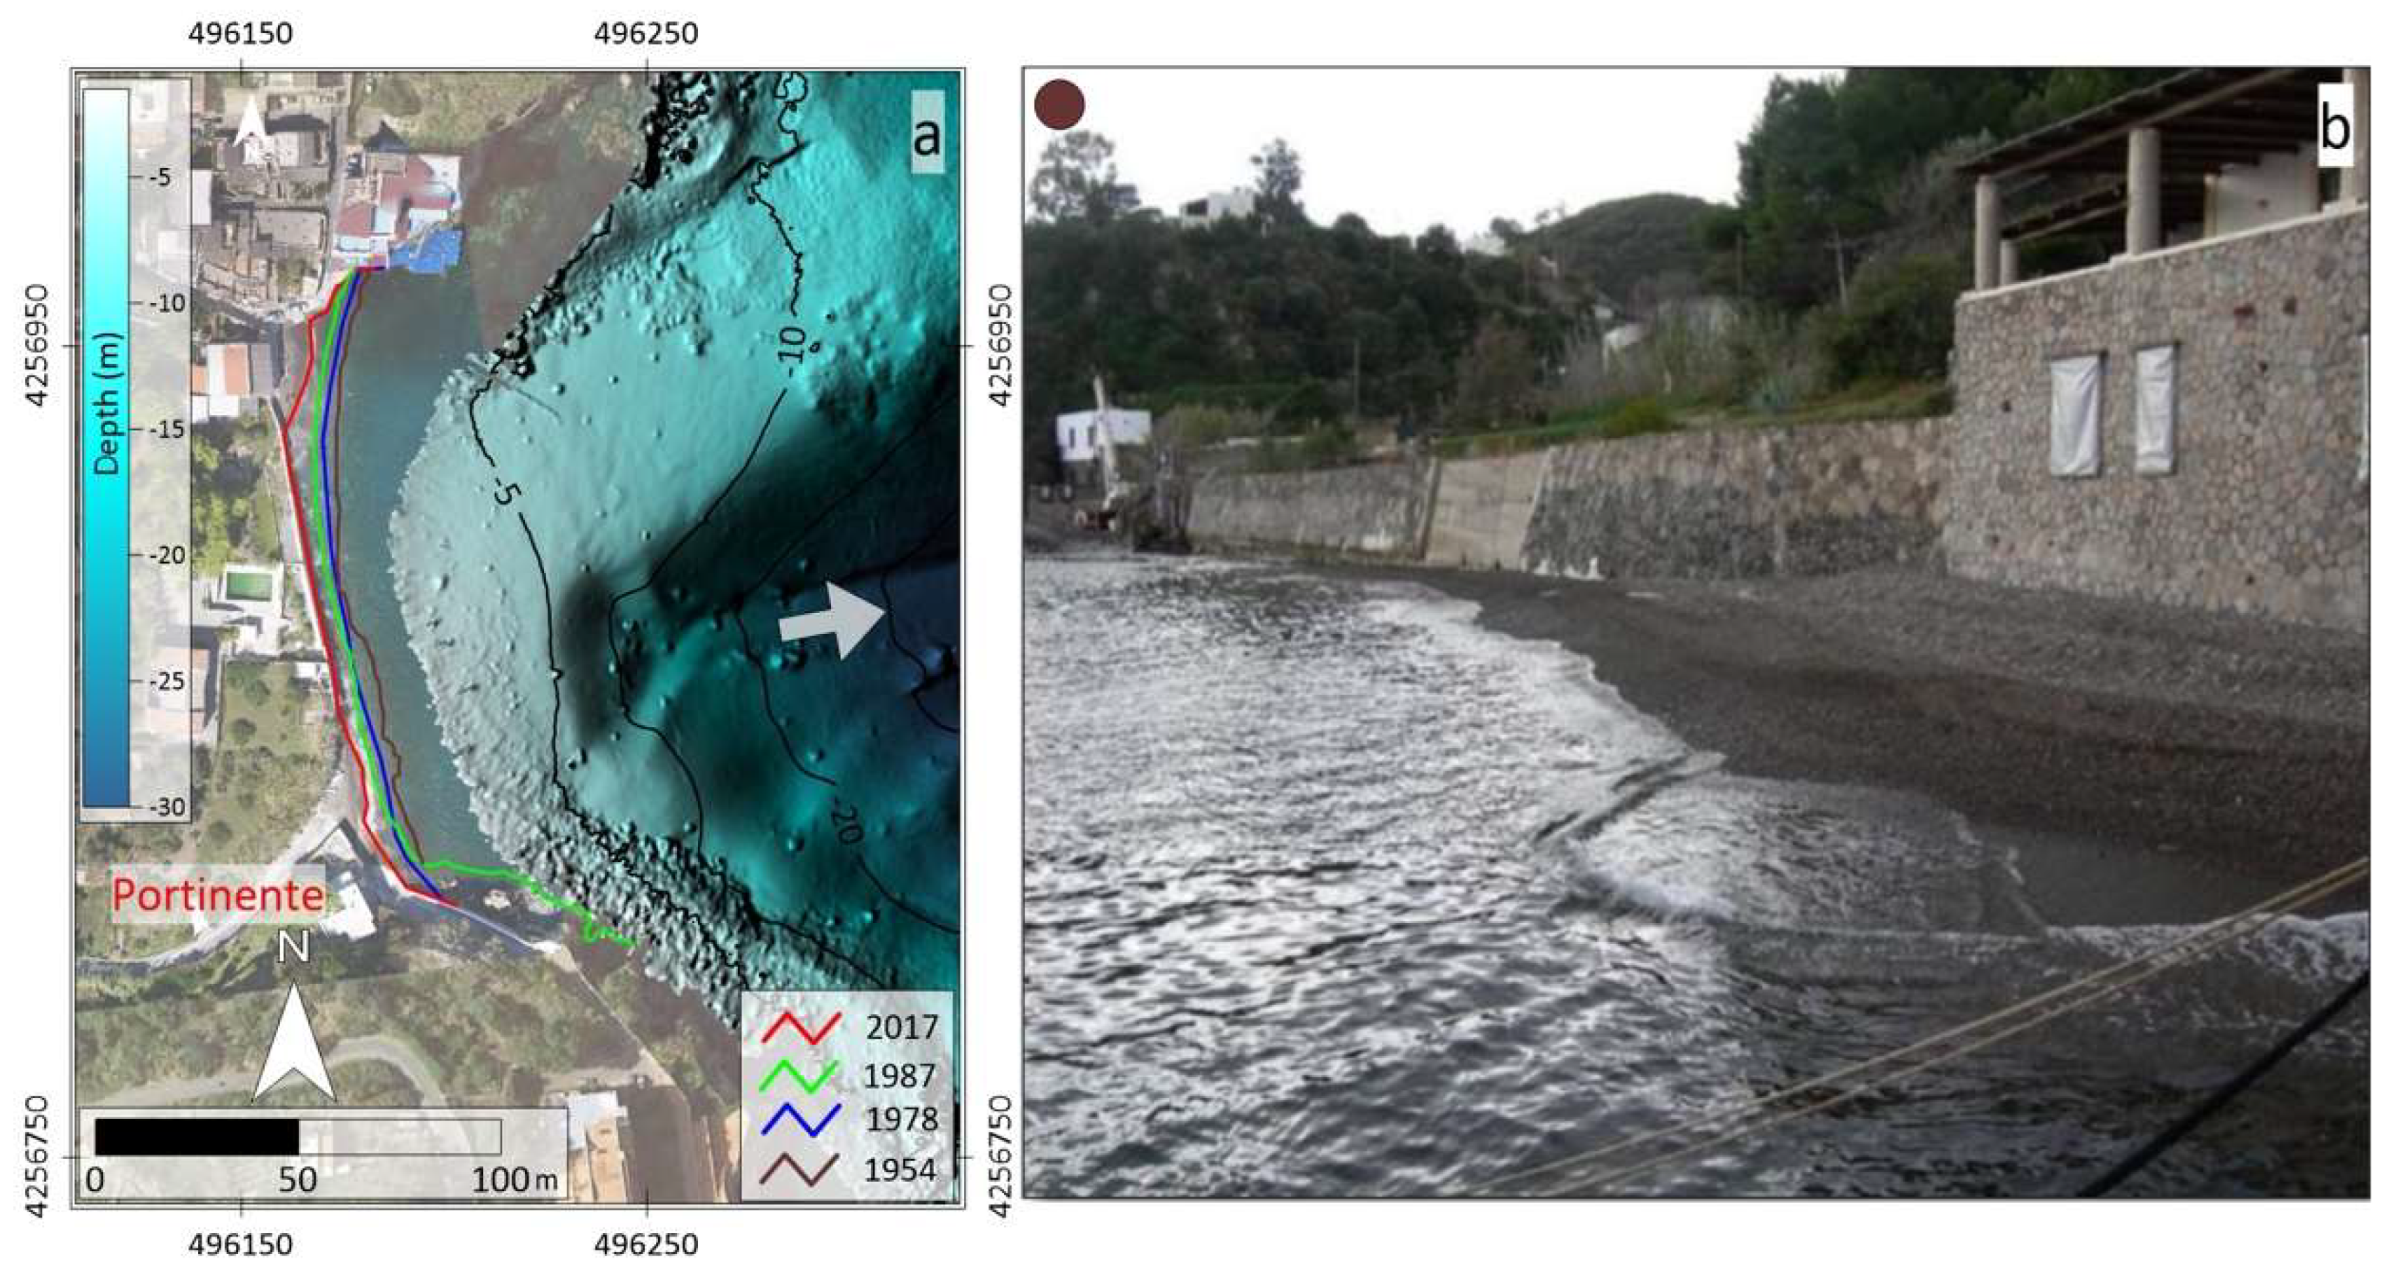
4.4. Marina Lunga and Portinente

The bay of Marina Lunga (also known as “Marina di Portosalvo”), located to the south of the Monterosa promontory (Figure 1), is the seat of most of the residential, commercial, and touristic settlements of Lipari. It evolved from a pebble beach to a port structured with docks and piers at the end of 1800 [14], and nowadays, its southern sector is the seat of the main landing pier for touristic ships and ferries (Figure 11a).
A very narrow beach is present only in the mid-southern part of the bay, where it is backed by a street and the village. The beach is gravelly–sandy and is made of volcaniclastic materials (fragments of lava, scoriae, etc.), reflecting the lithology of the hydrographic basins (lavas and pyroclasts; [23]). The pumice fraction is rare, as observed for all the beaches to the south of Monterosa. The coastline of 1954 appears still quite regular and continuous, and at that time, the beach reached a maximum extension of 30 m (Figure 11a). In the following decades, however, the beach has mostly retreated (Figure 11a and Figure A6). A set of groynes (Figure 11b) was installed at the end of the 1960s and in the early 1970s to protect the beach from erosion, and this has obviously affected the coastline evolution here as it has assumed an embayed shape in between the groynes (Figure 11a,b). Apart from a local inversion of the trend, with partial recovery in the southernmost part of the beach, where the main pier was prolonged, the beach never recovered its original extension and a slight negative rate of shoreline displacement (i.e., retreat) prevails in the overall period of 1954–2017 (Figure A6). The present-day beach in this sector is only several meters wide and is backed by a wall that separates it from the road plan (Figure 11). It is worth noting that the articulated head of the Marina Lunga canyon system deeply carves the bay into different branches (Figure 1 and Figure 11a), reaching the coastal area up to a very shallow depth (4 m wd), especially in the middle and southern part of the bay, undermining the coastal structures located here.
To the south of the main Lipari village, the small pocket beach of Baia Portinente (also known as “Porto delle Genti”) is included between rocky cliffs (Figure 1 and Figure 12a). The beach is gravelly–sandy and made of volcaniclastic materials (lava, scoriae, and similar lithologies to the Marina Lunga sector), with a rare pumice fraction. As indicated by the shoreline trend in the different time frames (Figure A7), the sediment is locally moved from one side of the pocket beach to the other, as frequently occurs in beach rotation processes [46]. However, the gradual and continuous processes of coastal retreat in recent decades are evident from the comparison between the analysed aerial photographs (a few selected shorelines are reported in Figure 12a) and the estimated shoreline displacement rates in Figure A7; this led to the virtual disappearance of the beach (Figure 12b) and moved the local authorities to plan reconstruction interventions [10]. In the submarine sector, a canyon head is observed (Figure 1 and Figure 11a), carving the Portinente small embayment at very shallow depth (about 6 m wd) only 50 m from the coast, suggesting the occurrence of active retrogressive processes [16]. Moreover, in this case, the backscatter intensity map proves the occurrence of active channelized flows in the canyon head, transporting sediment from the nearshore to a higher depth (Figure A8).

5. Discussion

Coastal erosion and flooding affect a great part of the present world coastlines due to several factors, which are partly enhanced by anthropogenic effects and exacerbated by climate change impacts [47,48,49,50]. Around half of the world’s sandy beaches could disappear by the end of the century [51]. Among low-lying coasts, small islands will become particularly exposed to the impacts of sea level rise, which has accelerated over time in recent decades and is expected to continue rising in the 21st century and beyond [52].
At Lipari, most of the beaches in the low-lying coastal sectors under study were already present in the 19th century [22] and this suggests that they are not of new formation. Their relatively reduced extension, such as in the western sector of Acquacalda and at Portinente, was also claimed in historical times [22] and reflects a precarious but persistent state of equilibrium that allowed them to exist. However, most of these beaches evolved with time in response to main drivers, as discussed below, becoming increasingly threatened by flooding and persistent erosion. As pointed out by our analyses, these hazards particularly affect the most populated coastal areas of the island and have important future implications in terms of socio-economic resources and risk assessment and reduction.

5.1. Evolution of Low-Lying Coastal Areas at Lipari: Natural and Anthropogenic Processes

The shoreline evolution in the northern and eastern low-lying coastal sectors of Lipari shows complex patterns that are variable in time (alternating phases of beach accretion and retreat) and in space (and also at short-distances, i.e., tens or hundreds of meters along shore). The analysis of the short-term shoreline variability at the seasonal/yearly scale, which would have necessitated the consideration of a wide number of observational data on high-frequency processes (such as wave climate, local tide data, storm surges, etc.) is beyond of the purposes of this study. Moreover, the compared shorelines refer to different periods of the year, although most of them are related to the beginning and the end of the summer season (June to October; Table 1), as this is out of the stormiest winter period. We thus cannot exclude the fact that part of the observed variation is due to short-term variability. At the multi-decadal scale of our analysis, however, the mid- to long-term patterns of coastal change reconstructed for these beaches show a common evolution. Despite the fact that they cannot be quantitatively coupled with the respective physical processes responsible for the observed variations, the main control factors influencing the long-term coastal behavior can be schematically individuated.
First, sediment input plays a fundamental role in feeding the coast. At Lipari, the beaches are of a mixed type (gravelly to sandy and commonly rich in blocks deriving from cliff erosion and/or mass failure processes). Part of the clastic sediment is supplied to the coast by the stream network, according to the extension and the lithology of the respective drainage basins (Figure 13). During the dry season, the streams are ephemeral, and the surface runoff is very low; however, sudden flash-flood events locally occur in response to intensive rains, carrying a high solid discharge that can occasionally reach the coast (Figure A9b). This input is unsteady and locally abundant only where non-cohesive lithotypes (such as pyroclastic deposits) crop up in the drainage basins or where the sediments are temporarily stored in artificial settling basins, from where they can be more easily washed out by heavy rains [25,26]. In the latter case, the location of the sediment input to the coast also reflects the human-made hydrogeological regulation of the drainage basins. Similar rapid and transient coastline changes associated with flash floods, generated by short and steep rivers with a torrential regime, are very common on the surrounding coastline of Calabria and Sicily [53,54].
Volcanic coasts are peculiar for the local production of volcanigenic sediments in connection with active volcanism (such as occurs at the nearby Stromboli Island; [1]) and thanks to the high erodibility of eruptive products such as the pyroclastic units. In the north-eastern and eastern sector of Lipari, while the rocky cliffed coastal stretches appear relatively stable, the presence of widespread pumice deposits, exploited for centuries, represents an important source of sediment supply to the coast. This appears evident in relation to the pumice quarry exploitation that has been carried out in recent decades, accumulating a large quantity of excavation waste materials close to the coast that were transported alongshore, feeding the beaches in the downdrift direction (Porticello, Papesca). We also noted the effects on the shoreline behaviour of the reduction in this contribution since the 1990s, when a more reduced part of the pumice detritus reached the sea, having been moved elsewhere and, particularly, at the end of the extraction activities since the beginning of 2000. In this case, the human-induced effects are markedly evident on the coastal evolution at the local scale, in addition to the indirect impacts due to other anthropogenic activities inland, such as the above-cited hydrographic network management and, in general, the change of land use for increasing touristic demand.
Furthermore, the coastal front of most of the urbanized areas (such as Marina Lunga and Canneto or the area in front of the Acquacalda village) has been the seat of local protection interventions to reduce coastal erosion, mostly carried out since the 1970s and 1980s, maintaining these beaches in a precarious equilibrium state (Figure 13). Together with other coastal structures, such as docks and jetties, these interventions interfered with the nearshore dynamics and often intercepted the longshore drift, resulting in local effects at the shoreline (Figure 5, Figure 7, Figure 9, Figure 10 and Figure 11) and in a general stiffening of the beach. The role of waves and currents in redistributing sediment along the coast through the longshore drift appears mostly W-to-E-directed in the northern sector (Acquacalda) and N-to-S-directed in the eastern sector of the island to the north of Monterosa (blue arrows in Figure 13). In the coastal areas more to the south, the littoral drift is less evident and probably has a more articulated pattern.
In combination with the coastal processes, the offshore physiography also plays an important role in the sediment accumulation or reworking along the coasts. In the case of the studied coastal sectors, a well-developed insular shelf is absent (Figure 1), in agreement with the occurrence of relatively young volcanic units here [7,21]. The occurrence of active canyon heads very close to the coastline and at a few metres of depth suggests their role in intercepting and capturing sediments in the nearshore (Figure 13). In this way, the canyons negatively influence the sedimentary budget of the beach and promote coastal erosion, especially if they are the seat of active flows (Figure A8) and their heads evolve through retrogressive erosion. Still more relevant to the long-term fate of the studied low-lying coasts is subsidence, which has the effect of creating more and more space (accommodation) due to land sinking, thus promoting coastal erosion and permanent flooding. This process, which markedly affects the eastern Lipari sector to the south of Monterosa (Figure 13) and impacts on the progressive reduction in the beaches of Marina Lunga and Baia Portinente, is discussed in the following subsection with respect to the relative sea level (RSL).

5.2. Relative Sea Level and Implications for Coastal Flooding

Sea level data at the global scale show a robust acceleration of sea level rise in the last century [55,56], with an increasing trend up to about 3.6 ± 0.3 mm/yr from 2006–2015 [57]. The hazards associated with the rising sea level include more frequent or intense coastal flooding, especially in the case of extreme storm events, possibly leading to the permanent submergence of land; enhanced coastal erosion; the loss or change of coastal ecosystems and effects on hydrogeological systems such as impeded drainage and the salinization of surface water [52]. The majority of low-lying coasts and communities will face substantial risks from these coastal hazards at the century scale, including those in the Mediterranean [58,59].
In the coastal area under study, the monthly averaged sea level anomalies (SLA) recorded by satellite altimetry to the north-east of Lipari Island in the time span of 1993–2020 have been analyzed (Figure 3b). The time series highlights the usual annual and semi-annual oscillations, related to the seasonality, which are dominant throughout the period, while linear regression provides a rate of 3.1 ± 0.4 mm/yr (Figure 3b). This value, fully comparable to the global average over the same period (within the interval of 3–3.54 mm/yr [52,60]) appears higher with respect to previous studies focused on the regional (Mediterranean Sea) and local scale (N Adriatic coast), which roughly consider the same time span (e.g., [61,62]). The variability at the decadal to multidecadal scale is mainly due to the numerous complexities that, at both the regional and the local scale, could significantly contribute to the sea level change with respect to the global mean [52]. Indeed, while the steric contribution and the mass component are considered the main drivers of sea level change at the global scale [63,64], the lateral mass transport fluxes become very significant when considering a semi-enclosed basin area of the world (e.g., the Mediterranean Sea and the sub-basins therein) [65]. Moreover, it is well known that, in addition to the different spatial scale complexities, the sea level change is directly influenced by inter-annual, decadal, and multidecadal climate fluctuations [66,67].
By examining the low-pass filtered function (blue line in Figure 3b) of the SLA monthly values, different trends in the sea level could be recognized since 1993: in a first phase (from 1993 to 2002), the SLA trend was higher (about 3.6 mm/yr), which also denoted a change around 1998, followed by a marked decrease within the period 2003–2008 (−6.6 mm/yr) and then a restoration of positive sea level rise up to 1.34 mm/yr until the present day. This result is in agreement with several studies which identify a fast sea level rise in the Mediterranean Sea during the 1990s (e.g., [68] mainly linked to an increase in sea surface temperature [69]), followed by a stop in the rise during the 2000s [70,71]. The non-stationary behavior in sea level change, causing uncertainties in the prediction of future trends, is partly attributed to its natural variability due to the natural modes of the coupled ocean-atmosphere oscillations such as the NAO (North Atlantic Oscillation). This widely influences the Mediterranean sea level variability [61,70] by modifying both the atmospheric sea level pressure [72,73] and the water mass exchange with the Atlantic [74,75]. For instance, one of the major positive SLA peaks in the Mediterranean Sea was recognized in the winter of 2010 (Figure 3b) and attributed to a markedly low NAO index [76,77], which caused a rise in sea level of about 12 cm [74].
At Lipari, a very significant contribution to the RSL is provided by the VLMs as the subsidence is locally occurring at higher rates than the global sea level rise. As tide gauges are lacking on Lipari, the land-movement component in the relative sea level cannot be derived from that kind of source. In the long-term, the VLMs can be reconstructed only in those sectors of where sea level markers (geological and archaeological) are present. Geoarchaeological and historical evidence, supported by the GNSS data, show the occurrence of a marked subsidence trend in the eastern part of the island, related to volcano–tectonic dynamics [11,30,31]. In these areas, the RSL rise is far larger than the global/absolute sea level rise, and this, together with other factors interacting with the coastal evolution and discussed in the previous section, markedly enhance the exposition of low-lying sectors to effects such as flooding and permanent submergence. The walking surface of the submerged roman age harbor in Marina Lunga is placed at about 9 m below sea level, while the ground floor of the historical buildings facing the beach in the same area are partly permanently flooded (Figure A11). Scenarios of RSL rise, considering the regional IPCC-AR5 projections and by assuming the recorded subsidence rates of the GPS network, indicate that about 12,500 m2 and 17,500 m2 of a 700 m-long stretch of the Marina Lunga waterfront will be permanently flooded by 2100 in the IPCC-AR5 worst climatic scenario [14]. Moreover, under the rise in mean sea level and in the absence of adaptation, these most critical sectors (Figure 13) are increasingly exposed to the growing frequency and intensity of marine ingression and to the impact of extreme storm events, superimposing on gradual changes in the RSL and enhancing coastal erosion (Figure A12). In other coastal stretches, where VLMs are not witnessed and their occurrence/contribution cannot be quantified, the coast in any case will undergo the “global/absolute” sea level component that, as discussed above, is variable in time, causing uncertainties in the prediction of future trends.

6. Conclusions

Through the integration of different geophysical and remote-sensing techniques we have investigated the onshore and offshore low-lying eastern and north-eastern coastal areas of Lipari, with the aim of identifying the most critical coastal stretches presently exposed to coastal erosion and flooding. We considered a multidecadal evolutionary framework, spanning the last 60–70 years, and evidenced the precarious but persistent state of equilibrium of the studied coastal areas, temporarily perturbed by specific natural and anthropogenic processes. Among these, changes in sediment supply due to natural or anthropogenic processes and the construction of human-made structures interfering with longshore drift are responsible for the main observed coastal changes.
Subsidence affects most of the coastal tract under study. In general, subsidence reduces the size and the lifetime of the volcanic islands above sea level, facilitating coastal retreat and increasing marine erosion as wave energy dissipation diminishes [2]. At Lipari, the locally high rates of this phenomenon promote coastal erosion and flooding, particularly in the most populated, low-lying coastal areas of the island. Moreover, in some nearshore sectors of Lipari we have shown the occurrence of submarine canyons heads, erosive features quite common around volcanic islands [78]. On small, reefless volcanic islands in post-eruptive stages, most of the (limited) coastal sediments deriving from cliff erosion can be transported offshore by downwelling currents that develop during storms, stripping these coasts of sandy sediment [2]. The location of canyon heads at a shallow depth may thus induce the capture of nearshore sediments, with negative effects on the sediment littoral budget and on shoreline stability.
The combined role of low sediment supply, subsidence, and sea level rise (together with the urbanization and stiffening of the coast) has reduced the natural defence potential of the studied beaches with respect to storm waves and led to a gradual but continuous shoreline retreat in some of them. Here, the possible disappearance of the beach under the impact of climate change and anthropogenic stress should have important near-future implications in terms of socio-economic resources and risk issues. As in many other Mediterranean islands, in fact, at Lipari part of the local economy depends on beach tourism; furthermore, the infrastructure and cultural heritage sites lying in the coastal area will be threatened. This suggests including Lipari among the UNESCO World Heritage sites at risk from coastal hazard due to sea level rise [79] and points to the need for proper future management. From a general perspective, small and low-lying islands are considered among the most vulnerable sites to climate change impacts and will likely suffer serious adverse effects from them [80,81]. To ensure appropriate adaptation and mitigation strategies, it is necessary to assess the risk profile of each individual island [81]. In this view, the individuation of the most (or potentially) critical coastal sectors of Lipari and of the related driving processes, which we have placed in the wider context of the decadal evolution of the main beaches, is the basis for exposure and vulnerability assessment and for context-specific adaptation measures facing the current and future climate change impacts [81].

Author Contributions

Conceptualization, C.R., D.C., C.V. and A.B.; methodology, C.R., D.C., C.V., A.B., M.A. and M.M.; software, C.V., F.B. and M.M.; validation, A.B. and D.C.; formal analysis, C.V., F.B., M.M. and F.D.; investigation, C.R., D.C., C.V., M.M. and A.B.; resources, C.R., D.C., A.B. and M.A.; data curation, C.R., C.V., D.C., A.B., M.M., M.A., F.D. and F.B.; writing—original draft preparation, C.R.; writing—review and editing, C.R., D.C., A.B., M.M. and M.A.; visualization, A.B. and M.M.; supervision, C.R., A.B. and D.C.; funding acquisition, C.R., D.C. and M.A. All authors have read and agreed to the published version of the manuscript.

Funding

This research benefited from the following funding: the University of Bologna for the acquisition of aerial photographs and software license (C.R.) and the University of Roma-Progetto di Ateneo 2016 (D.C.) for field surveys. The aerial photogrammetry has been carried out in the frame of INGV-DPC-V3 and the European project Savemedcoasts, funded by DGECHO (ECHO/SUB/2016/742473/PREV16, www.savemedcoasts.eu, accessed on 1 January 2022); Multibeam bathymetry has been funded by DPC-INGV V3 Project (“Multi-disciplinary analysis of the relationships between tectonic structures and volcanic activity”).

Data Availability Statement

Not applicable.

Acknowledgments

F. Aiello, P. De Rosa, G. Costanzo and B. Leone are gratefully acknowledged for pictures 2b-9a-9b-11b (F.A.), 2a (P.D.), 2c-2d-A12 (G.C.) and A9b (B.L., NOTIZIARIOEOLIE.IT). The altimetry data used in this study were developed, validated, and distributed by the CTOH/LEGOS, France. The use of aerial photographs A.T.A.-Regione Sicilia have been provided according to authorization 2020-E-2790 to CNR-IGAG. We acknowledge Ministero dell’Ambiente e della Tutela del Territorio e del Mare-Geoportale Nazionale with license Creative Commons 3.0 Italy (CC BY-SA-3.0IT) for providing the terrestrial LIDAR data. The Lipari Municipality P. Lo Cascio and C. Tranne are acknowledged for useful information. We thank the four anonymous reviewers for stimulating discussion and providing suggestions.

Conflicts of Interest

The authors declare no conflict of interest.

Appendix A

Figure A1. (a) Wave climate of Lipari Island (NOAA hindcasting from 1979 to 2009, [35]) represented as the circular histogram of significant wave height (Hs) related to a position to the north-east of Lipari Island (see text for details). The circular histogram in (b) represents the analysis of wave data only from the sector 45°–225°N and allows the better appreciation of the characteristics of waves from this provenance sector. (c) Time series of significant wave heights from the southeastern sector (45°–225°N).
Remotesensing 14 02960 g0a1
Figure A2. Rate of shoreline displacement for Acquacalda beach, estimated by means of DSAS along transects spaced 10 m for the different time intervals and for the overall time span of the analysis.
Remotesensing 14 02960 g0a2
Figure A3. Rate of shoreline displacement for Porticello beach, estimated by means of DSAS along transects spaced 10 m for the different time intervals and for the overall time span of the analysis.
Remotesensing 14 02960 g0a3
Figure A4. Rate of shoreline displacement for Papesca beach, estimated by means of DSAS along transects spaced 10 m for the different time intervals and for the overall time span of the analysis.
Remotesensing 14 02960 g0a4
Figure A5. Rate of shoreline displacement for Canneto beach, estimated by means of DSAS along transects spaced 10 m for the different time intervals and for the overall time span of the analysis.
Remotesensing 14 02960 g0a5
Figure A6. Rate of shoreline displacement for Marina Lunga beach, estimated by means of DSAS along transects spaced 10 m for the different time intervals and for the overall time span of the analysis.
Remotesensing 14 02960 g0a6
Figure A7. Rate of shoreline displacement for Portinente beach, estimated by means of DSAS along transects spaced 10 m for the different time intervals and for the overall time span of the analysis.
Remotesensing 14 02960 g0a7
Figure A8. Backscatter mosaic of selected marine sectors in correspondence with canyon heads at Acquacalda (a), Porticello (b), and Portinente (c), suggesting the occurrence of channelized flows in correspondence with canyon heads. The different backscatter intensity (pale grey/white tones correspond to high backscatter values and dark grey ones to low backscatter) supports the interpretation of the nature of the seabed (outcrop vs. sedimentary cover) and the overall coarser or finer grain size of superficial sediment (see text for details).
Remotesensing 14 02960 g0a8
Figure A9. (a) The pumice exploitation plants at Porticello in the 1960s and 1970s (from https://upload.wikimedia.org/wikipedia/commons/9/94/Lipari_-_La_pomice_-_panoramio.jpg, accessed on 20 June 2022); (b) flash flooding of the Calandra creek in the northern Canneto beach.
Remotesensing 14 02960 g0a9
Figure A10. Along the central and southern part of the Canneto beach, pumice fragments are present both as sparse (a) and concentrated on the berm (b); (c) visual comparison of the 0/−1 Φ1(1–2 mm) grain size fraction sampled in the beach foreshore sediment of Canneto beach from north to south (from LIP5A to LIP5D), showing the downdrift enrichment in the lighter pumice fraction.
Remotesensing 14 02960 g0a10
Figure A11. Flooded ground floor in a building along the coast of Marina Lunga. Until the 1980s, it was used as warehouse, but later, it was abandoned due to sea level rise. Presently, the ground floor is below the local sea level.
Remotesensing 14 02960 g0a11
Figure A12. The Acquacalda village (a) and the Marina Lunga waterfront (b) are increasingly exposed to storm events and marine ingression.
Remotesensing 14 02960 g0a12

References

  1. Romagnoli, C.; Mancini, F.; Brunelli, R. Historical shoreline changes at an active island volcano: Stromboli, Italy. J. Coast. Res. 2006, 22, 739–749. Available online: http://www.jstor.org/stable/4300334 (accessed on 1 April 2022). [CrossRef]
  2. Ramalho, R.S.; Quartau, R.; Trenhaile, A.S.; Mitchell, N.C.; Woodroffe, C.D.; Ávila, S.P. Coastal evolution on volcanic oceanic islands: A complex interplay between volcanism, erosion, sedimentation, sea-level change and biogenic production. Earth-Sci. Rev. 2013, 127, 140–170. [Google Scholar] [CrossRef] [Green Version]
  3. Romagnoli, C.; Jakobsson, S.P. Post-eruptive morphological evolution of island volcanoes: Surtsey as a modern case study. Geomorphology 2015, 250, 384–396. [Google Scholar] [CrossRef]
  4. Zhao, Z.; Mitchell, N.C.; Quartau, R.; Ramalho, R.S.; Rusu, L. Coastal erosion rates of lava deltas around oceanic islands. Geomorphology 2020, 370, 107410. [Google Scholar] [CrossRef]
  5. ISTAT. Rapporto Annuale 2021; ISTAT: Rome, Italy, 2021; p. 271. ISBN1 978-88-458-2054-0. ISBN2 978-88-458-2055-7. Available online: https://www.istat.it/it/archivio/259060 (accessed on 11 April 2022).
  6. Pichler, H. The island of Lipari. Rend. Della Soc. Ital. Mineral. Petrol. 1980, 36, 415–440. [Google Scholar]
  7. Forni, F.; Lucchi, F.; Peccerillo, A.; Tranne, C.A.; Rossi, P.L.; Frezzotti, M.L. Stratigraphy and geological evolution of the Lipari volcanic complex (central Aeolian archipelago). In The Aeolian Islands Volcanoes; Memoirs 37; Lucchi, F., Peccerillo, A., Keller, J., Tranne, C.A., Rossi, P.L., Eds.; Geological Society: London, UK, 2013; pp. 213–279. [Google Scholar] [CrossRef]
  8. Tykot, R.H. Obsidian Procurement and Distribution in the Central and Western Mediterranean. J. Mediterr. Archaeol. 1996, 9, 39–82. [Google Scholar] [CrossRef] [Green Version]
  9. Bernabò Brea, L. Alcune considerazioni sul carico di ceramiche dell’età del Bronzo di Pignataro di Fuori e sugli antichi scali marittimi dell’isola di Lipari. Sicil. Archeol. 1978, 11, 36–42. [Google Scholar]
  10. Tusa, S. Archeologia e Storia nei Mari di Sicilia; Magnus: Vicenza, Italy, 2010; p. 300. [Google Scholar]
  11. Regional Technical Map; Geofabrik GmbH: Karlsruhe, Germany, 2012.
  12. Municipality of Lipari; Lipari, Sicily Region, Italy. Personal communication, 2017.
  13. Calanchi, N.; Lucchi, F.; Pirazzoli, P.A.; Romagnoli, C.; Tranne, C.A.; Radtke, U.; Reyss, J.L.; Rossi, P.L. Late Quaternary relative sea-level changes and vertical movements at Lipari (Aeolian Islands). J. Quat. Sci. 2002, 17, 459–467. [Google Scholar] [CrossRef]
  14. Anzidei, M.; Bosman, A.; Casalbore, D.; Tusa, S.; La Rocca, R. New insights on the subsidence of Lipari island (Aeolian islands, southern Italy) from the submerged Roman age pier at Marina Lunga. Quat. Int. 2016, 401, 162–173. [Google Scholar] [CrossRef]
  15. Bosman, A.; Casalbore, D.; Anzidei, M.; Muccini, F.; Carmisciano, C.; Chiocci, F.L. The first ultra-high resolution Digital Terrain Model of the shallow-water sector around Lipari Island (Aeolian Islands, Italy). Ann. Geophys. 2015, 58, S0218. [Google Scholar] [CrossRef]
  16. Casalbore, D.; Romagnoli, C.; Bosman, A.; Anzidei, M.; Chiocci, F.L. Coastal hazard due to submarine canyons in active insular volcanoes: Examples from Lipari Island (southern Tyrrhenian Sea). J. Coast. Conserv. 2018, 22, 989–999. [Google Scholar] [CrossRef]
  17. Anzidei, M.; Bosman, A.; Carluccio, R.; Casalbore, D.; D’Ajello Caracciolo, F.; Esposito, A.; Nicolosi, I.; Pietrantonio, G.; Vecchio, A.; Carmisciano, C.; et al. Flooding scenarios due to land subsidence and sea-level rise: A case study for Lipari Island (Italy). Terra Nova 2017, 29, 44–51. [Google Scholar] [CrossRef]
  18. De Astis, G.; Ventura, G.; Vilardo, G. Geodynamic significance of the Aeolian volcanism (Southern Tyrrhenian Sea, Italy) in light of structural, seismological, and geochemical data. Tectonics 2003, 22, 1040. [Google Scholar] [CrossRef]
  19. Ventura, G. Kinematics of the Aeolian volcanism (Southern Tyrrhenian Sea) from geophysical and geological data. In The Aeolian Islands Volcanoes; Memoirs 37; Lucchi, F., Peccerillo, A., Keller, J., Tranne, C.A., Rossi, P.L., Eds.; Geological Society: London, UK, 2013; pp. 3–11. [Google Scholar] [CrossRef]
  20. Casalbore, D.; Bosman, A.; Romagnoli, C.; Di Filippo, M.; Chiocci, F.L. Morphology of Lipari offshore (Southern Tyrrhenian Sea). J. Maps 2016, 12, 77–86. [Google Scholar] [CrossRef] [Green Version]
  21. Romagnoli, C. Characteristics and morphological evolution of the Aeolian volcanoes from the study of submarine portions. In The Aeolian Islands Volcanoes; Memoirs 37; Lucchi, F., Peccerillo, A., Keller, J., Tranne, C.A., Rossi, P.L., Eds.; Geological Society: London, UK, 2013; pp. 13–26. [Google Scholar] [CrossRef]
  22. Luigi Salvatore d’Austria. Die Liparischen Inseln. Drittes Heft: Lipari, 1896. In Le Isole Lipari; Paino, P., Ed.; Edinixe: Lipari, Italy, 1982; Volume 3, p. 158. [Google Scholar]
  23. Morrone, C.; De Rosa, R.; Le Pera, E.; Marsaglia, K.M. Provenance of volcaniclastic beach sand in a magmatic-arc setting: An example from Lipari island (Aeolian archipelago, Tyrrhenian Sea). Geol. Mag. 2017, 154, 804–828. [Google Scholar] [CrossRef]
  24. Tripodo, A.; Casella, S.; Pino, P.; Mandarano, M.; Rasa’, R. Geomorphological map of the Lipari volcanic island (Aeolian Archipelago–Italy). J. Maps 2012, 8, 107–112. [Google Scholar] [CrossRef] [Green Version]
  25. Giornale di Lipari Website. Available online: https://www.giornaledilipari.it/calandra-il-torrente-di-pomice/ (accessed on 14 February 2022).
  26. Lipari.biz Website. Available online: https://www.lipari.biz/notizia.asp?idnews=11425. (accessed on 14 February 2022).
  27. Lucchi, F. Late-Quaternary terraced marine deposits as tools for wide-scale correlation of unconformity-bounded units in the volcanic Aeolian archipelago (southern Italy). Sediment. Geol. 2009, 216, 158–178. [Google Scholar] [CrossRef]
  28. Romagnoli, C. L’approdo di Marina Corta: Un porto che scompare. In Guida ai Vulcani e Alla Natura Delle Isole Eolie; Calanchi, N., Lo Cascio, P., Lucchi, F., Rossi, P.L., Tranne, C.A., Eds.; Comune di Lipari: Regione Sicilia, Italy, 2007; pp. 98–102. [Google Scholar]
  29. Mazza, A. Il Cosiddetto “Relitto di Pignataro di Fuori” di Lipari: Una revision del Contest dell’Età del Bronzo a cinquant’anni Dalla sua Scoperta; Arbor Sapientiae Editore: Roma, Italy, 2019; p. 138. ISBN 978-88-94820-79-9. [Google Scholar]
  30. Esposito, A.; Pietrantonio, G.; Bruno, V.; Anzidei, M.; Bonforte, A.; Guglielmino, F.; Mattia, M.; Puglisi, G.; Sepe, V.; Serpelloni, E. Eighteen years of GPS surveys in the Aeolian Islands (southern Italy): Open data archive and velocity field. Ann. Geophys. 2015, 58, S0439. [Google Scholar] [CrossRef]
  31. Mattia, M.; Palano, M.; Bruno, V.; Cannavò, F.; Bonaccorso, A.; Gresta, S. Tectonic features of the Lipari–Vulcano complex (Aeolian archipelago, Italy) from 10 years (1996–2006) of GPS data. Terra Nova 2008, 20, 370–377. [Google Scholar] [CrossRef]
  32. Permanent Service for Mean Sea Level (PSMSL) Website. Available online: http://www.psmsl.org/data/obtaining/ (accessed on 14 February 2022).
  33. Cicala, A. Guida alla Meteorologia Delle Isole Eolie; Aldo Natali Editore: Lipari, Italy, 2000; p. 150. [Google Scholar]
  34. NOAA NWS Website. Available online: https://polar.ncep.noaa.gov/waves/hindcasts/nopp-phase1.php (accessed on 22 February 2022).
  35. Chawla, A.; Spindler, D.M.; Tolman, H.L. Validation of a thirty year wave hindcast using the Climate Forecast System Reanalysis winds. Ocean. Model. 2013, 70, 189–206. [Google Scholar] [CrossRef]
  36. Himmelstoss, E.A.; Henderson, R.E.; Kratzmann, M.G.; Farris, A.S. Digital Shoreline Analysis System (DSAS) Version 5.1 User Guide. In U.S. Geological Survey Open-File Report 2021–1091; U.S. Geological Survey: Reston, VA, USA, 2021; p. 104. [Google Scholar]
  37. Vignudelli, S.; Kostianoy, A.G.; Cipollini, P.; Benveniste, J. Coastal Altimetry; Springer: Berlin, Germany, 2011; p. 578. [Google Scholar]
  38. Birol, F.; Fuller, N.; Lyard, F.; Cancet, M.; Niño, F.; Delebecque, C.; Fleury, S.; Toublanc, F.; Melet, A.; Saraceno, M.; et al. Coastal applications from nadir altimetry: Example of the X-TRACK regional products. Adv. Space Res. 2017, 59, 936–953. [Google Scholar] [CrossRef]
  39. Passaro, M.; Cipollini, P.; Vignudelli, S.; Quartly, G.D.; Snaith, H.M. ALES: A multi-mission adaptive subwaveform retracker for coastal and open ocean altimetry. Remote Sens. Environ. 2014, 145, 173–189. [Google Scholar] [CrossRef] [Green Version]
  40. Roblou, L.; Lamouroux, J.; Bouffard, J.; Lyard, F.; Le Hénaff, M.; Lombard, A.; Marsaleix, P.; De Mey, P.; Birol, F. Post-processing altimeter data towards coastal applications and integration into coastal models. In Coastal Altimetry; Vignudelli, S., Kosianoy, A., Cipollini, P., Benveniste, J., Eds.; Springer: Berlin, Germany, 2011; pp. 217–246. [Google Scholar] [CrossRef]
  41. Cipollini, P.; Calafat, F.M.; Jevrejeva, S.; Melet, A.; Prandi, P. Monitoring sea level in the coastal zone with satellite altimetry and tide gauges. Surv. Geophys. 2017, 38, 33–57. [Google Scholar] [CrossRef] [Green Version]
  42. CTOH LEGOS Website. Available online: https://doi.org/10.6096/CTOH_X-TRACK_2017_02 (accessed on 14 February 2022).
  43. Peltier, W.R.; Argus, D.F.; Drummond, R. Space geodesy constrains ice-age terminal deglaciation: The global ICE-6G_C (VM5a) model. J. Geophys. Res. Solid Earth 2015, 120, 450–487. [Google Scholar] [CrossRef] [Green Version]
  44. Zervas, C.E. Sea Level Variations of the United States, 1854–1999; NOAA Technical Report NOS CO-OPS 36; U.S. Dept. of Commerce, National Oceanic and Atmospheric Administration, National Ocean Service: Silver Spring, MD, USA, 2001; p. 201. [Google Scholar]
  45. UNESCO; World Heritage Committee. Mission Report Aeolian Islands (Italy (908): Paris (FR); UNESCO: Paris, France, 2007; p. 31. [Google Scholar]
  46. Klein, A.H.F.; Benedet Filho, L.; Schumacher, D.H. Short-term beach rotation processes in distinct headland bay beach systems. J. Coast. Res. 2002, 18, 442–458. [Google Scholar]
  47. Kron, W. Coasts: The high-risk areas of the world. Nat. Hazards 2013, 66, 1363–1382. [Google Scholar] [CrossRef]
  48. Ranasinghe, R. Assessing climate change impacts on open sandy coasts: A review. Earth-Sci. Rev. 2013, 160, 320–332. [Google Scholar] [CrossRef] [Green Version]
  49. Luijendijk, A.; Hagenaars, G.; Ranasinghe, R.; Baart, F.; Donchyts, G.; Aarninkhof, S. The State of the World’s Beaches. Sci. Rep. 2018, 8, 6641. [Google Scholar] [CrossRef]
  50. Nicholls, R.J.; Lincke, D.; Hinkel, J.; Brown, S.; Vafeidis, A.T.; Meyssignac, B.; Hanson, S.E.; Merkens, J.-L.; Fang, J. A global analysis of subsidence, relative sea-level change and coastal flood exposure. Nat. Clim. Chang. 2021, 11, 338–342. [Google Scholar] [CrossRef]
  51. Vousdoukas, M.I.; Ranasinghe, R.; Mentaschi, L.; Plomaritis, T.A.; Athanasiou, P.; Luijendijk, A.; Feyen, L. Sandy coastlines under threat of erosion. Nat. Clim. Chang. 2020, 10, 260–263. [Google Scholar] [CrossRef]
  52. Oppenheimer, M.; Glavovic, B.C.; Hinkel, J.; van de Wal, R.; Magnan, A.K.; Abd-Elgawad, A.; Cai, R.; Cifuentes-Jara, M.; DeConto, R.M.; Ghosh, T.; et al. Sea Level Rise and Implications for Low-Lying Islands, Coasts and Communities. In IPCC Special Report on the Ocean and Cryosphere in a Changing Climate; Pörtner, H.-O., Roberts, D.C., Masson-Delmotte, V., Zhai, P., Tignor, M., Poloczanska, E., Mintenbeck, K., Alegrìa, A., Nicolai, M., Okem, A., et al., Eds.; in press; Available online: https://www.ipcc.ch/srocc/chapter/chapter-4-sea-level-rise-and-implications-for-low-lying-islands-coasts-and-communities/ (accessed on 25 December 2020).
  53. Casalbore, D.; Chiocci, F.L.; Scarascia Mugnozza, G.; Tommasi, P.; Sposato, A. Flash-flood hyperpycnal flows generating shallow-water landslides at Fiumara mouths in Western Messina Strait (Italy). Mar. Geophys. Res. 2011, 32, 257–271. [Google Scholar] [CrossRef]
  54. Alberico, I.; Casalbore, D.; Pelosi, N.; Tonielli, R.; Calidonna, C.; Dominici, R.; De Rosa, R. Remote sensing and field survey data integration to investigate on the evolution of the coastal area. The case study of Bagnara Calabra (Southern Italy). Remote Sens. 2022, 14, 2459. [Google Scholar] [CrossRef]
  55. Dangendorf, S.; Hay, C.; Calafat, F.M.; Marcos, M.; Piecuch, C.G.; Berk, K.; Jensen, J. Persistent acceleration in global sea-level rise since the 1960s. Nat. Clim. Chang. 2019, 9, 705–710. [Google Scholar] [CrossRef] [Green Version]
  56. Frederikse, T.; Landerer, F.; Caron, L.; Adhikari, S.; Parkes, D.; Humphrey, V.W.; Dangendorf, S.; Hogarth, P.; Zanna, L.; Cheng, L.; et al. The causes of sea-level rise since 1900. Nature 2020, 584, 393–397. [Google Scholar] [CrossRef]
  57. Ablain, M.; Meyssignac, B.; Zawadzki, L.; Jugier, R.; Ribes, A.; Spada, G.; Benveniste, J.; Cazenave, A.; Picot, N. Uncertainty in satellite estimates of global mean sea-level changes, trend and acceleration. Earth Syst. Sci. Data 2019, 11, 1189–1202. [Google Scholar] [CrossRef] [Green Version]
  58. Lambeck, K.; Antonioli, F.; Anzidei, M.; Ferranti, L.; Leoni, G.; Scicchitano, G.; Silenzi, S. Sea level change along the Italian coast during the Holocene and projections for the future. Quat. Int. 2011, 232, 250–257. [Google Scholar] [CrossRef]
  59. Anzidei, M.; Lambeck, K.; Antonioli, F.; Furlani, S.; Mastronuzzi, G.; Serpelloni, E.; Vannucci, G. Coastal structure, sea-level changes and vertical motion of the land in the Mediterranean. Geol. Soc. Lond. Spec. Publ. 2014, 388, 453–479. [Google Scholar] [CrossRef]
  60. Horwath, M.; Gutknecht, B.D.; Cazenave, A.; Palanisamy, H.K.; Marti, F.; Marzeion, B.; Paul, F.; Le Bris, R.; Hogg, A.E.; Otosaka, I.; et al. Global sea-level budget and ocean-mass budget, with a focus on advanced data products and uncertainty characterization. Earth Syst. Sci. Data 2022, 14, 411–447. [Google Scholar] [CrossRef]
  61. Mohamed, B.; Abdallah, A.M.; Alam El-Din, K.; Nagy, H.; Shaltout, M. Inter-Annual Variability and Trends of Sea Level and Sea Surface Temperature in the Mediterranean Sea over the Last 25 years. Pure Appl. Geophys. 2019, 176, 3787–3810. [Google Scholar] [CrossRef]
  62. Meli, M.; Olivieri, M.; Romagnoli, C. Sea-Level Change along the Emilia-Romagna Coast from Tide Gauge and Satellite Altimetry. Remote Sens. 2021, 13, 97. [Google Scholar] [CrossRef]
  63. Meier, M.F.; Dyurgerov, M.B.; Rick, U.K.; O’Neel, S.; Pfeffer, W.T.; Anderson, R.S.; Anderson, S.P.; Glazovsky, A.F. Glaciers dominate Eustatic sea-level rise in the 21st century. Science 2007, 317, 1064–1067. [Google Scholar] [CrossRef] [PubMed] [Green Version]
  64. Slangen, A.B.A.; Church, J.A.; Zhang, X.; Monselesan, D. Detection and attribution of global mean thermosteric sea-level change. Geophys. Res. Lett. 2014, 41, 5951–5959. [Google Scholar] [CrossRef]
  65. Pinardi, N.; Zavatarelli, M.; Adani, M.; Coppini, G.; Fratianni, C.; Oddo, P.; Simoncelli, S.; Tonani, M.; Lyubartsev, V.; Dobricic, S.; et al. Mediterranean Sea large-scale low-frequency ocean variability and water mass formation rates from 1987 to 2007: A retrospective analysis. Prog. Oceanogr. 2015, 132, 318–332. [Google Scholar] [CrossRef]
  66. Holgate, S.J. On the decadal rates of sea level change during the twentieth century. Geophys. Res. Lett. 2007, 34, L01602. [Google Scholar] [CrossRef] [Green Version]
  67. Woodworth, P.L.; White, N.J.; Jevrejeva, S.; Holgate, S.J.; Church, J.A.; Gehrels, W.R. Evidence for the accelerations of sea level on multi-decade and century timescales. Int. J. Climatol. 2009, 29, 777–789. [Google Scholar] [CrossRef]
  68. Tsimplis, M.N.; Alvarez-Fanjul, E.; Gomis, D.; Fenoglio-Marc, L.; Perez, B. Mediterranean Sea level trends: Atmospheric pressure and wind contribution. Geophys. Res. Lett. 2005, 32, L20602. [Google Scholar] [CrossRef]
  69. Cazenave, A.; Cabanes, C.; Dominh, K.; Mangiarotti, S. Recent sea level changes in the Mediterranean Sea revealed by TOPEX/POSEIDON satellite altimetry. Geophys. Res. Lett. 2001, 28, 1607–1610. [Google Scholar] [CrossRef]
  70. Vigo, M.I.; Sanchez-Reales, J.M.; Trottini, M.; Chao, B.F. Mediterranean Sea level variations: Analysis of the satellite altimetric data, 1992–2008. J. Geodyn. 2011, 52, 271–278. [Google Scholar] [CrossRef] [Green Version]
  71. Criado-Aldeanueva, F.; Del Río, J.; Vera, J.G.-L. Steric and mass-induced Mediterranean sea level trends from 14 years of altimetry data. Glob. Planet. Chang. 2008, 60, 563–575. [Google Scholar] [CrossRef]
  72. Tsimplis, M.N.; Josey, S.A. Forcing of the Mediterranean Sea by atmospheric oscillations over the North Atlantic. Geophys. Res. Lett. 2001, 28, 803–806. [Google Scholar] [CrossRef] [Green Version]
  73. Calafat, F.M.; Chambers, D.P.; Tsimplis, M.N. Mechanisms of decadal sea level variability in the eastern North Atlantic and the Mediterranean Sea. J. Geophys. Res. Oceans 2012, 117, C09022. [Google Scholar] [CrossRef]
  74. Tsimplis, M.N.; Calafat, F.M.; Marcos, M.; Jordà, G.; Gomis, D.; Fenoglio-Marc, L.; Struglia, M.V.; Josey, S.; Chambers, D.P. The effect of the NAO on sea level and on mass changes in the Mediterranean Sea. J. Geophys. Res. Oceans 2013, 118, 944–952. [Google Scholar] [CrossRef] [Green Version]
  75. Fenoglio-Marc, L.; Mariotti, A.; Sannino, G.; Meyssignac, B.; Carillo, A.; Struglia, M.V.; Rixen, M. Decadal variability of net water flux at the Mediterranean Sea Gibraltar Strait. Glob. Planet. Chang. 2013, 100, 1–10. [Google Scholar] [CrossRef] [Green Version]
  76. Landerer, F.W.; Volkov, D.L. The anatomy of recent large sea level fluctuations in the Mediterranean Sea. Geophys. Res. Lett. 2013, 40, 553–557. [Google Scholar] [CrossRef]
  77. Bonaduce, A.; Pinardi, N.; Oddo, P.; Spada, G.; Larnicol, G. Sea-level variability in the Mediterranean Sea from altimetry and tide gauges. Clim. Dyn. 2016, 47, 2851–2866. [Google Scholar] [CrossRef] [Green Version]
  78. Babonneau, N.; Delacourt, C.; Cancouët, R.; Sisavath, E.; Bachèlery, P.; Mazuel, A.; Jorry, S.J.; Deschamps, A.; Ammann, J.; Villeneuve, N. Direct sediment transfer from land to deep-sea: Insights into shallow multibeam bathymetry at La Réunion Island. Mar. Geol. 2013, 346, 47–57. [Google Scholar] [CrossRef] [Green Version]
  79. Reimann, L.; Vafeidis, A.T.; Brown, S.; Hinkel, J.; Tol, R.S.J. Mediterranean UNESCO World Heritage at risk from coastal flooding and erosion due to sea-level rise. Nat. Commun. 2018, 9, 4161. [Google Scholar] [CrossRef] [Green Version]
  80. Duvat, V.K.E.; Magnan, A.K.; Wise, R.M.; Hay, J.E.; Fazey, I.; Hinkel, J.; Stojanovic, T.; Yamano, H.; Ballu, V. Trajectories of exposure and vulnerability of small islands to climate change. WIREs Clim. Chang. 2017, 8, e478. [Google Scholar] [CrossRef] [Green Version]
  81. Nurse, L.A.; McLean, R.F.; Agard, J.; Briguglio, L.P.; Duvat-Magnan, V.; Pelesikoti, N.; Tompkins, E.; Webb, A. Small islands. In Climate Change 2014: Impacts, Adaptation, and Vulnerability; Part B A.N.: Regional Aspects. Contribution of Working Group II to the Fifth Assessment Report of the Intergovernmental Panel on Climate Change; Barros, V.R., Field, C.B., Dokken, D.J., Mastrandrea, M.D., Mach, K.J., Bilir, T.E., Chatterjee, M., Ebi, K.L., Estrada, Y.O., Genova, R.C., et al., Eds.; Cambridge University Press: Cambridge, UK; New York, NY, USA, 2014; pp. 1613–1654. [Google Scholar]
Figure 1. High-resolution digital elevation model of Lipari Island and offshore sectors (contour depths in meters), with location of the coastal areas under study. Red boxes and color dots represent the areas of the maps and the location of the pictures reported in the following figures, respectively. Red triangles represent the location of subsident historical–archaeological sites (see text for details). The position of the main canyon and channel heads affecting the eastern coastal area of Lipari in shallow water is also indicated, together with that of other submarine features cited in the text (IS: insular shelf, SDT: submarine depositional terrace). In the inset: location of the Aeolian Islands in the southern Tyrrhenian Sea.
Remotesensing 14 02960 g001
Figure 2. Coastal areas in the eastern and north-eastern Lipari sector particularly affected by flooding during storm surges: (a) Marina Lunga, (b) Canneto, (c,d) Acquacalda. Location of pictures is in Figure 1 through respective colored dots.
Remotesensing 14 02960 g002
Figure 3. (a) Location of track 059 (red dotted line) of X-TRACK across southern Tyrrhenian Sea; the yellow dot highlights the position of the data considered in this work; (b) monthly mean SLA time series (black) with linear trend (red) and superimposed Lowess smoothing (blue).
Remotesensing 14 02960 g003
Figure 4. Panoramic view of the Acquacalda bay (a) and zoom of the central (b) and the western side (c). Location of pictures is in Figure 1 through respective colored dots.
Remotesensing 14 02960 g004
Figure 5. Map of Acquacalda sector, with zoomed areas in the western (a) and eastern (b) part of the beach and selected shorelines. See Figure 1 for location of both maps. White arrows show the active canyon heads located in the nearshore.
Remotesensing 14 02960 g005
Figure 6. (a) Pumice exploitation plants in 2017. Note the location of the small pumice quarry upslope from the eastern edge of the Acquacalda beach; (b) the coast to the south of Porticello where some pumice excavation waste materials still reach the beach. The location of this picture is in Figure 1 through the respective colored dot; its point of view is indicated in (a).
Remotesensing 14 02960 g006
Figure 7. Zoomed maps of Porticello (a) and Papesca (b) sectors and selected shorelines. The white dotted line in (a)represents the location of the boarding jetty built in front of the pumice exploitation plant; white arrows show the active canyon heads located in the nearshore. See Figure 1 for location of both maps.
Remotesensing 14 02960 g007
Figure 8. Images of Papesca beach from the end of 1970s to the beginning of the 1980s (a,b), showing the large extension of the beach at that time, due to abundant supply of pumice fragments moved by the littoral drift. Today (c), the same beach appears severely retreated (compare images with respect to the cliff in the background) and pumice fragments are locally accumulated only as narrow white stripes on the beach ridges. Location of pictures is in Figure 1 through the respective red-colored dot.
Remotesensing 14 02960 g008
Figure 9. (a) Image of Canneto bay, with the central pier intercepting the littoral drift from N to S. The submerged breakwaters are also visible in the coastal area, south of the pier; (b) image of the southernmost beach of Canneto during a storm. Location of pictures is in Figure 1 through respective colored dots.
Remotesensing 14 02960 g009
Figure 10. Map of the northern Canneto sector and selected shorelines. White arrows show the active canyon heads located in the nearshore. Location in Figure 1.
Remotesensing 14 02960 g010
Figure 11. Map of Marina Lunga central-southern sector (a) with selected reconstructed shorelines; white arrows show the active canyon heads located in the nearshore. (b) Marina Lunga beach after the construction of groynes. See Figure 1 for location.
Remotesensing 14 02960 g011
Figure 12. Map of Baia Portinente beach and related reconstructed shorelines (a) and image of the setting in November 2017 (b); see Figure 1 for location. White arrow shows the active canyon heads located in the nearshore.
Remotesensing 14 02960 g012
Figure 13. Sketch of drainage basins and fluvial network in the eastern and north-eastern sectors of Lipari Island. Main coastal areas critical for coastal erosion and flooding are indicated with red lines (dashed red line indicates sectors that are “potentially critical”; they are maintained in a precarious equilibrium state by man-made activities, such as defense interventions). The location of the active canyon heads located in the nearshore and the direction of the main littoral drift are also indicated.
Remotesensing 14 02960 g013
Table 1. Data used for reconstructing the shoreline variations through traditional aerial photographs and UAV-based surveys. IGM: Istituto Geografico Militare, Italy; A.T.A: Assessorato Territorio e Ambiente, Regione Sicilia, Italy.
DateScale/Ground Sample DistanceSource
28 October 19541:36,000IGM
15 July 19671:28,000IGM
June 19781:10,000Regione Sicilia (A.T.A)
5 July 19871:10,000Regione Sicilia (A.T.A.)
30 October 19951:40,000IGM
25 July 20051:28,000IGM
17 June 20101:10,000Geoportale Nazionale
2012–20131:10,000Regione Sicilia (A.T.A.)
September 20140.02 mUAV Survey
21 September 20170.02 mUAV Survey
Publisher’s Note: MDPI stays neutral with regard to jurisdictional claims in published maps and institutional affiliations.

