Abstract
The Next Generation Gravity Mission (NGGM), currently in a feasibility study phase as a candidate Mission of Opportunity for ESA-NASA cooperation in the frame of the Mass Change and Geo-Sciences International Constellation (MAGIC), is designed to monitor mass transport in the Earth system by its variable gravity signature with increased spatial and temporal resolution. The NGGM will be composed by a constellation of two pairs of satellites, each providing the measurement of two quantities from which the map of Earth’s gravity field will be obtained: the variation of the distance between two satellites of each pair, measured by a laser interferometer with nanometer precision; and the relative non-gravitational acceleration between the centers of mass of each satellite pair, measured by ultra-sensitive accelerometers. This article highlights the importance of the second “observable” in the reconstruction of the lower harmonics of Earth’s gravity field, by highlighting the tight control requirements in linear and angular accelerations and angular rates, and the expectable performances from the drag-free, attitude, and orbit control system (DFAOCS) obtained through an end-to-end (E2E) simulator. The errors resulting from different mission scenarios with varying levels of drag-free control and pointing accuracy are then presented, demonstrating that a high-performance accelerometer alone is not sufficient to achieve the measurement quality necessary to achieve the mission objectives, if the spacecraft does not provide to this sensor a suitable drag-free environment and a precise and stable pointing. The consequences of these different mission scenarios on the gravity field retrieval accuracy, especially for the lower spherical harmonic degrees, are computed in order to quantitatively justify the rationale for these capabilities on the NGGM spacecraft.
1. Introduction
All geophysical phenomena involving mass displacements (such as hydrological cycles, floods, drying of water reserves, glaciers melting, tectonic movements) can be “observed” through the variation they induce in Earth’s gravity field. Monitoring these phenomena on a global scale and over a long period provides essential information to study climate change evolution, manage natural resources, preserve ecosystems, and prevent and contain natural hazards [1], and space missions are the most appropriate means to perform this task. The use of satellites for Earth’s gravity field determination dates back to the launch of the first Sputnik in 1957, while the idea of using tracking between spacecraft for gravimetry was spelled out already in 1960 [2], becoming more concrete in 1969 [3].
From 2002 to 2017, the Gravity Recovery And Climate Experiment (GRACE) Mission [4] produced monthly maps of Earth’s gravity field; a service that since 2018 is carried out by the GRACE-Follow On (GFO) Mission [5]. In both missions, a pair of satellites flying at a mean relative distance of 220 km on a circular low-Earth orbit (initially at 500 km altitude) with near-polar inclination “observes” the gravitational potential through its effect on the variation of the satellite-to-satellite distance (measured by a dual-band microwave 24–23 GHz ranging instrument), “cleaned” from the contribution of the non-gravitational forces (measured by very sensitive accelerometers). GRACE satellites were mostly left to decay under the action of the atmospheric drag down to about 320 km at the end of the extended mission’s lifetime, with the consequence that the ground track pattern was changing continuously. The GFO satellites [5] were launched in May 2018 and are meant to continue the GRACE time series for at least five years. The satellite design is inherited from GRACE but includes a laser ranging interferometer (LRI) as a technology demonstration of a more precise ranging capability.
In parallel to the GRACE Mission, the European Space Agency launched its first Earth Explorer satellite for gravimetry in 2009: the Gravity Field and Steady-State Ocean Circulation Explorer (GOCE) [6]. Unlike GRACE and GFO (aimed at the long-term monitoring of Earth’s gravity variations at coarse spatial, from 500 to 300 km, and temporal, 1 month, resolution), the GOCE Mission objectives were to measure Earth’s static gravity field and model the geoid with unprecedented accuracy and spatial resolution. The GOCE satellite was orbiting from 2009 to 2013 at a mean altitude of 255 km (nominal mission) and 225 km (extended mission) in the drag-free mode. The measurement instrument was a gravity gradiometer, consisting of six ultra-precise accelerometers, complemented by a dual-frequency GPS receiver. The measurements of these instruments were used to derive gravity gradients and precise orbits, which were transformed into a gravity map of Earth with a mean global accuracy of 2 cm on geoid heights and 0.5 mGal on gravity anomalies, at 100 km spatial resolution [7]. The low controlled altitude, the drag compensation control (so-called “drag-free”), and the accurate angular accelerations measured as a by-product of the gradiometer payload were all instrumental in GOCE’s outstanding result. The GOCE Mission’s concept and technology have been enabling for the ultra-sensitive payload for the Microscope Mission, and have paved the way to the future NGGM [8], as explained later on.
Soon after the selection of GOCE as its first Earth Explorer (1999), the ESA started preparatory studies towards the NGGM. Since the mid-2000s, these studies have focused on a mission concept devoted to the sustained observation and quantification of mass transport processes in the Earth system, encompassing AOHIS (atmosphere, ocean, hydrology, ice, solid-earth), over a decade-long time span. Preferred mission concepts fitting the defined programmatic boundary conditions were identified in the “Assessment of a Next Generation Gravity Mission to Monitor the Variations of the Earth’s Gravity Field” and studied with prioritized science requirements and detailed system designs. These activities received precious inputs from the in-flight lessons learnt from the GOCE and GRACE missions [9]. The scientific studies aimed at complementing the technology studies, consolidating the science requirements, and focusing on the optimization of the satellite constellation, and advancing the gravity field retrieval algorithms. Notably, the science studies [10,11] produced a detailed assessment of the impact on the gravity field solutions of ocean tide aliasing, which was found to cause larger errors than non-tidal signals, and developed ocean tide mitigation strategies to be applied in post-processing.
To prepare the technology required for the NGGM concept, several complementary studies were initiated within the former Technology Research Programme (TRP), covering attitude and drag-free control aspects [12], electric propulsion elements (miniaturized radiofrequency ion thrusters [13] and indium-fed micro-thrusters [14]), breadboarding of a high-stability laser [15] with fiber amplifier, and a frequency stabilization unit for the interferometric measurements of the inter-satellite distance variation.
The focus of the ESA’s architectural (pre-Phase A) studies was the optimal combination of the orbit and the mission lifetime, being a design driver for the satellite system. As for all gravity missions, the orbit shall be as low as possible, while the mission lifetime was intended to cover a full solar cycle, i.e., 11 years. The technical solution to this set of requirements was found in developing a sophisticated attitude and orbit control system that is based on electric propulsion, where eight smaller ion thrusters (baselined given the higher gridded ion engine maturity), supported by three magnetic torquers, control the attitude of the satellites, and one larger ion thruster compensates for the effect of drag in the along-track direction [16]. Concerning the laser ranging instrument, two options were investigated in Nicklaus et al. [17]: an optical transponder and a retroreflector scheme. The transponder scheme is very similar to the laser ranging instrument (LRI) of the GFO mission, where a laser beam, generated on one satellite, is received by the other satellite, which regenerates the laser with its own laser source and retransmits the laser beam back to the first satellite. In contrast, in the retroreflector scheme, a heterodyne laser interferometer transmits a laser beam from one satellite, which is passively reflected by the other satellite. At the time of writing, the transponder scheme is baselined in the feasibility studies of the NGGM Phase A studies.
On the basis of the objectives and requirements expressed by the International Union of Geodesy and Geophysics (IUGG) [1], the NASA/ESA Interagency Gravity Science Working Group (IGSWG) [18], the US Decadal Survey for Earth Science and Applications from Space (DS) [19], ESA, and NASA are jointly coordinating the Phase A studies of the Mass Change Designed Observable (MCDO) and the Next Generation Gravity Mission (NGGM) within the Mass Change And Geosciences International Constellation (MAGIC).
The paper addresses first the NGGM objectives, the measurement technique of Earth’s gravity field, the fundamental observables, and their measurement requirements by highlighting their role in the achievement of the mission performance. Then, it explains the relation between the measurement of the non-gravitation acceleration and the control of the drag forces and of the spacecraft attitude; from the characteristics of the reference accelerometer and its coupling factors, the requirements on drag and attitude control are derived and compared with the NGGM orbital environment. Finally, the impact of a partial or total lack of drag control and of a coarse attitude control on the measurement error of the non-gravitational acceleration is provided with the consequent implications on the gravity field retrieval.
2. NGGM Objectives, Measurement Technique, and Fundamental Observables
2.1. User’s Need and Objectives of the Next Generation Gravity Mission
The results of the GRACE, GOCE, and GFO missions induced the user’s community to invoke continuity and evolutions of gravity missions to observe the mass changes and transport processes in the Earth system. The main thematic fields and phenomena which shall be investigated by NGGM are based on users and scientific needs collected in the reference documents [1,18,19]. They are summarized in Table 1 together with the required measurement accuracy (threshold and goal levels) of the Earth’s gravity signal produced by the phenomenon/event to be monitored, expressed in terms of equivalent water height (i.e., the height of a water layer over a region with the size equal to the required spatial resolution that produces the gravity signal corresponding to that phenomenon/event). Note: only the measurement accuracy associated to the minimum time scales plus long-term trends and to the minimum spatial resolutions of the phenomenon/event to be monitored are reported in Table 1 by way of example; the complete set of requirements at all resolutions can be found in [1,18,19].

Table 1.
Thematic fields and geophysical phenomena/events/quantities investigated by NGGM.
The scientific objectives for NGGM can be synthetized in the measurement of the geoid with an accuracy of 1 mm at a spatial resolution of 500 km every 3 days and 150 km every 10 days [9]. The achievement of these objectives will constitute a significant improvement in the monitoring of Earth’s gravity field and of the underlying geophysical phenomena listed in Table 1 by one order of magnitude or more with respect to the current state-of-the-art represented by GRACE and GFO. In fact, a single pair of satellites, flying on a near-polar orbit with an uncontrolled altitude cannot meet the operational and global user’s community needs as identified by IUGG [1] and support key applications like the careful management of the fresh water and other natural resources. Acceleration measurement errors (e.g., temperature-induced bias drifts), the relatively high and variable altitude (i.e., natural orbit decay), and the one-dimensional near North–South sampling away from the poles are known to affect the GRACE and GFO gravity model quality. Improvements to the spacecraft design (thermal control, attitude measurement, and control) can help to reduce systematic errors. Beyond that, however, the errors are dominated by the aliasing due to the coarse temporal sampling, limited to a monthly resolution in GRACE and GFO. Even a substantially improved instrument such as the LRI cannot be fully exploited due to the uncertainties in the aliasing reduction modeling of high-frequency ocean and atmospheric mass variations [20]. A future gravity mission dedicated to monitoring mass changes in the Earth system, as studied in the context of a Next Generation Gravity Mission [8], will therefore require improvements in the instrumentation, the spacecraft (disturbing accelerations), and the mission design (sampling). In particular, a single satellite pair must evolve in a dual-pair “Bender constellation” [21] with a controlled orbit altitude to reduce the aliasing errors by increasing the temporal resolution from one month to one week or less, while providing a homogenous spatial resolution high enough for the investigation of the phenomena of interest. Notably, by choosing the optimal orbit constellations for the two pairs of satellites (i.e., the orbit periods, inclinations, repeat cycles and sub-cycles, the relative orientation of the lines of nodes, etc.), high frequency mass variations will be observable and temporal aliasing errors from under-sampling will not be the limiting factor anymore [22].
2.2. The Satellite-To-Satellite Tracking Technique and the NGGM Scenario
The NGGM will measure Earth’s gravity field and its variation in time by means of the low-low satellite-to-satellite tracking (ll-SST) technique already successfully applied on GRACE and GFO. The ll-SST concept is illustrated in Figure 1. When two satellites fly along the same orbital path with a certain separation, the leading satellite (S1 in Figure 1) is subject to the gravitational force exerted by an overflown geographical area in advance of the trailing satellite (S2 in Figure 1) or, equivalently, at any given time the two satellites are subject to slightly different gravitational forces: FG1, FG2. The resulting effect is a continuous variation (ΔdG) of the distance d between the centers of mass (CoM) of the two satellites.
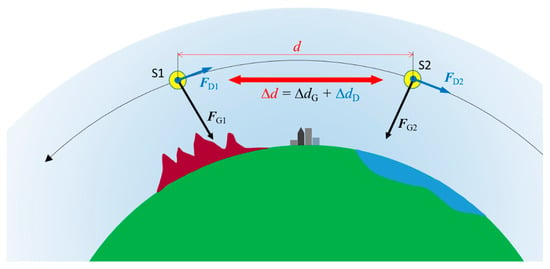
Figure 1.
Principle of the low-low satellite-to-satellite tracking technique.
To increase the amplitude of Earth’s gravity field components experienced by the satellite pair, the altitude of their orbit must be as low as possible, in a range where the non-gravitational force on the spacecraft produced by the atmospheric drag is non-negligible. As the satellites are separated along the orbital path, at any given time they fly across atmospheric regions of a different density with different velocity direction; moreover, the coupling of each spacecraft with the drag (function of the attitude and the surface temperature and scattering coefficient) is not identical. Consequently, the two satellites are subject to slightly different drag forces: FD1, FD2. The resulting effect is a continuous variation of the inter-satellite distance produced by the non-gravitational force (ΔdD) that, together with ΔdG, contributes to the overall CoM-to-CoM distance variation: Δd = ΔdG + ΔdD.
Ground coverage is another key factor in monitoring Earth’s gravity field with a high spatial and temporal resolution. The optimal solution identified to achieve this objective is constituted by two pairs of satellites (S1, S2 and S3, S4) arranged to form a “Bender constellation” [21]: one pair flying in a near-polar circular orbit and one pair in a medium inclination circular orbit, as illustrated in Figure 2. By properly selecting the mean altitudes (and so the periods) and the inclinations of the two orbits, it is possible to obtain a dense, homogenous coverage of Earth’s surface even in a short period (one week or less), during which sufficient measurements can be collected for obtaining accurate solutions of the gravity field with spatial resolutions <500 km.
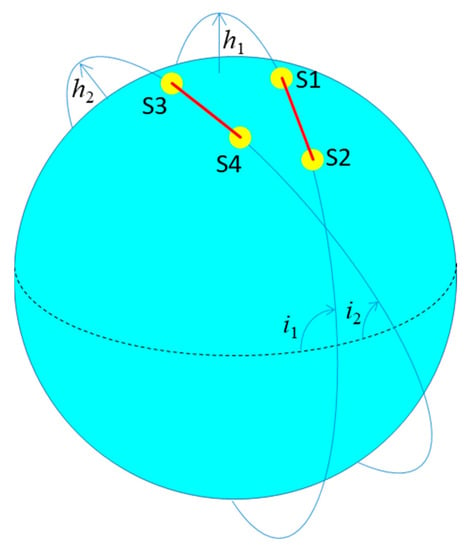
Figure 2.
Arrangement of two satellite pairs (S1-S2, S3-S4) in “Bender Constellation”.
The orbit optimization of the Bender constellation is a complex problem: concerning a survey on the algorithms developed and used for such a scope, we invite the reader to refer to the publication [23]. In a nutshell, all these approaches have the drawback that they optimize the orbits for a single temporal resolution, whereas multiple temporal resolutions are required to serve the needs of all users. For this reason, a new orbit selection approach that aims at optimizing the spatial sampling of the Bender constellation for multiple temporal resolutions [24] was developed. The approach was successfully used for generating the orbits in a number of ESA-funded simulation studies: recently, in ref. [23], a method to select a definite number of orbits to achieve the NGGM/MAGIC user requirements has been defined and used. The outcome coincides with a set of seven orbits, which has been further investigated and expanded in the current feasibility phase of the mission. Priority has been given to sub-cycles of 3, 5, and 7 days to achieve a high temporal resolution and its relevance for emergency and near-real-time (i.e., daily to sub-weekly) products. For selecting the candidate orbits, the “ground track homogeneity” has been defined and chosen as one of the two weighting parameters, together with the regular and common longitude shift. Finally, taking into account altitude constraints together with engineering requirements, the proposed sets of orbits in Table 3 of ref. [23] guarantee an excellent homogeneity and sampling, including a matching ground-track longitude shift for the two pairs.
The parameters of a suitable choice of orbits for the NGGM Bender constellation are provided in Table 2.

Table 2.
Orbital parameters of a Bender constellation suitable for the NGGM.
The selection of the inter-satellite distance depends on the spatial wavelengths of the gravity field to be retrieved, and on the orbit altitude [25]. Given the mission objectives and altitude range of the NGGM constellation, a reference inter-satellite distance d = 220 km (i.e., the same average distance of the GFO satellites) has been preliminarily identified for NGGM within the Phase A study.
2.3. NGGM Fundamental Observables and Measurement Requirements
With the ll-SST technique, Earth’s gravity field is reconstructed from its effect on the CoM-to-CoM distance variation ΔdG. However, ΔdG is not directly measurable. Instead, the overall distance variation Δd can be measured with a suitable metrology, which in the NGGM will consist of a high-performance laser interferometer, such as that embarked on the GFO as a technological demonstrator [26]. This quantity must therefore be complemented by a highly accurate measurement of the non-gravitational accelerations of the satellite’s CoM (aDi = FDi/mi, mi = mass of satellite Si), from which the component of the differential acceleration along the satellite-to-satellite direction (ΔaD = aD1 − aD2) and the resulting distance variation ΔdD can be obtained and separated from Δd, so as to isolate just the effect caused by Earth’s gravity alone (ΔdG).
The requirements on the stochastic measurement errors of the two fundamental observables (Δd, ΔaD) in the measurement bandwidth of the NGGM (from 1 mHz to 100 mHz) are expressed in terms of amplitude spectral density (ASD) and are shown in Figure 3 (for d = 220 km) and Figure 4. They have been derived as a function of the minimum (threshold) objectives and the more ambitious ones (goal) established by the user’s community of the NGGM products, described in Section 2.1, taking also into account the intrinsic limitations of the measurement instruments (laser interferometer and accelerometers).
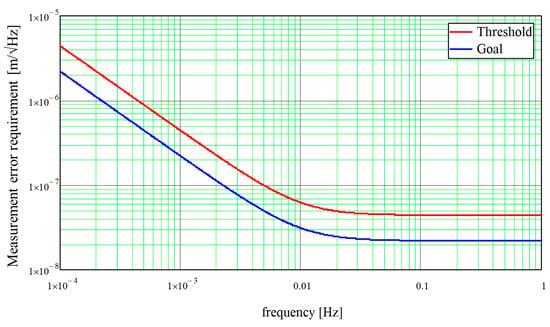
Figure 3.
Requirements (threshold and goal) on the stochastic measurement error of Δd.
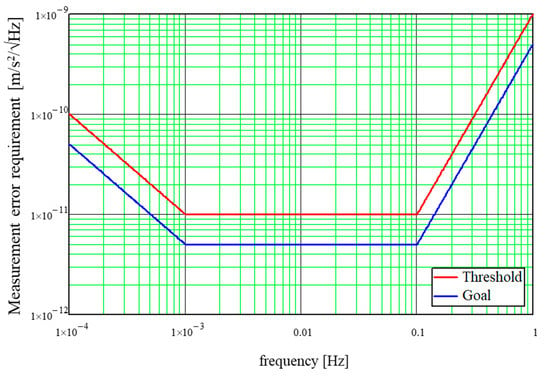
Figure 4.
Requirements (threshold and goal) on the stochastic measurement error of ΔaD.
The measurement performances of Δd and ΔaD required for the NGGM, even at the threshold level, represent an improvement by more than one order of magnitude over those achieved in the GFO by the K/Ka-band ranging system (primary instrument for the distance measurement) and by its accelerometer [27].
The combination of the requirements on ΔaD and Δd converted to the same units [m/s2/√Hz], by taking its second temporal derivative, shows that the contributions to the performance from the acceleration and from the distance variation measurement errors are approximately comparable at 1 mHz, while the performance limit below 1 mHz is set by the acceleration measurement error and above 1 mHz by the distance variation measurement error (see Figure 5).

Figure 5.
Combined requirements on ΔaD and on the second temporal derivative of Δd.
3. Drag and Attitude Control Role in the Measurement of the Non-Gravitational Accelerations
3.1. The Measurement of the Non-Gravitational Accelerations and the Main Error Terms
The NGGM will measure the non-gravitational differential acceleration between the CoMs of the satellites in each pair (ΔaD) through the use of highly sensitive electrostatic accelerometers.
This kind of accelerometer operates by nulling the relative motion (linear and angular) between a proof mass (PM) and its “electrode cage”, through the use of electrostatic forces and torques applied on it. The acceleration corresponding to the force applied to the PM for nulling its motion (a) is the quantity nominally measured by the accelerometer. It is equivalent to the relative acceleration between the PM and the cage (a = acage – aPM), and can be expressed as:
Here, aD encompasses all environmental non-gravitational accelerations (atmospheric drag, radiation pressure, and propulsion system thrusting) experienced by the satellite’s CoM, which are also the linear accelerations of the accelerometer cage being rigidly connected to the satellite, and apara refers to the PM acceleration relative to the cage produced by forces internal to the satellite and to the accelerometer (self-gravity forces, thermo-molecular forces, magnetic forces, etc.).
The term ([U] − [Ω2] − [])R is the acceleration of the PM relative to the cage due to the coupling of Earth’s gravity gradient [U], the spacecraft centrifugal acceleration [Ω2] and angular acceleration [] around its CoM with the position vector R of the center of the PM relative to the satellite’s CoM. The term 2 [Ω] is the Coriolis acceleration of the PM relative to the cage induced by the coupling of the rate of change of the position vector R with the satellite angular velocity [Ω] around its CoM. Since the PM is kept motionless relative to the cage, the first and second time derivative of the position vector R (, ) result from variations of the accelerometer cage offset relative to the CoM produced by causes internal to the satellite itself (thermo-elastic deformations of the structure to which the cage is connected, vibrations originated inside the satellite and propagating through the structure up to the cage, etc.). A schematic illustration of the contributors to the acceleration nominally measured by the accelerometer on board of the satellite is shown in Figure 6.
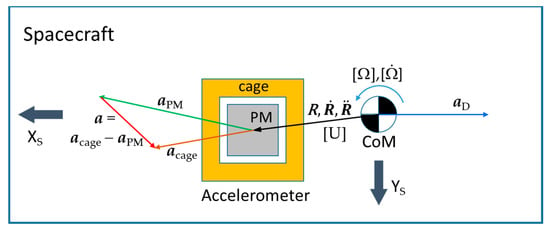
Figure 6.
Contributors to the acceleration a nominally measured by the accelerometer.
The above equation would reduce to a = aD were it to be assumed that δaD = 0, namely that the PM control is perfect (and the PM was perfectly centered within the electrodes cage at all times), vibrations between the electrodes and the rest of the spacecraft are neglected, and the center of the PM was perfectly coincident with the spacecraft’s CoM or the angular rates and accelerations were tightly controlled.
On the contrary, some terms accounting for the imperfections need to be added to the equation in order to allow for systematic uncertainties in the accelerometers, beyond misalignments in the reference frames: a scale factor, misalignment and coupling matrix [M] = 1 + [dM], a quadratic factor matrix [K2], a matrix for the coupling between linear and angular accelerations [C], the accelerometer’s bias b, and the measurement’s random noise n. Taking into account these terms, the acceleration actually measured by the accelerometer (ameas) can be expressed as a function of the “true” acceleration a as follows (see also illustration in Figure 7):
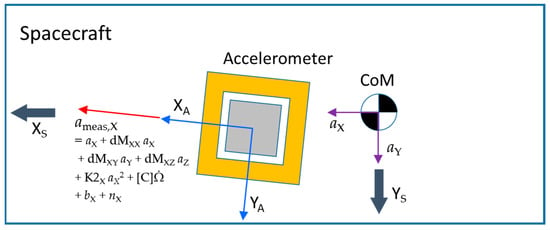
Figure 7.
Illustration of the errors affecting ameas.
Notably, the error δa on the measured acceleration is a function, besides other factors, of the acceleration itself through the coupling factors [dM] and [K2]. Therefore, the reduction of the error δa implies the reduction of the acceleration a (and in particular of the drag acceleration aD) through the implementation of a “drag-free control”.
Additionally, the misalignment between the accelerometer reference frame and the satellite-to-satellite reference frame (SSRF) will also induce a projection error in the measured acceleration along the direction joining the CoMs of the two satellites (Figure 8).
aD = ameas,X + θZ ameas,Y + θY ameas,Z
→ δaD = δameas,X + θZ δameas,Y + δθZ ameas,Y + θY δameas,Z + δθY ameas,Z

Figure 8.
Accelerometer reference frame (XA, YA, ZA) to SSRF (XSS, YSS, ZSS) misalignment giving rise to the pitch/yaw-dependent error term δaD.
The reduction of the error δaD implies a fine pointing and pointing stability of the accelerometer X-axis along the CoM-to-CoM direction, i.e., the tight control of the pitch and yaw angles θY, θZ.
From the above discussion, the errors affecting the measurement of the non-gravitational differential acceleration between the CoMs of the satellites (ΔaD) can be classified in the following classes (illustrated in the error tree of Figure 9):
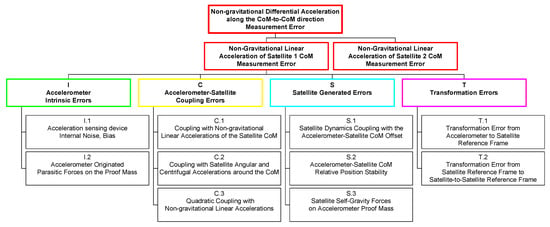
Figure 9.
Error tree for the measurement of the non-gravitational differential acceleration along the satellite’s CoM-to-CoM direction.
- Accelerometer Intrinsic Errors (I): sensor intrinsic noise and bias, parasitic forces on the PM originated internally to the accelerometer (gold-wire stiffness, thermo-molecular forces, etc.).
- Accelerometer-Satellite Coupling Errors (C): errors originated from the interactions of the accelerometer scale factor, internal misalignments, quadratic factors with residual non-gravitational accelerations, and the attitude dynamics of the spacecraft.
- Satellite Generated Errors (S): errors produced by sources dependent only on the spacecraft (self-gravity forces, stability of the accelerometer-CoM relative position, etc.).
- Transformation Errors (T): errors originated by the projection of the measured acceleration along the CoM-to-CoM direction.
3.2. The Candidate Accelerometer for NGGM
In order to have the same level of performance along the three axes for linear accelerations and to provide three pure angular accelerations, ONERA has proposed the new concept of the accelerometer, named MicroSTAR, with a cubic proof mass (PM) surrounded by six identical electrode plates (Figure 10). The principle of measurement of MicroSTAR is identical to the previous accelerometers utilized on GOCE [28] or GFO [29]: the PM is suspended at the center of the electrode cage with electrostatic forces, with the control being ensured by a capacitive measurement of the motion of the PM with respect to the electrode cage. With the electrode cage being fixed inside the satellite, the electrostatic forces applied on the PM are representative of the relative acceleration of the PM with respect to the satellite at the accelerometer’s location. For an accelerometer at the center of mass of the satellite, the linear accelerations measured by the instrument are the non-gravitational accelerations seen by the satellite. For an off-centered accelerometer, additional terms due to the angular motion of the satellite and the gravity gradient are present in the measurement, as described in Section 3.1.
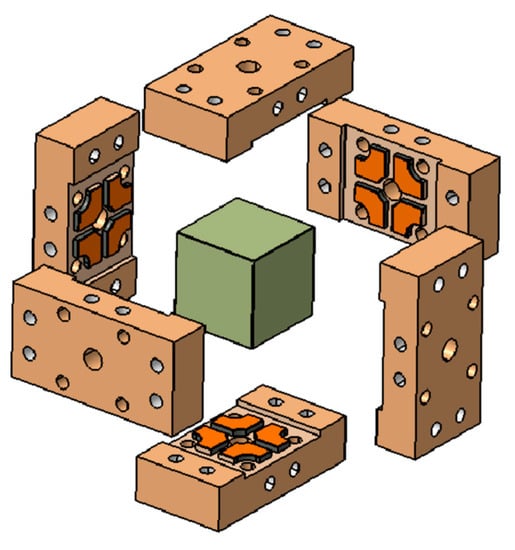
Figure 10.
Core of MicroSTAR with the cubic PM surrounded by 6 identical electrode plates.
To achieve the performance required for the mission, the PM is made in Platinum Rhodium alloy (PtRh10), as for the GOCE accelerometer, with a gap between the PM and electrode of 300 µm. A very thin gold wire of 5 µm diameter polarizes the PM with a DC voltage Vp (polarization voltage) and a 100 kHz voltage Vd (detection voltage for capacitive detection). The PM is controlled with a digital control loop to take full benefit of the electrode redundancy and to facilitate the non-linearity calibration and correction, as was completed for the GOCE accelerometer.
The accelerometer sensor head (ASH) with the accelerometer core and the front-end electronics unit (FEEU) with the sensitive analog functions (capacitive detection, actuation amplification, and readout chain) shall be located in a very stable thermal enclosure in order to achieve the performance at low frequency. A stability of 5 mK/√Hz for ASH and 10 mK/√Hz for the FEEU is required in addition to very low thermal sensitivity of the electronics functions.
The interface and control unit (ICU) includes the software to control the PM along its six degrees of freedom, as well as to filter the accelerometer acceleration measurement before transferring the measurements to the on-board computer. It is foreseen to have two different outputs: one for the science processing with high resolution and lower range (1.2 × 10⁻⁵ m/s2) and one for the drag-free, attitude, and orbit control system (DFAOCS) with lower resolution but higher range (4.7 × 10⁻⁵ m/s2). Figure 11 shows the amplitude spectral density of the MicroSTAR measurement noise in the science output and in the DFAOCS output channel for the linear accelerations and the angular accelerations, derived from a worst-case analysis (WCA). Note that the X axis of the accelerometer is that on which the polarization gold wire is applied; therefore, it is slightly less sensitive than the other two (ultra-sensitive) Y and Z axes. On the spacecraft, the accelerometer is oriented with one of its ultra-sensitive axes nominally aligned to the flight direction.
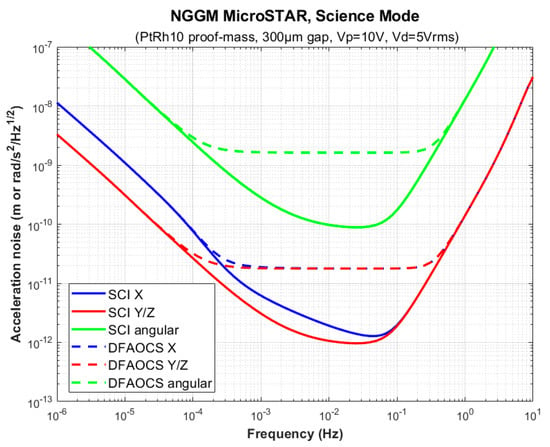
Figure 11.
Worst-case analysis (WCA) of the acceleration measurement noise for linear and angular accelerations for the science output (SCI) or for DFAOCS outputs. Performance is shown for the X axis (less sensitive) and for Y/Z axes (ultra-sensitive) of the accelerometer reference frame.
As explained in Section 3.1, the measurement performance of the relative non-gravitational acceleration depends not only on the accelerometer intrinsic noise, but also on the coupling of the accelerometer with the satellite environment. Indeed, due to the non-perfect geometry of the accelerometer parts or the non-perfect electronics components, the accelerometer is affected by a bias, a scale factor, a quadratic factor, and internal misalignments. The expected values of the parameters achievable by construction and after in-flight calibration, as well as their in-flight stability in the measurement bandwidth are provided in Table 3.

Table 3.
Bias, scale factor, quadratic factor, and misalignments of the MicroSTAR accelerometer (in the accelerometer reference frame).
3.3. Drag and Attitude Control Requirements
Besides the altitude maintenance, necessary to ensure a homogeneous, constant ground track repetition pattern along the mission, a tight control of the satellite’s non-gravitational accelerations and attitude dynamics at all frequencies inside the instrument measurement bandwidth (MBW) of NGGM (threshold: from 1 to 100 mHz; goal: from 0.1 mHz to 1 Hz) is necessary to fulfil the measurement requirements of ΔaD.
Control requirements are derived from the couplings between accelerometer and satellite dynamics feeding into the relative non-gravitational linear acceleration measurement performance requirements through the corresponding linear and angular accelerations and angular rates. Their required values are reported in Table 4.

Table 4.
Requirements on non-gravitational accelerations and attitude motion control for NGGM.
These control requirements allow the fulfillment of the mission’s required performance for the measurement of the two mission observables when considered in conjunction with the calibration-dependent parameters in Table 3. Relaxation of these requirements (or of the calibration stringency) would lead to worsening of the performances, locally for some frequency ranges, or generally across the whole spectrum, as explored in more detail in Section 4.1.
3.4. Drag Environment on NGGM Reference Orbits
Atmospheric drag is the dominant source of non-gravitational accelerations for low-Earth orbits like those of the NGGM. The drag forces on the satellite depend on the atmospheric density, which in turn is affected by the solar activity, on the satellite’s velocity relative to the atmosphere on the satellite geometry, on the accommodation factors, and on the temperature of its surfaces.
- The atmospheric models utilized within the NGGM system study are:
- NRLMSISE-00 for neutral density estimation/predictions (consistent with ECSS E ST 10 04C Rev1 Space Environment standard);
- HWM-14 for winds;
- Hickey’s model for the high-frequency density/wind fluctuations [30].
The drag forces on the spacecraft are computed using the NGGM E2E e-MAGIC simulator, inherited from the end-to-end (E2E) simulator developed by Thales Alenia Space for the GOCE Mission and successfully validated against the flight data (see Figure 12). A remarkable result of this comparison is the fundamental role played by Hickey’s model for a correct reproduction of the drag force behavior in the frequency range from 1 mHz to 1 Hz (see Figure 13), which includes the measurement bandwidth of the NGGM.
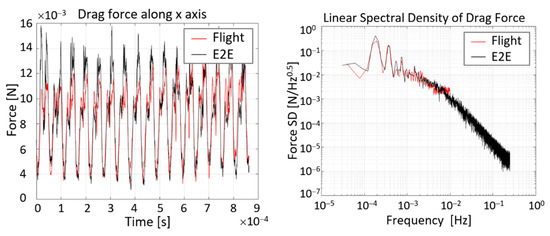
Figure 12.
Time history and amplitude spectral density of the drag force along the X-axis of GOCE measured in flight (black line) and computed by the E2E simulator (red line).
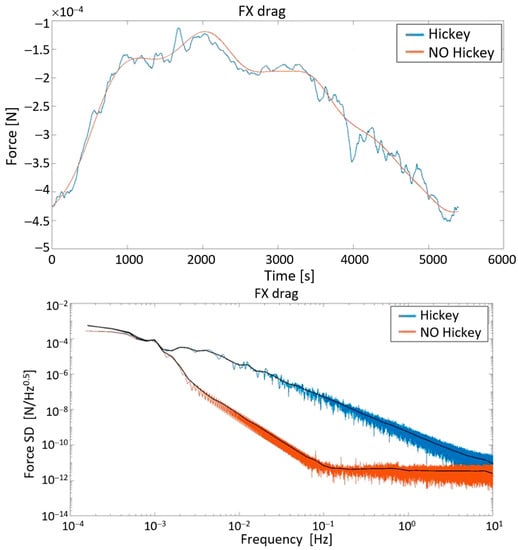
Figure 13.
Time history (above) and amplitude spectral density (below) of the drag force along the X-axis of NGGM computed with and without the Hickey’s atmospheric model.
The dependency on the drag force module on the solar activity is clearly shown in the time series Figure 14 spanning 14 years from 2027 and computed for the two reference orbit altitudes of the NGGM considering the solar-flux (F10.7) and the geomagnetic index (Ap) predicted with the 50th and 95th percentile (i.e., the probability, expressed in percentage, that a variable X will be less than a given value) [31].
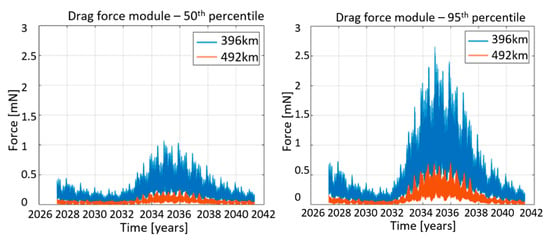
Figure 14.
Drag force module over 14 years from 2027 at 396 km and 492 km altitude, computed with 50th percentile (left) and 95th percentile (right) on F10.7 and Ap prediction.
According to the predicted activity in solar cycle 26, the maximum is expected to occur around October 2034; the date comprised in the planned NGGM on-orbit lifetime. The three components of the uncompensated drag accelerations experienced by the satellite (expressed in its reference frame), computed along two orbits at the maximum of the predicted solar activity with the 95th percentile, are provided in Figure 15 (time series) and Figure 16 (amplitude spectral density).
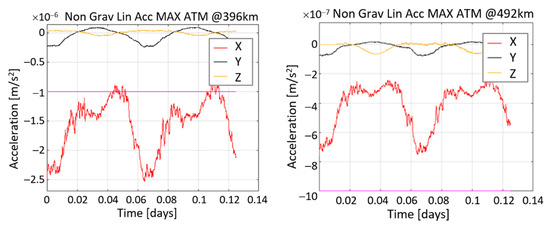
Figure 15.
Drag acceleration components over 2 orbits at 396 km and 492 km, computed at the epoch of maximum solar activity with 95th percentile on F10.7 and Ap prediction.
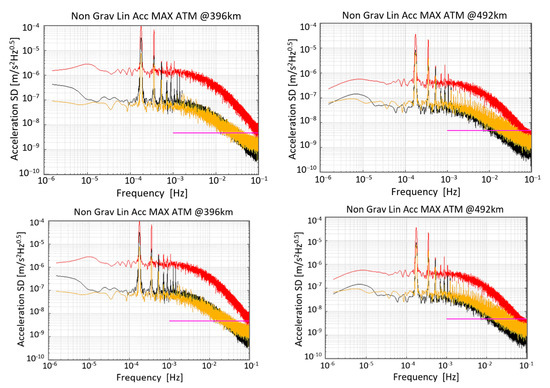
Figure 16.
Amplitude spectral density of the drag acceleration components at 396 km and 492 km, computed at the epoch of maximum solar activity with 95th percentile on F10.7 and Ap prediction. The control requirement (magenta horizontal line, taken from Table 4′s control requirement for the spectral densities of the linear accelerations in the MBW) is abundantly exceeded below 50 mHz by all components.
From the above Figure 16, it is apparent how external perturbations have a direct influence on the residual linear accelerations that the SC is subject to at the different altitudes. In order to respect the requirements on the residual linear accelerations described in Table 4, it is necessary to exercise linear drag-free control to compensate for the external drag as well as for dominant thruster effects. Indeed, independently from the thruster layout and thruster usage (impulsive or proportional thrusters), the accelerometer will always measure the thruster effects due to the non-ideal thrust caused by thruster misalignments, noise, etc. The latter effect is particularly evident on the cross-tack and radial axes, while along the in-flight direction, the dominant source is external drag. Consequently, the in-flight direction performance worsens when flying at a lower altitude.
4. Drag and Attitude Control Impacts on Mission Performance
The drag and attitude control results just presented above feed into the performance and error budget model through their impact in several of the error terms in Figure 9: in particular, the accelerometer-to-satellite coupling contributors (C) and the transformation contributors (T), as mentioned in Section 3.3, weighted by some of the parameters in Table 3. In addition, in Section 3.1: the non-gravitational linear acceleration ASDs resulting from the E2E simulator shown in Figure 16 are fed directly into the contributors for the coupling error estimates (scaled appropriately by the scale factors) and the transformation error estimates (through the pointing misalignments between the accelerometer and satellite reference frames) under several assumptions of drag-free capabilities. Spectral densities for the simulated drag-free performance are also employed for the axes enabled with the drag-free control. The resulting non-gravitational acceleration measurement error ASDs, shown in Section 4.1, are then employed to obtain the errors in the gravity field retrieval resulting from the propagation of said measurement errors on the constellation’s ground track pattern, as shown in Section 4.2.
4.1. Error Budget for the Non-Gravitational Acceleration Measurement
The mission’s control requirements regarding drag and attitude/pointing control flow down from the coupling (C) and transformation (T) contributors to the measurement error. On the other hand, the intrinsic accelerometer performance (I) is ensured through the use of the MicroSTAR accelerometer described in Section 3.2. The stability between the CoM and accelerometer feeds into the satellite (S) contributor.
When assuming that said control requirements are exactly met through the use of fine pointing attitude control and full (3-axis) drag-free propulsive control at the mission’s altitude range, the baseline performance in the measurement of the non-gravitational differential acceleration between the CoMs of the satellites (ΔaD) is achieved as shown in Figure 17.
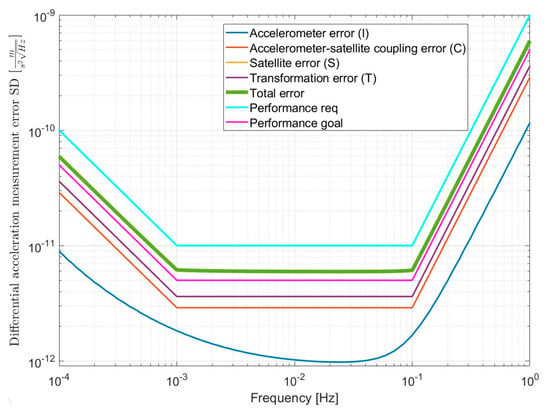
Figure 17.
Nominal non-gravitational acceleration measurement performance (green line) in the case of perfect matching of control requirements (see Section 3.3) and realistic conservative allocations for the values of the parameters subject to calibration (see Section 3.1), in comparison to mission performance requirements (light blue) and goals (magenta). Shown in dark blue, red, yellow, and purple are the (I), (C), (S), and (T) uncertainty contributors to the overall budgeted performance, respectively.
While this is the only configuration explored that is capable of fulfilling the performance requirements, several performance degradation scenarios of interest have been explored in the context of the NGGM’s Phase A, as part of the ongoing mission tradeoff analysis, in the interest of cost, complexity, and other practical parameters of interest.
By selecting the uncontrolled drag accelerations provided in Section 3.4 (Figure 16) to feed into the performance model, while assuming the fulfillment of the attitude control requirements, the following scenarios have been studied obtaining the performance shown in Figure 18:
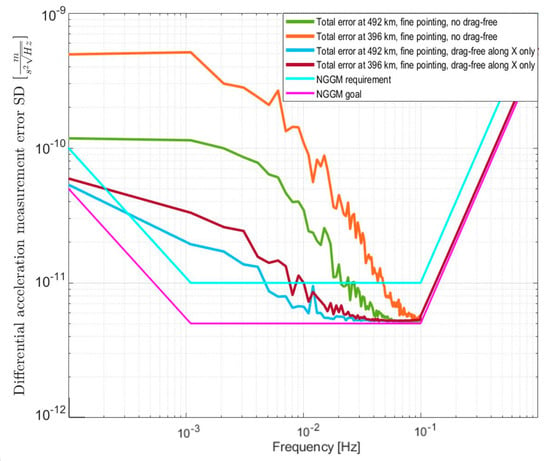
Figure 18.
Performance for scenarios with degraded drag-free control (either no drag-free control along the flight direction, satellite X axis, or along any of the axes) at the two orbital altitude regimes considered as 396 and 492 km.
- no drag-free control along any of the axes;
- drag-free control along the flight direction (satellite X axis) only, no control along Y and Z axes.
As expected, the impact on the measurement of the differential acceleration caused by the total or partial lack of drag-free control is more important on the lower orbit where the aerodynamic forces experienced by the satellite are larger. Note that, since the Earth’s gravitational potential decreases with the orbit radius r (from Earth’s center) very rapidly for large values of the spherical harmonic degree (proportionally to 1/r(SHD+1), as deduced from the spherical harmonic expansion of the gravitational potential of a non-symmetrical mass distribution satisfying Laplace’s equation , where the solution for the radial component takes the form for points located outside the mass distribution), a worse measurement on a low orbit degrades the gravity field retrieval at a high spatial resolution more than a better measurement on a high orbit.
Alternatively, while assuming the fulfillment of the drag-free requirements along any axis, the effect of a coarse attitude control has been studied. For this purpose, in-flight data from the GFO’s attitude have been employed (from ref. [32]) and fed into the performance model obtaining the performance shown in Figure 19. Note that, in principle, this scenario is independent of orbital altitude since the triaxial drag-free control capability is retained. This kind of coarse attitude control produces, in particular, a variation of the satellite pitch/yaw angles in the measurement bandwidth which translates into a transformation error degrading the ΔaD measurement performance by about two orders of magnitude around 1 mHz independently on the orbit altitude. A similar degradation is produced by the lack of drag-free control on the lowest orbit considered for the NGGM scenario.
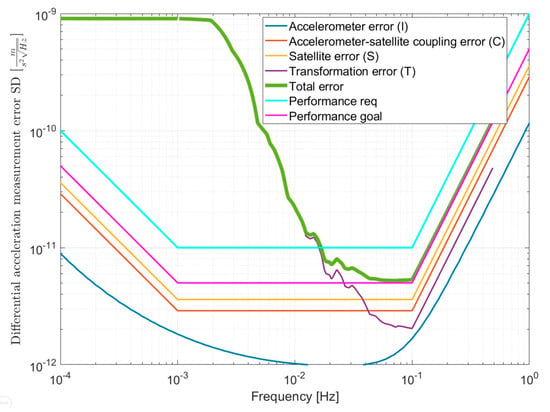
Figure 19.
Coarse attitude control effect in non-gravitational acceleration performance (green line) in the case of perfect matching of drag-free control requirements in the three axes, at any altitude where that control is feasible.
It is apparent that the hypothetical combined degraded scenario with neither fine pointing control nor drag compensation will see its error budget still dominated by the performance degradation effects due to the coarse pointing, as shown in Figure 20.
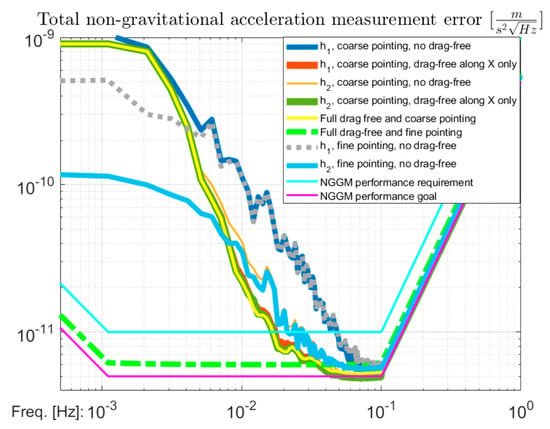
Figure 20.
Performance for the scenarios with both coarse pointing and degraded drag-free performances at h1 = 492 km and h2 = 396 km, overlaid to the cases with full drag-free control at any altitude combined with fine and coarse pointing.
4.2. Implications on the Gravity Field Retrieval
In order to assess the influence of the three drag-free cases and the two pointing regimes on the quality of the gravity field, we exploited the linear perturbation theory (LPT) [33] to propagate errors in the frequency domain to the Stokes coefficients, following the approach of [34]. In this way, the errors in the frequency domain are projected into the ground track coverage dictated by the orbital configuration of the constellation (i.e., both satellites), thus determining which gravity field coefficients are affected by those errors. This is an efficient method to evaluate the impact of colored noise from different sensors on the quality of the gravity field models [35].
As implied, this approach assumes the errors are stationary, which is adequate for instrument errors. Unfortunately, this approach is not capable of handling non-stationary errors, such as those resulting from temporal aliasing [36]. Although there are strategies to address temporal aliasing, e.g., [22,37], these errors are still dominant in the error budget of ll-SST satellites [20]. In any case, the level of temporal aliasing is dictated by the orbit configuration (namely their repeat period) and data processing choices on the ground. For this work, we have exploited the orbit configurations determined in [23] and note that data processing choices are irrelevant for the satellite design. For this reason, we chose the LPT to assess the impact of different design choices in the quality of the monthly gravity field.
Figure 21 illustrates the cumulative degree RMS error of the three drag-free options and the two pointing regimes on the quality of the gravity field (cf. Figure 18, except for the “NGGM requirement” curve and Figure 20, yellow line), in terms of the equivalent water height (EWH) added to the “goal” case in Figure 3. This means the curves in Figure 21 include the errors from the laser interferometer, the accelerometer, and associated drag-free and pointing regimes. The first observation is that the full and X-axis drag-free cases (for both pointing regimes) are very similar, with some small differences in degrees 5–40 for the fine pointing regime and no obvious difference for the coarse pointing regime (i.e., the light blue and green lines are overlapping). For the fine pointing regime, the error amplitude below 40 degrees jumps up from full/X-axis drag-free to no drag-free by as much as it jumps from the latter to all coarse pointing cases. This means that the fine pointing regime has larger benefits to the quality of the gravity field than the drag-free options. As the degree increases, the differences between all six cases progressively reduce. This is because the errors in the laser interferometer (not shown) are dominant at degrees above 80; the exception is the fine pointing and full/X-axis drag-free cases, which are below the laser interferometer errors for degrees above 20. In other words, the full/X-axis drag-free capability is required to fully exploit the accuracy of the laser interferometer.
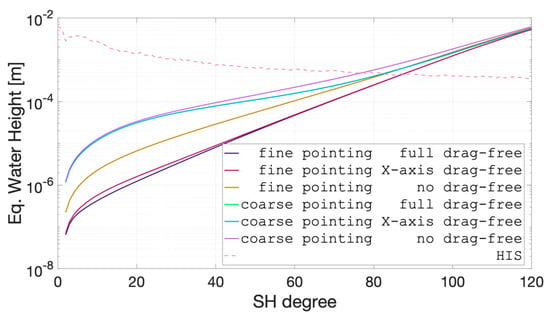
Figure 21.
Degree RMS of the error in the gravity field coefficients in terms of EWH resulting from the laser interferometer, the accelerometer, and associated drag-free and pointing regimes. The curves for X-axis and full drag-free for the coarse pointing (green and light blue lines) are overlapping.
Represented by the broken pink line is the so-called HIS signal, which contains the variability of the hydrological, icesheets, and solid-earth mass transport components, from [38]. This line represents one of the main signals to be observed by future gravimetry. As such, the intersection between the error curves and the HIS curve indicates the spherical harmonic degree (SHD), which can be directly translated to a spatial resolution, at which the signal-to-noise (SNR) is 1. For lower degrees (or lower spatial resolution), the HIS processes can be fully observed; above, this is not the case. Table 5 lists the values of the predicted spatial resolution for the cases considered in this study. As expected, the fine pointing and full/X-axis drag-free cases have the highest spatial resolution of 235 km and the coarse pointing with no drag-free control has the lowest at 267 km.

Table 5.
Maximum spatial resolution of the different scenarios to fully observe the HIS signal, in spherical harmonic degree (SHD) and distance.
Even though the different cases do not substantially affect the maximum resolution, they do affect the accuracy of the low degrees, by over 1 order of magnitude below degree 40. This may not seem relevant to the observability of the HIS signal, but such a large difference may play an important role in the estimation of the low degrees, with consequences to diverse geophysical applications. For example, the C20 coefficient of GRACE is notoriously difficult to estimate, and some studies have hinted that the cause is the poor performance of the accelerometers at low frequencies [39]. Furthermore, the low-quality data provided by GFO’s accelerometer have created the need to have an independent estimate of the C30 coefficient [40].
5. Conclusions
In a mission based on the satellite-to-satellite tracking technique for monitoring at a high spatial and temporal resolution the variations of Earth’s gravity field, the two fundamental observables (CoM-to-CoM distance variation and non-gravitational differential acceleration between the CoMs of the satellites) are equally important to achieve the final objectives. In Section 4.1, the importance of fulfilling the control requirements on the satellite’s drag accelerations and attitude dynamics provided in Table 4 to achieve the measurement performance of the non-gravitational differential acceleration has been demonstrated. Without compensating at all the drag forces’ variations in the MBW, the measurement performance is degraded with respect to the full drag-free control condition by about 100 times in the lowest part of the MBW for the orbit of the Bender constellation with the lower altitude (396 km). The degradation can be mitigated by compensating at least the largest component of the drag force along the flight direction. Conversely, without a fine stabilization of the satellite orientation along the satellite-to-satellite direction, the resulting performance degradation (again, about two orders of magnitude around 1 mHz) is independent of the orbital altitude.
In terms of the influence of the instrument errors in the accuracy of the monthly gravity field models, the analysis conducted with linear perturbation theory (LTP), cf. Section 4.2, confirms that the only way to exploit the full capabilities of the accelerometer is to use drag-free control, either on the X-axis or for all directions combined with the fine pointing mode. This analysis predicts that the maximum achievable spatial resolution to completely observe the HIS signal of the ESA Earth system model is 235 km, since the laser interferometer can resolve signals with an amplitude of 0.2 mm EWH at SHD 85. This is also the only case where the errors caused by the accelerometer are below those of the laser interferometer for the complete SHD range. For all other cases, the accelerometer affects the lower degrees more severely and with decreasing intensity for higher degrees, up to SHDs 60–70. When the accelerometer operates in a satellite platform with coarse pointing, it needs the drag-free control (either on the X-axis or for all directions) to come close to the case of fine pointing coupled with no drag-free control, with a spatial resolution of 250 and 245 km, respectively (SHDs 80 and 81). In the case of coarse pointing and no drag-free control, the spatial resolution is predicted to be 267 km (SHD 75). Since our analysis tool cannot handle non-stationary noise, such as temporal aliasing, we expect these values to be optimistic, and they should be regarded as the upper limit for complete observability. The analysis of model errors with a more complex simulation approach will certainly lead to worse quality gravity field models. However, importantly, those results will also be proportional to the quality of the results found using the LPT, so our approach is adequate for instrument design, especially since it allowed us to perform a much larger number of simulations throughout the design process (not shown).
Author Contributions
Conceptualization, S.C.; Writing—original draft, S.D., M.S., D.B.-B., L.M., J.T.d.E. and B.C.; Writing—review & editing, S.C. All authors have read and agreed to the published version of the manuscript.
Funding
This paper has been prepared within the Phase A System Study of the Next Generation Gravity Mission (NGGM), under ESA contract No. 4000134593/21/NL/CT.
Acknowledgments
The authors thank all the team members of the NGGM Phase A System Study involved in the design of this challenging, breakthrough mission.
Conflicts of Interest
The authors declare no conflict of interest.
References
- Pail, R.; Bingham, R.; Braitenberg, C.; Dobslaw, H.; Eicker, A.; Güntner, A.; Horwath, M.; Ivins, E.; Longuevergne, L.; Panet, I.; et al. Science and user needs for observing global mass transport to understand global change and to benefit society. Surv. Geophys. 2015, 36, 743–772. [Google Scholar] [CrossRef]
- Baker, R. Orbit determination from range and range rate data. Technical report. In Proceedings of the Semiannual Meeting of American Rocket Society, Los Angeles, CA, USA, 9–12 May 1960. [Google Scholar]
- Wolff, M. Direct measurement of the Earth’s gravitational potential using a satellite pair. J. Geophys. Res. 1969, 74, 5295–5300. [Google Scholar] [CrossRef]
- Tapley, B.D.; Bettadpur, S.; Ries, J.C.; Thompson, P.F.; Watkins, M.M. GRACE measurements of mass variability in the earth system. Science 2004, 305, 503–506. [Google Scholar] [CrossRef] [PubMed]
- Landerer, F.W.; Flechtner, F.M.; Save, H.; Webb, F.H.; Bandikova, T.; Bertiger, W.I.; Bettadpur, S.V.; Byun, S.H.; Dahle, C.; Dobslaw, H.; et al. Extending the global mass change data record: GRACE Follow-On instrument and science data performance. Geophys. Res. Lett. 2020, 47, e2020GL088306. [Google Scholar] [CrossRef]
- Floberghagen, R.; Fehringer, M.; Lamarre, D.; Muzi, D.; Frommknecht, B.; Steiger, C.; Pieiro, J.; da Costa, A. Mission design, operation and exploitation of the gravity field and steady-state ocean circulation explorer mission. J. Geod. 2011, 85, 749–758. [Google Scholar] [CrossRef]
- Brockmann, J.M.; Schubert, T.; Schuh, W.-D. An improved model of the Earth’s static gravity field solely derived from reprocessed GOCE data. Surv. Geophys. 2021, 42, 277–316. [Google Scholar] [CrossRef]
- Cesare, S.; Allasio, A.; Anselmi, A.; Dionisio, S.; Mottini, S.; Parisch, M.; Massotti, L.; Silvestrin, P. The European way to gravimetry: From GOCE to NGGM. Adv. Space Res. 2015, 57, 1047–1064. [Google Scholar] [CrossRef]
- Haagmans, R.; Siemes, C.; Massotti, L.; Carraz, O.; Silvestrin, P. ESA’s Next-Generation Gravity Mission Concepts. Rend. Lincei. Sci. Fis. E Nat. 2020, 31, 15–25. [Google Scholar] [CrossRef]
- Reubelt, T.; Sneeuw, N.; Iran Pour, S.; Pail, R.; Gruber, T.; Murböck, M.; Daras, I.; Visser, P.; Texeira de Encarnação, J.; van Dam, T.; et al. The ESA project SC4MGV Assessment of Satellite Constellations for Monitoring the Variations in Earth’s Gravity—Overview, objectives and first results. In Proceedings of the EGU General Assembly 2014, Vienna, Austria, 27 April–2 May 2014; p. 3758. [Google Scholar]
- Daras, I.; Visser, P.; Sneeuw, N.; van Dam, T.; Pail, R.; Gruber, T.; Tabibi, S.; Chen, Q.; Liu, W.; Tourian, M.; et al. Impact of orbit design choices on the gravity field retrieval of Next Generation Gravity Missions—Insights on the ESA-ADDCON project. In Proceedings of the 19th EGU General Assembly, EGU2017, Vienna, Austria, 23–28 April 2017; p. 8530. [Google Scholar]
- Dionisio, S.; Anselmi, A.; Cesare, S.; Novara, C.; Colangelo, L.; Massotti, L.; Silvestrin, P. System and AOCS challenges for the design consolidation of the next generation gravity mission. In Proceedings of the AIAA Guidance, Navigation, and Control Conference, Kissimmee, FL, USA, 8–12 January 2018. [Google Scholar] [CrossRef][Green Version]
- Smirnova, M.; Mingo, A.; Schein, J.; Smirnov, P.; Bosch, E.; Massotti, L. Test Campaign on the novel Variable Isp Radio Frequency Mini Ion Engine. In Proceedings of the 36th International Electric Propulsion Conference, Vienna, Austria, 15–20 September 2019. IEPC-2019-A-574. [Google Scholar]
- Massotti, L.; Gonzalez del Amo, J.; Silvestrin, P.; Krejci, D.; Reissner, A.; Seifert, B. The Next Generation Gravity Mission and the qualification of the Indium-fed mN-FEEP thruster. CEAS Space J. 2021, 14, 109–124. [Google Scholar] [CrossRef]
- Nicklaus, K.; Herding, M.; Wang, X.; Beller, N.; Fitzau, O.; Giesberts, M.; Herper, M.; Barwood, G.P.; Williams, R.A.; Gill, P.; et al. High stability laser for next generation gravity missions. In Proceedings of the International Conference on Space Optics—ICSO 2014, Tenerife, Spain, 6–10 October 2014; SPIE: Bellingham, WA, USA, 2017; Volume 10563, pp. 808–815. [Google Scholar] [CrossRef]
- Dionisio, S.; Anselmi, A.; Cesare, S.; Massotti, L.; Silvestrin, P. The Next Generation Gravity Mission challenges, consolidation of the system concepts and technological innovations. In Proceedings of the 15th International Conference on Space Operations, Marseille, France, 28 May–1 June 2018. [Google Scholar] [CrossRef]
- Nicklaus, K.; Cesare, S.; Massotti, L.; Bonino, L.; Mottini, S.; Pisani, M.; Silvestrin, P. Laser metrology concept consolidation for NGGM. In Proceedings of the International Conference on Space Optics 2018, Chania, Greece, 9–12 October 2018. [Google Scholar] [CrossRef]
- Visser, P.; Bettadpur, S.; Chambers, D.; Diament, M.; Gruber, T.; Hanna, E.; Rodell, M.; Wiese, D.; Labreque, J.; Johnson, T.; et al. Towards a Sustained Observing System for Mass Transport to Understand Global Change and to Benefit Society; NASA/ESA Interagency Gravity Science Working Group (IGSWG): Delft, The Netherlands, 2016; Doc. nr.: TUDIGSWG-2016-01; Available online: http://www.deos.tudelft.nl/AS/pieter/IGSWG/IGSWG-Report.pdf (accessed on 23 September 2021).
- National Academies of Sciences, Engineering, and Medicine. Thriving on Our Changing Planet—Decadal Survey for Earth Science and Applications from Space; The National Academies Press: Washington, DC, USA, 2017. [Google Scholar]
- Flechtner, F.; Neumayer, K.H.; Dahle, C.; Dobslaw, H.; Fagiolini, E.; Raimondo, J.-C.; Güntner, A. What can be expected from the GRACE-FO laser ranging interferometer for earth science applications? Surv. Geophys. 2016, 37, 453–470. [Google Scholar] [CrossRef]
- Bender, P.L.; Wiese, D.N.; Nerem, R.S. A possible dual-GRACE mission with 90 and 63 inclination orbits. In Proceedings of the 3rd International Symposium on Formation Flying, Missions and Technologies, Noordwijk, The Netherlands, 23–25 April 2008. [Google Scholar]
- Daras, I.; Pail, R. Treatment of temporal aliasing effects in the context of next generation satellite gravimetry missions. J. Geophys. Res. Solid Earth 2017, 122, 7343–7362. [Google Scholar] [CrossRef]
- Massotti, L.; Siemes, C.; March, G.; Haagmans, R.; Silvestrin, P. Next Generation Gravity Mission Elements of the Mass Change and Geoscience International Constellation: From Orbit Selection to Instrument and Mission Design. Remote Sens. 2021, 13, 3935. [Google Scholar] [CrossRef]
- Murböck, M.; Pail, R.; Daras, I.; Gruber, T. Optimal orbits for temporal gravity recovery regarding temporal aliasing. J. Geod. 2014, 88, 113–126. [Google Scholar] [CrossRef]
- Sneeuw, N.; Flury, J.; Rummel, R. Science Requirements on Future Missions and Simulated Mission Scenarios. In Future Satellite Gravimetry and Earth Dynamics; Flury, J., Rummel, R., Eds.; Springer: New York, NY, USA, 2005. [Google Scholar] [CrossRef]
- Abich, K.; Abramovici, A.; Amparan, B.; Baatzsch, A.; Okihiro, B.B.; Barr, D.C.; Zimmermann, M. On orbit performance of the GRACE Follow-On Laser Ranging Interferometer. Phys. Rev. Lett. 2019, 123, 031101. [Google Scholar] [CrossRef] [PubMed]
- Kornfeld, R.P.; Arnold, B.W.; Gross, M.A.; Dahya, N.T.; Klipstein, W.M.; Gath, P.F.; Bettadpur, S. GRACE-FO: The Gravity Recovery and Climate Experiment Follow-On Mission. J. Spacecr. Rocket. 2019, 56, 3. [Google Scholar] [CrossRef]
- Touboul, P.; Foulon, B.; Rodrigues, M.; Marque, J.P. In orbit nano-g measurements, lessons for future space missions. Aerosp. Sci. Technol. 2004, 8, 431–441. [Google Scholar] [CrossRef]
- Christophe, B.; Boulanger, D.; Foulon, B.; Huynh, P.-A.; Lebat, V.; Liorzou, F.; Perrot, E. A new generation of ultra-sensitive electrostatic accelerometers for GRACE Follow-on and towards the next generation gravity missions. Acta Astronaut. 2015, 117, 1–7. [Google Scholar] [CrossRef]
- Hickey, M.P. An Engineering Model for the Simulation of Small-Scale Thermospheric Density Variation for Orbital Inclinations Greater Than 40 Degrees; NASA Contractor Report 201140; NASA: Washington, DC, USA, 1996.
- Niehuss, K.O.; Euler, H.C.; Vaughan, W.W. Statistical Technique for Intermediate and Long-Range Estimation of 13-Month Smoothed Solar Flux and Geomagnetic Index; NASA Technical Memorandum 4759; NASA: Washington, DC, USA, 1996.
- Wegener, H.; Müller, V.; Heinzel, G.; Misfeldt, M. Tilt-to-Length Coupling in the GRACE Follow-On Laser Ranging Interferometer. J. Spacecr. Rocket. 2020, 57, 1362–1372. [Google Scholar] [CrossRef]
- Kaula, W.M. A Theory of Satellite Geodesy: Applications of Satellites to Geodesy; Blaisdel Publishing Company: Waltham, MA, USA, 1966. [Google Scholar]
- Visser, P.N.A.M. The Use of Satellites in Gravity Field Determination and Model Adjustment. Ph.D. Thesis, Delft University, Delft, The Netherlands, 1992. Available online: https://repository.tudelft.nl/islandora/object/uuid%3A957b041a-8e2c-4ad7-be73-214c0727df01 (accessed on 17 June 2022).
- Visser, P.N.A.M. Low-Low Satellite-to-Satellite Tracking: A Comparison between Analytical Linear Orbit Perturbation Theory and Numerical Integration. J. Geod. 2005, 79, 160–166. [Google Scholar] [CrossRef]
- Thompson, P.F.; Bettadpur, S.V.; Tapley, B.D. Impact of Short Period, Non-Tidal, Temporal Mass Variability on GRACE Gravity Estimates. Geophys. Res. Lett. 2004, 31, L06619. [Google Scholar] [CrossRef]
- Wiese, D.N.; Visser, P.N.A.M.; Nerem, R.S. Estimating Low Resolution Gravity Fields at Short Time Intervals to Reduce Temporal Aliasing Errors. Adv. Space Res. 2011, 48, 1094–1107. [Google Scholar] [CrossRef]
- Dobslaw, H.; Bergmann-Wolf, I.; Dill, R.; Forootan, E.; Klemann, V.; Kusche, J.; Sasgen, I. The Updated ESA Earth System Model for Future Gravity Mission Simulation Studies. J. Geod. 2015, 89, 505–513. [Google Scholar] [CrossRef]
- Minkang, C.; Ries, J. The Unexpected Signal in GRACE Estimates of C_{20}. J. Geod. 2017, 91, 897–914. [Google Scholar] [CrossRef]
- Loomis, B.D.; Rachlin, K.E.; Wiese, D.N.; Landerer, F.W.; Luthcke, S.B. Replacing GRACE/GRACE-FO with Satellite Laser Ranging: Impacts on Antarctic Ice Sheet Mass Change. Geophys. Res. Lett. 2020, 47, 1–7. [Google Scholar] [CrossRef]
Publisher’s Note: MDPI stays neutral with regard to jurisdictional claims in published maps and institutional affiliations. |
© 2022 by the authors. Licensee MDPI, Basel, Switzerland. This article is an open access article distributed under the terms and conditions of the Creative Commons Attribution (CC BY) license (https://creativecommons.org/licenses/by/4.0/).