
A Framework for Assessing the Dynamic Coastlines Induced by Urbanization Using Remote Sensing Data: A Case Study in Fujian, China


Abstract
:
1. Introduction
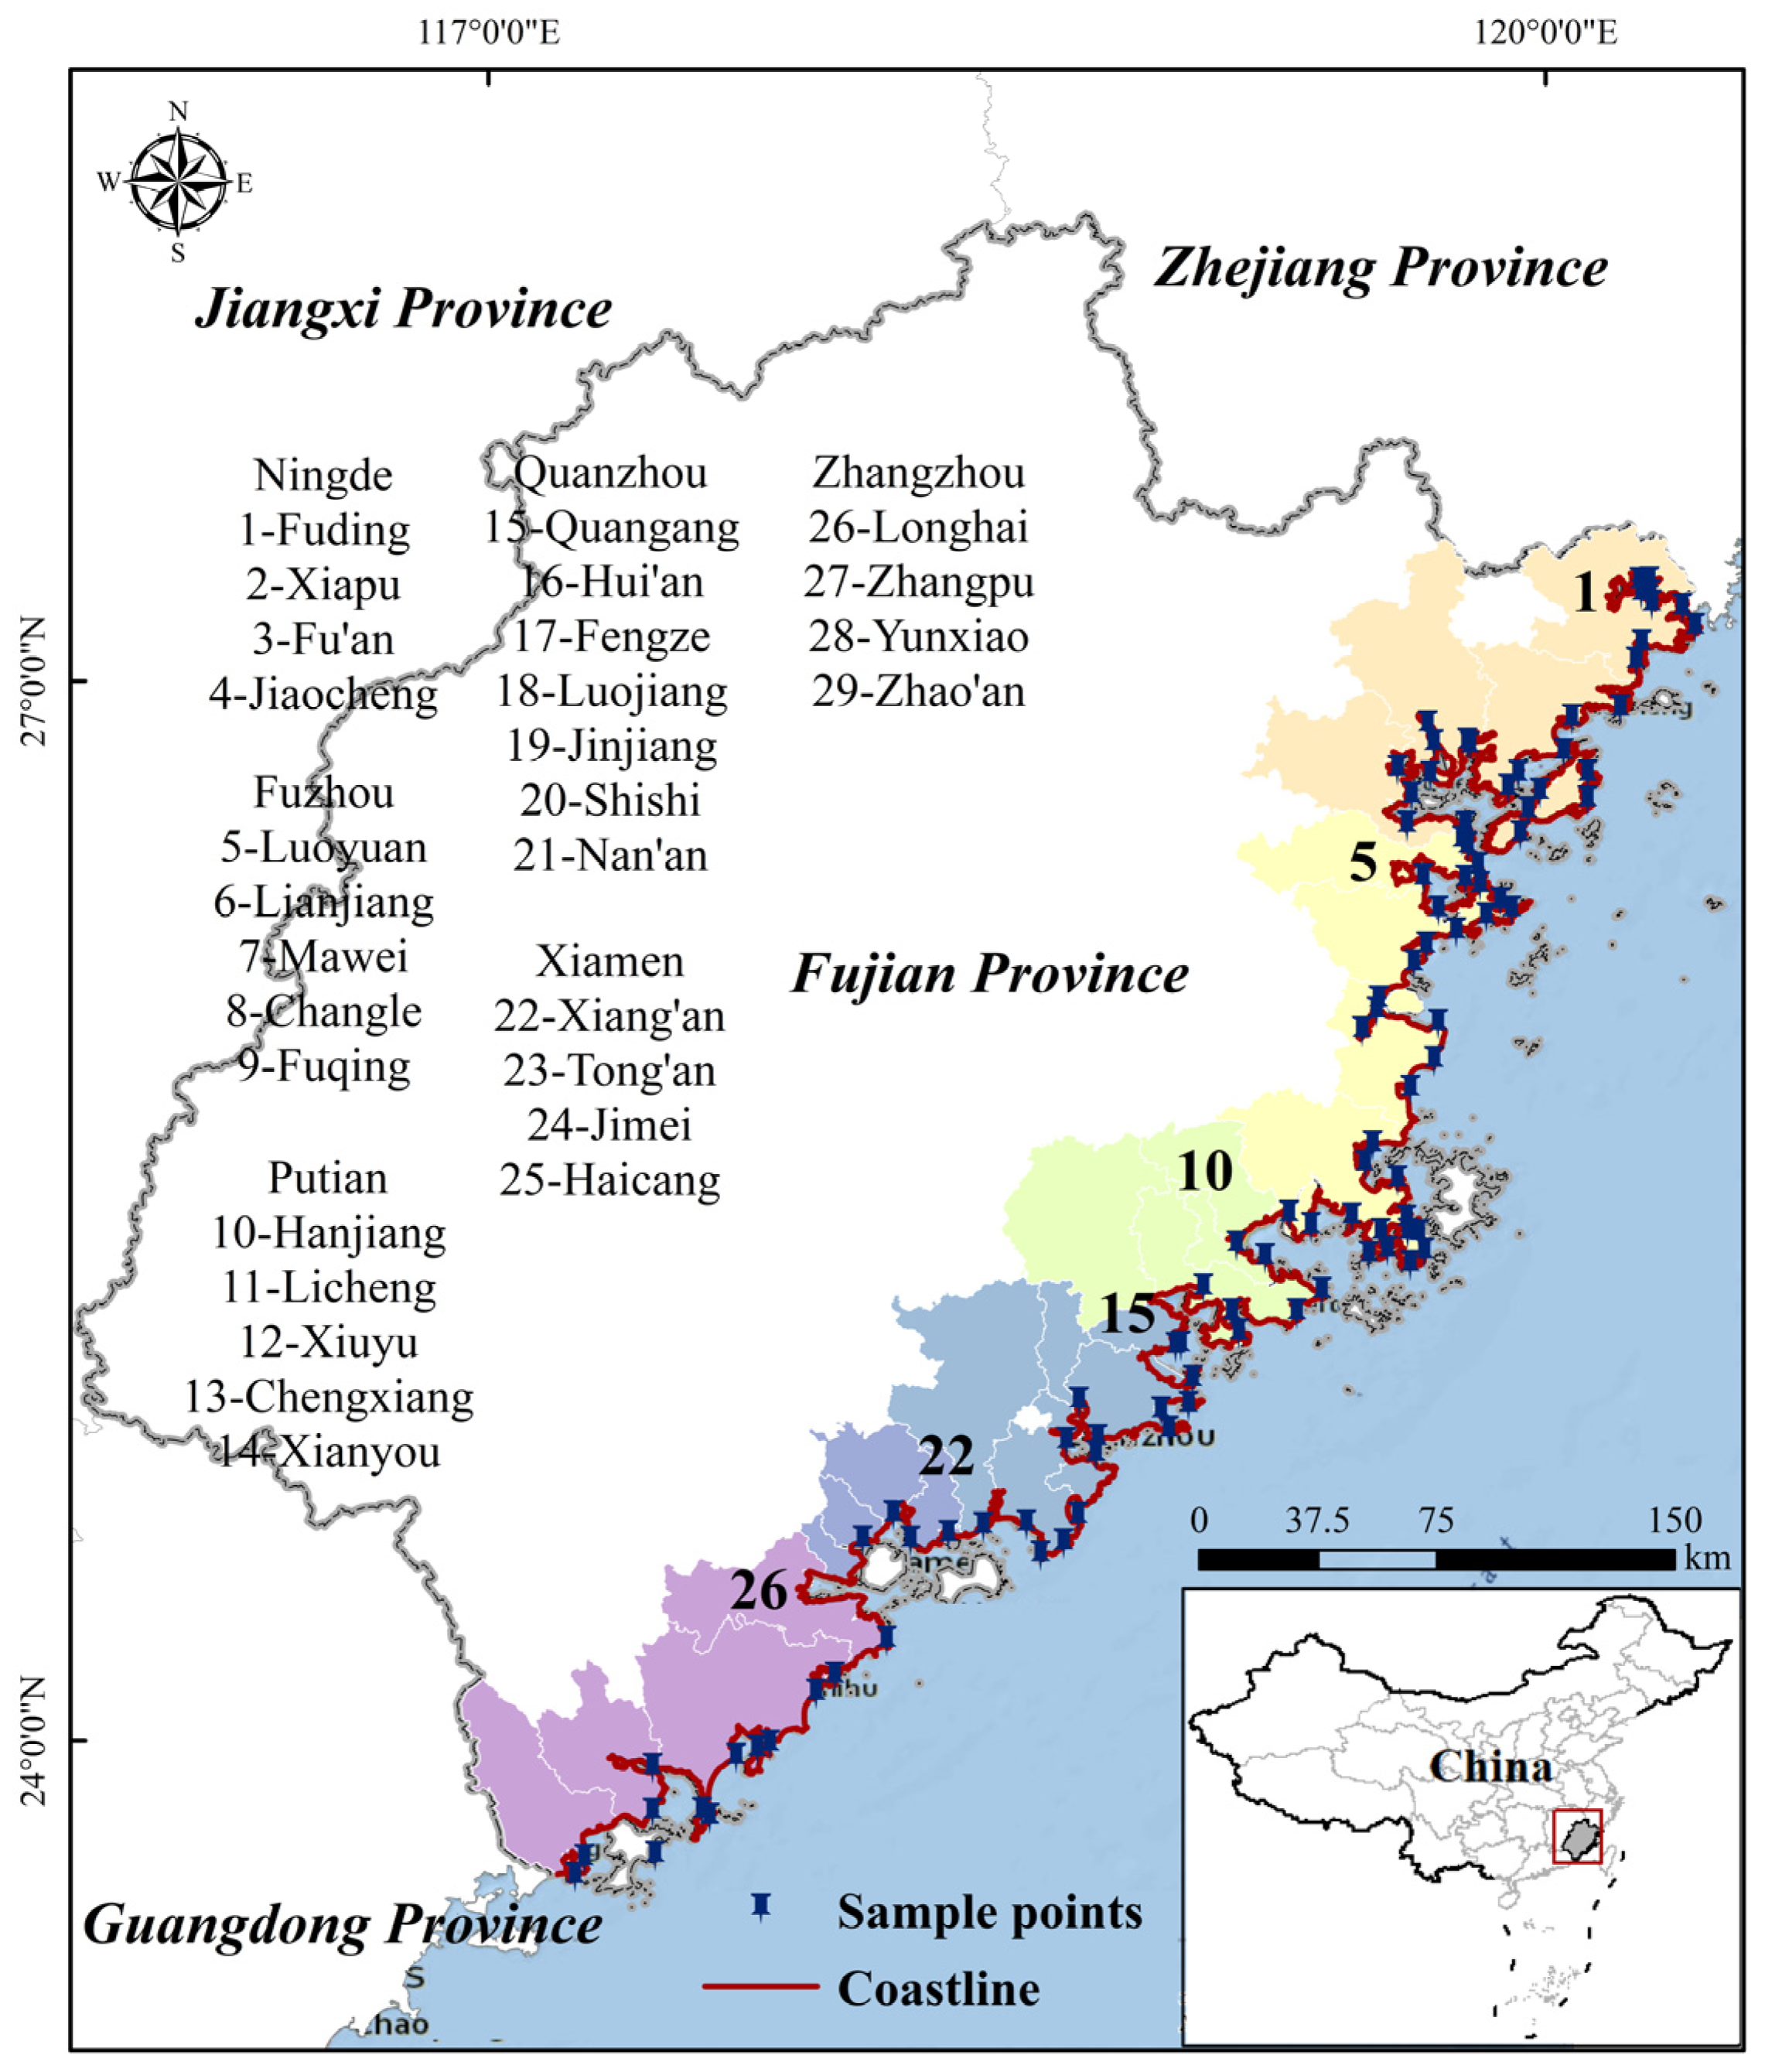
2. Study Area
3. Data and Method
3.1. Data and Pre-Processing
3.2. Detection of the Continental Coastlines
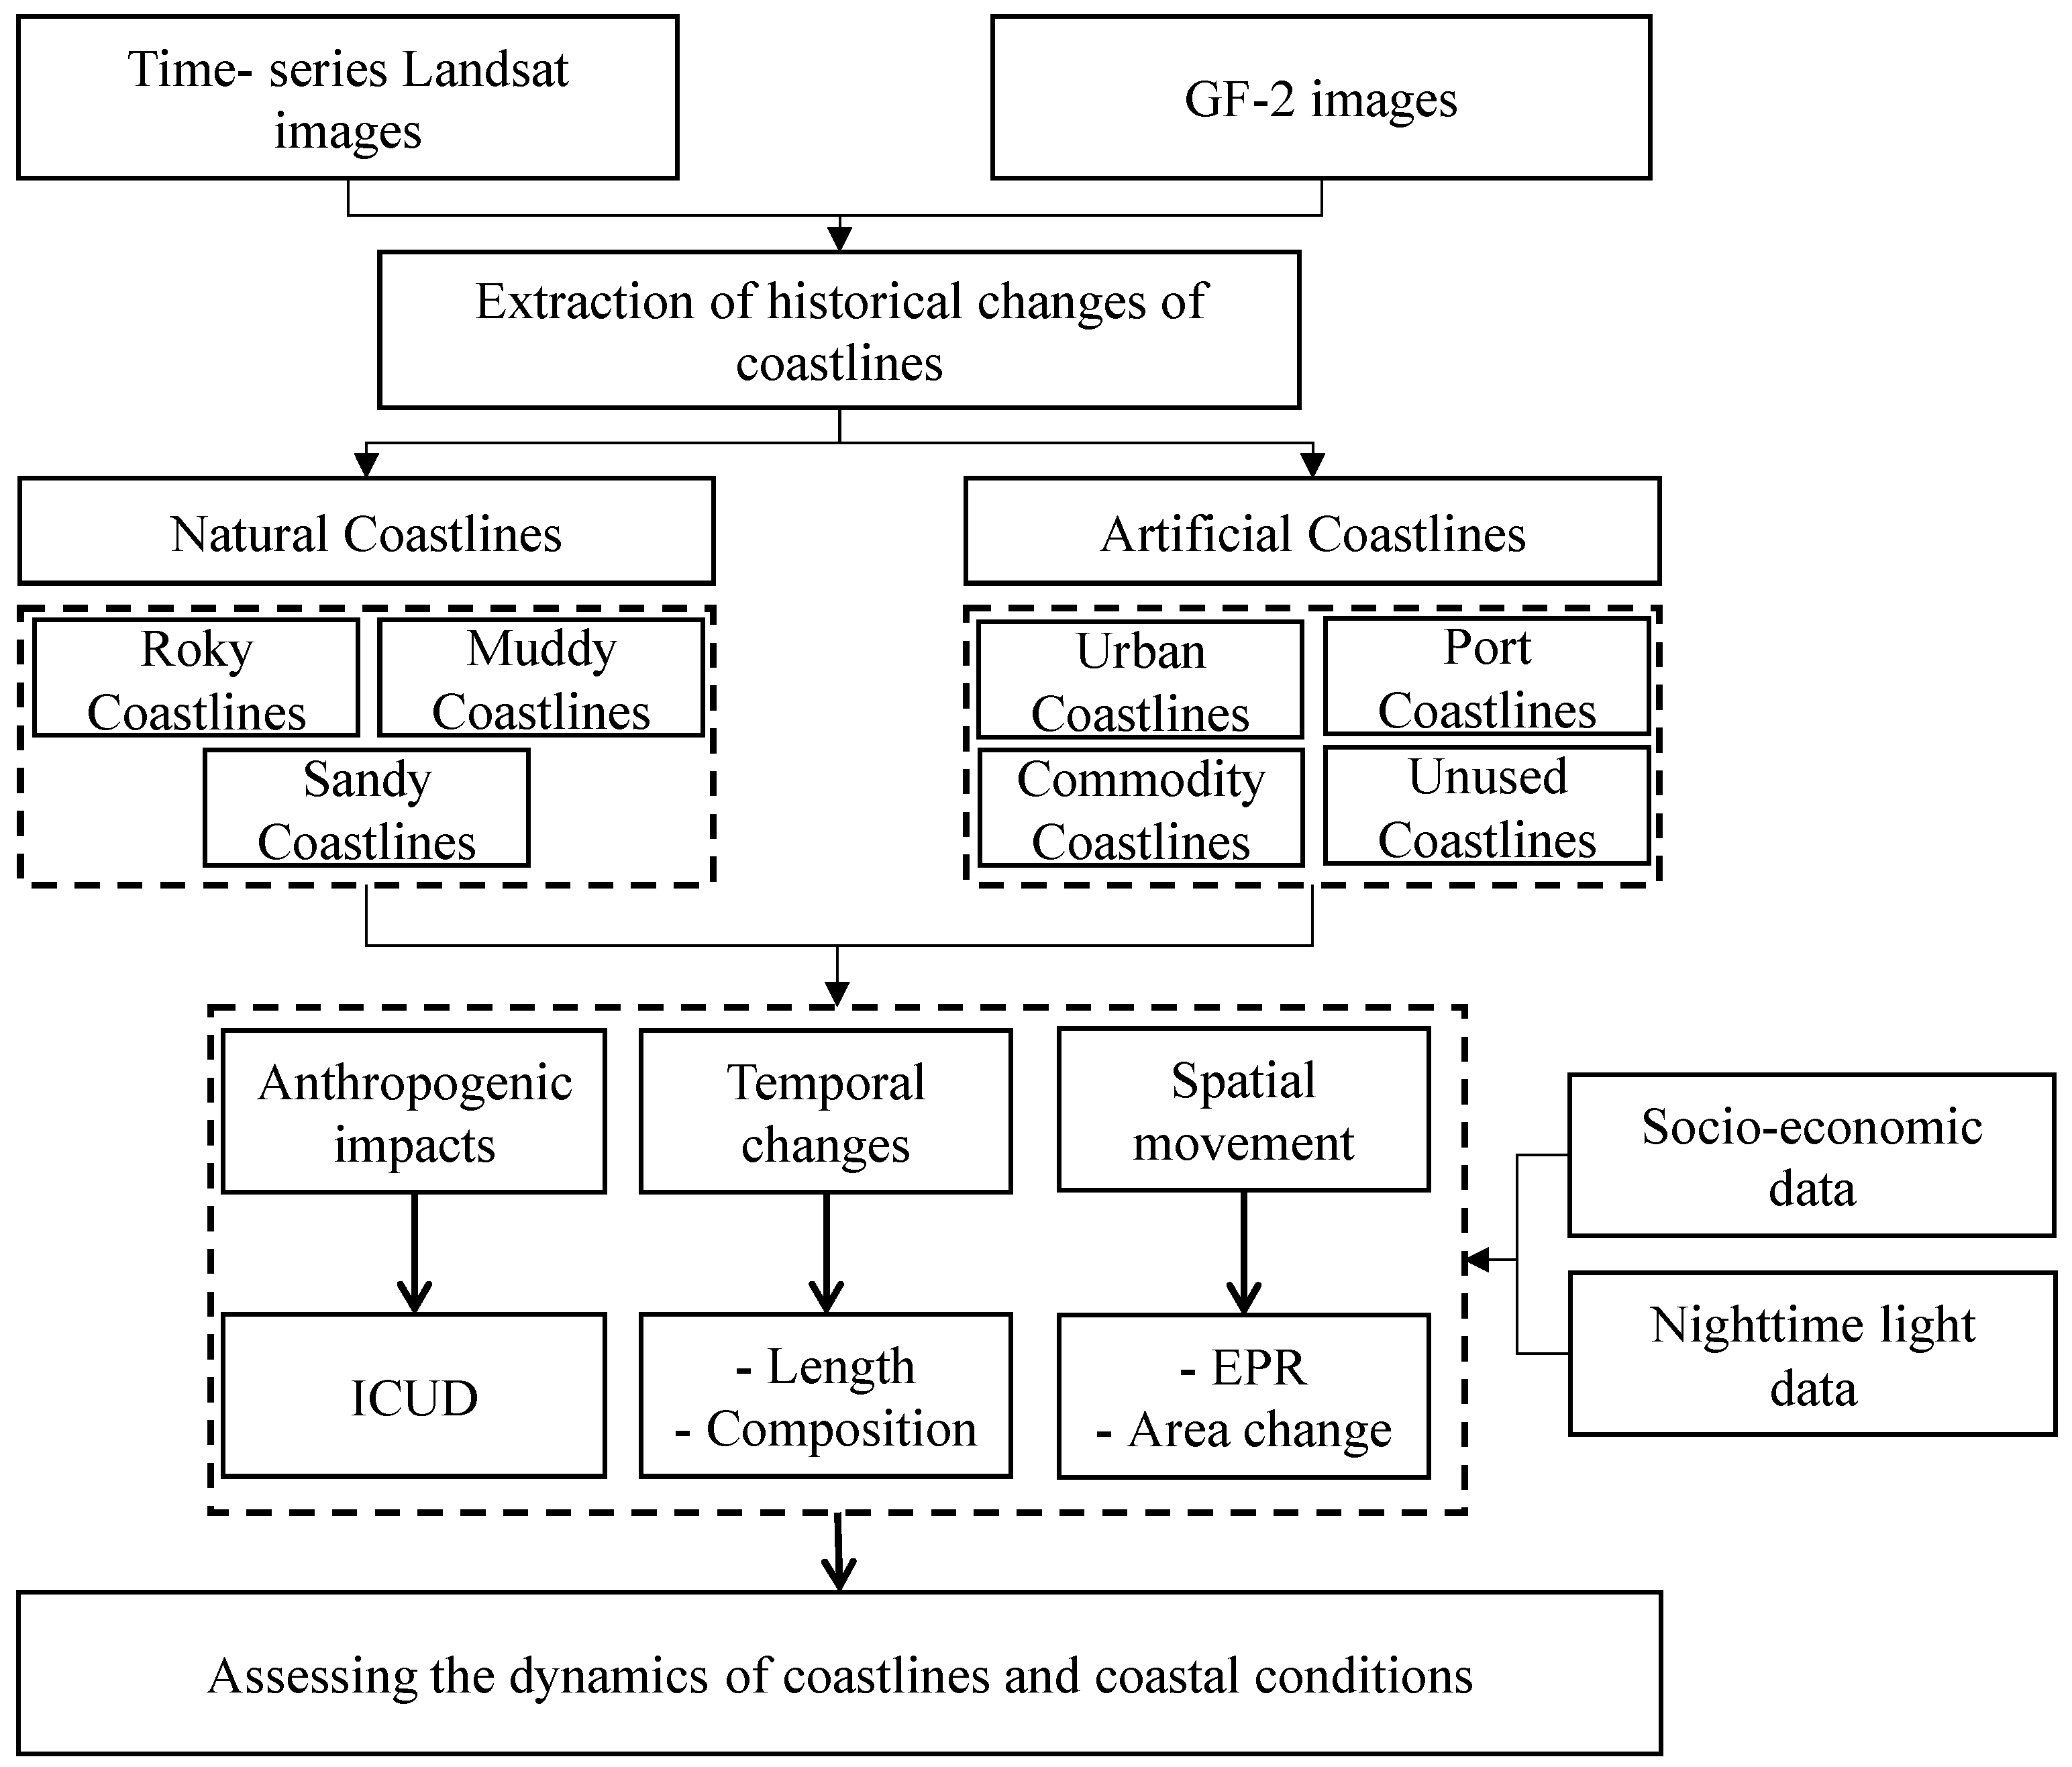
3.3. Framework for Assessing the Dynamics of Coastlines
3.3.1. Assessing Temporal Changes in Coastline
3.3.2. Mapping the Spatial Dynamics of Coastlines
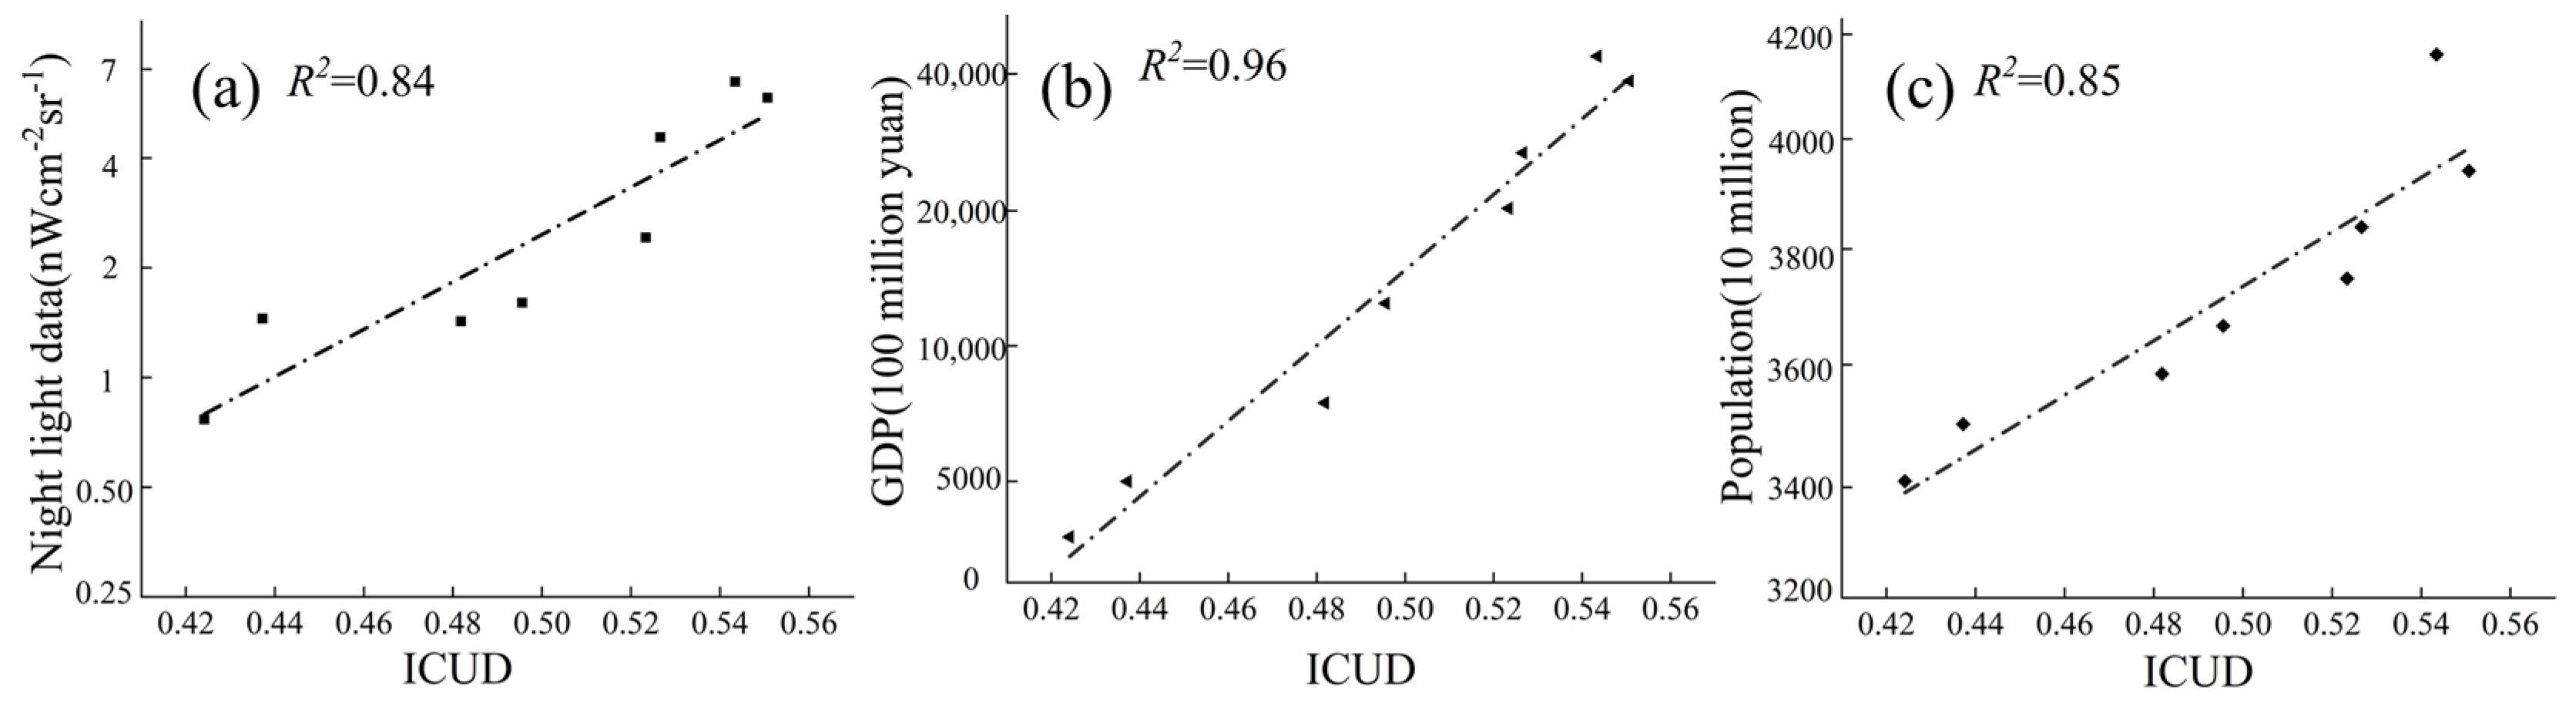
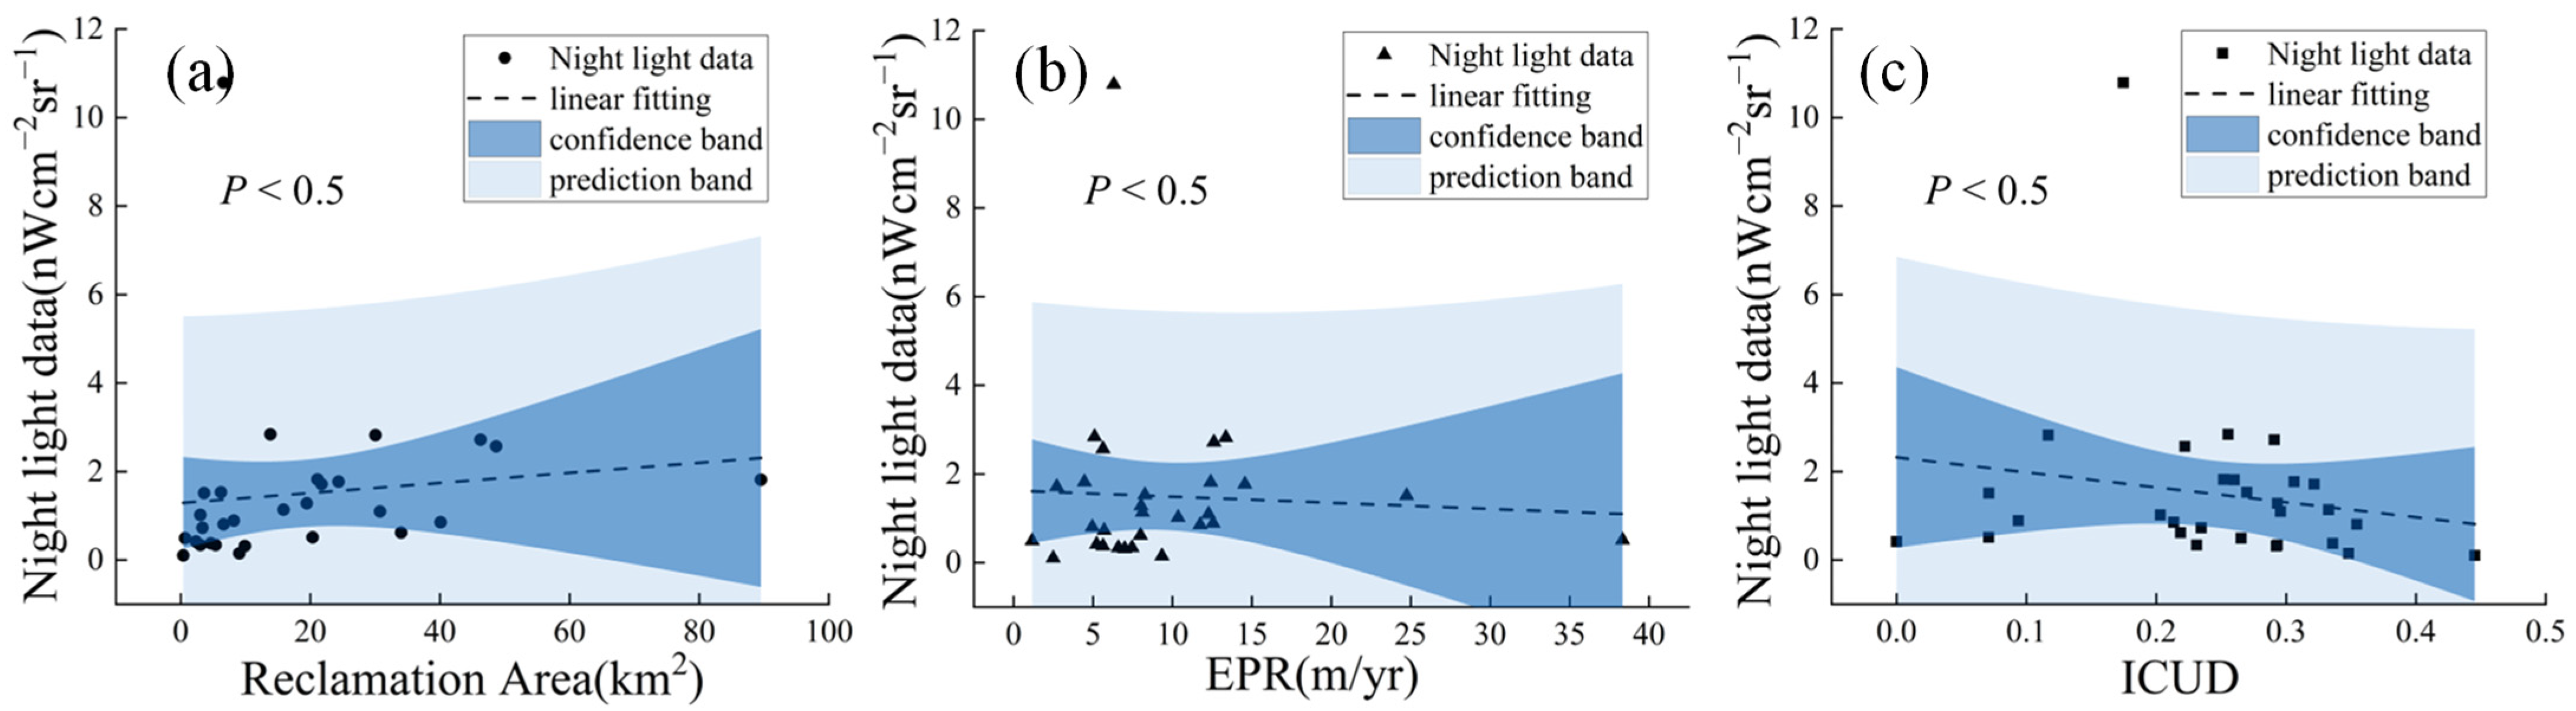
3.3.3. Quantifying the Anthropogenic Impacts on Coastlines
4. Results
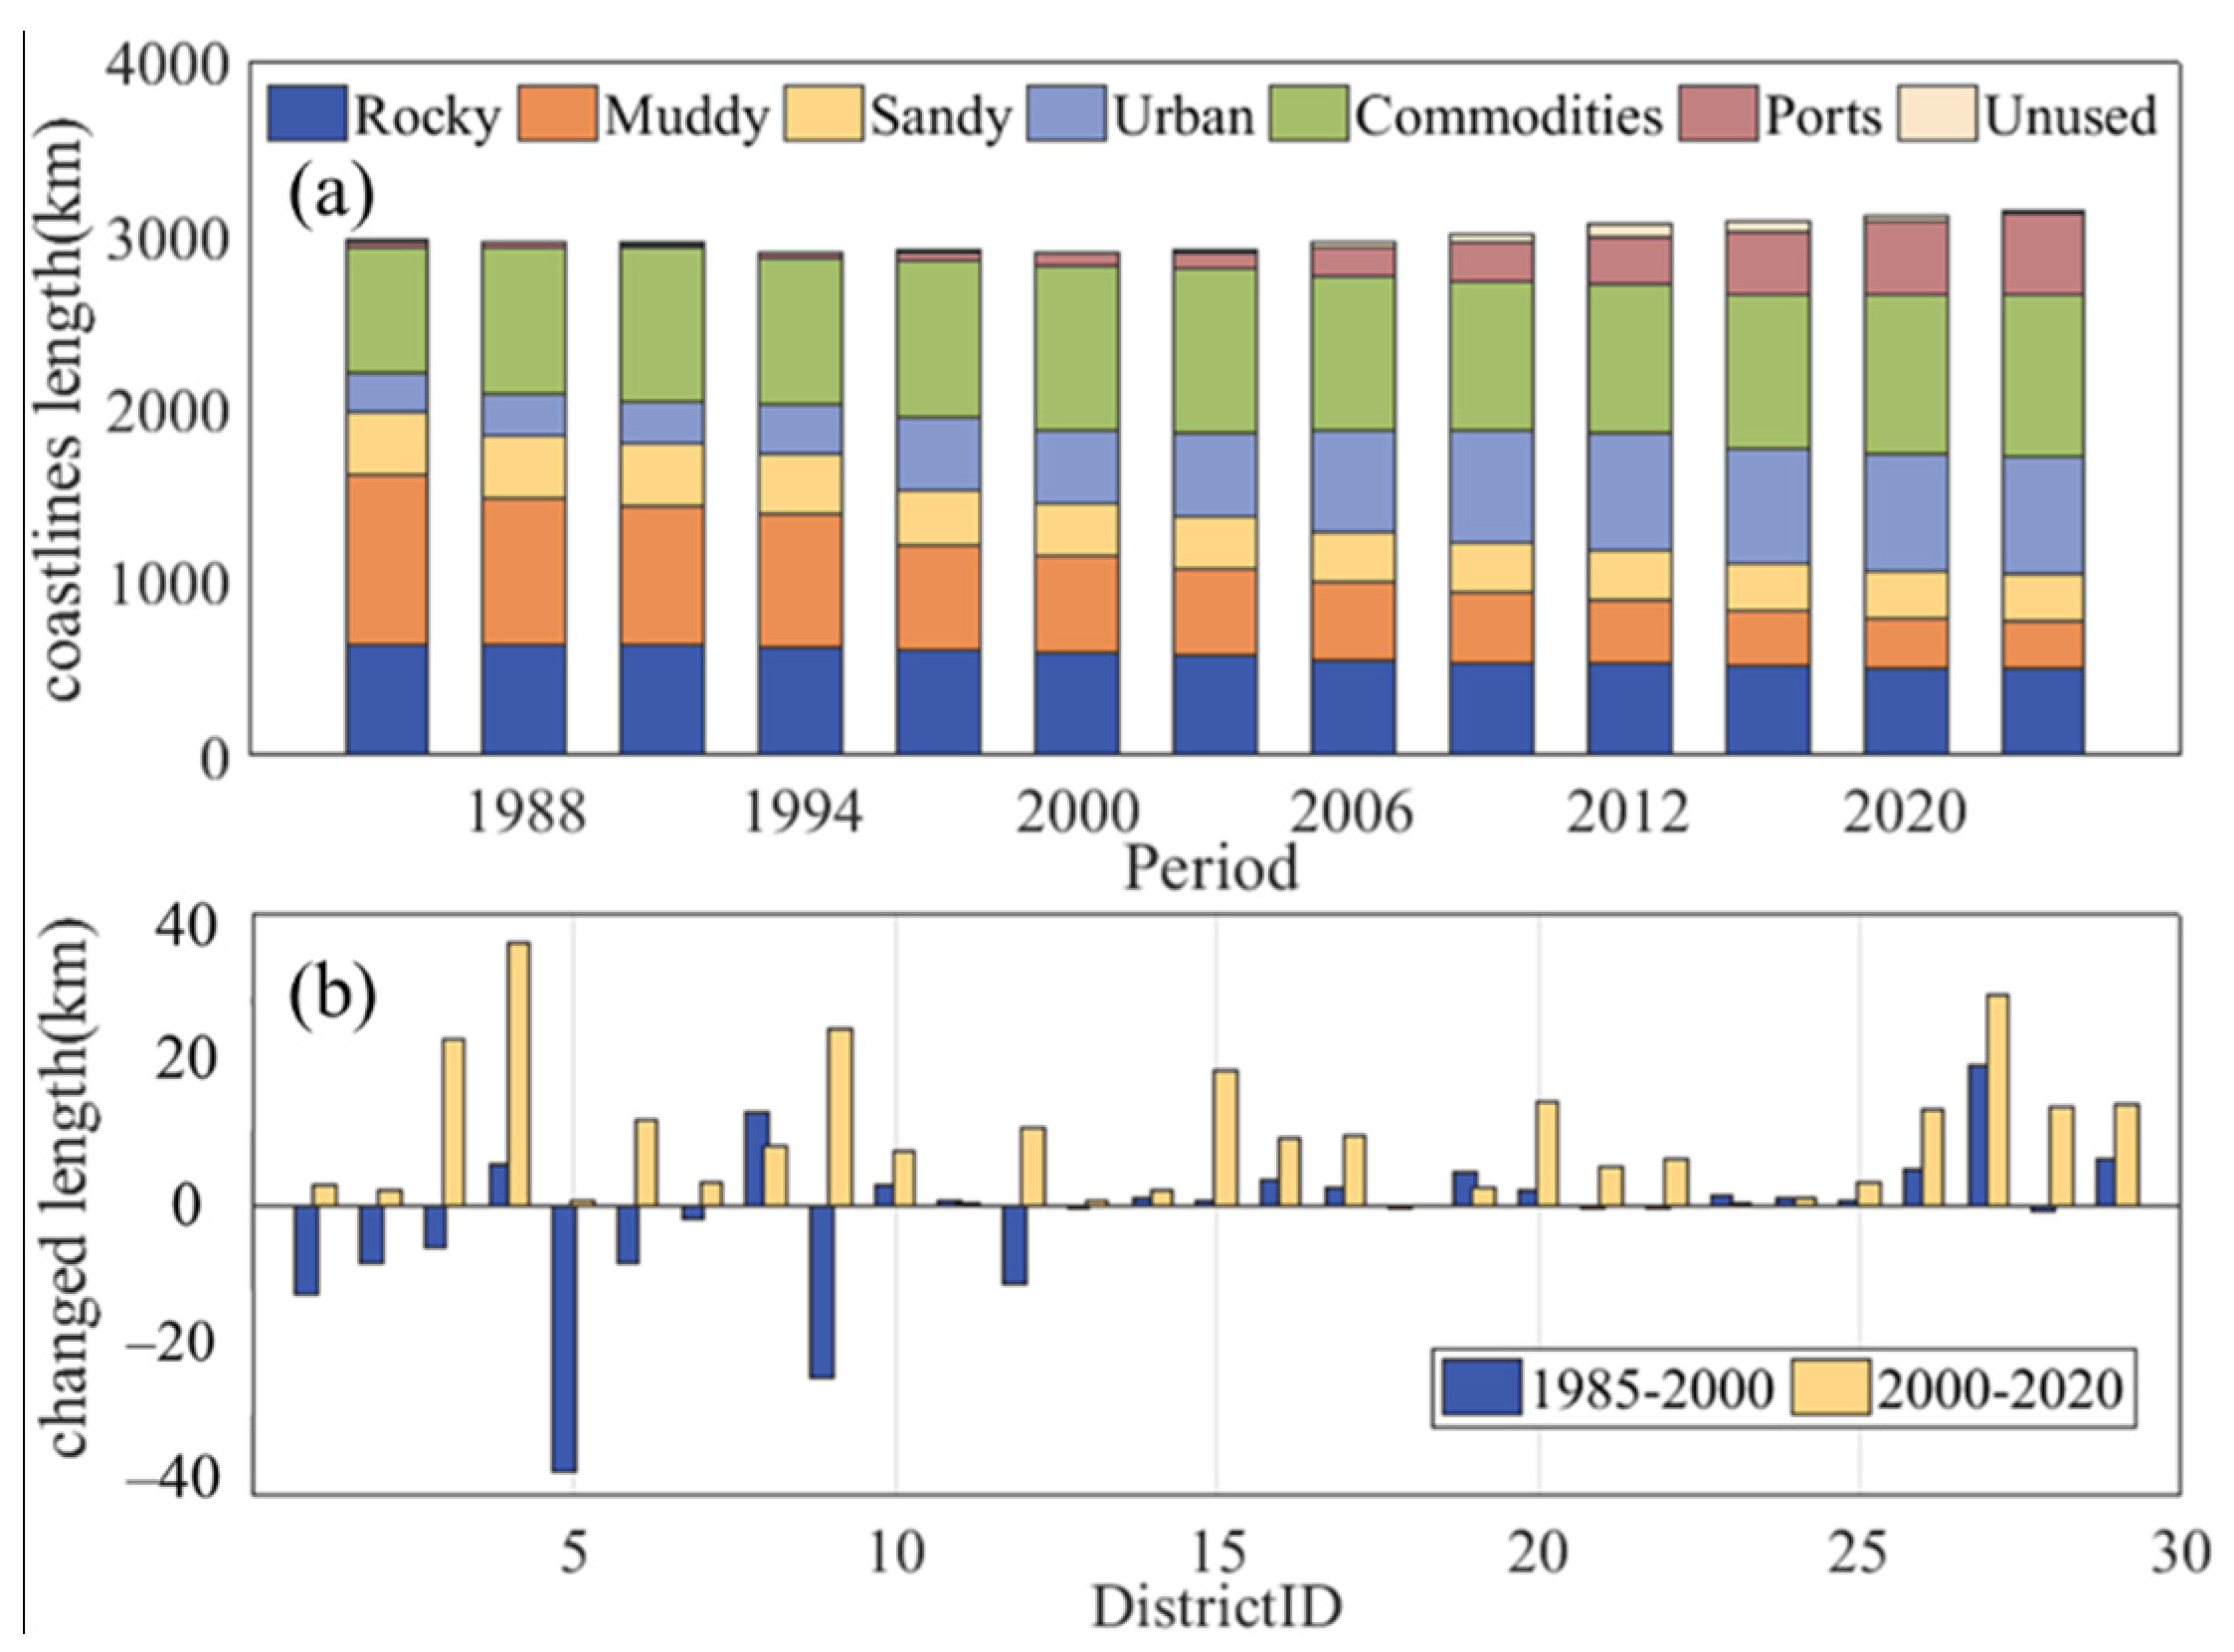
4.1. Changes in Length and Composition of Coastlines
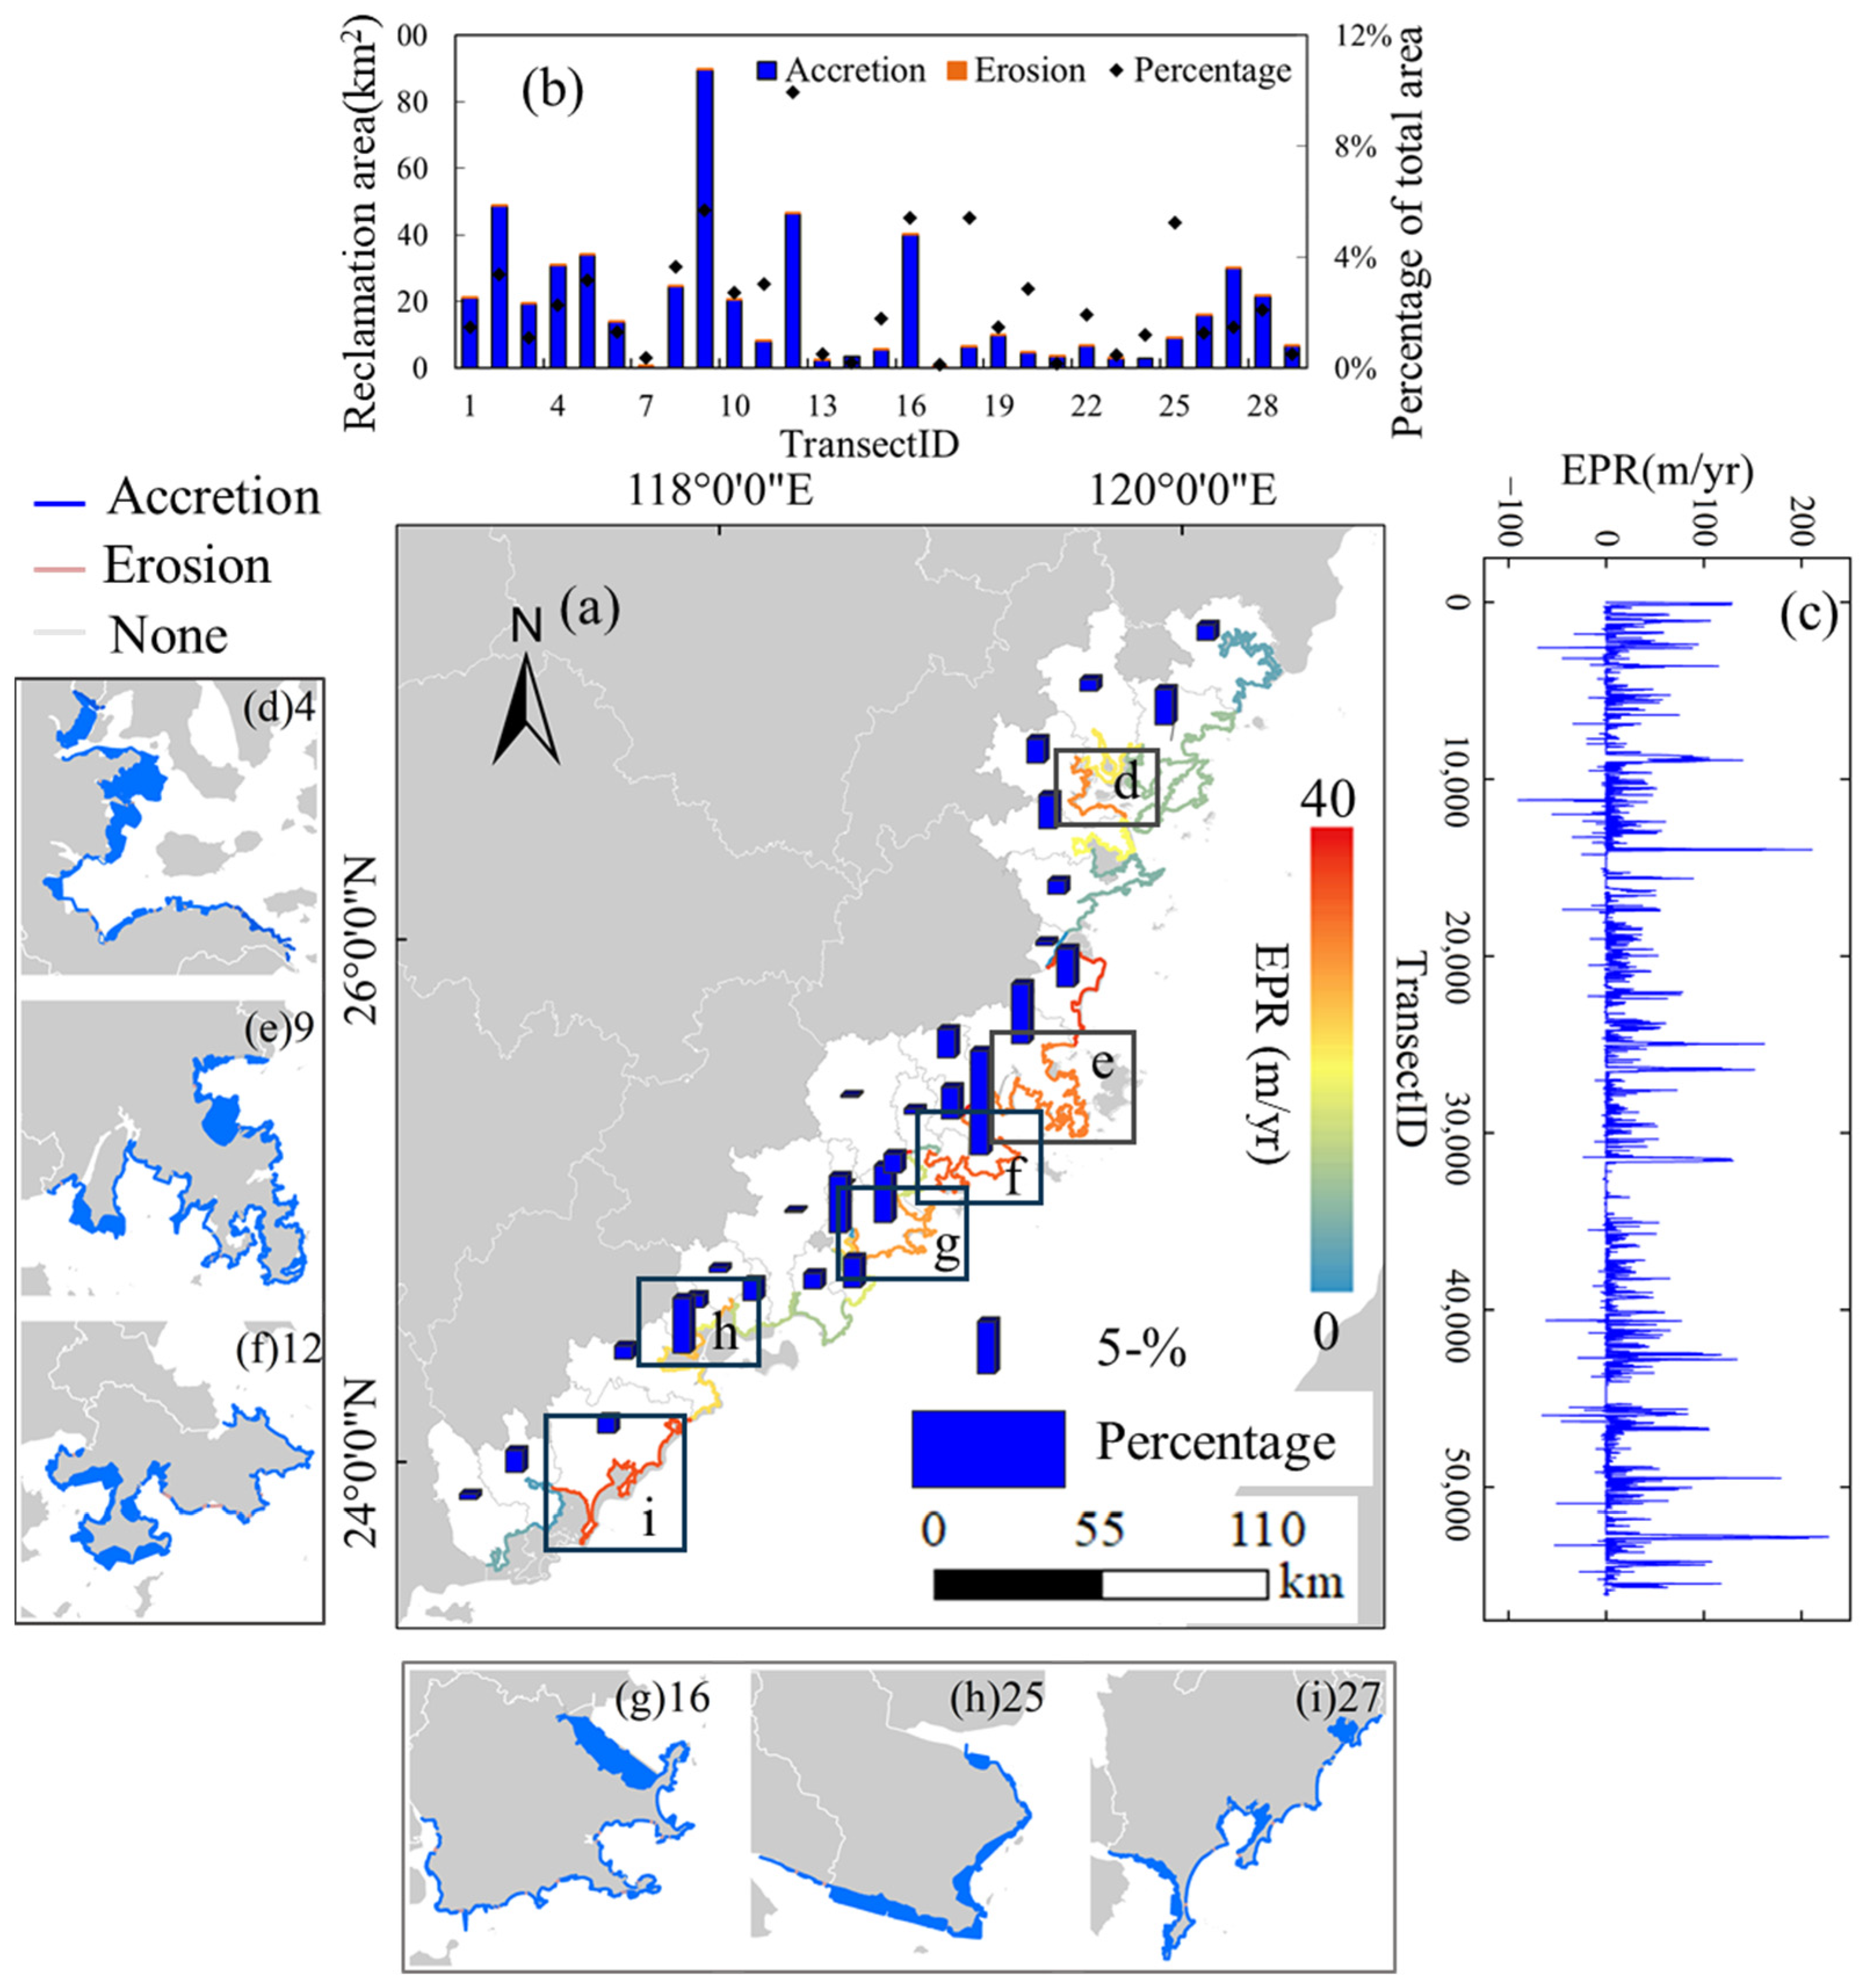
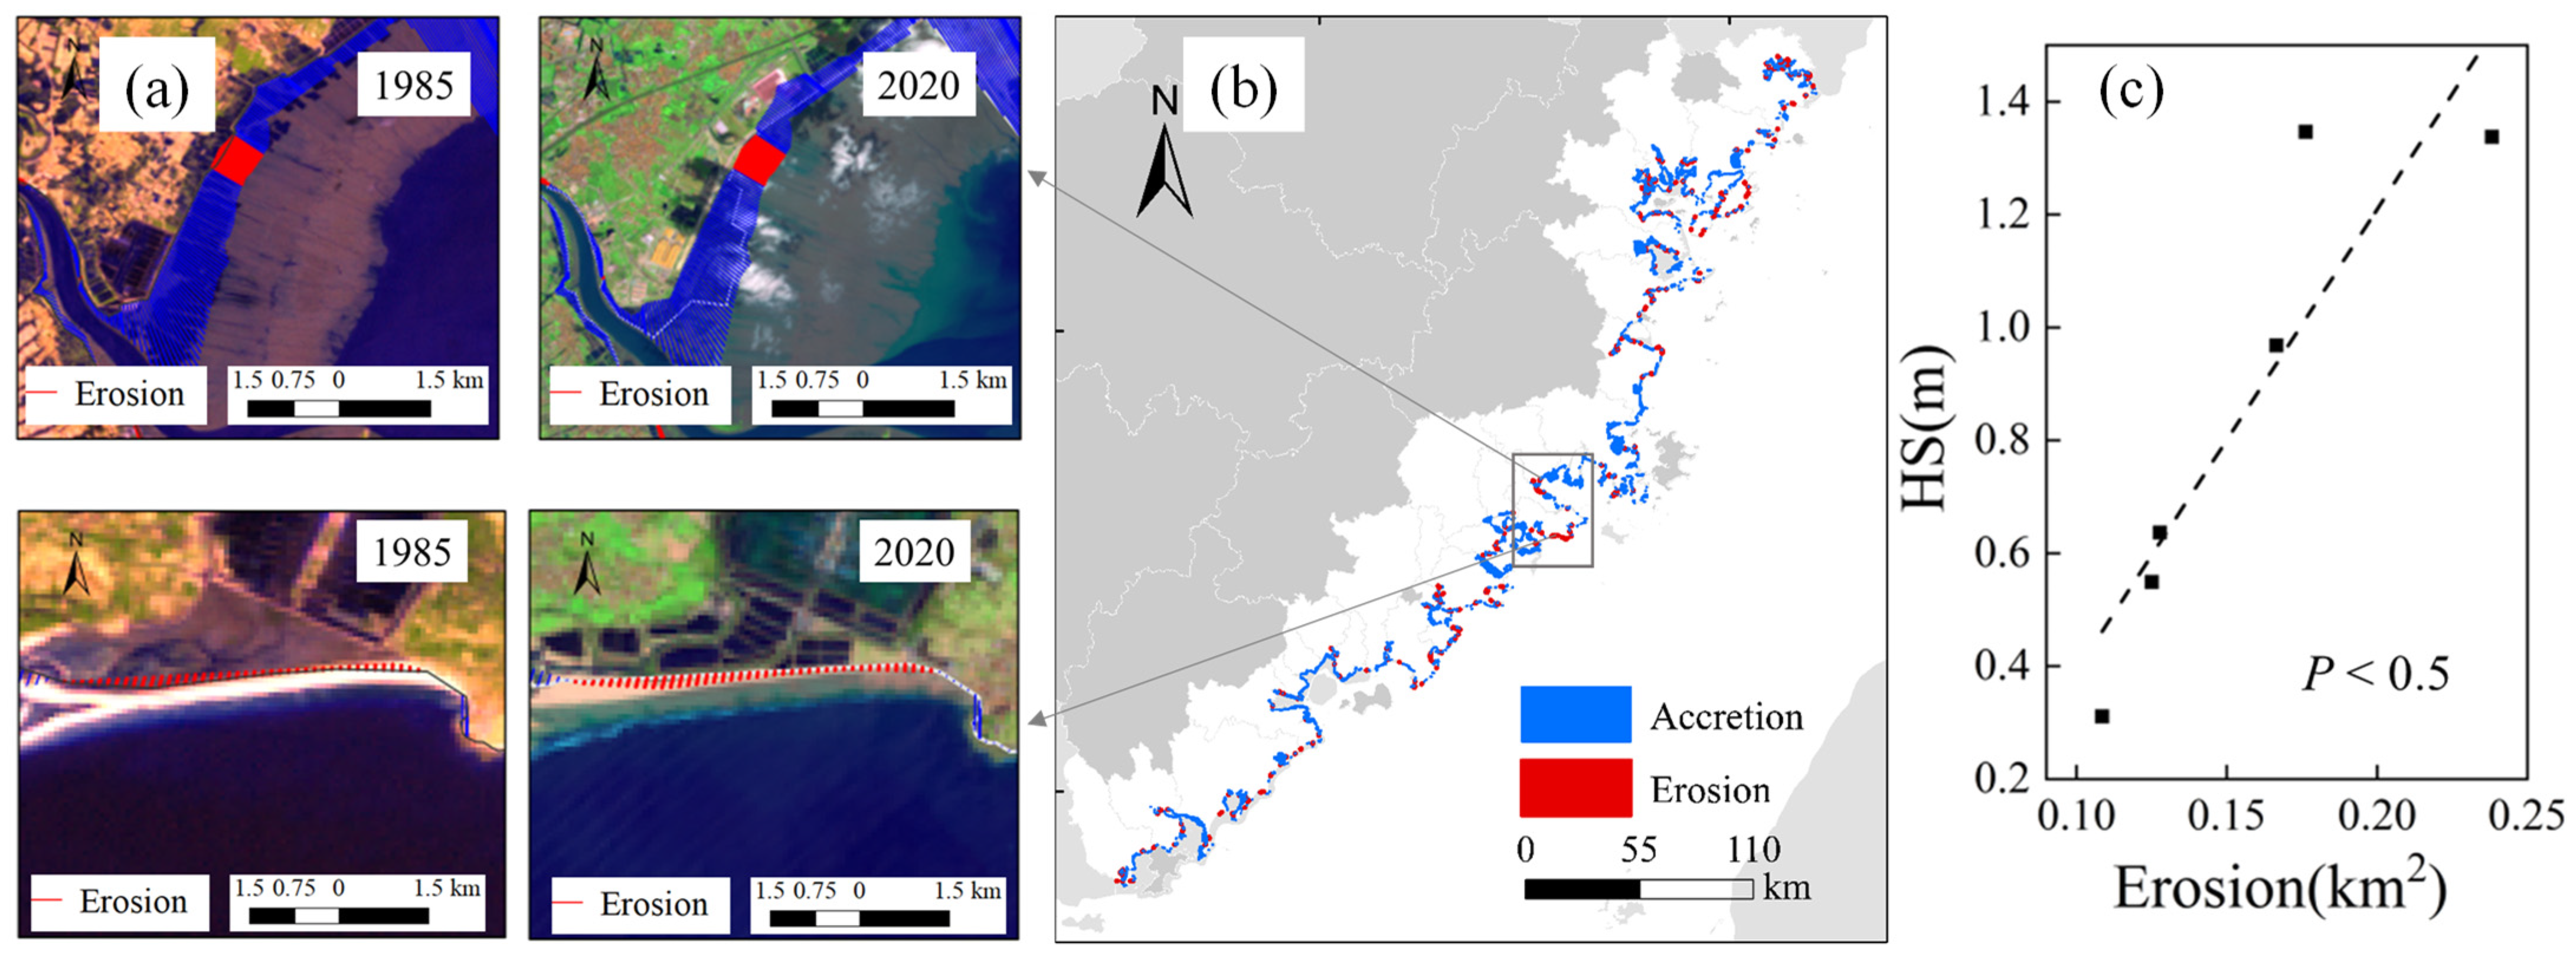
4.2. Spatial Dynamics of Coastlines
4.3. Changes in Coastline Utilization Degree
5. Discussion
6. Conclusions
Author Contributions
Funding
Data Availability Statement
Acknowledgments
Conflicts of Interest
References
- Tian, H.; Lindenmayer, D.B.; Wong, G.; Mao, Z.; Huang, Y.; Xue, X. A methodological framework for coastal development assessment: A case study of Fujian Province, China. Sci. Total Environ. 2018, 615, 572–580. [Google Scholar] [CrossRef] [PubMed]
- Liu, J. Analysis on environmental vulnerability of the coastal zone in Jiaozhou bay. Mar. Environ. Sci. 2016, 35, 750–755. [Google Scholar] [CrossRef]
- Wu, T.; Hou, X.; Xu, X. Spatio-temporal characteristics of the mainland coastline utilization degree over the last 70 years in China. Ocean. Coast. Manag. 2014, 98, 150–157. [Google Scholar] [CrossRef]
- Wu, W.; Zhi, C.; Gao, Y.; Chen, C.; Chen, Z.; Su, H.; Lu, W.; Tian, B. Increasing fragmentation and squeezing of coastal wetlands: Status, drivers, and sustainable protection from the perspective of remote sensing. Sci. Total Environ. 2022, 811, 152339. [Google Scholar] [CrossRef] [PubMed]
- Hou, X.; Wu, T.; Hou, W.; Chen, Q.; Wang, Y.; Yu, L. Characteristics of coastline changes in mainland China since the early 1940s. Sci. China Earth Sci. 2016, 59, 1791–1802. [Google Scholar] [CrossRef]
- Boak, E.H.; Turner, I.L. Shoreline definition and detection: A review. J. Coast. Res. 2005, 21, 688–703. [Google Scholar] [CrossRef] [Green Version]
- Li, X.; Damen, M.C.J. Coastline change detection with satellite remote sensing for environmental management of the Pearl River Estuary, China. J. Mar. Syst. 2010, 82, S54–S61. [Google Scholar] [CrossRef]
- Gao, Y.; Wang, H.; Su, F.; Liu, G. Spatial and temporal of continental coastline of China in recent decades. Acta Oceanol. Sin. 2013, 35, 31–42. [Google Scholar]
- Tian, B.; Wu, W.; Yang, Z.; Zhou, Y. Drivers, trends, and potential impacts of long-term coastal reclamation in China from 1985 to 2010. Estuar. Coast. Shelf Sci. 2016, 170, 83–90. [Google Scholar] [CrossRef]
- Wu, W.; Tian, B.; Zhou, Y.; Shu, M.; Qi, X.; Xu, W. The trends of coastal reclamation in China in the past three decades. Acta Ecol. Sin. 2015, 36, 5007–5016. [Google Scholar] [CrossRef]
- Zhang, Y.; Qiao, Q.; Liu, J.; Sang, H.; Yang, D.; Zhai, L.; Li, N.; Yuan, X. Coastline changes in mainland China from 2000 to 2015. Int. J. Image Data Fusion 2022, 13, 95–112. [Google Scholar] [CrossRef]
- National Bureau of Statistics of China. China Statistical Yearbook-2021. 2021. Available online: http://www.stats.gov.cn/tjsj/ndsj/2021/indexeh.htm (accessed on 10 July 2021).
- Chen, Z.; Yu, B.; Yang, C.; Zhou, Y.; Wu, J. An extended time-series (2000–2018) of global NPP-VIIRS-like nighttime light data from a cross-sensor calibration. Earth Syst. Sci. Data 2020, 13, 889–906. [Google Scholar] [CrossRef]
- Wu, T.; Hou, X. Review of research on coastline changes. Acta Ecol. Sin. 2016, 36, 1170–1182. [Google Scholar] [CrossRef]
- Toure, S.; Diop, O.; Kpalma, K.; Maiga, A.S. Shoreline detection using optical remote sensing: A review. ISPRS Int. J. Geo-Inf. 2019, 8, 75. [Google Scholar] [CrossRef] [Green Version]
- Xiu, C.; Hou, S.; Yao, H.; Duan, H.; Du, M. Coastline Classification for Strictly Controlling Natural Coastline in the New Era. Sci. Geogr. Sin. 2022, 42, 333–342. [Google Scholar] [CrossRef]
- Sun, W.; Ma, Y.; Zhang, J.; Liu, S.; Ren, G. Study of Remote Sensing interpretation Keys and Extraction Technique of Different types of Shoreline. Bull. Surv. Mapp. 2011, 3, 41–44. [Google Scholar]
- Liu, X.; Deng, R.; Xu, J.; Gong, Q. Spatiotemporal Evolution Characteristics of Coastlines and Driving Force Analysis of the Pearl River Estuary in the Past 40 Years. J. Geo-Inf. Sci. 2017, 19, 1336–1345. [Google Scholar] [CrossRef]
- Ai, B.; Zhang, R.; Zhang, H.; Ma, C.; Gu, F. Dynamic process and artificial mechanism of coastline change in the Pearl River Estuary. Reg. Stud. Mar. Sci. 2019, 30, 100715. [Google Scholar] [CrossRef]
- Gao, S. Analysis of Interpretation Quality of Remote Sensing Image for Railway Engineering Geology. J. Railw. Eng. Soc. 2010, 8, 25–28, 37. [Google Scholar]
- Muskananfola, M.R.; Supriharyono; Febrianto, S. Spatio-temporal analysis of shoreline change along the coast of Sayung Demak, Indonesia using Digital Shoreline Analysis System. Reg. Stud. Mar. Sci. 2020, 34, 101060. [Google Scholar] [CrossRef]
- Liu, R.; Zhang, J.; Qiu, S.; Zhao, Z.; Liu, S.; Ma, Y. Remote sensing monitoring and analysis of shoreline evolution in estuaries of Fujian Province from 1982 to 2012. J. Appl. Oceanogr. 2014, 03, 425–433. [Google Scholar] [CrossRef]
- Zhuang, D.; Liu, J. Study on the Model of Regional Differentiationof Land Use Degree in China. J. Nat. Resour. 1997, 12, 10–16. [Google Scholar] [CrossRef]
- Cui, H.; Wang, C.; Yang, H.; Hu, Z.; Ang, C. Analysis of spatiotemporal dynamic changes of the north Jiangsu coastline in the past 40 years. Mar. Environ. Sci. 2020, 39, 694–702. [Google Scholar] [CrossRef]
- National Bureau of Statistics. China Statistical Yearbook-2019. 2019. Available online: http://www.stats.gov.cn/tjsj/ndsj/2019/indexeh.htm (accessed on 10 July 2021).
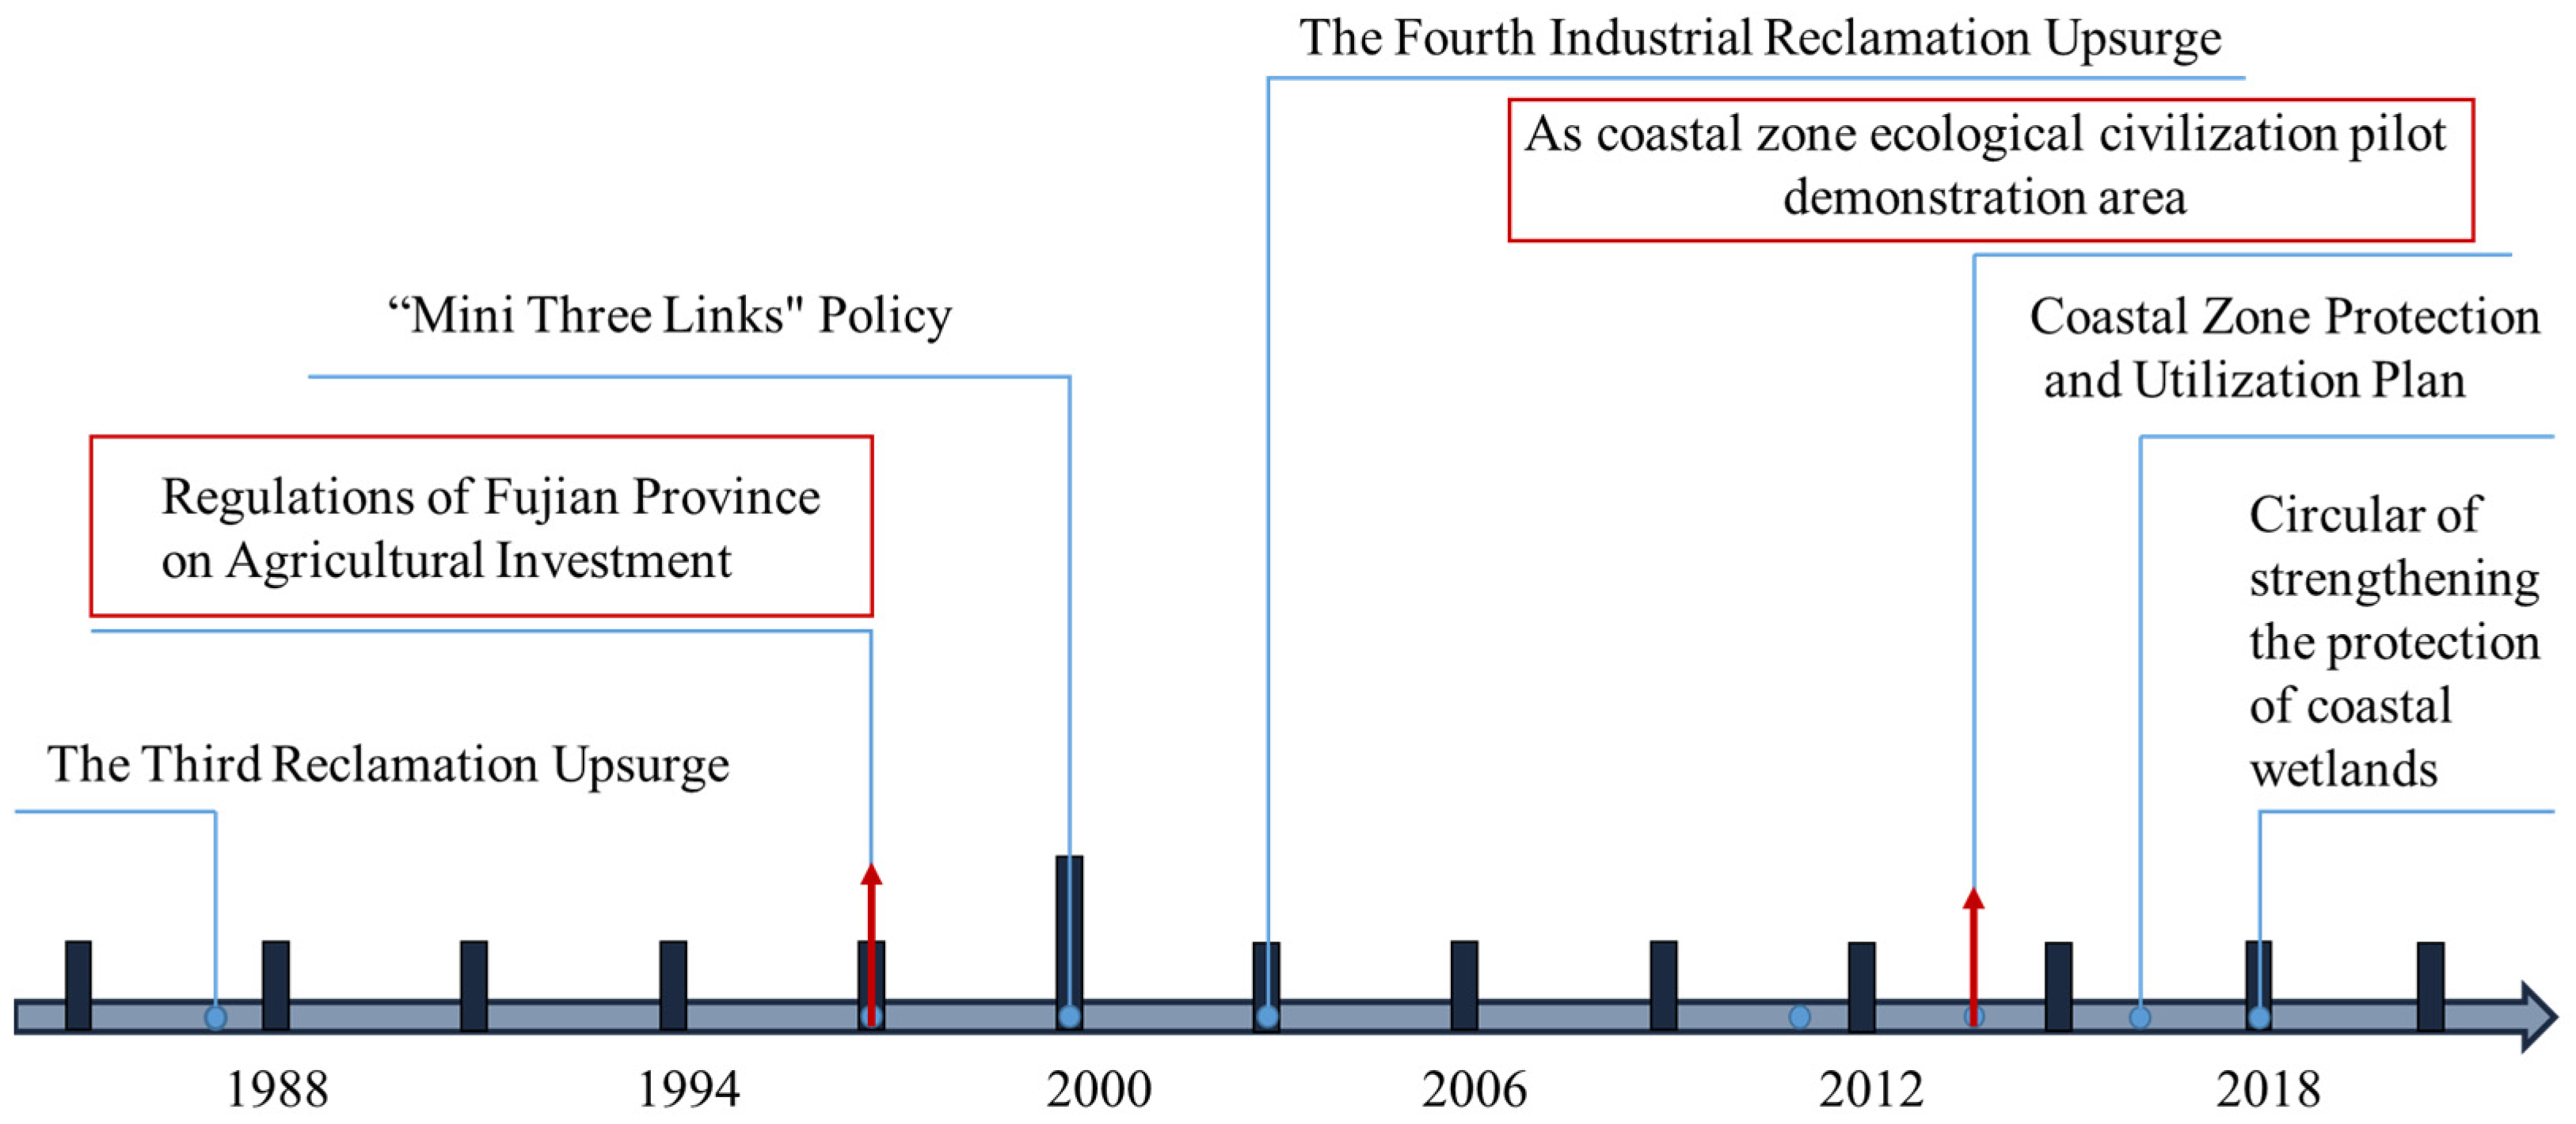
- Wang, W.; Liu, H.; Li, Y.; Su, J. Development and management of land reclamation in China. Ocean. Coast. Manag. 2014, 102, 415–425. [Google Scholar] [CrossRef]
- Regulations of Fujian Province on Agricultural Investment. 1997. Available online: http://www.law-lib.com/law/law_view.asp?id=29460 (accessed on 10 July 2021).
- News background: Major Events in the Process of Cross-Strait “Three Links”. 2013. Available online: http://www.gov.cn/jrzg/2013-12/14/content_2547693.htm (accessed on 10 July 2021).
- Circular of the State Council on Printing and Distributing the Outline of the National Marine Economic Development Plan. 2003. Available online: http://www.gov.cn/zhengce/content/2008-03/28/content_2657.htm (accessed on 10 July 2021).
- Several Opinions of the State Council on Supporting Fujian Province to Deeply Implement the Ecological Province Strategy and Speed Up the Construction of the First Demonstration Area of Ecological Civilization. 2014. Available online: http://www.gov.cn/zhengce/content/2014-04/09/content_8745.htm (accessed on 10 July 2021).
- Development and Reform Commission of Fujian province (DRCF). Master Plan for Coastal Protection and Utilization in Fujian Province (2016–2020). 2016. Available online: http://hyyyj.fujian.gov.cn/xxgk/fgwj/201608/P020180331553180619802.pdf (accessed on 10 July 2021).
- Circular of the State Council on Strengthening the Protection of Coastal Wetlands and Strictly Controlling Reclamation. 2018. Available online: http://www.gov.cn/zhengce/content/2018-07/25/content_5309058.htm (accessed on 10 July 2021).
- Wu, W.; Yang, Z.; Chen, C.; Tian, B. Tracking the environmental impacts of ecological engineering on coastal wetlands with numerical modeling and remote sensing. J. Environ. Manag. 2022, 302, 113957. [Google Scholar] [CrossRef]
- Temmerman, S.; Meire, P.; Bouma, T.J.; Herman, P.M.J.; Ysebaert, T.; de Vriend, H.J. Ecosystem-based coastal defence in the face of global change. Nature 2013, 504, 79–83. [Google Scholar] [CrossRef]
- Kirwan, M.L.; Megonigal, J.P. Tidal wetland stability in the face of human impacts and sea-level rise. Nature 2013, 504, 53–60. [Google Scholar] [CrossRef]
- Marjolijn, H.; Judy, L.; Alexandre, K.M. Pathways to coastal retreat. Science 2021, 372, 1287–1290. [Google Scholar] [CrossRef]
- Scyphers, S.B.; Beck, M.W.; Furman, K.L.; Haner, J.; Keeler, A.G.; Landry, C.E.; O’Donnell, K.L.; Webb, B.M.; Grabowski, J.H. Designing effective incentives for living shorelines as a habitat conservation strategy along residential coasts. Conserv. Lett. 2020, 13, e12744. [Google Scholar] [CrossRef]


| Data | Sources | Timespan |
|---|---|---|
| Landsat Images | https://earthengine.google.com/ (accessed on 6 September 2020) | 1985–2020 |
| Nighttime light data | DOI:10.5194/essd-2020-201 [13] | 2000–2018 |
| Population and GDP | http://www.stats.gov.cn/ (accessed on 10 July 2021) | 1985–2020 |
| GF-2 Images | Geomatic Center of Fujian Province | 2020 |
| Significant wave height dataset | http://doi.org/10.11922/sciencedb.j00001.00038 (accessed on 10 July 2021) | 2018 |
| Categories | Features | Sample Images | |
|---|---|---|---|
| Natural coastlines | Rocky coastlines | The boundary between a cape or vertical cliff and the ocean with a clear edge. |  |
| Muddy coastlines | The boundary of muddy flats with natural vegetation grows on. |  | |
| Sandy coastlines | The boundary of the ridge-like sandy sedimentary belt on the beach. |  | |
| Artificial coastlines | Urban coastlines | The boundary between human settlements and the sea with regular and clear edges. |  |
| Port coastlines | The boundary of ports with regular geometric structure. |  | |
| Commodity coastlines | The boundary of reclamation projects for aquaculture and agriculture. |  | |
| Unused coastlines | The boundary of reclaimed areas but not been used yet. |  | |
| Coastline Type | Urban | Ports | Commodities | Unused | Rocky Coastline | Muddy Coastline | Sandy Coastline |
|---|---|---|---|---|---|---|---|
| Ci | 1 | 0.8 | 0.6 | 0.2 | 0.1 | 0.1 | 0.1 |
Publisher’s Note: MDPI stays neutral with regard to jurisdictional claims in published maps and institutional affiliations. |
© 2022 by the authors. Licensee MDPI, Basel, Switzerland. This article is an open access article distributed under the terms and conditions of the Creative Commons Attribution (CC BY) license (https://creativecommons.org/licenses/by/4.0/).
Share and Cite
Wu, W.; Gao, Y.; Chen, C.; Sun, Y.; Su, H. A Framework for Assessing the Dynamic Coastlines Induced by Urbanization Using Remote Sensing Data: A Case Study in Fujian, China. Remote Sens. 2022, 14, 2911. https://doi.org/10.3390/rs14122911
Wu W, Gao Y, Chen C, Sun Y, Su H. A Framework for Assessing the Dynamic Coastlines Induced by Urbanization Using Remote Sensing Data: A Case Study in Fujian, China. Remote Sensing. 2022; 14(12):2911. https://doi.org/10.3390/rs14122911
Chicago/Turabian StyleWu, Wenting, Yiwei Gao, Chunpeng Chen, Yu Sun, and Hua Su. 2022. "A Framework for Assessing the Dynamic Coastlines Induced by Urbanization Using Remote Sensing Data: A Case Study in Fujian, China" Remote Sensing 14, no. 12: 2911. https://doi.org/10.3390/rs14122911
APA StyleWu, W., Gao, Y., Chen, C., Sun, Y., & Su, H. (2022). A Framework for Assessing the Dynamic Coastlines Induced by Urbanization Using Remote Sensing Data: A Case Study in Fujian, China. Remote Sensing, 14(12), 2911. https://doi.org/10.3390/rs14122911