Article

Assessment of Polar Ionospheric Observations by VIPIR/Dynasonde at Jang Bogo Station, Antarctica: Part 1—Ionospheric Densities

1
Division of Atmospheric Sciences, Korea Polar Research Institute, Incheon 21990, Korea
2
Department of Polar Science, Korea University of Science and Technology, Daejeon 34113, Korea
3
Department of Electrical, Energy and Computer Engineering, University of Colorado, Boulder, CO 80309, USA
4
Korea Astronomy and Space Science Institute, Daejeon 34055, Korea
5
Cooperative Institute for Research in Environmental Sciences, University of Colorado, Boulder, CO 80309, USA
*
Author to whom correspondence should be addressed.
Remote Sens. 2022, 14(12), 2785; https://doi.org/10.3390/rs14122785
Submission received: 6 May 2022 / Revised: 7 June 2022 / Accepted: 7 June 2022 / Published: 10 June 2022
(This article belongs to the Special Issue Ionosphere Monitoring with Remote Sensing)

Abstract

:
Vertical incidence pulsed ionospheric radar (VIPIR) has been operated to observe the polar ionosphere with Dynasonde analysis software at Jang Bogo Station (JBS), Antarctica, since 2017. The JBS-VIPIR-Dynasonde (JVD) provides ionospheric parameters such as the height profile of electron density with NmF2 and hmF2, the ion drift, and the ionospheric tilt in the bottomside ionosphere. The JBS (74.6°S, 164.2°E) is located in the polar cap, cusp, or auroral region depending on the geomagnetic activity and local time. In the present study, an initial assessment of JVD ionospheric densities is attempted by the comparison with GPS TEC measurements which are simultaneously obtained from the GPS receiver at JBS during the solar minimum period from 2017 to 2019. It is found that the JVD NmF2 and bottomside TEC (bTEC) show a generally good correlation with GPS TEC for geomagnetically quiet conditions. However, the bTEC seems to be less correlated with the GPS TEC with slightly larger spreads especially during the daytime and in summer, which seems to be associated with the characteristics of the polar ionosphere such as energetic particle precipitations and large density irregularities. It is also found that the Dynasonde analysis seems to show some limitations to handle these characteristics of the polar ionosphere and needs to be improved to produce more accurate ionospheric density profiles especially during disturbed conditions.

1. Introduction

The ionospheric density is principally governed by solar EUV radiation, but the polar ionospheric density exhibits various characteristic features due to the additional magnetospheric forcings such as electric fields and energetic particles as well as the unique geometry of nearly vertical geomagnetic field line (e.g., [1,2]). The energetic particles precipitate into the polar upper atmosphere and produce additional ionization mainly in the auroral region but also in the polar cap region. The soft electron precipitation also produces the F-region ionization in the cusp region. The polar ionospheric density is further redistributed by the plasma convection induced by the magnetospheric electric field, which transports the dayside plasma to the night side to produce the characteristic features of the polar cap ionosphere, such as the tongue of ionization (TOI) and the polar cap patch (e.g., [3,4]). The ionospheric density distributions in the polar region are closely associated with coupling processes between the ionosphere and the magnetosphere, being strongly affected by solar wind conditions, which makes it difficult to understand and requires routine monitoring of the states of the polar ionosphere. Another important factor of the polar ionosphere’s dynamics is its atmospheric wave activity.
The world-wide network of ionosondes has a relatively good coverage over the globe, but it is sparse at high latitudes, particularly in the southern hemisphere. Other ground-based observations for the polar ionospheric density are also mostly located in the Arctic: for example, incoherent scatter radars (ISRs) at Poker Flat (Alaska), Resolute Bay (Canada), Sondrestrom (Greenland), Kiruna (Sweden), Tromsø and Svalbard (Norway), and Sodankylä (Finland). On the other hand, there are only a few observation sites for the ionospheric density in the southern polar region. Only one ISR has been operational in Syowa station, and a few digisondes are operational, for example, at Zhongshan station and Casey station. Recently, an ionospheric sounding system was installed at Jang Bogo Station (JBS), Antarctica, and started operating in 2017 to collect ionospheric parameters in the southern polar region. The sounding system is called the Vertical Incidence Pulsed Ionospheric Radar (VIPIR), and it utilizes the Dynasonde mode of operation and the Dynasonde analysis software to conduct echo recognitions and ionogram inversions to produce ionospheric parameters such as bottomside ionospheric electron density profiles with error bars, the F-region peak density (NmF2) and the peak height (hmF2), estimates for the ion drifts, and ionospheric tilts [5,6,7,8]. The JBS-VIPIR-Dynasonde (JVD) is distinguished from a conventional digital ionosonde, for example, the digisonde series from Lowell Digisonde International, which is one of the most widely operated digital ionospheric sounding systems around the globe (e.g., see https://www.digisonde.com/index.html, accessed on 3 March 2022). The data acquisition and analysis procedures in the Dynasonde are performed with minimized assumptions and no data pre-processing such as Fourier transform is applied to reduce the loss of precision in the phase-based physical parameters of the radio echoes such as the line-of-sight Doppler, range resolution, and angles of arrival of received signals. This approach also allows the application of sophisticated upper-level analysis techniques producing parameters of the Traveling Ionospheric Disturbances (TIDs), of kilometer-scale irregularities, and vector velocities of the isodensity ionization contours, all from a single standard ionogram mode. All of this data processing is performed autonomously and in real time. Historically, there have been a few Dynasondes in the polar regions such as at the EISCAT Tromsø and Svalbard observatories, at the IRF Kiruna and Lycksele stations in the northern polar region, and at the Halley base in Antarctica. However, those at Lycksele and at the Halley base are no longer in operation. The JVD is currently the only available Dynasonde for the ionospheric observation in the southern polar region. In order to evaluate the overall quality of the ionospheric data obtained from JVD, we compare the JVD bottomside ionospheric densities with the independent measurements of total electron content (TEC) from a Global Positioning System (GPS) receiver simultaneously operated at JBS. We fully understand that parameters measured by the two instruments are not exactly the same. However, the GPS TEC is the only available measurement related to the ionospheric density to be compared with JVD data at the moment. There have been a few comparison studies between ionosonde and GPS TEC measurements. However, these are mostly conducted at low and middle latitudes [9,10,11], and no comparison has been performed in the polar region. As for the other ionospheric parameter such as ion drift and irregularity, there will be a separate study on the comparison with the SuperDARN radar observations around JBS. In the following sections, we briefly introduce the observations of JVD densities, as well as GPS TEC, and the results of the comparison will be presented.

2. Data

2.1. The Observation of Ionospheric Density from JVD

The VIPIR was installed at JBS (74.62° S, 164.23° E geographic coordinates and 79.87° S geomagnetic latitude), Antarctica, in 2015, but the ionospheric data with a high temporal resolution of 2 min were not available until 2017, when the installation and subsequent test operations were complete. The Dynasonde data analysis procedure estimates the ionospheric quantities by using the echo information, including two angles of arrival, phase-based group range, line-of-sight Doppler, polarization, and amplitude. Every sounding session produces a long list (up to a few thousand) of detected radio echoes. The echo information is inverted to the height profiles of ionospheric density, of the vertical Doppler, and of the two tilt components via the NeXtYZ inversion procedure within the Dynasonde analysis software [8] to produce the ionospheric parameters. More details of the VIPIR hardware and Dynasonde software can be found in Ham et al. [7].
In principle, the ground-based ionospheric sounding technique is optimized to measure the height profiles of the bottomside ionosphere when the density monotonically increases to the F-region peak with the increase in height. Note that it is not intended for TEC measurements since no direct information of the topside ionosphere is available from the ground sounding technique. It is also important to notice that the ionospheric density profiles can be severely disturbed, especially in the polar region during magnetic storm/substorm or sporadic E. For example, when the E-region peak density (NmE) exceeds the NmF2 during auroral events, the ionosonde can theoretically observe the density only up to the E-region peak height (hmE) around 110–120 km and is unable to observe the F-region ionosphere. The ionospheric density with so-called E-layer-dominated ionosphere (ELDI) has been frequently observed in the auroral region, for example, in Tromsø and Svalbard in the winter for the solar minimum period [12]. During the ELDI events, the radar signals from the ionosonde are blocked and cannot reach above the E-layer peak heights, and the F-region density profiles can only be observed by other observation techniques such as ISRs [2,12] and GPS radio occultation from COSMIC or CHAMP satellites [13,14]. Since the JBS is mostly located in the polar cap during the nighttime, at the vicinity of the poleward boundary of the auroral oval at dawn and dusk, and in the cusp region near magnetic local noon [15], the ionospheric density profiles can be affected by geomagnetic activities. It is found that the JVD observations can be erroneous when the ionosphere is severely disturbed, as will be shown later in the paper. In order to minimize the effects of the severely disturbed ionosphere as well as the ELDI events from JVD observations, we perform the assessment study only for geomagnetically quiet times (Kp < 2), during which about 80% of the data were utilized. The ionospheric density parameters including NmF2 and bottomside TEC (bTEC) from the JVD observations are compared with the GPS TEC measurements during the solar minimum years of 2017 to 2019. The mean F10.7 index was about 72 solar flux units (sfu) for the three-year period. The JVD observations for disturbed times will be briefly discussed in Section 4.

2.2. The Observation of GPS TEC at JBS

The National Geographic Information Institute (NGII) has been operating a dual-frequency GPS receiver at JBS for geodetic survey, providing a slant TEC (STEC) along a ray path between the GPS satellites and the receiver. The STECs were derived by the Space Geodesy group at the Korea Astronomy and Space Science Institute (KASI) with a 30 s time interval using a geometry-free combination as below:
STEC P = 1 40.3 f 1 2 f 2 2 f 1 2 f 2 2 ( P 2 P 1 ) ,
STEC L = 1 40.3 f 1 2 f 2 2 f 1 2 f 2 2 ( ϕ 1 λ 1 ϕ 2 λ 2 ) ,
where f and λ are the signal frequency and wavelength, respectively, and P and ϕ are pseudorange measurements and carrier phase measurements, respectively. The unit of TEC is TECU (1 TECU = 1016 electrons/m2). The STECP is absolute but noisy, while STECL is more precise but includes ambiguities. Therefore, the final STECs are derived through a phase leveling from both code and carrier-phase-based STECs within an arc of each satellite [16]. Then, the STECs can be converted into vertical TECs (VTECs) using a single layer approximation as follows:
VTEC = 1 ( R E R E + h i p p cos ( e l ) ) 2 × ( STEC b r b s ) ,
where RE and el are the Earth’s radius and the elevation angle of the satellite, respectively, and hipp is the height of the ionospheric pierce point (IPP), which is set to be 350 km in altitude in this study. The bs and br are the differential code biases (DCBs) of the satellites and the receiver, respectively. The satellite DCBs are provided by the Center for Orbit Determination in Europe of Astronomical Institute University of Bern, and the receiver DCBs are calculated from a single-receiver method [17].
The STEC to VTEC conversion is inherently ambiguous. As noted above, it invokes a thin-shell model of the ionosphere. This model is easy to handle, but it is very far from being realistic, as it compresses electron content from the altitude range extending up to about 20,000 km into the single point at about 350 km (the effective altitude of the shell). The unrealistic character of the thin-shell model may introduce substantial uncertainty into the VTEC estimates. Even though the phase leveling is applied for more precise TEC and both satellite and receiver DCBs are corrected, it is still challenging to estimate TEC in Antarctica. Extremely low electron density in high latitude regions can sensitize the TEC estimation because even a small amount of TEC changes in the phase-leveling process could be critical. Furthermore, strong ionospheric density irregularities causing scintillations or loss of signal lock are frequent at JBS during the December solstice [18], and they can also affect the phase-leveling accuracy, owing to the changes in ambiguities. This means that using VTEC data as a truth for assessing an ionospheric sounding data has a certain limitation.
A lack of the TEC measurements with high elevation angles greater than about 70° due to the inclination of GPS satellites causes large displacements among the IPPs within a specific time window. At the same time, there are various ionospheric density structures in the polar region, causing large density variations. For example, the density levels of TOI or the polar cap patch in the polar ionosphere can be at least two times greater than the ambient electron density [19]. Hence, the resulting large density gradients with large displacements of IPPs in the GPS TEC measurements should be considered in the comparison with the JVD densities. Even though a cut-off elevation angle of 15°~30° is typically applied to avoid multipath effects [20,21], it may not be appropriate for representing the VTECs over the JBS. Therefore, we used the larger elevation cut-off angle of 50° to increase the accuracy of the averaged VTECs at the zenith of JBS during the times when the JVD ionospheric density measurements were available. Figure 1a shows the spatial distribution of IPPs around the JBS for the GPS TEC measurements with the elevation angles greater than 50° for a day (DOY 291, 2018) as an example. Note that the spatial distributions of IPPs are mostly located at the lower latitudes of the JBS, considering the 55° inclination of GPS satellites. They are mostly located within less than 2.5° around the JBS (i.e., within about 250 km of the JBS). This spatial difference from the JBS may still be large and may not be negligible for the comparison between JVD electron densities and GPS TEC measurements, so it needs to be considered to interpret the results of the comparison. There are about 1~4 GPS satellites located around the JBS for a 10 min time interval, during which the JVD densities and GPS TEC measurements are averaged for the comparison. Figure 1b shows the traces of the GPS satellite paths for 10 min in the azimuth-elevation coordinate.

3. Comparisons between JVD-Observed Densities and GPS TEC Measurements

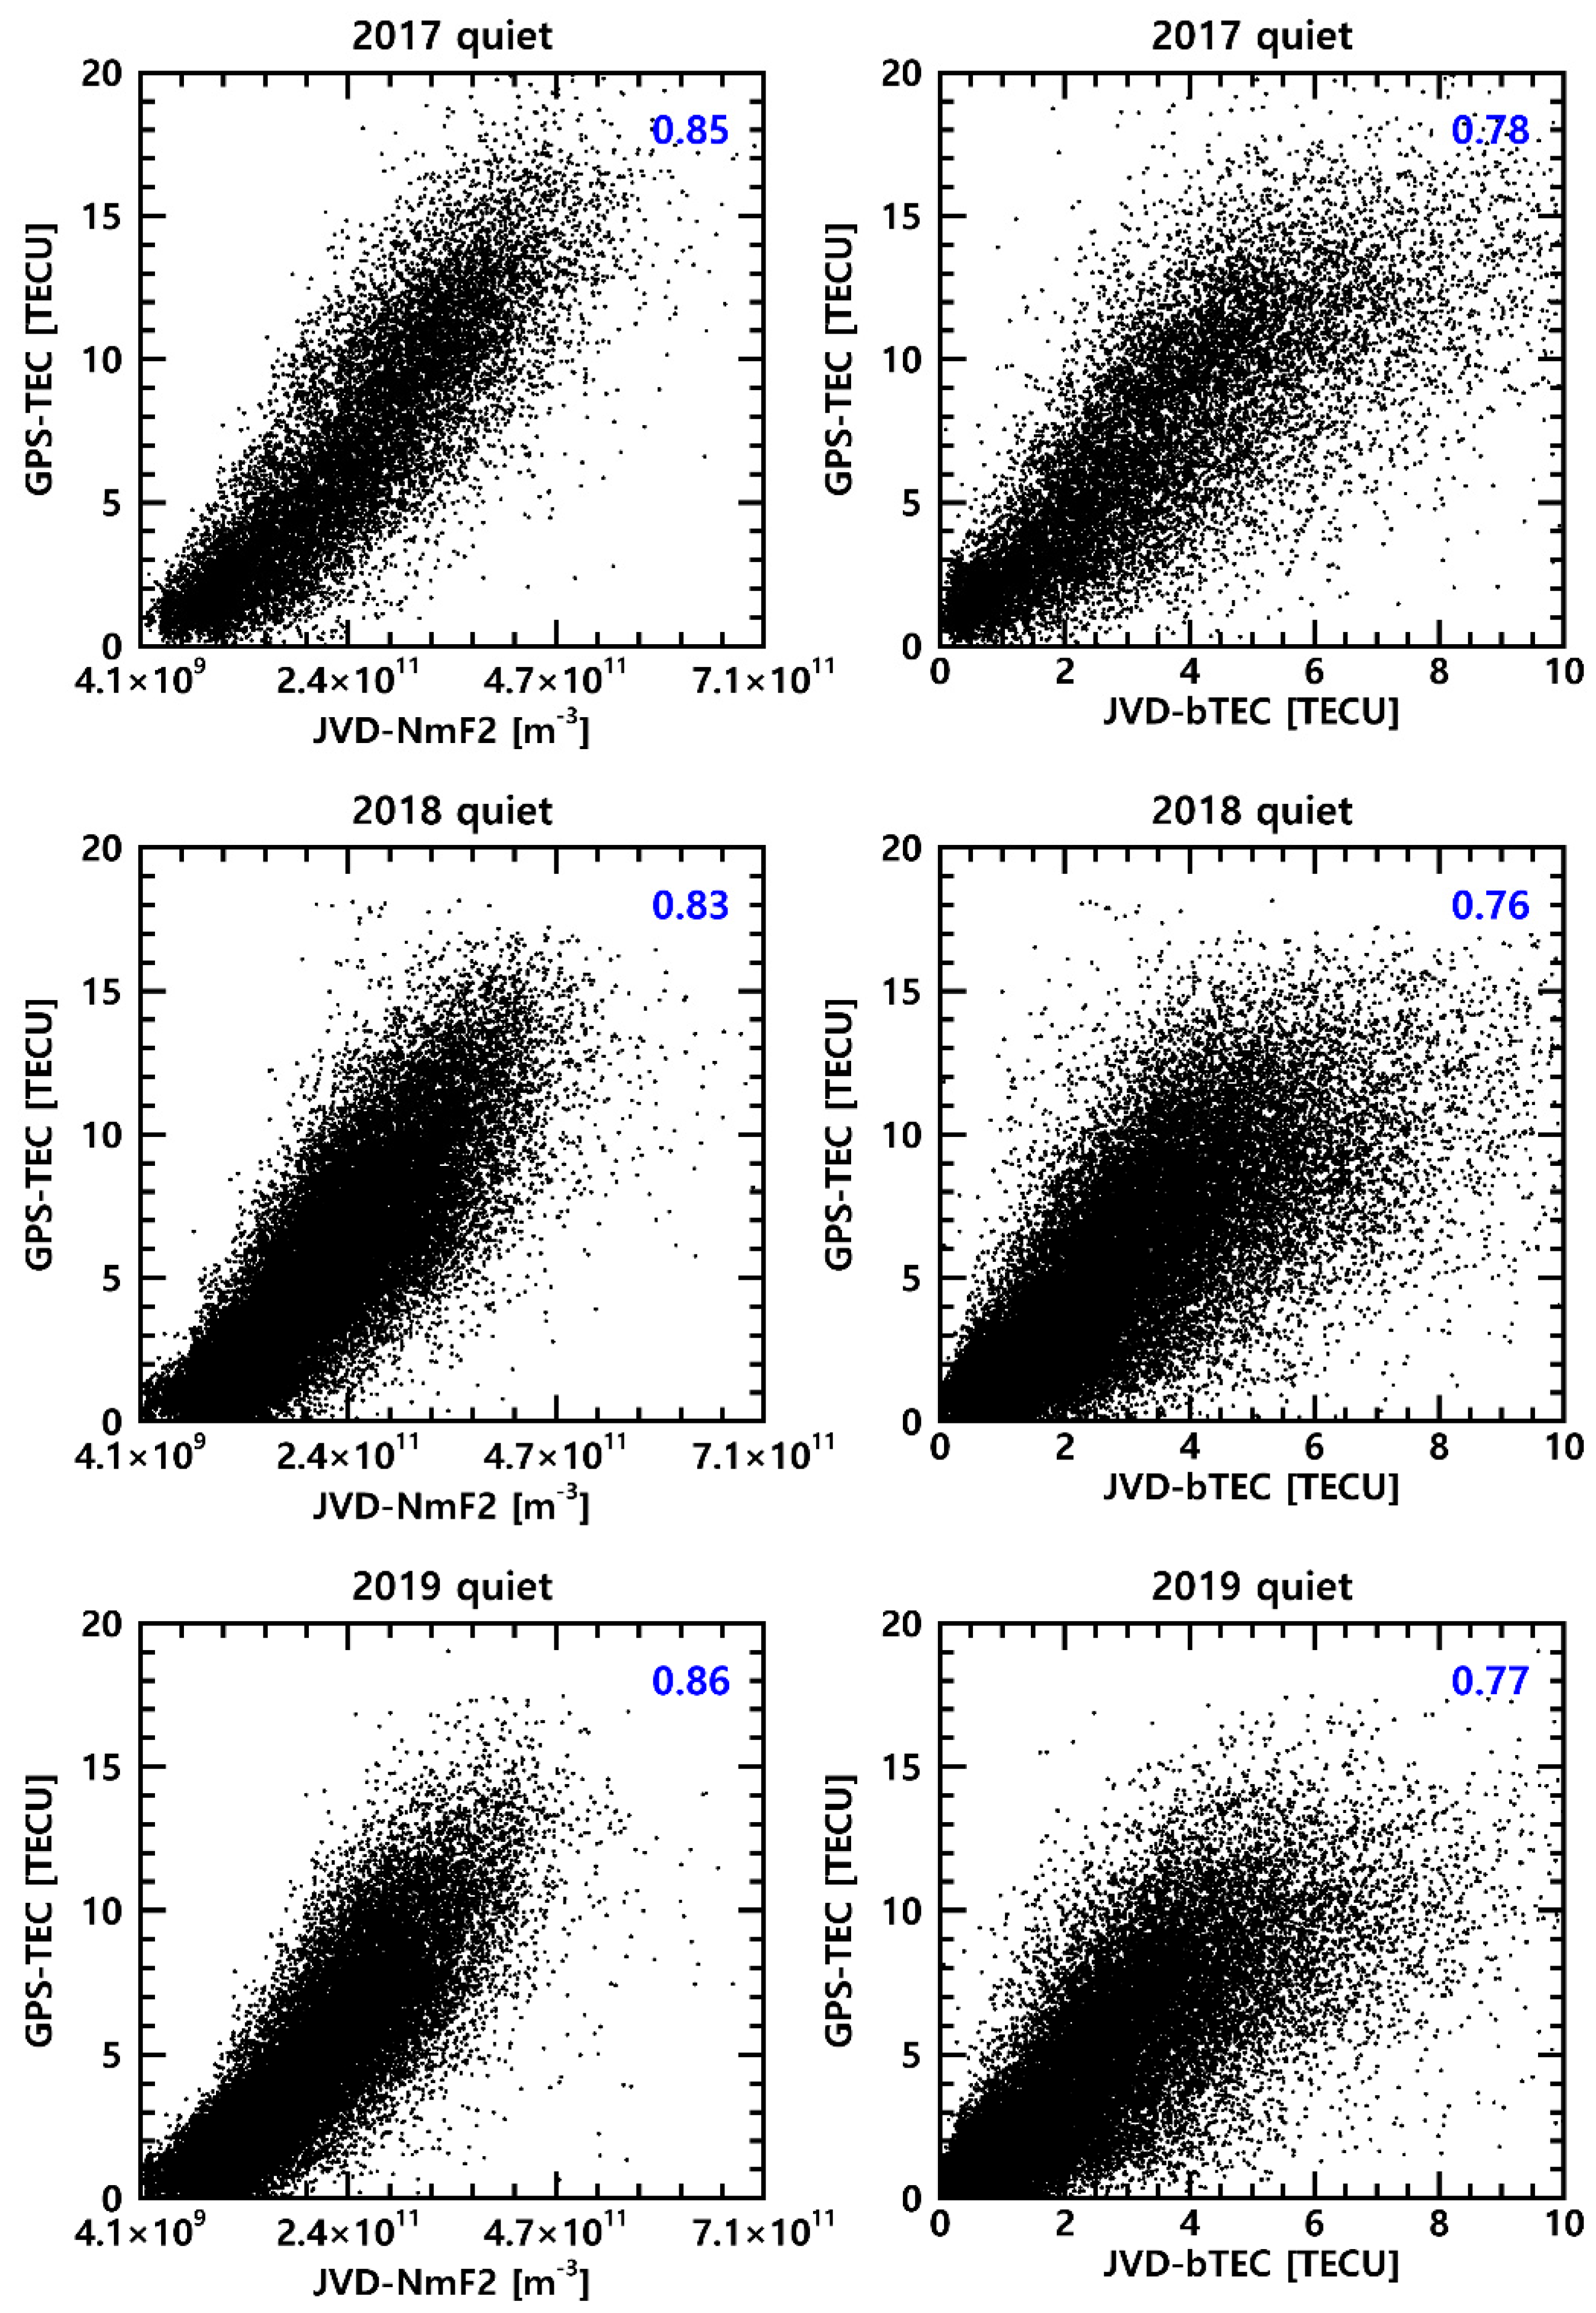
Both JVD and GPS measurements are valuable additions to the sparse ionospheric observations in the southern polar region. Bearing in mind all limitations of such approach, we initially compared the JVD NmF2 and bTEC with VTEC measurements from a co-located GPS receiver at JBS for geomagnetically quiet times during solar minimum years. Figure 2 shows the scatter plot of 10 min averaged GPS TEC vs. JVD NmF2 (left) and bTEC (right) from 2017 to 2019 from the top to bottom panels. The linear Pearson correlation coefficients for each case are shown at the upper-right corner of each panel. Note that both NmF2 and bTEC are supposed to be somewhat correlated to the GPS TEC, considering how much the F-region peak density contributes to the GPS TEC (e.g., [9,22]). It was found in Figure 2 that the JVD NmF2 is highly correlated with GPS TEC, but the JVD bTEC shows slightly lower correlations, which seems to imply that the JVD measurement of the F-region peak density is more accurate than the measurement of bTEC calculated from the density profile of the bottomside ionosphere. However, we should remember that bTEC has the more complex nature compared to NmF2: it is computed from the density profiles that are estimated by the NeXtYZ inversion procedure using not only the observed information but also the physics-based and empirical models for the daytime D-region (or nighttime E-region) ionization and for the E-F valley region [8], which may deviate from the true ionosphere. The bottomside TEC involves an effective thickness Hb of the bottomside ionosphere (bTEC = NmF2 × Hb), and the VTEC involves an effective thickness Ht of the entire ionosphere (VTEC = NmF2 × Ht). These two TECs may not correlate well with each other, especially in the polar region. Nonetheless, the correlations between the two independent measurements are fairly strong.
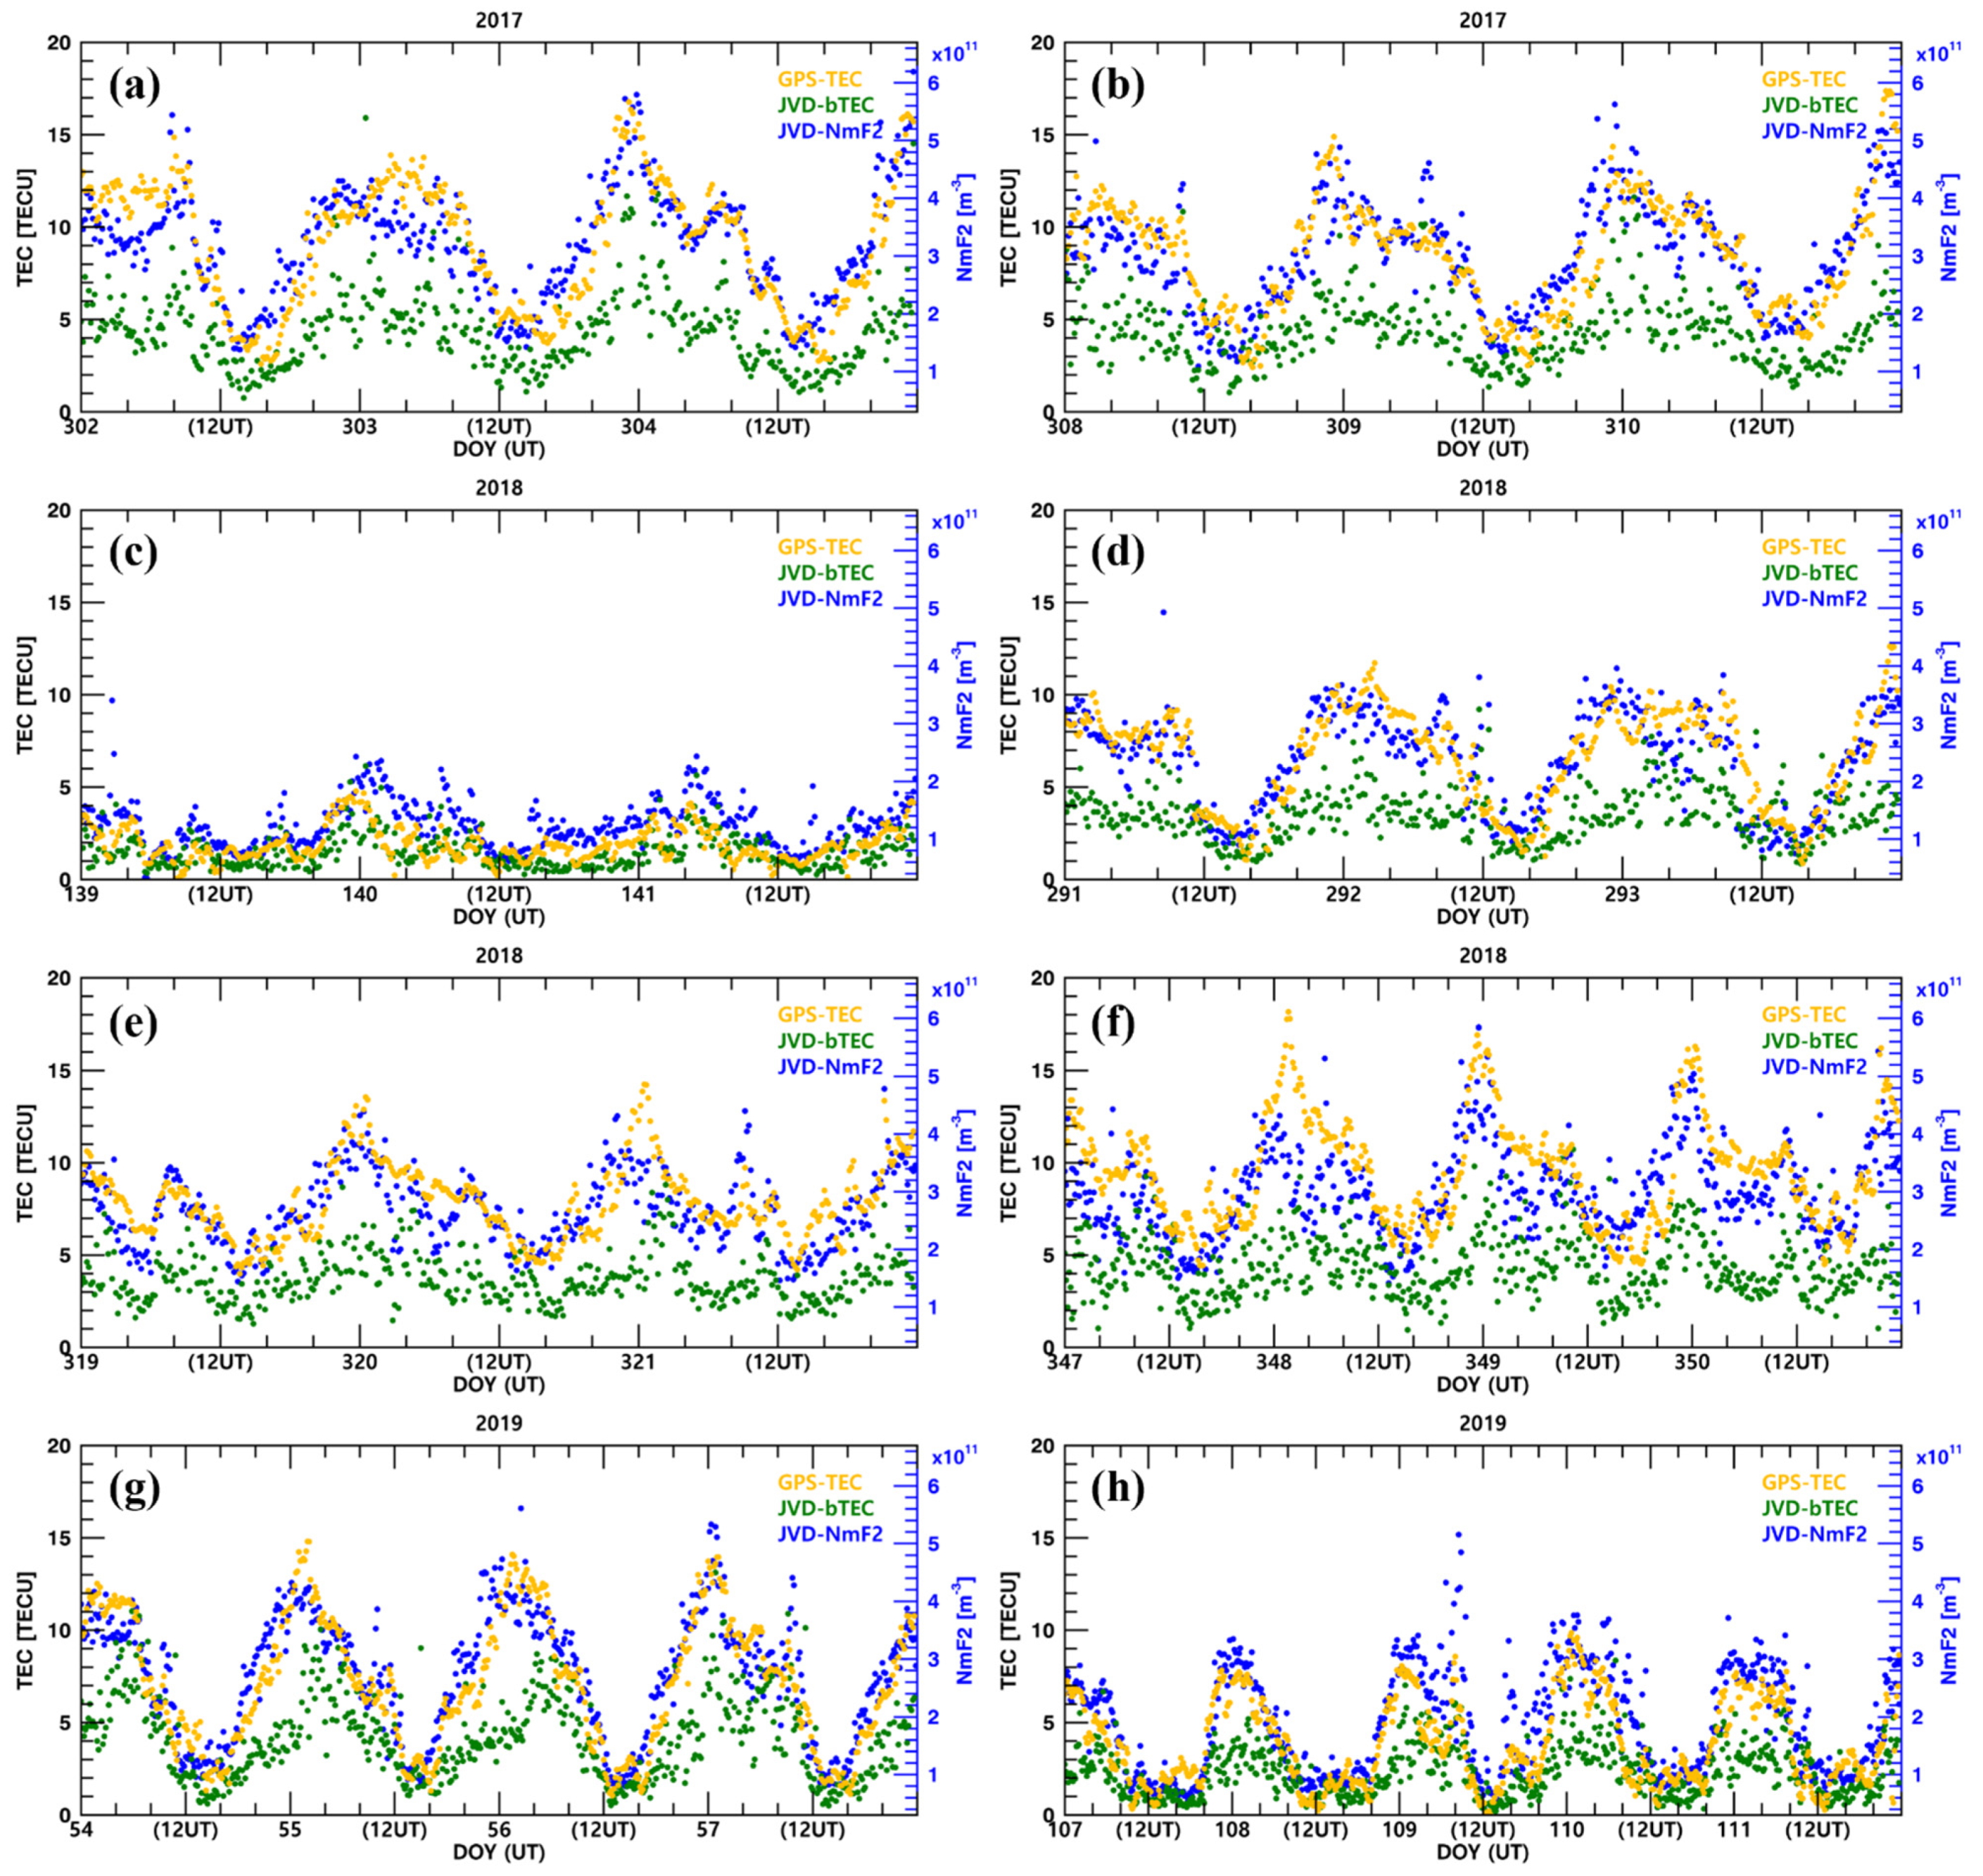
The next comparisons with the GPS TEC measurements were performed for the international quiet days (IQDs) during the study period. Figure 3 shows the diurnal variations in 10 min. averaged JVD bTEC and NmF2 and GPS TEC for eight IQD cases (mean Kp~0.4). We chose the cases when the geomagnetically quiet condition persists for at least three consecutive days from the lists of the five quietest days for each month provided by the World Data Center for Geomagnetism, Kyoto. The diurnal variations in JVD NmF2 very closely follow the variations in GPS TEC, although the IPPs of the GPS satellites mostly exist at lower latitudes. The JVD bTECs also show similar diurnal variations from the JVD NmF2 and GPS TEC but with a somewhat larger spread. The larger spread in the JVD measurements may be associated with the ionospheric structures causing spread F on the ionogram. Since the spread F ionograms show multiple refractive scatterings, it may complicate the analysis of the ionogram data [23]. The TID activity caused by atmospheric gravity waves is the most common mechanism of the spread F ionogram. Shimazaki [24] reported that the spread F can also be caused by charged particles precipitating into the F-region ionosphere at high latitudes with lower energy than auroral particles. According to their study, the high-latitude spread F appears even in the sunlit conditions, while it mainly occurs during nighttime at low and middle latitudes. When the spread echoes appear on the ionogram, it may be a challenge for automatic scaling to produce the realistic ionospheric density profiles. In addition, the ionospheric irregularities have been reported to frequently occur especially in summer in the southern polar ionosphere [18]. Figure 3 also shows a tendency of a larger spread (particularly in bTEC) during the daytime in the summer season (see Figure 3f). As will be discussed in the next section, the Dynasonde analysis procedure seems to show some limitations to estimate the ionospheric density profiles, in particular when the characteristic features of the polar ionosphere exist: for example, energetic particle precipitations and ionospheric density irregularities.
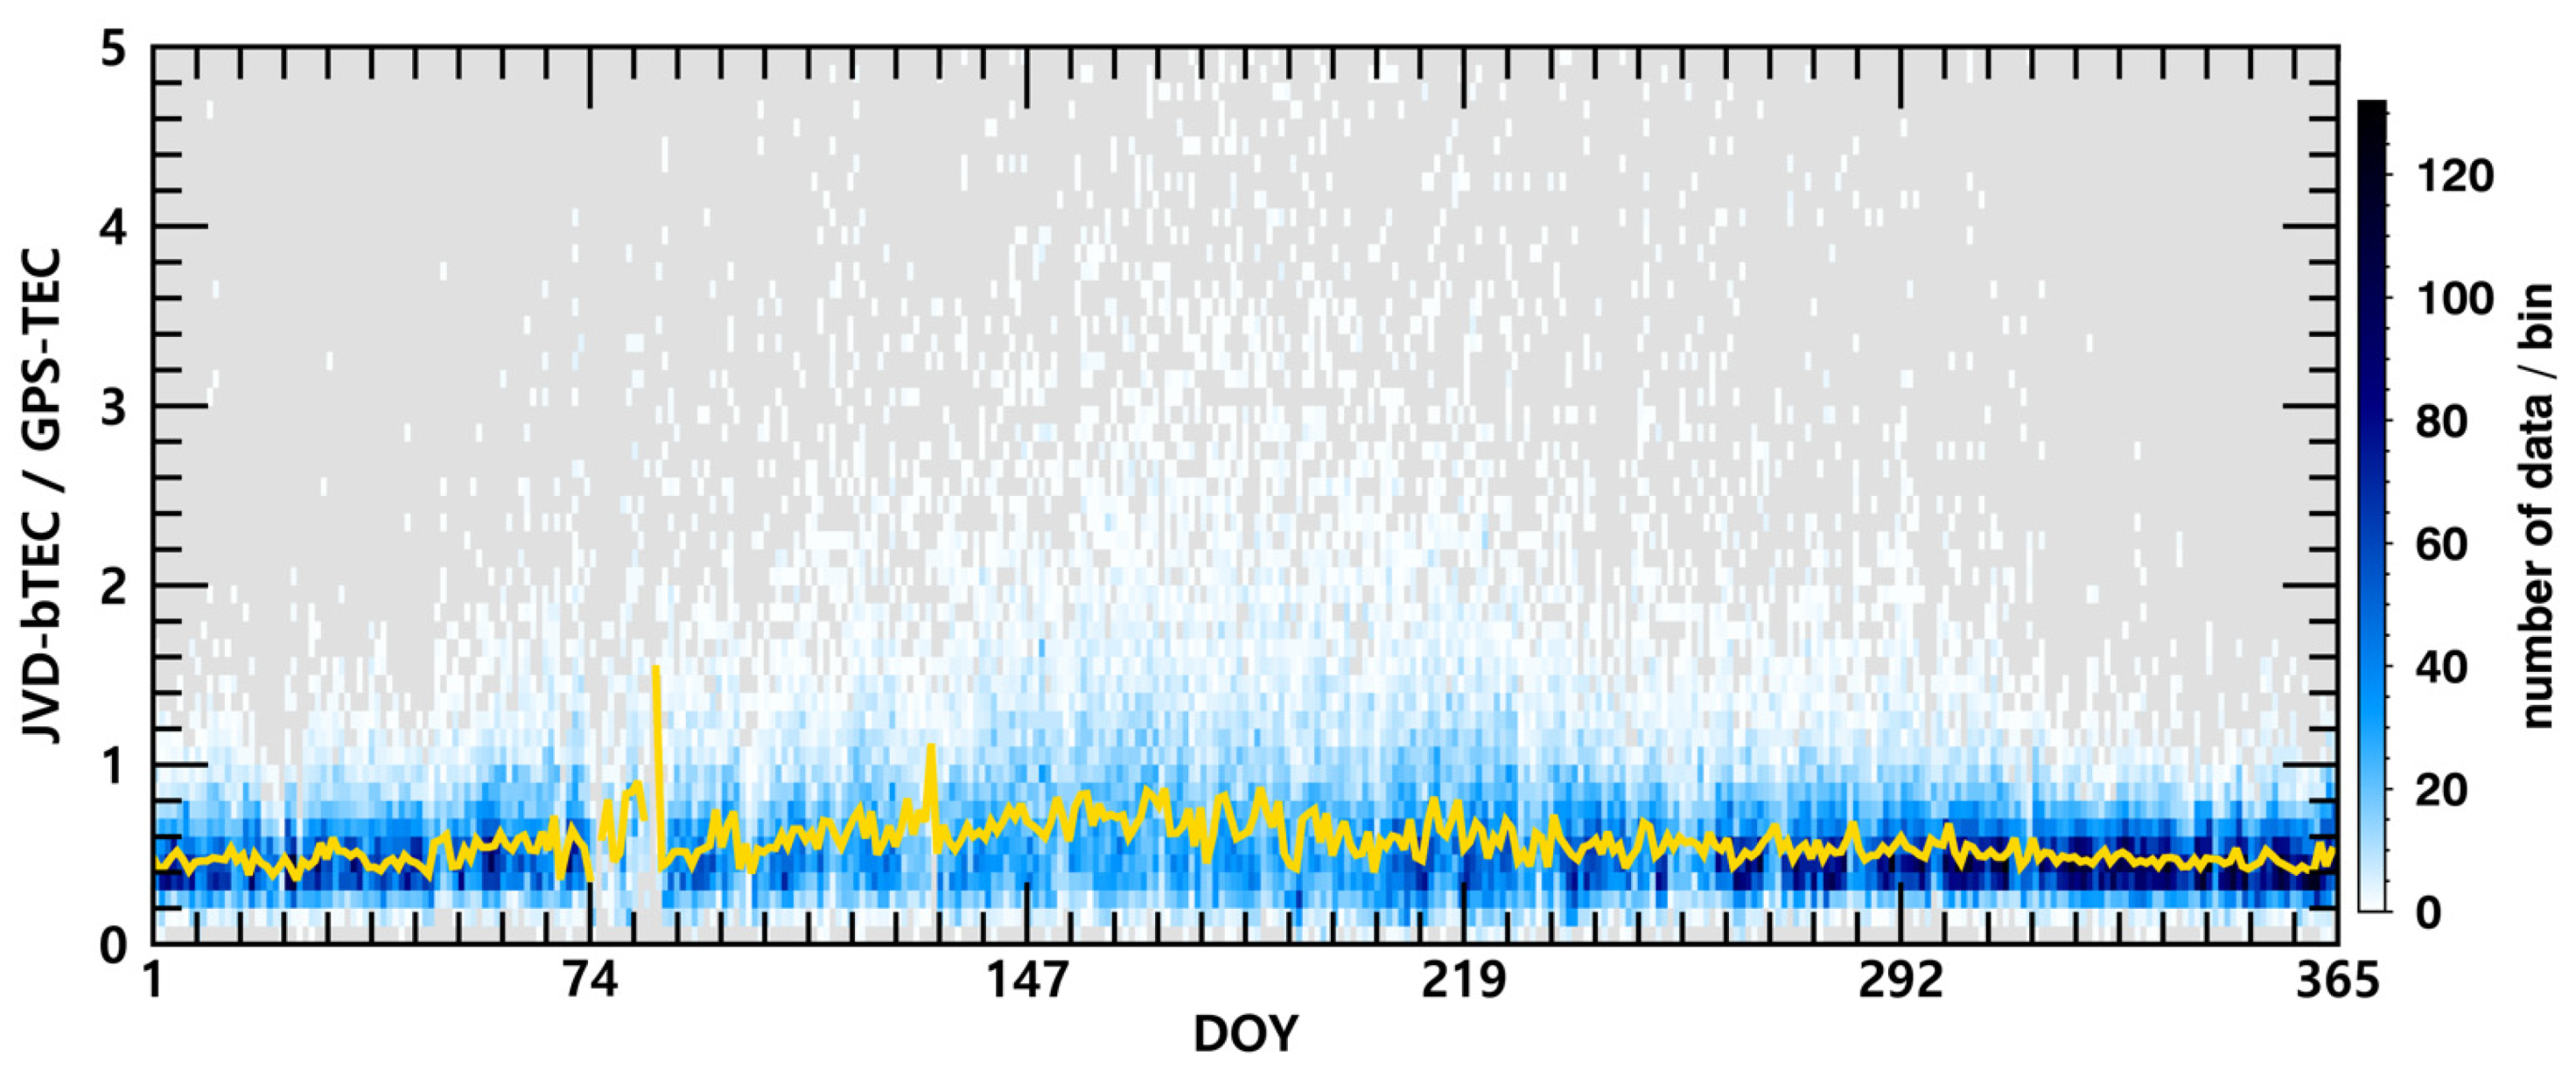
When the solar-production is negligibly small near the polar winter (see Figure 3c), the magnitudes of JVD bTECs are very close to the GPS VTECs for DOY 139–141 (early winter), 2018. In summer season, however, the differences between the two TECs become large, especially during daytime (see Figure 3f). Typically, the bottomside ionospheric TEC is known to contribute to GPS TEC by about 10~40% in the low and middle latitude ionospheres [10]. Figure 4 shows the annual variations in the ratios of 10 min averaged JVD bTECs to GPS VTECs for quiet conditions during the study period of 2017 to 2019. Each pixel in the figure indicates the total amount of data for three years within a bin of a day and a 0.1 ratio interval. The ratios are mostly less than about 0.5 in the austral summer season, peaking at about 0.35, but they tend to be slightly enhanced up to about 0.7 in the austral winter season. The daily medians, as depicted by the yellow line, are the average values per each DOY for the three-year period. However, the ratios are sometimes greater than 1, indicating that the JVD bTECs occasionally exceed the GPS VTECs, particularly in the winter season. Note that the enhanced contribution of bTEC to GPS TEC may be related with the E-region density enhancements by stronger energetic particle precipitations in winter season [25,26,27]. Moreover, the solar production mainly responsible for the F-region density is nearly absent in polar winter, which reduces the contribution of the F-region density to GPS TEC. This aspect of the ratio is a unique characteristic of the polar ionosphere. Nonetheless, occasions of the large ratio (greater than 1), while statistically insignificant, clearly imply that there might be some quality issues in measurements from both GPS receiver and JVD.
Figure 5 shows the diurnal variations in the hourly mean GPS VTEC (yellow) and JVD bTEC (green) for each month from 10 min averaged VTEC measurements with standard deviations (error bars) during quiet times for the period from 2017 (top) to 2019 (bottom). The GPS TEC data were not available in April and May in 2017. Note that LT = UT + 11 at JBS. The mean values of the bottomside ionospheric TEC are mostly well below the GPS TEC measurements. However, the differences between GPS TEC and JVD bTEC become smaller at night and especially in winter when the solar production is nearly absent but the additional production by auroral precipitation exists in the polar nighttime E-region ionosphere. As will be discussed later in the next section, however, the JVD seems to have some issues with regard to the estimation of the ionospheric density profiles during auroral events, which may be the reason for slightly larger standard deviations in JVD bTECs. Nonetheless, the climatological characteristics of JVD bTEC are generally consistent with the GPS TEC measurements in the polar region: the ionospheric densities are greater during daytime than nighttime and in summer than in winter during solar minimum years. Both measurements also show the variations with the solar activity, decreasing toward the solar minimum from 2017 to 2019.

4. Common Type of Misestimated Ionospheric Density Profiles from the Dynasonde

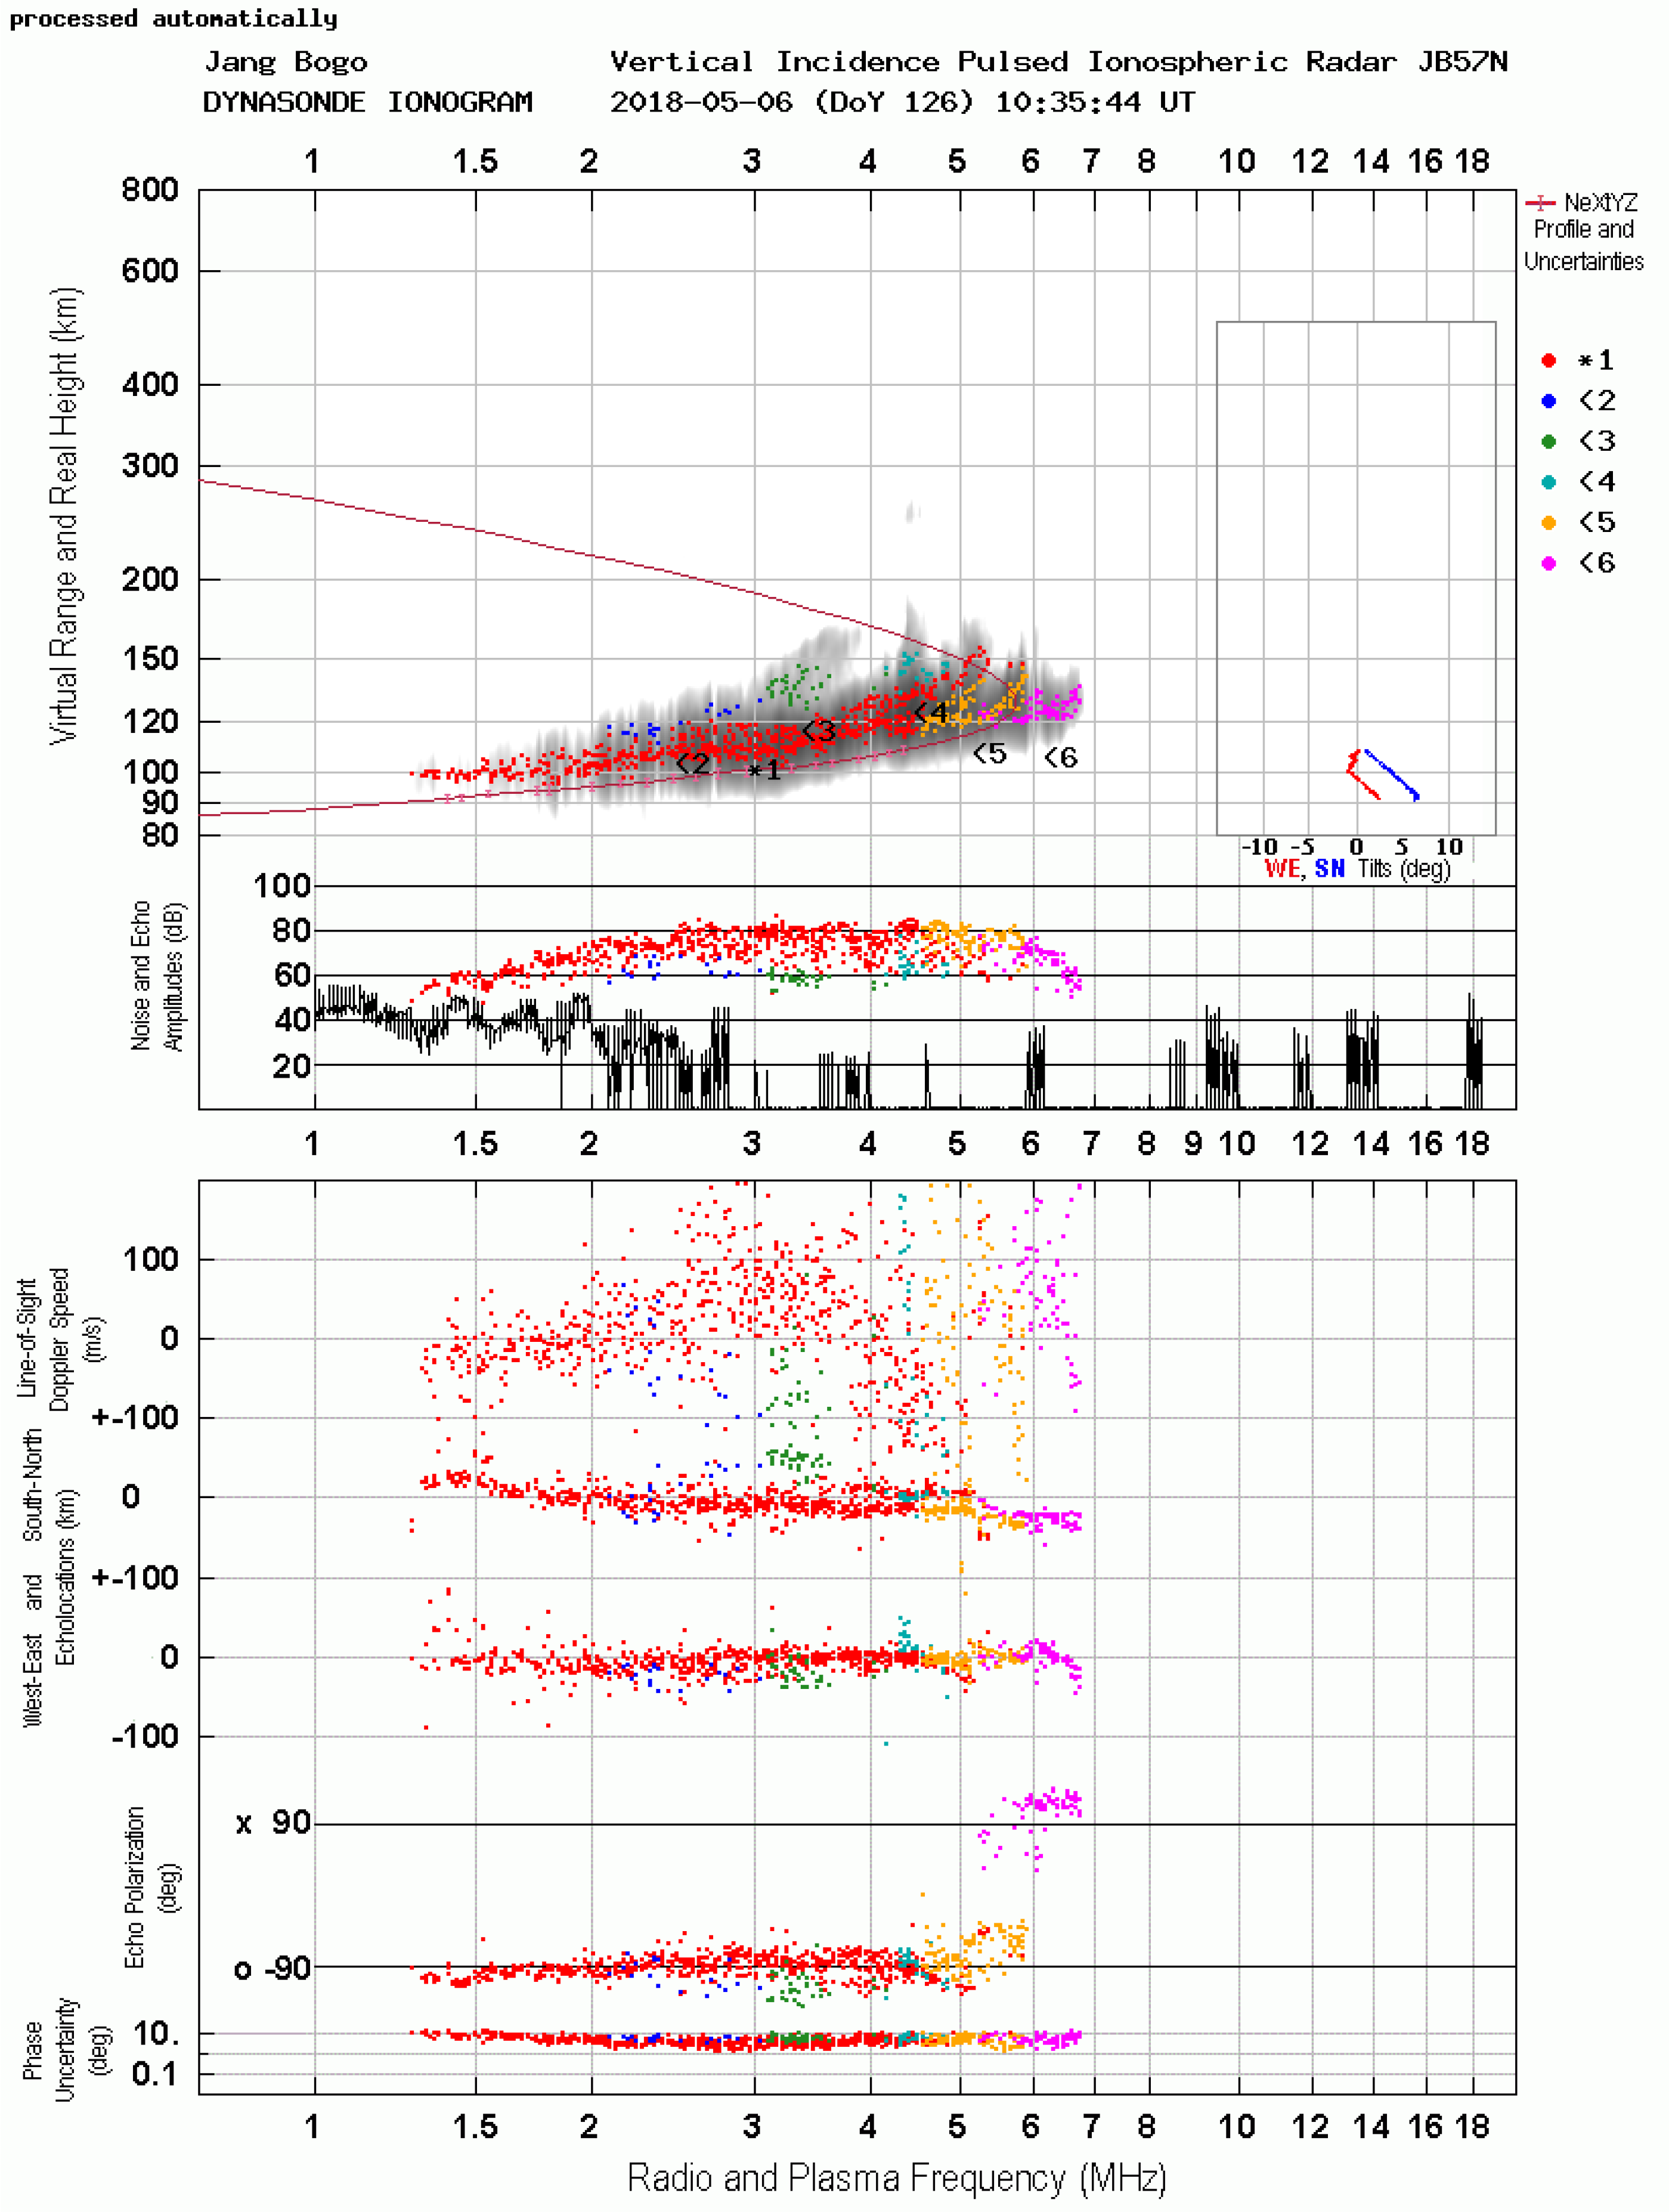
One of the characteristic features of the polar ionosphere is that the E-region peak density can be equivalent or even greater than the F-region peak density, due to the additional production by energetic particle precipitations. The so-called E-layer dominated ionosphere (ELDI) frequently occurs at high latitude in winter for solar minimum and geomagnetically disturbed times when the F-region density is minimized due to the reduced solar production, but the E-region density is increased by the enhanced energetic particle precipitations (e.g., [2,12]). Since the ionospheric sounding technique cannot observe the ionosphere above the density peak height whether it occurs in the F-region or in the E-region, the observed ionospheric densities from the JVD should be carefully examined, in particular when the energetic particle precipitations exist. During disturbed times, it is well known that the signals can be blocked by enhanced E-region density (e.g., ELDI), attenuated by increased D-region densities (e.g., polar cap absorption), and experience scintillations by density irregularities [18,28,29]. When these happen, the measurements from the ionospheric sounding must be affected by them, and the resulting ionospheric density profiles may not represent the state of the ionosphere well. Figure 6 shows an example of the ionogram produced by JVD at around 21.5 LT on 6 May 2018 (F10.7 = 68.4 sfu, Kp = 3), at which there was an auroral event over JBS. The ionogram and resulting density profile in Figure 6 imply that the echoes are reflected by the enhanced E-region density caused by auroral particle precipitation at around 100–120 km altitude: that is, the F-region could not be observed by JVD since the F-region density is probably smaller than the E-region density, which is indicated by there being no reflected signal above the E-region.
Note that this is an example of absolutely correct processing of available ionogram data. The Dynasonde analysis detected 998 radio echoes, calculated their physical parameters and classified them into 6 traces (5 of which were ordinary polarization, reflecting complex structure of the disturbed E region, and 1, #6, was extraordinary). The autonomous analysis has chosen trace #1 for the profile inversion and successfully obtained the E-region profile with reasonable error bars (The topside part of this profile is not an actual inversion, it is just a Chapman-model-based extrapolation, which, in this case, has little to do with the real upper ionosphere).
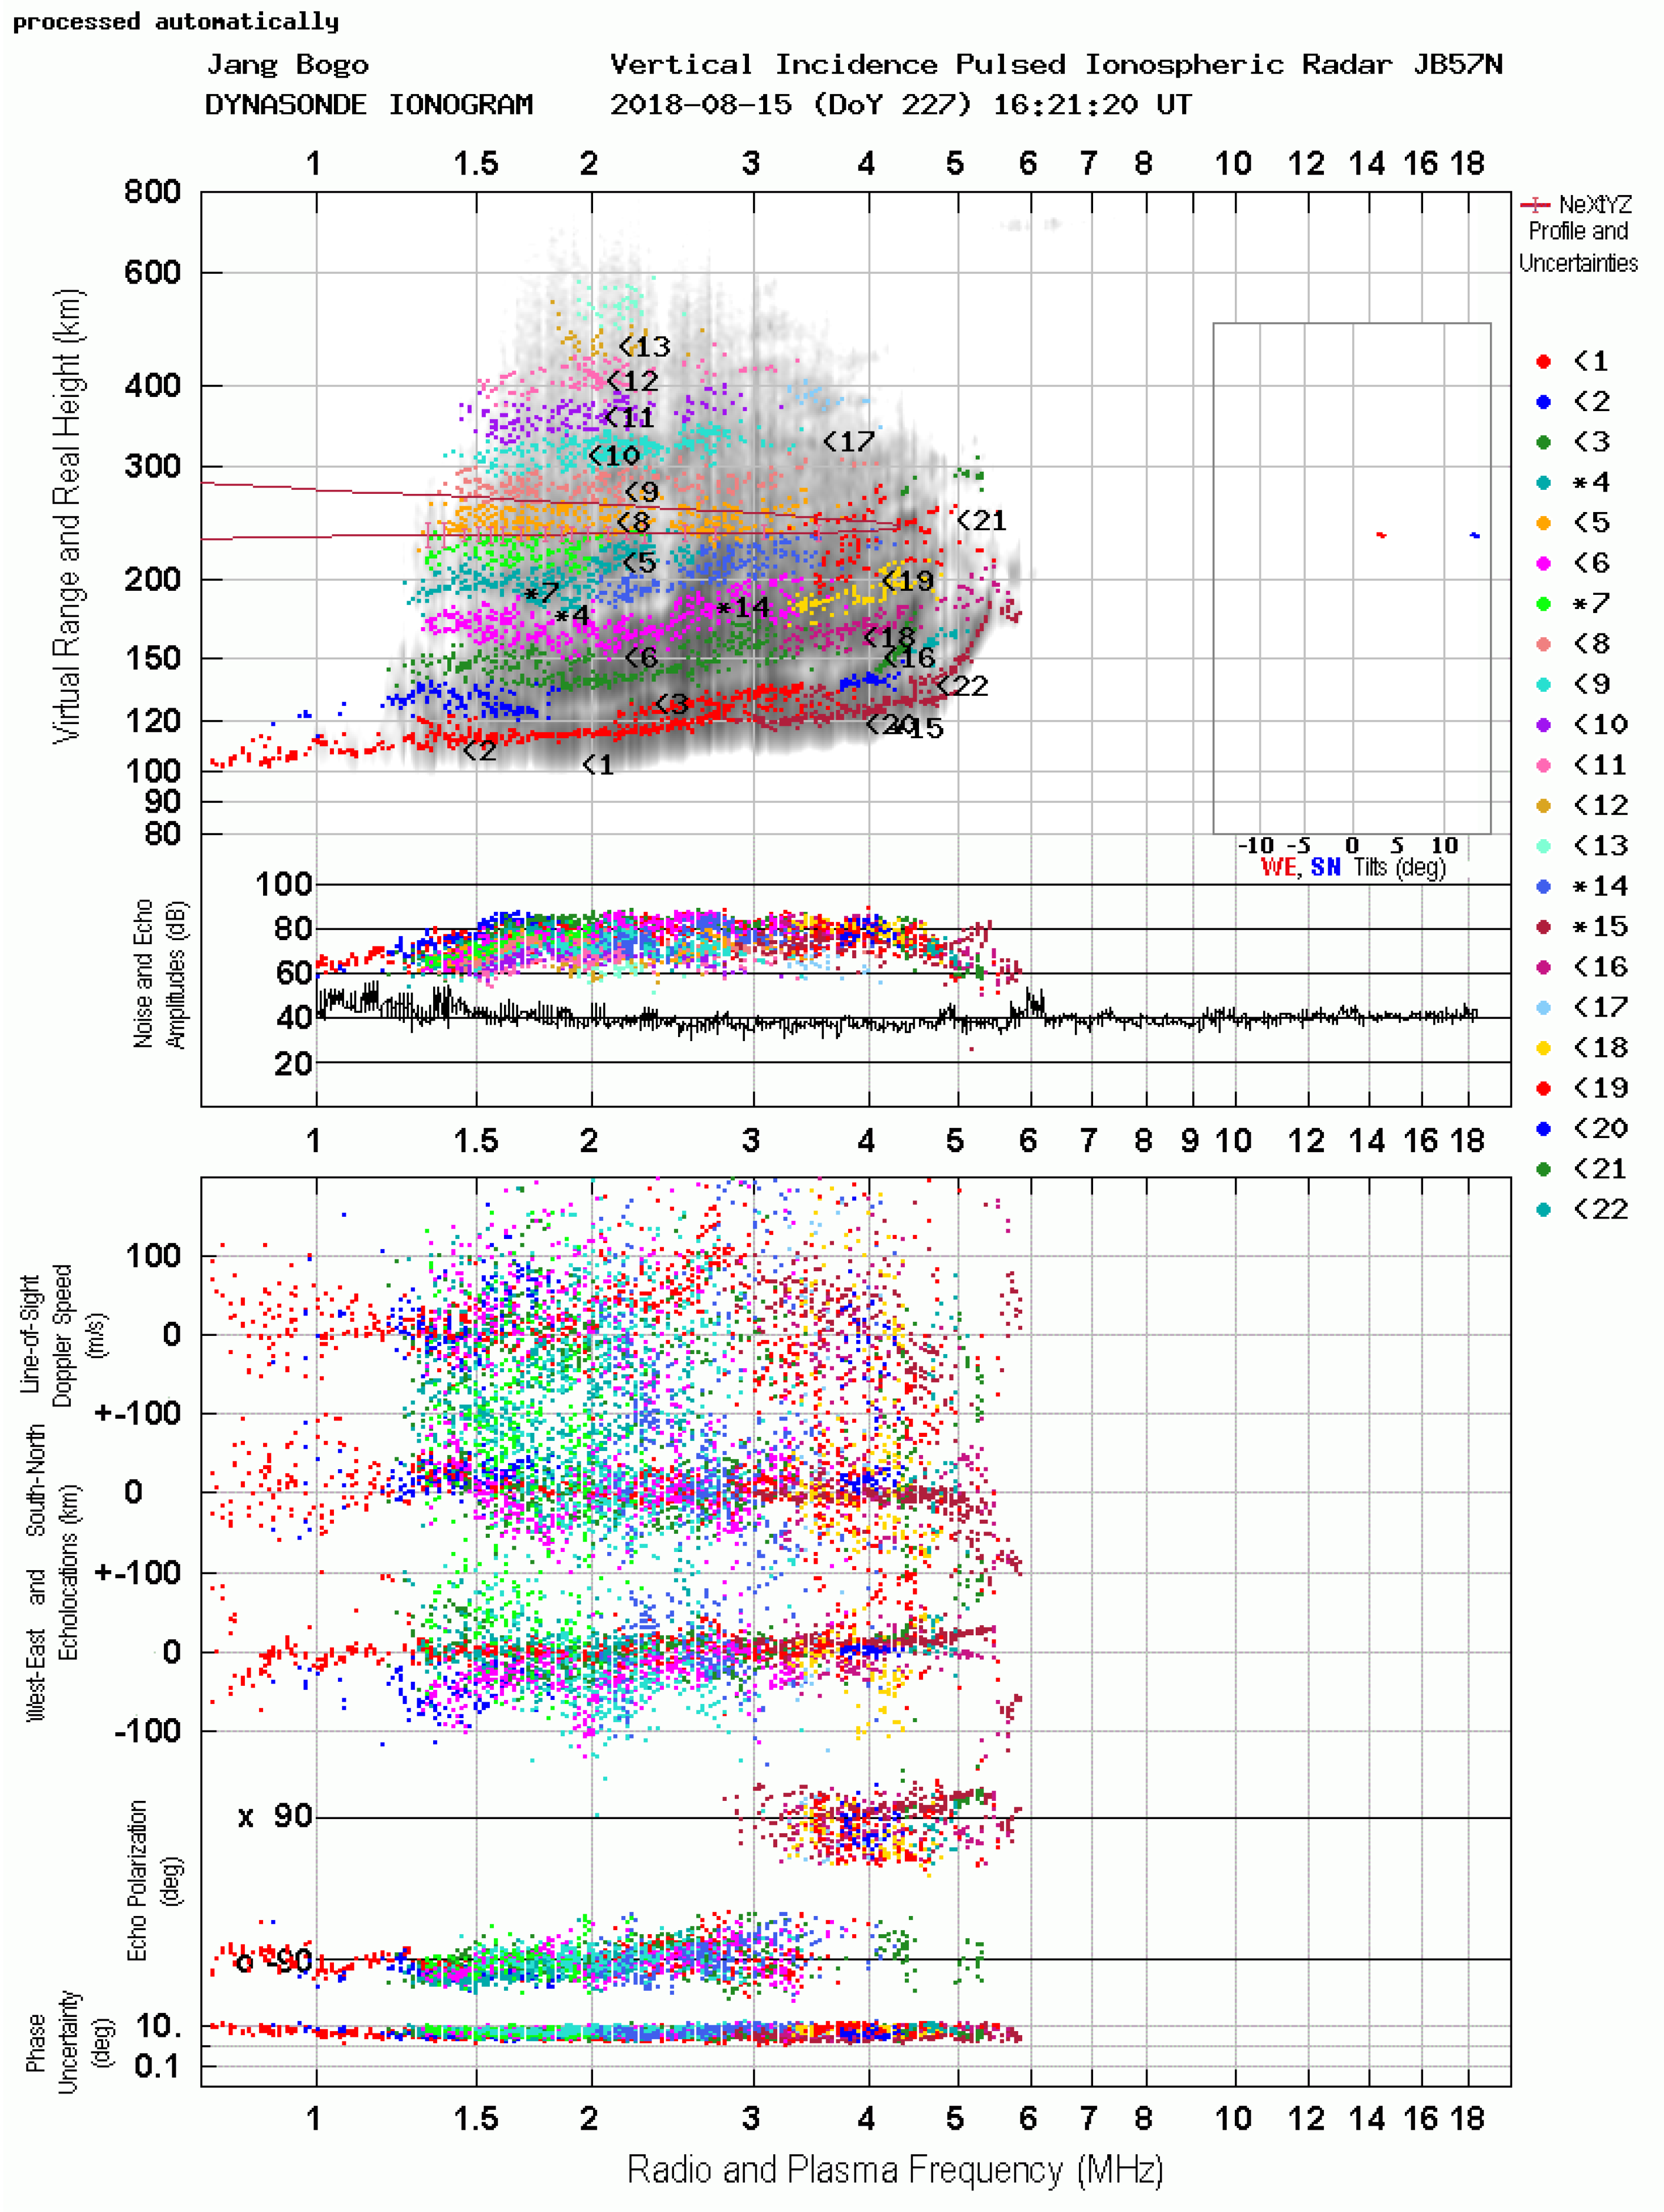
The described procedure is completely based on objective physical parameters contained in the list of detected radio echoes. Note that it does not use the poorly defined notion of “the leading edge” of the ionospheric reflections. Most of the time, it works very well. Sometimes, however, when the ionospheric structure is particularly complex, the autonomous analysis makes mistakes in trace selection. Figure 7 shows an example of the erroneous density profile estimated at around 03 LT on 15 August 2018 with an auroral event over JBS during low solar and moderately disturbed geomagnetic conditions (F10.7 = 70.6 sfu, Kp = 3). The autonomous analysis software successfully identified 4130 radio echoes and classified them into 22 traces. It should have selected traces #1 and #15 for further analysis. However, wrong traces #4, #7, and #14 were chosen instead of the trace #1 for the profile inversion and this resulted in an unusually thin density profile peaking around 250 km in height, which does not represent the actual ionospheric density profile. This erroneous density profile belongs to the type of the misestimated density profiles by Dynasonde analysis, mostly occurring during the auroral events. This example indicates that the trace selection within the autonomous Dynasonde analysis software does not work dependably when the aurora occurs. This is not to say that such problems are unique to JVD, or to Dynasondes in general. This kind of misestimation has been observed at other high-latitude Dynasonde locations and with other amplitude-based ionospheric sounding techniques. The phase-based approach, with multiple physical parameters of the radio echoes readily available for the analysis, definitely has more diverse tools for improving results of this sort, and this must be one of the directions of future work. The current version of the software includes the expert reprocessing capability when an experienced operator is able to correct the trace selection mistakes.
During such disturbed conditions as auroral events in the polar ionosphere, the ionospheric density profiles often deviate from typical mid-latitude ionospheric density profiles with an F-region peak at around 300 km and a smaller E-region density peak at around 120 km or no E-region at night. The disturbed density profiles in the polar ionosphere may still be a challenge in the ionospheric sounding techniques such as the Dynasonde, as well as the more conventional digisonde. In conclusion, the electron density profiles estimated by the Dynasonde are mostly in reasonable agreement with the independent GPS TEC measurements during undisturbed conditions, but caution is required when using some of the analysis products during disturbed conditions in the polar ionosphere.

5. Summary and Conclusions

The ionospheric densities obtained from the JVD are assessed using GPS VTEC data, the only available independent measurement of the ionospheric densities at JBS, Antarctica. We fully understand that the two instruments do not exactly measure the same parameters. Moreover, the VTEC measurements at high latitudes are very difficult by themselves, and their results cannot be considered as the ground truth. This study was performed mostly for geomagnetically quiet times during solar minimum years from 2017 to 2019. The JVD NmF2 is well correlated with GPS VTEC measurements but the JVD bTEC shows slightly less correlations. The more detailed comparisons between JVD densities and GPS VTEC have been performed for international quiet days. Both JVD NmF2 and bTEC are generally in a good agreement with GPS TEC but the JVD bTECs show relatively larger spread, which may be associated with the diverse characteristic features of the polar ionosphere such as energetic particle precipitations and large density irregularities. Those same features create additional difficulties for estimates of proper density profiles. The median ratios of JVD bTEC to GPS VTEC are about 0.5 on average but tend to be larger in winter. It indicates that the solar production is nearly absent in polar winter, but the effect of particle precipitation enhances the contribution of bottomside ionosphere to the total electron content in the polar region. Finally, it was found that the autonomous Dynasonde estimation of the ionospheric density profiles seems to have issues with trace selection during disturbed conditions, which need to be addressed in future versions of the Dynasonde analysis software.

Author Contributions

Conceptualization, G.J. and E.K.; methodology, E.K. and G.J.; software, E.K.; validation, G.J. and N.Z.; formal analysis, E.K.; investigation, E.K., G.J., N.Z., Y.-B.H., C.L. and H.-J.K.; resources, Y.-B.H., C.L., J.H., H.-J.K., J.-H.K., N.Z. and T.B.; data curation, E.K., Y.-B.H., C.L., J.H. and H.-J.K.; writing—original draft preparation, E.K.; writing—review and editing, E.K. and G.J.; visualization, E.K.; supervision, G.J. All authors have read and agreed to the published version of the manuscript.

Funding

This research was funded by the grant PE22020 from Korea Polar Research Institute (KOPRI).

Acknowledgments

Junseok Hong was supported by a basic research fund from the Korea Astronomy and Space Science Institute (KASI) (2022185010).

Conflicts of Interest

The authors declare no conflict of interest.

References

  1. Heelis, R.A.; Lowell, J.K.; Spiro, R.W. A model of the high latitude ionosphere convection pattern. J. Geophys. Res. 1982, 82, 6339–6345. [Google Scholar] [CrossRef]
  2. Kim, E.; Jee, G.; Ji, E.-Y.; Kim, Y.H.; Lee, C.; Kwak, Y.-S.; Shim, J.-S. Climatology of polar ionospheric density profiles in comparison with mid-latitude ionosphere from long-term observations of incoherent scatter radars: A review. J. Atmos. Solar-Terr. Phys. 2020, 211, 105449. [Google Scholar] [CrossRef]
  3. Sojka, J.J.; Bowline, M.D.; Schunk, R.W. Patches in the polar ionosphere: UT and seasonal dependence. J. Geophys. Res. 1994, 99, 14959–14970. [Google Scholar] [CrossRef]
  4. David, M.; Sojka, J.J.; Schunk, R.W.; Coster, A.J. Polar cap patches and the tongue of ionization: A survey of GPS TEC maps from 2009 to 2015. Geophys. Res. Lett. 2016, 43, 2422–2428. [Google Scholar] [CrossRef] [Green Version]
  5. Rietveld, M.T.; Wright, J.W.; Zabotin, N.; Pitteway, M.L.V. The Tromsø dynasonde. Polar Sci. 2008, 2, 55–71. [Google Scholar] [CrossRef] [Green Version]
  6. Kwon, H.-J.; Lee, C.; Jee, G.; Ham, Y.-B.; Kim, J.-H.; Kim, Y.H.; Kim, K.-H.; Wu, Q.; Bullett, T.; Oh, S.; et al. Ground-based observations of the polar region space environment at the Jang Bogo Station, Antarctica. J. Astron. Space Sci. 2018, 35, 185–193. [Google Scholar] [CrossRef]
  7. Ham, Y.-B.; Jee, G.; Lee, C.; Kwon, H.-J.; Kim, J.-H.; Zabotin, N.; Bullett, T. Observations of the polar ionosphere by the Vertical Incidence Pulsed Ionospheric Radar at Jang Bogo station, Antarctica. J. Astron. Space Sci. 2020, 37, 143–156. [Google Scholar] [CrossRef]
  8. Zabotin, N.A.; Wright, J.W.; Zhbankov, G.A. NeXtYZ: Three-dimensional electron density inversion for Dynasonde ionograms. Radio Sci. 2006, 41, 1–12. [Google Scholar] [CrossRef] [Green Version]
  9. Belehaki, A.; Jakowski, N.; Reinisch, B.W. Comparison of ionospheric ionization measurements over Athens using ground ionosonde and GPS-derived TEC values. Radio Sci. 2003, 38, 1105. [Google Scholar] [CrossRef]
  10. McKinnell, L.-A.; Opperman, B.; Cilliers, P.J. GPS TEC and ionosonde TEC over Grahamstown, South Africa: First comparisons. Adv. Space Res. 2007, 39, 816–820. [Google Scholar] [CrossRef]
  11. Zhu, Q.; Lei, J.; Luan, X.; Dou, X. Contribution of the topside and bottomside ionosphere to the total electron content during two strong geomagnetic storms. J. Geophys. Res. 2016, 121, 2475–2488. [Google Scholar] [CrossRef]
  12. Cai, H.; Li, F.; Shen, G.; Zhan, W.; Zhou, K.; McCrea, I.W.; Ma, S. E layer dominated ionosphere observed by EISCAT/ESR radars during solar minimum. Ann. Geophys. 2014, 32, 1223–1231. [Google Scholar] [CrossRef]
  13. Mayer, C.; Jakowski, N. Enhanced E-layer ionization in the auroral zones observed by radio occultation measurements onboard CHAMP and Formosat-3/COSMIC. Ann. Geophys. 2009, 27, 1207–1212. [Google Scholar] [CrossRef]
  14. Kamal, S.; Jakowski, N.; Hoque, M.M.; Wickert, J. Evaluation of E layer dominated ionosphere events using COSMIC/FORMOSAT-3 and CHAMP ionospheric radio occultation data. Remote Sens. 2020, 12, 333. [Google Scholar] [CrossRef] [Green Version]
  15. Jee, G.; Ham, Y.-B.; Choi, Y.; Kim, E.; Lee, C.; Kwon, H.; Trondsen, T.S.; Kim, J.E.; Kim, J.-H. Observations of the aurora by visible all-sky camera at Jang Bogo Station, Antarctica. J. Astron. Space Sci. 2021, 38, 203–215. [Google Scholar] [CrossRef]
  16. Rungraengwajiake, S.; Supnithi, P.; Saito, S.; Siansawasdi, N.; Saekow, A. Ionospheric delay gradient monitoring for GBAS by GPS stations near Suvarnabhumi airport, Thailand. Radio Sci. 2015, 50, 1076–1085. [Google Scholar] [CrossRef] [Green Version]
  17. Arikan, F.; Nayir, H.; Sezen, U.; Arikan, O. Estimation of single station interfrequency receiver bias using GPS-TEC. Radio Sci. 2008, 43, 1–13. [Google Scholar] [CrossRef]
  18. Hong, J.; Chung, J.; Kim, Y.H.; Park, J.; Kwon, H.; Kim, J. Characteristics of Ionospheric Irregularities Using GNSS Scintillation Indices Measured at Jang Bogo Station, Antarctica (74.62°S, 164.22°E). Space Weather 2020, 18, e2020SW002536. [Google Scholar] [CrossRef]
  19. Crowley, G.; Ridley, A.J.; Deist, D.; Wing, S.; Knipp, D.J.; Emery, B.A. The transformation of high-latitude ionospheric F- region patches into blobs during the March 21, 1990 storm. J. Geophy. Res. 2000, 105, 5215–5230. [Google Scholar] [CrossRef] [Green Version]
  20. Otsuka, Y.; Ogawa, T.; Saito, A.; Tsugawa, T.; Fukao, S. A new technique for mapping of total electron content using GPS network in Japan. Earth Planets Space 2002, 54, 63–70. [Google Scholar] [CrossRef]
  21. Panda, S.K.; Gedam, S. Robustness of Elevation Cut-off in Estimating Ionospheric Total Electron Content from GPS Observation Data. In Proceedings of the 8th International Conference on Microwaves, Antenna, Propagation & Remote Sensing (ICMARS-2012), Jodhpur, India, 11–15 December 2012. [Google Scholar]
  22. Hoque, M.M.; Jakowski, N.; Prol, F.S. A new climatological electron density model for supporting space weather services. J. Space Weather Space Climate 2022, 12, 1. [Google Scholar] [CrossRef]
  23. Scotto, C.; Pezzopane, M. Automatic scaling of polar ionograms. Antarctic Sci. 2011, 24, 88–94. [Google Scholar] [CrossRef] [Green Version]
  24. Shimazaki, T. A statistical study of occurrence probability of spread F at high latitudes. J. Geophys. Res. 1962, 67, 4617–4634. [Google Scholar] [CrossRef]
  25. Newell, P.T.; Meng, C.I.; Lyons, K.M. Suppression of discrete aurorae by sunlight. Nature 1996, 381, 766–767. [Google Scholar] [CrossRef]
  26. Borovsky, J.E. Still in the dark. Nature 1998, 393, 312–313. [Google Scholar] [CrossRef]
  27. Barth, C.A.; Baker, D.N.; Bailey, S.M. Seasonal variation of auroral electron precipitation. Geophys. Res. Lett. 2004, 31, L04809. [Google Scholar] [CrossRef] [Green Version]
  28. Bates, H.F. HF propagation through the auroral curtain. J. Geophys. Res. 1970, 75, 143–151. [Google Scholar] [CrossRef]
  29. Kintner, P.M.; Ledvina, B.M.; Paula, E.R. GPS and ionospheric scintillations: Gps and ionospheric scintillations. Space Weather 2007, 5. [Google Scholar] [CrossRef]
Figure 1. Spatial distribution of the ionospheric pierce points (IPPs) (black dots) for the TEC measurements over the JBS (blue star) from the GPS satellites with the elevation angles greater than 50° for DOY 291, 2018 (a) and four GPS satellite paths for 10 min from 23:50 to 23:59 UT in azimuth-elevation coordinate (b) over JBS.
Remotesensing 14 02785 g001
Figure 2. The scatter plot of JVD NmF2 (left) and bottom bTEC (right) vs. GPS TEC averaged for 10 min during quiet time from 2017 (top) to 2019 (bottom). The linear correlation coefficients for each case are shown at the upper right-corner of the panels.
Remotesensing 14 02785 g002
Figure 3. The diurnal variations of 10 min averaged JVD bTEC (green), NmF2 (blue), and GPS TEC (yellow) for eight IQDs. Note that LT = UT + 11 at JBS. The eight IQD cases include DOY 302–304, 2017 (a); DOY 308–310, 2017 (b); DOY 139–141, 2018 (c); DOY 291–293, 2018 (d); DOY 319–321, 2018 (e); DOY 347–350, 2018 (f); DOY 54–57, 2019 (g); DOY 107–111, 2019 (h).
Remotesensing 14 02785 g003
Figure 4. The annual variation in the ratios of JVD bTECs to GPS VTECs averaged for 10 min during the period of 2017 to 2019. The yellow line indicates daily median values, and the bluish colors indicate the numbers of data in each bin.
Remotesensing 14 02785 g004
Figure 5. The diurnal variations in mean GPS TEC (yellow) and JVD bTEC (green) from 10 min– averaged values for each month are presented for a three-year period. Note that LT = UT + 11 at JBS.
Remotesensing 14 02785 g005
Figure 6. An example of the ionogram and resulting density profile obtained by JVD in winter at night on 6 May 2018 when the F10.7 was 68.4 sfu and the Kp index was 3.
Remotesensing 14 02785 g006
Figure 7. An ionogram and the resulting density profile obtained by autonomous Dynasonde analysis on 15 August 2018 (F10.7 = 70.6 sfu, Kp = 3).
Remotesensing 14 02785 g007
Publisher’s Note: MDPI stays neutral with regard to jurisdictional claims in published maps and institutional affiliations.