
UAV-Based Characterization of Tree-Attributes and Multispectral Indices in an Uneven-Aged Mixed Conifer-Broadleaf Forest

 ,
,  ,
, 

Abstract

1. Introduction
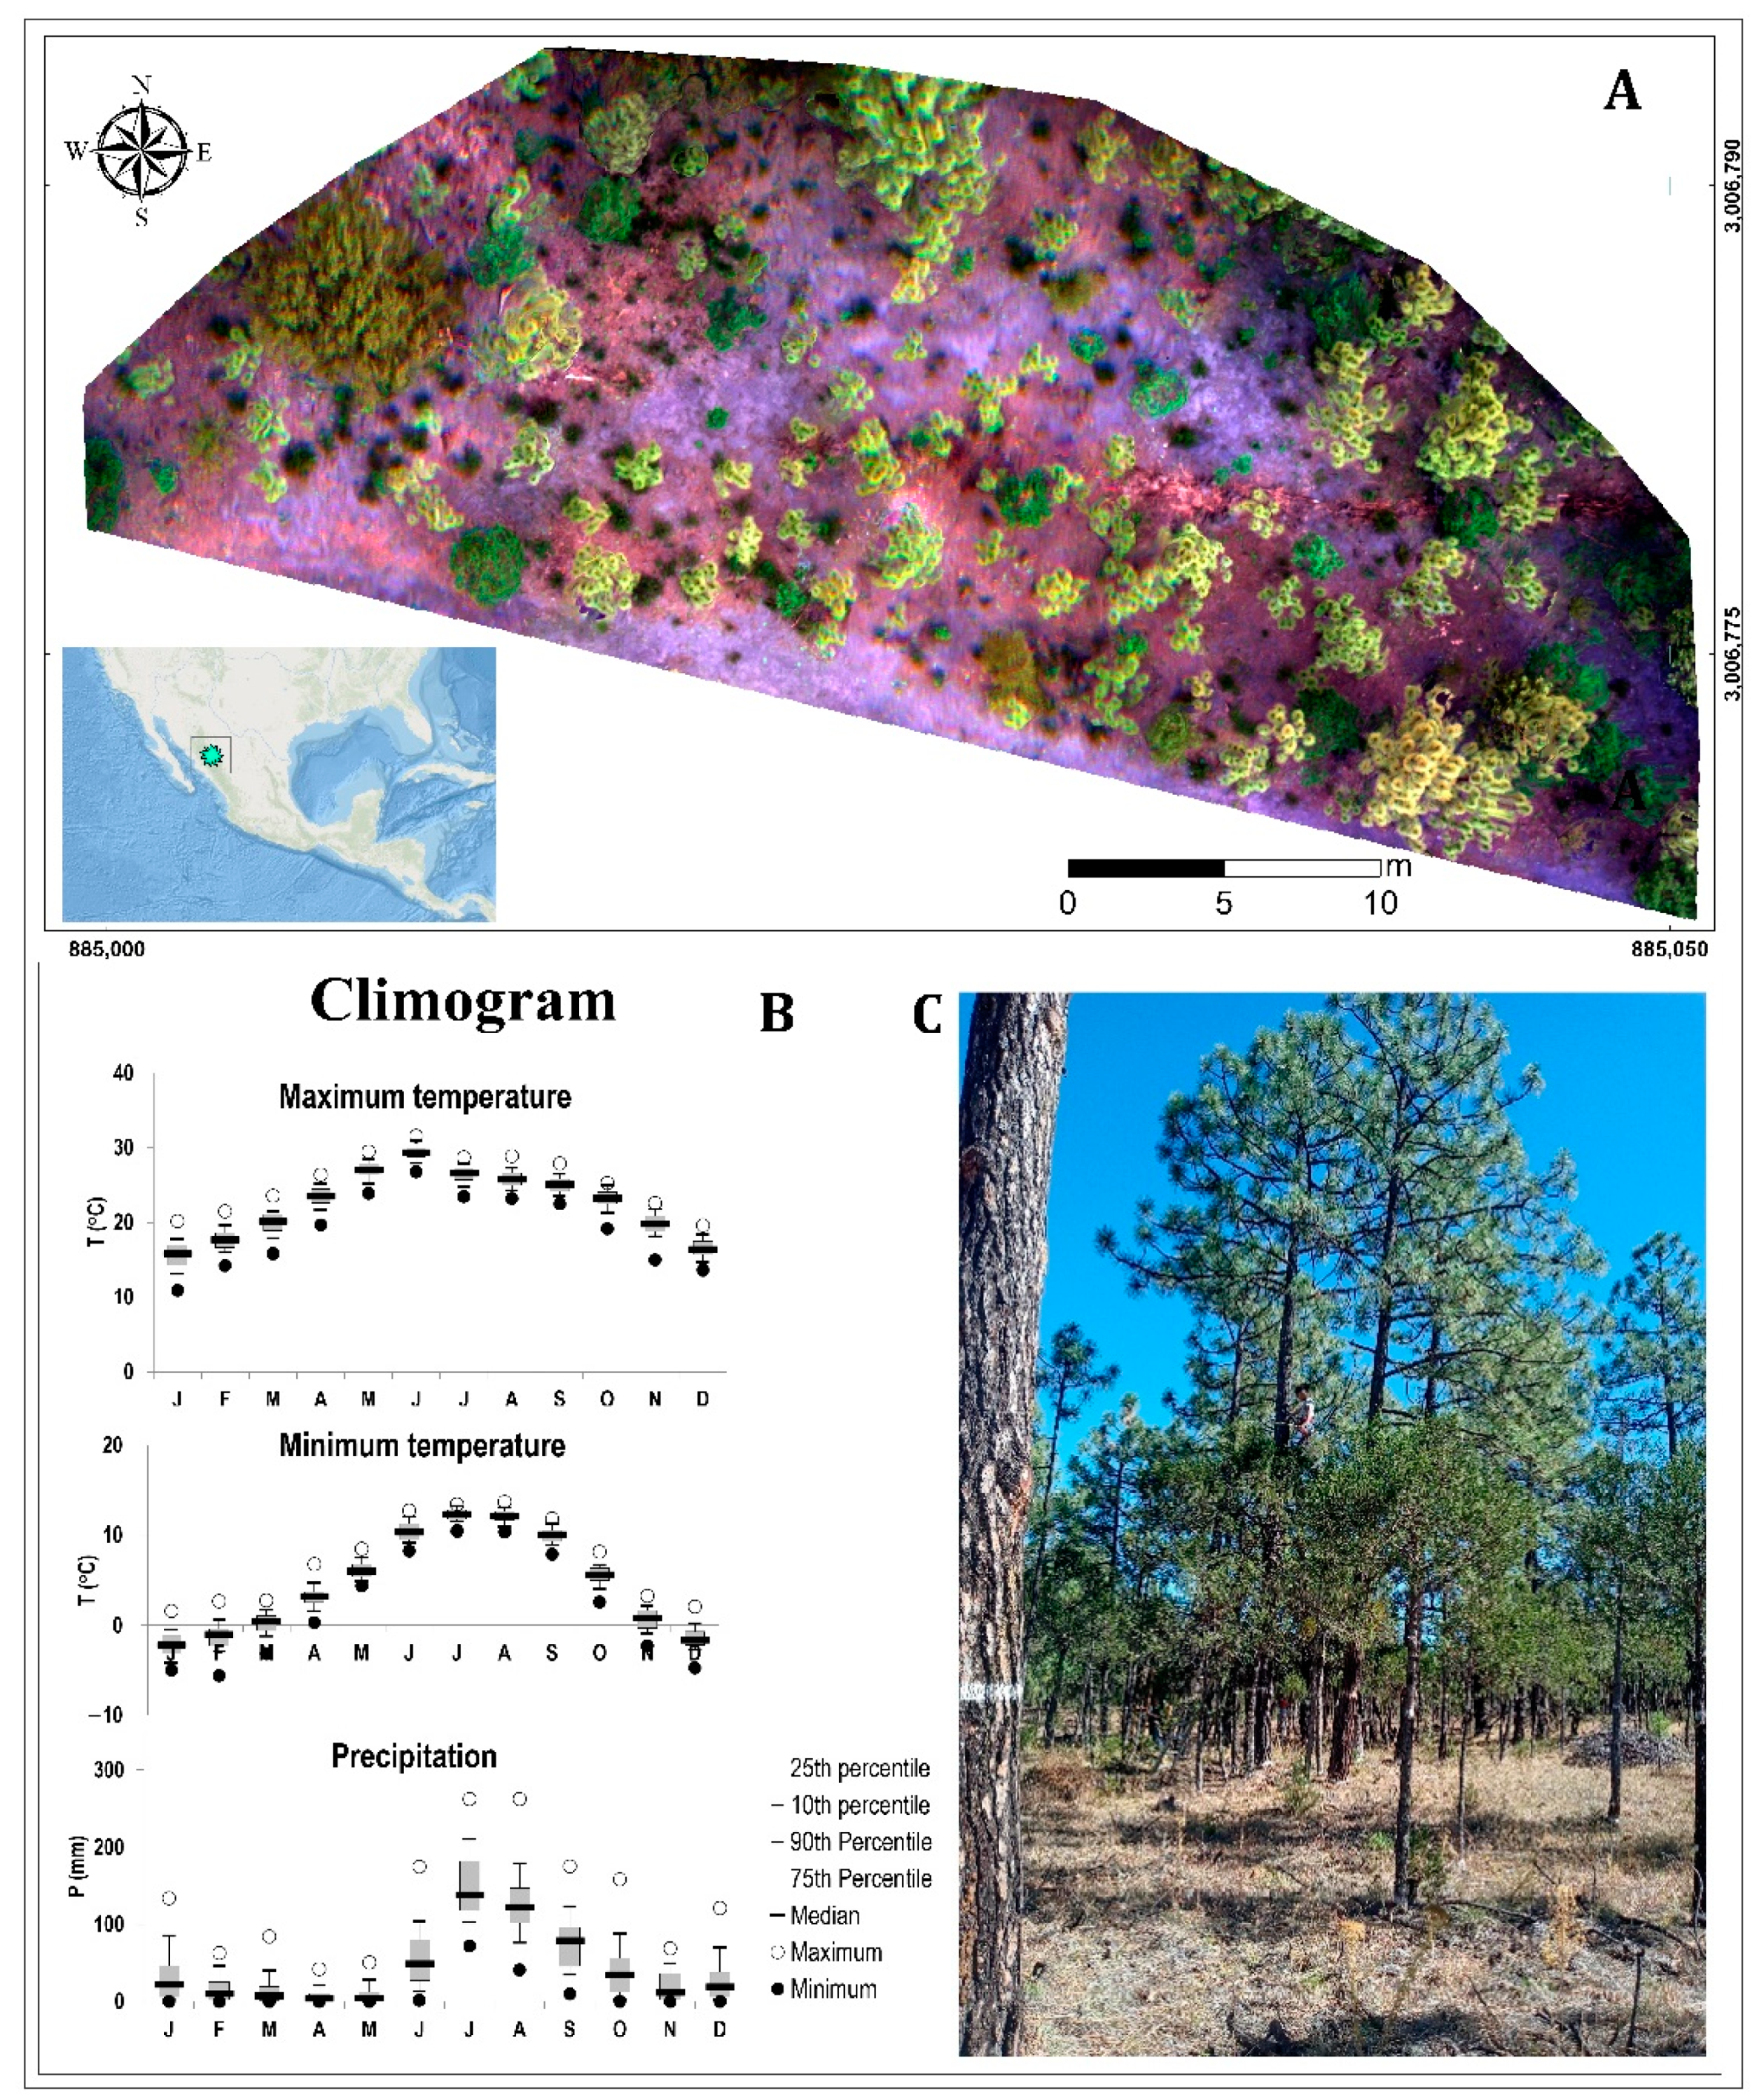
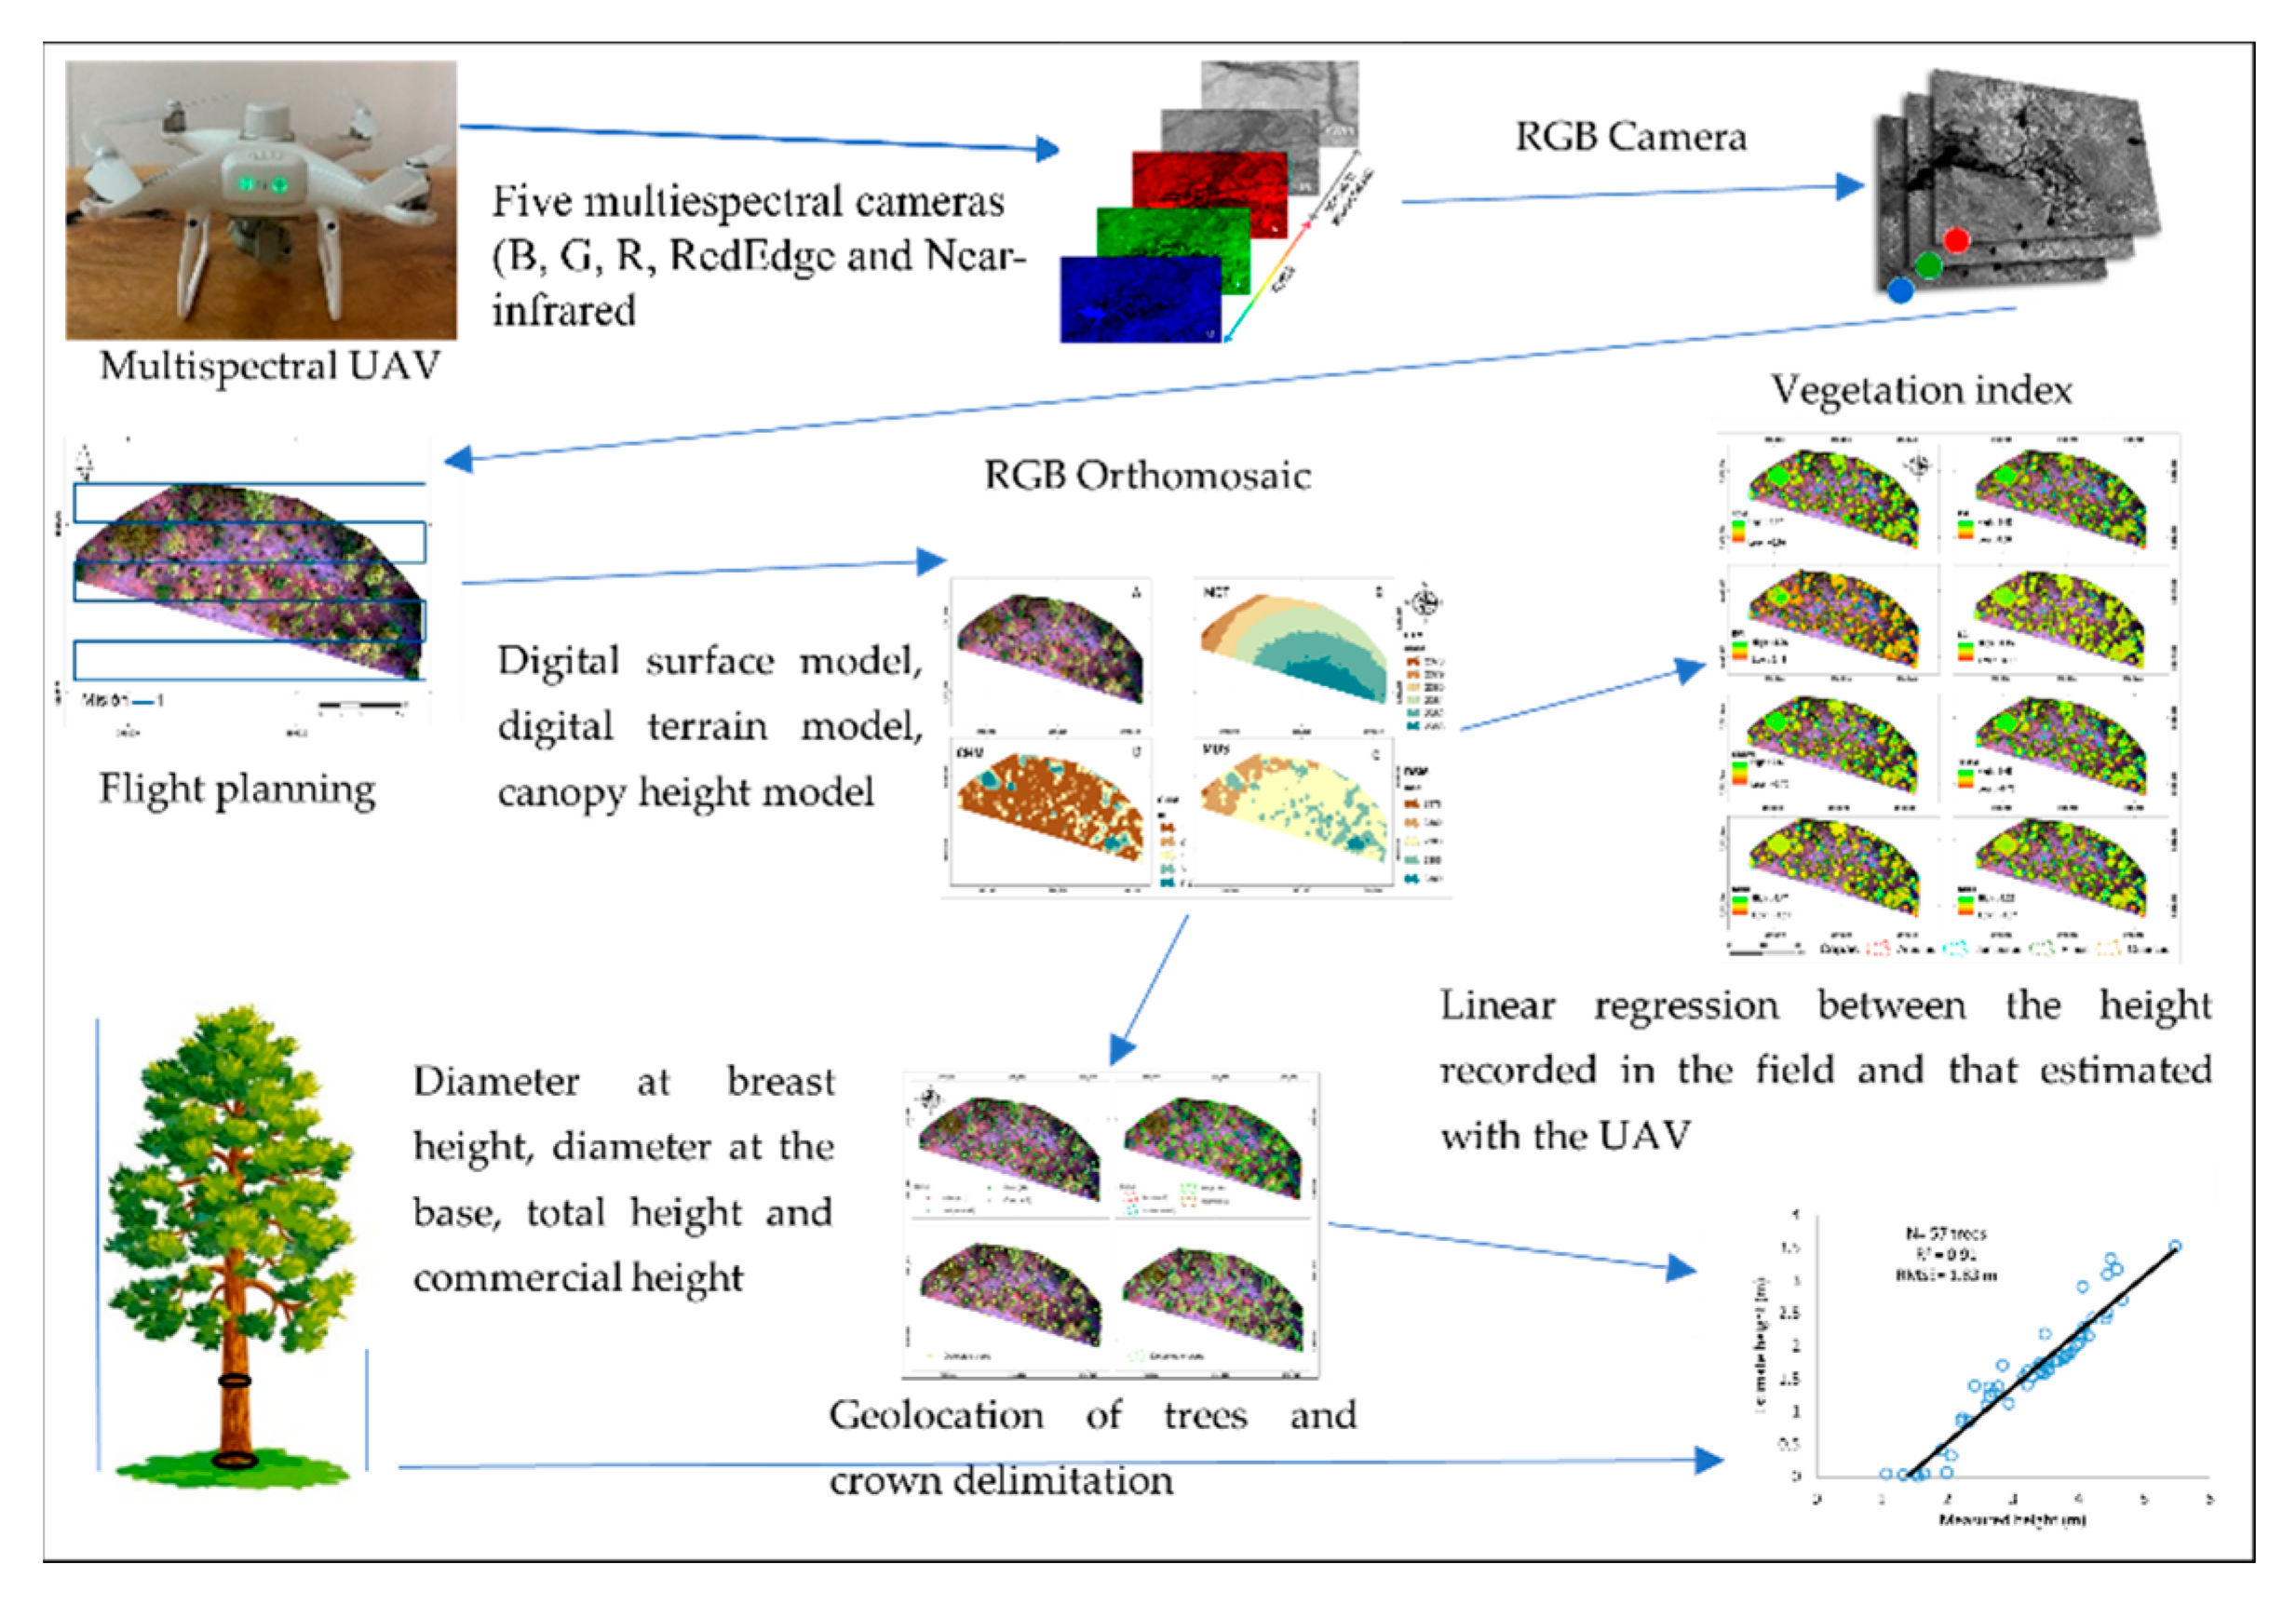
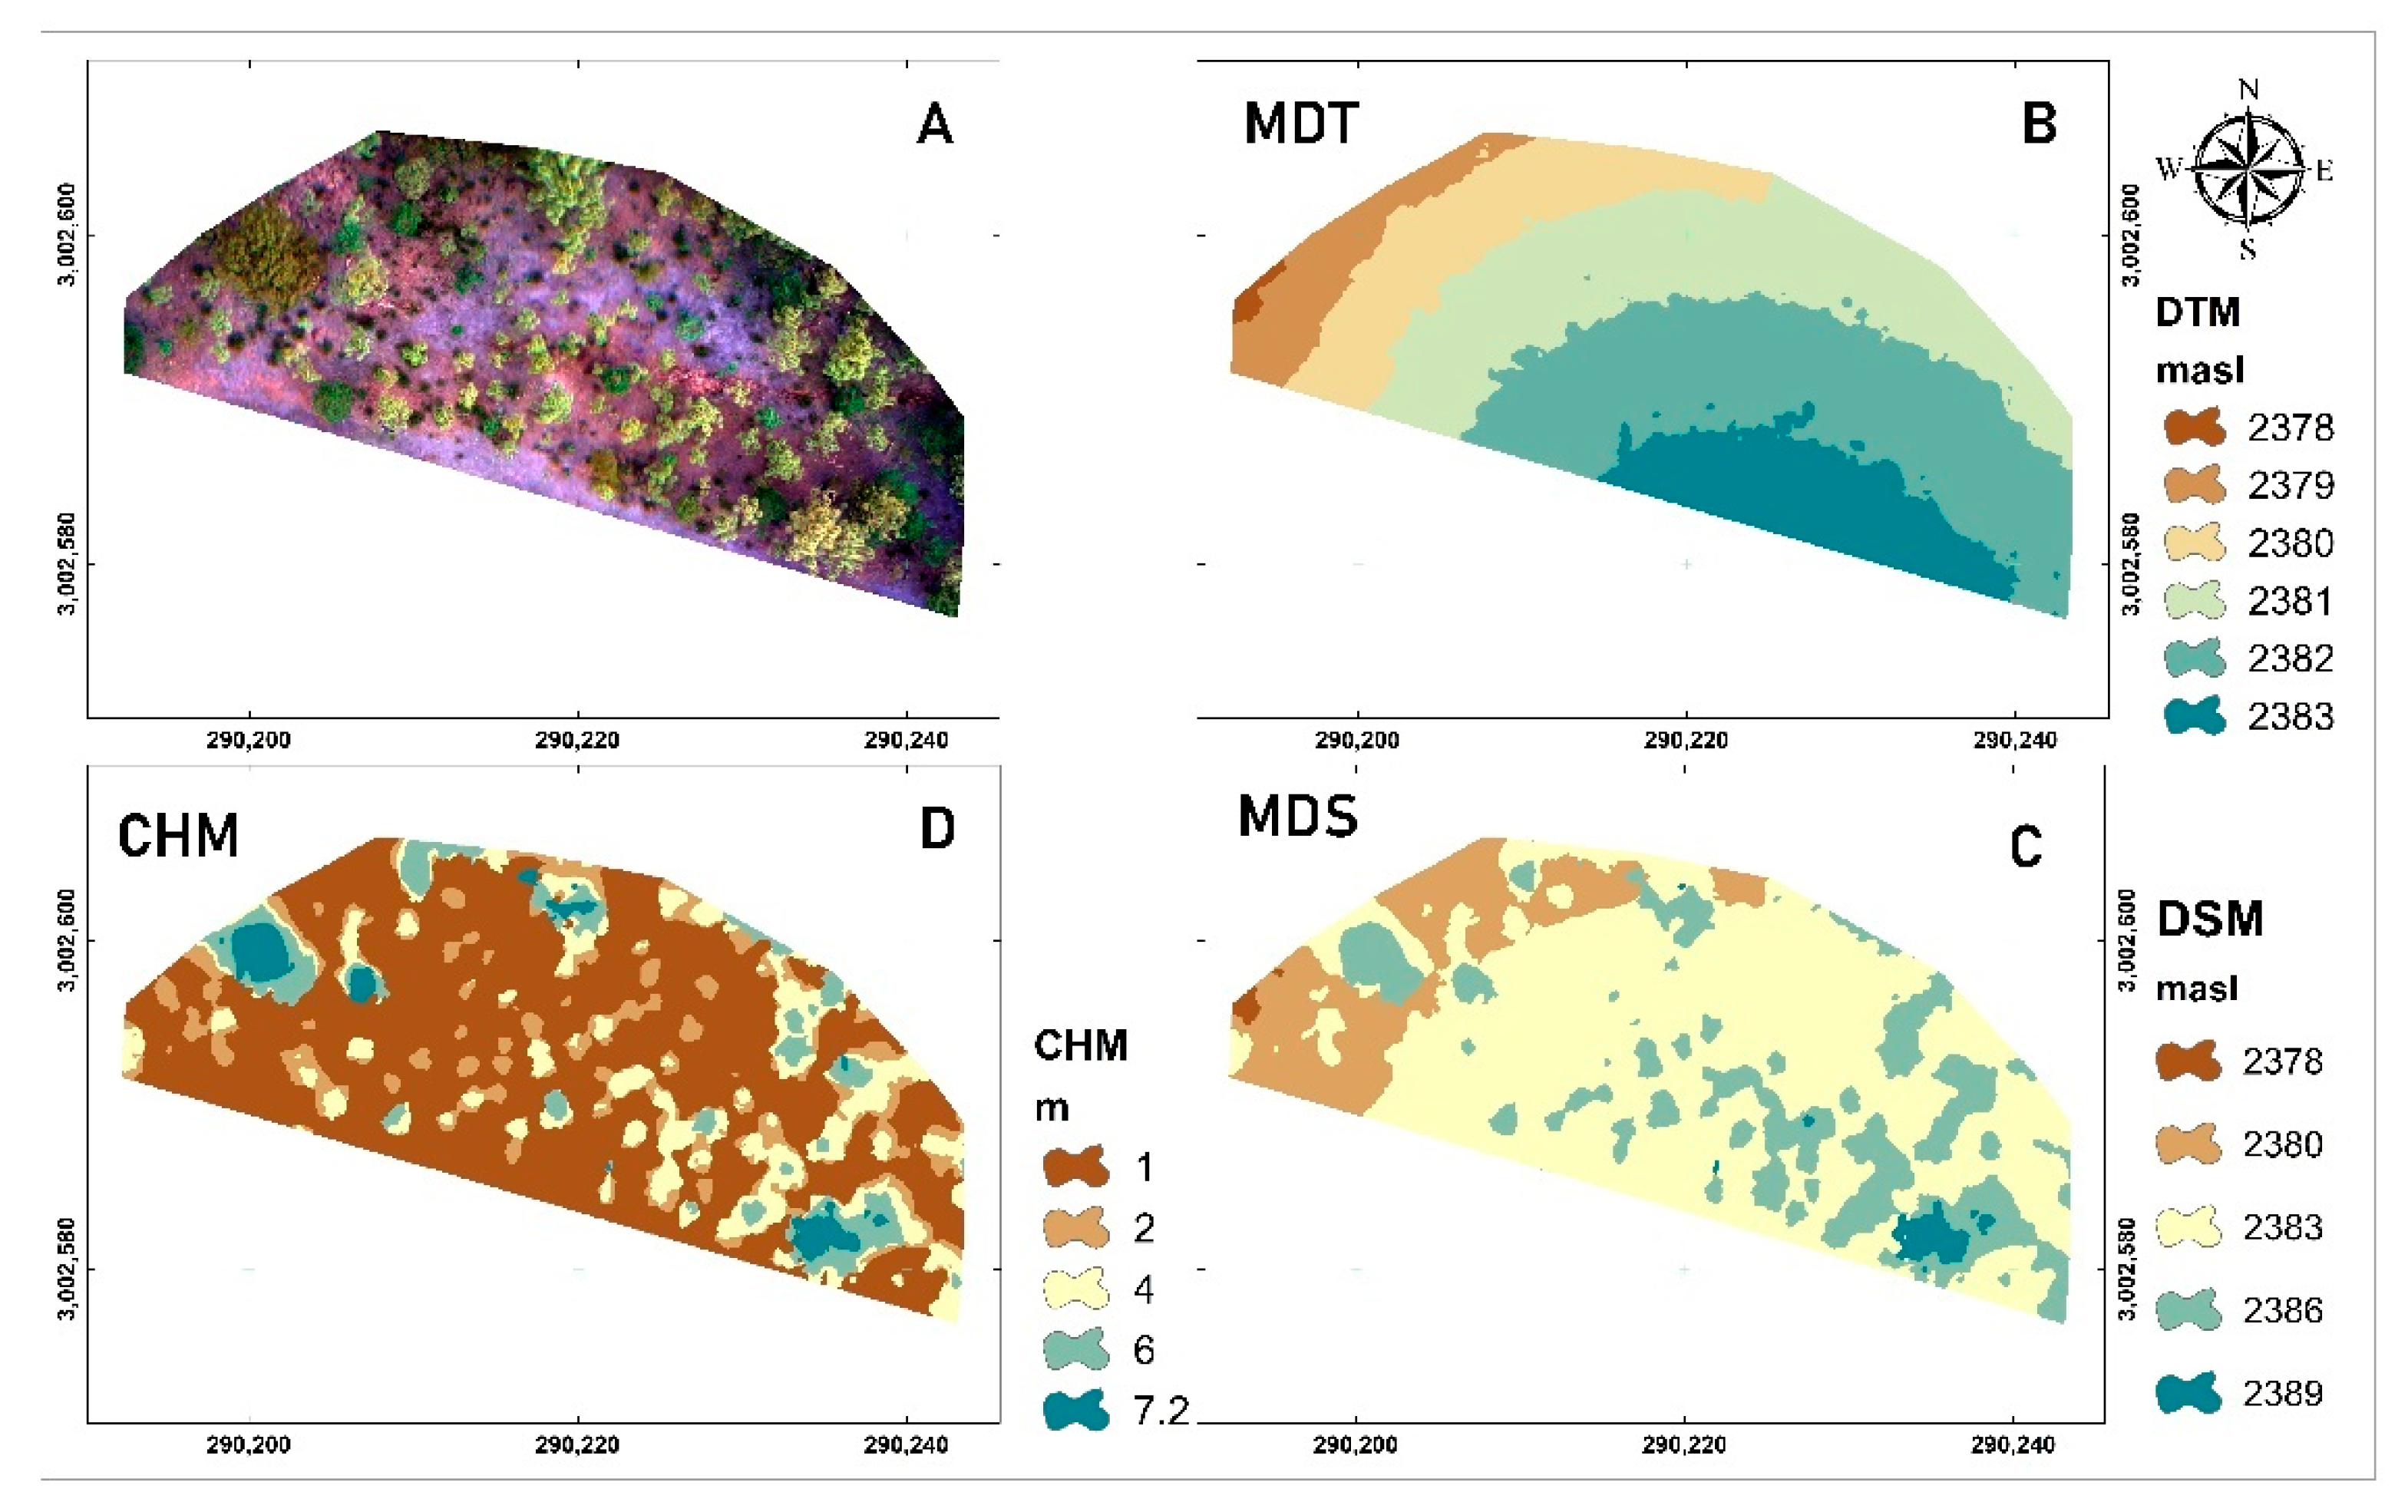
2. Materials and Methods
Workflow
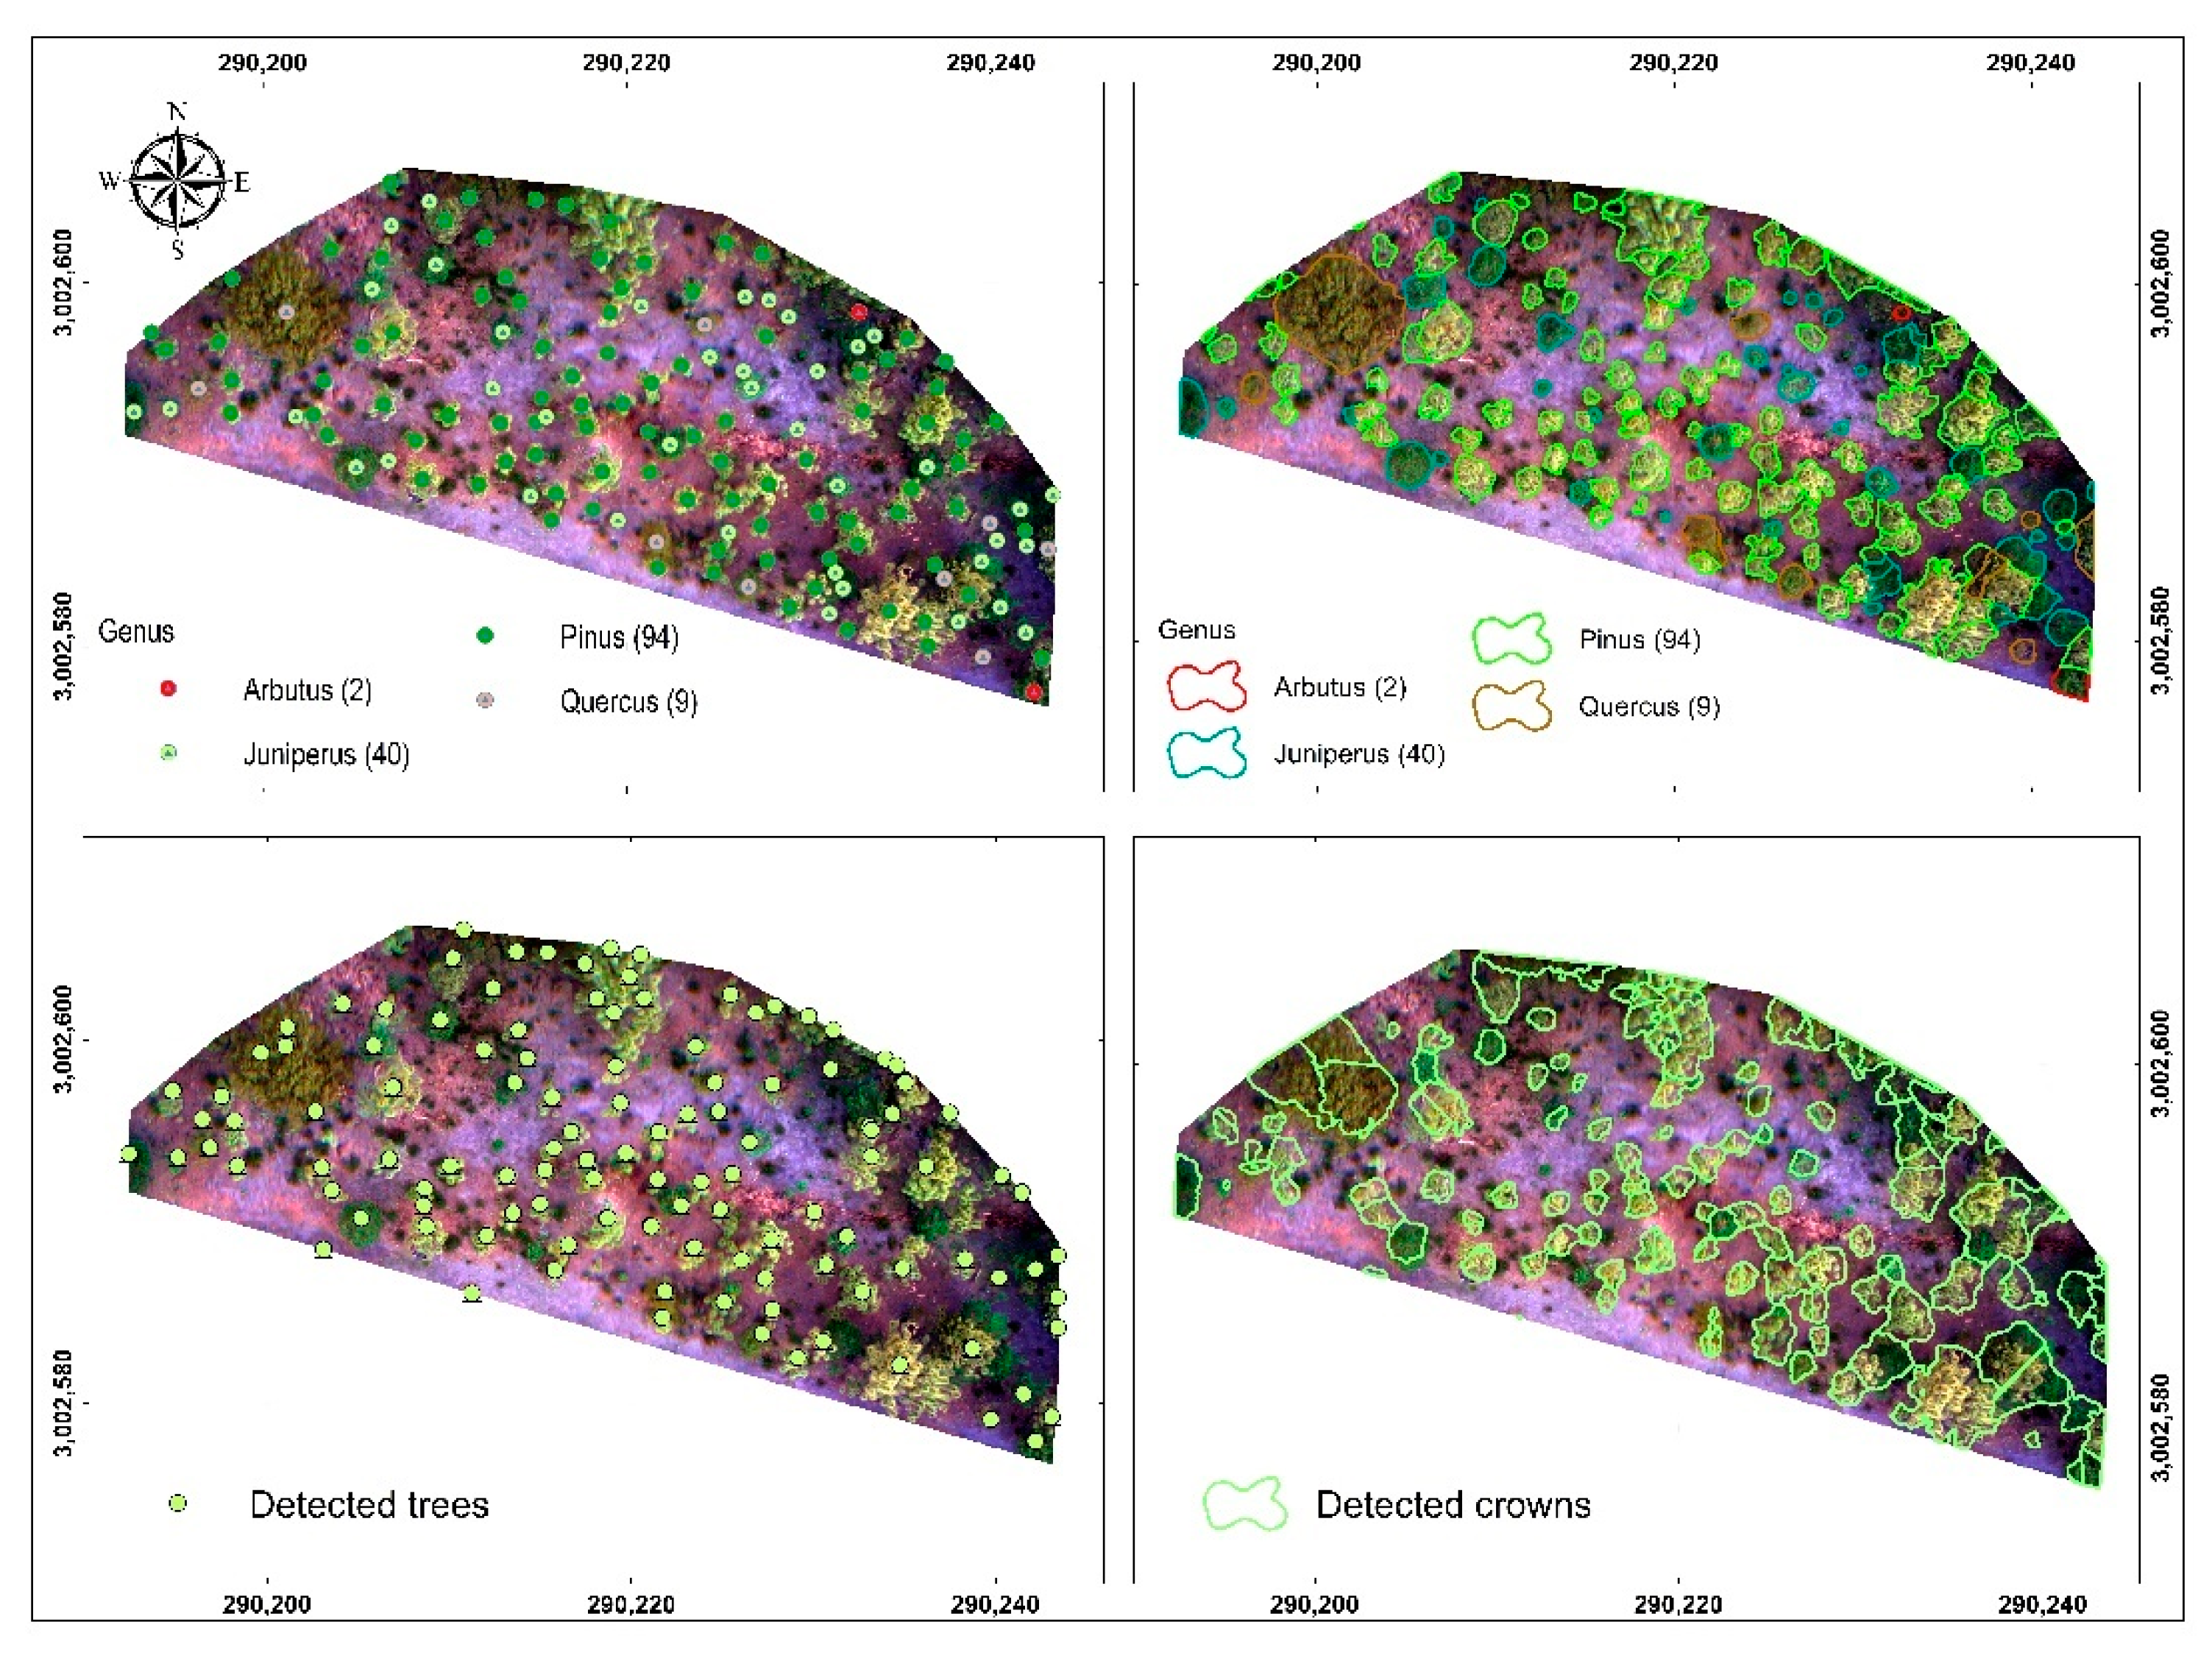
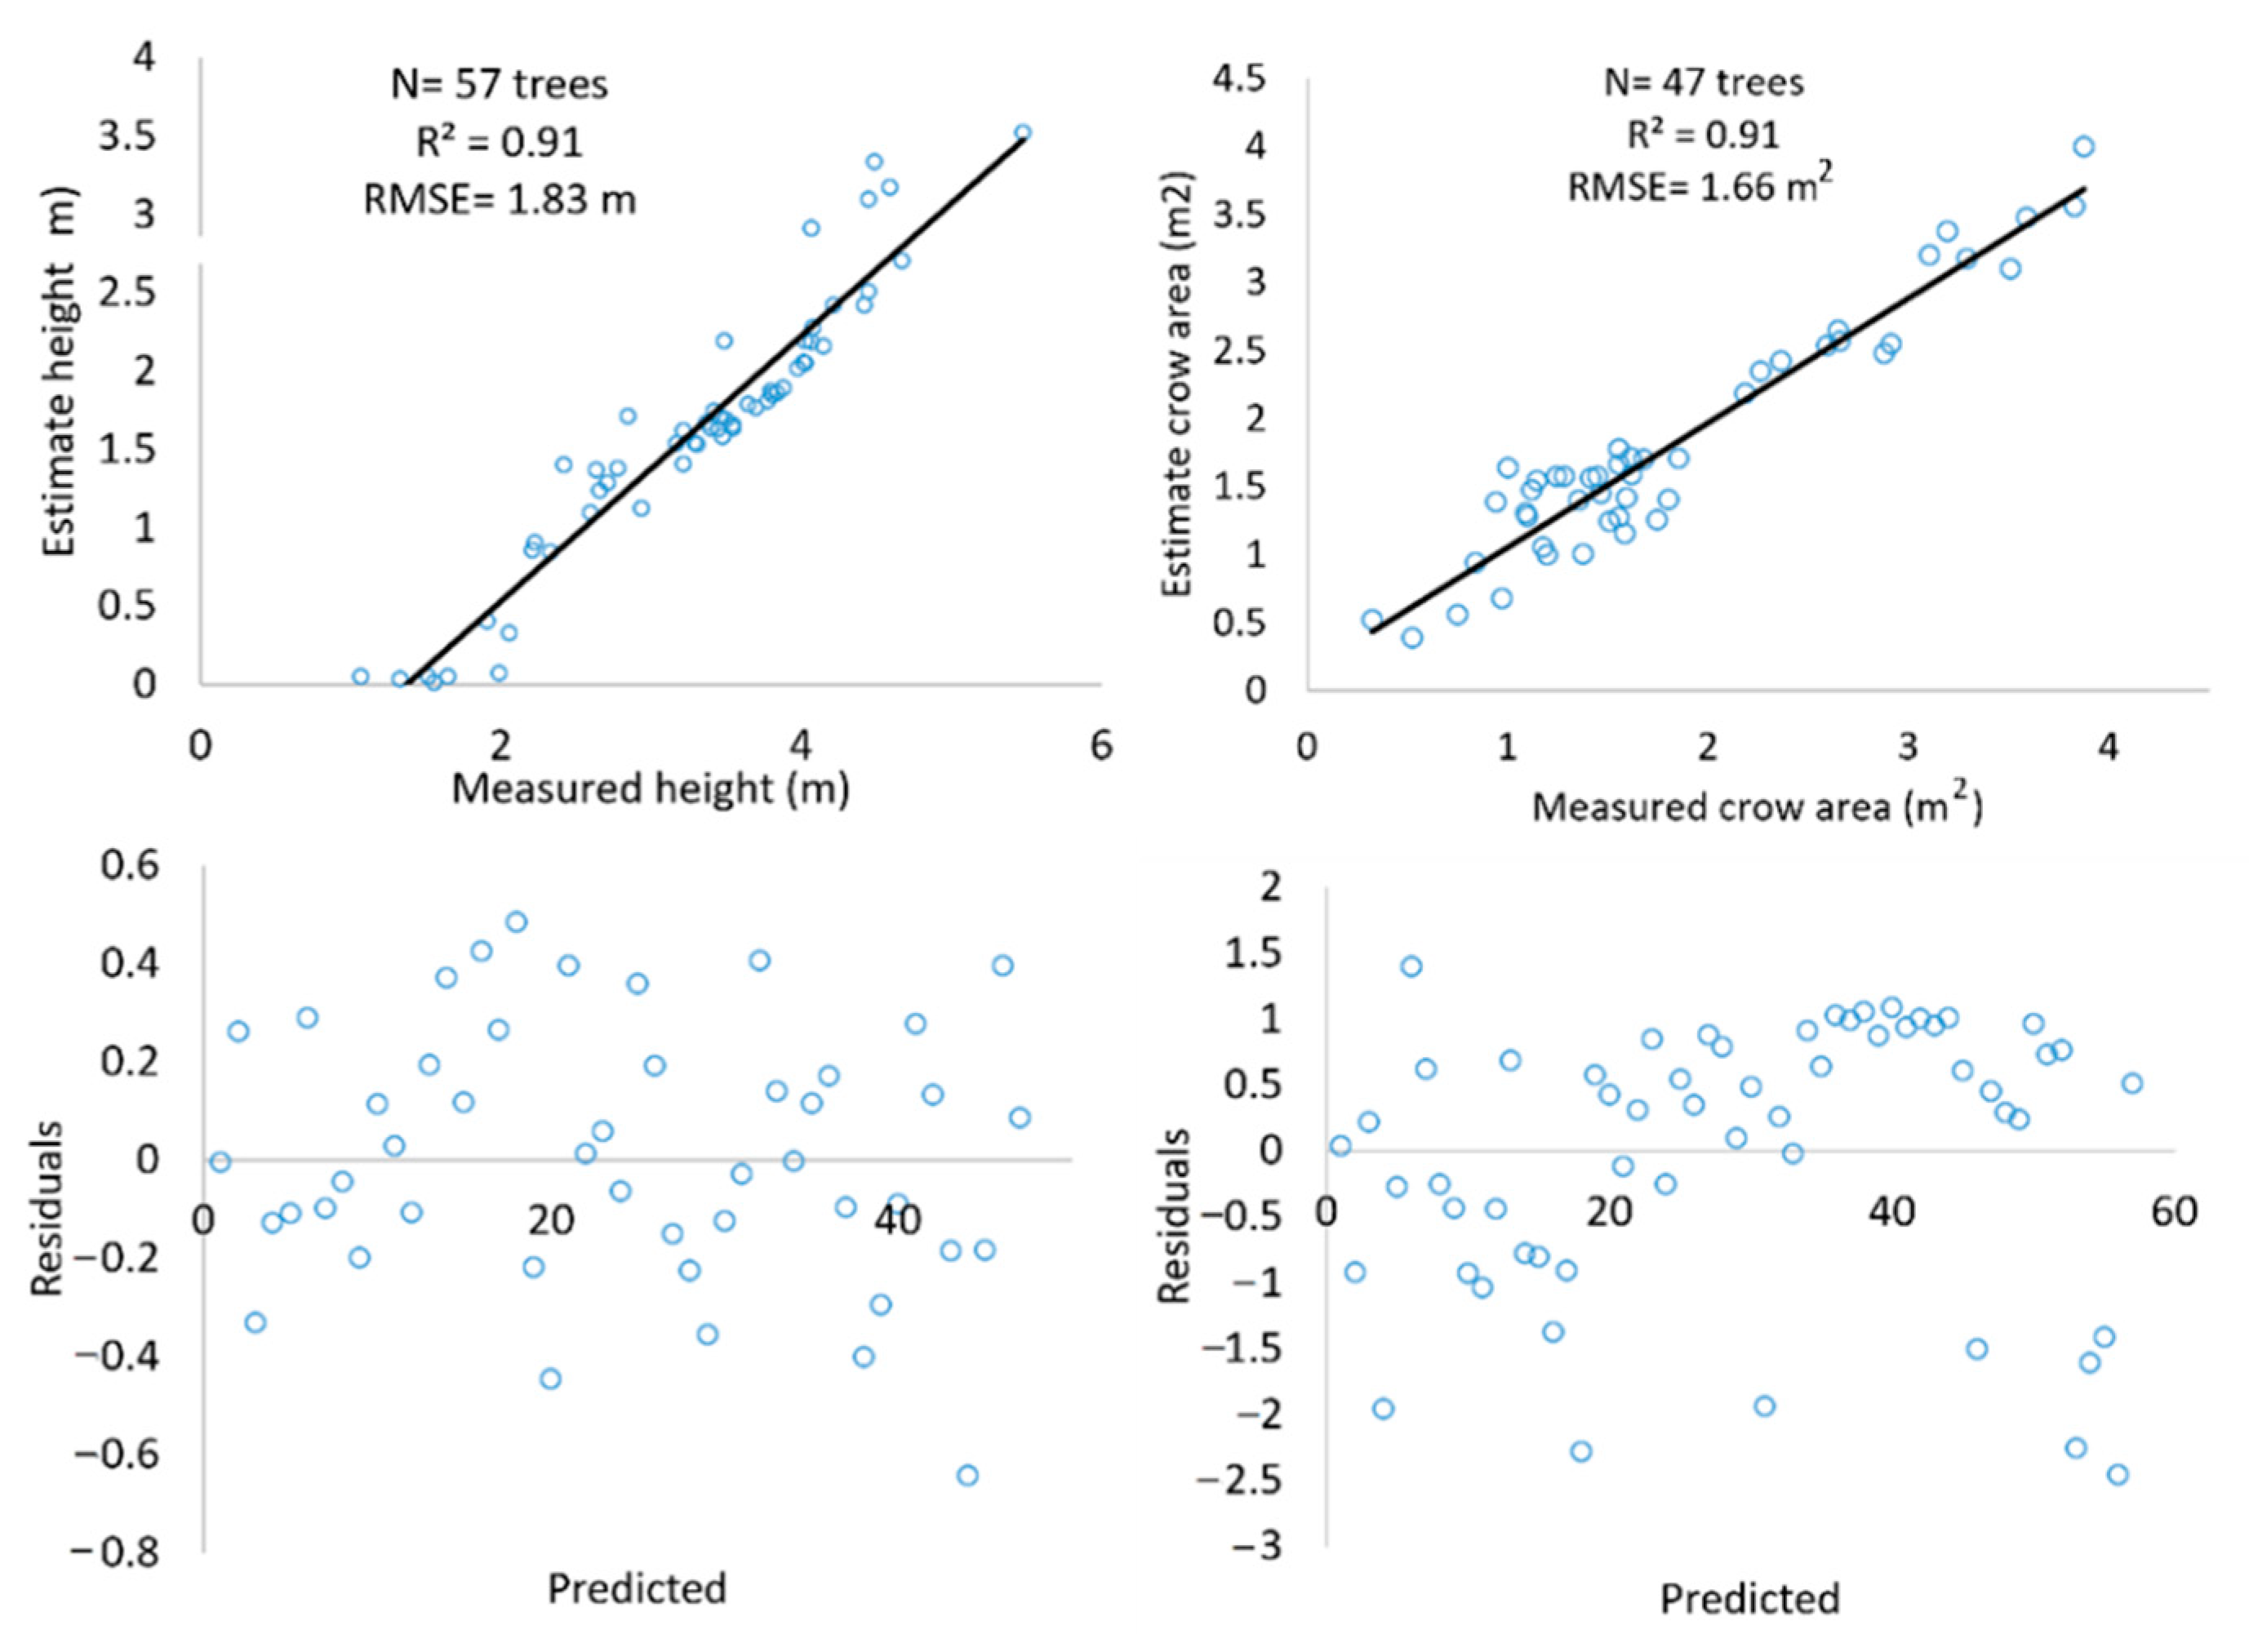
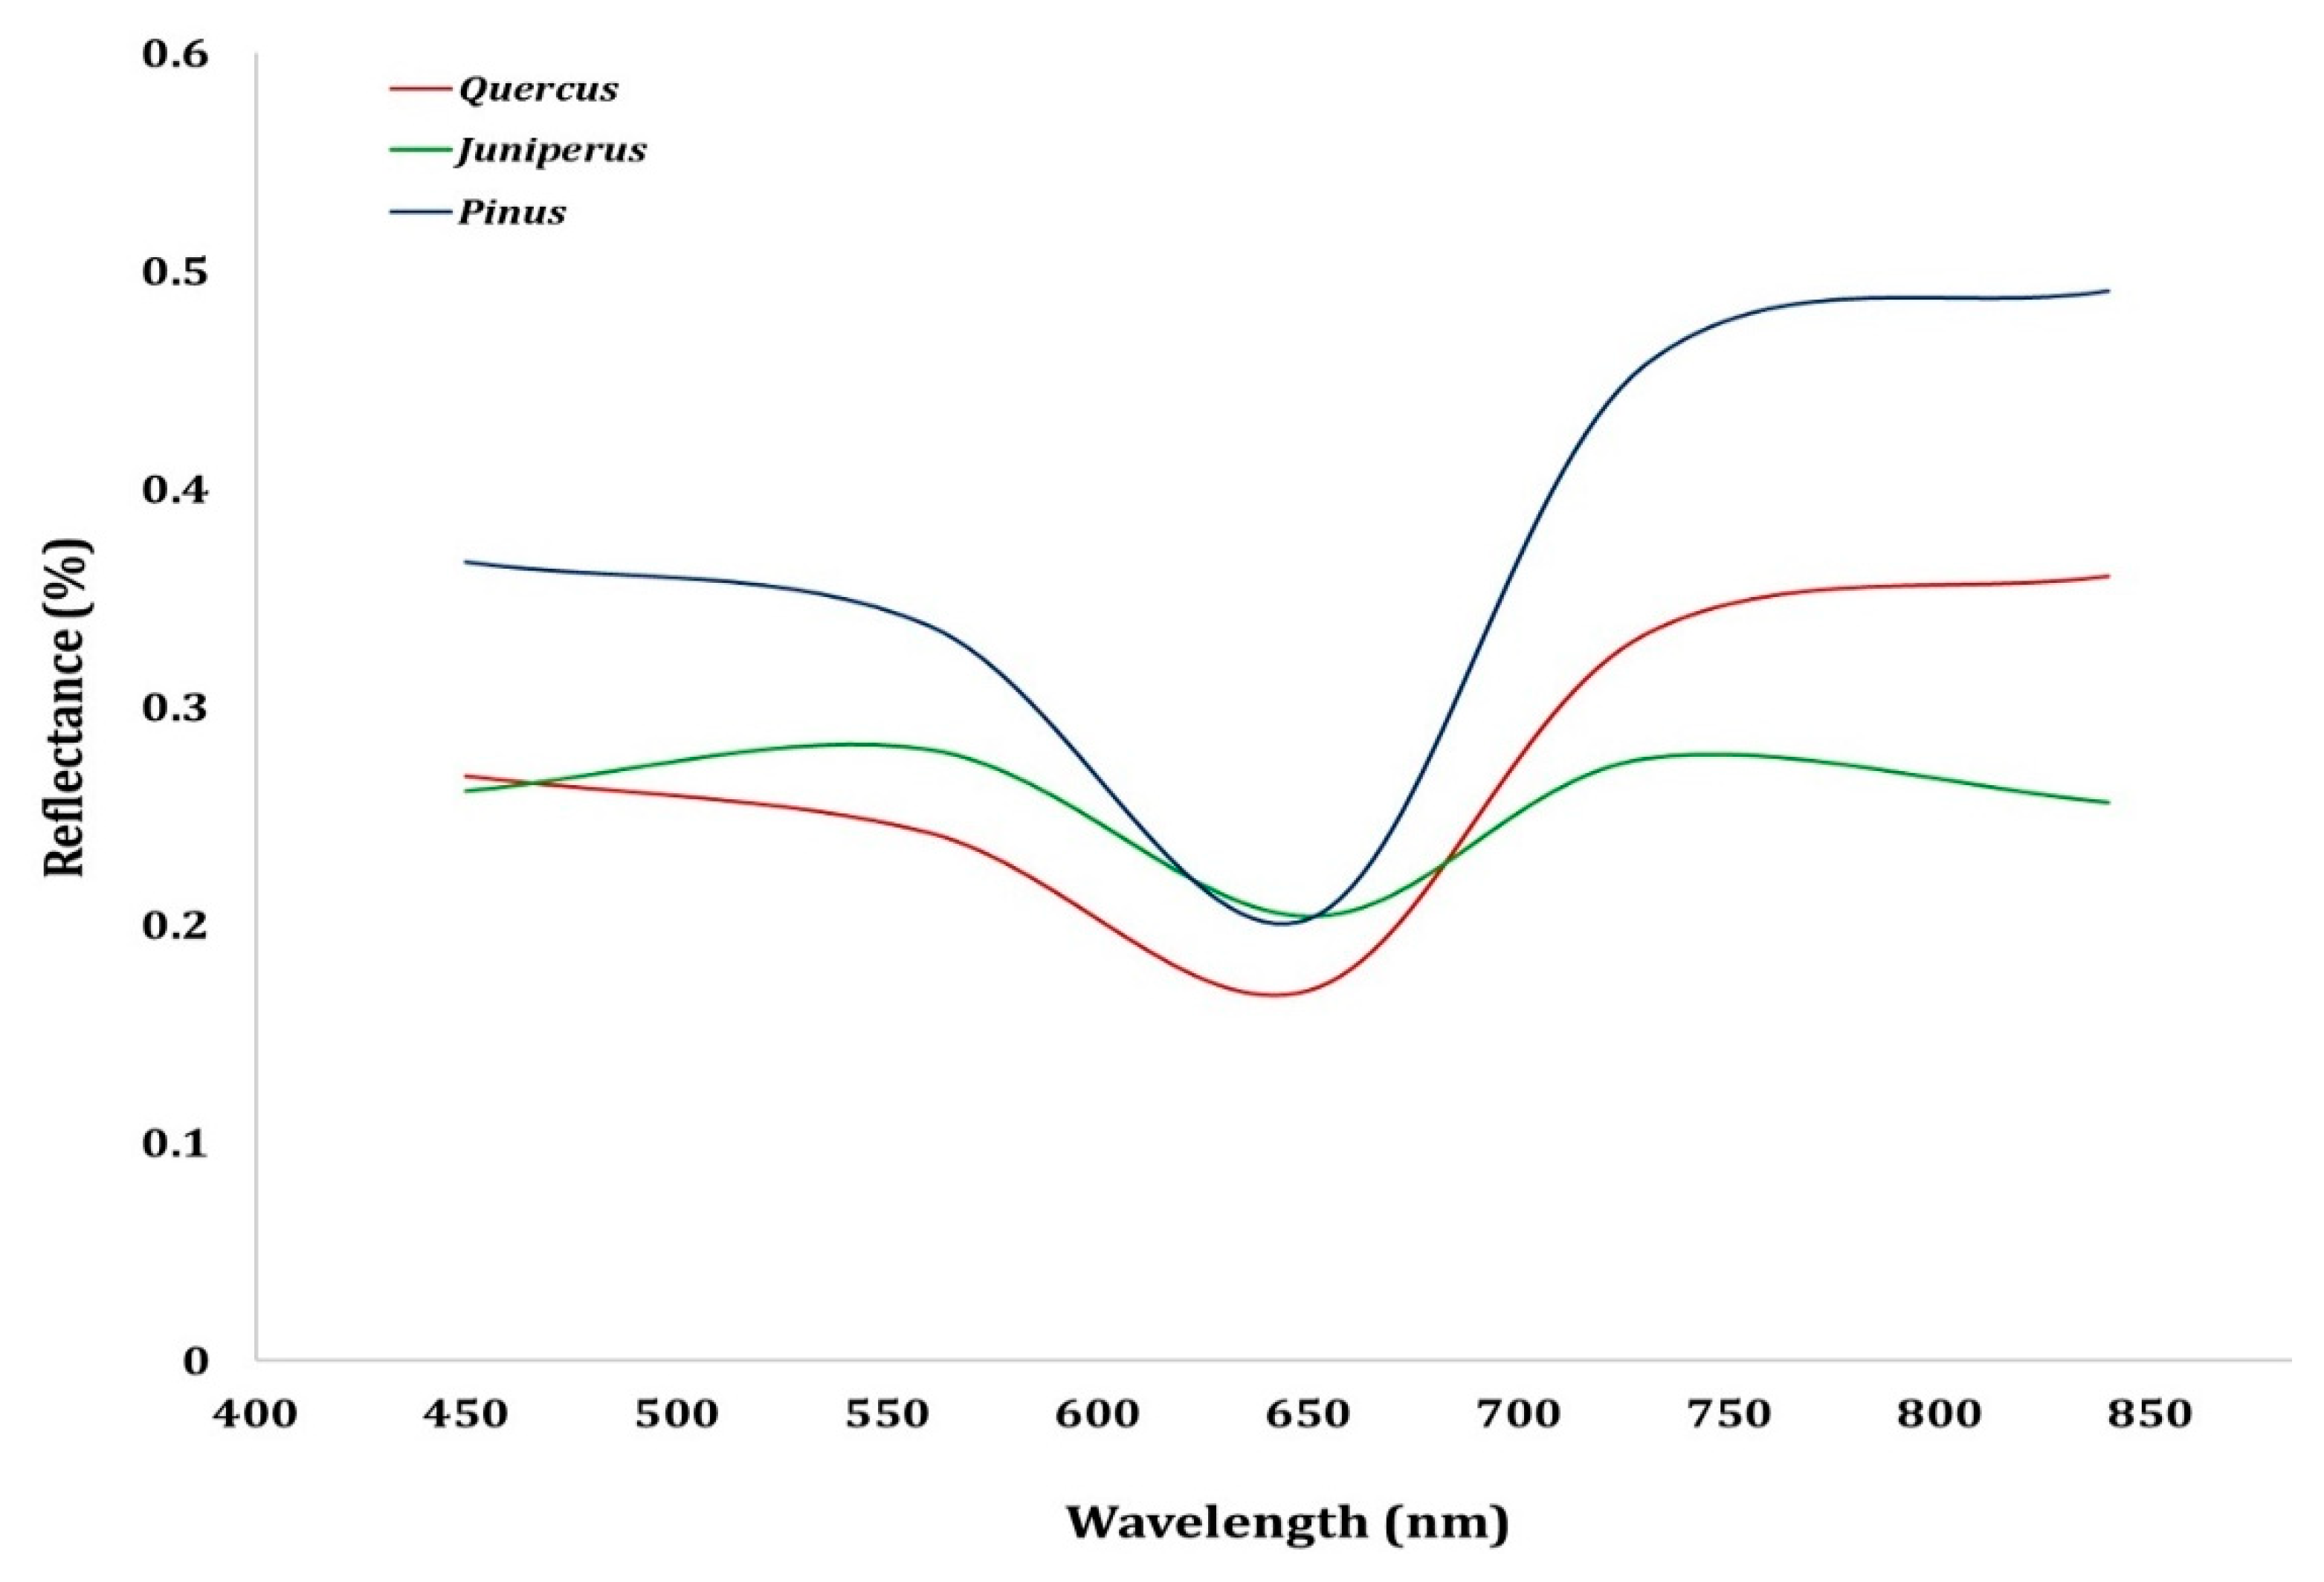
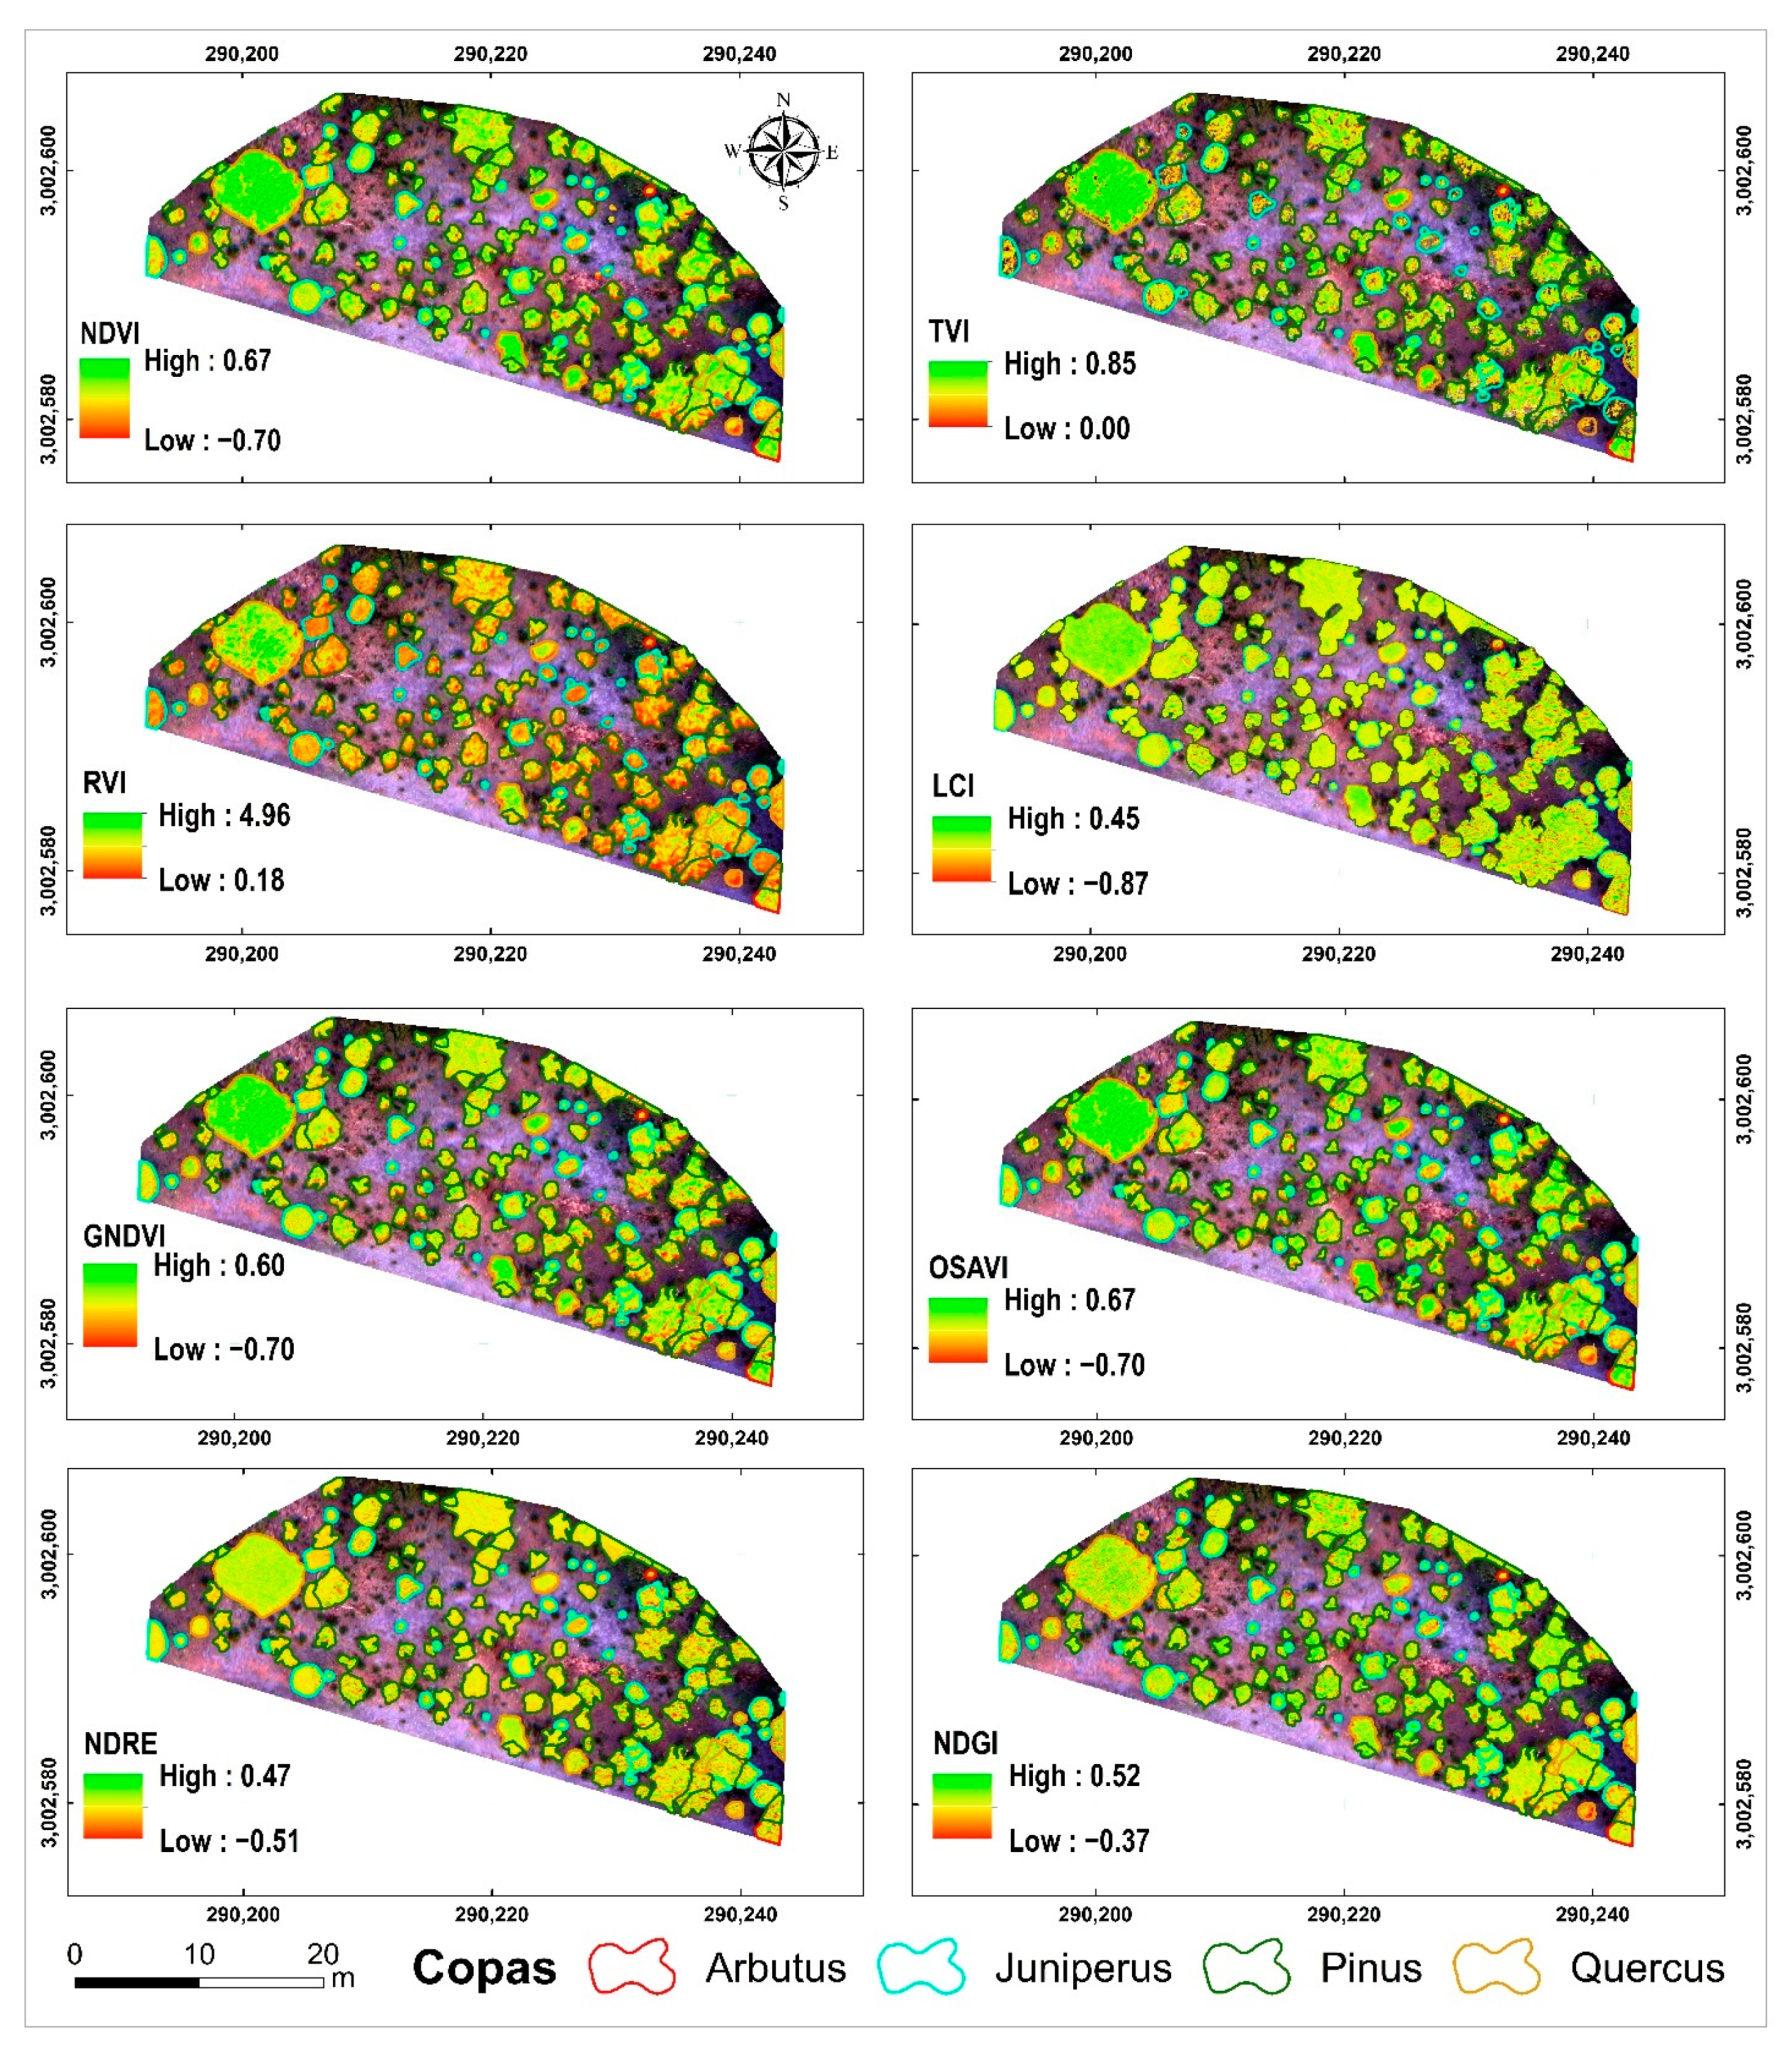
3. Results
4. Discussion
4.1. Estimation of Attributes of Individual Trees
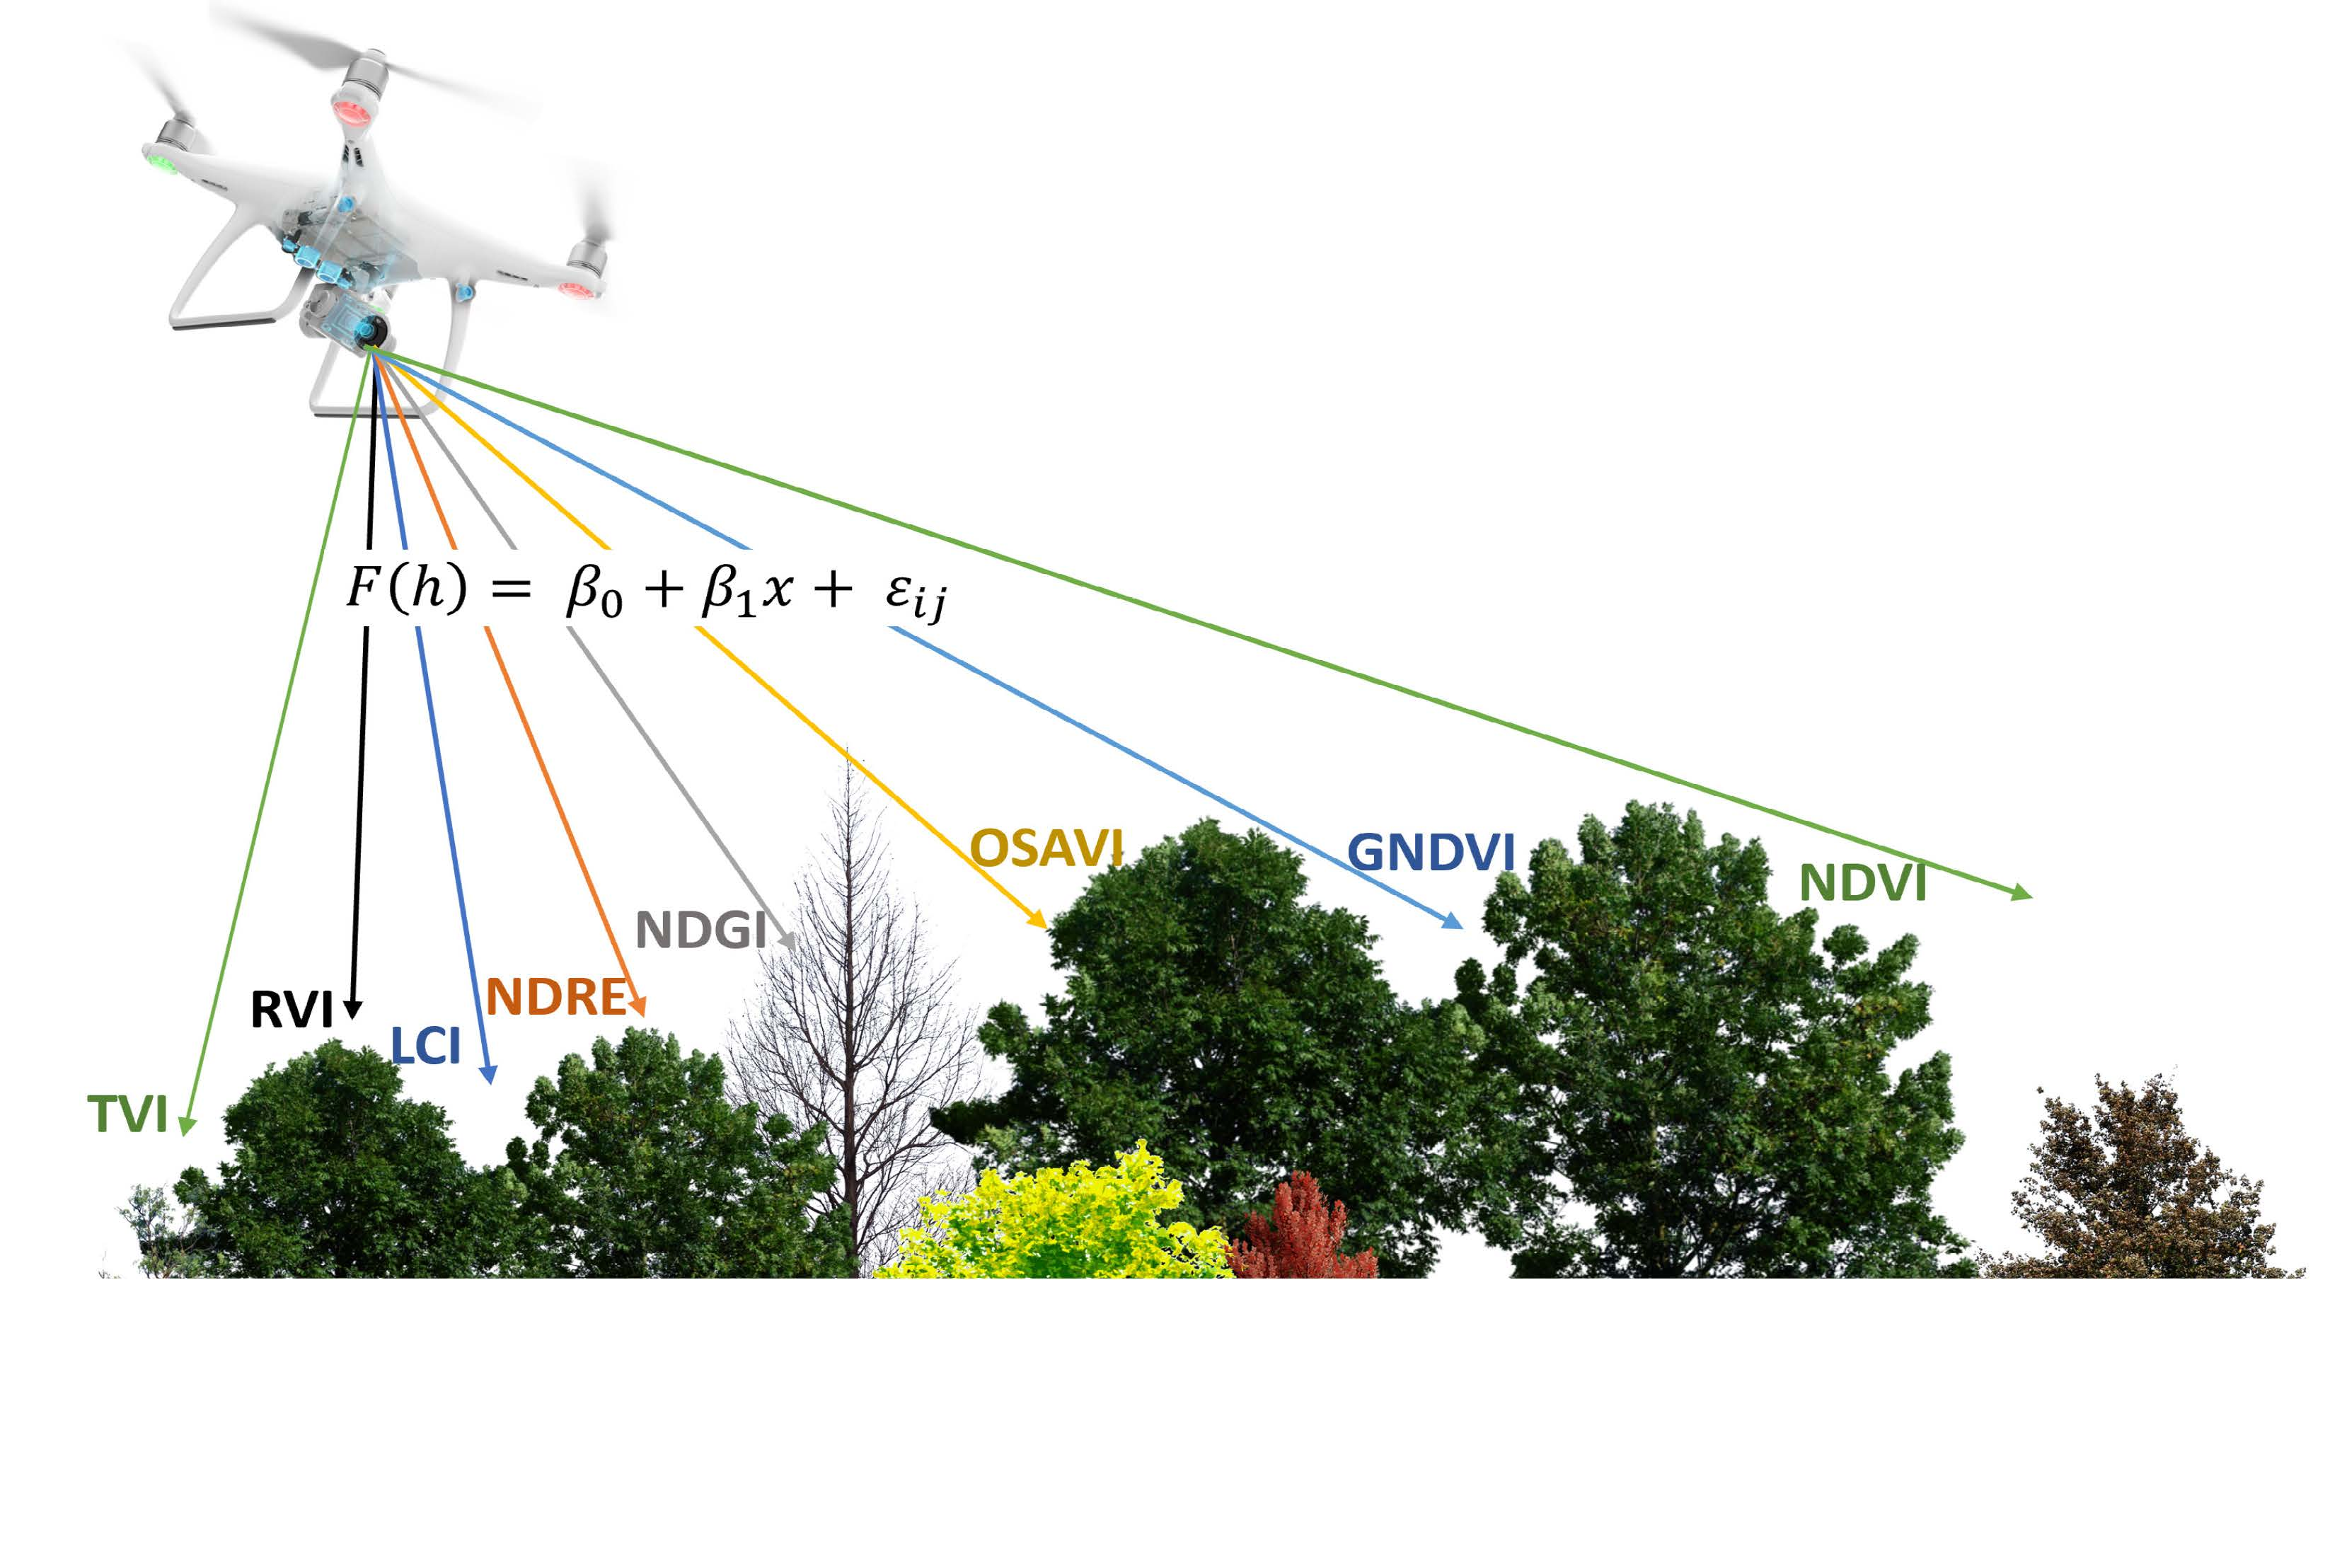
4.2. Multispectral Indices
5. Conclusions
Author Contributions
Funding
Data Availability Statement
Acknowledgments
Conflicts of Interest
References
- Lechner, A.M.; Foody, G.M.; Boyd, D.S. Applications in Remote Sensing to Forest Ecology and Management. One Earth 2020, 2, 405–412. [Google Scholar] [CrossRef]
- Wallerman, J.; Bohlin, J.; Nilsson, M.B.; Franssen, J.E. Drone-Based Forest Variables Mapping of ICOS Tower Surroundings. In IGARSS 2018–2018 IEEE International Geoscience and Remote Sensing Symposium; IEEE: Hoboken, NJ, USA, 2018; pp. 9003–9006. [Google Scholar] [CrossRef]
- Jayathunga, S.; Owari, T.; Tsuyuki, S. The use of fixed–wing UAV photogrammetry with LiDAR DTM to estimate merchantable volume and carbon stock in living biomass over a mixed conifer–broadleaf forest. Int. J. Appl. Earth Obs. Geoinf. 2018, 73, 767–777. [Google Scholar] [CrossRef]
- Overman, H.; Butt, N.; Cummings, A.R.; Luzar, J.B.; Fragoso, J. National REDD+ Implications for Tenured Indigenous Communities in Guyana, and Communities’ Impact on Forest Carbon Stocks. Forests 2018, 9, 231. [Google Scholar] [CrossRef]
- Grybas, H.; Congalton, R.G. A Comparison of Multi-Temporal RGB and Multispectral UAS Imagery for Tree Species Classification in Heterogeneous New Hampshire Forests. Remote Sens. 2021, 13, 2631. [Google Scholar] [CrossRef]
- González, E.; Núñez, C.; Salinas, J.; Rodas, J.; Rodas, M.; Paiva, E.; Kali, Y.; Saad, M.; Lesme, F.; Lesme, J.; et al. Analysis and Application of Multispectral Image Processing Techniques Applied to Soybean Crops from Drones Vision System. In Proceedings of the 18th International Conference on Informatics in Control, Automation and Robotics (ICINCO), Online, 6–8 July 2021; pp. 707–715. [Google Scholar] [CrossRef]
- Lausch, A.; Erasmi, S.; King, D.J.; Magdon, P.; Heurich, M. Understanding Forest Health with Remote Sensing-Part I—A Review of Spectral Traits, Processes and Remote-Sensing Characteristics. Remote Sens. 2016, 8, 1029. [Google Scholar] [CrossRef]
- Dash, J.P.; Pearse, G.D.; Watt, M.S. UAV Multispectral Imagery Can Complement Satellite data for Monitoring Forest Health. Remote Sens. 2018, 10, 1216. [Google Scholar] [CrossRef]
- Moncada, W.; Willems, B.; Pereda, A.; Aldana, C.; Gonzales, J. Tendencia anual, anomalías y predicción del comportamiento de cobertura de vegetación con imágenes Landsat y MOD13Q1, microcuenca Apacheta, Región Ayacucho. Rev. Teledetección 2022, 59, 73–86. [Google Scholar] [CrossRef]
- Yu, R.; Luo, Y.; Zhou, Q.; Zhang, X.; Wu, D.; Ren, L. Early detection of pine wilt disease using deep learning algorithms and UAV-based multispectral imagery. For. Ecol. Manag. 2021, 497, 119493. [Google Scholar] [CrossRef]
- Safonova, A.; Hamad, Y.; Dmitriev, E.; Georgiev, G.; Trenkin, V.; Georgieva, M.; Dimitrov, S.; Iliev, M. Individual Tree Crown Delineation for the Species Classification and Assessment of Vital Status of Forest Stands from UAV Images. Drones 2021, 5, 77. [Google Scholar] [CrossRef]
- Gallardo-Salazar, J.L.; Pompa-García, M. Detecting Individual Tree Attributes and Multispectral Indices Using Unmanned Aerial Vehicles: Applications in a Pine Clonal Orchard. Remote Sens. 2020, 12, 4144. [Google Scholar] [CrossRef]
- Liu, S.; Zeng, W.; Wu, L.; Lei, G.; Chen, H.; Gaiser, T.; Srivastava, A.K. Simulating the Leaf Area Index of Rice from Multispectral Images. Remote Sens. 2021, 13, 3663. [Google Scholar] [CrossRef]
- González-Elizondo, M.S.; González-Elizondo, M.; Tena-Flores, J.A.; Ruacho-González, L.; López-Enríquez, I.L. Vegetación de la Sierra Madre Occidental, México: Una síntesis. Acta Botánica Mex. 2012, 100, 351–403. [Google Scholar] [CrossRef]
- Fraser, B.T.; Congalton, R.G. Monitoring Fine-Scale Forest Health Using Unmanned Aerial Systems (UAS) Multispectral Models. Remote Sens. 2021, 13, 4873. [Google Scholar] [CrossRef]
- Jiang, Q.; Fang, S.; Peng, Y.; Gong, Y.; Zhu, R.; Wu, X.; Ma, Y.; Duan, B.; Liu, J. UAV-Based Biomass Estimacion for Rice Combining Spectral, TIN-Based Structural and Meteorological Features. Remote Sens. 2019, 11, 890. [Google Scholar] [CrossRef]
- Marques Ramos, A.P.; Prado Osco, L.; Garcia Furuya, D.E.; Nunes Gonçalves, W.; Cordeiro Santana, D.; Ribeiro Teodoro, L.P.; da Silva Junior, C.A.; Capristo-Silva, G.F.; Li, J.; Rojo Baio, F.H.; et al. A random forest ranking approach to predict yield in maize with uav-based vegetation spectral indices. Comput. Electron. Agric. 2020, 178, 105791. [Google Scholar] [CrossRef]
- Reyes-Zurita, N.; Rodríguez-Ortiz, G.; Enríquez-del Valle, J.R.; Jiménez-Colmenares, C.L.; Rincón-Ramírez, J.A. Estimación de variables dasométricas en rodales bajo manejo forestal con vehículos aéreos no tripulados. FIGEMPA: Investig. Desarro. 2022, 13, 22–31. [Google Scholar] [CrossRef]
- Erb, K.H.; Kastner, T.; Plutzar, C.; Bais, A.L.S.; Carvalhais, N.; Fetzel, T.; Gingrich, S.; Haberl, H.; Lauk, C.; Niedertscheider, M.; et al. Unexpectedly large impact of forest management and grazing on global vegetation biomass. Nature 2018, 553, 73–76. [Google Scholar] [CrossRef]
- Otsu, K.; Pla, M.; Duane, A.; Cardil, A.; Brotons, L. Estimating the Threshold of Detection on Tree Crown Defoliation Using Vegetation Indices from UAS Multispectral Imagery. Drones 2019, 3, 80. [Google Scholar] [CrossRef]
- Fulé, P.Z.; Ramos-Gómez, M.; Cortés-Montaño, C.; Miller, A.M. Fire regime in a Mexican forest under indigenous resource management. Ecol. Appl. 2011, 21, 764–775. [Google Scholar] [CrossRef]
- DJI P4 Multispectral Specs. Available online: https://www.dji.com/p4-multispectral/specs (accessed on 21 March 2022).
- OpenDroneMap/ODM. Available online: https://github.com/OpenDroneMap/ODM (accessed on 22 February 2022).
- ForestTools: Analyzing Remotely Sensed Forest Data. Available online: https://CRAN.R-project.org/package=ForestTools (accessed on 22 January 2022).
- The R Project for Statistical Computing. Available online: https://www.r-project.org/ (accessed on 22 January 2022).
- Ganivet, E.; Bloomberg, M. Towards rapid assessments of tree species diversity and structure in fragmented tropical forests: A review of perspectives offered by remotely-sensed and field-based data. For. Ecol. Manag. 2019, 432, 40–53. [Google Scholar] [CrossRef]
- Jurado, J.M.; Ortega, L.; Cubillas, J.J.; Feito, F.R. Multispectral Mapping on 3D Models and Multi-Temporal Monitoring for Individual Characterization of Olive Trees. Remote Sens. 2020, 12, 1106. [Google Scholar] [CrossRef]
- Huang, S.; Tang, L.; Hupy, J.P.; Wang, Y.; Shao, G. A commentary review on the use of normalized difference vegetation index (NDVI) in the era of popular remote sensing. J. For. Res. 2021, 32, 1–6. [Google Scholar] [CrossRef]
- Potter, C.S.; Brooks, V. Global analysis of empirical relations between annual climate and seasonality of NDVI. Int. J. Remote Sens. 1998, 19, 2921–2948. [Google Scholar] [CrossRef]
- Hao, Z.; Lin, L.; Post, C.J.; Jiang, Y.; Li, M.; Wei, N.; Yu, K.; Liu, J. Assessing tree height and density of a young forest using a consumer unmanned aerial vehicle (UAV). New For. 2021, 52, 843–862. [Google Scholar] [CrossRef]
- Kureel, N.; Sarup, J.; Matin, S.; Goswami, S.; Kureel, K. Modelling vegetation health and stress using hypersepctral remote sensing data. Modeling Earth Syst. Environ. 2022, 8, 733–748. [Google Scholar] [CrossRef]
- Hardenbol, A.A.; Kuzmin, A.; Korhonen, L.; Korpelainen, P.; Kumpula, T.; Maltamo, M.; Kouki, J. Detection of aspen in conifer-dominated boreal forests with seasonal multispectral drone image point clouds. Silva Fenn. 2021, 55, 10515. [Google Scholar] [CrossRef]
- Jayathunga, S.; Owari, T.; Tsuyuki, S. Digital Aerial Photogrammetry for Uneven-Aged Forest Management: Assessing the Potential to Reconstruct Canopy Structure and Estimate Living Biomass. Remote Sens. 2019, 11, 338. [Google Scholar] [CrossRef]
- Su, J.; Liu, C.; Coombes, M.; Hu, X.; Wang, C.; Xu, X.; Li, Q.; Guo, L.; Chen, W.H. Wheat yellow rust monitoring by learning from multispectral UAV aerial imagery. Comput. Electron. Agric. 2018, 155, 157–166. [Google Scholar] [CrossRef]
- Liu, K.; Shen, X.; Cao, L.; Wang, G.; Cao, F. Estimating forest structural attributes using UAV-LiDAR data in Ginkgo plantations. ISPRS J. Photogramm. Remote Sens. 2018, 146, 465–482. [Google Scholar] [CrossRef]
- Weinstein, B.G.; Marconi, S.; Bohlman, S.A.; Zare, A.; White, E.P. Cross-site learning in deep learning RGB tree crown detection. Ecol. Inform. 2020, 56, 101061. [Google Scholar] [CrossRef]
- Miraki, M.; Sohrabi, H.; Fatehi, P.; Kneubuehler, M. Individual tree crown delineation from high-resolution UAV images in broadleaf forest. Ecol. Inform. 2021, 61, 101207. [Google Scholar] [CrossRef]
- Jones, A.R.; Raja Segaran, R.; Clarke, K.D.; Waycott, M.; Goh, W.S.H.; Gillanders, B.M. Estimating Mangrove Tree Biomass and Carbon Content: A cCmparison of Forest Inventory Techniques and Drone Imagery. Front. Mar. Sci. 2020, 6, 784. [Google Scholar] [CrossRef]
- Panagiotidis, D.; Abdollahnejad, A.; Surový, P.; Chiteculo, V. Determining tree height and crown diameter from high-resolution UAV imagery. Int. J. Remote Sens. 2017, 38, 2392–2410. [Google Scholar] [CrossRef]
- Mohan, M.; Silva, C.A.; Klauberg, C.; Jat, P.; Catts, G.; Cardil, A.; Hudak, A.T.; Dia, M. Individual Tree Detection from Unmanned Aerial Vehicle (UAV) Derived Canopy Height Model in an Open Canopy Mixed Conifer Forest. Forests 2017, 8, 340. [Google Scholar] [CrossRef]
- Corona, P.; Chianucci, F.; Quatrini, V.; Civitarese, V.; Clementel, F.; Costa, C.; Floris, A.; Menesatti, P.; Puletti, N.; Sperandio, G.; et al. Precision forestry: Concepts, tools and perspectives in Italia. For.-J. Silvic. For. Ecol. 2017, 14, 1–21. [Google Scholar] [CrossRef]
- Dalponte, M.; Bruzzone, L.; Gianelle, D. Tree species classification in the Southern Alps based on the fusion of very high geometrical resolution multispectral/hyperspectral images and LiDAR data. Remote Sens. Environ. 2012, 123, 258–270. [Google Scholar] [CrossRef]
- Cunliffe, A.M.; Brazier, R.E.; Anderson, K. Ultra-fine grain landscape-scale quantification of dryland vegetation structure with drone-acquired structure-from-motion photogrammetry. Remote Sens. Environ. 2016, 183, 129–143. [Google Scholar] [CrossRef]
- Zhen, Z.; Quackenbush, L.J.; Zhang, L. Trends in Automatic Individual Tree Crown Detection and Delineation—Evolution of LiDAR Data. Remote Sens. 2016, 8, 333. [Google Scholar] [CrossRef]
- Shashkov, M.; Ivanova, N.; Shanin, V.; Grabarnik, P. Ground Surveys Versus UAV Photography: The Comparison of Two Tree Crown Mapping Techniques. In Information Technologies in the Research of Biodiversity; Springer: Cham, Switzerland, 2019; pp. 48–56. [Google Scholar] [CrossRef]
- Norma Oficial Mexicana NOM-152-SEMARNAT-2006. Available online: http://www.diariooficial.gob.mx/nota_detalle.php?codigo=5064731&date=17/10/2008 (accessed on 20 March 2022).
- Meneses, V.A.B.; Téllez, J.M.; Velasquez, D.F.A. Uso de drones para el análisis de imágenes multiespectrales en agricultura de precisión. Limentech Cienc. y Tecnol. Aliment. 2015, 13, 28–40. [Google Scholar] [CrossRef]
- Gamon, J.A.; Field, C.B.; Goulden, M.L.; Griffin, K.L.; Hartley, A.E.; Joel, G.; Penuelas, J.; Valentini, R. Relationships between NDVI, Canopy Structure, and Photosynthesis in Three Californian Vegetation Types. Ecol. Appl. 1995, 5, 28–41. [Google Scholar] [CrossRef]
- Riihimäki, H.; Heiskanen, J.; Luoto, M. The effect of topography on arctic-alpine aboveground biomass and NDVI patterns. Int. J. Appl. Earth Obs. Geoinf. 2017, 56, 44–53. [Google Scholar] [CrossRef]
- Liu, S.; Cheng, F.; Dong, S.; Zhao, H.; Hou, X.; Wu, X. Spatiotemporal dynamics of grassland aboveground biomass on the Qinghai-Tibet Plateau based on validated MODIS NDVI. Sci. Rep. 2017, 7, 4182. [Google Scholar] [CrossRef]
- Han, H.; Wan, R.; Li, B. Estimating Forest Aboveground Biomass Using Gaofen-1 Images, Sentinel-1 Images, and Machine Learning Algorithms: A Case Study of the Dabie Mountain Region, China. Remote Sens. 2022, 14, 176. [Google Scholar] [CrossRef]
- Alla, A.Q.; Pasho, E.; Marku, V. Growth variability and contrasting climatic responses of two Quercus macrolepis stands from Southern Albania. Trees 2017, 31, 1491–1504. [Google Scholar] [CrossRef]
- Vicente-Serrano, S.M.; Camarero, J.J.; Olano, J.M.; Martín-Hernández, N.; Peña-Gallardo, M.; Tomás-Burguera, M.; Gazol, A.; Azorin-Molina, C.; Bhuyan, U.; Kenawy, A.E. Diverse relationships between forest growth and the Normalized Difference Vegetation Index at a global scale. Remote Sens. Environ. 2016, 187, 14–29. [Google Scholar] [CrossRef]
- Cui, B.; Zhao, Q.; Huang, W.; Song, X.; Ye, H.; Zhou, X. A New Integrated Vegetation Index for the Estimation of Winter Wheat Leaf Chlorophyll Content. Remote Sens. 2019, 11, 974. [Google Scholar] [CrossRef]
- Σκιάνης, Γ.A.; Βαϊόπουλος, Δ.A.; Νικολακόπουλος, Κ. Assessment of the TVI vegetation index with the aid of probability theory. Geol. Soc. Am. Bull. 2004, 36, 1338–1346. [Google Scholar] [CrossRef][Green Version]
- Girolimetto, D.; Venturini, V. Water Stress Estimation from NDVI-Ts Plot and the Wet Environment Evapotranspiration. Adv. Remote Sens. 2013, 2, 283–291. [Google Scholar] [CrossRef]
- Thapa, S.; Rudd, J.C.; Xue, Q.; Bhandari, M.; Reddy, S.K.; Jessup, K.E.; Liu, S.; Devkota, R.N.; Baker, J.; Baker, S. Use of NDVI for characterizing winter wheat response to water stress in a semi-arid environment. J. Crop Improv. 2019, 33, 633–648. [Google Scholar] [CrossRef]
- Pompa-García, M.; Camarero-Martínez, J.J. Potencial dendroclimático de la madera temprana y tardía de Pinus cooperi Blanco. Agrociencia 2015, 49, 177–187. Available online: http://www.scielo.org.mx/pdf/agro/v49n2/v49n2a6.pdf (accessed on 12 February 2022).
- Jorge, J.; Vallbé, M.; Soler, J.A. Detection of irrigation inhomogeneities in an olive grove using the NDRE vegetation index obtained from UAV images. Eur. J. Remote Sens. 2019, 52, 169–177. [Google Scholar] [CrossRef]
- Lei, S.; Luo, J.; Tao, X.; Qiu, Z. Remote Sensing Detecting of Yellow Leaf Disease of Arecanut Based on UAV Multisource Sensors. Remote Sens. 2021, 13, 4562. [Google Scholar] [CrossRef]
- Steven, M.D. The Sensitivity of the OSAVI Vegetation Index to Observational Parameters. Remote Sens. Environ. 1998, 63, 49–60. [Google Scholar] [CrossRef]
- Qi, H.; Wu, Z.; Zhang, L.; Li, J.; Zhou, J.; Jun, Z.; Zhu, B. Monitoring of peanut leaves chlorophyll content based on drone-based multispectral image feature extraction. Comput. Electron. Agric. 2021, 187, 106292. [Google Scholar] [CrossRef]
- Nedkov, R. Normalized Differential Greenness Index for Vegetation Dynamics Assessment. Comptes Rendus De L’academie Bulg. Des Sci. 2017, 70, 1143–1146. Available online: https://www.researchgate.net/profile/R-Nedkov-2/publication/319141286_Normalized_differential_greenness_index_for_vegetation_dynamics_assessment/links/5994608d0f7e9b98953af1d6/Normalized-differential-greenness-index-for-vegetation-dynamics-assessment.pdf (accessed on 22 February 2022).
- De Castro, A.I.; Torres-Sánchez, J.; Peña, J.M.; Jiménez-Brenes, F.M.; Csillik, O.; López-Granados, F. An Automatic Random Forest-OBIA Algorithm for Early Weed Mapping between and within Crop Rows Using UAV Imagery. Remote Sens. 2018, 10, 285. [Google Scholar] [CrossRef]
- Liu, H. Classification of urban tree species using multi-features derived from four-season RedEdge-MX data. Comput. Electron. Agric. 2022, 194, 106794. [Google Scholar] [CrossRef]
- Li, L.; Mu, X.; Chianucci, F.; Qi, J.; Jiang, J.; Zhou, J.; Chen, L.; Huang, H.; Yan, G.; Liu, S. Ultrahigh-resolution boreal forest canopy mapping: Combining UAV imagery and photogrammetric point clouds in a deep-learning-based approach. Int. J. Appl. Earth Obs. Geoinf. 2022, 107, 102686. [Google Scholar] [CrossRef]
- Wan, L.; Cen, H.; Zhu, J.; Zhang, J.; Zhu, Y.; Sun, D.; Du, X.; Zhai, L.; Weng, H.; Li, Y.; et al. Grain yield prediction of rice using multi-temporal UAV-based RGB and multispectral images and model transfer—A case study of small farmlands in the South of China. Agric. For. Meteorol. 2020, 291, 108096. [Google Scholar] [CrossRef]
- Asner, G.P. Biophysical and Biochemical Sources of Variability in Canopy Reflectance. Remote Sens. Environ. 1998, 64, 234–253. [Google Scholar] [CrossRef]


| Variable | CH | TH | Hc | BD | ND |
|---|---|---|---|---|---|
| n | 163 | 163 | 163 | 163 | 163 |
| min | 1.13 | 1.91 | 0.56 | 4 | 1.8 |
| q1 | 1.86 | 3.495 | 1.555 | 9.25 | 6.2 |
| average | 2.211 | 4.911 | 2.7 | 13.064 | 9.247 |
| median | 2.16 | 4.45 | 2.18 | 11.5 | 8.1 |
| q3 | 2.41 | 5.5 | 3.185 | 15.05 | 10.75 |
| max | 5.39 | 15.09 | 10.41 | 46.3 | 37.5 |
| sd | 0.664 | 2.262 | 1.782 | 6.446 | 5.231 |
| se | 0.052 | 0.177 | 0.14 | 0.505 | 0.41 |
| Genus | Variable | n | min | q1 | Average | Median | q3 | max | sd | se |
|---|---|---|---|---|---|---|---|---|---|---|
| Arbutus | CH | 2 | 1.54 | 1.585 | 1.63 | 1.63 | 1.675 | 1.72 | 0.127 | 0.09 |
| TH | 4.05 | 4.318 | 4.585 | 4.585 | 4.852 | 5.12 | 0.757 | 0.535 | ||
| Hc | 2.51 | 2.732 | 2.955 | 2.955 | 3.178 | 3.4 | 0.629 | 0.445 | ||
| BD | 12.5 | 14.125 | 15.75 | 15.75 | 17.375 | 19 | 4.596 | 3.25 | ||
| ND | 8 | 9.45 | 10.9 | 10.9 | 12.35 | 13.8 | 4.101 | 2.9 | ||
| Juniperus | CH | 43 | 1.13 | 1.43 | 1.745 | 1.71 | 2.03 | 2.41 | 0.365 | 0.056 |
| TH | 1.91 | 2.58 | 3.549 | 3.45 | 4.47 | 6.34 | 1.122 | 0.171 | ||
| Hc | 0.56 | 1.005 | 1.804 | 1.57 | 2.32 | 4.89 | 0.876 | 0.134 | ||
| BD | 4 | 6.55 | 10.667 | 8.3 | 14.15 | 28.8 | 5.213 | 0.795 | ||
| ND | 1.8 | 3.95 | 7.174 | 6.1 | 10.05 | 22.6 | 4.042 | 0.616 | ||
| Pinus | CH | 109 | 1.52 | 2.02 | 2.429 | 2.28 | 2.53 | 5.39 | 0.678 | 0.065 |
| TH | 2.21 | 3.88 | 5.33 | 4.7 | 6.1 | 15.09 | 2.373 | 0.227 | ||
| Hc | 0.6 | 1.75 | 2.901 | 2.47 | 3.32 | 10.41 | 1.856 | 0.178 | ||
| BD | 6.3 | 10 | 13.504 | 11.6 | 14.7 | 46.3 | 6.025 | 0.577 | ||
| ND | 3.9 | 6.9 | 9.742 | 8.2 | 10.3 | 37.5 | 5.141 | 0.492 | ||
| Quercus | CH | 9 | 1.66 | 1.72 | 1.927 | 1.92 | 2.02 | 2.31 | 0.208 | 0.069 |
| TH | 3.3 | 4.91 | 6.411 | 5.86 | 8.81 | 10.11 | 2.446 | 0.815 | ||
| Hc | 1.64 | 2.99 | 4.484 | 3.95 | 6.83 | 8.01 | 2.29 | 0.763 | ||
| BD | 6.3 | 11.5 | 18.6 | 16.4 | 19.5 | 44.7 | 11.669 | 3.89 | ||
| ND | 3.5 | 7.4 | 12.789 | 11.4 | 14.3 | 31.3 | 8.264 | 2.755 |
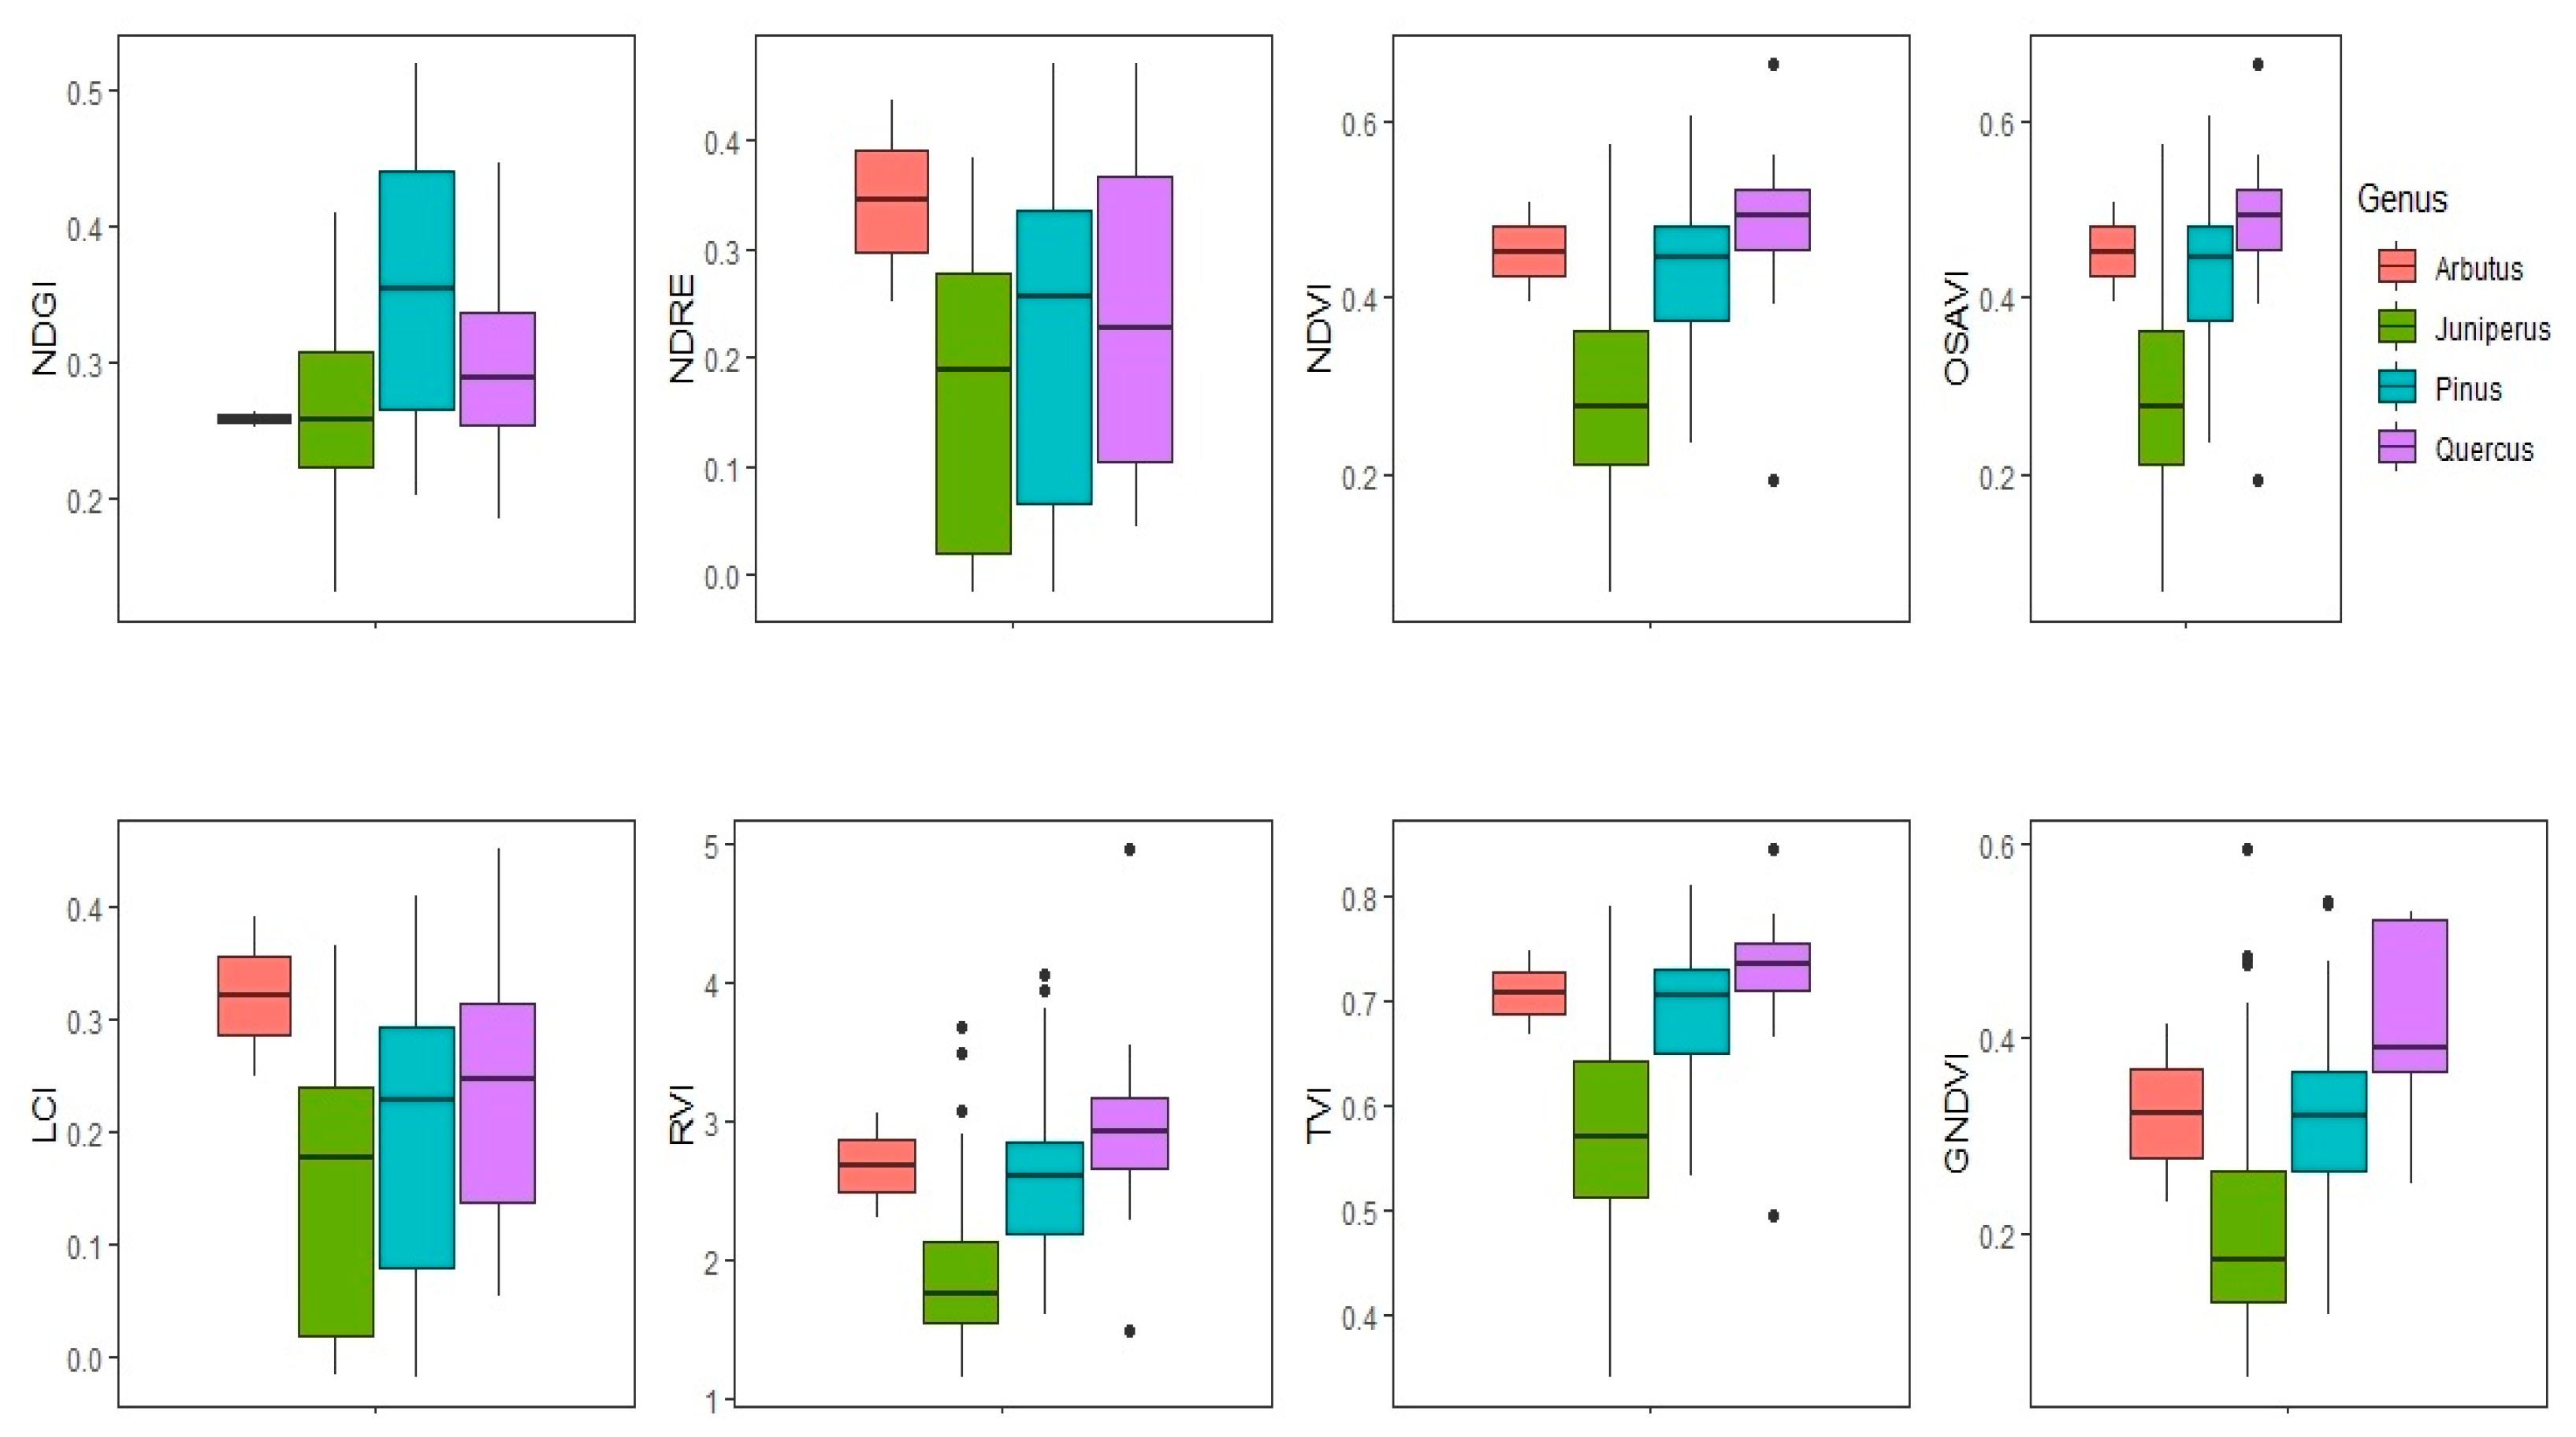
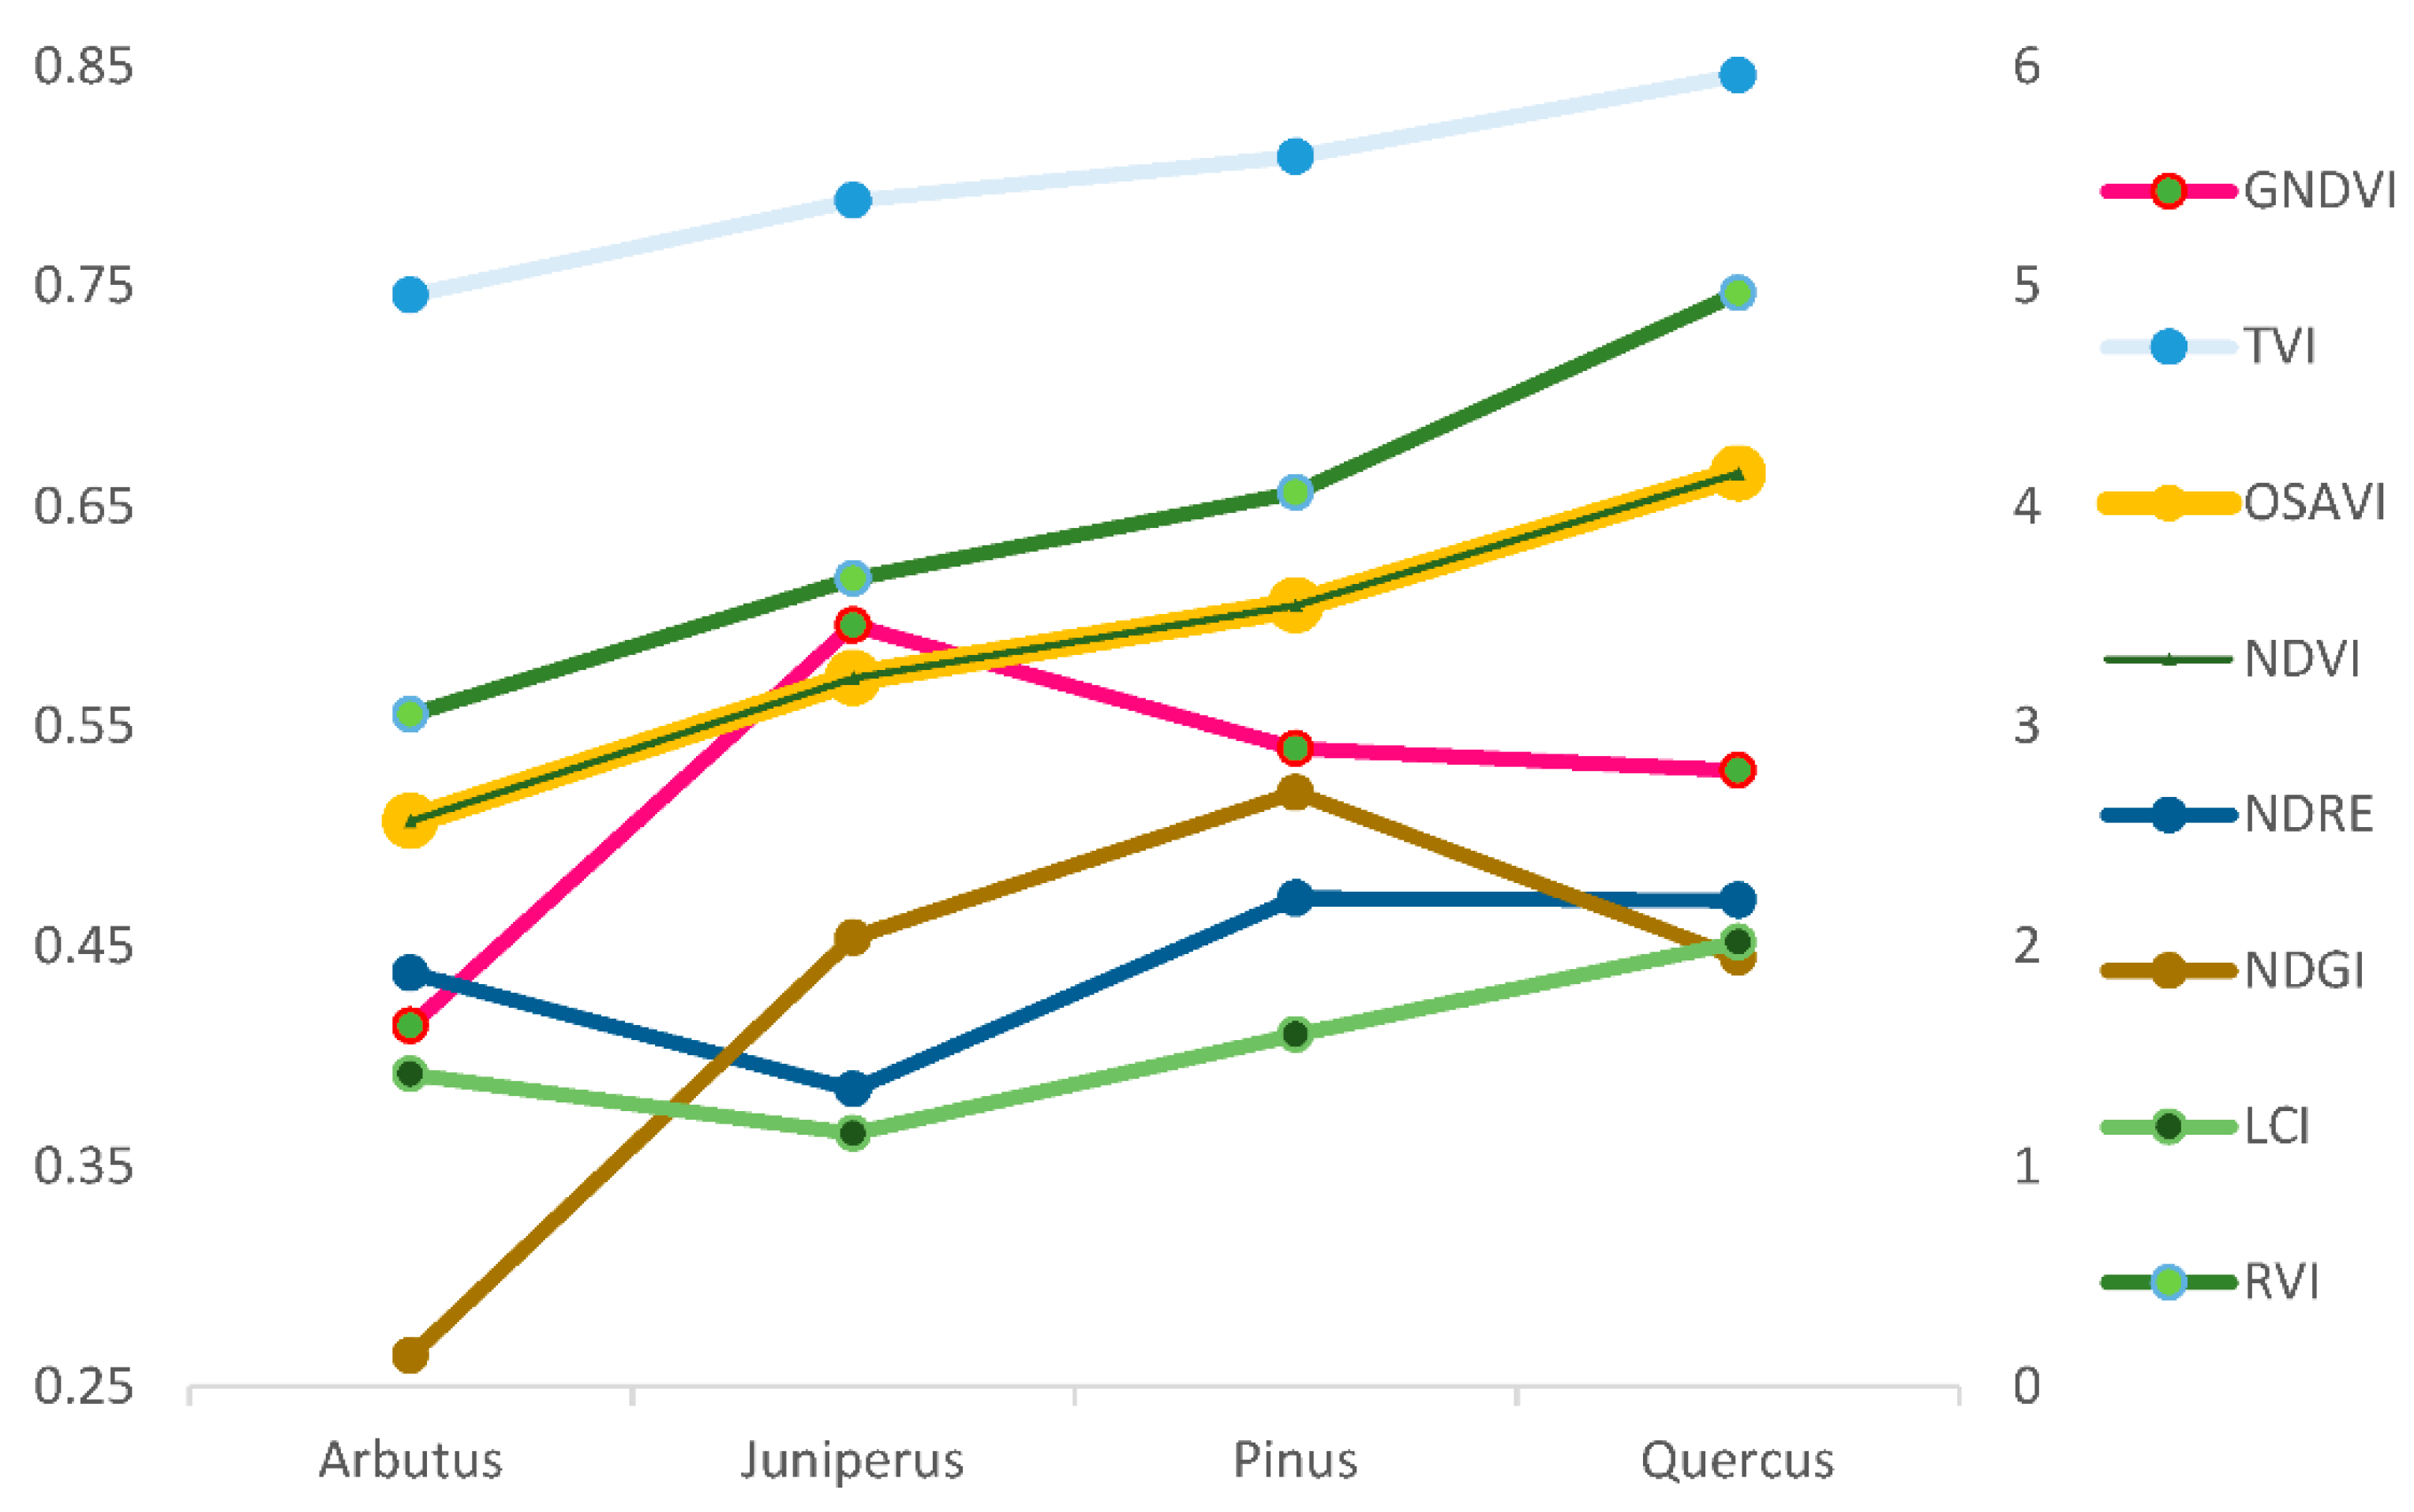
| Variable | GNDVI | LCI | NDGI | NDRE | NDVI | OSAVI | RVI | TVI |
|---|---|---|---|---|---|---|---|---|
| min | −0.024 | 0 | −0.347 | 0 | −0.206 | −0.206 | 0.658 | 0.455 |
| average | 0.307 | 0.198 | 0.089 | 0.212 | 0.412 | 0.412 | 2.508 | 0.680 |
| max | 0.596 | 0.453 | 0.520 | 0.472 | 0.664 | 0.664 | 4.96 | 0. 845 |
| sd | 0.109 | 0.118 | 0.117 | 0.141 | 0.112 | 0.112 | 0.598 | 0.073 |
Publisher’s Note: MDPI stays neutral with regard to jurisdictional claims in published maps and institutional affiliations. |
© 2022 by the authors. Licensee MDPI, Basel, Switzerland. This article is an open access article distributed under the terms and conditions of the Creative Commons Attribution (CC BY) license (https://creativecommons.org/licenses/by/4.0/).
Share and Cite
Vivar-Vivar, E.D.; Pompa-García, M.; Martínez-Rivas, J.A.; Mora-Tembre, L.A. UAV-Based Characterization of Tree-Attributes and Multispectral Indices in an Uneven-Aged Mixed Conifer-Broadleaf Forest. Remote Sens. 2022, 14, 2775. https://doi.org/10.3390/rs14122775
Vivar-Vivar ED, Pompa-García M, Martínez-Rivas JA, Mora-Tembre LA. UAV-Based Characterization of Tree-Attributes and Multispectral Indices in an Uneven-Aged Mixed Conifer-Broadleaf Forest. Remote Sensing. 2022; 14(12):2775. https://doi.org/10.3390/rs14122775
Chicago/Turabian StyleVivar-Vivar, Eduardo D., Marín Pompa-García, José A. Martínez-Rivas, and Luis A. Mora-Tembre. 2022. "UAV-Based Characterization of Tree-Attributes and Multispectral Indices in an Uneven-Aged Mixed Conifer-Broadleaf Forest" Remote Sensing 14, no. 12: 2775. https://doi.org/10.3390/rs14122775
APA StyleVivar-Vivar, E. D., Pompa-García, M., Martínez-Rivas, J. A., & Mora-Tembre, L. A. (2022). UAV-Based Characterization of Tree-Attributes and Multispectral Indices in an Uneven-Aged Mixed Conifer-Broadleaf Forest. Remote Sensing, 14(12), 2775. https://doi.org/10.3390/rs14122775