Article

Spatial Sustainable Development Assessment Using Fusing Multisource Data from the Perspective of Production-Living-Ecological Space Division: A Case of Greater Bay Area, China

1
State Key Laboratory of Resources and Environmental Information System, Institute of Geographic Sciences and Natural Resources Research, Chinese Academy of Sciences, Beijing 100101, China
2
University of Chinese Academy of Sciences, Beijing 100049, China
3
College of Desert Control Science and Engineering, Inner Mongolia Agricultural University, Hohhot 010018, China
*
Author to whom correspondence should be addressed.
These authors contributed equally to this work.
Remote Sens. 2022, 14(12), 2772; https://doi.org/10.3390/rs14122772
Submission received: 24 May 2022 / Accepted: 7 June 2022 / Published: 9 June 2022
(This article belongs to the Special Issue Remote Sensing for Engineering and Sustainable Development Goals)

Abstract

:
United Nations Sustainable Development Goal SDG11.3.1—the ratio of land consumption rate (LCR) to population growth rate (PGR) (LCRPGR)—aims to measure the efficiency and sustainability of urban land use. In recent years, SDG11.3.1 has been widely used in sustainable urban development research. However, previous studies have focused on the urban core area, while the sustainable development status of the urban peripheral areas (suburban and rural areas) that contribute significantly to the ecological environment has been neglected. To this end, relying on land use/cover change (LUCC) data obtained from high-resolution remote sensing satellite images rather than the single impervious surface data used in traditional research, according to the multiple functions of the land use type, the city is divided into three types of space: production, living, and ecological spaces. Research from the perspective of multi-scale coordination is of great significance for gaining a comprehensive understanding of the sustainable development status of urban space. Taking the Guangdong-Hong Kong-Macao Greater Bay Area (GBA) in China as an example, in this paper, LUCC remote sensing data and comprehensive population and gross domestic product (GDP) data are used. From the multi-functional production-living-ecological space perspective, based on the original land use efficiency indicator, the ratio of land consumption rate (LCR) to economic growth rate (EGR) (LCREGR) is introduced and the analytic hierarchy process (AHP) is used to comprehensively evaluate the sustainable development level (SDL) of the space between 2000–2010 and 2010–2020 on the urban agglomeration and prefecture-level city scales. The results show that (1) the level of and changes in the spatial sustainable development are significantly different at different scales; (2) the division of the production-living-ecological spaces can guide cities to optimize different types of spaces in the future. This paper proposes a new evaluation method for spatial sustainable development, which provides a useful reference for any country or region in the world.

Graphical Abstract

1. Introduction

Following the Millennium Development Goals, the UN General Assembly adopted the “Transforming Our World, 2030 Agenda” at its seventieth session in 2015. It called on all countries in the world to work hard to achieve 17 sustainable development goals (SDGs) and 169 specific goals in the next 15 years and pointed out the direction for the causes of global sustainable development [1]. Under the background of globalization, urban population surges and population loss have both been serious [2,3,4,5]. Most developing countries in the world are faced with serious urban environmental problems such as overcrowding and pollution. The relationship between the urban space and population is developing in an imbalanced manner. The sustainable development of cities was included in the 2030 Sustainable Development Goals, and this is a key topic of increasing concern around the world [6,7,8]. SDG11 considers the aesthetics of cities and urban settlements, aiming to “make cities and people’s settlements inclusive, safe, resilient and accessible” [9]. An understanding of regional urban land use efficiency (ULUE) is an important foundation for understanding land productivity and land use sustainability. To this end, the SDG 11.3.1 land use efficiency indicator (i.e., the ratio of the land consumption rate (LCR) to the population growth rate (PGR), LCRPGR) falls under this target and focuses on “enhancing inclusive and sustainable urbanization and participatory, integrated and sustainable human settlements planning and management capacity” [10]. This indicator is of great value in identifying the land use efficiency and sustainability of urban development.
Scholars have used this indicator to represent the relationship between the rate of land changes and the rate of population growth during the process of urbanization, and it is widely used to study sustainable urban development. Mudau et al. [11] used this indicator to assess the sustainable development trends of large and small cities in South Africa based on built-up area data and census data extracted from Landsat5TM and SPOT2&5 satellite images acquired in 1996, 2001 and 2011. Koroso et al. [12] observed land use changes based on Landsat 7/8 remote sensing data and calculated the ratio of built-up area changes to the population growth rate. They found that 16 cities in Ethiopia had low land use efficiencies and insufficient urban filling rates from 2007 to 2019. Nicolau et al. [13] calculated that the LCRPGR of Portugal was negative during 2007–2011 and 2011–2015, that is, in most cities in the mainland area of Portugal, the urban area was increasing, but the urban population was decreasing. Wang et al. [14] used this indicator to detect the spatial heterogeneity and dynamic trend of the urban land use efficiency in China from 1990 to 2010 on the grid, city, and country scales and compared the results with the data for developed countries. In addition, in the government documents and reports issued by Britain and France, the sustainable development of cities is also measured using this indicator [15,16]. The economy, society and environment are three important factors that are inseparable from sustainable development. However, the SDG11.3.1 land use efficiency indicator used in these studies fails to establish the relationship link between land use efficiency and urban economic development under this evaluation system. In response to the problem that this indicator is not closely related to the economy, Jiang et al. [17] introduced the expansion indicator of the economic growth rate (EGR) and land consumption rate (LCR) (EGRLCR) to make up for the lack of economic dimension of the LCRPGR indicator. They quantitatively analyzed the relationship between land consumption, population and economic growth and evaluated the sustainability of urbanization in 433 cities in China from 1990 to 2010. However, although Jiang et al. [17] further improved the indicator in the economic dimension, their indicator still has a disadvantage in common with the research that did not consider the economic dimension. They only focused on the built-up area of the city and did not taking into account the sustainable development of the rural and suburban areas with large areas of natural ecological land around the city. Estoque et al. [18] were aware of this problem and pointed out that an important limitation of land use efficiency indicators is that changes in urban natural capital and external impacts of cities and urban areas are not taken into account. The rural space around the city is the starting point and key development area of urban urbanization [19]. Liu et al. [20] also emphasized in the Nature article “Revitalizing the World’s Rural Areas” that cities and villages, as an organic whole, can only support each other if they both develop sustainably. However, no research has addressed this problem with the LCRPGR indicator.
From the perspective of production-living-ecological spaces, some scholars have divided urban spaces into production spaces, living spaces, and ecological spaces [21,22,23]. This division method not only takes into account the large amount of living and production space in urban built-up areas, but it also takes into account the large area of ecological space in urban suburbs and rural areas, which can improve the analysis of the status of the overall urban space. In addition, Liu et al. [22] further pointed out that from the perspective of production-living-ecological functions carried by land, production, living, and ecological functions can coexist in the land space per unit area. This multifunctional perspective reinforces the perception of efficient and sustainable use of space as opposed to only considering the expansion of the boundary of the space. Based on this, in this study, the modified land use efficiency indicators (with the introduction of the economic dimension) were organically combined with the multi-functional concept of production-living-ecological spaces. The relationships between the rate of change of the functions of the production-living-ecological spaces and the growth rates of the population and economy were investigated. The three types of spaces (production, living, and ecological) in the city, as well as the overall spatial sustainability of the city, were comprehensively evaluated. In addition, the fact that the scale of the analysis would have a great impact on the final research results was considered [24,25]. In this study, the results for different spatial scales were analyzed and compared to improve our overall understanding of the sustainable use of urban space.
In summary, this paper proposes a new set of assessment methods for the sustainable development of urban spaces that can be applied to any country or region in the world: (1) using land use/cover change (LUCC) remote sensing data with full coverage and easy access, the city was divided into production space, living space, and ecological space, based on the functions carried by the internal land use types; (2) by comprehensively considering the population data and gross domestic product (GDP) data for the city. Based on the indicator of the SDG11.3.1 land use efficiency principle, the ratio of the functional rate of change of the city’s production, living, and ecological space to the population growth rate (LCRPGR) and the ratio of the LCR to the growth rate of the GDP (LCREGR) were calculated. (3) Using the analytic hierarchy process (AHP) to assign weights to the types of spaces and corresponding indicators, multi-scale observational comparative studies were carried out at two administrative spatial scales to achieve a comprehensive understanding of the sustainable development of urban space. The research process is shown in Figure 1. According to this process, the Guangdong-Hong Kong-Macao Greater Bay Area (GBA), which is the fourth largest bay area in the world, was selected as a case study. At the urban agglomeration and prefecture-level city scales, the spatial sustainable development in the GBA during 2000–2010 and 2010–2020 were evaluated to verify the usability of the method.

2. Materials and Methods

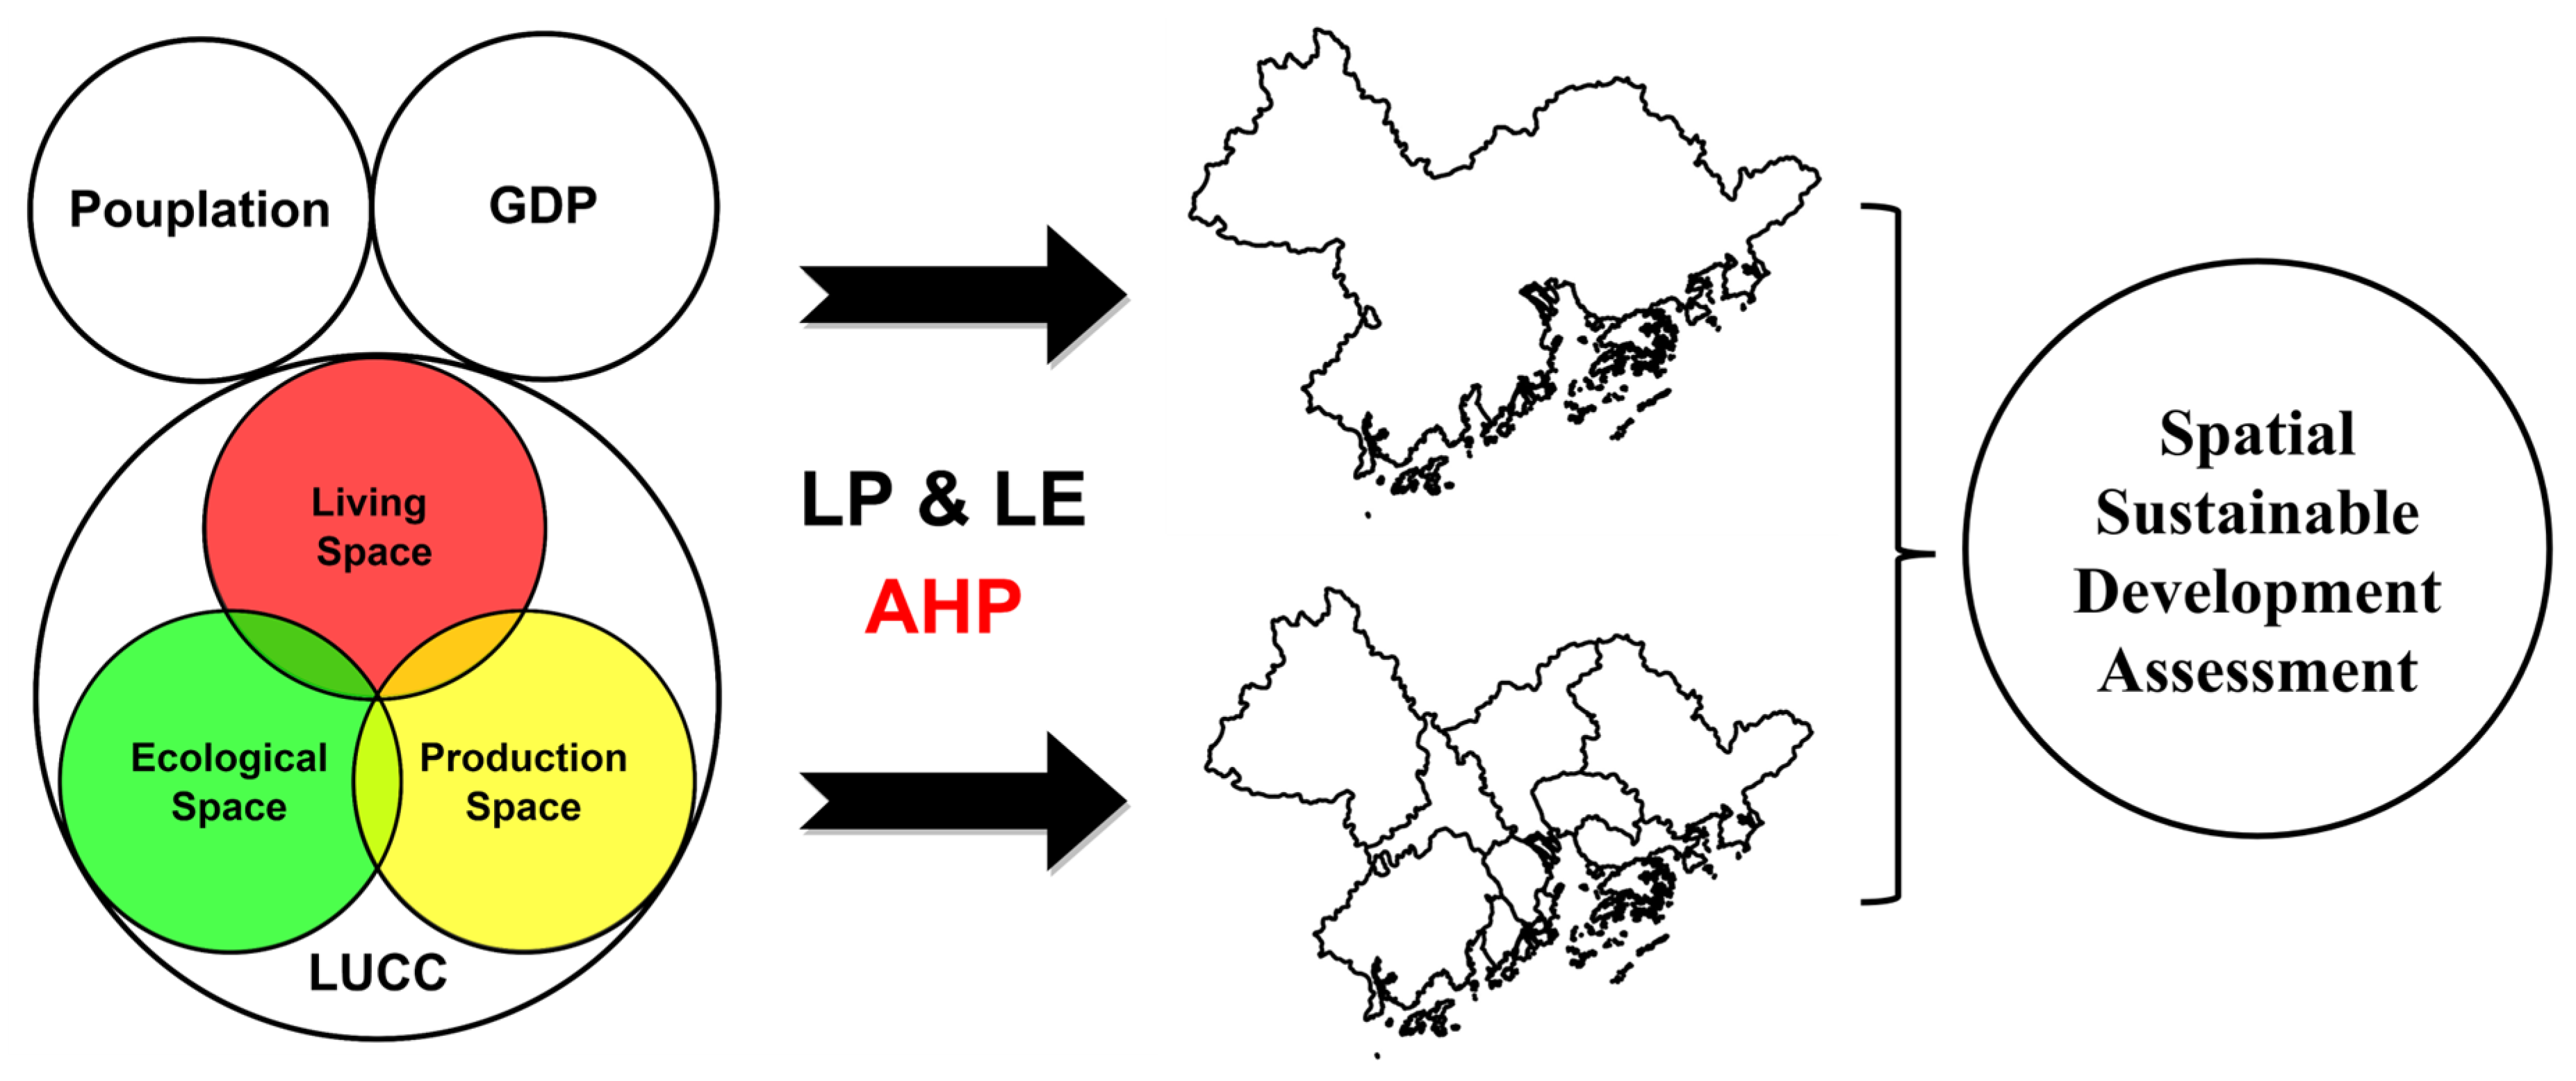
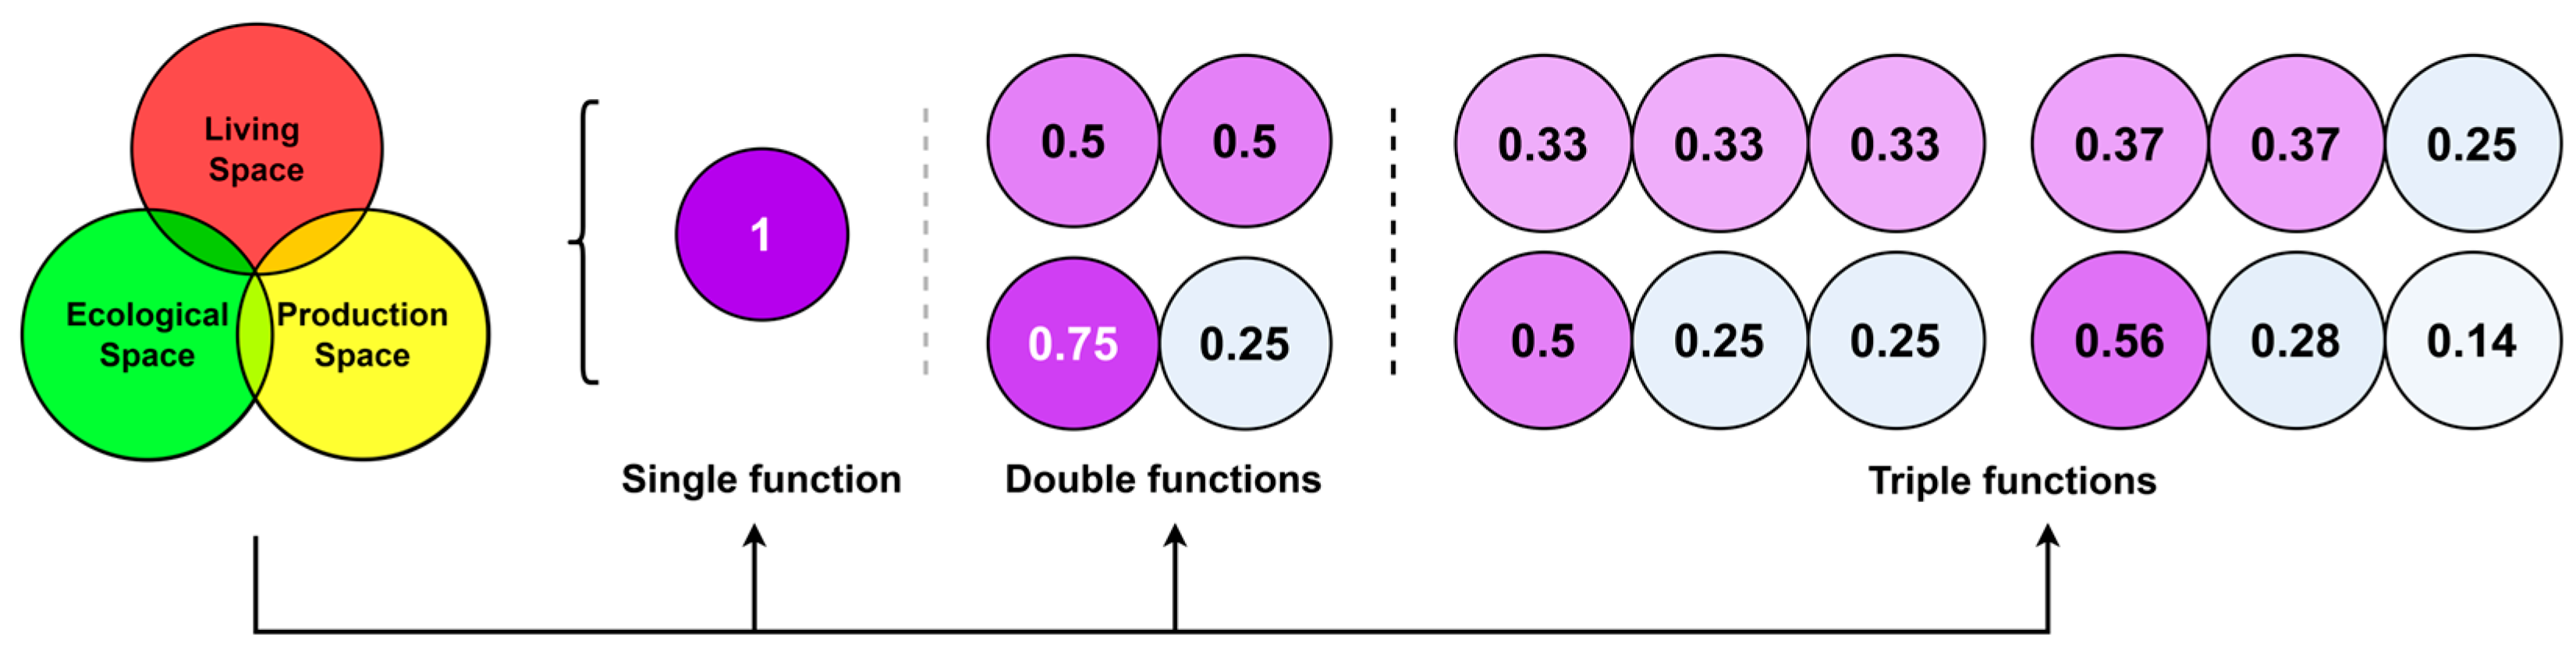
2.1. Production-Living-Ecological Space Division Method from the Perspective of Multi-Functional Land

In this study, the urban space is divided into three types: production, living, and ecological spaces. Among them, living space consists of static living space and dynamic living space. Static living space refers to a place for human beings to live in; while dynamic living space refers to the space used for activities such as living, shopping, leisure, social interaction, which highlights the social and cultural nature of living space [26]. Ecological space refers to the space that carries the corresponding ecological functions of the space. Production space is composed of urban production space and rural production space, and it refers to the production and operation spaces with the functions of product acquisition and supply, including the space for providing industrial products, agricultural products, and intangible service products [27].
As a multifunctional whole, the functions carried by the same land category are not singular, and they include strong and weak functions and primary and secondary functions. This study was based on previous research ideas regarding the quantification of regional production-living-ecological space functions [22,28,29]. Using LUCC data, according to the multi-function production-living-ecological spaces, the land use was divided into three main types (single function, double function, and triple function) and seven sub-types. Based on the previous relevant studies [30,31,32,33,34,35,36,37,38] and data from official documents on land use types, qualitative pair-wise comparisons were made, and within the interval (0–1), weights were assigned in equal proportions (Figure 2).
Finally, the 26 s-level land categories under the 6 first-level land categories in the LUCC data were divided and assigned based on the strength of the function of production-living-ecological space. The multi-functional assignment system of the production-living-ecological space for the land use types was constructed (Table 1). Among them, a single function means that this type of land has only one type of spatial function; and double functions mean that this type of land has two spatial functions at the same time. When the functions are balanced and it is difficult to distinguish the strengths and weaknesses, a weight of 0.5 is assigned. In contrast, when one function is stronger than the other, the weights 0.75 (strong) and 0.25 (weak) are assigned. Triple functions mean that this type of land serves all three types of functions. When there is no visible strength difference, the weight of 0.33 is assigned. When one type is weak and the other two types are stronger and relatively balanced, the weights 0.37 (strong), 0.37 (strong), and 0.25 (weak) are assigned; when one type is strong, the other two types are relatively balanced and weak of the weights 0.5 (strong), 0.25 (weak), and 0.25 (weak) are assigned. When the three types of functions have a visibly strong and weak relationship, they are assigned values of 0.56, 0.28, and 0.14 (strong to weak).

2.2. Modified Land Use Efficiency Indicators

In this study, SDGs11.3.1, namely, the ratio of the land consumption rate to the population growth rate (i.e., the LCRPGR) was selected to evaluate the sustainable development of the urban spaces. Considering the lack of economic dimension of this indicator, in this study, the ratio of land consumption rate (LCR) to GDP growth rate (EGR)(LCREGR) was used. In addition, the land consumption rate in this indicator refers to the rate of change in the land area, and this study is based on the spatial sustainable development evaluation from the perspective of the functions of production-living-ecological space of land use types. Therefore, the rate of change of the functional scores of production-living-ecological space was used to replace the original land consumption rate. The transformation from the extensive horizontal perspective of area change to the saving vertical perspective of the function of the bearing change was realized, and modified land use efficiency indicators (LPLE) were developed. By studying the relationship between the three spatial functions of population, economy, and ecology, the sustainable development of the urban space was evaluated.
The formula for the modified land use efficiency indicators used in this study is given in Equation (1), which is defined as the ratio of the rate of change of the functional score of the production-living-ecological space to the population growth rate. Equation (2) was used to calculate the ratio of the rate of change the functional score of the production-living-ecological space to the GDP growth rate.
LP = LCR / PGR = ln l n + i l n / ln P n + i P n ,
LE = LCR / EGR = ln l n + i l n / ln E n + i E n ,
where LP is the ratio of the rate of change of the functional score of production-living-ecological space to the population growth rate, LE is the ratio of the rate of change of the functional score of production-living-ecological space to the economic growth rate; LCR is the rate of change of the functional score of the production-living-ecological space ( l n is the functional score of a certain type of space in the region in the nth year, and l n + i represents the functional score of the space in the region after i years); PGR is the population growth rate ( P n is the total population of the region in the nth year, and P n + i is the total population in the region after i years), EGR is the GDP growth rate ( E n is the GDP of the region in the nth year, E n + i is the GDP of the region after i years); and i represents the number of years in the study period.
Explanation of the value range of the formulas:
(1) The value ranges of LP and LE are (−∞, +∞). (2) When LP and LE are >0, the spatial function of the production-living-ecology space has the same trend as the population and GDP. At this time, a smaller value indicates that if the spatial function increases to a certain limit, the region has exceeded the economic value and population service capacity of its functions, leading to stronger sustainability. In contrast, when LP and LE are <0, then the trend of the spatial function of production-life-ecology space is different from the trends of the population and GDP. At this time, the larger the value is, the stronger the sustainability. (3) The change in the spatial function should be coordinated with the changes in the GDP and population (i.e., in one direction), so the sustainable development situation is better when LP and LE are >0 than when LP and LE < 0. (4) PLP, LLP, and ELP represent the ratio of the rates of change of the functions of the production, living, and ecological spaces to the rates of population growth, respectively. Similarly, the ratio of the rates of change in the spatial functions of the production-living-ecology space to the rates of economic growth are PLE, LLE, and ELE, respectively.

2.3. Analytic Hierarchy Process for Evaluation of Space Sustainable Development

In the 1970s, American operations researcher Professor Satie of the University of Pittsburgh proposed the analytic hierarchy process (AHP), which is a decision analysis method [39]. This method divides the related elements into a target layer, a criterion layer, and a scheme layer. According to the level, each element is assigned a weight value according to the relative importance of each level to achieve a systematic analysis of complex problems in the hierarchy [40]. Based on the three major functional divisions of Guangdong Province, relevant government documents, and expert scores, in this study, the importance of the production-living-ecology spaces in the GBA were objectively ranked. In terms of the importance of modified land use efficiency indicators, since the LCREGR is a supplementary indicator, its importance is weaker than that of the LCRPGR. Based on this, the AHP was used to calculate the production-living-ecological space and the weights of the six sub-indices in each level city in the GBA.
Before executing the AHP, the original data needs to be made dimensionless via normalization to meet the comparability requirements of the evaluation results. Normalization methods can be divided into two types: reverse and forward normalization. In this study, the six types of sustainable development indicator values were normalized so that the six types of indicator values were between 0 and 1. The formulas for forward and reverse normalization are Equations (3) and (4), respectively.
X = ( x x m i n ) / ( x m a x x m i n ) ,
X = ( x m a x x ) / ( x m a x x m i n ) ,
where X is the normalized result, x is a value in a group of numbers, x m i n is the minimum value in the group numbers, and x m a x is the maximum value in the group numbers.
The AHP after normalization included four basic steps: (1) establishing a hierarchical structure model; (2) constructing a value matrix; (3) calculating the weights and maximum eigenvalues; (4) performing a consistency check. The status was evaluated to verify the usability of the method.
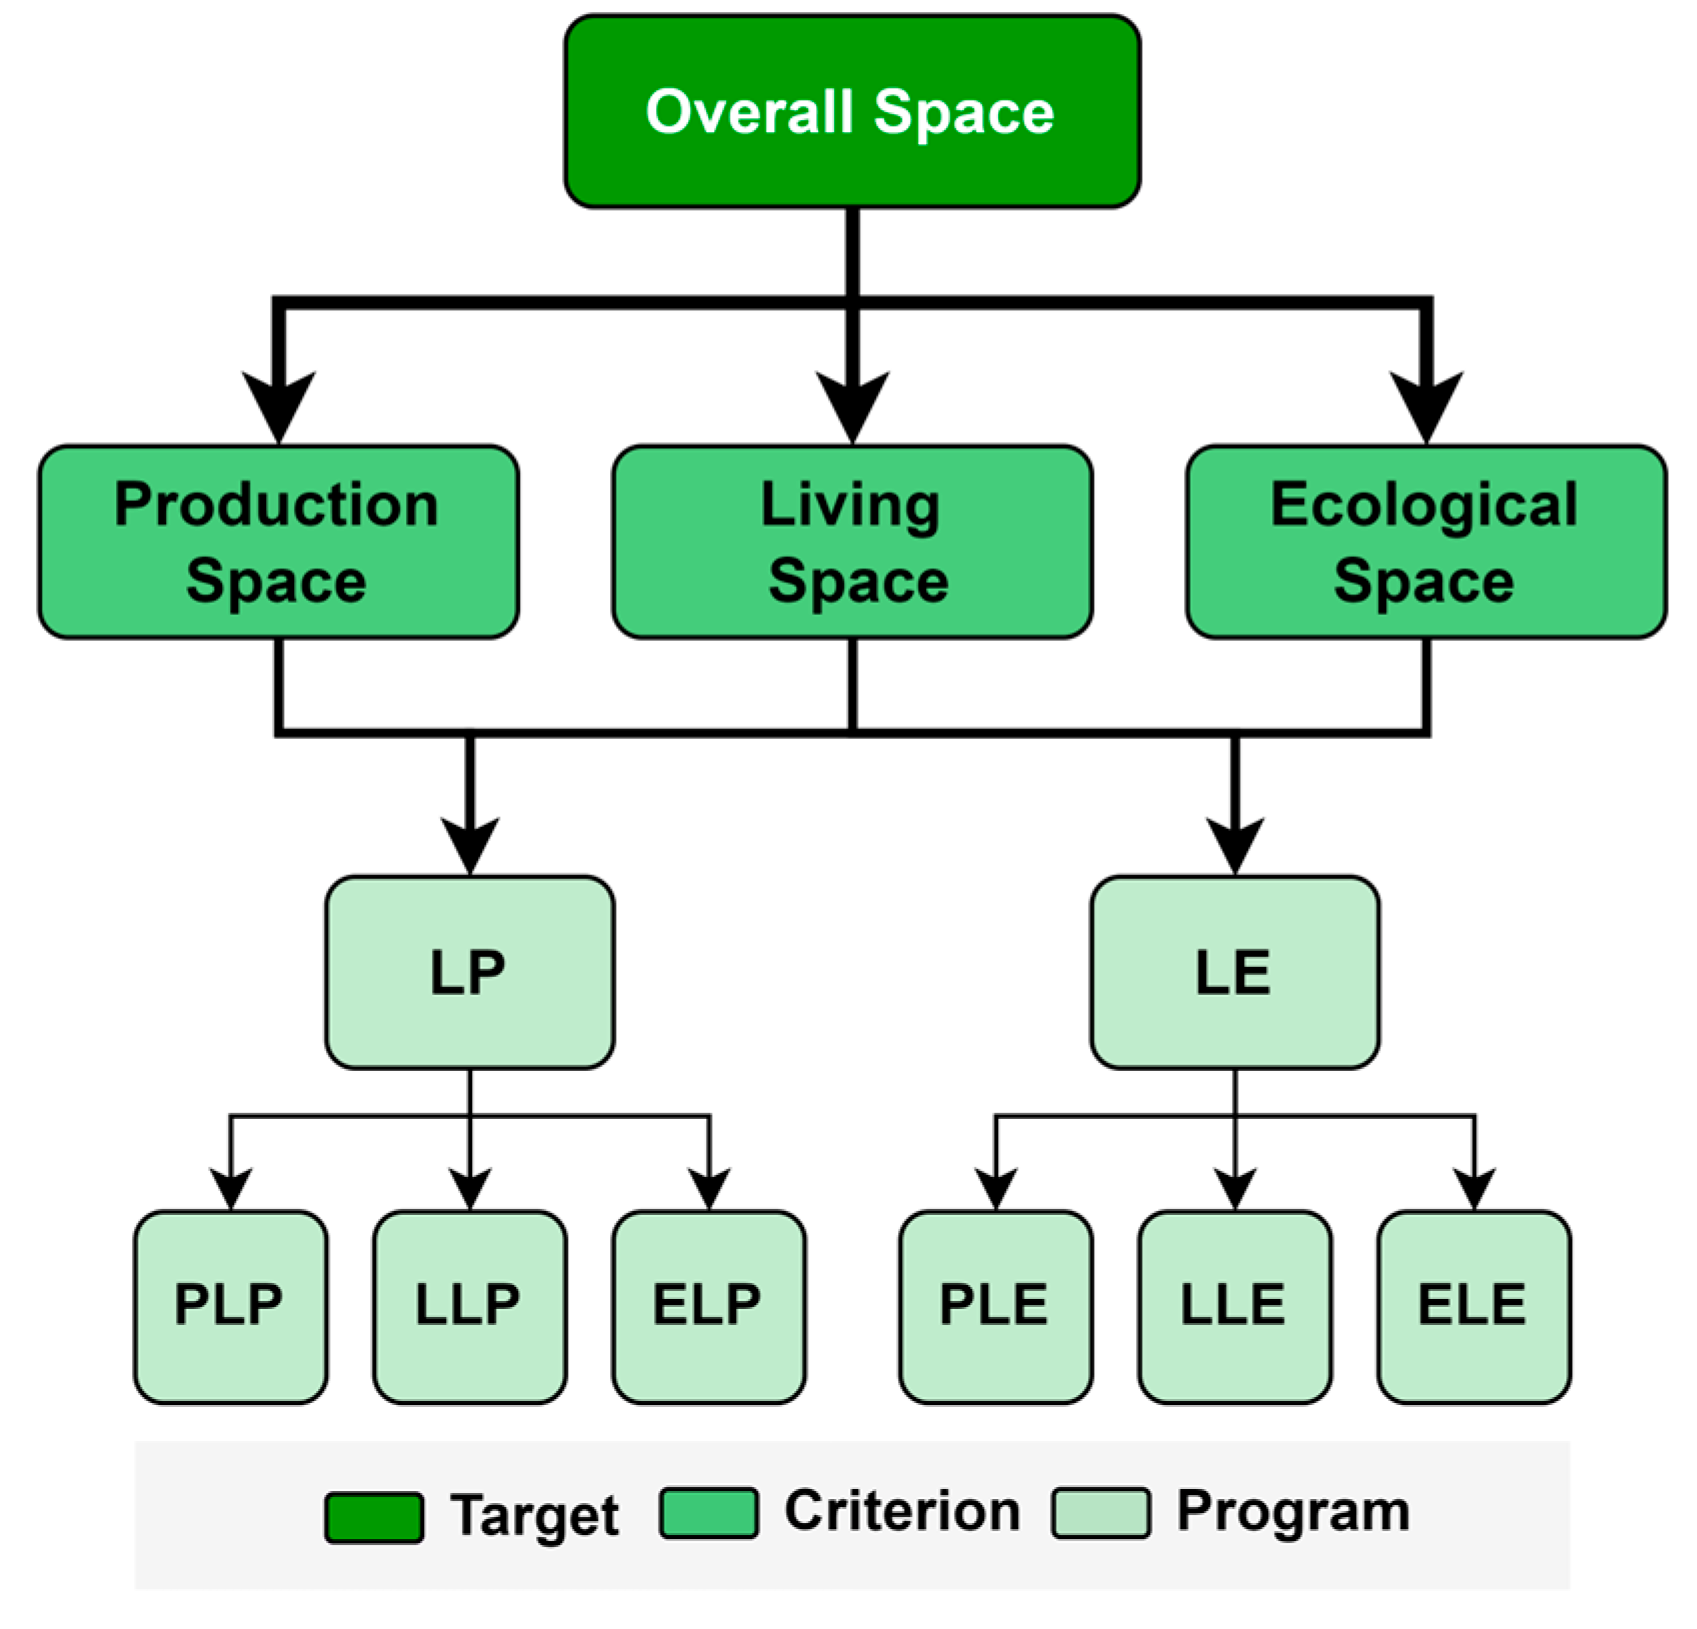
  • Establishing a hierarchical structure model: In this study, the entire research decision-making process was divided into three levels from top to bottom according to the AHP: a target layer, a criterion layer, and a program layer. The target layer includes the degree of sustainable development of the space. The criterion layer includes the degree of sustainable development of the ecological space, production space, and living space. The program layer includes the two land use efficiency indicators and the sub-indices corresponding to the production-living-ecological space. Together they form a set of assessment hierarchy models of spatial sustainability (Figure 3).
  • Constructing a judgment matrix: As is shown in Equation (5), according to the relative importance of the criterion layer indicators and referring to Table 2 for the meaning of the judgment matrix scale, a judgment matrix was constructed. In matrix A, a i u is the importance of a i compared to a u .
    A = a 11 a 1 n a n 1 a n n .
  • Calculating the weight and the largest eigenvalue: The arithmetic mean method was used to calculate the weight of each indicator. The calculated weight of each indicator was taken as the eigenvector ω , which was multiplied by the judgment matrix A to obtain A ω . The maximum eigenvalue calculation formula was used to calculate the maximum eigenvalue λ m a x . The formula for calculating the maximum eigenvalue is as follows:
    λ m a x = i = 1 n A ω i / n ω i .
  • Consistency test: To test whether the weights assigned to each indicator value in the constructed judgment matrix are reasonable, a consistency test is required. The consistency verification formula is
    CR = CI/RI,
    where CI is the consistency indicator, CR is the consistency ratio, and RI is the random consistency indicator. The consistency test is passed when CR < 0.1. Among them, the formula for calculating CI is
    CI = ( λ m a x n ) / n 1 .
The RI values of the judgment matrix of orders 1–9 are presented in Table 3.
Based on the analytic hierarchy process, an evaluation indicator system for sustainable spatial development was constructed, and the final weight values of the criterion layer and the scheme layer were obtained (Table 4). The LE and LP of the scheme layer were second-order matrices, which passed the consistency test. The consistency test results of the six sub-indices of the scheme layer are presented in Table 5 and Table 6. It can be seen from the table that the sub-indices passed the consistency test.
The LE and LP of the scheme layer are second-order matrices, which passed the consistency test. The consistency test results of the six sub-indices of the scheme layer are presented in Table 5 and Table 6. It can be seen from the table that the sub-indices passed the consistency test.

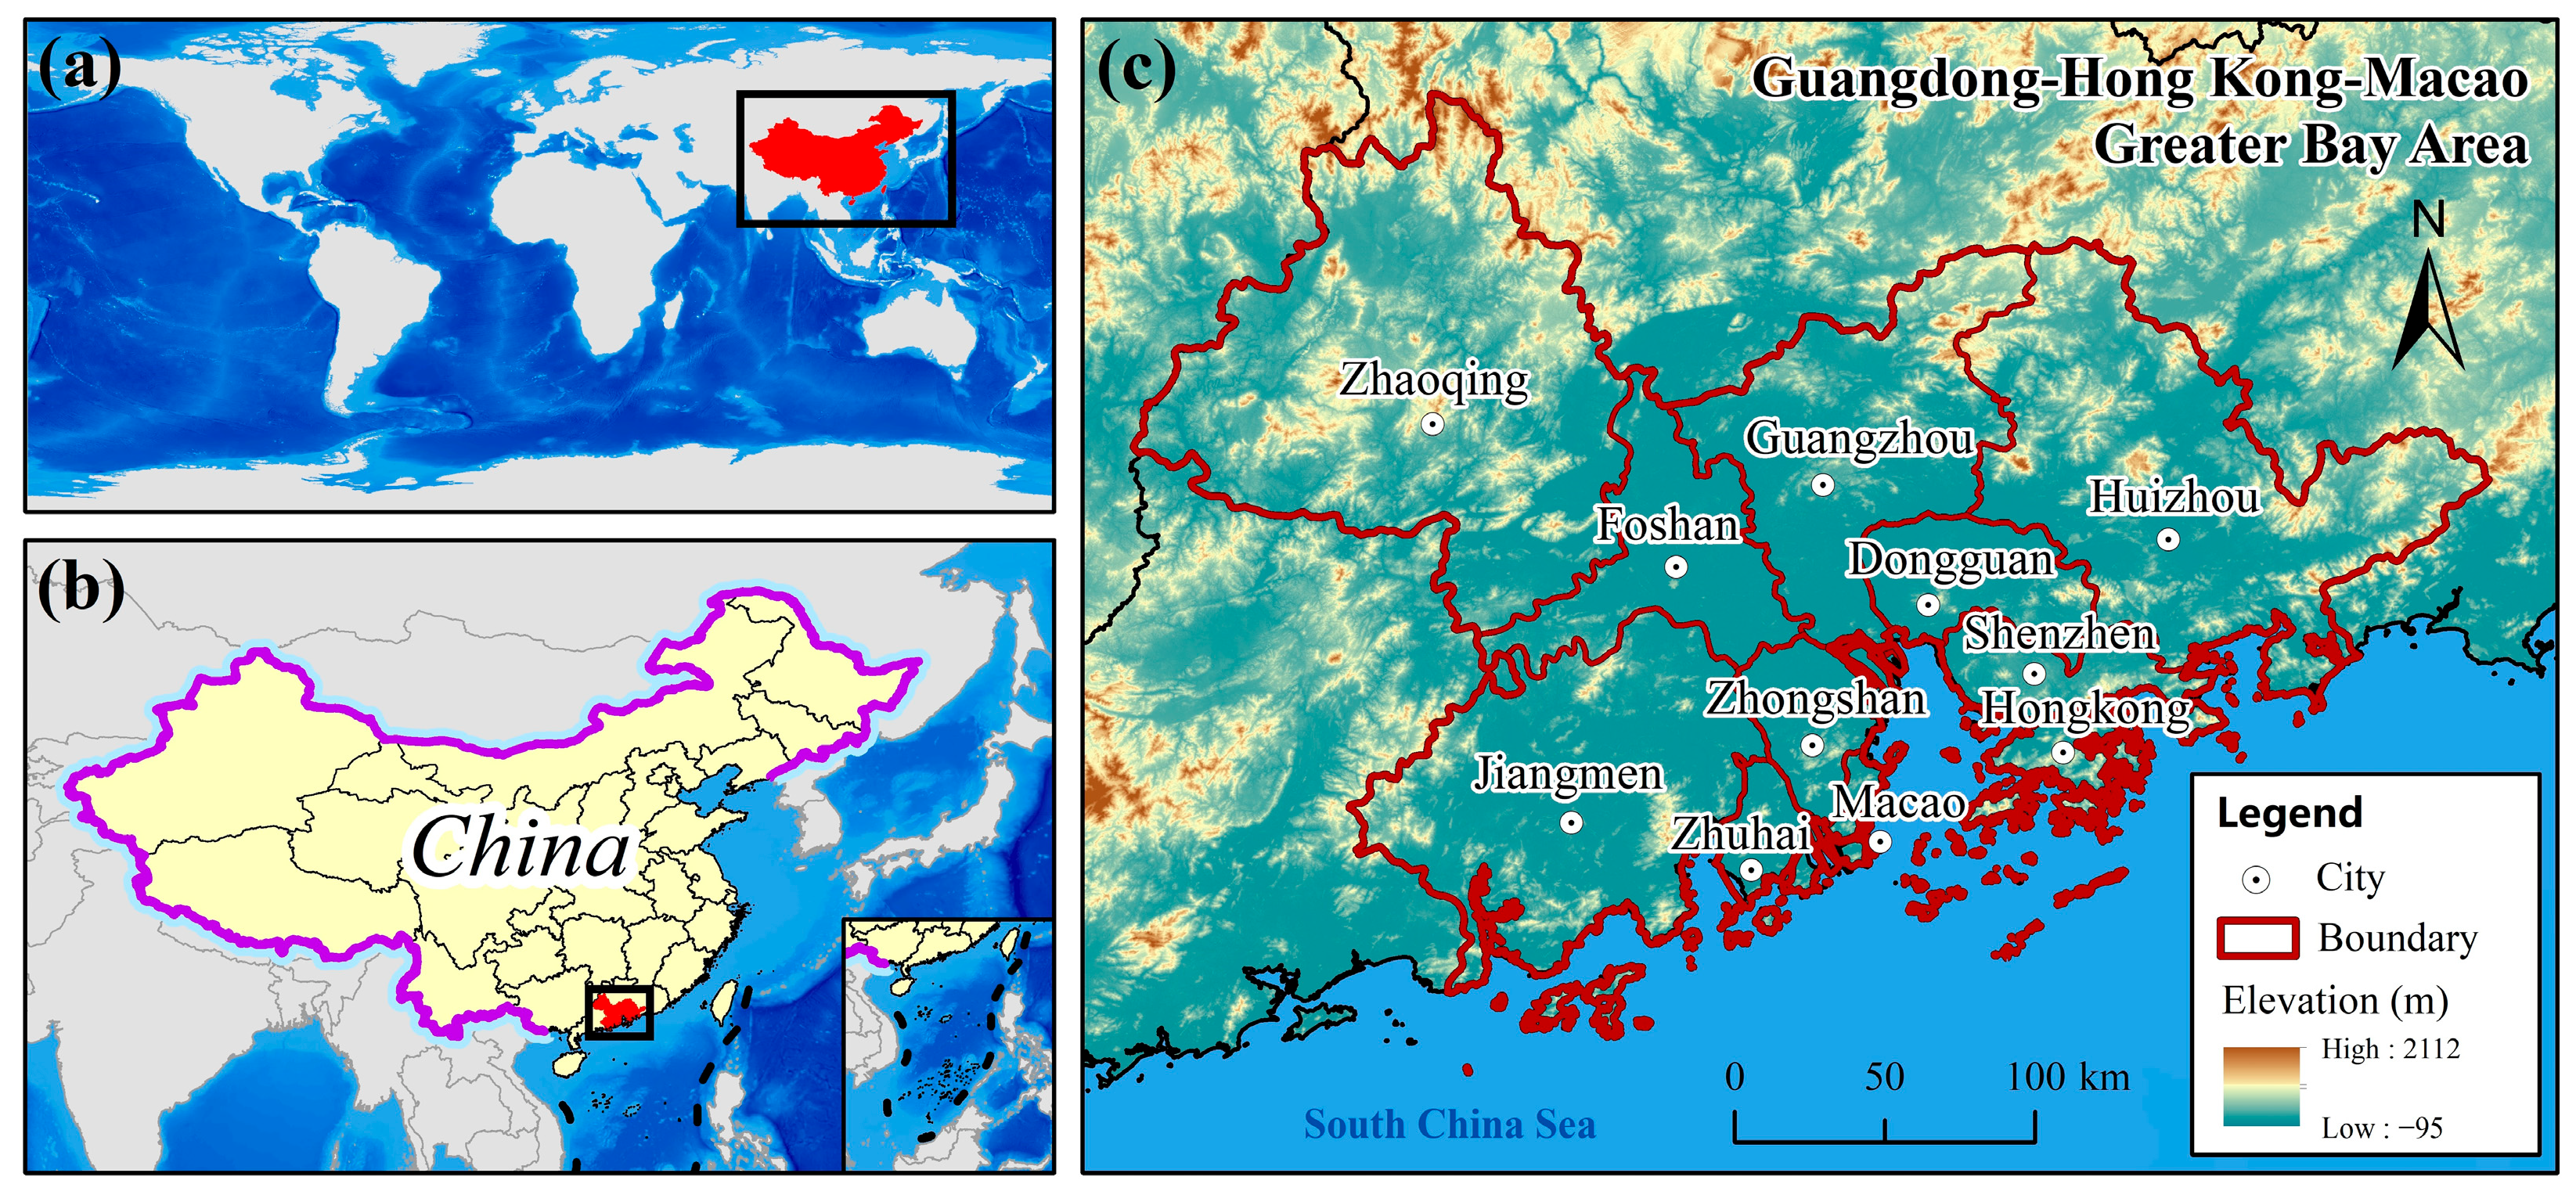
2.4. Study Area and Data

To verify the feasibility of the spatial sustainability evaluation method proposed in this paper, the GBA in China, the fourth largest bay area in the world, was selected as the study area.
The GBA (112°47′–115°28′E, 22°35′–23°05′N) is located in the transition zone between mainland China and the South China Sea. Relying on China and facing the world, it consists of Hong Kong and Macao, as well as nine cities in the Pearl River Delta, i.e., Guangzhou, Shenzhen, Zhuhai, Foshan, Huizhou, Dongguan, Zhongshan, Jiangmen, and Zhaoqing (referred to as the Pearl River Delta) (Figure 4). It is a typical urban agglomeration with a relatively compact space and a close economic connection. The GBA covers an area of 56,000 km2 and has a population of 68 million. In terms of land area and population size, it ranks first among the four bay areas in the world (the other three are the New York Bay Area and the San Francisco Bay Area in the United States and the Tokyo Bay Area in Japan) [41]. The dense population distribution leads to a huge demand for land resources in the GBA [42]. In addition, the GBA, as a key hub for the construction of China’s Belt and Road initiative [43], enjoys a high level of urbanization and rapid development. Its economy accounts for about 13% of China’s total economy, making it one of the most open and dynamic regions in the country. According to estimates by the China Center for International Economic Exchanges, the GBA would surpass the Tokyo Bay Area and New York Bay Area to become the largest bay area in the world by 2030 [44]. Therefore, the GBA is a good research example to present the spatial sustainability assessment method proposed in this paper to the world. It is of great guiding significance for China and even the world to explore the dynamic evolution of the urban space, population, and economy of the GBA and to evaluate the sustainable development of the space.
In terms of data usage, LUCC, population, and GDP data were mainly used in this study to evaluate the spatial sustainable development of the GBA. Due to the impact of COVID-19, the GDP growth rate of the GBA in 2020 fluctuated to a certain extent [45]. Therefore, GDP data for three periods (2000, 2010, and 2019) were selected for use. The specific data sources and information are presented in Table 7.

3. Results

3.1. Results of the Production-Living-Ecological Space Division in the GBA Based on the LUCC

Based on the above-mentioned method of dividing the production-living-ecological space using the multi-functional attributes carried by the land use types in the LUCC data, geographic information system (GIS) software was used to classify the functional score and distribution of the production-living-ecological space in the GBA. The spatial-temporal distributions of the production-living-ecological spaces are shown in Figure 5. Through observation, it was found that the coverages of spatial distribution of the production-living-ecological space in the GBA were as follows: ecological space > production space > living space. For the production space (a1–a3), its distribution was relatively uniform, its carrying function was relatively weak, and the production function was the lowest in the central region. From 2000 to 2020, the functions of the production space in the central part of the region tended to increase, while there was no obvious change in the surrounding areas. For the living space (b1–b3), it was mainly distributed in the central and eastern part of the GBA, and it had strong functions, with function scores of 0.75 and 1, respectively. From 2000 to 2020, the distribution of living spaces in the central and eastern regions exhibited a clear expansion trend, and the functions also increased. For the ecological space (c1–c3), it covered almost all of the GBA. The ecological function of the central area was weak, and the ecological function of the surrounding areas was strong. From 2000 to 2020, the functional scope of the weak ecological space in the central area tended to gradually expand, and there was no obvious change in the surrounding areas. In summary, the spatial and temporal distributions of the production-living-ecology space in the GBA were in an unbalanced development state. However, it is difficult for the spatial distribution pattern to change drastically in a short period, and the boundary would be relatively stable. Therefore, enriching and balancing the functions of the three types of spaces is the direction that should be taken in the future.

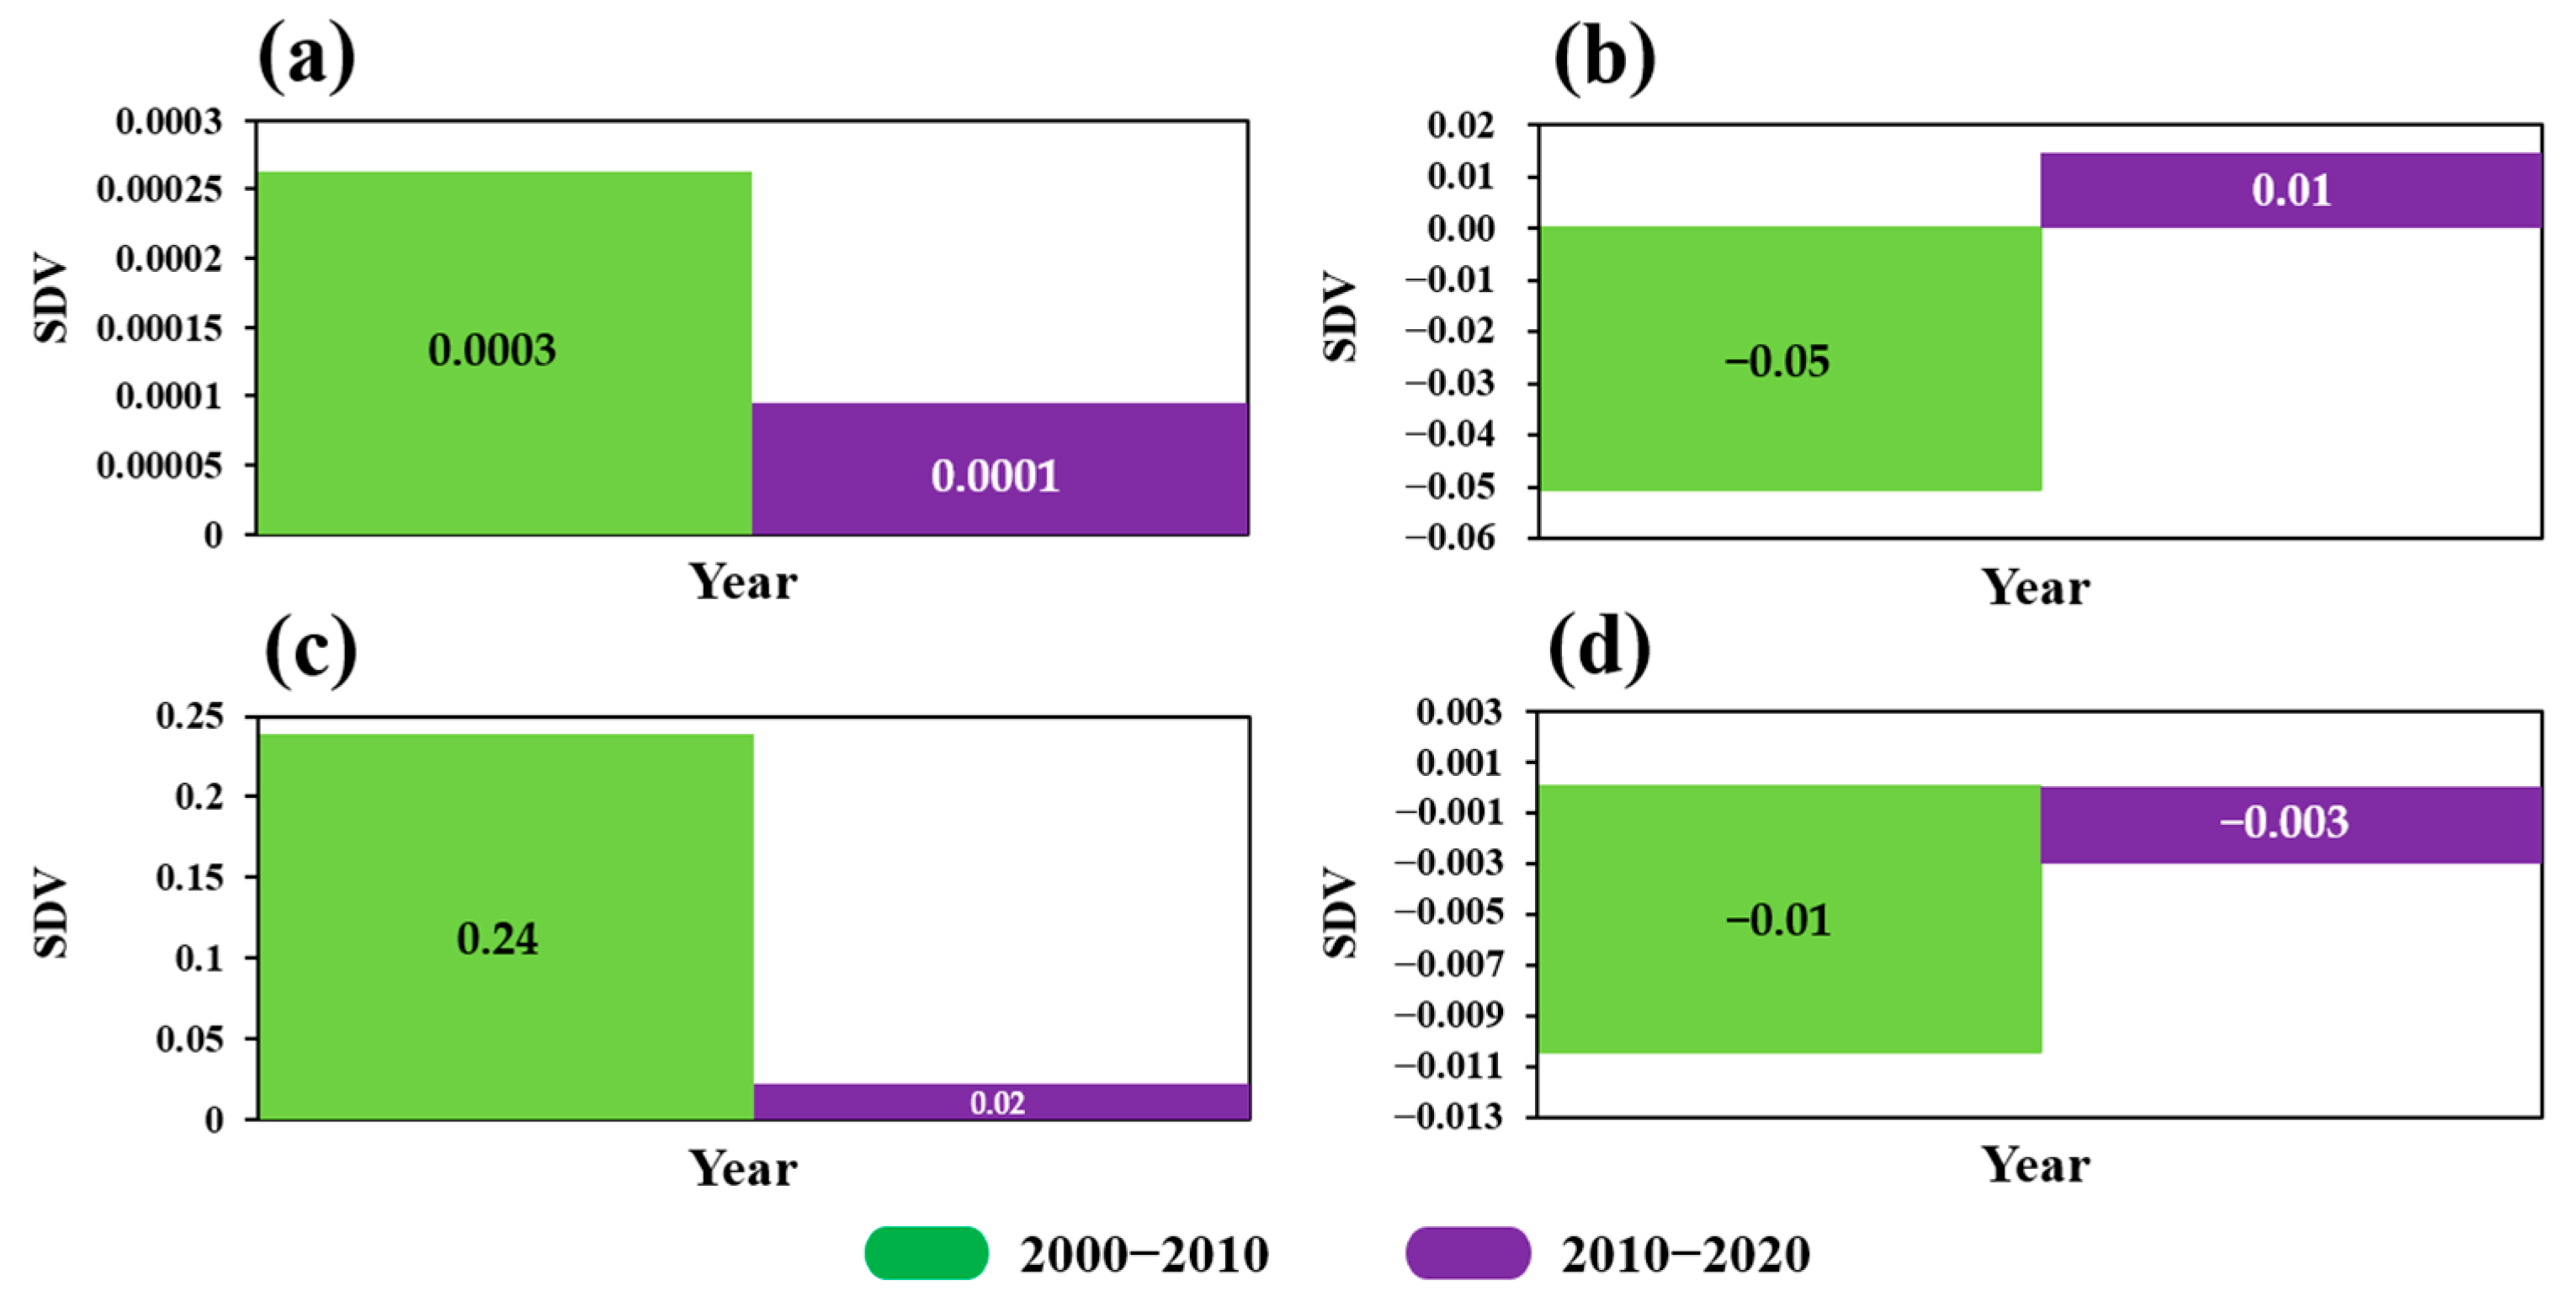
3.2. Urban Agglomeration Scale: The Sustainable Development of Space Is Improving

First, in this study, the GBA was studied at the urban agglomeration scale, and the spatial sustainable development and changes in the GBA during two periods (2000–2010 and 2010–2020) were evaluated from an overall perspective. As shown in Figure 6, it was found that from 2000–2010 and 2010–2020, the spatial sustainable development indicator (SDV) of the GBA exhibited a downward trend indicating that the sustainable development level (SDL) of the space from the overall perspective has improved. In terms of the change of the sustainable development indicator value (SDV) of the production-living-ecological spaces, the sustainable development status of production space, living space, and ecological space also improved to varying degrees. In production space, SDV went from negative to positive. This indicates that while the population and GDP of the GBA increased during this period, the production space function of the Bay Area urban agglomeration showed a positive trend of growth. In the living space, SDV was positive, but showed a downward trend. This shows that while the functions of living space were enhanced, more residents were served, and the GDP produced by unit living space also improved. In the ecological space, its value is negative, but there is an increasing trend. This indicates that with the increase of population and GDP, the overall ecological function loss of urban agglomeration is slowing down. This shows that since 2000–2020, with the continuous introduction and implementation of relevant spatial development policies in Guangdong Province, the overall optimization and adjustment of the space has achieved good results and the area is developing in a sustainable direction.

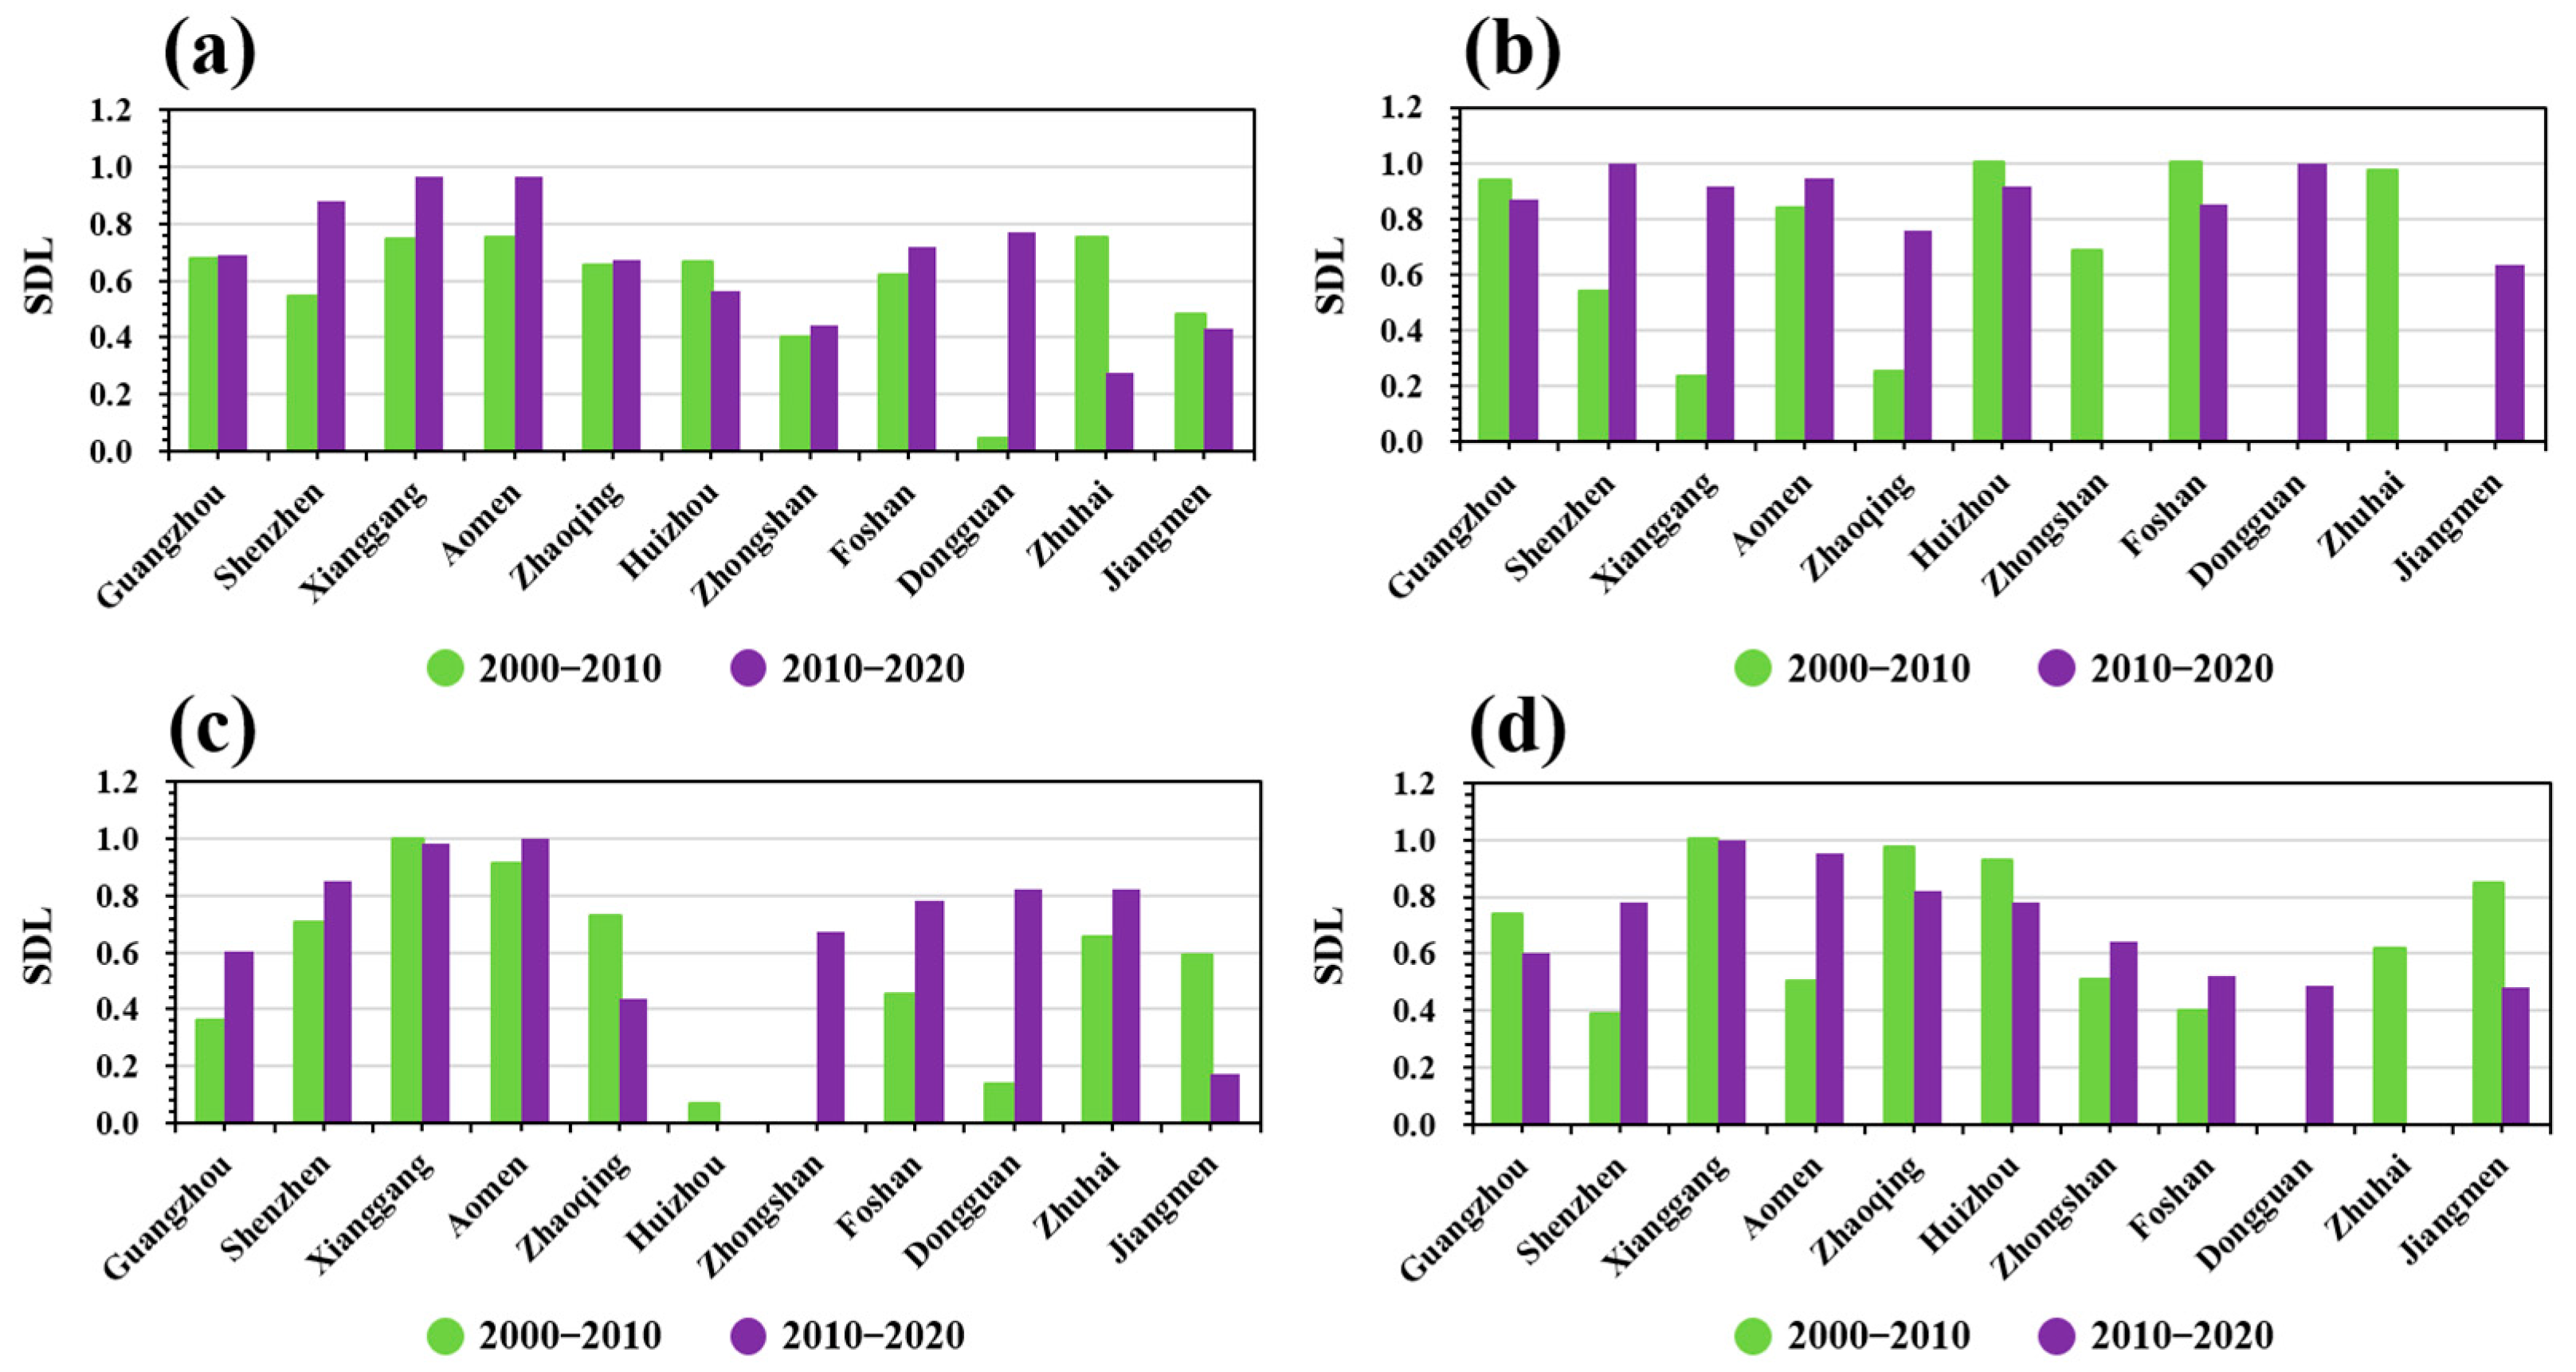
3.3. Prefecture-Level City Scale: There Are Differences in Spatial Sustainable Development

The SDV used in this paper is a backward indicator. To compare the prefecture-level cities, the SDV was normalized again to form the SDL. The higher the value is, the stronger the sustainable development level is. Figure 7 shows the time series of spatial sustainable development during the two periods (2000–2010 and 2010–2020) at the prefecture-level city scale. From 2000–2010 to 2010–2020, the SDV of the overall space of the local-level cities exhibited an upward trend in eight cities: Guangzhou, Shenzhen, Hong Kong, Macau, Zhaoqing, Zhongshan, Foshan, and Dongguan. Among them, Dongguan City exhibited the largest increase. The remaining three prefecture-level cities exhibited decreasing trend: Huizhou, Zhuhai, and Jiangmen. Regarding the changes in the SDL of the production-living-ecological space in the prefecture-level cities, first, in terms of production space, the sustainable development levels of six of the prefecture-level cities improved: Shenzhen, Hong Kong, Macau, Zhaoqing, Dongguan, and Jiangmen. The SDL decreased in Guangzhou, Huizhou, Zhongshan, Foshan, and Zhuhai. Second, in terms of living space, the SDL of seven prefecture-level cities improved: Guangzhou, Shenzhen, Macau, Zhongshan, Foshan, Dongguan, and Zhuhai. The SDL decreased in Zhaoqing, Huizhou, Hong Kong, and Jiangmen. Finally, in terms of ecological space, the sustainable development levels of five prefecture-level cities improved: Shenzhen, Macau, Zhongshan, Foshan, and Dongguan. The SDL decreased in Guangzhou, Zhaoqing, Huizhou, Zhuhai, and Jiangmen.
As shown in Figure 8, the prefecture-level cities in which the SDL of the overall space and the production, living, and ecological space declined were extracted separately, and their rates of decline were compared. It was found that in terms of the overall space, Zhuhai City experienced the largest decline in the SDL, followed by Jiangmen City and Huizhou City. In terms of the production space, Zhongshan and Zhuhai experienced the largest decline, followed by Foshan, Huizhou, and Guangzhou. In terms of the living space, Huizhou experienced the largest decline, followed by Jiangmen, Zhaoqing and Hong Kong. In terms of the ecological space, Zhuhai City experienced the largest decline, followed by Jiangmen City, Guangzhou City, Zhaoqing City, and Huizhou City.

4. Discussion

4.1. Value and Contribution of LUCC Remote Sensing Data

LUCC remote sensing data is the core data supporting the spatial sustainable development in this paper. Its own data accessibility is conducive to the extension of the method in this paper. In addition, the division of production-living-ecological space based on LUCC enables us to discover the sustainable development status of different spatial types in the same region. To this end, we further discuss the value of LUCC data from its own advantages and the main contribution to this paper.

4.1.1. Advantages of LUCC Remote Sensing Data Products

Currently, 41 percent of the SDGs have no methodology. The accessibility and difficulty of the data involved in the research method have a great impact on the promotion and popularity of the research method. The LUCC remote sensing data involved in the method of evaluating the spatial sustainable development proposed in this paper has the strong advantages of easy access, popularization, and application. From the end of the last century to the present, relevant research teams in different countries around the world have produced a series of LUCC data products with the help of remote sensing images [46,47,48,49,50,51]. This provides strong data support for relevant researchers to observe changes in the temporal and spatial distributions of global land cover [52] and to conduct a series of assessments of ecological functions and food security [53]. In addition, the long time series and full coverage advantages of LUCC remote sensing data products can meet the needs of any country and region in the world for carrying out LUCC-based research.

4.1.2. Contribution of LUCC Data in This Study

Due to the advantages of remote sensing LUCC data, it was easier to consider the city as a whole when evaluating the spatial sustainable development in this study and to divide the area into production, living, and ecological spaces. In contrast, it would be more difficult to achieve this goal using single impervious surface data, because they only focus on the central part of the city, including living spaces and few production spaces, and they insufficiently consider the ecological spaces.
In this study, it was demonstrated that division of the production-living-ecological spaces can be achieved using LUCC data. Moreover, this method revealed the differences in the sustainable development of the three types of spaces in the different prefecture-level cities of the GBA. Taking Foshan City as an example, by comparing the results for 2000–2010 and 2010–2020, it was found that the sustainable development level of its overall space increased, but the sustainable development level of the production space decreased. Therefore, in the future, optimization should focus on the production space. In this study, the statistics of the changes in the sustainable development levels of all 11 prefecture-level cities in the GBA were obtained based on the three internal types of spaces. The principle of the areas in which the sustainable development level have declined need optimization and the increases in sustainable development should be maintained. The study area was divided into six typical areas: a living space optimization area, a production space optimization area, a living-ecological space optimization area, a living-production-ecological space optimization area, a production-ecological space optimization area, and a maintenance area (Figure 9).
By comparing the degrees of decline in the level of sustainable development, the importance of the future development of the production-life-ecological spaces in the prefecture-level cities that need to be optimized were ranked in order from fast to slow. Then, they were divided into three types: strong optimization, intermediate optimization, and weak optimization (Table 8), which indicates the direction of the future optimization of the spaces in the various cities in the GBA. In contrast, if we only study the sustainable development of the living space in the core area of the Greater Bay Area, e.g., from the perspective of Jiang et al. [17], then the disadvantage of Foshan’s production space may be ignored, which obviously cannot meet the needs of the overall development of the city.
In addition to the LUCC remote sensing data used in this study to investigate the SDG11.3.1, in recent years, most scholars have used the values of different types of remote sensing data from different perspectives in the tracking and extension of SDGs. Giuliani et al. [54] used open and free earth observation data (e.g., DEM, population grid data, LUCC data) to supplement the official and traditional statistical data for urban areas, effectively promoting European Union (EU) reporting against SDG indicators and better comparison between EU countries. Mulligan et al. [55] used several publicly available earth observation datasets (land cover, climate, soil, population, and agriculture) and the widely used spatial ecosystem services assessment tool Co$tingNature to achieve an SDG6 assessment of Madagascar on the country and Volta Basin scales. Therefore, we encourage the popularization and promotion of the use of remote sensing data in research on human society and urban development in the future.

4.2. Importance of Introducing the Economic Dimension and Conducting Multiscale Analysis

Wang et al. [56] used SDG11.3.1 to conduct a similar study on the GBA, that is, they identified the relationship between the rate of change of the land and the population growth rate in the built-up area where the land consumption rate has exceeded the population growth rate, and they determined that the development trend is not coordinated. However, due to the lack of research on the relationship between the rate of change in the land and the economic growth rate, their research results cannot fully reflect the three aspects of society, economy, and environment in the Pearl River Delta, and overall identification of the sustainable development status of the urban space is lacking. Based on the LCRPGR, in this study, the ratio of the rate of change of the land’s functions to the economic growth rate (LCREGR) was introduced to incorporate the economic dimension. The relationship between the rates of change in the two is considered to yield a comprehensive evaluation of the sustainable development of the urban space.
Different from Wang et al. [56], they found that the PGR of seven cities in the Pearl River Delta exhibited downward trends, and the LCR values of six cities exhibited upward trends. However, they did not pay attention to the changes in the PGR and LCR in the Pearl River Delta as a whole at the urban agglomeration scale. In this study, the spatial sustainable development status of 11 prefecture-level cities in the GBA was analyzed at the prefecture-level city scale and the urban agglomeration scale. i.e., the entire bay area as a whole. The results show that the spatial sustainable development of the GBA at the urban agglomeration scale during 2010–2020 improved compared with that during 2000–2010. However, on the prefecture-level city scale, the sustainable development of the space in Huizhou, Zhuhai, and Jiangmen decreased. In addition, in terms of the production-living-ecological spaces, the sustainable development changes at the urban agglomeration and prefecture-level city scales were different. Therefore, studying the sustainable development of urban space at a single scale may lead to insufficient information and inefficient and uninformed decision-making. This study was a multiple spatial scale study from the perspective of the production-living-ecological spaces, which not only revealed the differences in the spatial sustainable development status of the two scales but also enabled the identification of three levels of spatial sustainable development within each scale. The multi-scale nature of the research results is characterized by stratification and refinement.
From the perspectives of the urban agglomeration and prefecture-level city scales and the production-life-ecological spaces, the following suggestions for the future sustainable development of the GBA are provided. The following suggestions can also be used for reference by other countries or regions in the world when implementing spatial optimization.
  • At the urban agglomeration scale in the GBA: based on the principle of people-oriented and high-quality spatial development, we should actively promote the synergistic optimization of the relationship between the production-life-ecological spaces; enriching the multi-functionality of the land use types’ attributes. This should include improving the efficiency of land resource utilization, promoting the optimization of the urban layout, and formulating phased development goals, maintaining and utilizing the inertia of the trend of improving the sustainability level of the land space in the past 20 years.
  • At the prefecture-level city scale in the GBA: the main goals should be identifying prefecture-level cities with declining levels of sustainable development, comparing the extent of the decline, and implementing targeted optimization plans to varying degrees. In addition, before implementing specific optimization plans, the different resources, environmental carrying capacity, and development suitability of these prefecture-level cities should be considered. Differentiated spatial development policies should be formulated according to the development mode and intensity of the space to promote overall improvement of the three types of spaces in the GBA.
  • Regarding the living spaces in the GBA: (1) The expansion of built-up areas should be controlled. (2) Infrastructure construction should be strengthened. (3) The three-dimensional transportation development mode should be improved. (4) Transportation accessibility should be improved. (5) The service scope of public facilities should be expanded. Rationally distributing dynamic living areas such as parks and squares should be appropriately increased to facilitate people’s leisure and entertainment. Regarding the production spaces: (1) Local natural, policy, and economic conditions should be taken into consideration. characteristic and advantageous industries should be developed according to the local conditions. (2) The optimization and coordination of the three major industrial structures in the GBA should be promoted. (3) Investments in science and technology should be increased to improve production efficiency. (4) Agglomeration development should be implemented to achieve complementary advantages, resource sharing, and the effect of 1 + 1 > 2. Regarding the ecological spaces: (1) Ecological barriers should be consolidated. (2) Soil and water conservation should be strengthened. (3) The original ecological spaces such as mountains, rivers, forests, fields, lakes, and grasslands should be protected. (4) Tree planting and afforestation should be increased. (5) Modern ecological construction methods such as green buildings and roof gardens should be popularized. (6) The incorporation of ecological space into living space and production space should be promoted. (7) The reasonable restoration and planning of new ecological spaces should be implemented.

4.3. Uncertainties and Future Work

4.3.1. Demarcation of Production-Living-Ecological Spaces Based on Multi-Functionality of Land Use

In recent years, the research and demarcation of production-living-ecological spaces have received a great deal of attention in academic circles. However, at present, there is still no clear standard system for the division of production-living-ecological spaces. Different scholars have produced different classification standards and methods at different research scales and from different perspectives. In this study, from the perspective of the land use carrying versatility, with LUCC remote sensing data as the core and taking advantage of its rich land use types, weight assignment was carried out from the macroscopic qualitative perspective, based on the previous research results on the division of production-living-ecological spaces and the multi-functionality of land use types. Then, the urban space was divided into three types of spaces: production, living, and ecological spaces. However, there is still room for optimization and improvement of the quantitative weight assignment of the production-living-ecological space functions. Some scholars have based the quantitative division of the production-living-ecological spaces on the niche theory of organizational ecology, which measures the position and function of an organism in a community [57]. By collecting a large number of statistical data and indicators, the ecological niche correlation evaluation model and calculation formula [58,59,60] can be constructed to achieve the quantitative assignment and division of the regional production-ecological functions. This type of quantitative three-generation space division method based on niches is worthy of reference. However, the purpose of our research approach is global in this paper. Considering the completeness and authenticity of the statistical data acquisition in some less developed countries and regions. We still hope that with the gradual development of remote sensing big data, remote sensing data and deep learning methods can be used to complete the objective and quantitative assignment of the production-living-ecological space functions of land use types in the future. Further enhancing the popularity of the spatial sustainability evaluation method based on remote sensing data proposed in this paper.

4.3.2. AHP Weight Assignment

Since the research area in this study was the GBA in China, the use of the spatial sustainable development analytic hierarchy process was primarily based on the importance of the three types of spaces in this area. Therefore, when using this method, we should take measures according to local conditions, combine the development direction and policy inclination of the three types of local spaces, and assign weights in a targeted manner, which is also a key point to note.

4.3.3. Prospects for the Use of This Method

In future research, in addition to the quantitative assignment of production-living-ecological functions of land use types mentioned above, the spatial sustainability evaluation method proposed in this paper also deserves attention in the following two aspects. (1) Division of production-living-ecological spaces at fine scale: we believe that the application of this method can be further refined regarding the research scale. In production-living-ecological spaces, production space and living space are the main areas with frequent human activities. In this study, these two types of space were only defined from a macroscopic perspective, but the functional heterogeneity at the micro-level within the space was not distinguished, such as residential, commercial, and industrial areas. (2) Exploration of offshore areas: the coastal zone is the most dynamic, complex, and changeable region in the world, and it is an important point of study on sustainable development of cities, especially coastal cities [61,62]. With the increasing demand for land space and the gradual derivation of high-resolution remote sensing data, the spatial sustainable development assessment research of production-living-ecological spaces in offshore areas would also be a direction of future efforts.
In terms of the production and living spaces in the central urban area, some scholars have divided the city into different functional areas at the block scale by integrating multivariate geographic big data and using deep learning-related algorithms [63,64,65], which has greatly improved the spatial accuracy of the city’s social, economic, and environmental factors. In addition, Tang et al. [66] constructed a spatial scene system for the coastal zone with clear geographical locations and full space. Xu et al. [67] used remote sensing images to analyze the utilization dynamics of oceans and coastlines based on marine functional zoning and assessed the coastal zone capacity and sustainability. All of these studies can provide valuable references for future research on the above two points.

5. Conclusions

In the context of the United Nations 2030 Agenda for Sustainable Development, this paper proposed a new evaluation method for spatial sustainable development, which effectively tracked and extended the SDG11.3.1 land use efficiency indicator in the 17 Goals. In this method, based on LUCC remote sensing data, cities were divided into three types of spaces (production, living, and ecological spaces) according to the multi-functionality of the land use types. The ratios of the rates of change of the functions of the urban production space, living space, and ecological space to the rates of change of the population and GDP were analyzed from the perspective of multi-scale coordinated development using the modified land use efficiency indicator and by integrating regional population and GDP data. The AHP was used to assign weights to the three types of spaces and the indicator, and the spatial sustainable development index value was calculated via weighting.
Using this method, in the GBA in China, the status of spatial sustainable development of 11 cities was evaluated during 2000–2010 and 2010–2020. The results revealed significant differences in the levels of and changes in the urban spatial sustainable development at different spatial scales, and the study of a single scale may lead to incorrect decisions. In addition, from the perspective of the production-living-ecological spaces, the sustainable development of the urban production, living, and ecological spaces was different. As such, cities should optimize the sustainable development of the three spaces differently in the future, rather than treating them as equal. Therefore, we believe that this method had some advantages regarding the hierarchy and integrity of the evaluation results. In addition, the use of open-source remote sensing data has made the methodology easier to use in future spatial sustainable development assessments in any country or region of the world.

Author Contributions

Conceptualization, K.G. and X.Y.; methodology, K.G. and Z.W.; software, K.G.; validation, K.G., X.Y., Z.W. and H.Z.; formal analysis, K.G. and Z.W.; investigation, K.G. and X.Z.; resources, K.G., X.Y., Z.W. and C.H.; data curation, K.G. and Z.W.; writing—original draft preparation, K.G.; writing—review and editing, Z.W.; visualization, K.G.; supervision, Z.W.; project administration, Z.W.; funding acquisition, Z.W. All authors have read and agreed to the published version of the manuscript.

Funding

This research was funded by the National Natural Science Foundation of China (Grant No. 41890854; 41901354) and the Innovation Project of LREIS (Grant No. O88RAA01YA).

Data Availability Statement

Not applicable.

Conflicts of Interest

The authors declare no conflict of interest.

Abbreviations

GBAThe Guangdong-Hong Kong-Macao Greater Bay Area
SDVSustainable development index value
SDLSustainable development level
LCRLand consumption rate
PGRpopulation growth rate
EGReconomic growth rate
LCRPGR (LP)The ratio of the LCR to the PGR
LCREGR (LE)The ratio of the LCR to the EGR
AHPAnalytic hierarchy process

References

  1. Transforming Our World: The 2030 Agenda for Sustainable Development; United Nations: New York, NY, USA, 2015.
  2. Grimm, N.B.; Faeth, S.H.; Golubiewski, N.E.; Redman, C.L.; Wu, J.; Bai, X.; Briggs, J.M. Global change and the ecology of cities. Science 2008, 319, 756–760. [Google Scholar] [CrossRef] [PubMed] [Green Version]
  3. United Nations. World Urbanization Prospects: The 2014 Revision, Highlights; Department of Economic and Social Affairs, Population Division, United Nations: New York, NY, USA, 2014. [Google Scholar]
  4. Rieniets, T. Shrinking cities: Causes and effects of urban population losses in the twentieth century. Nat. Cult. 2009, 4, 231–254. [Google Scholar] [CrossRef]
  5. Beyer, E.; Hagemann, A.; Rieniets, T.; Oswalt, P. Atlas of Shrinking Cities; Hatje Cantz: Ostfildern-Ruit, Germany, 2006. [Google Scholar]
  6. Sun, L.; Chen, J.; Li, Q.; Huang, D. Dramatic uneven urbanization of large cities throughout the world in recent decades. Nat. Commun. 2020, 11, 5366. [Google Scholar] [CrossRef] [PubMed]
  7. Bain, P.G.; Kroonenberg, P.M.; Johansson, L.O.; Milfont, T.L.; Crimston, C.R.; Kurz, T.; Bushina, E.; Calligaro, C.; Demarque, C.; Guan, Y.; et al. Public views of the sustainable development goals across countries. Nat. Sustain. 2019, 2, 819–825. [Google Scholar] [CrossRef] [Green Version]
  8. Elmqvist, T.; Andersson, E.; Frantzeskaki, N.; McPhearson, T.; Olsson, P.; Gaffney, O.; Takeuchi, K.; Folke, C. Sustainability and resilience for transformation in the urban century. Nat. Sustain. 2019, 2, 267–273. [Google Scholar] [CrossRef]
  9. Caprotti, F.; Cowley, R.; Datta, A.; Broto, V.C.; Gao, E.; Georgeson, L.; Herrick, C.; Odendaal, N.; Joss, S. The New Urban Agenda: Key opportunities and challenges for policy and practice. Urban Res. Pract. 2017, 10, 367–378. [Google Scholar] [CrossRef] [Green Version]
  10. UN-Habitat. SDG Indicator 11.3.1 Training Module: Land Use Efficiency; UN-Habitat: London, UK; Sterling, VA, USA, 2018. [Google Scholar]
  11. Mudau, N.; Mwaniki, D.; Tsoeleng, L.; Mashalane, M.; Beguy, D.; Ndugwa, R. Assessment of SDG indicator 11.3. 1 and urban growth trends of major and small cities in South Africa. Sustainability 2020, 12, 7063. [Google Scholar]
  12. Koroso, N.H.; Lengoiboni, M.; Zevenbergen, J.A. Urbanization and urban land use efficiency: Evidence from regional and Addis Ababa satellite cities, Ethiopia. Habitat Int. 2021, 117, 102437. [Google Scholar] [CrossRef]
  13. Nicolau, R.; David, J.; Caetano, M.; Pereira, J.M. Ratio of land consumption rate to population growth rate—Analysis of different formulations applied to mainland Portugal. ISPRS Int. J. Geo-Inf. 2018, 8, 10. [Google Scholar] [CrossRef] [Green Version]
  14. Wang, Y.; Huang, C.; Feng, Y.; Zhao, M.; Gu, J. Using earth observation for monitoring SDG 11.3. 1-ratio of land consumption rate to population growth rate in Mainland China. Remote Sens. 2020, 12, 357. [Google Scholar] [CrossRef] [Green Version]
  15. UK Office for National Statistics. Using Innovative Methods to Report against the Sustainable Development Goals. 2018. Available online: https://www.ons.gov.uk/economy/environmentalaccounts/articles/usinginnovativemethodstoreportagainstthesustainabledevelopmentgoals/2018-10-22 (accessed on 1 December 2018).
  16. Commissariat General au Developpement Durable. Indicateurs Nationaux de la Transition Ecologique Vers Undeveloppement Durable (2015–2020); Commissariat General au Developpement Durable: Paris, France, 2016; Available online: http://www.statistiques.developpement-durable.gouv.fr/indi-cateurs-indices/f/.2491/0/artificialisation-sols-1.html (accessed on 1 December 2018).
  17. Jiang, H.; Sun, Z.; Guo, H.; Weng, Q.; Du, W.; Xing, Q.; Cai, G. An assessment of urbanization sustainability in China between 1990 and 2015 using land use efficiency indicators. npj Urban Sustain. 2021, 1, 34. [Google Scholar] [CrossRef]
  18. Estoque, R.C.; Ooba, M.; Togawa, T.; Hijioka, Y.; Murayama, Y. Monitoring global land-use efficiency in the context of the UN 2030 Agenda for Sustainable Development. Habitat Int. 2021, 115, 102403. [Google Scholar] [CrossRef]
  19. Zhu, J.; Hou, Z.; Li, X.; Xu, J. The Effect and Mechanism of Urbanization on Rural Revitalization in China. Econ. Geogr. 2022, 42, 200–209. [Google Scholar]
  20. Liu, Y.; Li, Y. Revitalize the world’s countryside. Nature 2017, 548, 275–277. [Google Scholar] [CrossRef] [PubMed]
  21. Li, G.; Fang, C. Quantitative function identification and analysis of urban ecological-production-living spaces. Acta Geogr. Sin. 2016, 71, 49–65. [Google Scholar]
  22. Liu, J.; Liu, Y.; Li, Y. Classification evaluation and spatial-temporal analysis of “production-living-ecological” spaces in China. Acta Geogr. Sin. 2017, 7, 1290–1304. [Google Scholar]
  23. Huang, J.; Lin, H.; Qi, X. A literature review on optimization of spatial development pattern based on ecological-production-living space. Prog. Geogr. 2017, 36, 378–391. [Google Scholar]
  24. Wheatley, M.; Johnson, C. Factors limiting our understanding of ecological scale. Ecol. Complex. 2009, 6, 150–159. [Google Scholar] [CrossRef]
  25. Turner, M.G.; O’Neill, R.V.; Gardner, R.H.; Milne, B.T. Effects of changing spatial scale on the analysis of landscape pattern. Landsc. Ecol. 1989, 3, 153–162. [Google Scholar] [CrossRef]
  26. Peng, J.; Ma, J.; Du, Y.; Zhang, L.; Hu, X. Ecological suitability evaluation for mountainous area development based on conceptual model of landscape structure, function, and dynamics. Ecol. Indic. 2016, 61, 500–511. [Google Scholar] [CrossRef]
  27. Zeng, W. Study on Urban Residents’ Living Space During the Transition Period; Nanjing Normal University: Nanjing, China, 2015. [Google Scholar]
  28. Cui, J.; Gu, J.; Sun, J.; Luo, J. The Spatial Pattern and Evolution Characteristics of the Production, Living and Ecological Space in Hubei Provence. China Land Sci. 2018, 32, 67–73. [Google Scholar]
  29. Song, X.; Wu, Z.; Ouyang, Z. Changes of cultivated land function in China since 1949. Acta Geogr. Sin. 2014, 69, 435–447. [Google Scholar]
  30. Liao, G.; He, P.; Gao, X.; Deng, L.; Zhang, H.; Feng, N.; Zhou, W.; Deng, O. The production–living–ecological land classification system and its characteristics in the hilly area of Sichuan province, southwest China based on identification of the main functions. Sustainability 2019, 11, 1600. [Google Scholar] [CrossRef] [Green Version]
  31. Xie, B.; Wang, Q.; Huang, B.; Chen, Y.; Yang, J.; Qi, P. Coordinated State Analysis and Differential Regulation of Territorial Spatial Functions in Underdeveloped Regions: A Case Study of Gansu Province. China. Sustain. 2022, 14, 950. [Google Scholar] [CrossRef]
  32. Chepil, W.S. Dynamics of wind erosion: I. Nature of movement of soil by wind. Soil Sci. 1945, 60, 305–320. [Google Scholar]
  33. He, S.F.; Jiang, D.M.; Lamusa, A.; Liu, Z.M.; Luo, Y.M. Sand-fixing effects of Caragana microphylla shrub in Keerqin Sandy Land. J. Soil Water Conserv. 2007, 21, 84–87. [Google Scholar]
  34. Xie, G.; Zhang, Y.; Lu, C.; Zheng, D.; Cheng, S. Study on valuation of rangeland ecosystem services of China. J. Nat. Resour. 2001, 16, 47–53. [Google Scholar]
  35. Ouyang, Z.; Zhao, T.; Wang, X.; Miao, H. Ecosystem services analyses and valuation of China terrestrial surface water system. Acta Ecol. Sin. 2004, 24, 2091–2099. [Google Scholar]
  36. Xiao, J.; Shi, G.; Mao, C.; Xing, Z. Evaluation of economic value of river ecosystem service functions in China. J. Econ. Water Resour. 2008, 26, 9–11. [Google Scholar]
  37. Zhang, Z.; He, X.; Liu, L.; Li, Z.; Wang, P. Ecological service functions and value estimation of glaciers in the Tianshan Mountains, China. Acta Geogr. Sin. 2018, 73, 856–867. [Google Scholar]
  38. Qiu, J. Development and utilization of Chinese modem tidal flat: A review. Water Resour. Dev. Res. 2006, 3, 26–28. [Google Scholar]
  39. Thomas, P.G.; Doherty, P.C. The Analytic Hierarchy Process: Planning, Priority Setting, Resource Allocation; McGraw-Hill: New York, NY, USA, 1980. [Google Scholar]
  40. Hagquist, R.F. High-Precision Prioritization Using Analytical Hierarchy Process: Determining State HPMS Component Weighting Factors. Multimodal Priority Setting and Application of Geographic Information Systems. Transp. Res. Rec. 1994, 1429, 7–14. [Google Scholar]
  41. Yang, C.; Li, Q.; Hu, Z.; Chen, J.; Shi, T.; Ding, K.; Wu, G. Spatiotemporal evolution of urban agglomerations in four major bay areas of US, China and Japan from 1987 to 2017: Evidence from remote sensing images. Sci. Total Environ. 2019, 671, 232–247. [Google Scholar] [CrossRef] [PubMed]
  42. Lin, H.; Zhang, H.; Lin, Y.; Wei, S.; Wu, Z. Spatiotemporal changes of gridded urban population in the Guangdong-Hong Kong-Macao Greater Bay Area based on impervious surface-population correlation. Prog. Geogr. 2018, 37, 1644–1652. [Google Scholar]
  43. Cai, C. The building of a World-Class City cluster in Guangdong-Hong Kong-Macao Greater Bay Area: Stretegic meanings and challenges. Soc. Sci. Guangdong 2017, 4, 5–14. [Google Scholar]
  44. CW CPA. The Greater Bay Area Initiative—An Overview with a German Focus. 2017. Available online: https://www.cwhkcpa.com/greater-bay-area-initiative-overview-german-focus/ (accessed on 20 March 2022).
  45. Choi, S.Y. Industry volatility and economic uncertainty due to the COVID-19 pandemic: Evidence from wavelet coherence analysis. Financ. Res. Lett. 2020, 37, 101783. [Google Scholar] [CrossRef]
  46. Wang, Y.; Huang, C.; Feng, Y.; Gu, J. Evaluation of the Coordinated Relationship between Land Consumption Rate and Population Growth Rate in the Pear River Delta based on the 2030 Sustainable Development Goals. Remote Sens. Technol. Appl. 2021, 36, 1168–1177. [Google Scholar]
  47. Hansen, M.C.; DeFries, R.S.; Townshend, J.R.; Sohlberg, R. Global land cover classification at 1 km spatial resolution using a classification tree approach. Int. J. Remote Sens. 2000, 21, 1331–1364. [Google Scholar] [CrossRef]
  48. Zhu, Z.; Yang, L. Characteristics of the 1 km AVHRR data set for North America. Int. J. Remote Sens. 1996, 17, 1915–1924. [Google Scholar] [CrossRef]
  49. Muchoney, D.; Borak, J.; Chi, H.; Friedl, M.; Gopal, S.; Hodges, J.; Morrow, N.; Strahler, A. Application of the MODIS global supervised classification model to vegetation and land cover mapping of Central America. Int. J. Remote Sens. 2000, 21, 1115–1138. [Google Scholar] [CrossRef]
  50. Bicheron, P.; Defourny, P.; Brockmann, C.; Schouten, L.; Vancutsem, C.; Huc, M.; Bontemps, S.; Leroy, M.; Achard, F.; Herold, M.; et al. GLOBCOVER: Products Description and Validation Report; MEDIAS-France: Toulouse, France, 2008. [Google Scholar]
  51. Chen, J.; Chen, J.; Liao, A.; Cao, X.; Chen, L.; Chen, X.; Peng, S.; Han, G.; Zhang, H.; He, C.; et al. Concepts and Key Techniques for 30 m Global Land Cover Mapping. Acta Geod. Cartogr. Sin. 2014, 43, 551–557. [Google Scholar] [CrossRef]
  52. Zanaga, D.; Van De Kerchove, R.; De Keersmaecker, W.; Souverijns, N.; Brockmann, C.; Quast, R.; Wevers, J.; Grosu, A.; Paccini, A.; Vergnaud, S.; et al. ESA WorldCover 10 m 2020 v100. 2021. Available online: https://developers.google.com/earth-engine/datasets/catalog/ESA_WorldCover_v100 (accessed on 10 February 2022).
  53. Schubert, H.; Caballero, C.A.; Rauchecker, M.; Rojas-Zamora, O.; Brokamp, G.; Schütt, B. Assessment of Land Cover Changes in the Hinterland of Barranquilla (Colombia) Using Landsat Imagery and Logistic Regression. Land 2018, 7, 152. [Google Scholar] [CrossRef] [Green Version]
  54. Mulligan, M.; van Soesbergen, A.; Hole, D.G.; Brooks, T.M.; Burke, S.; Hutton, J. Mapping nature’s contribution to SDG 6 and implications for other SDGs at policy relevant scales. Remote Sens. Environ. 2020, 239, 111671. [Google Scholar] [CrossRef]
  55. Giuliani, G.; Petri, E.; Interwies, E.; Vysna, V.; Guigoz, Y.; Ray, N.; Dickie, I. Modelling accessibility to urban green areas using Open Earth Observations Data: A novel approach to support the urban SDG in four European cities. Remote Sens. 2021, 13, 422. [Google Scholar] [CrossRef]
  56. Huang, H.; Zhou, Y.; Qian, M.; Zeng, Z. Land use transition and driving forces in Chinese Loess Plateau: A case study from Pu County, Shanxi Province. Land 2021, 10, 67. [Google Scholar] [CrossRef]
  57. Vandermeer, J.H. Niche theory. Annu. Rev. Ecol. Syst. 1972, 3, 107–132. [Google Scholar] [CrossRef]
  58. Meng, L.; Zheng, X.; Zhao, L.; Deng, J. Land-use functional regionalization based on niche-fitness model. Trans. Chin. Soc. Agric. Eng. 2011, 27, 282–287. [Google Scholar]
  59. Zheng, F. Study on the Space Demarcation and Control Measures of Jinan City Based on the Niche Fitness Model; China University of Geosciences: Beijing, China, 2019. [Google Scholar] [CrossRef]
  60. Jing, Z.; Wang, J.; Tang, Q.; Liu, B.; Niu, H. Evolution of land use in coal-based cities based on the ecological niche theory: A case study in Shuozhou City, China. Resour. Policy 2021, 74, 102245. [Google Scholar] [CrossRef]
  61. Crossland, C.J.; Kremer, H.H.; Lindeboom, H.; Crossland, J.I.M.; Le Tissier, M.D. (Eds.) Coastal fluxes in the Anthropocene: The Land-Ocean Interactions in the Coastal Zone Project of the International Geosphere-Biosphere Programme; Springer Science & Business Media: Berlin/Heidelberg, Germany, 2005. [Google Scholar]
  62. Liu, R.; Pu, L.; Zhu, M.; Huang, S.; Jiang, Y. Coastal resource-environmental carrying capacity assessment: A comprehensive and trade-off analysis of the case study in Jiangsu coastal zone, eastern China. Ocean. Coast. Manag. 2020, 186, 105092. [Google Scholar] [CrossRef]
  63. Zhang, X.; Du, S. A Linear Dirichlet Mixture Model for decomposing scenes: Application to analyzing urban functional zonings. Remote Sens. Environ. 2015, 169, 37–49. [Google Scholar] [CrossRef]
  64. Ding, Y.; Xu, H.; Wang, C. Research on urban functional area recognition integrating OSM road network and POI data. Geogr. Inf. Sci. 2020, 36, 57–63. [Google Scholar]
  65. Zhu, Q.; Lei, Y.; Sun, X.; Guan, Q.; Zhong, Y.; Zhang, L.; Li, D. Knowledge-guided land pattern depiction for urban land use mapping: A case study of Chinese cities. Remote Sens. Environ. 2022, 272, 112916. [Google Scholar]
  66. Tang, Y.; Wang, M.; Liu, Q.; Hu, Z.; Zhang, J.; Shi, T.; Wu, G.; Su, F. Ecological carrying capacity and sustainability assessment for coastal zones: A novel framework based on spatial scene and three-dimensional ecological footprint model. Ecol. Model. 2022, 466, 109881. [Google Scholar] [CrossRef]
  67. Xu, J.; Li, F.; Suo, A.; Zhao, J.; Su, X. Spatio-temporal change and carrying capacity evaluation of human coastal utilization in Liaodong Bay, China from 1993 to 2015. Chin. Geogr. Sci. 2019, 29, 463–473. [Google Scholar]
Figure 1. Space Sustainability Assessment Process.
Remotesensing 14 02772 g001
Figure 2. Schematic diagram of functional grade assignment of Production-living-ecological space.
Remotesensing 14 02772 g002
Figure 3. Analytic hierarchy model for spatial sustainable development.
Remotesensing 14 02772 g003
Figure 4. Map of the GBA. (a) is China's position in the world. (b) is the location of the Guangdong-Hong Kong-Macao Greater Bay Area in China. (c) is the area map of Guangdong-Hong Kong-Macao Greater Bay Area.
Remotesensing 14 02772 g004
Figure 5. The spatial and temporal distribution pattern of production-living-ecological space in the GBA from 2000 to 2020, (a1a3) show the function and distribution of the production space during 2000–2020; (b1b3) show function and distribution of the living space during 2000 to 2020; (c1c3) show function and distribution of the ecological space during 2000–2020.
Remotesensing 14 02772 g005
Figure 6. Changes in sustainable development indicator value (SDV) of urban agglomeration in the GBA. (a) is overall space; (b) is production space; (c) is living space; (d) is ecological space.
Remotesensing 14 02772 g006
Figure 7. Changes in sustainable development level (SDL) of urban agglomeration in the GBA. (a) is overall space; (b) is production space; (c) is living space; (d) is ecological space.
Remotesensing 14 02772 g007
Figure 8. Comparison of areas where the sustainable development level (SDL) in the Guangdong-Hong Kong-Macao Greater Bay Area has declined and the decreasing amplitude. (a) is overall space; (b) is production space; (c) is living space; (d) is ecological space.
Remotesensing 14 02772 g008
Figure 9. The spatial development direction of the local-level cities. Except for the maintenance area, the other areas need to be optimized and adjusted (P, L, and E denote the production, living, and ecological spaces, respectively).
Remotesensing 14 02772 g009
Table 1. Production-ecological-living space multi-function weighting system.
First ClassSecond ClassFeaturesWeights
NameNameProductionLivingEcological
1. Arable land11. Paddy fieldGuarantee food supply and safety, purifies the environment, and has a landscape ecology function.0.500.5
12. Dry land0.500.5
2. Woodland21. Forest landEcological functions such as windbreak, sand fixation, and oxygen supply are the main functions; supplemented by the production of fruit and edible oil.0.2500.75
22. Shrub woodMainly reduce surface temperature and water evaporation, weakens sandstorm; supplemented by producing feed and fuel to attain economic benefits.0.2500.75
23. Open woodlandA land use type with a single ecological function, slow growth, and difficulty in natural regeneration.001
24. Other woodlandMainly in orchards, mulberry orchards, tea gardens, and thermal forest gardens, with equal emphasis on ecological functions and production functions0.500.5
3. Grassland31. High-coverage grassMainly focus on protecting biodiversity, maintaining water and soil, and maintaining ecological balance; supplemented by developing animal husbandry.0.2500.75
32. Medium-coverage grass0.2500.75
33. Low-coverage grass0.2500.75
4. Waters41. CanalsMainly conserving water resources and degrading pollutants; providing domestic water; supplemented by leisure and entertainment; it also has certain shipping and fishery production functions.0.140.280.56
42. LakeMainly adjustment of the temperature and local climate; supplemented by human recreation and tourism; it can also support freshwater aquaculture fishery production activities in certain areas.0.140.280.56
43. Reservoir pond0.140.280.56
44. Permanent glacier snowMainly for climate regulation; supplemented by hydropower.0.2500.75
45. Tidal flatBiodiversity protection and coastal erosion control are the main functions; tidal flat farming is supplementary function; it also has a certain recreational tourism function.0.280.140.56
46. Bottomland0.280.140.56
5. Urban and rural, industrial and mining residential land51. Urban landMainly serves a residential function for human life; the green landscape in the residential area has certain ecological benefits.00.750.25
52. Rural settlement00.750.25
53. Other construction landIt is mainly used for production functions such as oil fields, salt fields, and quarries; supplemented by dynamic living functions such as airports and transportation land.0.750.250
6. unused land61. SandThere is no place for human production and living, it mainly exerts its own single ecological function, and the ecological value is low.001
62. Gobi 001
63. Saline-alkali land001
64. Wetlands001
65. Bare land001
66. Bare rock001
67. Other unused land001
99. OceanNutrient circulation, water regulation, and other ecological functions are the main functions; marine aquaculture, shipping, and oil and gas industry are supplemented functions; there is also a certain tourism and leisure functions.0.280.140.56
Table 2. Definition of the judgment matrix scale.
Factor i Compared to Factor jJudgment Scale
Equally important1
Slightly important3
More important5
Strongly important7
Extremely important9
The median value of two adjacent judgments2, 4, 6, 8
Table 3. RI values of the mean random consistency indicator.
N123456789
RI000.580.901.121.241.321.411.45
Table 4. Weights of the production-living-ecological space and sustainable development indicators.
Type of SpaceWeightsIndicatorsWeights
Production Space0.62PLP0.63
PLE0.57
Living Space0.27LLP0.26
LLE0.29
Ecological Space0.12ELP0.11
ELE0.14
Table 5. Consistency test results for the LP.
λ m a x CIRICRResult
3.040.0190.520.037 < 0.1Pass
Table 6. Consistency inspection results for LE.
λ m a x CIRICRResult
300.520 < 0.1Pass
Table 7. Data sources.
DataSourcesTime
LUCC
(30 M × 30 M)
http://www.resdc.cn
(accessed on 1 July 2021)
2000/2010/2020
PopulationGuangdong Statistical Yearbook; HKSAR Government, Census and
Statistics Department;
Government of the Macao Special Administrative Region-Bureau of
Statistics and Census
2000/2010/2020
GDPGuangdong Statistical yearbook; Statistics page for Guangdong-Hong Kong-Macao Greater Bay Area2000/2010/2019
Table 8. Production-living-ecological space optimization plan for prefecture-level cities with declining levels of sustainable development.
SpacesProduction SpaceLiving SpaceEcological Space
Cities
Zhaoqing★★★★★
Huizhou★★★★★
Jiangmen★★★★★
Guangzhou★★★★★
Hongkong★★★
Zhuhai★★★★★★
Zhongshan★★★
Foshan★★★
★★★ denotes strong optimization; ★★ denotes intermediate optimization; and ★ denotes weak optimization.
Publisher’s Note: MDPI stays neutral with regard to jurisdictional claims in published maps and institutional affiliations.

