
Real-Time Ground-Level Building Damage Detection Based on Lightweight and Accurate YOLOv5 Using Terrestrial Images

Abstract
:
1. Introduction
- (1)
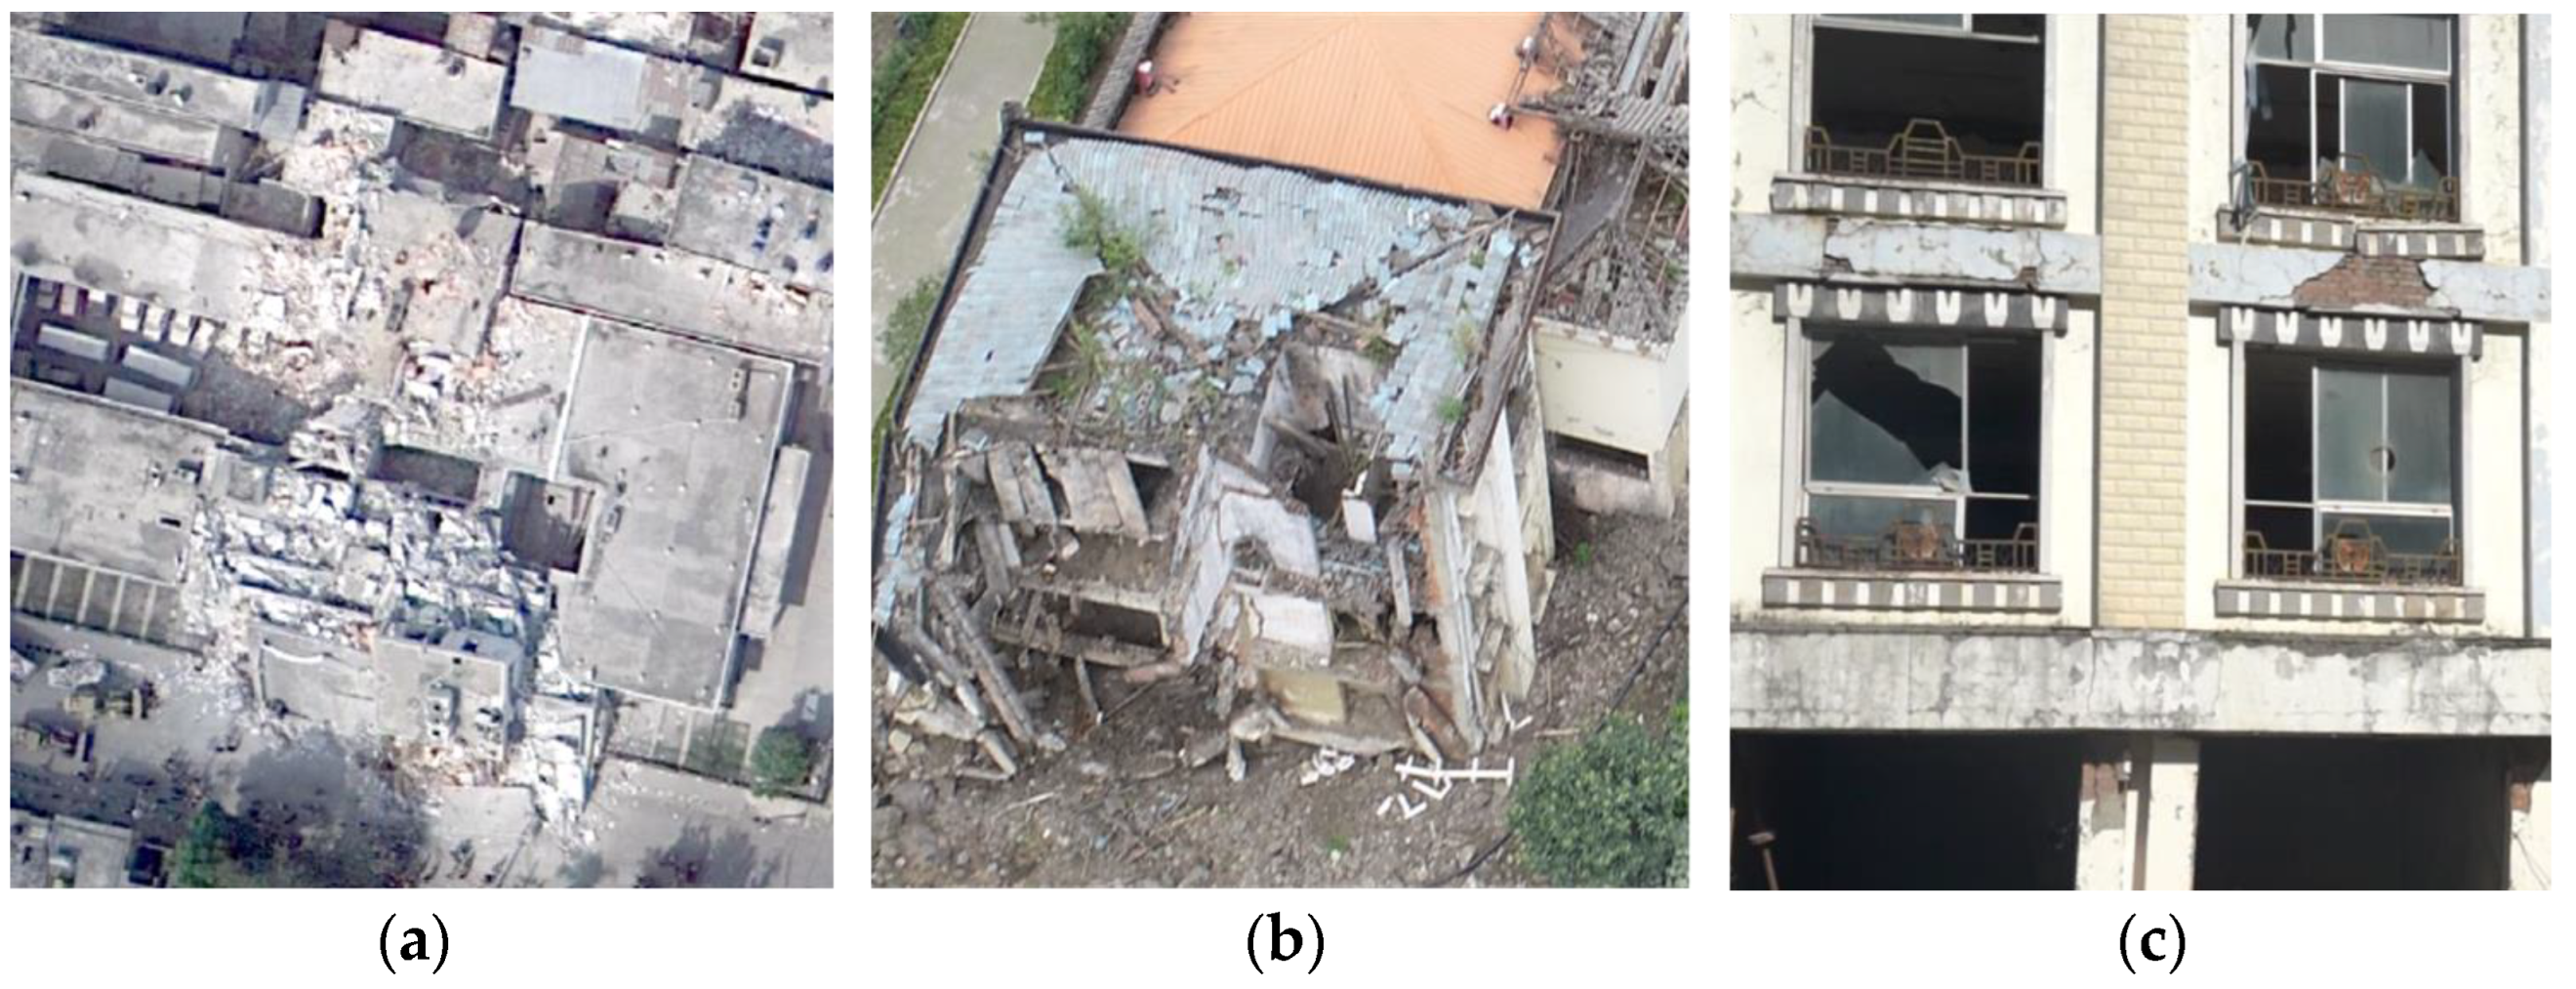
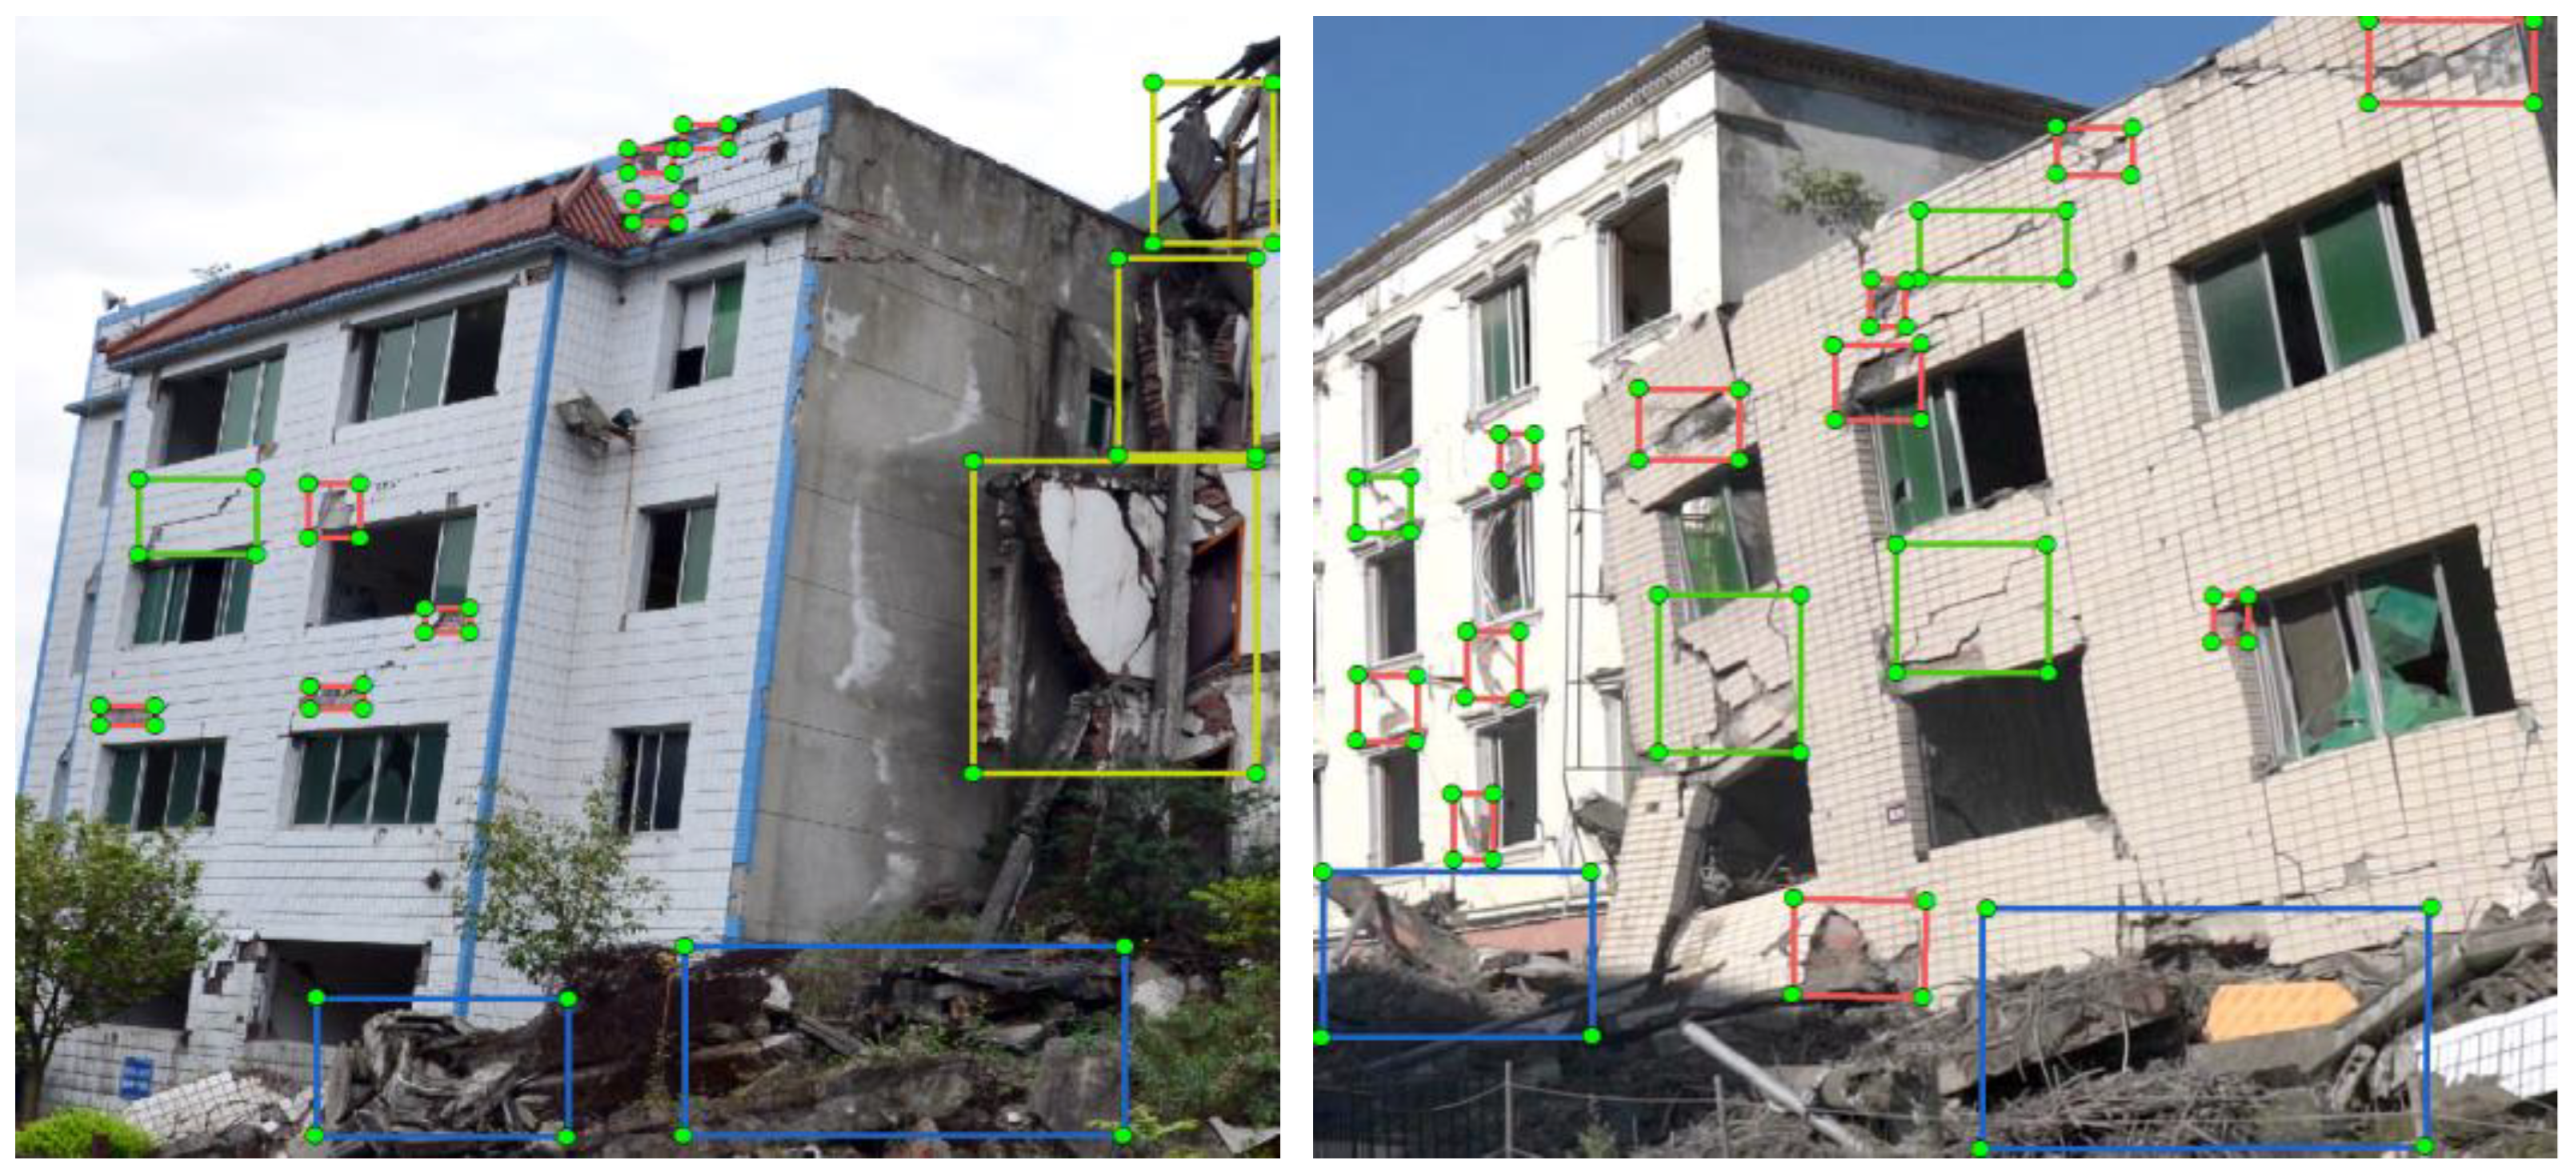
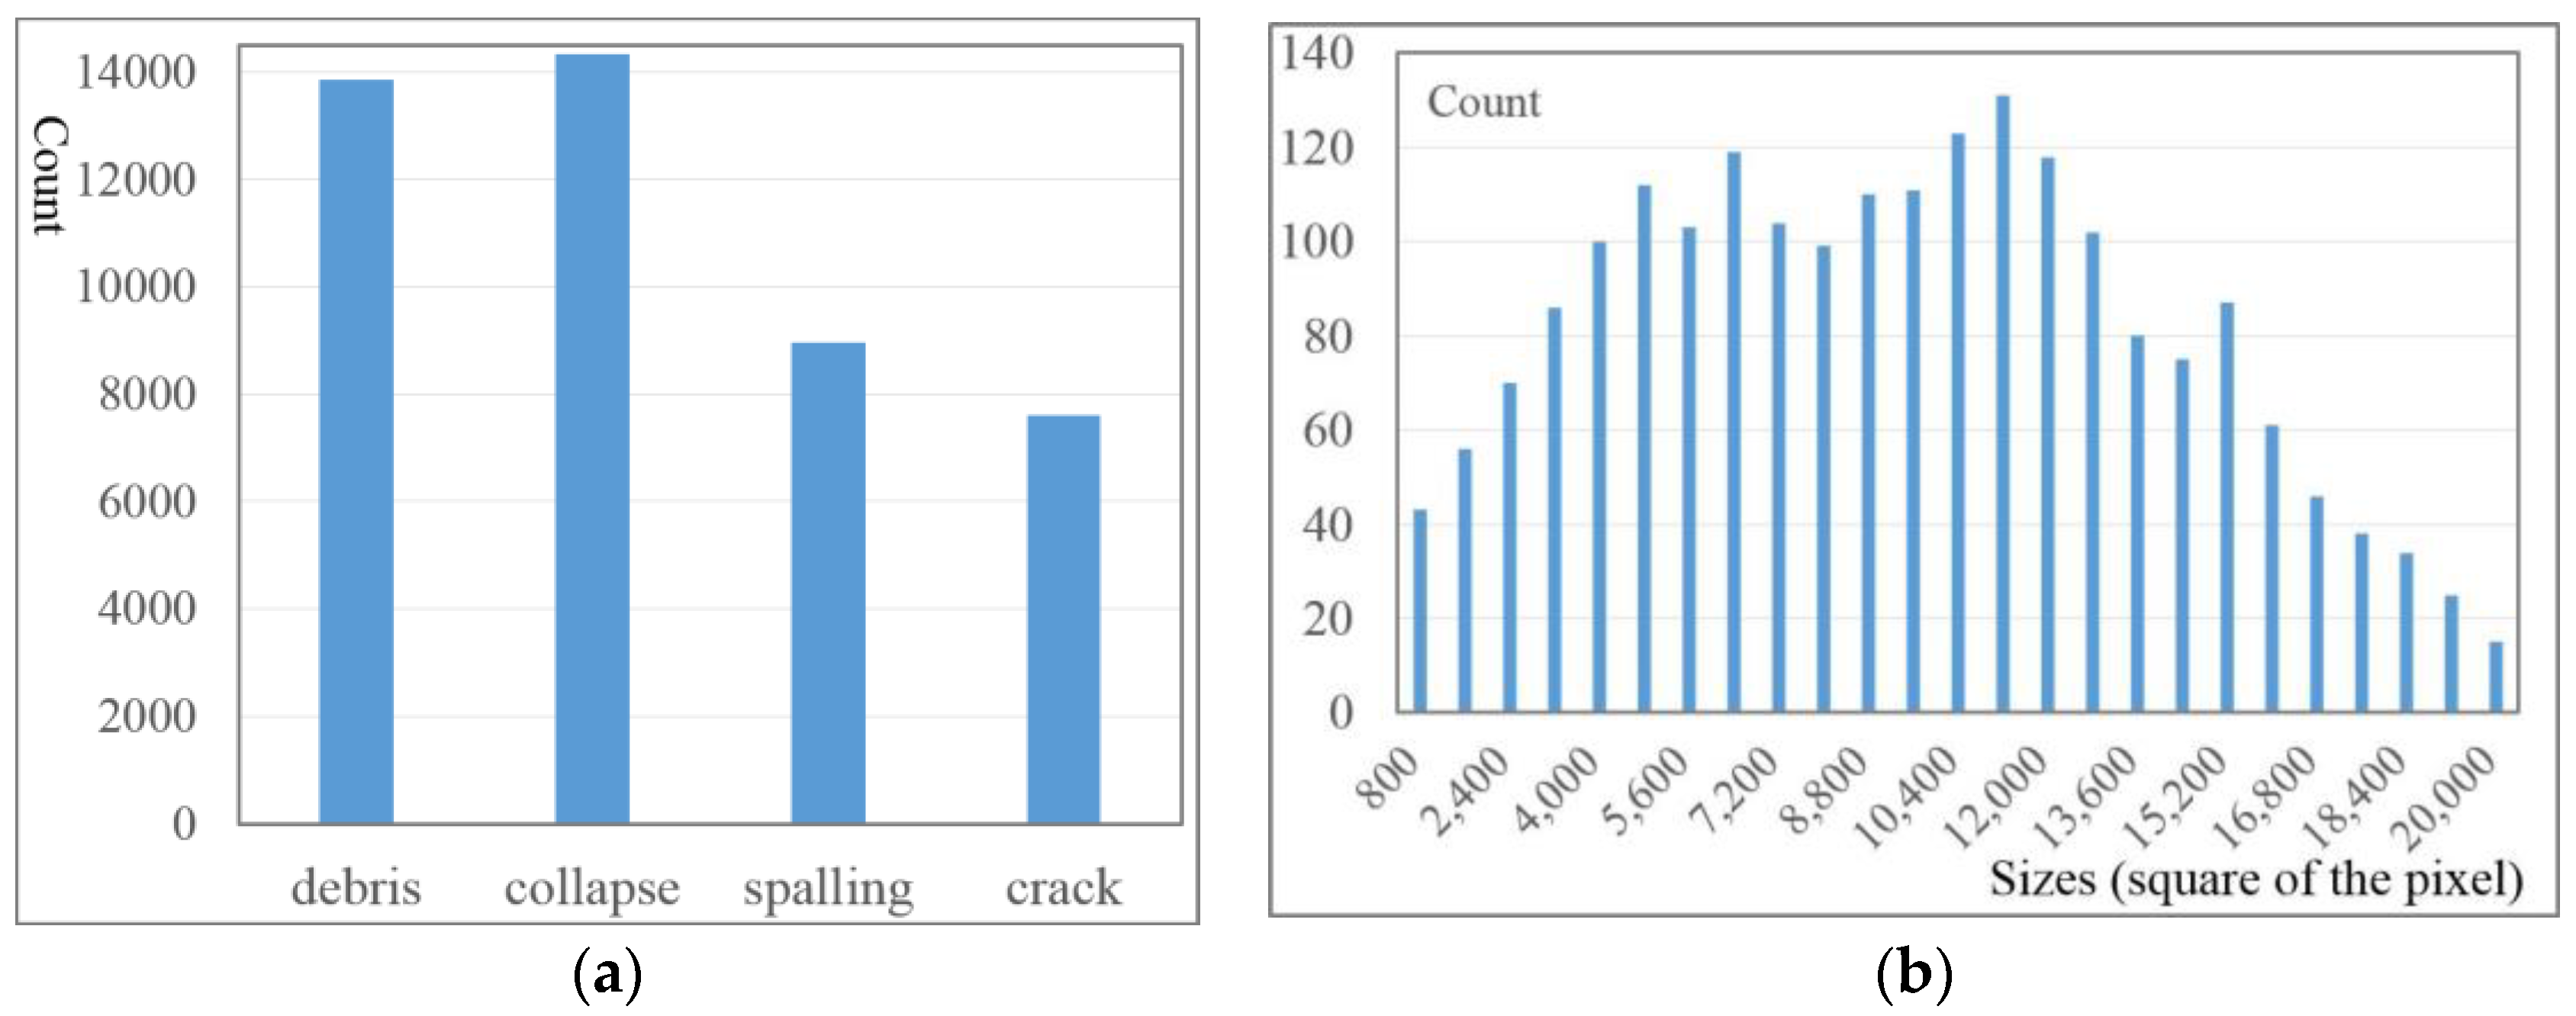
- A ground-level building damage dataset of considerable data volume was created from terrestrial images, which cover a wide variety of types of building damage so as to facilitate future detailed damage analysis of buildings.
- (2)
- Ghost bottleneck and CBAM modules are introduced into the backbone of YOLOv5, and DSConv and BiFPN are introduced into the neck module of YOLOv5 to accelerate the damage detection efficiency and enhance the damage features.
- (3)
- One prototype system is designed and implemented based on the proposed lightweight LA-YOLOv5 model. It can be used for real-time damage detection from smartphone or camera images. Importantly, the proposed model can be embedded into smartphones or other ground terminals in the future, which is convenient for ground investigators to conduct building damage investigation.
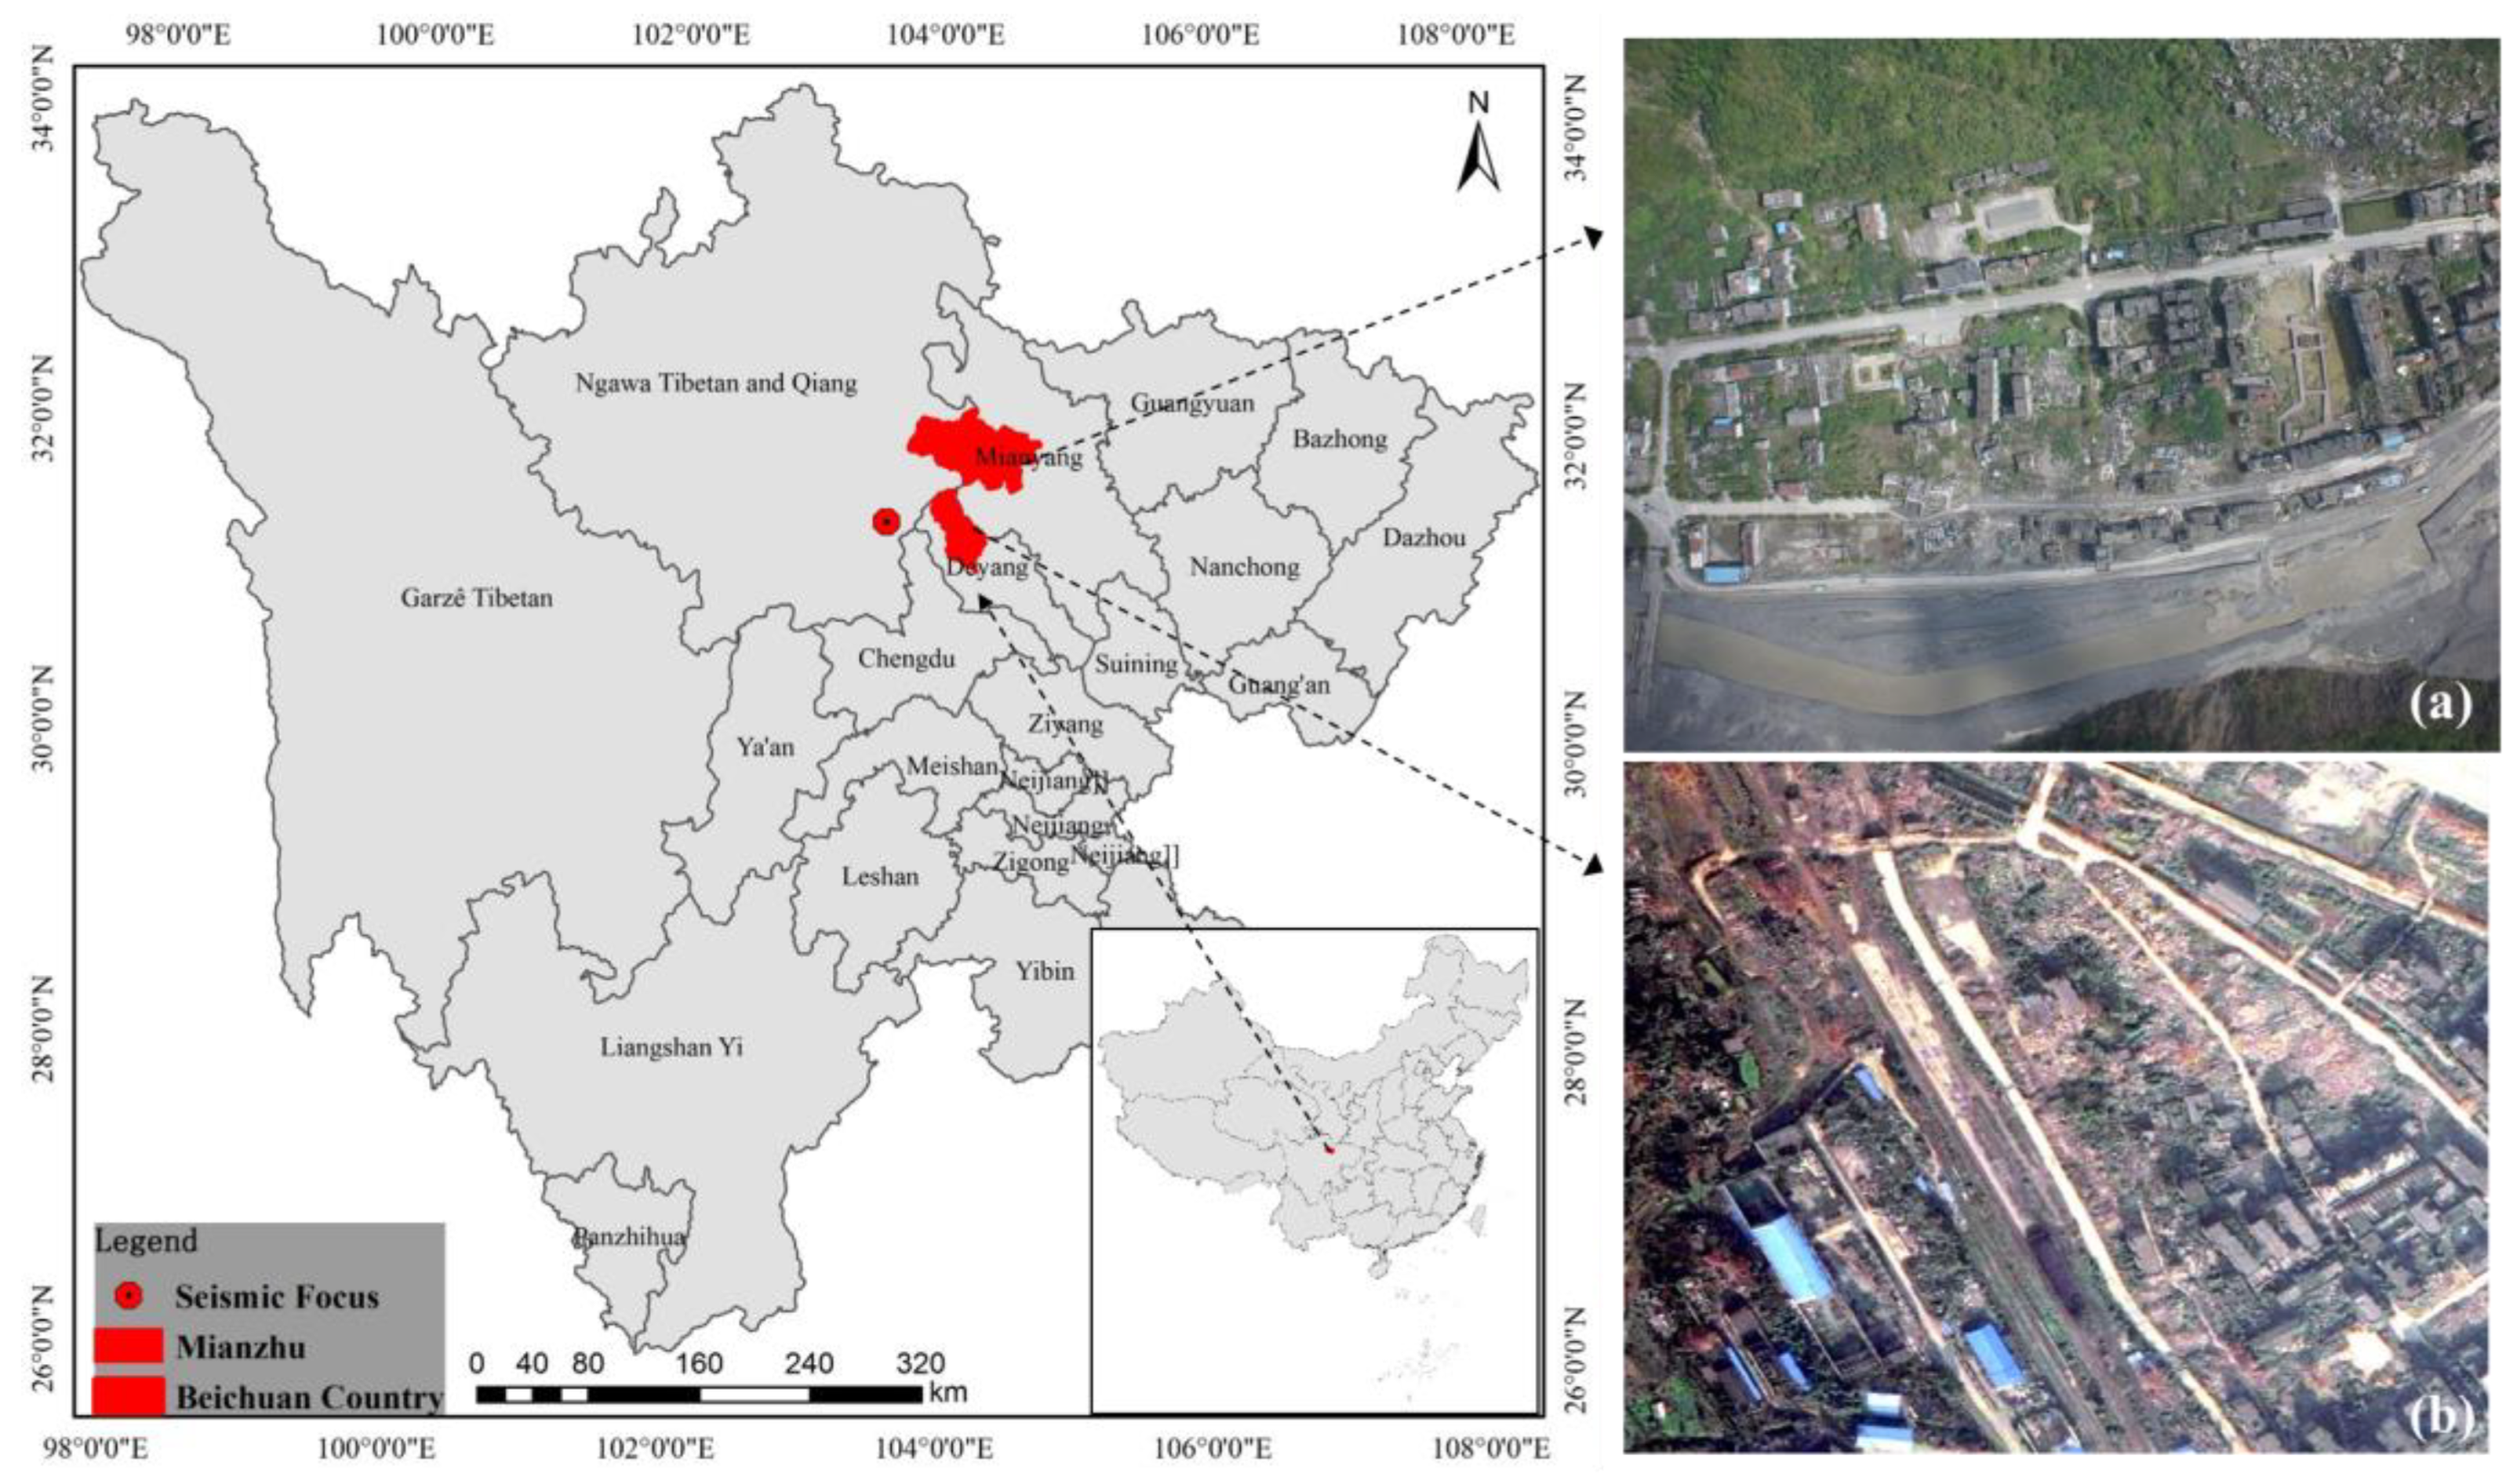
2. Study Area and Data Source
3. Methodology
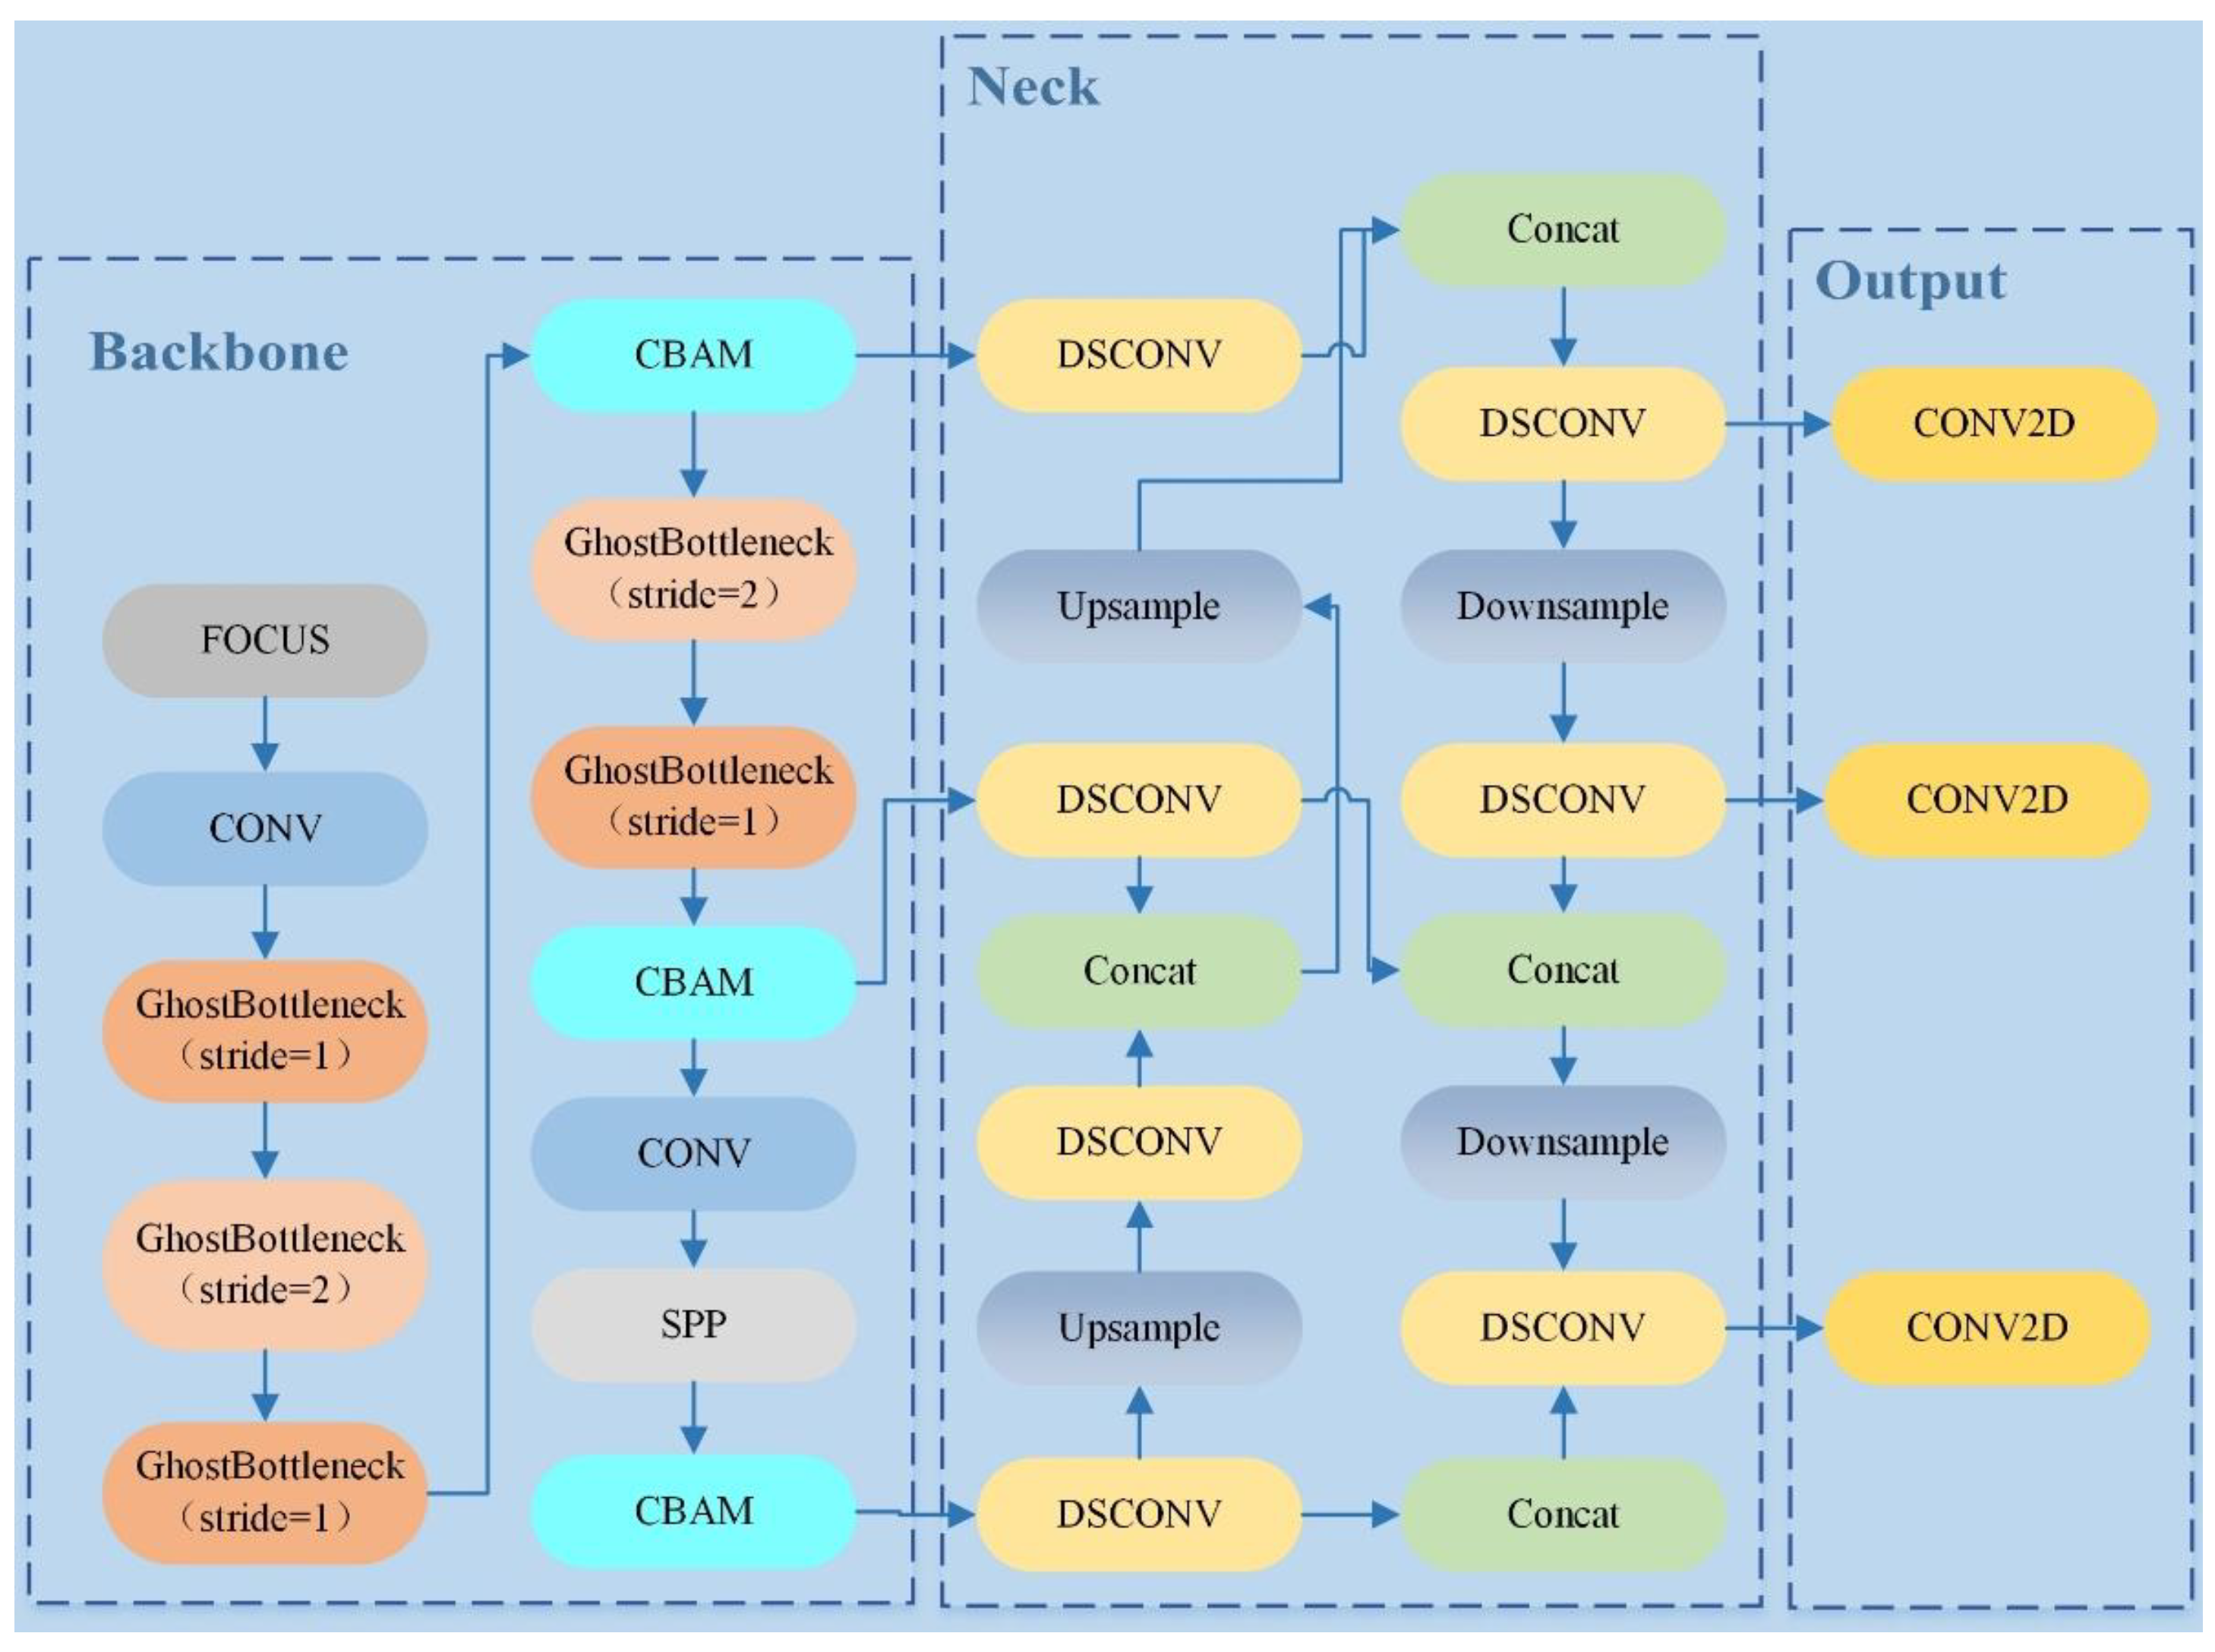
3.1. Overview
3.2. Improvement of Backbone Network
3.2.1. Ghost Bottleneck
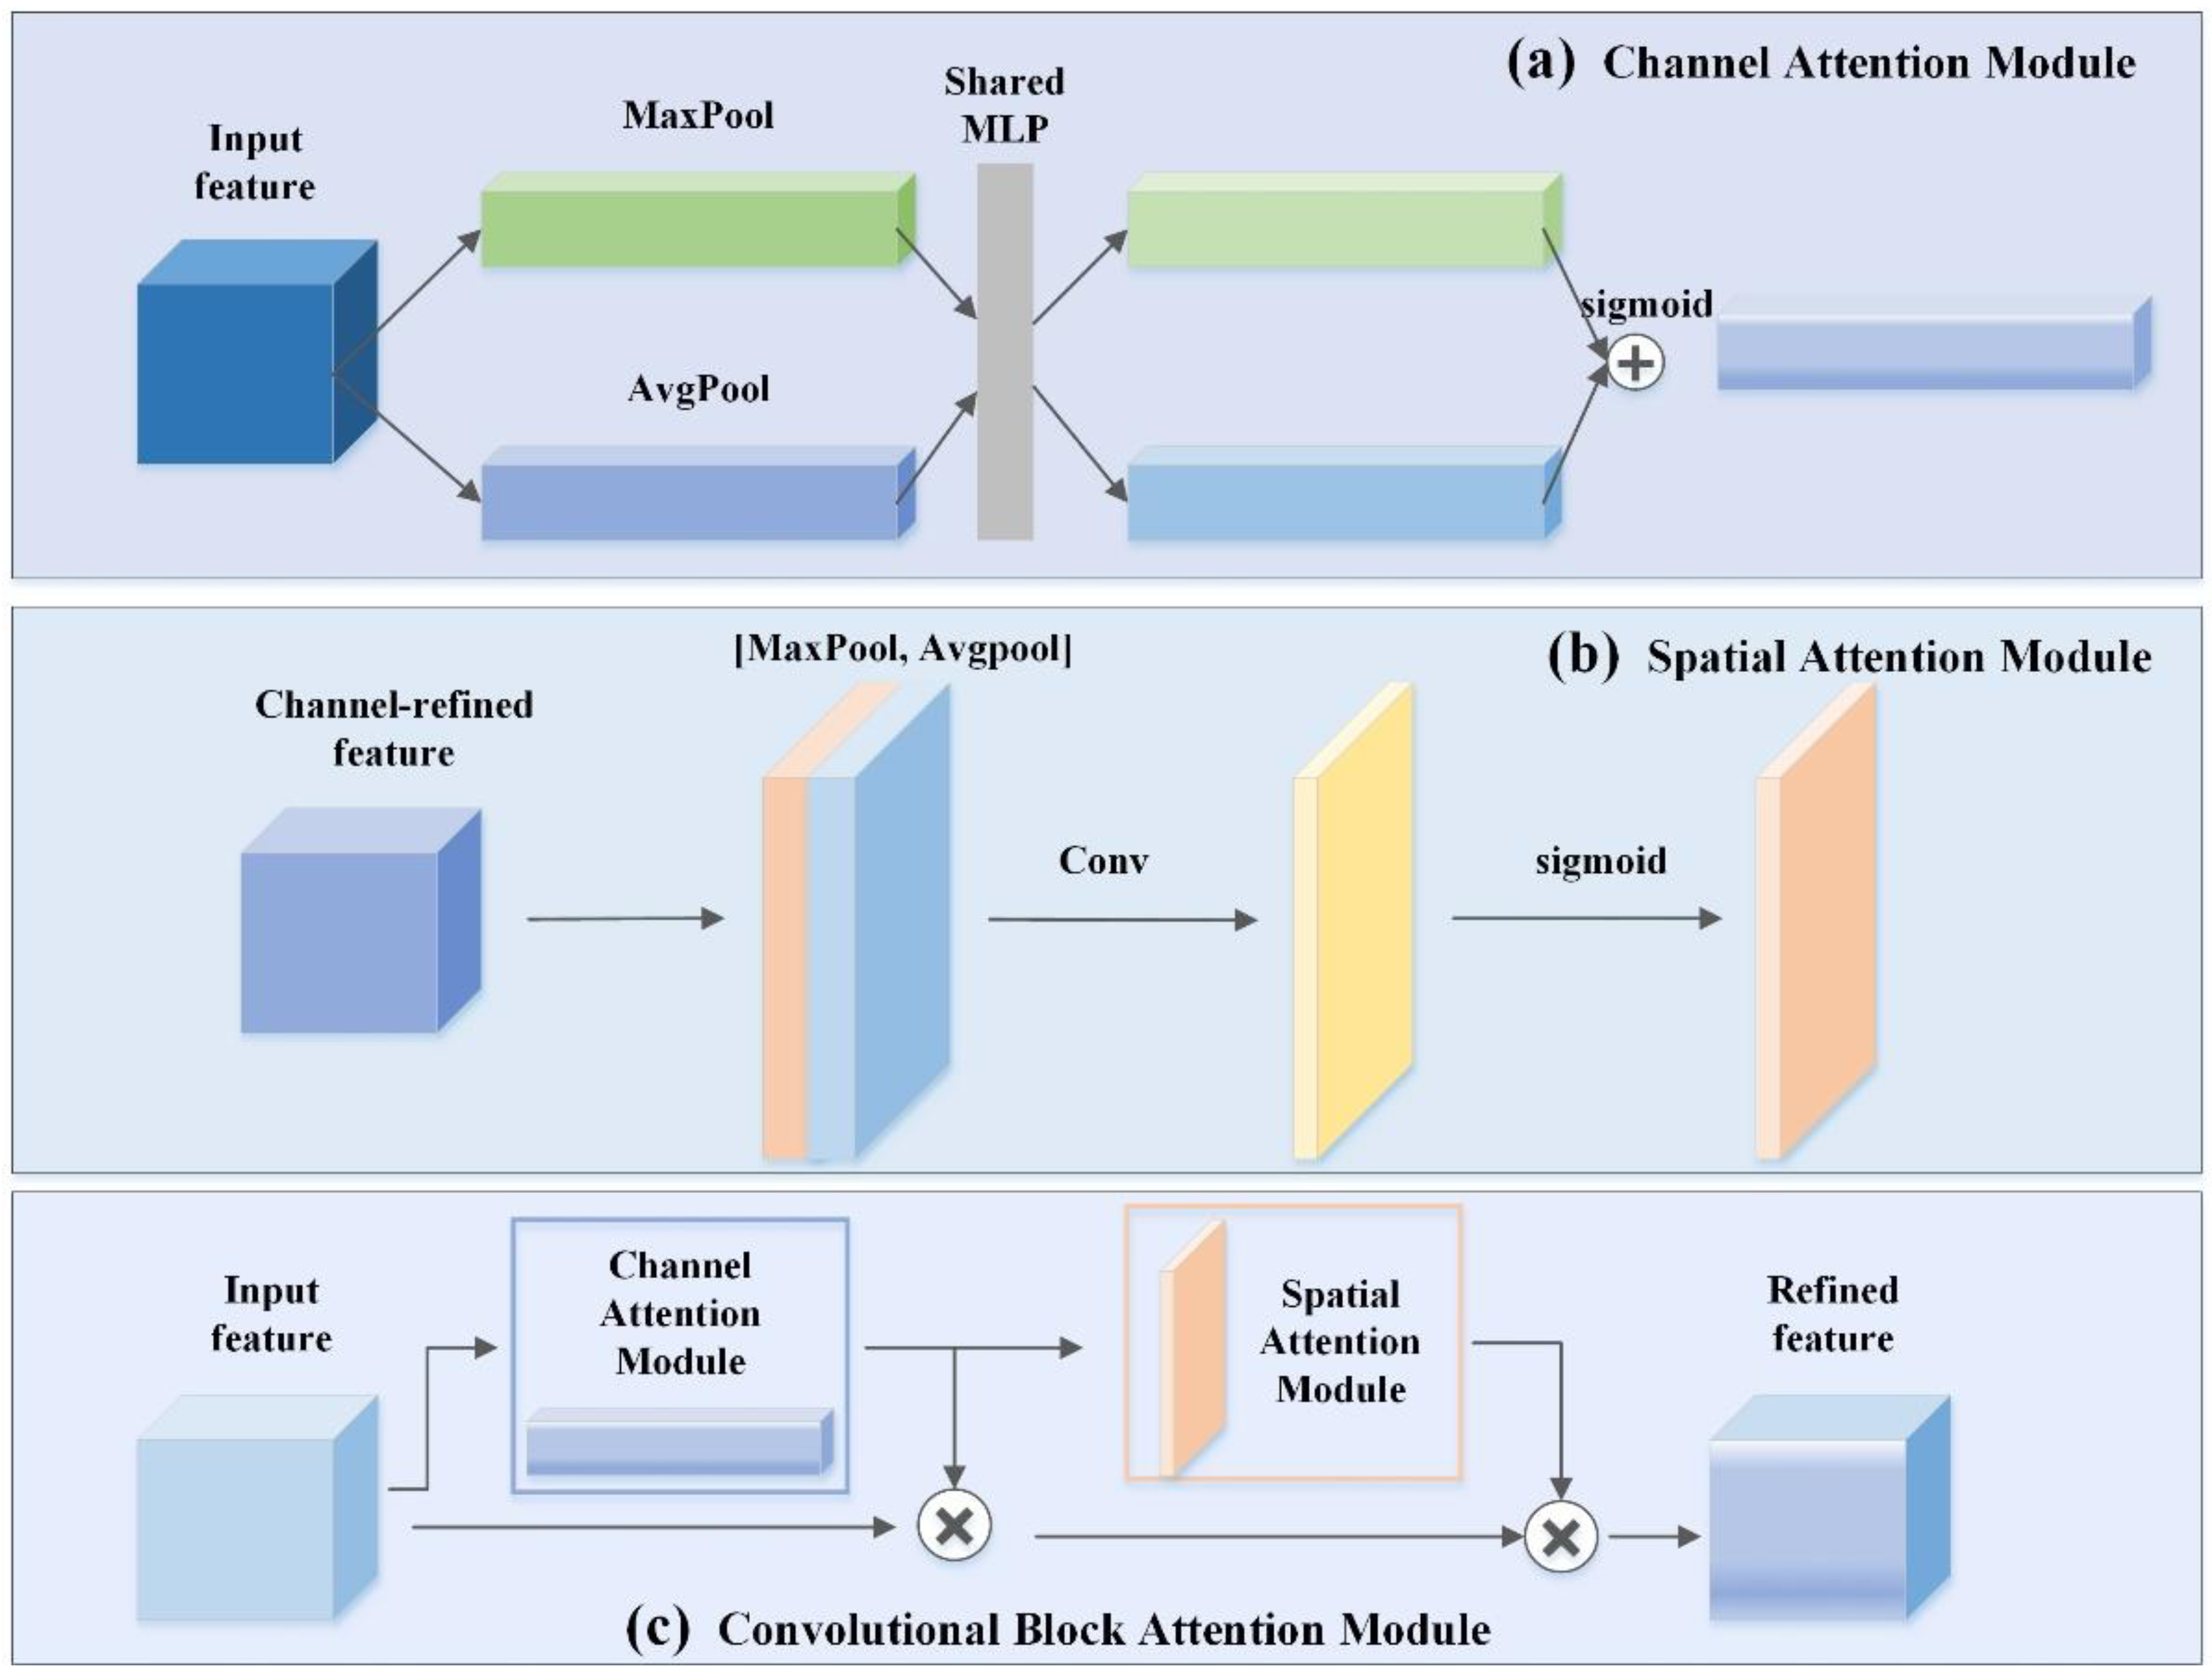
3.2.2. CBAM Module
3.3. Improvement of Neck Network
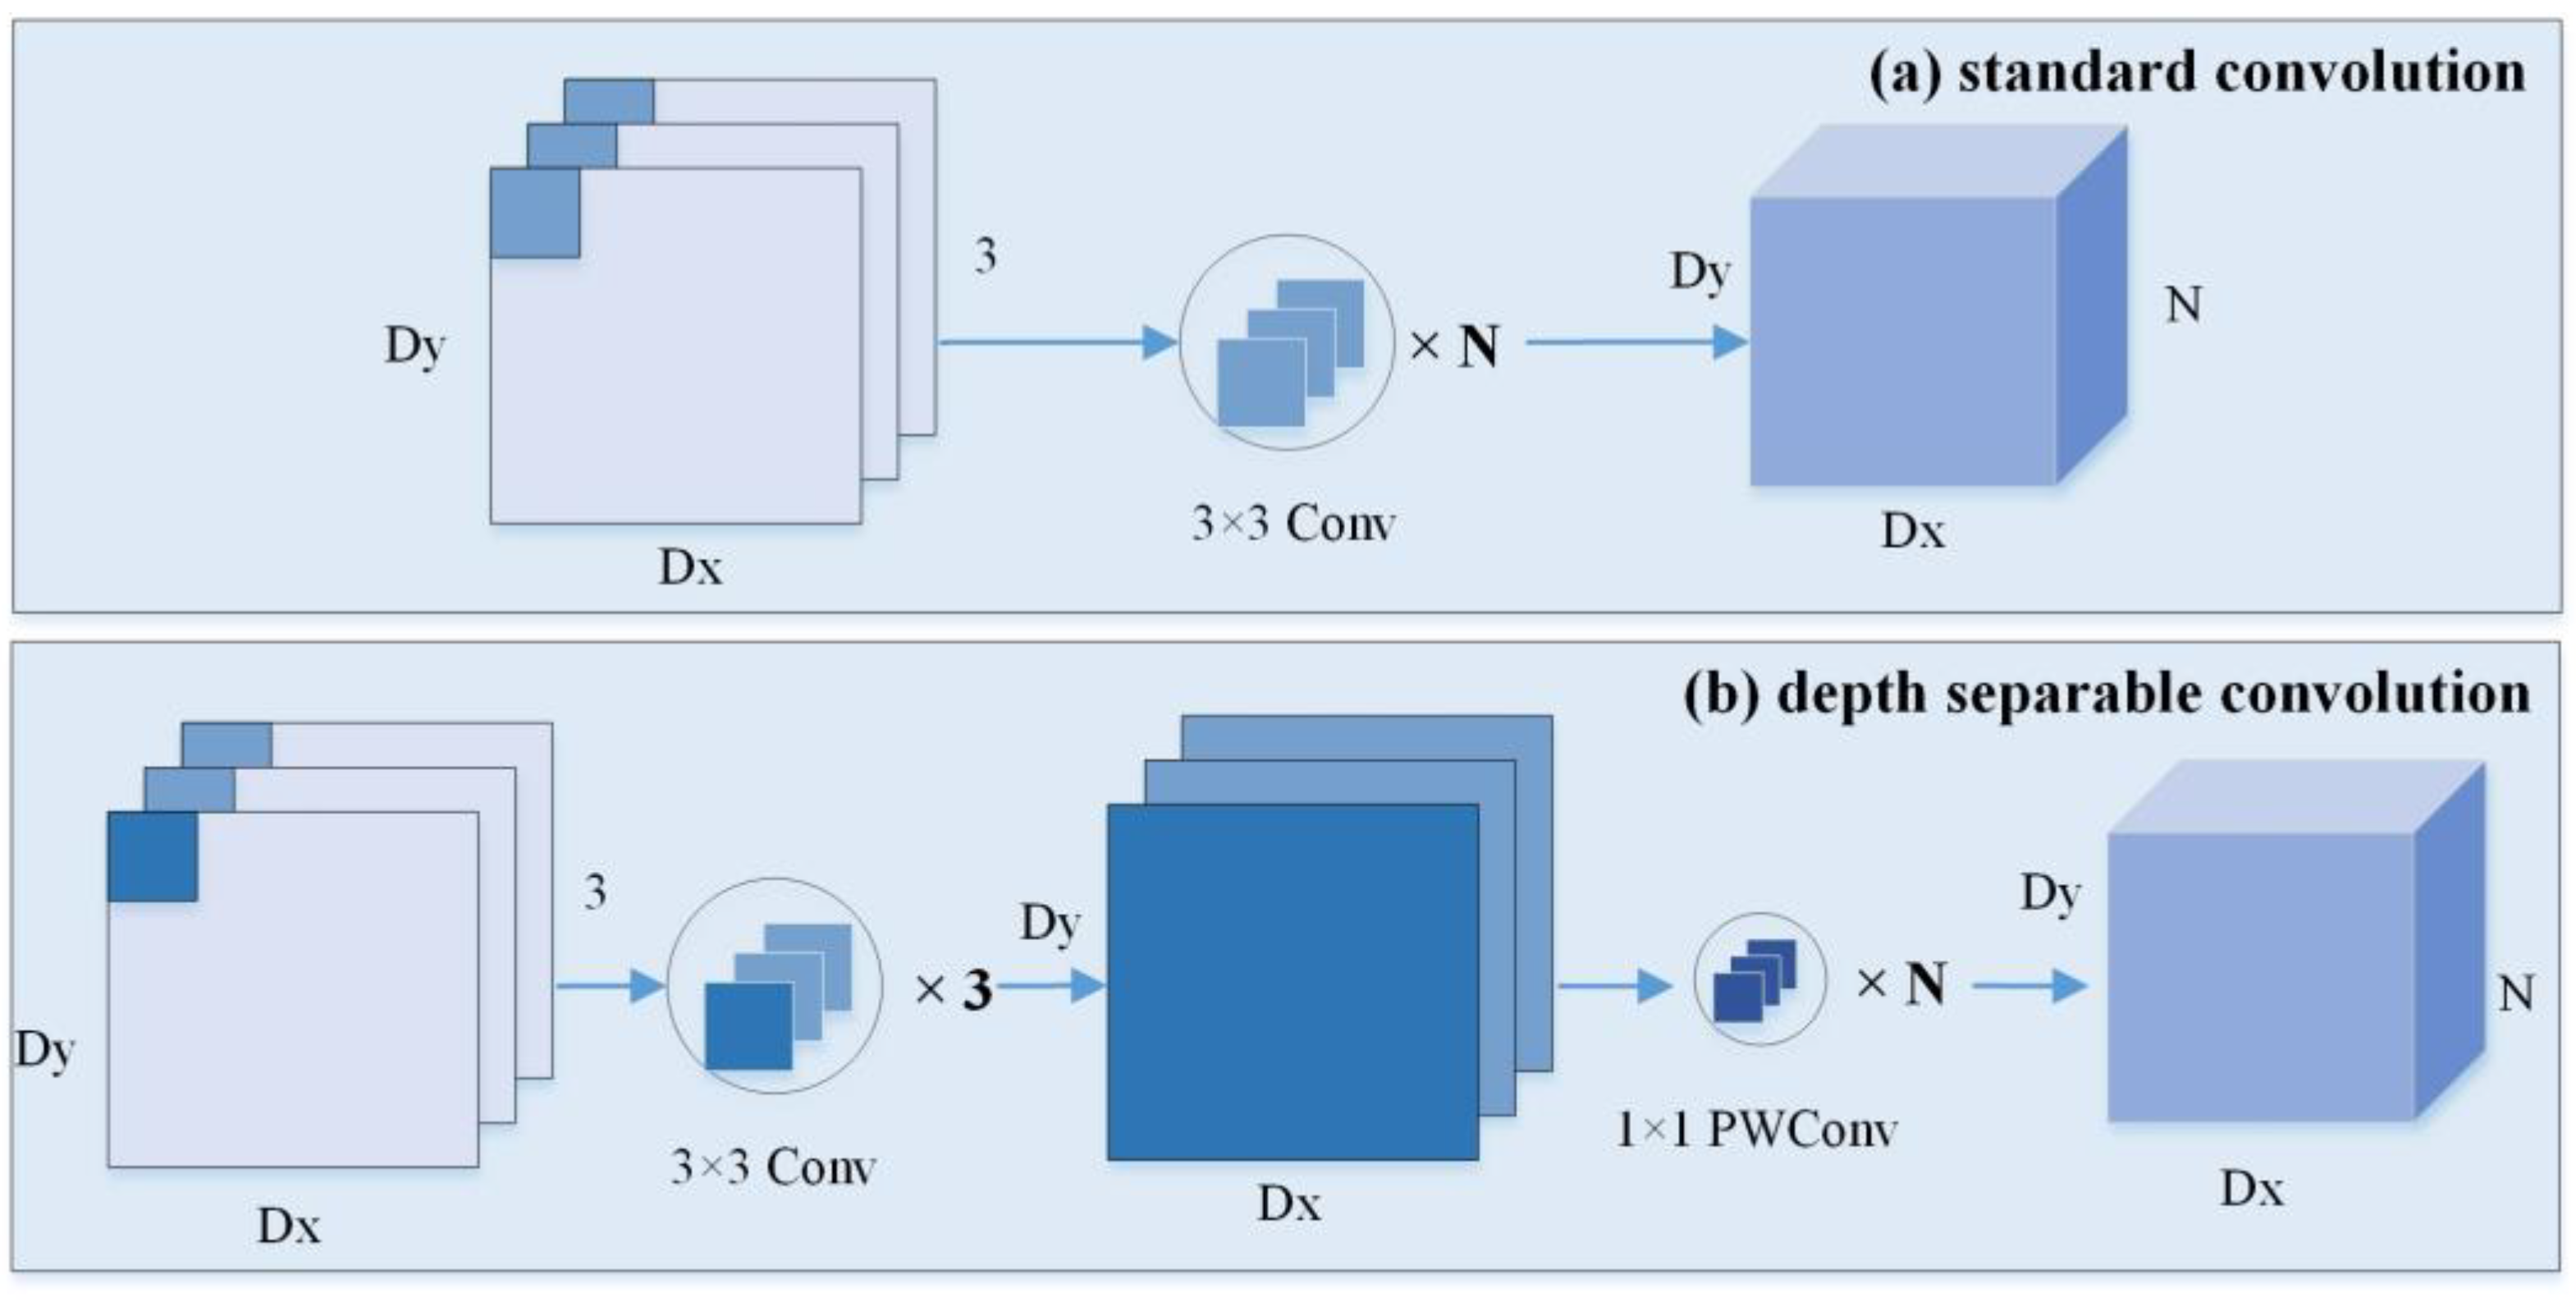
3.3.1. Deep Separable Convolution
3.3.2. Multi-Scale Feature Fusion Using Bi-FPN
4. Experimental Materials
4.1. Migration Network Initialization
4.2. Evaluation Metric
5. Result and Analysis
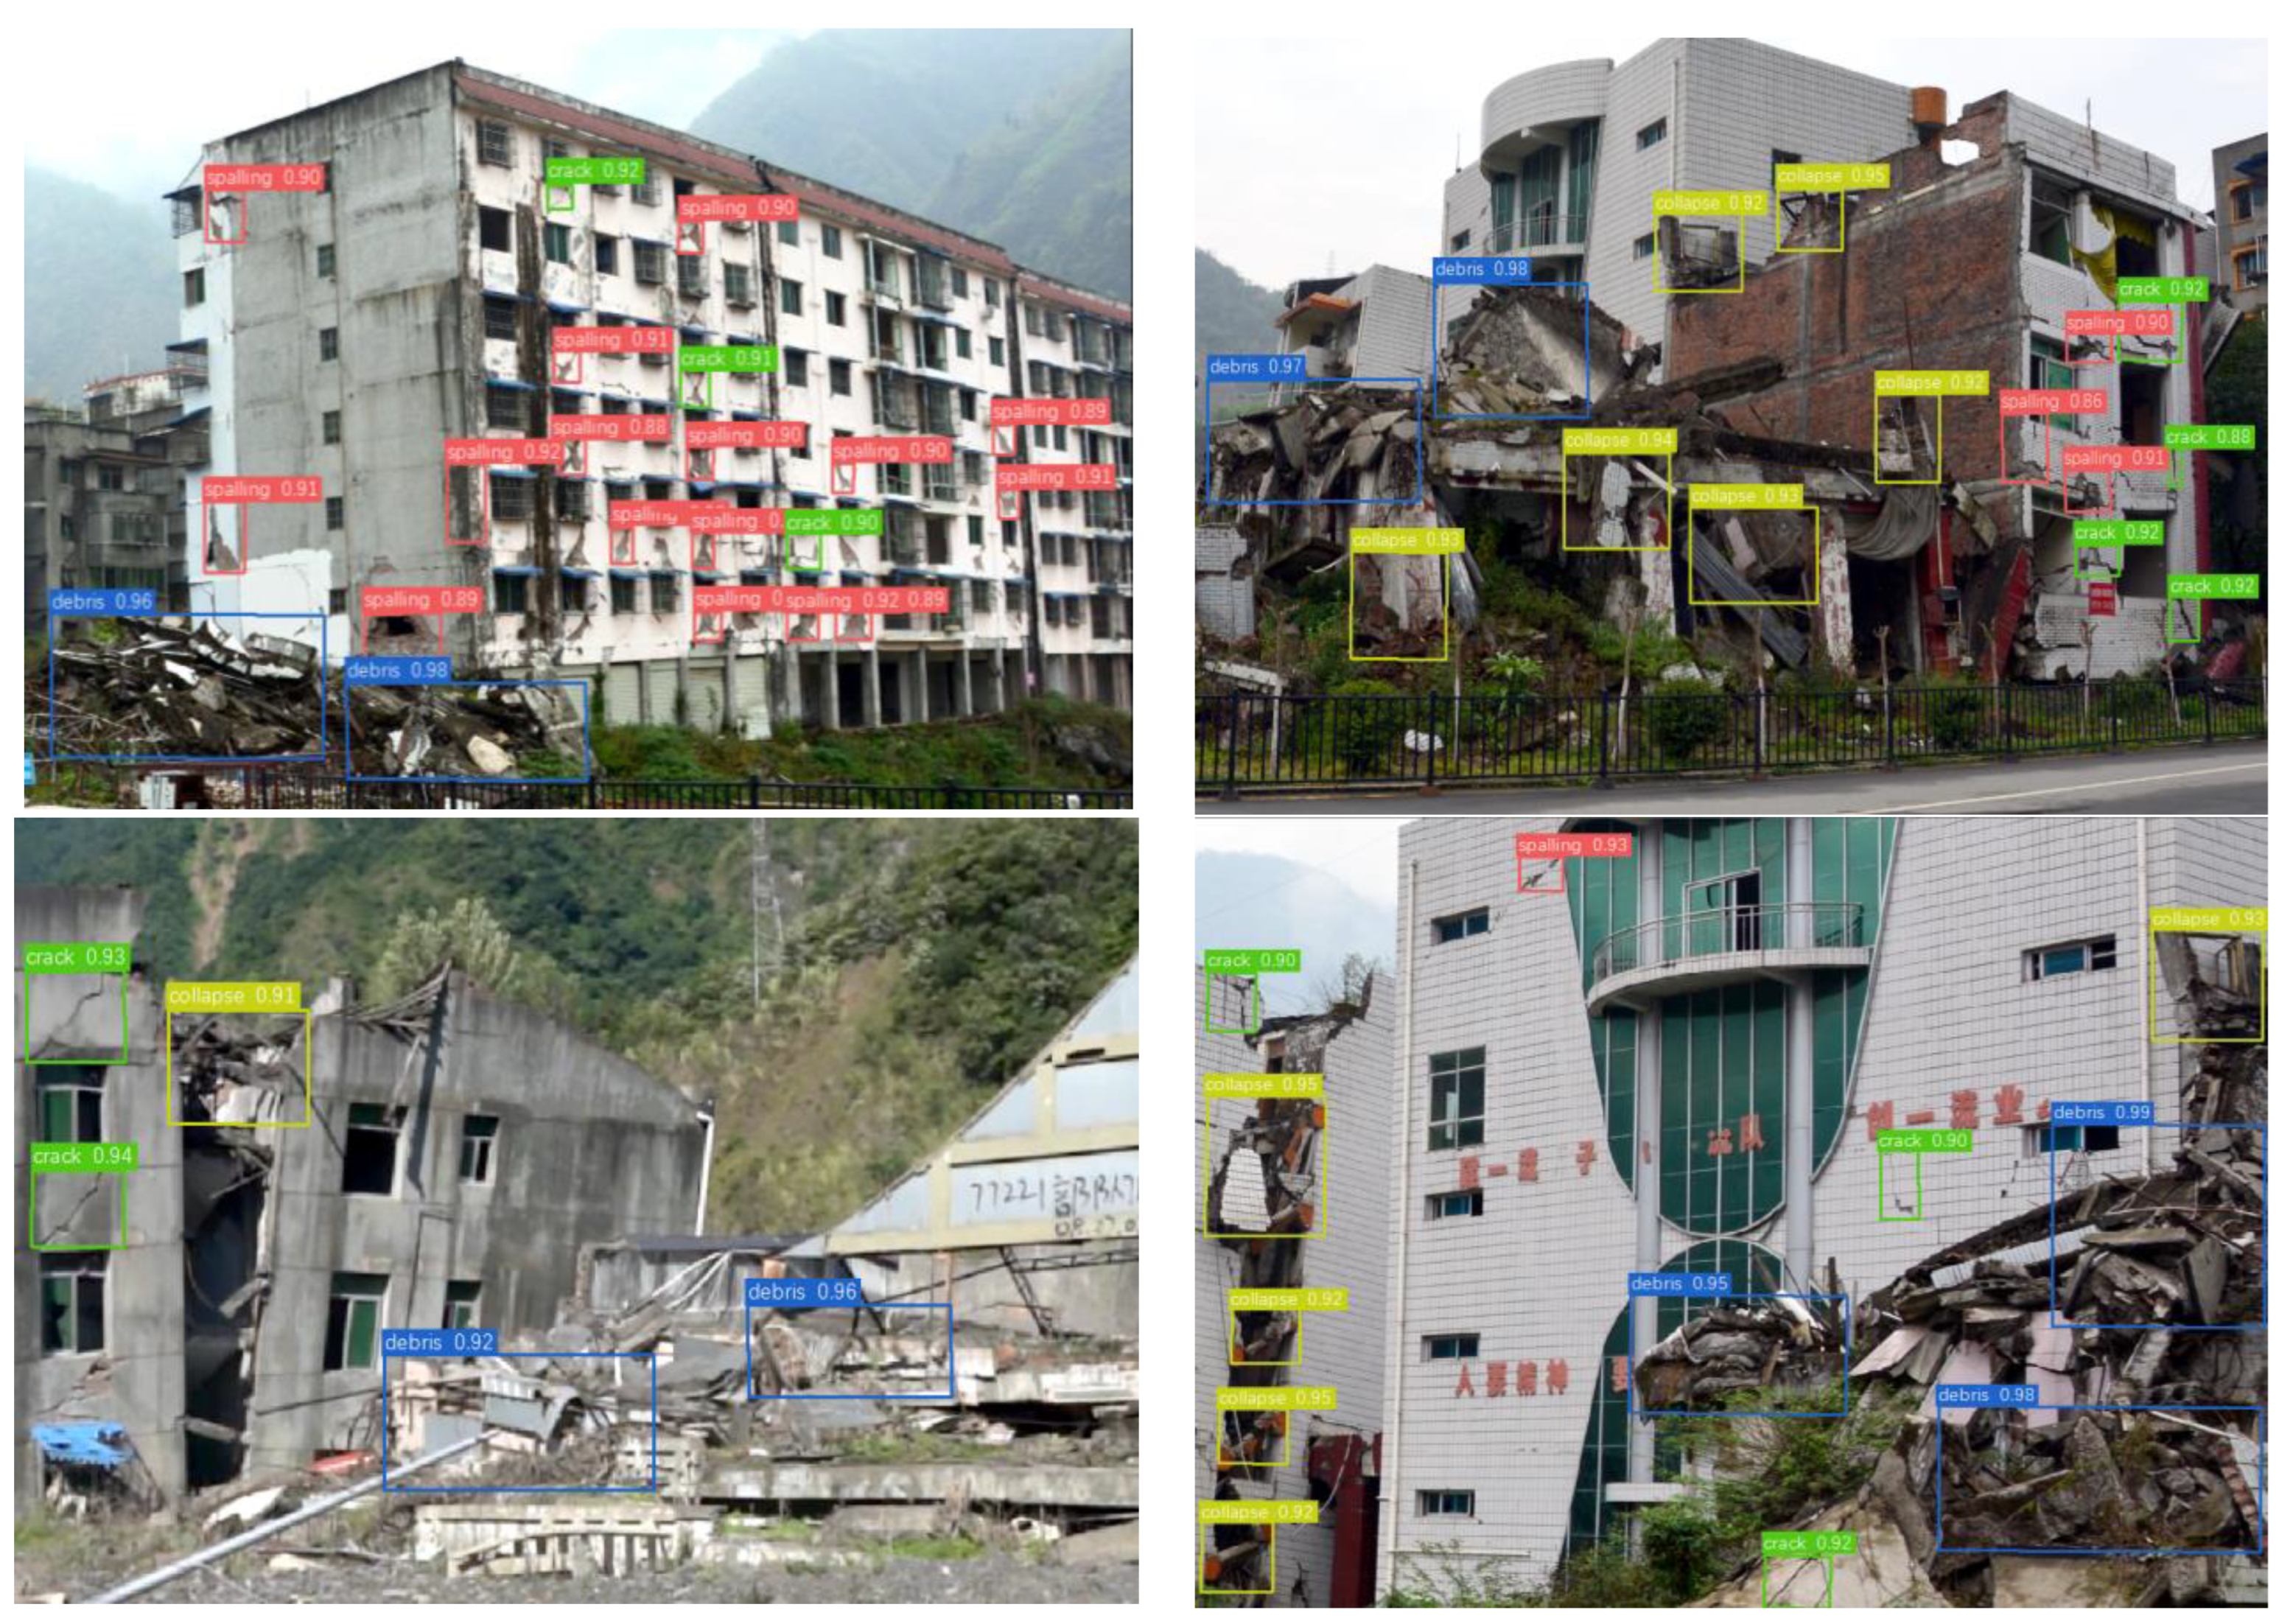
5.1. Detection Assessment for Different Damage Types
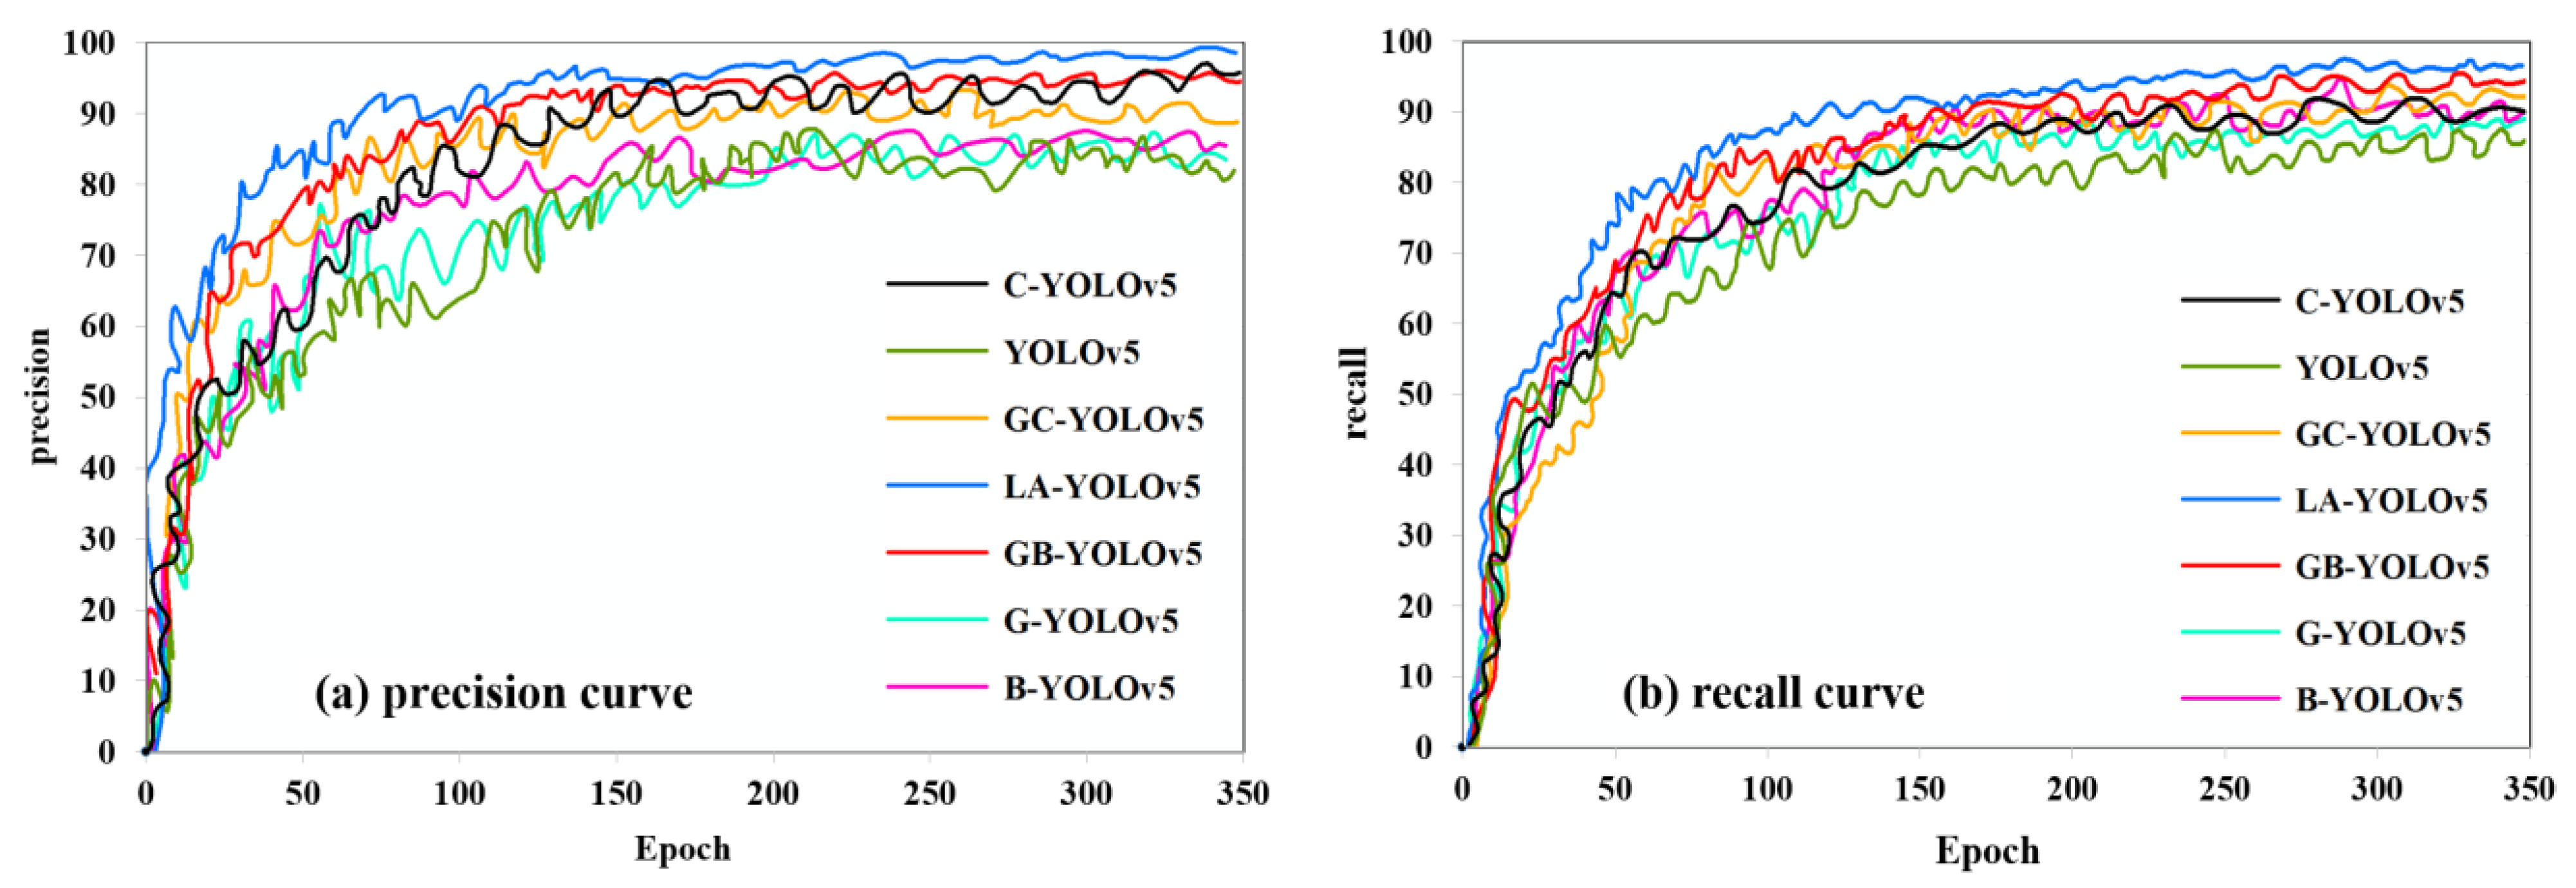
5.2. Ablation Experiments
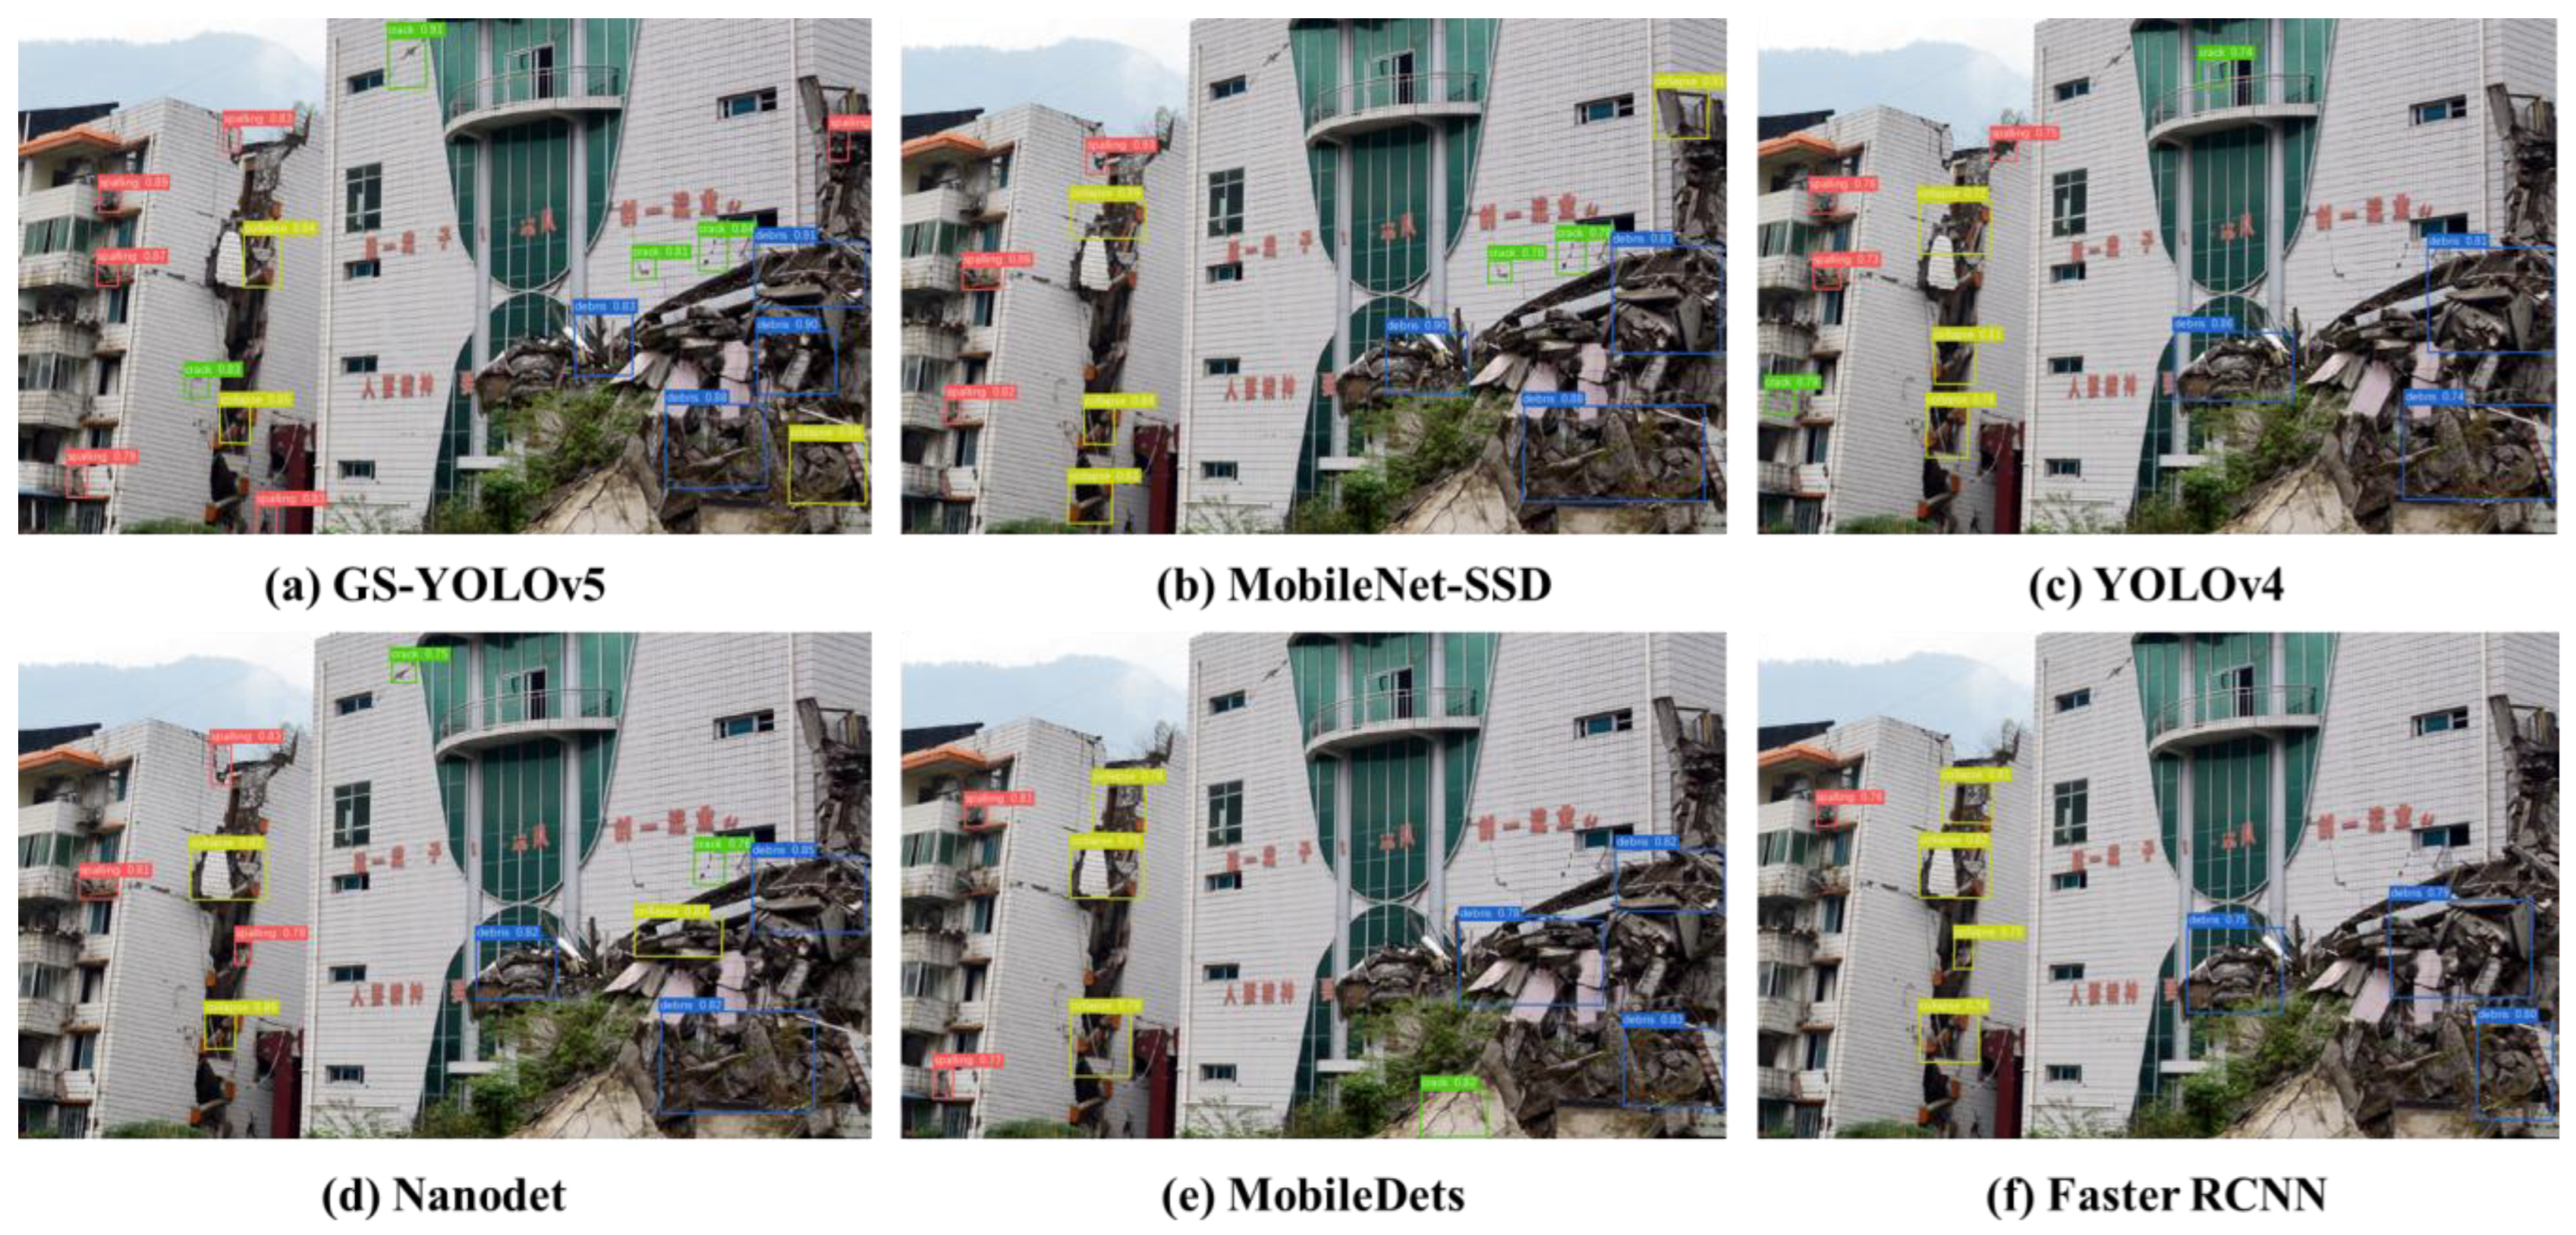
5.3. Comparison Analysis Using Different Models
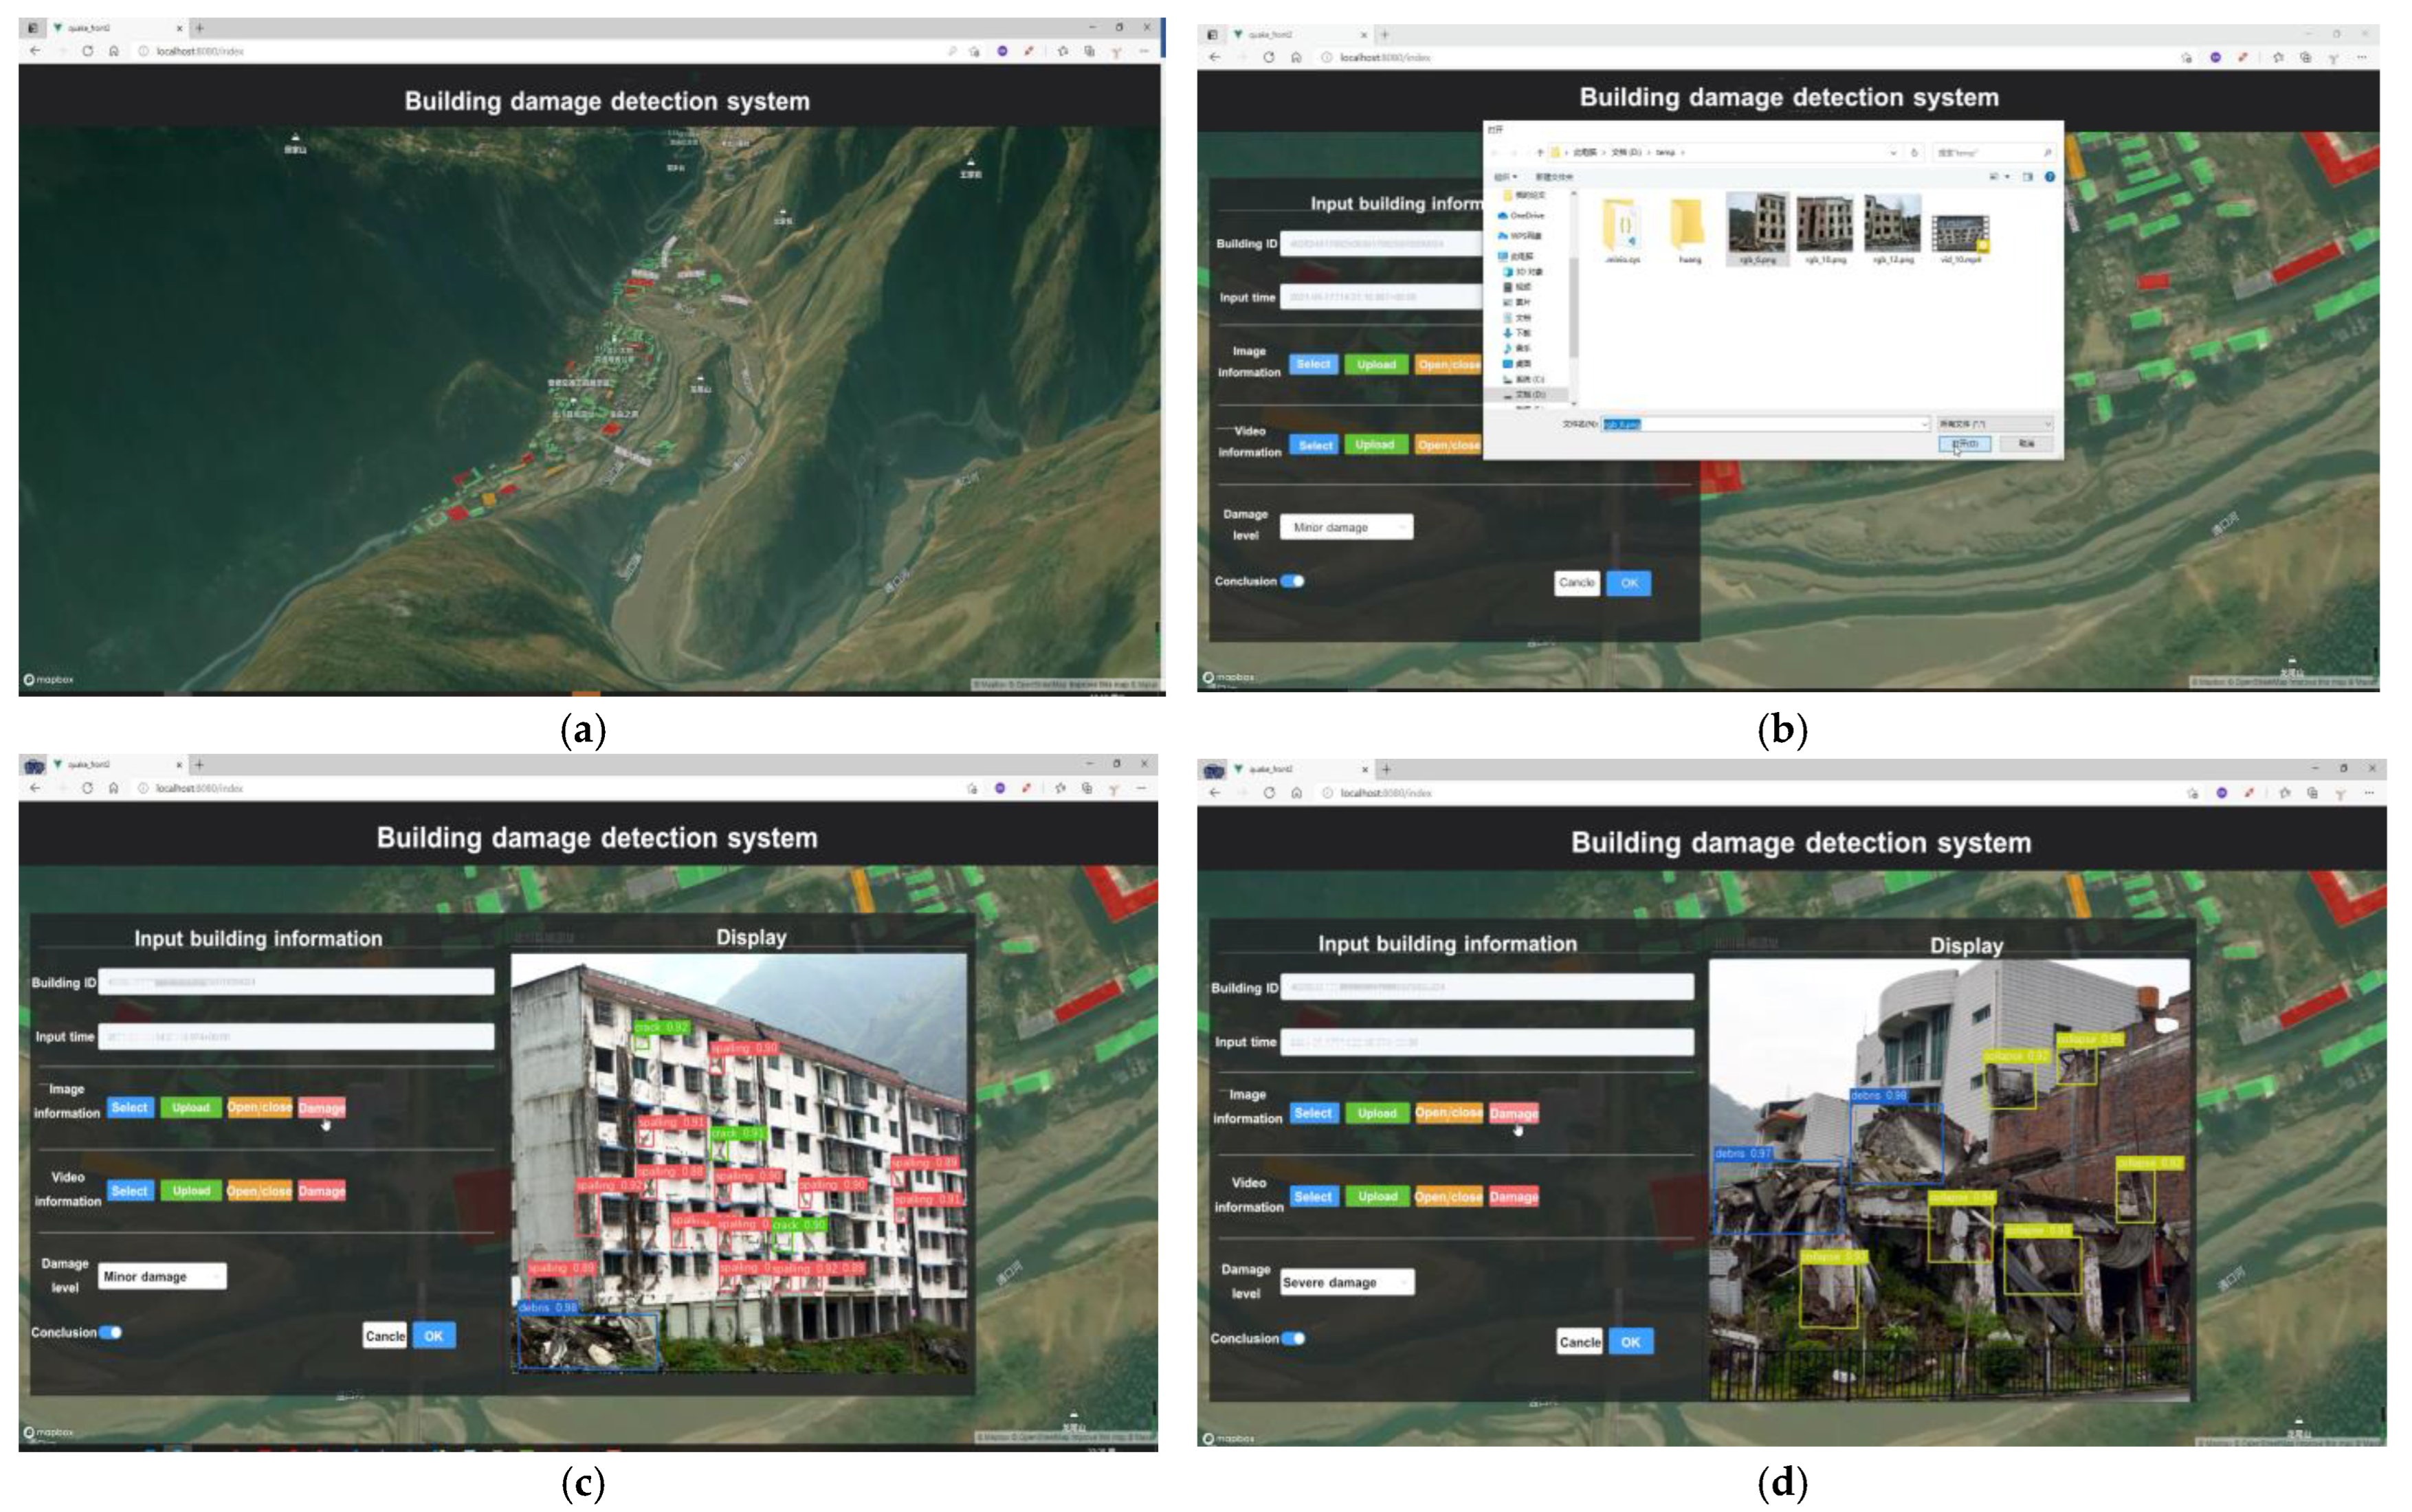
5.4. Validation Using a Prototype System
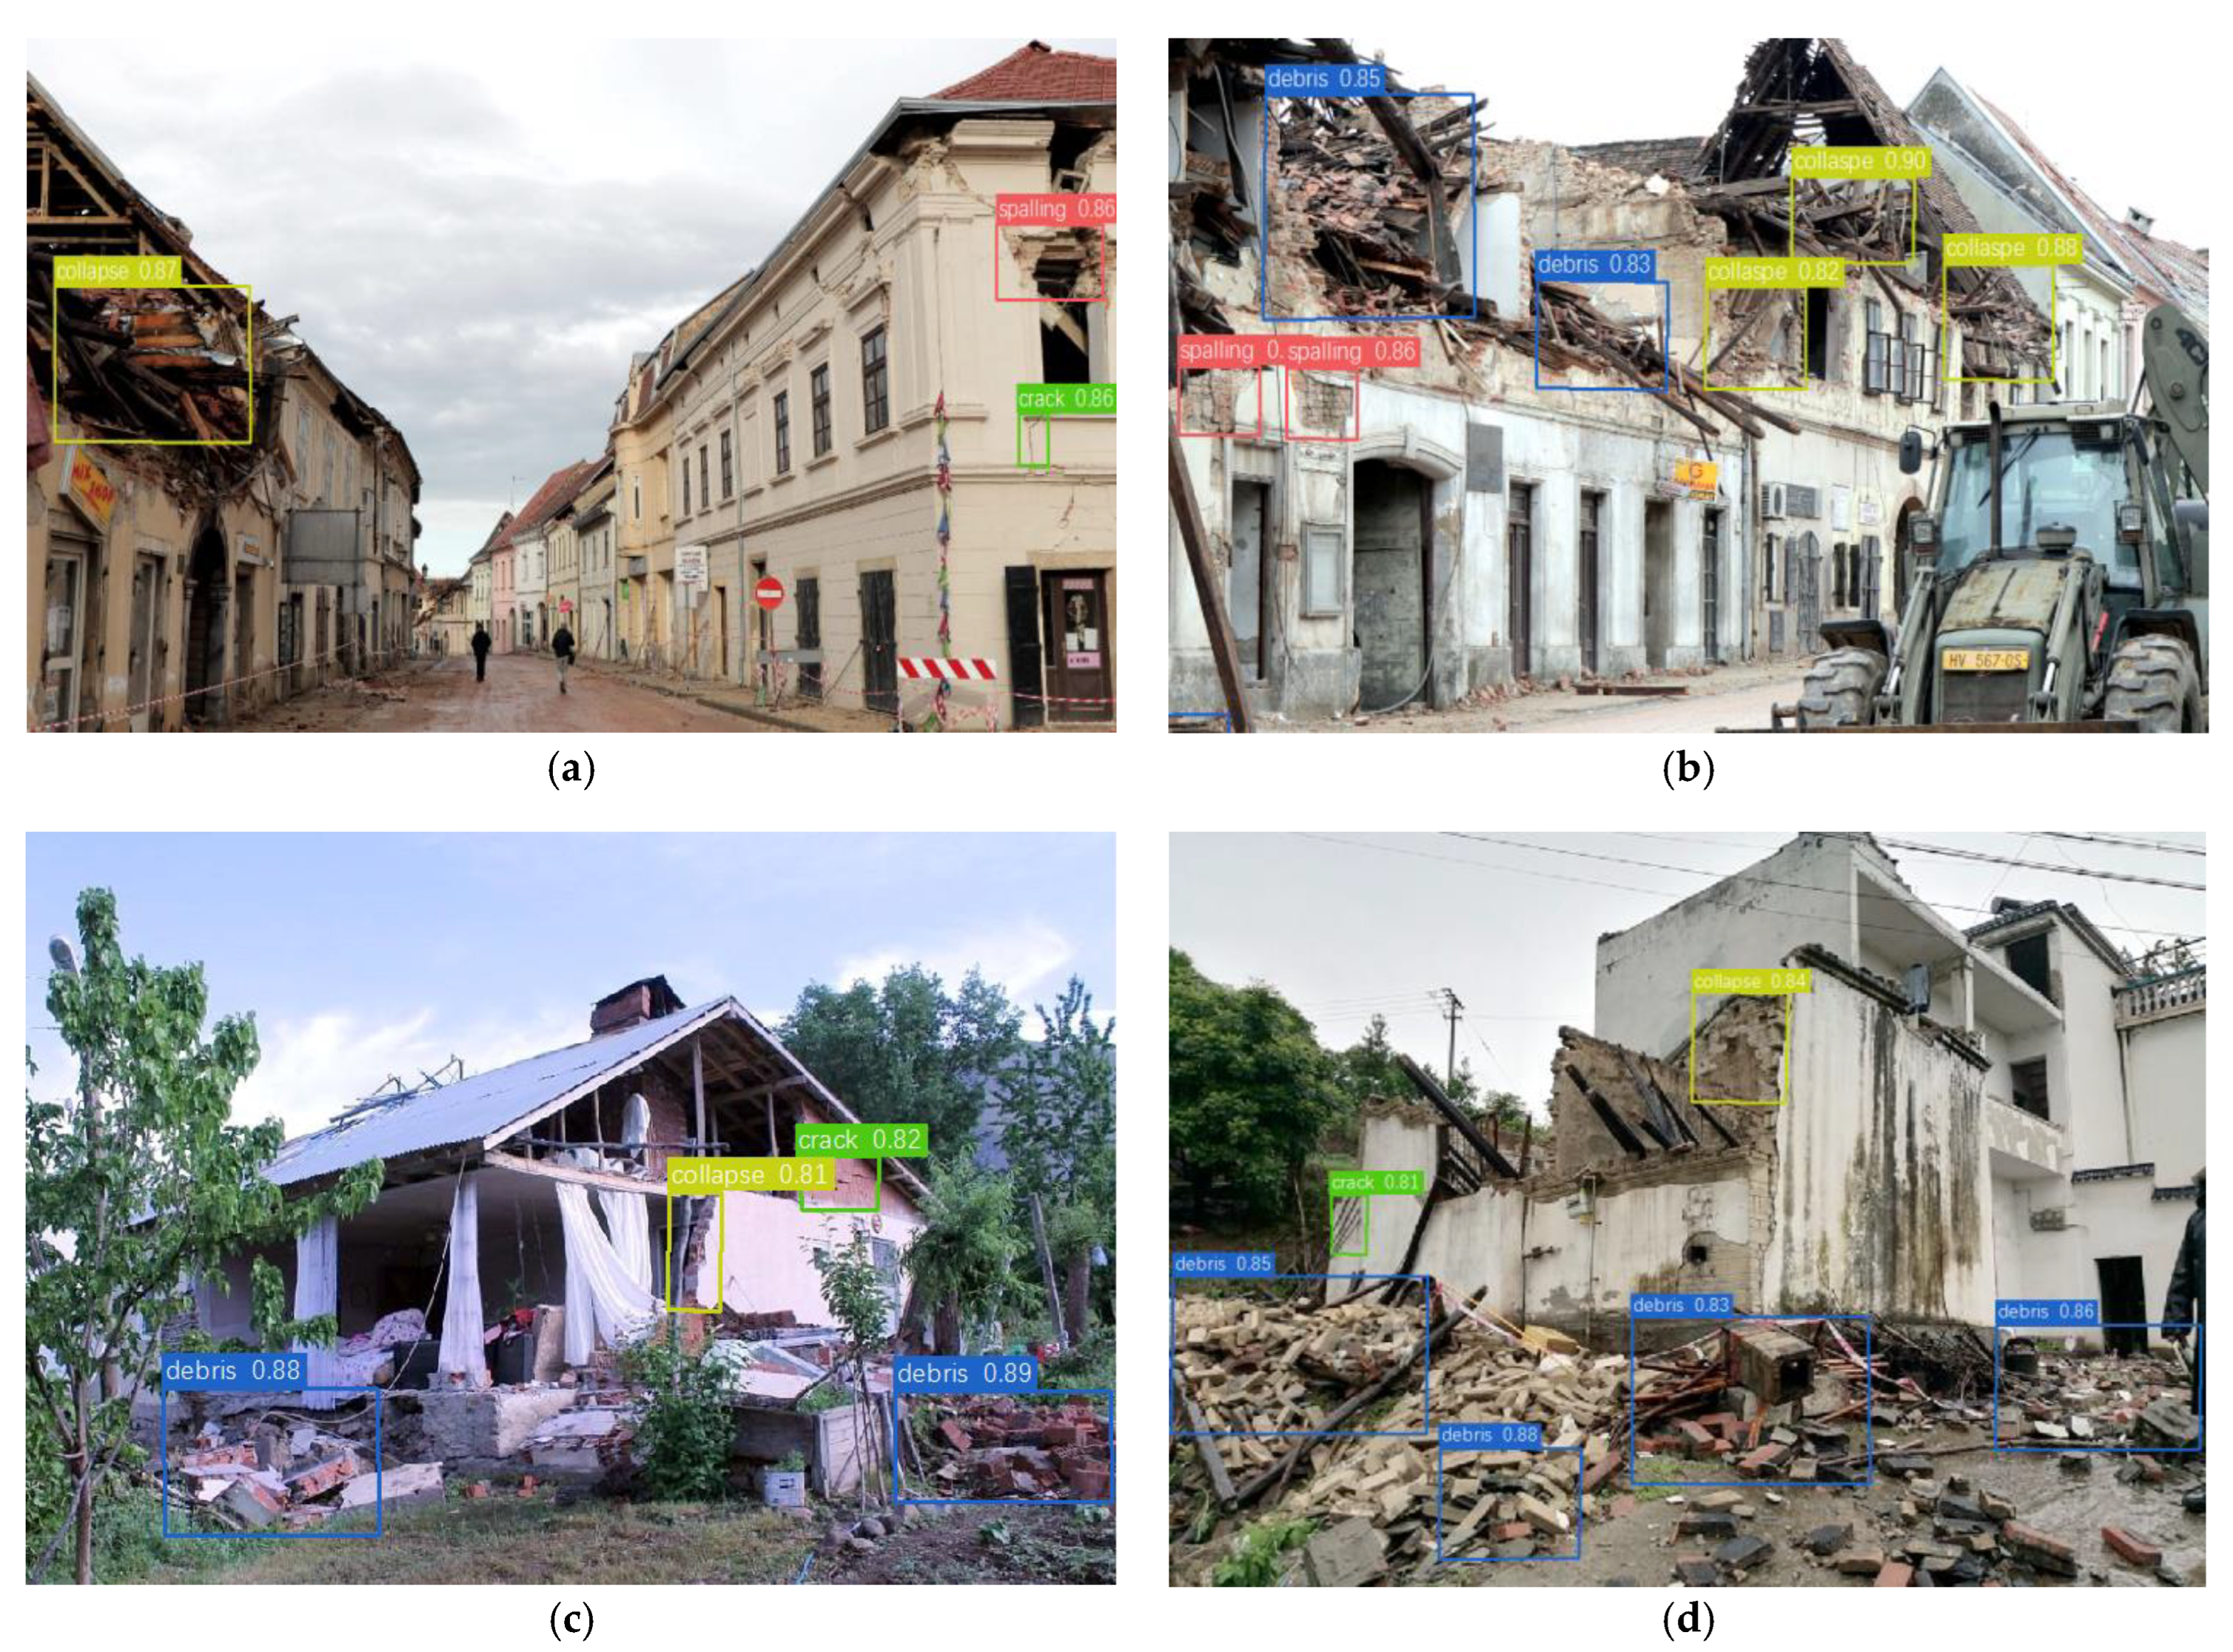
5.5. Analysis of Generalization Ability
6. Discussion
6.1. Analysis of Importance of Lightweight Model in Damage Detection
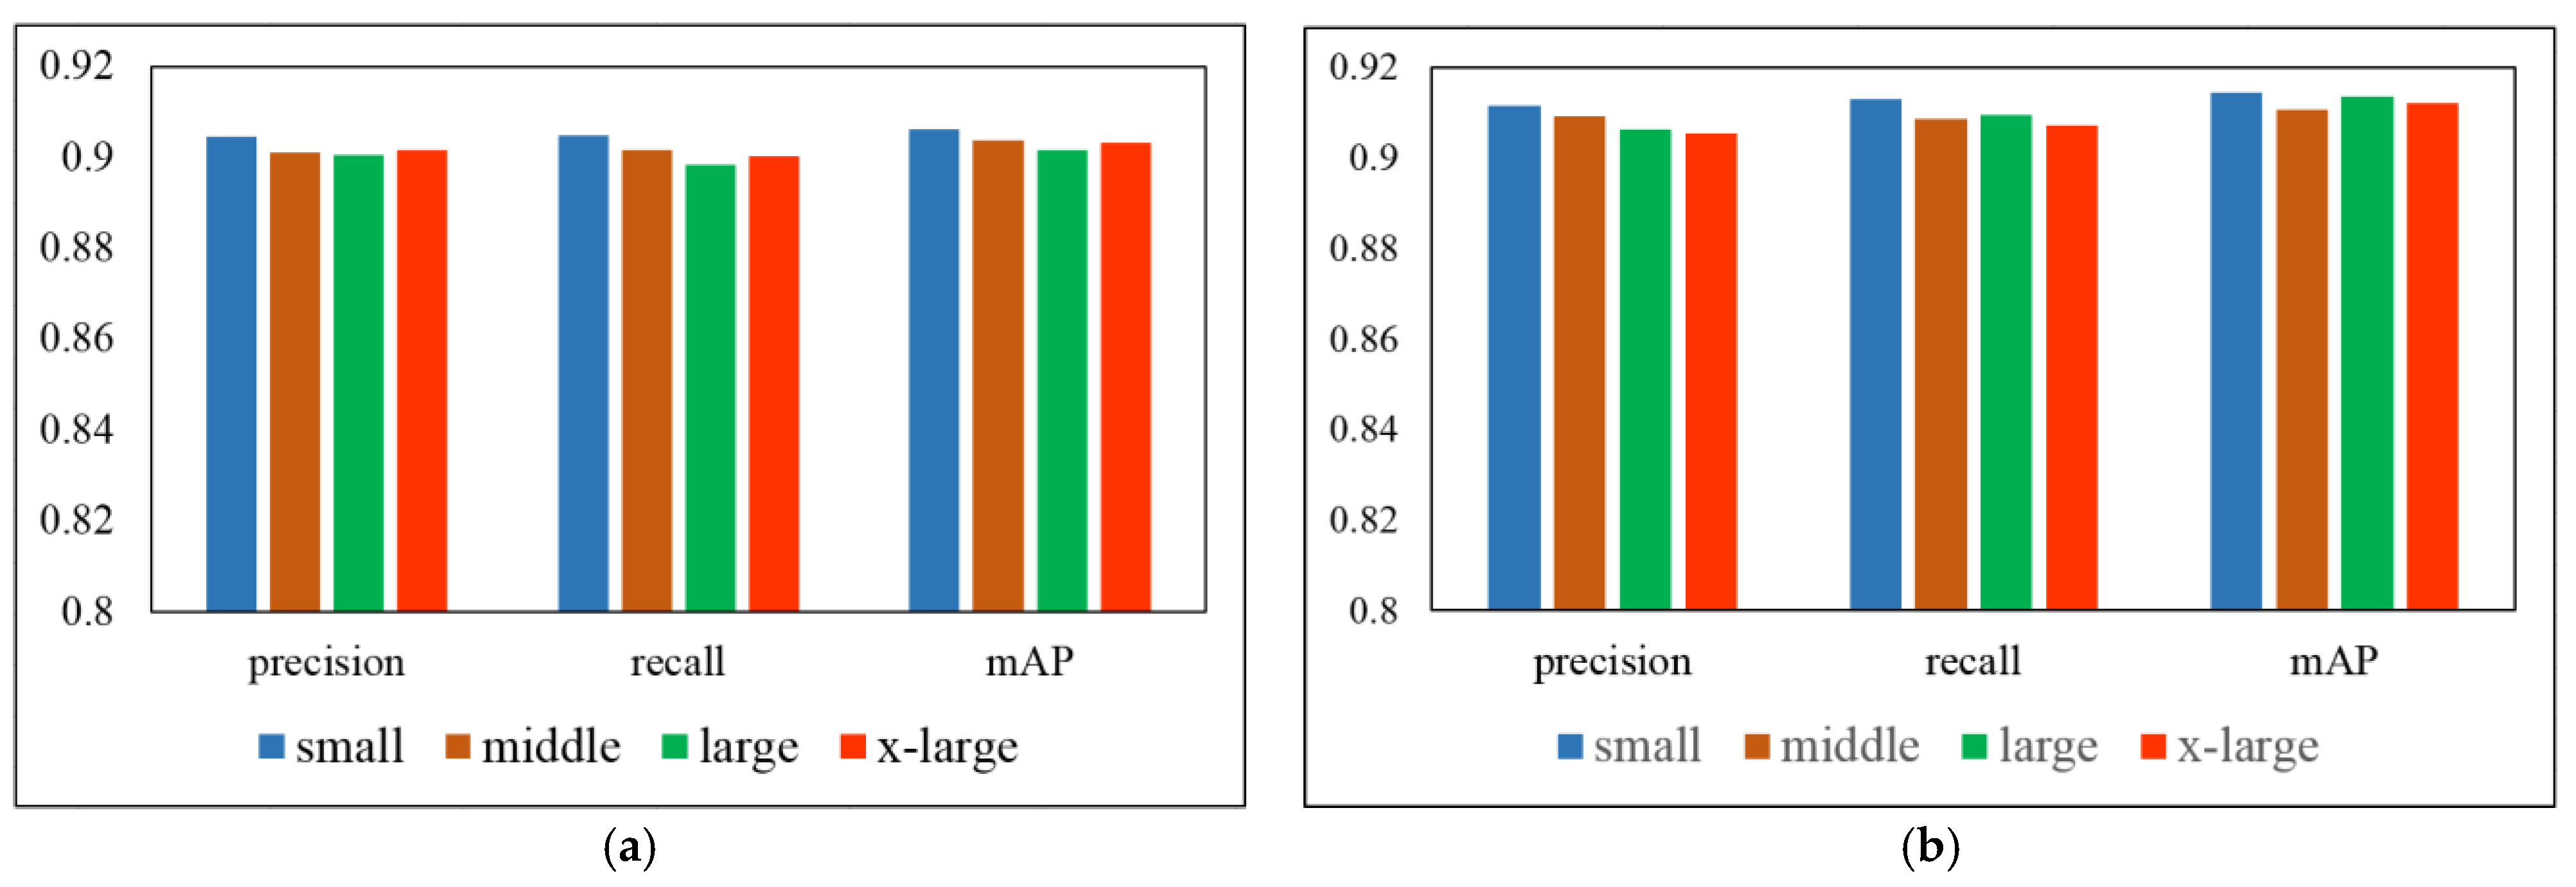
6.2. Performance Analysis Based on Different Depths and Widths of the Network
7. Conclusions
Future Developments
Author Contributions
Funding
Data Availability Statement
Acknowledgments
Conflicts of Interest
References
- Çömert, R.; Matci, D.K.; Avdan, U. Detection of Collapsed Building from Unmanned Aerial Vehicle Data with Object Based Image Classification. Eskisehir Technol. Univ. J. Sci. Technol. B Theor. Sci. 2018, 6, 109–116. [Google Scholar] [CrossRef] [Green Version]
- Ge, P.; Gokon, H.; Meguro, K. A review on synthetic aperture radar-based building damage assessment in disasters. Remote Sens. Environ. 2020, 240, 111693. [Google Scholar] [CrossRef]
- Foulser, R.; Spence, R.; Eguchi, R.; King, A. Using remote sensing for building damage assessment: GEOCAN study and validation for 2011 Christchurch earthquake. Earthq. Spectra 2016, 32, 611–631. [Google Scholar] [CrossRef]
- Suppasri, A.; Mas, E.; Charvet, I.; Gunasekera, R.; Imai, K.; Fukutani, Y. Building damage characteristics based on surveyed data and fragility curves of the 2011 Great East Japan tsunami. Nat. Hazards 2013, 66, 319–341. [Google Scholar] [CrossRef] [Green Version]
- Dong, L.; Shan, J. A comprehensive review of earthquake-induced building damage detection with remote sensing techniques. ISPRS J. Photogramm. Remote Sens. 2013, 84, 85–99. [Google Scholar] [CrossRef]
- Adriano, B.; Xia, J.; Baier, G.; Yokaya, N.; Koshimura, S. Multi-source data fusion based on ensemble learning for rapid building damage mapping during the 2018 sulawesi earthquake and tsunami in Palu, Indonesia. Remote Sens. 2019, 11, 886. [Google Scholar] [CrossRef] [Green Version]
- Liu, C.; Sui, H.; Huang, L. Identification of building damage from UAV-based photogrammetric point clouds using supervoxel segmentation and latent dirichlet allocation model. Sensors 2020, 20, 6499. [Google Scholar] [CrossRef]
- Kaya, G.; Taski, K.; Musaoglu, N.; Ersoy, O. Damage assessment of 2010 Haiti earthquake with post-earthquake satellite image by support vector selection and adaptation. Photogramm. Eng. Remote Sens. 2011, 77, 1025–1035. [Google Scholar] [CrossRef]
- Kerle, N.; Nex, F.; Gerke, M.; Duarte, D.; Vetrivel, A. UAV-Based Structural Damage Mapping: A Review. ISPRS Int. J. Geo-Inf. 2020, 9, 14. [Google Scholar] [CrossRef] [Green Version]
- Xu, Z.; Lu, X.; Cheng, Q.; Guan, H.; Deng, L.; Zhang, Z. A smart phone-based system for post-earthquake investigations of building damage. Int. J. Disaster Risk Reduct. 2017, 27, 214–222. [Google Scholar] [CrossRef]
- Tu, J.; Sui, H.; Feng, W.; Sun, K.; Hua, L. Detection of damaged rooftop areas from high-resolution aerial images based on visual bag-of-words model. IEEE Geosci. Remote Sens. Lett. 2016, 3, 1817–1821. [Google Scholar] [CrossRef]
- Janalipour, M.; Mohammadzadeh, A. Building damage detection using object-based image analysis and ANFIS from high-resolution image (case study: BAM earthquake, Iran). IEEE J. Sel. Top. Appl. Earth Observ. Remote Sens. 2019, 9, 1937–1945. [Google Scholar] [CrossRef]
- Liu, C.; Zhou, L.; Wang, W.; Zhao, X. Concrete Surface Damage Volume Measurement Based on Three-Dimensional Reconstruction by Smartphones. IEEE Sens. J. 2021, 21, 11349–11360. [Google Scholar] [CrossRef]
- Zhai, W.; Peng, Z. Damage assessment using google street view: Evidence from hurricane Michael in Mexico beach, Florida. Appl. Geogr. 2020, 123, 102252–102266. [Google Scholar] [CrossRef]
- Ji, M.; Liu, L.; Du, R.; Buchroithner, M.F. A comparative study of texture and convolutional neural network features for detecting collapsed buildings after earthquakes using pre- and post-event satellite imagery. Remote Sens. 2019, 11, 1202. [Google Scholar] [CrossRef] [Green Version]
- Vetrivel, A.; Gerke, M.; Kerle, N.; Nex, F.; Vosselman, G. Disaster damage detection through synergistic use of deep learning and 3D point cloud features derived from very high resolution oblique aerial images, and multiple-kernel-learning. ISPRS J. Photogramm. Remote Sens. 2018, 140, 45–59. [Google Scholar] [CrossRef]
- He, K.; Gkioxari, G.; Dollár, P.; Girshick, R. Mask r-cnn. In Proceedings of the IEEE International Conference on Computer Vision, Venice, Italy, 22–29 October 2017; pp. 2961–2969. [Google Scholar]
- Liu, W.; Anguelov, D.; Erhan, D.; Szegedy, C.; Reed, S.; Fu, C.; Berg, A.C. SSD: Single shot multibox detector. In Proceedings of the 14th European Conference on Computer Vision (ECCV), Amsterdam, The Netherlands, 8–16 October 2016; pp. 21–37. [Google Scholar]
- Pham, T.H.; Apparicio, P.; Gomez, C.; Weber, C.; Mathon, D. Towards a rapid automatic detection of building damage using remote sensing for disaster management: The 2010 Haiti earthquake. Disaster Prev. Manag. 2014, 23, 53–66. [Google Scholar] [CrossRef]
- Adams, S.M.; Levitan, M.L.; Friedland, C.J. High Resolution Imagery Collection Utilizing Unmanned Aerial Vehicles (UAVs) for Post-Disaster Studies. Photogramm. Eng. Remote Sens. 2014, 80, 1161–1168. [Google Scholar] [CrossRef] [Green Version]
- Ye, X.; Liu, M.; Wang, J.; Qin, Q.; Ren, H.; Wang, J.; Hui, J. Building-based damage detection from postquake image using multiple-feature analysis. IEEE Geosci. Remote Sens. Lett. 2017, 14, 499–503. [Google Scholar] [CrossRef]
- Wu, C.; Zhang, F.; Xia, J.; Xu, Y.; Liu, R. Building damage detection using u-net with attention mechanism from pre- and post-disaster remote sensing datasets. Remote Sens. 2021, 13, 905. [Google Scholar] [CrossRef]
- Schwarz, J.; Raschke, M.; Maiwald, H. Comparative seismic risk studies for German earthquake regions on the basis of the european macroseismic scale ems-98. Nat. Hazards 2006, 38, 259–282. [Google Scholar] [CrossRef]
- Orlando, M.; Salvatori, L.; Spinelli, P.; De Stefano, M. Displacement capacity of masonry piers: Parametric numerical analyses versus international building codes. Bull. Earthq. Eng. 2016, 14, 2259–2271. [Google Scholar] [CrossRef]
- Zhan, Y.; Liu, W.; Maruyama, Y. Damaged Building Extraction Using Modified Mask R-CNN Model Using Post-Event Aerial Images of the 2016 Kumamoto Earthquake. Remote Sens. 2022, 14, 1002. [Google Scholar] [CrossRef]
- Chen, F.; Yu, B. Earthquake-induced building damage mapping based on multi-task deep learning framework. IEEE Access 2019, 7, 181396–181404. [Google Scholar] [CrossRef]
- Li, Y.; Hu, W.; Dong, H.; Zhang, X. Building damage detection from post-event aerial imagery using single shot multibox detector. Appl. Sci. 2019, 9, 1128. [Google Scholar] [CrossRef] [Green Version]
- Cheng, C.S.; Behzadan, A.H.; Noshadravan, A. Deep learning for post-hurricane aerial damage assessment of buildings. Comput. Aided Civ. Infrastruct. Eng. 2021, 36, 695–710. [Google Scholar] [CrossRef]
- Zhang, X.; Zou, J.; He, K.; Sun, J. Accelerating very deep convolutional networks for classification and detection. IEEE Trans. Pattern Anal. Mach. Intell. 2015, 38, 1943–1955. [Google Scholar] [CrossRef] [Green Version]
- Guo, J.M.; Yang, J.S.; Seshathiri, S.; Wu, H.W. A Light-Weight CNN for Object Detection with Sparse Model and Knowledge Distillation. Electronics 2022, 11, 575. [Google Scholar] [CrossRef]
- Gao, C.; Yao, R.; Zhou, Y.; Zhao, J.; Fang, L.; Hu, F. Efficient lightweight video person re-identification with online difference discrimination module. Multimed. Tools Appl. 2022, 81, 19169–19181. [Google Scholar] [CrossRef]
- Liu, R.; Jiang, D.; Zhang, L.; Zhang, Z. Deep depthwise separable convolutional network for change detection in optical aerial images. IEEE J. Sel. Top. Appl. Earth Observ. Remote Sens. 2020, 13, 1109–1118. [Google Scholar] [CrossRef]
- Xu, G.; Fang, W.; Shi, P.; Yuan, Y. The fast loss assessment of the Wenchuan earthquake. J. Earthq. Eng. Eng. Vib. 2008, 28, 74–83. [Google Scholar]
- Zhu, L.; Geng, X.; Li, Z.; Liu, C. Improving YOLOv5 with Attention Mechanism for Detecting Boulders from Planetary Images. Remote Sens. 2021, 13, 3776. [Google Scholar] [CrossRef]
- Han, K.; Wang, Y.; Tian, Q.; Guo, J.; Xu, C.; Xu, C. Ghostnet: More features from cheap operations. In Proceedings of the IEEE/CVF Conference on Computer Vision and Pattern Recognition, Virtual, 14–19 June 2020; pp. 1580–1589. [Google Scholar]
- Woo, S.; Park, J.; Lee, J.Y.; Kweon, I.S. CBAM: Convolutional block attention module. In Proceedings of the European conference on computer vision (ECCV), Munich, Germany, 8–14 September 2018; pp. 3–19. [Google Scholar]
- Zhang, Y.; Yi, P.; Zhou, D.; Yang, X.; Yang, D.; Zhang, Q.; Wei, X. CSANet: Channel and spatial mixed attention CNN for pedestrian detection. IEEE Access 2020, 8, 76243–76252. [Google Scholar] [CrossRef]
- Lu, X.; Ji, J.; Xing, Z.; Miao, Q. Attention and feature fusion ssd for remote sensing object detection. IEEE Trans. Instrum. Meas. 2021, 70, 5501309. [Google Scholar] [CrossRef]
- Li, L.; Zhang, S.; Wu, J. Efficient object detection framework and hardware architecture for remote sensing images. Remote Sens. 2019, 11, 2376. [Google Scholar] [CrossRef] [Green Version]
- Sandler, M.; Howard, A.; Zhu, M.; Zhmoginov, A.; Chen, L.C. Mobilenetv2: Inverted residuals and linear bottlenecks. In Proceedings of the 2018 IEEE conference on computer vision and pattern recognition, Salt Lake City, UT, USA, 18–23 June 2018; pp. 4510–4520. [Google Scholar]
- Ma, S.; Liu, W.; Cai, W.; Shang, Z.; Liu, G. Lightweight deep residual CNN for fault diagnosis of rotating machinery based on depthwise separable convolutions. IEEE Access. 2019, 7, 57023–57036. [Google Scholar] [CrossRef]
- Xiao, Z.; Zhang, Z.; Hung, K.W.; Lui, S. Real-time video super-resolution using lightweight depthwise separable group convolutions with channel shuffling. J. Vis. Commun. Image Represent. 2021, 75, 103038. [Google Scholar] [CrossRef]
- Ma, J.; Yuan, Y. Dimension reduction of image deep feature using PCA. J. Vis. Commun. Image Represent. 2019, 63, 102578. [Google Scholar] [CrossRef]
- Xiao, Y.; Tian, Z.; Yu, J.; Zhang, Y.; Liu, S.; Du, S.; Lan, X. A review of object detection based on deep learning. Multimed. Tools Appl. 2020, 79, 23729–23791. [Google Scholar] [CrossRef]
- Mekhalfi, M.L.; Nicolo, C.; Bazi, Y.; Rahhal, M.; Alsharif, N.A.; Maghayreh, E.A. Contrasting yolov5, transformer, and efficientdet detectors for crop circle detection in desert. IEEE Geosci. Remote Sens. Lett. 2021, 19, 3003205. [Google Scholar] [CrossRef]
- Tan, M.; Pang, R.; Le, Q.V. EfficientDet: Scalable and Efficient Object Detection. In Proceedings of the 2020 IEEE Conference on Computer Vision and Pattern Recognition, Seattle, WA, USA, 13–19 June 2020; pp. 10778–10787. [Google Scholar]
- Bochkovskiy, A.; Wang, C.Y.; Liao, H.Y.M. YOLOv4: Optimal Speed and Accuracy of Object Detection. arXiv 2020, arXiv:2004.10934. Available online: https://arxiv.org/abs/2004.10934 (accessed on 28 June 2020).
- Pan, B.; Tai, J.; Zheng, Q.; Zhao, S. Cascade convolutional neural network based on transfer-learning for aircraft detection on high-resolution remote sensing images. J. Sens. 2017, 2017, 1796728. [Google Scholar] [CrossRef] [Green Version]


| Disaster | Dataset Type | Dataset Number | Damage Type | Damage Number |
|---|---|---|---|---|
| Wenchuan Earthquake | Training dataset | 5608 images | Debris | 9565 |
| Collapse | 9868 | |||
| Spalling | 6167 | |||
| Crack | 5243 | |||
| Testing dataset | 2584 images | Debris | 4098 | |
| Collapse | 4228 | |||
| Spalling | 2643 | |||
| Crack | 2247 | |||
| Croatia Earthquake and Luxian Earthquake | Verifying dataset | 148 images | Debris | 188 |
| Collapse | 231 | |||
| Spalling | 159 | |||
| Crack | 108 |
| Types | Precision (%) | Recall (%) | mAP (%) | F1-Score (%) |
|---|---|---|---|---|
| Debris | 95.56 | 92.95 | 94.26 | 92.42 |
| Collapse | 91.35 | 90.93 | 93.53 | 91.86 |
| Spalling | 89.82 | 90.18 | 91.28 | 89.28 |
| Crack | 87.91 | 89.58 | 90.63 | 90.59 |
| Average | 91.16 | 90.91 | 92.43 | 91.06 |
| Model | Training Hours | Weight Size (MB) | Parameter Size | Inferences (s) | Precision | Recall | mAP (%) | F1-Score (%) |
|---|---|---|---|---|---|---|---|---|
| LA-YOLOv5 | 8.43 | 7.51 | 3.18 × 10⁶ | 0.033 | 92.47 | 91.39 | 93.43 | 92.26 |
| GB-YOLOv5 | 8.29 | 6.92 | 2.97 × 10⁶ | 0.030 | 90.25 | 89.78 | 91.86 | 90.08 |
| GC-YOLOv5 | 8.63 | 8.55 | 3.42 × 10⁷ | 0.039 | 89.95 | 89.08 | 89.15 | 88.57 |
| C-YOLOv5 | 9.26 | 10.37 | 4.29 × 10⁶ | 0.048 | 88.25 | 88.46 | 87.12 | 87.48 |
| G-YOLOv5 | 8.49 | 7.58 | 3.13 × 10⁶ | 0.035 | 87.92 | 87.63 | 86.64 | 86.29 |
| B-YOLOv5 | 8.85 | 8.73 | 3.62 × 10⁶ | 0.037 | 88.38 | 88.72 | 87.52 | 87.86 |
| YOLOv5 | 9.19 | 20.62 | 3.95 × 10⁷ | 0.043 | 85.96 | 84.27 | 84.63 | 85.54 |
| Model | Training Hours | Weight Size (MB) | Parameter Size | Inferences (s) | Precision | Recall | mAP (%) | F1-Score (%) |
|---|---|---|---|---|---|---|---|---|
| LA-YOLOv5 | 8.43 | 7.51 | 3.18 × 10⁶ | 0.033 | 91.16 | 91.29 | 92.43 | 91.36 |
| MobileNet-SSD | 10.15 | 26.59 | 6.47 × 10⁶ | 0.059 | 88.37 | 87.42 | 87.92 | 86.47 |
| Nanodet | 7.14 | 7.28 | 3.73 × 10⁶ | 0.027 | 86.92 | 84.63 | 84.14 | 83.29 |
| MobileDets | 6.85 | 6.83 | 2.12 × 10⁶ | 0.022 | 84.73 | 83.12 | 84.52 | 82.26 |
| GS-YOLOv5 | 8.82 | 8.72 | 3.32 × 10⁶ | 0.036 | 90.25 | 89.78 | 89.86 | 89.04 |
| YOLOv4 | 11.63 | 123.55 | 9.72 × 10⁷ | 0.106 | 88.95 | 87.08 | 87.15 | 83.57 |
| Faster RCNN | 12.36 | 328.62 | 4.65 × 10⁷ | 0.228 | 79.82 | 83.33 | 81.57 | 82.39 |
| Dataset | 2020 Croatia Earthquake | 2021 Luxian Earthquake | ||||||
|---|---|---|---|---|---|---|---|---|
| Inference (s) | Precision | Recall | mAP (%) | Inference (s) | Precision | Recall | mAP (%) | |
| Verifying | 0.042 | 81.52 | 82.08 | 82.57 | 0.046 | 80.74 | 82.15 | 82.16 |
| Testing | 0.039 | 91.16 | 91.29 | 91.03 | 0.042 | 90.33 | 91.33 | 92.34 |
Publisher’s Note: MDPI stays neutral with regard to jurisdictional claims in published maps and institutional affiliations. |
© 2022 by the authors. Licensee MDPI, Basel, Switzerland. This article is an open access article distributed under the terms and conditions of the Creative Commons Attribution (CC BY) license (https://creativecommons.org/licenses/by/4.0/).
Share and Cite
Liu, C.; Sui, H.; Wang, J.; Ni, Z.; Ge, L. Real-Time Ground-Level Building Damage Detection Based on Lightweight and Accurate YOLOv5 Using Terrestrial Images. Remote Sens. 2022, 14, 2763. https://doi.org/10.3390/rs14122763
Liu C, Sui H, Wang J, Ni Z, Ge L. Real-Time Ground-Level Building Damage Detection Based on Lightweight and Accurate YOLOv5 Using Terrestrial Images. Remote Sensing. 2022; 14(12):2763. https://doi.org/10.3390/rs14122763
Chicago/Turabian StyleLiu, Chaoxian, Haigang Sui, Jianxun Wang, Zixuan Ni, and Liang Ge. 2022. "Real-Time Ground-Level Building Damage Detection Based on Lightweight and Accurate YOLOv5 Using Terrestrial Images" Remote Sensing 14, no. 12: 2763. https://doi.org/10.3390/rs14122763
APA StyleLiu, C., Sui, H., Wang, J., Ni, Z., & Ge, L. (2022). Real-Time Ground-Level Building Damage Detection Based on Lightweight and Accurate YOLOv5 Using Terrestrial Images. Remote Sensing, 14(12), 2763. https://doi.org/10.3390/rs14122763