Article

Effects of Aerosols on Gross Primary Production from Ecosystems to the Globe

1
College of Life Science and Technology, Central South University of Forestry and Technology (CSUFT), Changsha 410004, China
2
National Engineering Laboratory for Applied Technology of Forestry & Ecology in South China, Central South University of Forestry and Technology (CSUFT), Changsha 410004, China
3
Earth Systems Research Center, Institute for the Study of Earth, Oceans, and Space, University of New Hampshire, Durham, NH 03824, USA
4
CSIRO Oceans and Atmosphere, 107 Station Street, Aspendale, VIC 3195, Australia
5
School of Atmospheric Sciences, Southern Marine Science and Engineering Guangdong Laboratory (Zhuhai), Sun Yat-sen University, Zhuhai 519082, China
6
Center for Eco-Environmental Research, Nanjing Hydraulic Research Institute, Nanjing 210029, China
*
Author to whom correspondence should be addressed.
Remote Sens. 2022, 14(12), 2759; https://doi.org/10.3390/rs14122759
Submission received: 22 April 2022 / Revised: 2 June 2022 / Accepted: 7 June 2022 / Published: 8 June 2022
(This article belongs to the Topic Recent Progress in Aerosol Remote Sensing and Products)

Abstract

:
Aerosols affect the gross primary productivity (GPP) of plants by absorbing and scattering solar radiation. However, it is still an open question whether and to what extent the effects of aerosol on the diffuse fraction (Df) can enhance GPP globally. We quantified the aerosol diffuse fertilization effect (DFE) and incorporated it into a light use efficiency (LUE) model, EC-LUE. The new model is driven by aerosol optical depth (AOD) data and is referred to as AOD-LUE. The eddy correlation variance (EC) of the FLUXNET2015 dataset was used to calibrate and validate the model. The results showed that the newly developed AOD-LUE model improved the performance in simulating GPP across all ecosystem types (R2 from 0.6 to 0.68), with the highest performance for mixed forest (average R2 from 0.71 to 0.77) and evergreen broadleaf forest (average R2 from 0.34 to 0.45). The maximum LUE of diffuse photosynthetic active radiation (PAR) (3.61 g C m−2 MJ−1) was larger than that of direct PAR (1.68 g C m−2 MJ−1) through parameter optimization, indicating that the aerosol DFE seriously affects the estimation of GPP, and the separation of diffuse PAR and direct PAR in the GPP model is necessary. In addition, we used AOD-LUE to quantify the impact of aerosol on GPP. Specifically, aerosols impaired GPP in closed shrub (CSH) by 6.45% but enhanced the GPP of grassland (GRA) and deciduous broadleaf forest (DBF) by 3.19% and 2.63%, respectively. Our study stresses the importance of understanding aerosol-radiation interactions and incorporating aerosol effects into regional and global GPP models.

Graphical Abstract

1. Introduction

Accurate and reliable estimates of gross primary productivity (GPP) are important for understanding the terrestrial carbon cycle and predicting plant production status [1,2]. Gross primary productivity is the major indicator to measure the material production (e.g., food and fiber) capacity and carbon uptake rate of an ecosystem [3,4]. Aerosols can affect the productivity of plants by increasing the diffuse radiation reaching the surface, thereby affecting the carbon cycle [5,6,7,8]. However, it is difficult to determine how changes in aerosol-induced radiation affect GPP changes. Thus, it is necessary to incorporate the influences of aerosols into GPP models to quantify how aerosols affect the terrestrial carbon cycle [6,9].
The enhancement or inhibition effect of aerosols on GPP has been an issue of constant debate [10,11], and the effective quantification of GPP by aerosols has become a scientific problem that needs to be solved urgently. For two reasons, the estimate of the aerosol effects on GPP is controversial. First, moderate aerosol loading regions can increase the diffuse fraction (Df) of solar radiation. Diffuse light can penetrate canopies more effectively and increase plant photosynthesis via the aerosol diffuse fertilization effect (DFE) [12]. On the contrary, in the dense aerosol loading regions, aerosols have a negative impact on GPP because the diffuse radiation is easily saturated and the direct light is strongly attenuated [13,14]. In addition, the negative effect of high-load aerosols on GPP is also manifested in that aerosol particles are deposited on leaves, thereby blocking stomata, directly affecting plant photosynthesis and related protein expression [10]. For example, a modeling study showed that for a part of the northern coniferous forest, a relatively high aerosol loading (AOD > 2) resulted in a decrease in total radiation and thereby the GPP [4]. Second, the effect of aerosols on GPP may also be limited to the height and leaf area index (LAI) and variations in different ecosystems. Increased diffuse radiation can enhance GPP for forests (i.e., broadleaf forest) with complex canopy structure and high LAI [13,15,16] but not for forests with low canopy (i.e., wetlands) and LAI (i.e., needleleaf forest) [17,18]. However, few studies have currently considered both the regional differences in aerosol loading distribution and the differences in vegetation structure characteristics [19,20,21]. There is an urgent need to systematically study the specific impact of aerosols on GPP from a global perspective.
Existing studies have proved that incorporating the impact of aerosols on GPP in the GPP models is an important and effective way to reduce the uncertainty of GPP estimates [22,23,24]. The transmission of direct light and diffuse light in the canopy can differ due to aerosols [25], and therefore some models need to divide the canopy into sunlit and shaded leaves [26,27]. For example, some current two-leaf models and land surface process models [28,29] consider the influence of aerosols and improve the performance in simulating GPP by calculating photosynthetically active radiation and GPP for shaded and sunlit leaves separately [30]. However, most of the current light use efficient (LUE) models treat the entire canopy as a leaf [31], ignoring the differences in photosynthetic active radiation (PAR) and LUE caused by aerosols among different leaves within the canopy [16,32,33]. Regional and global GPP estimates have substantial uncertainty partly because the influence of aerosol on radiation is not considered [34,35,36]. Yuan et al. [31] found that ignoring the promotion of aerosols on diffuse radiation (increasing the diffuse radiation by 43%) led to an underestimation of the European GPP. Therefore, we emphasize the need to quantify the relationship between aerosols and diffuse radiation, which is a factor that cannot be ignored in future GPP simulation improvements.
In this study, we improved a widely used LUE model, EC-LUE, by including aerosol-radiation effects, and examined the potential impact of aerosols on GPP at a global scale. The EC-LUE is a widely used tool to estimate large-scale real GPPs because of its reasonable performance and few input parameters [37]. Data from the EC-sites and satellites were used to monitor GPP at the global scale and evaluate the impact of aerosols on it. The objectives of this study were: (1) to quantify the relationship between aerosols and diffuse radiation; (2) to determine whether aerosols and diffuse radiation can be included in the GPP model; and (3) to quantify the aerosol impact on GPP at the global scale.

2. Materials and Methods

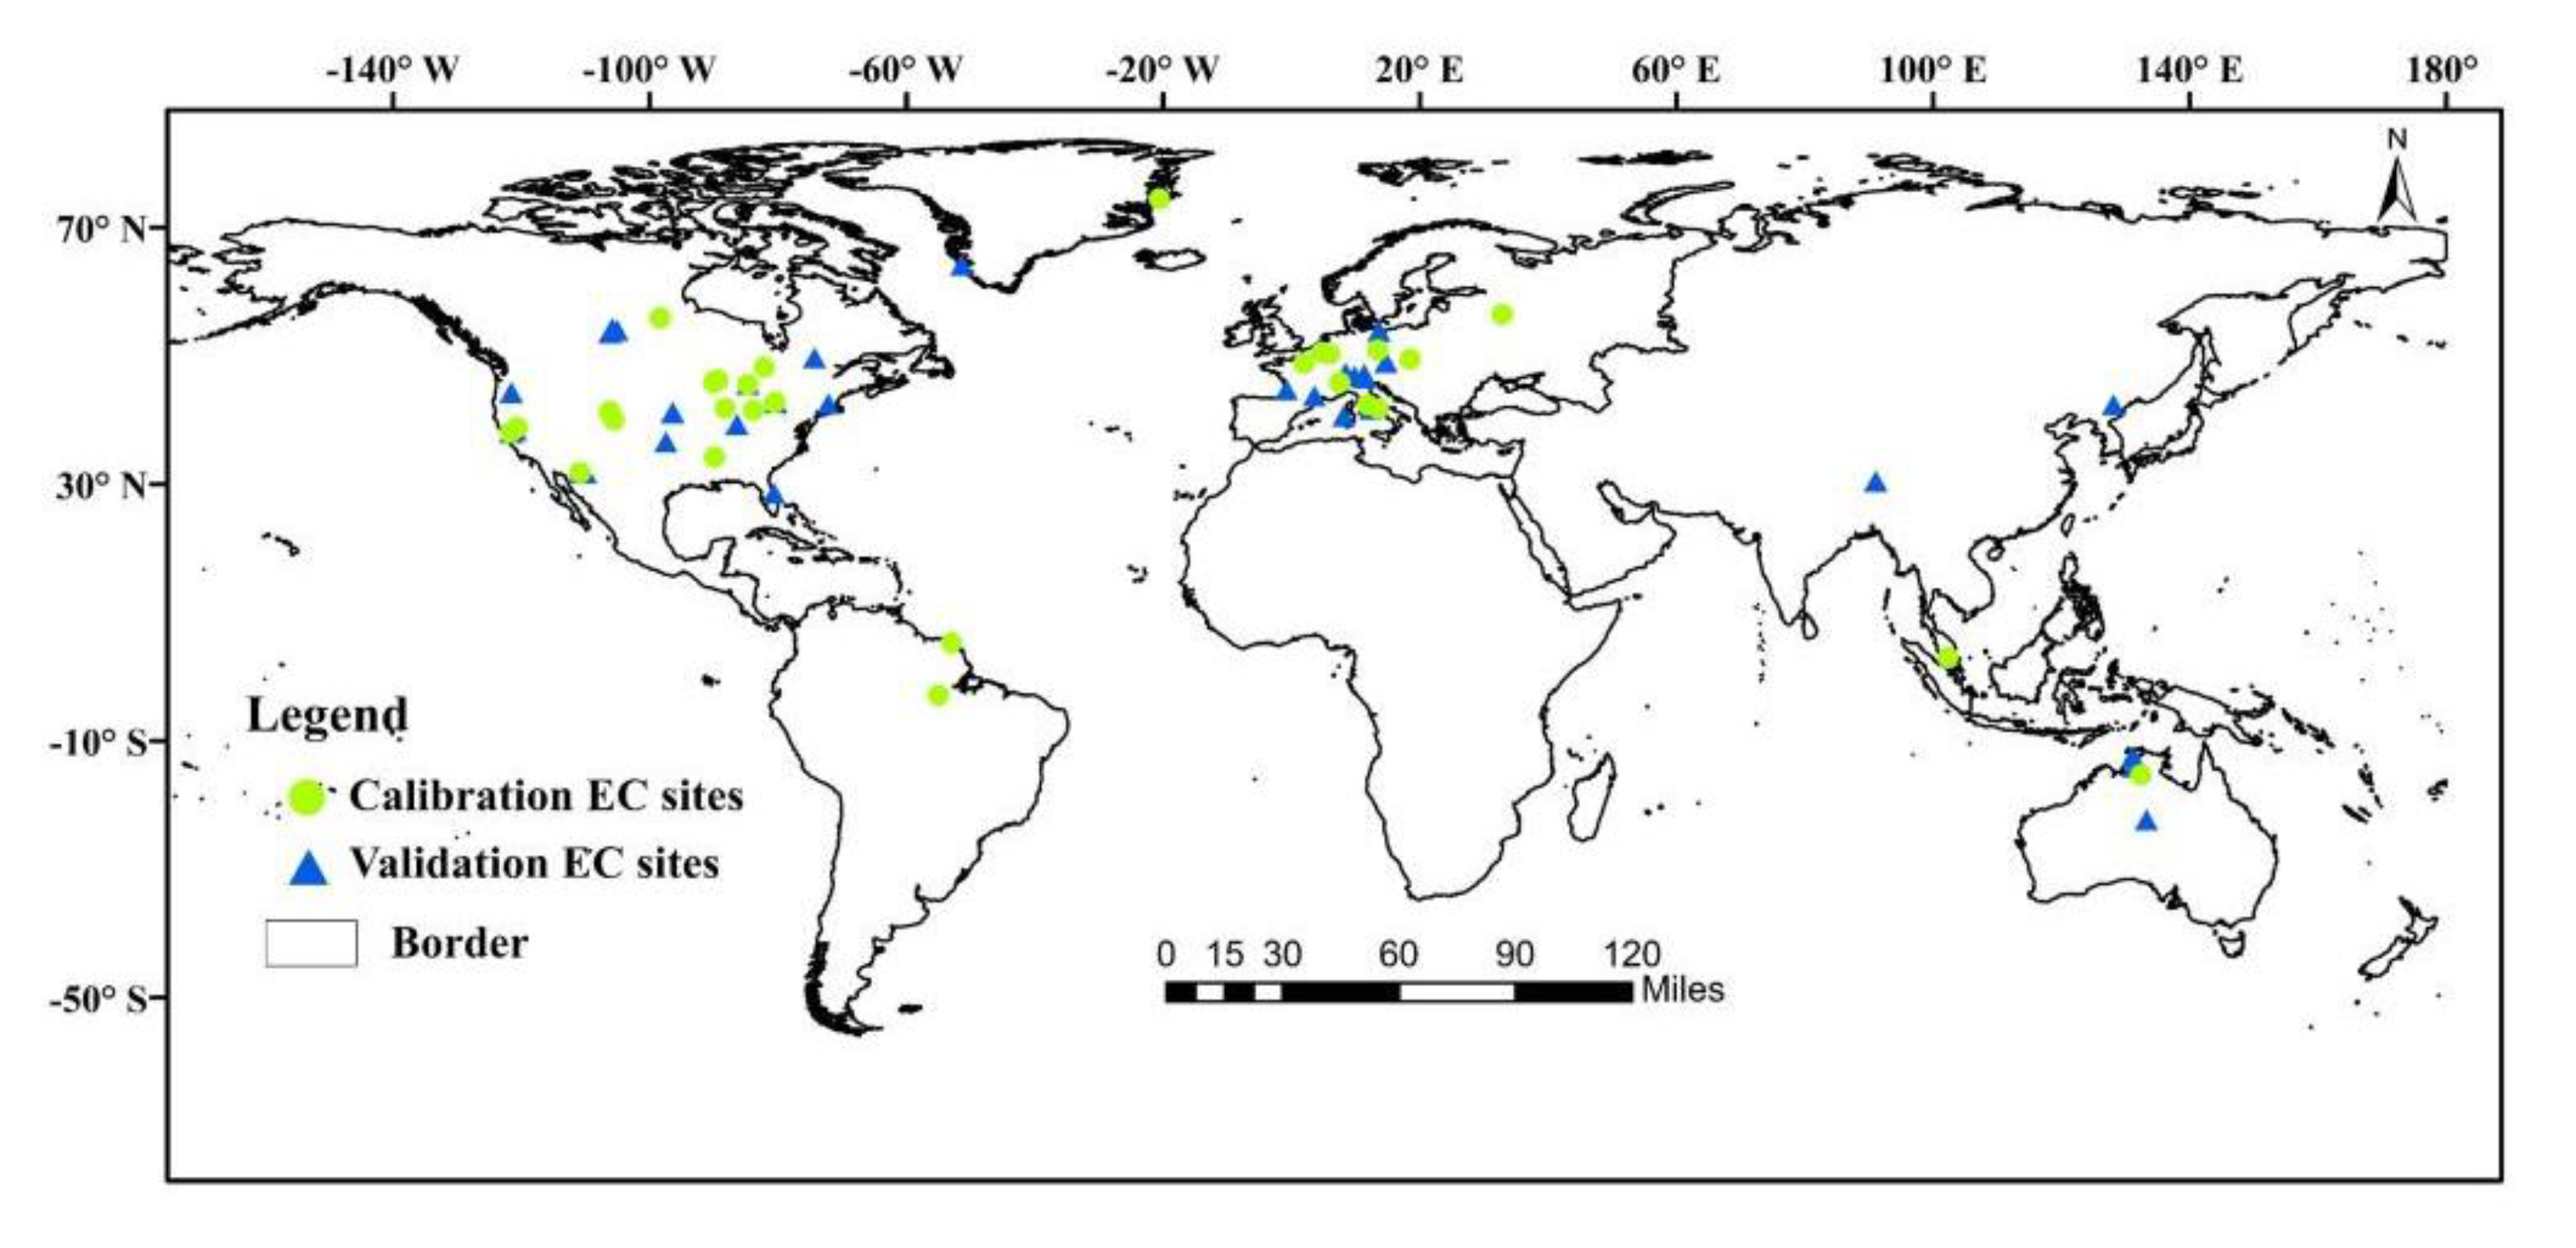
2.1. Eddy Covariance Flux Tower Data

Data from the FLUXNET2015 dataset (Available online: http://www.fluxdata.org, accessed on 11 March 2020) explain ecosystem-scale processes such as the exchange of carbon dioxide, water, and energy between the biosphere and the atmosphere. The data processing and site description details can be found on the FLUXNET2015 dataset website (Available online: https://fluxnet.org/data/fluxnet2015-dataset/, accessed on 9 June 2020). In this paper, a total of 70 eddy covariance (EC) sites were selected (Table S1), and each of these sites had more than five years of data that were able to capture interannual variations and long-term changes (Figure 1). According to the classification scheme developed by the International Geosphere-Biosphere Programme, the land cover classes are divided into 10 types (Table S1): Crop (CRO, 8 sites), Closed Shrub (CSH, 1 site), Deciduous Broadleaf Forest (DBF, 10 sites), Evergreen Broadleaf Forest (EBF, 5 sites), Evergreen Needleleaf Forest (ENF, 17 sites), Grassland (GRA, 14 sites), Mixed Forest (MF, 4 sites), Open Shrub (OSH, 2 sites), Wetlands (WET, 5 sites), and Woody Savanna (WSA, 4 sites).
The daily GPP variable (GPP_NT_VUT_REF) was estimated using net ecosystem exchange (NEE) methods [38]. The air temperature (Ta), sensible heat (H), and latent heat (LE) variables were quantified for each site. Using marginal distribution sampling (MDS), the micrometeorological variables have been gap-filled with reanalysis datasets, while the carbon flux measurement data were gap-filled with LE and H. The daily average values were aggregated to the 8-day time step to match the time step of other data.

2.2. Remote Sensing Data

Aerosol optical depths (AOD) for 550-nm wavelengths are available from the Office of Global Modeling and Assimilation (GMAO) of NASA (Available online: https://disc.gsfc.nasa.gov/datasets/, accessed on 14 July 2021). The data is part of the NASA atmospheric reanalysis dataset (MERRA-2) for the satellite era [39]. In the MERRA project, historical climate analyses are conducted at a range of time scales covering weather and climate, and the NASA EOS observations are placed in a climate context.
The SYN1deg Version 4.1 Cloud and Earth Radiant Energy System (CERES) product [40] provided the direct PAR and diffuse PAR data for clear skies for the period from 2000 to 2014. The PARtotal was calculated as the sum of PARdir and PARdif. The SYN1deg Ed4A product is designed to provide top of the atmosphere (TOA) and surface flux data with the highest temporal resolution by incorporating hourly GEO imager data. The CERES PAR data are available online (Available online: https://ceres-tool.larc.nasa.gov/ord-tool/jsp/SYN1degEd41Selection.jsp, accessed on 3 May 2021).

2.3. Description of the AOD-LUE Model

We developed a new LUE model, AOD-LUE, by improving the EC-LUE model [37] by incorporating the relative effects of diffuse and direct radiation on GPP. A total of 35 EC sites encompassing ten vegetation types were selected for calibration, and the remaining 35 EC sites were used for model verification (Figure 1). The EC-LUE model is expressed as:
  G P P = P A R × f P A R × ε max   × m i n T s , W S  
where fPAR is the fraction of incident daily photosynthetically active radiation absorbed by the vegetation canopy (g C m−2 MJ−1 APAR) (%), PAR is the incident daily photosynthetically active radiation (MJ m−2), ε max   is the maximum light use efficiency without environmental stress (APAR) [2], min is the minimum function of two scalars varying from 0 to 1 and represents the reduction of potential LUE under limiting environmental conditions, and Ts and Ws, are temperature and water downward regulation scalars, respectively.
To explicitly consider the Df effect of aerosols, we used the Df fitting to divide PAR into PARdir and PARdif in the EC-LUE model. At the same time, the maximum LUE parameter (ε) will also be parameterized for PARdir and PARdif separately. We use a nonlinear regression equation (NLS) to fit the LUE values of the two types of radiation respectively. The AOD-LUE model is as follows:
GPP = fPAR × PAR × 1 D f × L U E d i r + PAR × D f × L U E d i f × f T s , W s  
where LUEdir is the maximum LUE (g C m−2 MJ−1 APAR) affected by PARdir, LUEdif is the maximum LUE affected by PARdif. In the overall model representation, through the NLS equation, LUEdir and LUEdif were estimated to be 1.68 (g C m−2 MJ−1) and 3.61 (g C m−2 MJ−1) respectively.
In the model, fPAR is approximated as linear function of NDVI:
f P A R = a × N D V I + b
where a and b are empirical constants. According to Sims et al. [41], a and b are set to 1.24 and −0.168, and NDVI is obtained directly from 1 km MODIS data.
The influence of aerosol on solar radiation is mainly manifested in two aspects, the enhancement of PARdif and the weakening of PARdir. In order to consider the influence of aerosol on the diffusion part of global irradiance, the Df was calculated as:
D f = PAR dif PAR total
where PARtotal is the total photosynthetically active radiation, and PARtotal is the total PAR.
Aerosol and Df were fitted by the Michaelis–Menten equation:
D f = V max × AOD K M + AOD
where Vmax is the maximum rate achieved by the ecosystem when the substrate concentration is saturated. The Michaelis constant KM is the concentration of substrate at which a reaction rate is halved of Vmax. The concentrations at which Vmax and KM were optimized in this study were 0.6 and 0.14 respectively [11,42].
Estimated Ts based on the equation developed for terrestrial ecosystem model (TEM):
T S = T s T min × T a T max T a T min × T a T max ( T a T opt ) 2
where Tmin (0 °C), Tmax (40 °C), and Topt (23.5 °C) correspond to the minimum, maximum, and optimum daily air temperatures (°C) for photosynthesis. Ts = 0 if Tmin or Tmax fall below or above the minimum air temperature [37].
The evaporative fraction (Ws) formula is as follows:
W S = LE LE + H
where LE is EC-measured latent heat flux (W m−2), and H is sensible heat flux (W m −2).
The determination coefficient (R2), RMSE, and SD of the predicted value and the observation value are calculated to evaluate the performance of the model at the site level [43,44].

2.4. Data Analysis and Prediction of GPP

This study used ArcGIS 10.4 to calculate the annual average values of AOD, PARdir, PARdif and PARtotal from 2000 to 2014, and plot the global average. A linear trend analysis method was used to study the annual trend of each variable, and then to test the significance of the regression slope.
In this research, an orthogonal regression method was used to compare each spatial data product with the corresponding site-level measurement value. Orthogonal regression can consider the errors of independent variables and dependent variables at the same time [45]. The correction coefficient obtained by orthogonal regression was used to correct the spatial data set for the prediction of GPP globally. The correction coefficients were derived by regressing a flux tower variable value against a spatially derived variable value based on slope and intercept. For the global GPP simulation, the AOD-LUE model was driven by the MERRA-2 reanalysis dataset. The 1km NDVI data we obtained are aggregated these data to 0.1 degree resolution and monthly time step.
In addition, we used the AOD-LUE model to estimate GPP with the 0.1° spatial resolution and monthly temporal resolution for the globe during 2000–2019 (Figure S1a). Using linear regression analysis in Python3, we determined the long-term trend in GPP from 2000 to 2019 (Figure S1b).

2.5. Aerosols Contribution to Changes in GPP

In order to represent different biomes on the global spatial scale, the global potential natural vegetation (PNV) map at 1 km spatial resolution (Available online: https://doi.org/10.7910/DVN/QQHCIK, accessed on 18 February 2021) was used for the prediction of GPP. The PNV map includes 10 vegetation types. We used PVN vegetation classification because it assumes an undisturbed natural vegetation state and can well reflect the zonal characteristics of vegetation [46]. The aerosol-radiation effect has a higher latitudinal direction in the influence of GPP, and the use of PVN can better show the influence of aerosol on GPP in different latitudes vegetation types.
To isolate the contribution of aerosols to GPP, we also simulated GPP with a global spatial resolution of 0.1° and a monthly temporal resolution from 2000 to 2019 using the EC-LUE model. The simulation based on the AOD-LUE model considered aerosol radiation effects and was referred to as S0 hereafter, while the simulation based on the EC-LUE model ignored aerosol radiation effects and was referred to as S1 hereafter. Two metrics: ΔGPP (Equation (8)) and ΔGPP (%) (Equation (9)) were used to measure the differences in GPP between the S0 and S1 simulations:
Δ G P P = GPP S 0 GPP S 1
Δ G P P % = Δ GPP GPP S 1

3. Results

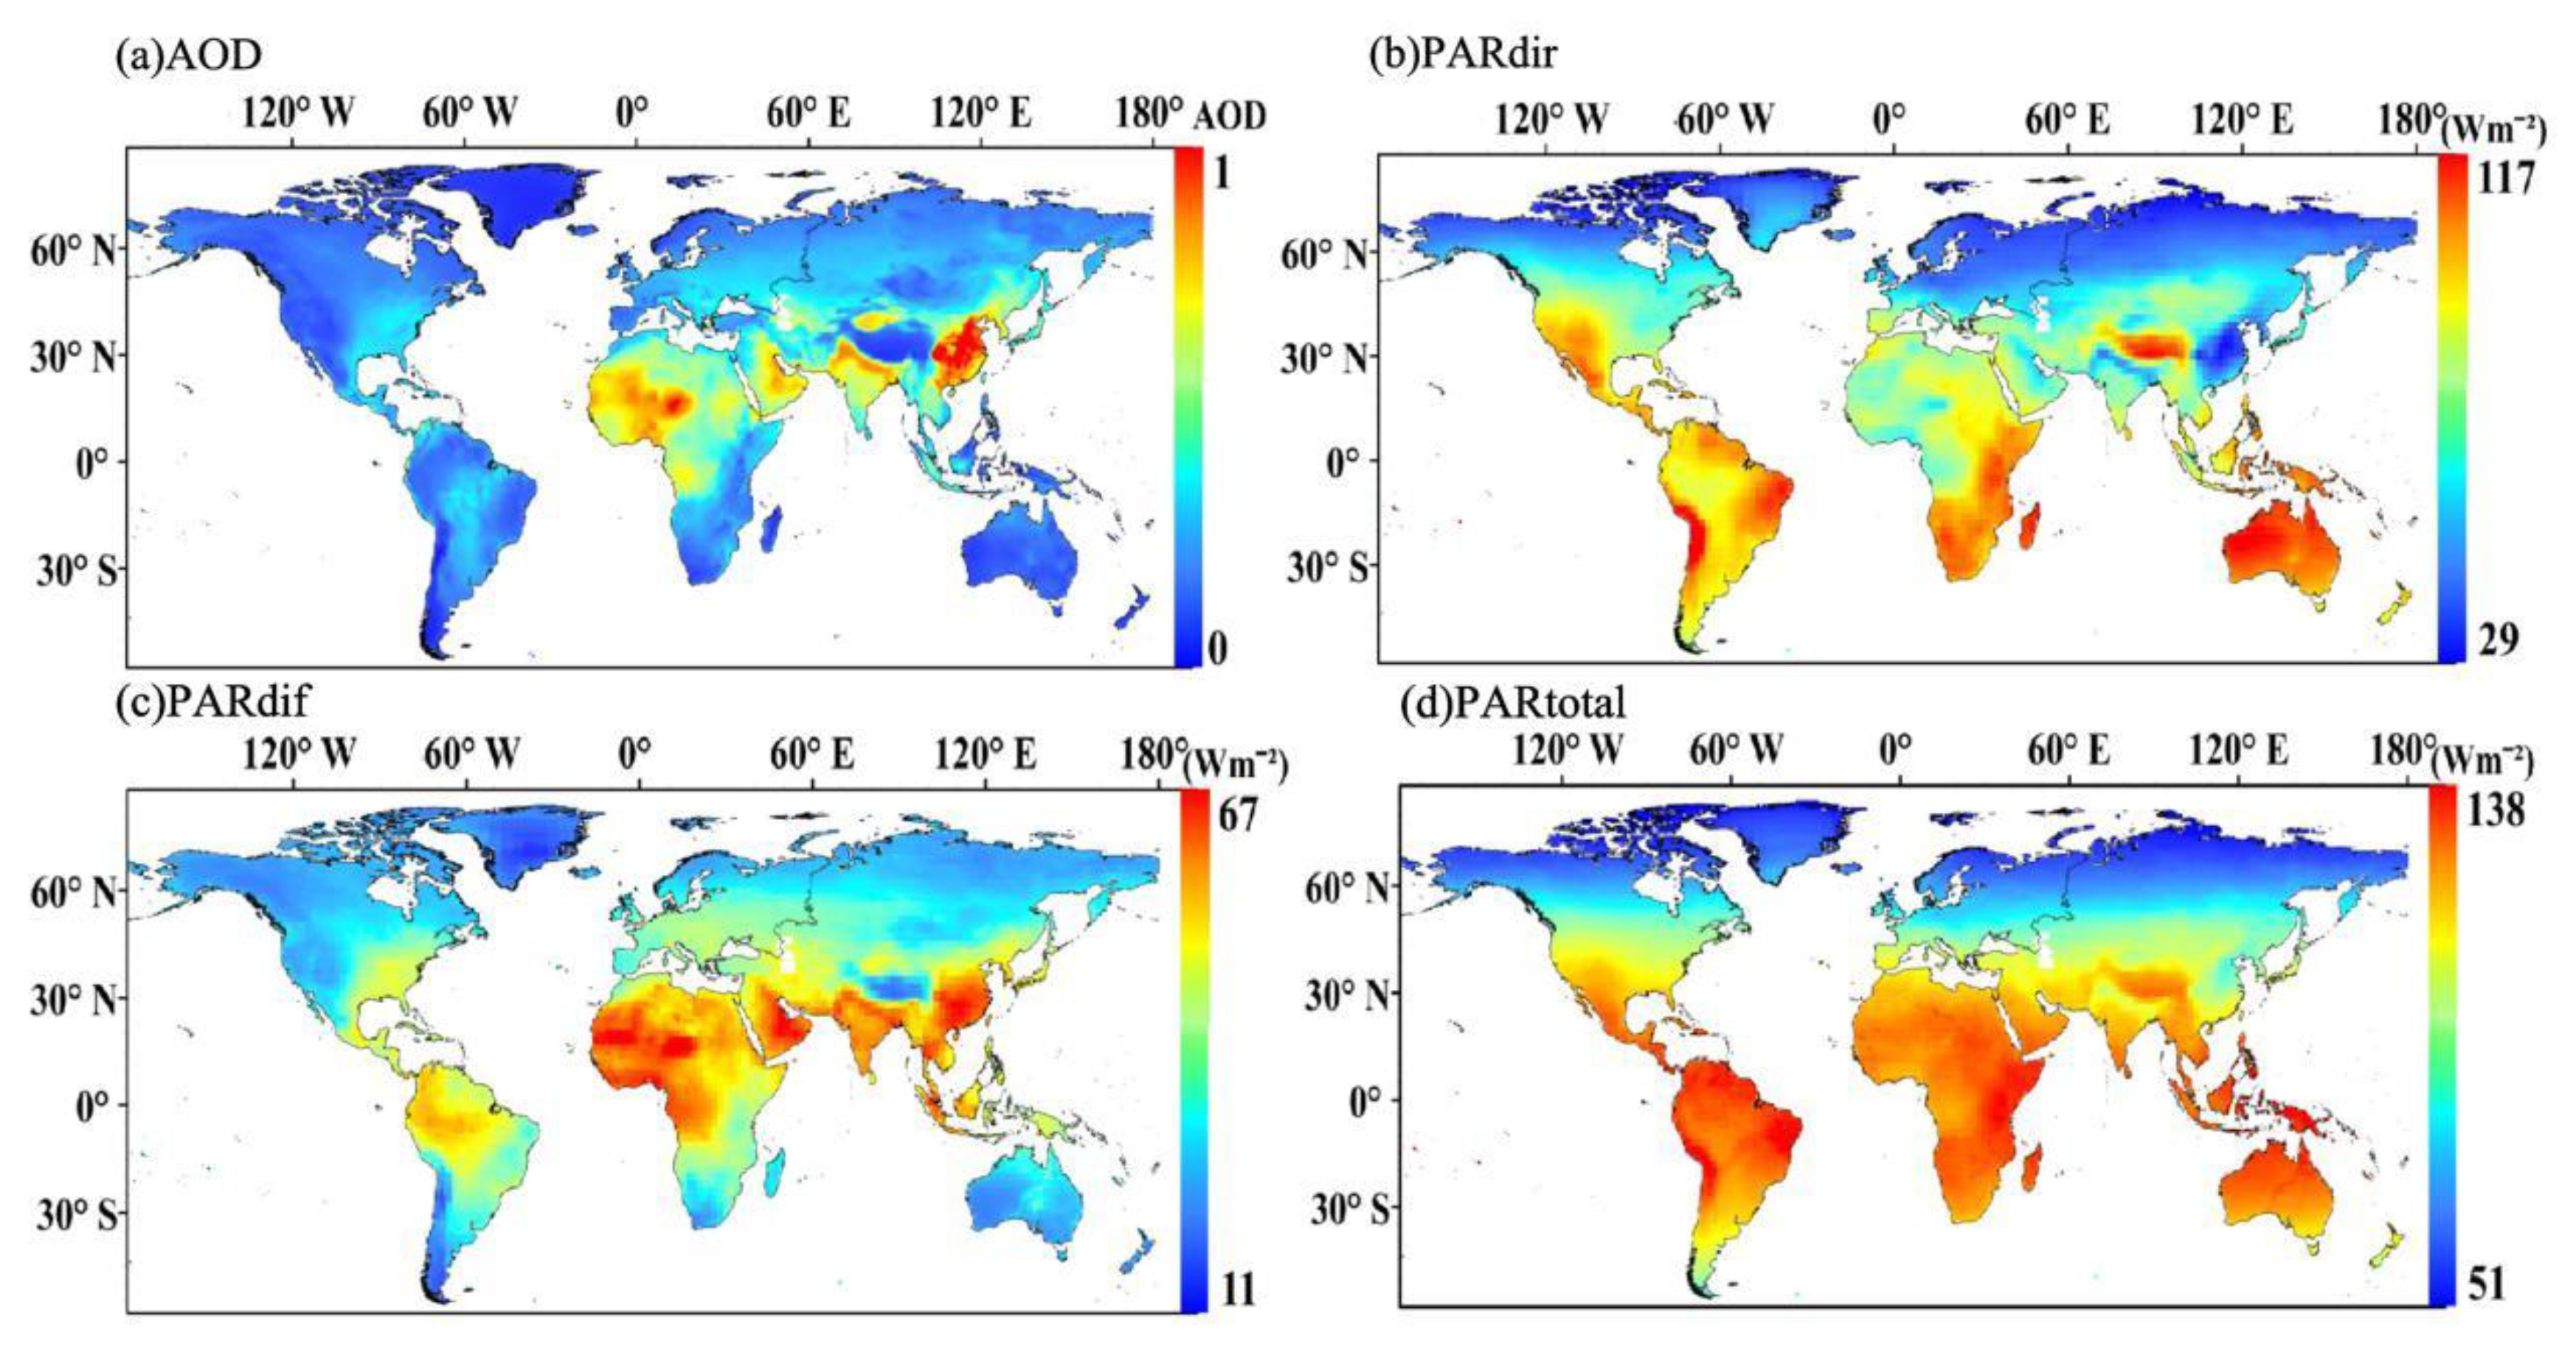
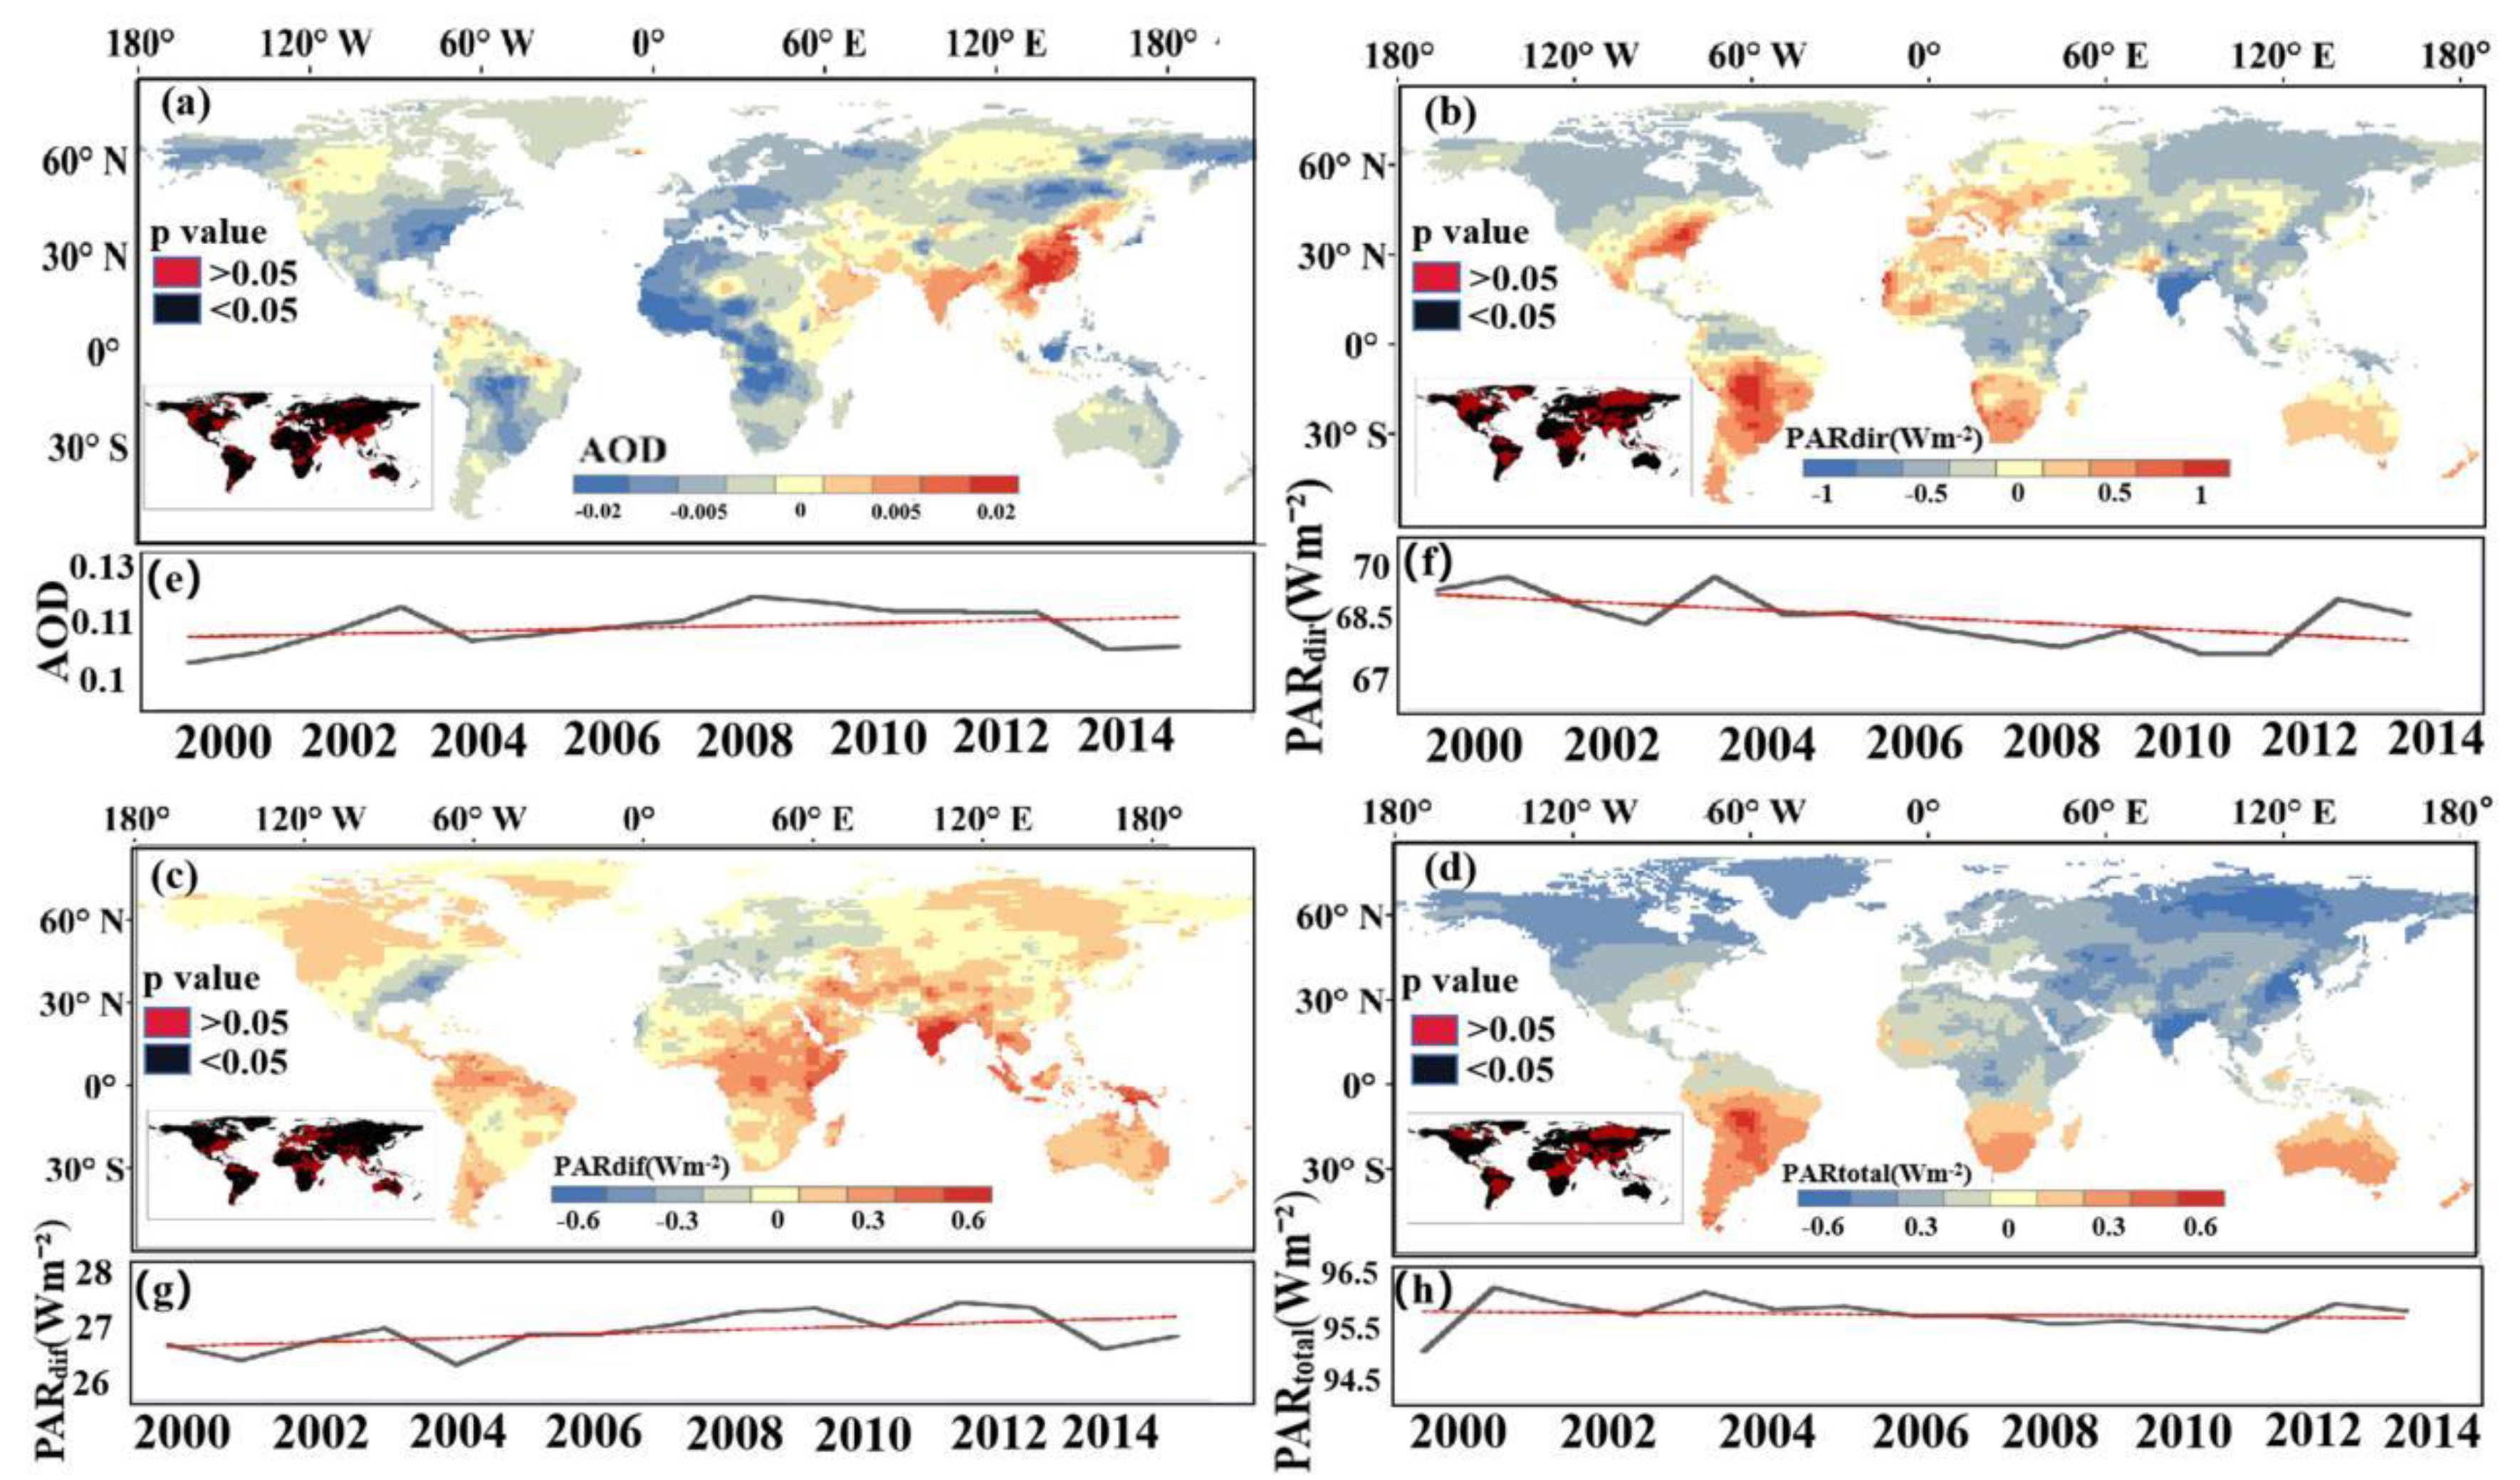
3.1. Spatio-Temporal Variations of AOD, PARdif, PARdir and PARtotal

The global mean values of AOD, PARdir, PARdif, and PARtotal had large spatial differences from 2000 to 2014 (Figure 2). The high values of AOD and PARdif (>0.8 and 50W m−2, respectively) were found in regions with rapidly developing economies such as eastern China and northern India, mainly due to man-made pollution (Figure 2a,c); the moderate values were found in desert areas (e.g., the Arabian Peninsula and North Africa) likely due to frequent sandstorms; the low values (<0.2 and 20W m−2, respectively) were found in the Qinghai-Tibet Plateau and Andes Mountains. The PARdir distribution patterns (Figure 2b) showed the opposite pattern to those of AOD and PARdif on the Plateau, in the Himalayas, and in the Andes. In addition, PARtotal and PARdir values had similar spatial patterns (Figure 2b,d), and the influence of PARdir on PARtotal was greater than that of PARdif.
The trends of AOD, PARdir, PARdif, and PARtotal mean values over the period 2000–2014 varied across regions (Figure 3). For example, in India and southeastern China, values for AOD and PARdif exhibited significant growth trends (Figure 3a,c), while those for PARdir and PARtotal showed significant declines (Figure 3b,d). The value for PARdif showed a significant growth trend, while that for AOD dropped noticeably in tropical regions (e.g., Indonesia and Congo Basin) (Figure 3a,c). Values of PARdif, PARdir and PARtotal all had increasing trends in most parts of the Southern Hemisphere (Figure 3b,d). At the global scale, the annual averages of AOD and PARdif showed upward trends (0.03 Wm−2 and 0.1 Wm−2) (Figure 3e,g), while the annual averages of PARdir (−0.3 Wm−2) and PARtotal displayed downward trends (Figure 3f,h) during the period 2000–2014.

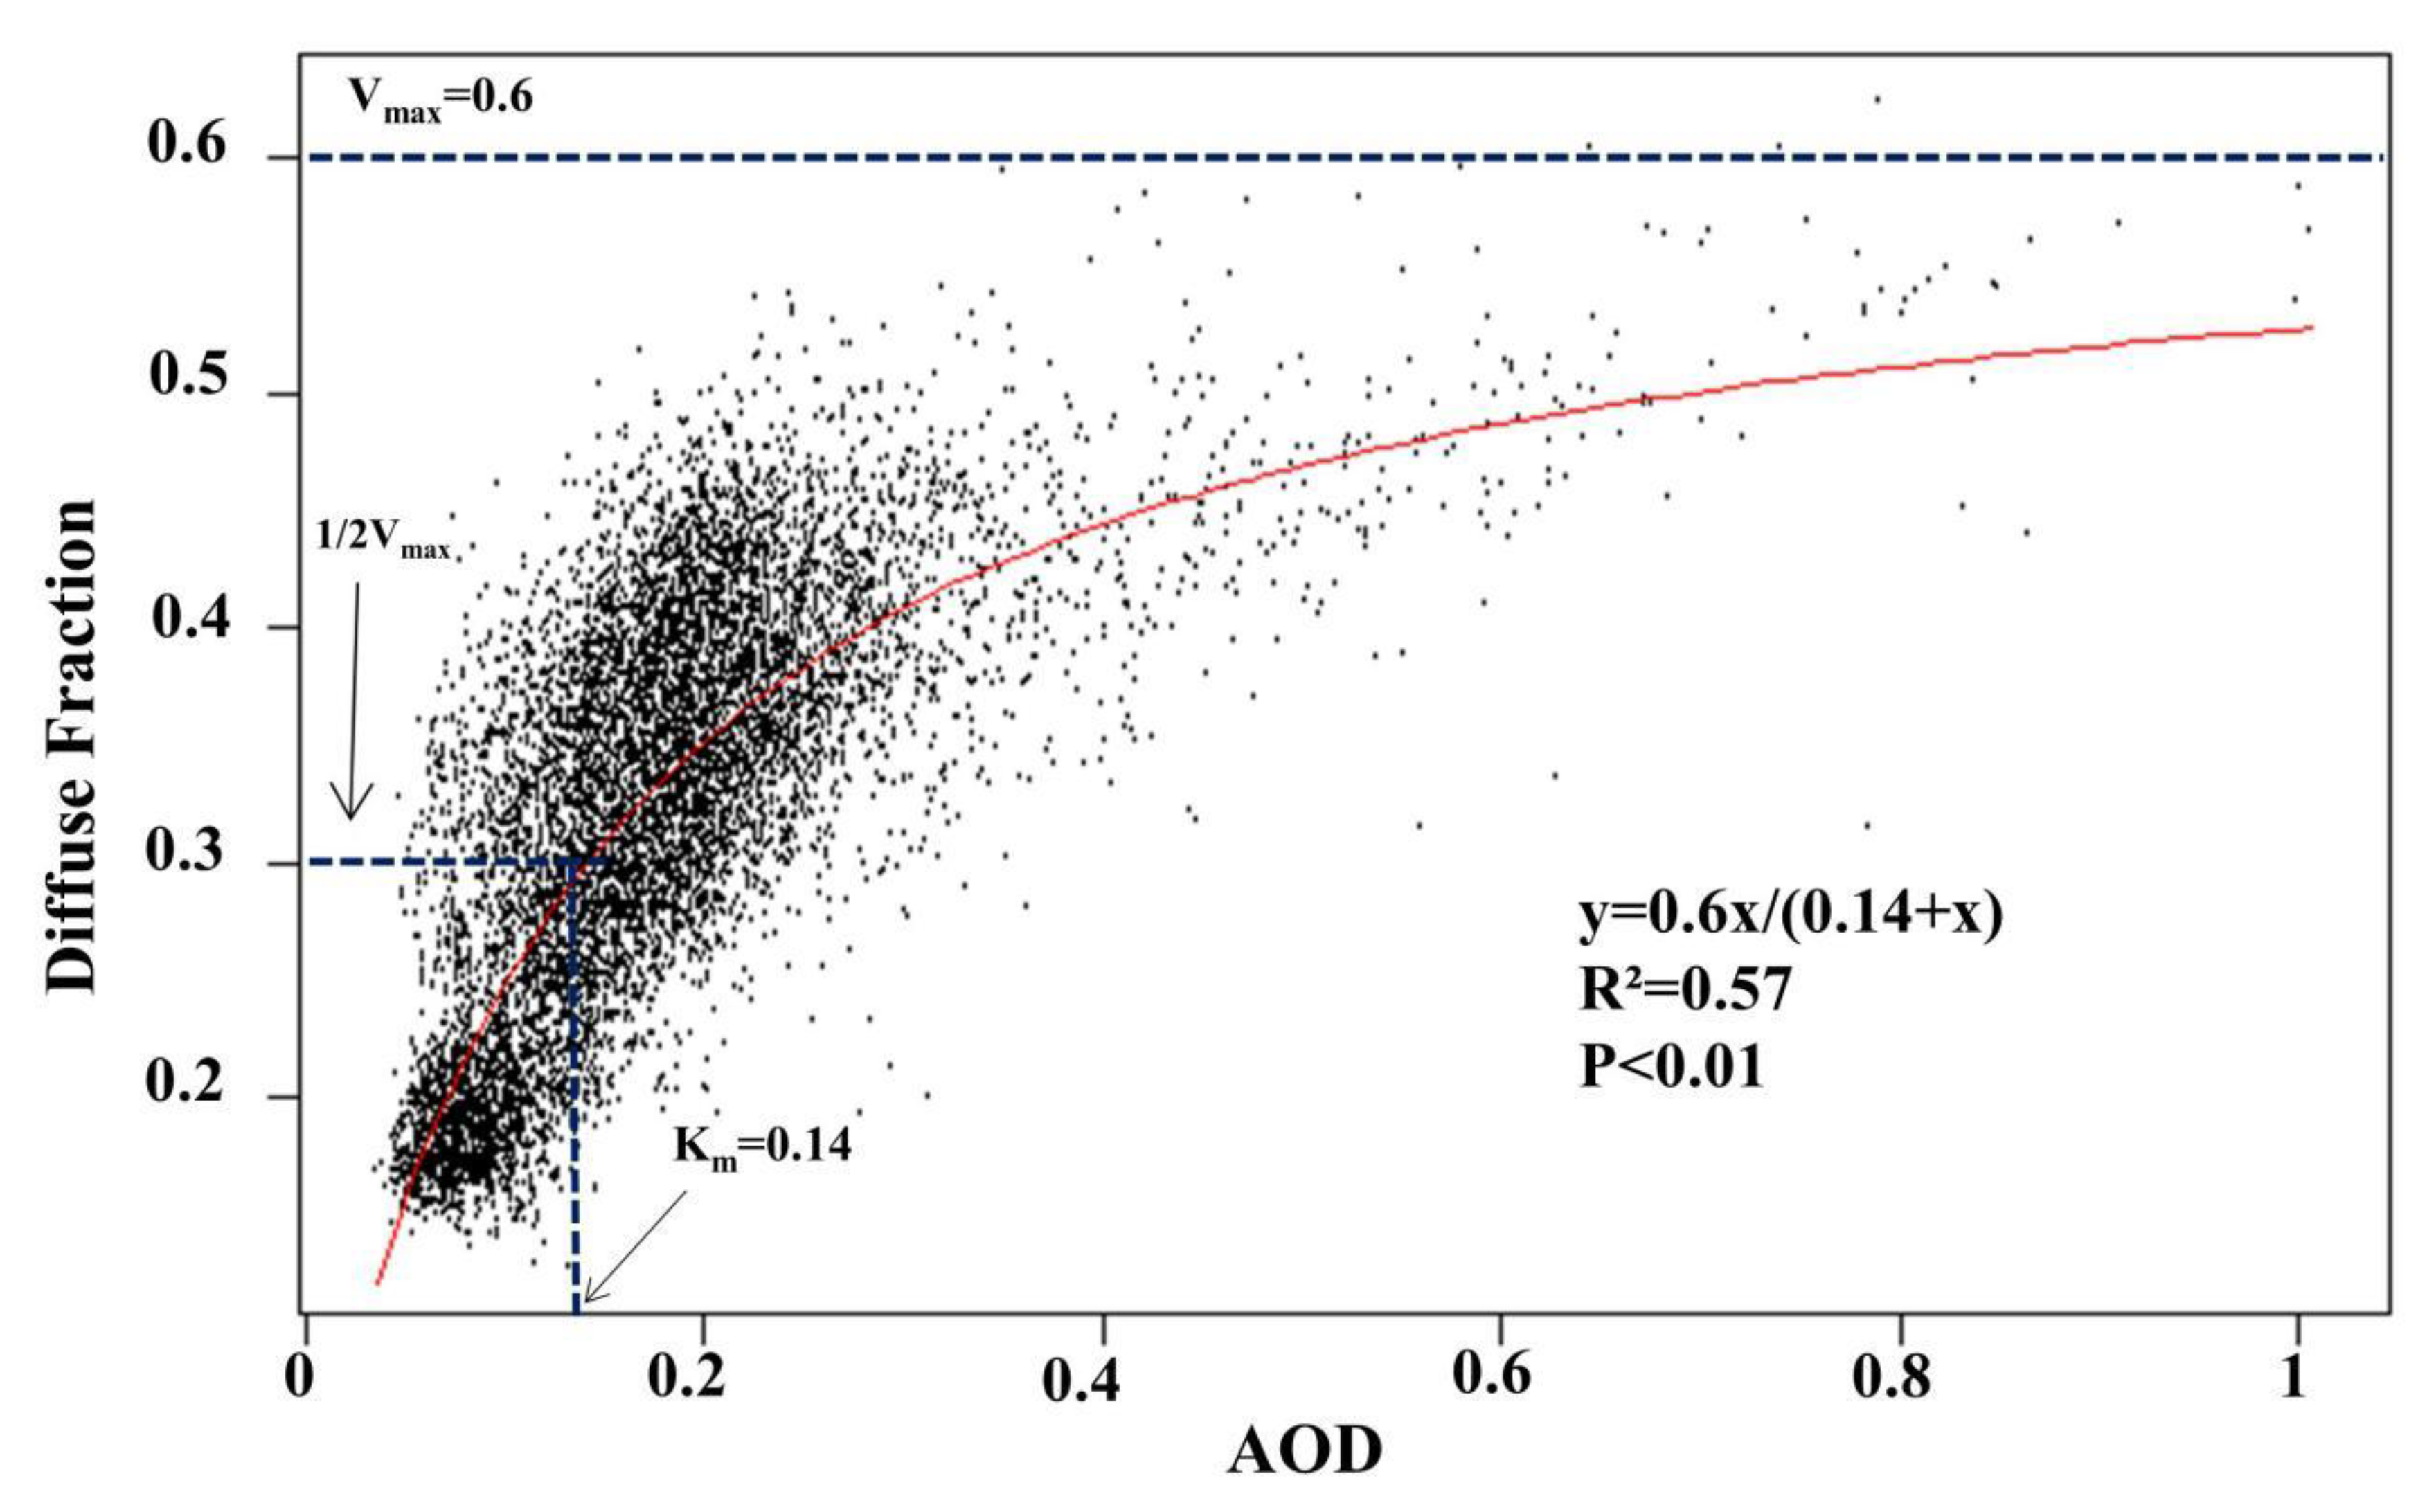
3.2. High Correlations between AOD and Df

The AOD had a high correlation with the diffusion fraction (Df) (Figure 4; R2 = 0.57, p < 0.01), and the influence of AOD on Df can be expressed by the distribution of the Michaelis–Menten equation (Equation (5): Df = Vmax × AOD/(Km + AOD), where AOD is set to range from 0.1 to 1). Among them, Vmax represents the threshold of Df that could be affected by AOD (Figure 4), that is to say, AOD will not have an impact on Df once Df exceeds this value (0.6). In addition, Km represents the AOD value (0.14) when Df is half Vmax (i.e., 0.3) (Figure 4). According to this equation, we can know the increase velocity of diffusivity under different aerosol loading. When the AOD loading was low (from 0 to 0.14), Df increases rapidly (from 0 to 0.3), which was a first-order reaction. As the value of AOD increases (from 0.14 to 1), the growth rate of Df starts to slow down (from 0.3 to 0.6), which was a second-order reaction. Overall, most of the AOD values were low, indicating a large scatter at low AOD.

3.3. Improvement of GPP Estimation by Considering the Aerosol-Radiation Effect

Compared with the EC-LUE model, the improved GPP model that considered aerosol-radiation effects (i.e., the AOD-LUE model) can more accurately estimate GPP (Figure 5a). The AOD-LUE model had higher R² (0.68) and slope (0.93) than the EC-LUE model (R2 = 0.6 and slope = 0.89). The data points of the AOD-LUE model values were more concentrated in the vicinity of the 1:1 line than those of the EC-LUE model, which indicated that the GPP values estimated by the AOD-LUE model were closer to the true values (i.e., flux tower GPP). Additionally, the simulated value of the AOD-LUE model decreased when the towers GPP was less than 7.5, and vice versa. The degree of improvement of the AOD-LUE model differed across EC sites (Figure 5b). To be more specific, the AOD-LUE model was better optimized at the EC sites where the R2 for the EC-LUE model was lower (Figure 5b). The AOD-LUE model can be greatly improved (is about 40–120%) when the R2 value of the EC-LUE model is in the range of 0–0.4., but when the R2 value of the EC-LUE model was high (i.e., R2 greater than 0.6), the R2 value of the AOD-LUE model was not greatly improved (less than 10%).
For each vegetation type, the simulation performance of the AOD-LUE model outperformed the EC-LUE model (Table 1). As compared with the EC-LUE model, the AOD-LUE model produced higher R2 and less SD across all vegetation types. The improvement was more obvious in EBF and CSH, in which the EC-LUE model has low R2 (0.35, 0.18) and high RMSE (2.21, 1.76), and the AOD-LUE model increased R2 by 0.1 and 0.11 and decreased RMSE by 0.12 and 0.17 and SD by 0.2 and 0.18. For other vegetation types such as MF, DBF, and ENF, the AOD-LUE model had slightly higher performance than the EC-LUE model. The results show that the AOD-LUE model has higher potential in some poorly simulated vegetation types.

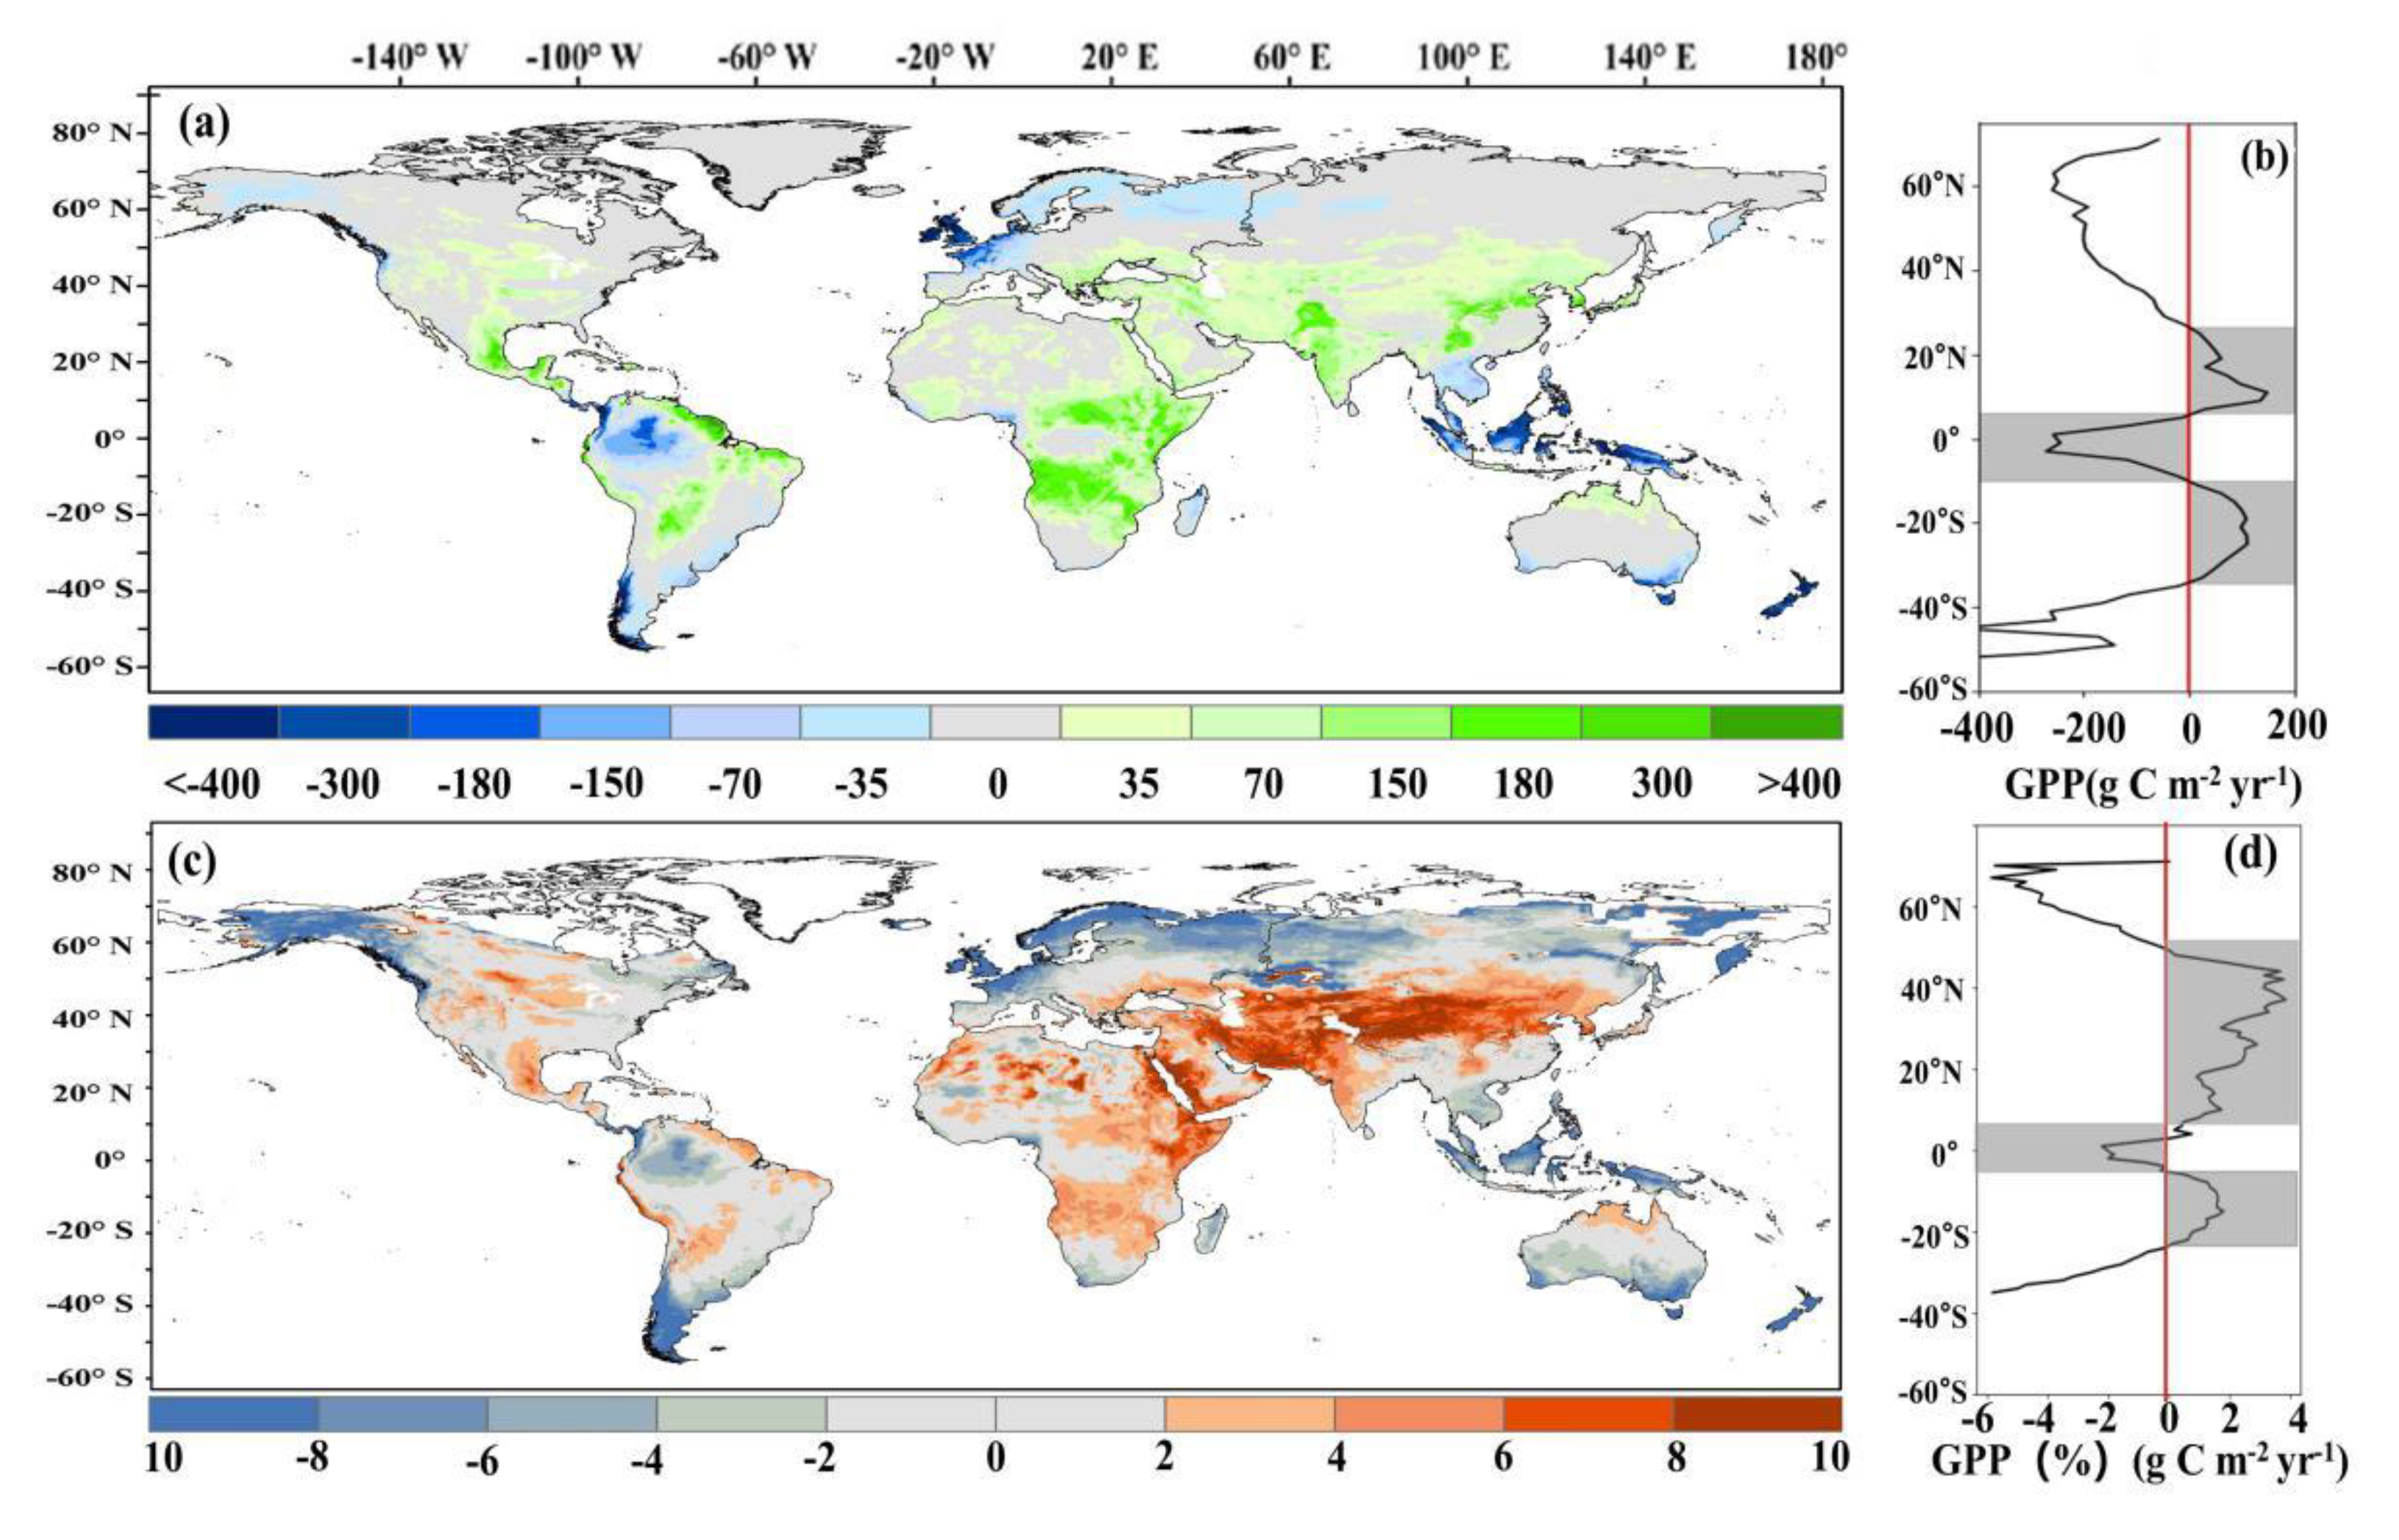
3.4. Impact of Aerosols on GPP

The impact of aerosols on GPP (ΔGPP = ±400 g C m−2 yr−1) showed spatial heterogeneity on a global scale (Figure 6a). Aerosols had positive effects on GPP in many areas across the globe, such as northern China, Central Asia, India, Europe, tropical and southern Africa, and Mexico, and the positive impact of ΔGPP could be up to 300−400 g C m−2 yr−1 (6–8%) (Figure 6a,c). The negative effects of aerosols on GPP were mainly concentrated in tropical Asia, western Europe, Amazon, and coastal areas in some regions (Figure 6a). From the perspective of latitude distribution, aerosols had a large weakening effect on ΔGPP (200 g C m−2 yr−1) in tropical and high latitude (220 g C m−2 yr−1) regions but had a large enhancement effect for most subtropical (110 g C m−2 yr−1) and temperate (80 g C m−2 yr−1) regions (Figure 6b,d). From the percentage change in the spatial distribution of GPP caused by the aerosol, it was found that there was a large substantial increase in GPP in Central Asia, the Sahara Desert, and northwestern China. The GPP values in the Amazon rainforest, Southeast Asia, and boreal forest areas declined significantly due to the impact of the aerosol (Figure 6c).
Different terrestrial ecosystems responded differently to aerosols (Figure 7). Among all vegetation types, aerosols had a positive impact of 2.38% on ΔGPP and a negative impact of 3.83%. The GPP increased for some subtropical and temperate vegetation, some drought-tolerant woods and dry grasslands, but decreased for other vegetation types, including tropical vegetation and alpine vegetation (Figure 7). Specifically, there was a negative correlation between ΔGPP and aerosols in Evergreen Broadleaf Forest (EBF) (−6.45%), Evergreen Broadleaf Forest (EBF) (−3.97%), Evergreen Needleleaf Forest (ENF) (−3.36%) and Wetlands (WET) (−4.67%). Aerosol positively influenced ΔGPP in the mainly Grassland (GRA) (3.19%) and Deciduous Broadleaf Forest (DBF) (2.63%), graminoid and Open Shrub (OSH) (2.38%), Crop (CRO) (2.19%) and Woody Savanna (WSA) (1.49%).

4. Discussion

4.1. Model Improvement by Incorporating the Effects of Diffuse Radiation

The traditional ecosystem models typically do not consider the impact of diffuse PAR [47], and have a certain deviation in simulated GPP under clear and cloudy conditions [48]. However, the changes in diffuse radiation under natural conditions are often caused by changes in aerosols, and our results found that aerosols can significantly increase diffuse PAR. Gu et al. [30] hypothesized that aerosols would increase NPP due to the increased quantum yield of diffuse light. However, the effects of diffuse light on GPP have not been quantified globally. In addition, we also found that when there was a higher Df, aerosols weakened plant photosynthesis by reduced direct PAR. Therefore, compared with previous modeling studies that only considered the total incident PAR [49,50], our research results revealed that the relative effects of diffuse PAR and direct PAR on plant growth should be considered in GPP models.
Most LUE models define GPP as the product of PAR and LUE absorbed by the vegetation canopy [2]. When PAR is affected by aerosol and changes, maximum LUE will also change [51]. In the estimation of GPP based on remote sensing, the GPP estimation caused by the structural changes of LUE can also be considered as a key component of the total error budget [21,52,53]. The LUE models like EC-LUE typically use a constant LUE independent of the biological community [48], and assume that LUE is independent of the diffuse PAR [54], which leads to the underestimation of GPP on cloudy days with more diffuse radiation.
In this research, through the AOD-LUE model, we quantified the maximum LUE parameter of PARdif and PARdir (3.61 and 1.68, respectively). The maximum LUE of PARdif is much higher than that of PARdir mainly because canopy photosynthesis tends to use light more effectively under diffuse light than direct light [55]. Most of the modeling and observational studies also proved that LUE increases when the Df increases [56,57]. The regression relationship between the GPP estimated by the EC tower data and the GPP simulated by the AOD-LUE model has a slope of 0.68, which is higher than the slope for the original EC-LUE model (Figure 5a). This means that the model with the effects of aerosols added further shows the spatial heterogeneity of global GPP [27,58].

4.2. Differences in the Impact of Aerosol Diffuse Fertilization Effect on GPP in Different Regions

According to our modeling, aerosol-induced changes in PAR have a strong impact on GPP depending on aerosol loading and cloud thickness. Moderate aerosol increases the photosynthesis of plants by increasing the Df of total PAR, while the further increase in aerosol loading can have the opposite effect due to the strong attenuation of total PAR. Moderate aerosol loading would increase plant photosynthesis and the total partition of PAR to Df, while further increases in aerosol loading could have an opposite effect due to a strong attenuation of total PAR. The key mechanism of aerosols affecting GPP is its effect on total PAR and partitioning of total PAR into direct and diffuse fractions. Diffuse PAR is more effective than direct PAR in penetrating vegetation canopy [11,30,42] and therefore has a higher LUE coefficient (3.61 g C m−2 MJ−1) than direct PAR (1.68 g C m−2 MJ−1). In addition, the aerosol diffuse fertilization effect (DFE) was very closely related to cloud cover [12,59], which caused the Df of the area to easily reach saturation and reduce the availability of light [60]. Therefore, the overall impact of aerosol DFE on GPP may be positive in areas with low cloud cover and aerosol loading, and may be negative in areas with higher cloud cover and aerosol loading.
The negative impact of aerosols on GPP is the greatest in the tropics (ΔGPP < −4%). This is mainly because tropical regions with strong evapotranspiration have limited potential for aerosol DFE due to thick cloud cover [12,61], which cannot compensate for the reduction of total PAR and direct PAR (Figure 3b,d). However, our results showed that ΔGPP > 2% is common in subtropical areas with low cloud cover, especially in some arid and semi-arid regions (ΔGPP > 3%) (Figure 6d). The cloudiness in these areas is generally low and does not inhibit the aerosol DFE [25,61] likely because the vegetation photosynthesis in these areas does not saturate [8,62] and the change of aerosol to diffuse PAR increases the potential LUE. The mean value of diffuse PAR in these areas was relatively high and exhibited an increasing trend.
However, compared with subtropical regions with moderate aerosols, southeastern China did not exhibit increases in GPP due to aerosol DFE despite a heavy aerosol loading (AOD > 0.5). Previously, Yue and Unger [63] considered the impact of aerosols and ozone pollutants on net primary productivity (NPP) and found that the aerosol DFE would increase NPP by 0.2 Pg C (5%) in eastern China. The reason why our research results are different from them is likely because we have considered that the increase of Df is limited by aerosol loading and the corresponding offsetting effect of direct PAR attenuation [25].
Although aerosols have positive and negative effects on GPP, they are even offset by positive and negative effects in the global effect. What cannot be ignored, is the change of scattered radiation caused by aerosols. Although the relationship between scattered radiation and aerosol coincidence leads to a small change in GPP, it can be compensated by the increase of LUE [10].

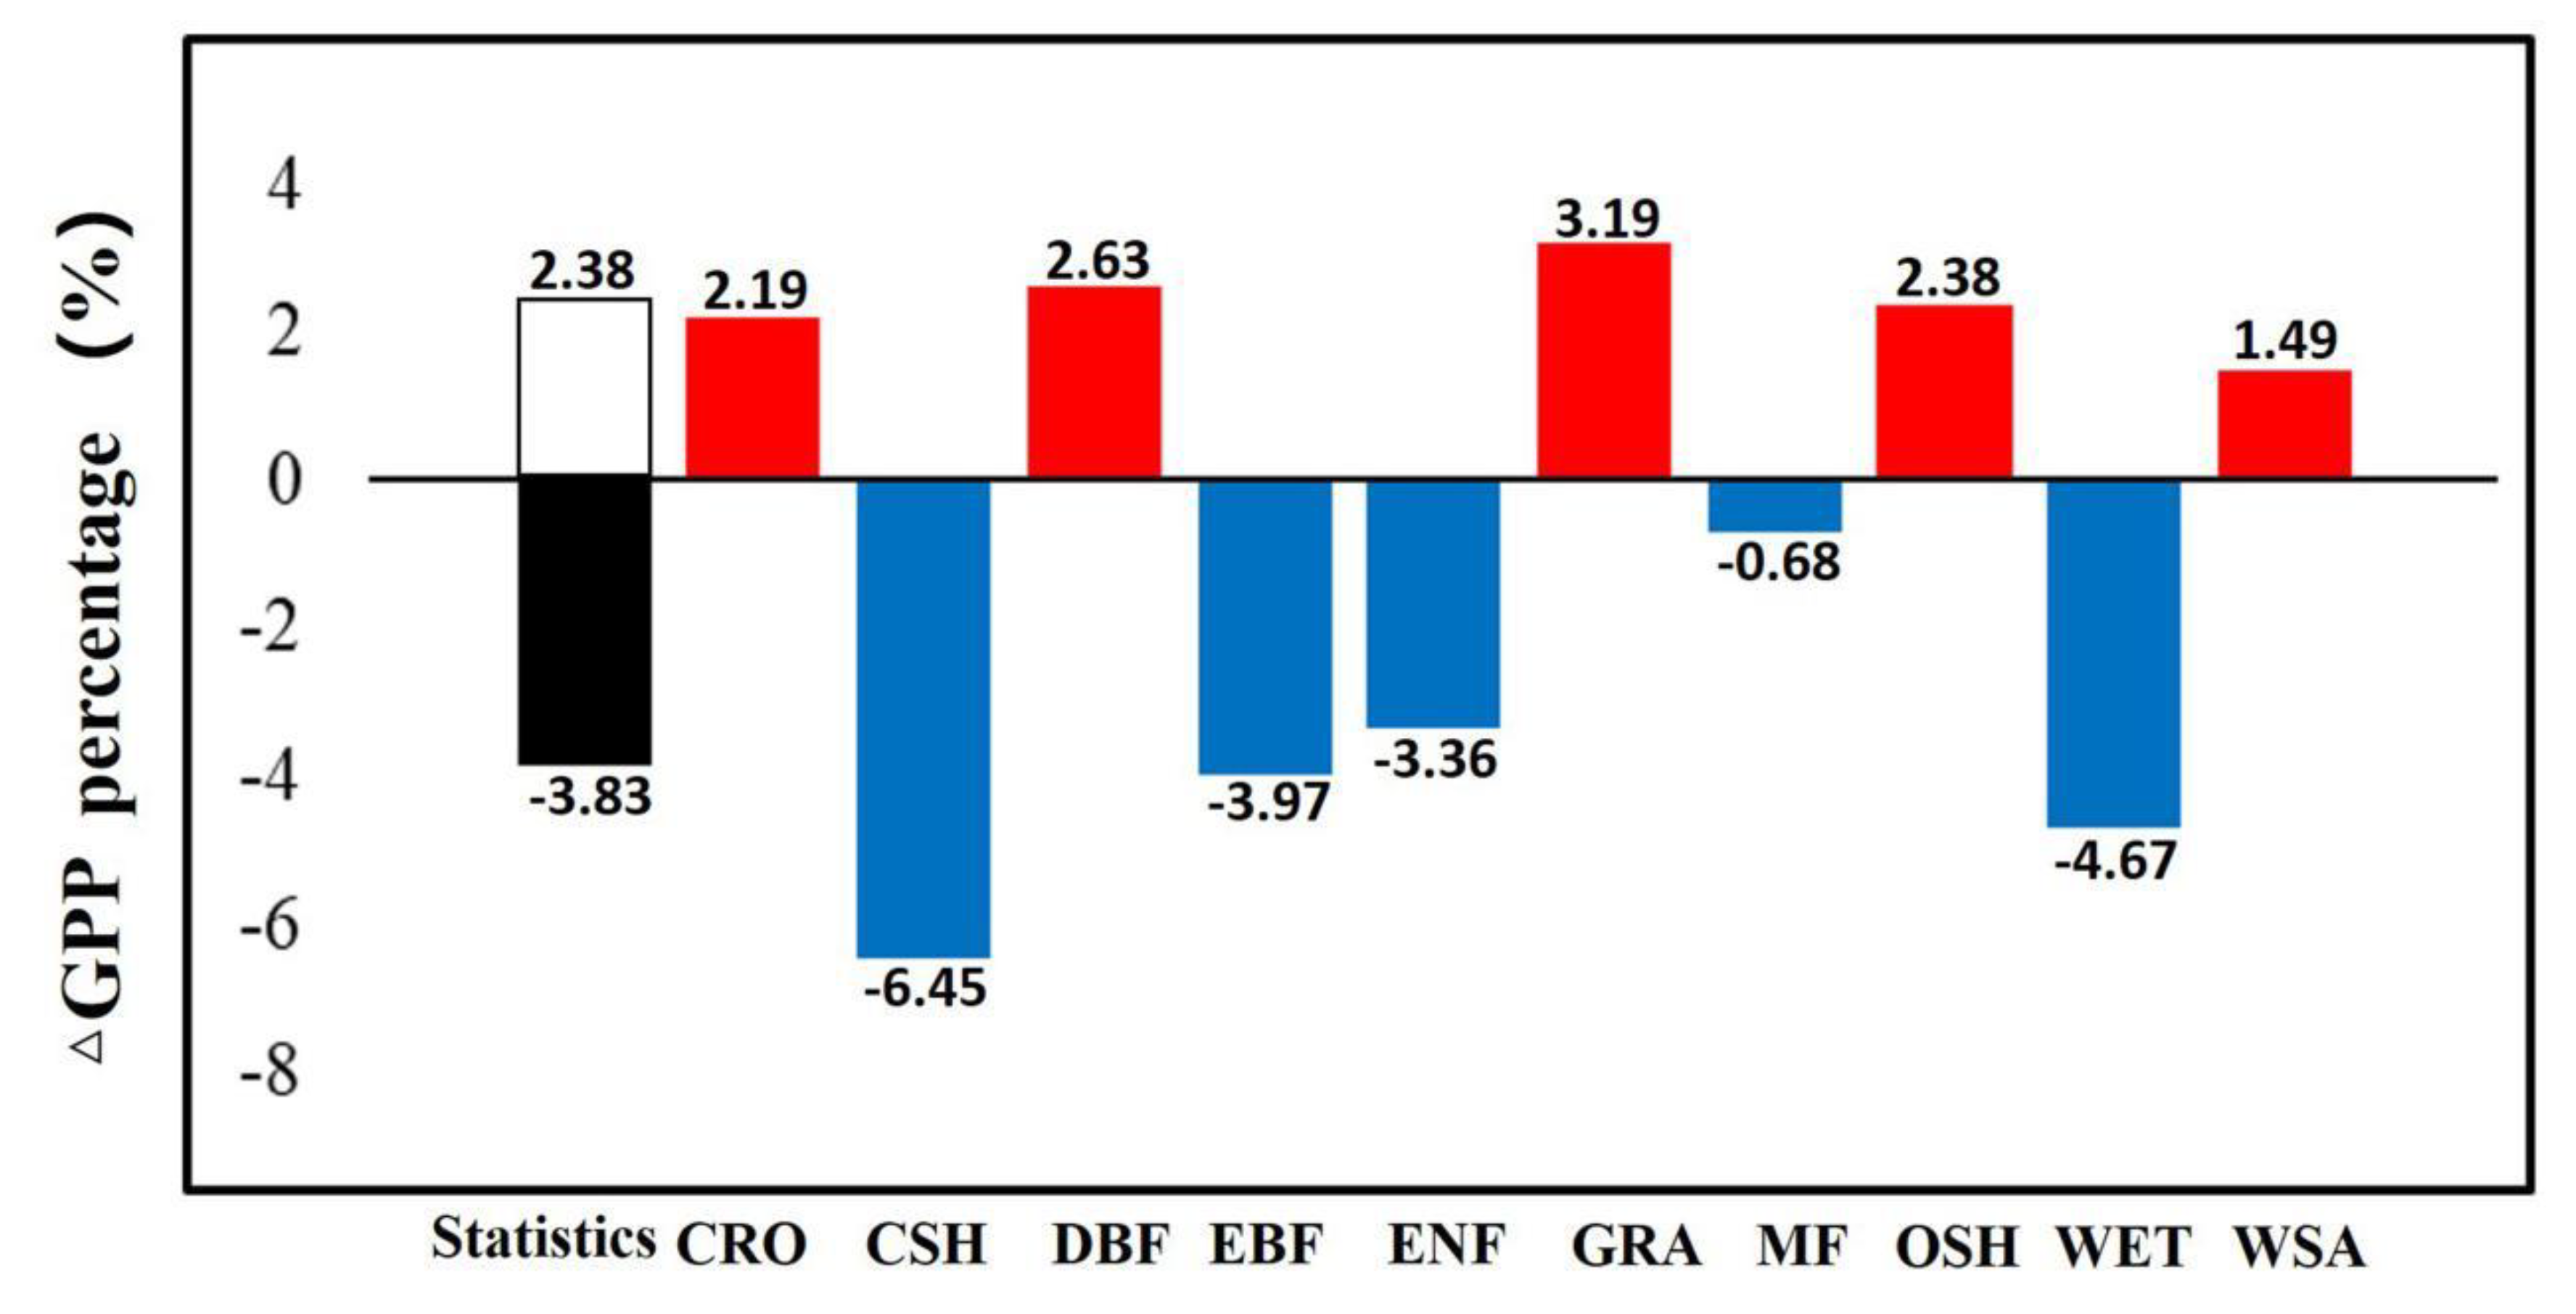
4.3. Differences in the Impact of Aerosol DFE on Different Vegetation Types

Our results show that aerosol DFE increased GPP for most broad-leaved forests. However, in coniferous forests, the aerosol greatly reduced the total PAR and reduced the ΔGPP by 3.36%. One possible explanation is that the aerosol DEF of coniferous forests is not as obvious as that of broad-leaved forests [64], which may be caused by the sparse canopy and lower leaf area index (LAI) of coniferous forests [12,65]. Another possible reason is that the negative effect by the reduction of total PAR more than offset the DEF. As a result of the increase in the proportion of leaves exposed to moderate light levels, terrestrial ecosystems with high LAI were more sensitive to diffuse radiation [66]. A modeling study by Alton et al. [67] showed that under the condition of an increased diffuse fraction, the actual LUE increased by 33% for a broad-leaved forest with an LAI of 5.05 but by only 6% for a Scottish coniferous forest with an LAI of 2. The simulations by Knohl and Baldocchi [15] using a multilayer canopy model also indicated that the aerosol DFE decreased with a decrease in LAI.
In addition, previous studies have suggested that GPP in some ecosystems with fewer leaves or open canopies, such as grasslands and wetlands, is also less sensitive to diffuse radiation [17,50]. However, in our research, we found that in some drought-tolerant grasslands (such as WSA) with low LAI, the aerosol DFE caused a significant increase in GPP (Figure 7). Jing et al. [29] found that CO2 absorption increased significantly due to aerosols and thick clouds in grasslands with extremely low LAI (0.37). There is a significant relationship between canopy structure and the aerosol DFE for the multilayer arctic shrub system with low LAI (1.5) [68]. Some previous studies also have suggested that the LAI of temperate coniferous forests and temperate deciduous forests was similar, and LAI alone cannot explain the differences in the response of GPP between plant functional types (PFTs) to the aerosol DFE [15,69]. Therefore, our results support Park et al.’s [11] view that canopy structure may be more important in determining the aerosol DFE than LAI.

4.4. Limitations and Future Needs

There are still some uncertainties in our quantitative study of the influence of aerosol on GPP. First, the current flux tower sites measure less diffuse PAR when conducting carbon and water flux observations [29,36]. Although most process-based models can now differentiate between sunlit and shaded leaves [21,36,70], field measurements are still necessary in order to parameterize the effects of diffuse PAR on LUE and photosynthesis. However, most of the diffuse radiation data used nowadays are mainly derived from experience or numerical models [67,71]. Therefore, the lack of field-based diffuse PAR measurements can lead to uncertainty in simulated effects of scattered radiation on GPP by numerical models.
Second, the indirect effects of aerosols on meteorological changes (i.e., precipitation) can also affect GPP. Yue et al. [63] found that aerosol-induced drought strongly reduced NPP, which may be due to aerosol-induced changes in evaporation and precipitation [22,72]. In addition, the indirect effects of aerosols can also change the size and distribution of cloud droplets and cloud albedo [32,73] and increase the depth and number of clouds. Clouds can also disturb the scattered radiation, surface temperature and precipitation and thus have complex effects on the terrestrial carbon cycle. Because the relationship between aerosols and clouds is so complicated, current research cannot completely separate them [74,75]. To resolve these meteorological feedbacks and accompanying mechanisms, future efforts are needed to fully couple the terrestrial biosphere, atmosphere chemistry and climate in earth system models [63].
Third, the input data also affect the simulation of the impact of aerosols on GPP. The effects of spatial resolution and uncertainty of remote sensing data on carbon fluxes cannot be ignored [76,77]. Some uncertainties in the simulation of the AOD-LUE model may be caused by the scale mismatch between the input data sets. The spatial resolution of the AOD data used in this article was 0.5° × 0.625°, while the spatial resolution of other simulated flux tower datasets was generally less than 0.03° × 0.03°. This kind of uncertainty in GPP simulation caused by data scale mismatch is inevitable [1,53]. For example, researchers Wang et al. [35] found that spatial PAR data explained 57% of the PAR variation detected at EC tower sites [78,79]. To achieve a global level of spatial resolution for GPP modeling on a large scale, the GPP model research center still must improve the quality of remote sensing data.

5. Conclusions

The relationship between aerosols and diffuse radiation was quantified and a new LUE model developed in this study to explicitly account for the diffuse fertilization effect of aerosols on GPP. By changing the structure of the widely used EC-LUE model, the maximum LUE of diffuse PAR and direct PAR were incorporated and parameterized. In comparison with the original model (EC-LUE), the new model (AOD-LUE) shows fairly good performance across different biomes (R2 = 0.68, p < 0.01). The model was then used to simulate GPP at the global level from 2000–2014. We then used the AOD-LUE model to simulate GPP at the global scale for the period 2000–2014. With the global-scale GPP estimates, we quantified the effects of aerosol radiation on GPP regionally and globally and for different vegetation types. Although the total effect is low, it still needs attention, because the total effect is offset by both positive and negative aspects, but the positive and negative effects of different regions are very large. Aerosols mainly have a relatively large negative impact on Closed Shrub (CSH) (ΔGPP = −6.45%), and a positive impact on arid and semi-arid regions (GRA) (ΔGPP = 3.19%) in the subtropical zone. Our results showed that the effects of aerosol radiation have severely affected the global GPP. Separating PAR to diffuse and direct components and incorporating their relative effects to LUE models are effective for improving the accuracy of the GPP simulation at regional to global scales.

Supplementary Materials

The following supporting information can be downloaded at: https://www.mdpi.com/article/10.3390/rs14122759/s1, Figure S1: Spatial pattern of global GPP simulated by the AOD-LUE model during 2000–2019: (a) averaged annual GPP; (b) trend of annual GPP (g C m−2 yr−1); Table S1: Information of the eddy covariance (EC) sites used in this study for model calibration and validation.

Author Contributions

S.L. designed the research; Y.S. (Yamei Shu), S.L. performed research; and Y.S. (Yamei Shu), S.L., Z.W., J.X., Y.S. (Yi Shi), X.P., H.G., Y.W., W.Y. (Wenping Yuan), W.Y. (Wende Yan), Y.N. and Q.L. contributed to the writing of the paper. All authors have read and agreed to the published version of the manuscript.

Funding

This research was funded by the National Natural Science Foundation of China (Grants No. 41971152 and U20A2089); and the Hunan Innovative Talent Program (Grant No. 2019RS1062) to S.L.

Data Availability Statement

The FLUXNET2015 dataset (Available online: http://www.fluxdata.org, accessed on 11 March 11 2020). The aerosol optical depths (AOD) for 550-nm wavelengths are available from the Office of Global Modeling and Assimilation (GMAO) of NASA (Available online: https://disc.gsfc.nasa.gov/datasets/, accessed on 14 July 2021). The CERES PAR data are available online (Available online: https://ceres-tool.larc.nasa.gov/ord-tool/jsp/SYN1degEd41Selection.jsp,accessed on 3 May 2021). The global potential natural vegetation (PNV) map at 1 km spatial resolution (Available online: https://doi.org/10.7910/DVN/QQHCIK, accessed on 18 February 18 2021).

Acknowledgments

The project was supported by the research grants from the National Natural Science Foundation of China (U20A2089 and 41971152) and Hunan Innovative Talent Program (2019RS1062) to S Liu. We would especially like to thank the eddy covariance data acquired and shared by the FLUXNET (Available online: http://fluxnet.fluxdata.org/data/fluxnet2015-dataset/, accessed on 9 June 2020).

Conflicts of Interest

The authors declare no conflict of interest.

References

  1. Sjöström, M.; Zhao, M.; Archibald, S.; Arneth, A.; Cappelaere, B.; Falk, U.; de Grandcourt, A.; Hanan, N.; Kergoat, L.; Kutsch, W.; et al. Evaluation of MODIS gross primary productivity for Africa using eddy covariance data. Remote Sens. Environ. 2013, 131, 275–286. [Google Scholar] [CrossRef]
  2. Yuan, W.; Cai, W.; Xia, J.; Chen, J.; Liu, S.; Dong, W.; Merbold, L.; Law, B.; Arain, A.; Beringer, J.; et al. Global comparison of light use efficiency models for simulating terrestrial vegetation gross primary production based on the LaThuile database. Agric. For. Meteorol. 2014, 192, 108–120. [Google Scholar] [CrossRef]
  3. Bunn, A.G.; Goetz, S.J. Trends in satellite-observed circumpolar photosynthetic activity from 1982 to 2003: The influence of seasonality, cover type, and vegetation density. Earth Interact. 2006, 10, 1–19. [Google Scholar] [CrossRef] [Green Version]
  4. Cirino, G.G.; Souza, R.A.F.; Adams, D.K.; Artaxo, P. The effect of atmospheric aerosol particles and clouds on net ecosystem exchange in the Amazon. Atmos. Chem. Phys. 2014, 14, 6523–6543. [Google Scholar] [CrossRef] [Green Version]
  5. Kanniah, K.D.; Beringer, J.; Tapper, N.J.; Long, C.N. Aerosols and their influence on radiation partitioning and savanna productivity in northern Australia. Theor. Appl. Climatol. 2010, 100, 423–438. [Google Scholar] [CrossRef]
  6. Mahowald, N. Aerosol indirect effect on biogeochemical cycles and climate. Science 2011, 334, 794–796. [Google Scholar] [CrossRef]
  7. Pachauri, B.; Kumar, A.; Dhar, J. Software reliability growth modeling with dynamic faults and release time optimization using GA and MAUT. Appl. Math. Comput. 2014, 242, 500–509. [Google Scholar] [CrossRef]
  8. Yue, X.; Unger, N. Fire air pollution reduces global terrestrial productivity. Nat. Commun. 2018, 9, 1–9. [Google Scholar] [CrossRef]
  9. Matsui, H.; Mahowald, N. Development of a global aerosol model using a two-dimensional sectional method: 2. Evaluation and sensitivity simulations. J. Adv. Modeling Earth Syst. 2017, 9, 1887–1920. [Google Scholar] [CrossRef]
  10. Ezhova, E.; Ylivinkka, I.; Kuusk, J.; Komsaare, K.; Vana, M.; Krasnova, A.; Noe, S.; Arshinov, M.; Belan, B.; Park, S.-B.; et al. Direct effect of aerosols on solar radiation and gross primary production in boreal and hemiboreal forests. Atmos. Chem. Phys. 2018, 18, 17863–17881. [Google Scholar] [CrossRef] [Green Version]
  11. Park, S.-B.; Knohl, A.; Lucas-Moffat, A.M.; Migliavacca, M.; Gerbig, C.; Vesala, T.; Peltola, O.; Mammarella, I.; Kolle, O.; Lavrič, J.V.; et al. Strong radiative effect induced by clouds and smoke on forest net ecosystem productivity in central Siberia. Agric. For. Meteorol. 2018, 250, 376–387. [Google Scholar] [CrossRef]
  12. Mercado, L.M.; Bellouin, N.; Sitch, S.; Boucher, O.; Huntingford, C.; Wild, M.; Cox, P.M. Impact of changes in diffuse radiation on the global land carbon sink. Nature 2009, 458, 1014–1017. [Google Scholar] [CrossRef] [PubMed] [Green Version]
  13. Doughty, C.E.; Flanner, M.G.; Goulden, M.L. Effect of smoke on subcanopy shaded light, canopy temperature, and carbon dioxide uptake in an Amazon rainforest. Glob. Biogeochem. Cycles 2010, 24, 693–709. [Google Scholar] [CrossRef]
  14. Kuniyal, J.C.; Guleria, R.P. The current state of aerosol-radiation interactions: A mini review. J. Aerosol Sci. 2019, 130, 45–54. [Google Scholar] [CrossRef]
  15. Knohl, A.; Baldocchi, D.D. Effects of diffuse radiation on canopy gas exchange processes in a forest ecosystem. J. Geophys. Res. Biogeosciences 2008, 113, 108708. [Google Scholar] [CrossRef]
  16. Moreira, D.S.; Longo, K.M.; Freitas, S.R.; Yamasoe, M.A.; Mercado, L.M.; Rosário, N.E.; Gloor, E.; Viana, R.S.M.; Miller, J.B.; Gatti, L.V.; et al. Modeling the radiative effects of biomass burning aerosols on carbon fluxes in the Amazon region. Atmos. Chem. Phys. 2017, 17, 14785–14810. [Google Scholar] [CrossRef] [Green Version]
  17. Letts, M.G.; Lafleur, P.M.; Roulet, N.T. On the relationship between cloudiness and net ecosystem carbon dioxide exchange in a peatland ecosystem. Ecoscience 2005, 12, 53–69. [Google Scholar] [CrossRef]
  18. Letts, M.G.; Mulligan, M. The impact of light quality and leaf wetness on photosynthesis in north-west Andean tropical montane cloud forest. J. Trop. Ecol. 2005, 21, 549–557. [Google Scholar] [CrossRef]
  19. Fernández-Martínez, M.; Vicca, S.; Janssens, I.A.; Ciais, P.; Obersteiner, M.; Bartrons, M.; Sardans, J.; Verger, A.; Canadell, J.G.; Chevallier, F.; et al. Atmospheric deposition, CO2, and change in the land carbon sink. Sci. Rep. 2017, 7, 1–13. [Google Scholar] [CrossRef]
  20. Greenwald, R.; Bergin, M.H.; Xu, J.; Cohan, D.; Hoogenboom, G.; Chameides, W.L. The influence of aerosols on crop production: A study using the CERES crop model. Agric. Syst. 2006, 89, 390–413. [Google Scholar] [CrossRef]
  21. He, M.; Ju, W.; Zhou, Y.; Chen, J.; He, H.; Wang, S.; Wang, H.; Guan, D.; Yan, J.; Li, Y.; et al. Development of a two-leaf light use efficiency model for improving the calculation of terrestrial gross primary productivity. Agric. For. Meteorol. 2013, 173, 28–39. [Google Scholar] [CrossRef]
  22. Bellouin, N.; Quaas, J.; Gryspeerdt, E.; Kinne, S.; Stier, P.; Watson-Parris, D.; Boucher, O.; Carslaw, K.S.; Christensen, M.; Daniau, A.-L.; et al. Bounding global aerosol radiative forcing of climate change. Rev. Geophys. 2020, 58, e2019RG000660. [Google Scholar] [CrossRef] [PubMed] [Green Version]
  23. Forkel, R.; Werhahn, J.; Hansen, A.B.; McKeen, S.; Peckham, S.; Grell, G.; Suppan, P. Effect of aerosol-radiation feedback on regional air quality–A case study with WRF/Chem. Atmos. Environ. 2012, 53, 202–211. [Google Scholar] [CrossRef]
  24. Krakauer, N.Y.; Randerson, J.T. Do volcanic eruptions enhance or diminish net primary production? Evidence from tree rings. Glob. Biogeochem. Cycles 2003, 17, 1118. [Google Scholar] [CrossRef]
  25. Cohan, D.S.; Xu, J.; Greenwald, R.; Bergin, M.H.; Chameides, W.L. Impact of atmospheric aerosol light scattering and absorption on terrestrial net primary productivity. Glob. Biogeochem. Cycles 2002, 16, 37-1–37-12. [Google Scholar] [CrossRef]
  26. Lee, M.S.; Hollinger, D.Y.; Keenan, T.F.; Ouimette, A.P.; Ollinger, S.V.; Richardson, A.D. Model-based analysis of the impact of diffuse radiation on CO2 exchange in a temperate deciduous forest. Agric. For. Meteorol. 2018, 249, 377–389. [Google Scholar] [CrossRef] [Green Version]
  27. Wang, J.; Ge, Y.; Heuvelink, G.B.M.; Zhou, C. Spatial sampling design for estimating regional GPP with spatial heterogeneities. IEEE Geosci. Remote Sens. Lett. 2013, 11, 539–543. [Google Scholar] [CrossRef]
  28. Feng, Y.; Chen, D.; Zhao, X. Impact of aerosols on terrestrial gross primary productivity in North China using an improved boreal ecosystem productivity simulator with satellite-based aerosol optical depth. GIScience Remote Sens. 2020, 57, 258–270. [Google Scholar] [CrossRef]
  29. Jing, X.; Huang, J.; Wang, G.; Higuchi, K.; Bi, J.; Sun, Y.; Yu, H.; Wang, T. The effects of clouds and aerosols on net ecosystem CO2 exchange over semi-arid Loess Plateau of Northwest China. Atmos. Chem. Phys. 2010, 10, 8205–8218. [Google Scholar] [CrossRef] [Green Version]
  30. Gu, L. Advantages of diffuse radiation for terrestrial ecosystem productivity. J. Geophys. Res. Atmos. 2002, 107, ACL 2-1–ACL 2-23. [Google Scholar] [CrossRef] [Green Version]
  31. Yuan, W.; Liu, S.; Yu, G.; Bonnefond, J.; Chen, J.; Davis, K.; Desai, A.R.; Goldstein, A.H.; Gianelle, D.; Rossi, F.; et al. Global estimates of evapotranspiration and gross primary production based on MODIS and global meteorology data. Remote Sens. Environ. 2010, 114, 1416–1431. [Google Scholar] [CrossRef] [Green Version]
  32. Fanourgakis, G.S.; Kanakidou, M.; Nenes, A.; Bauer, S.E.; Bergman, T.; Carslaw, K.S.; Yu, F. Evaluation of global simulations of aerosol particle and cloud condensation nuclei number, with implications for cloud droplet formation. Atmos. Chem. Phys. 2019, 19, 8591–8617. [Google Scholar] [CrossRef] [PubMed] [Green Version]
  33. Matsui, T.; Beltrán-Przekurat, A.; Niyogi, D.; Pielke, R.A.; Coughenour, M. Aerosol light scattering effect on terrestrial plant productivity and energy fluxes over the eastern United States. J. Geophys. Res. Atmos. 2008, 113, D14S14. [Google Scholar] [CrossRef] [Green Version]
  34. Olmo, F. A comparison of ground level solar radiative effects of recent volcanic eruptions. Atmos. Environ. 1999, 33, 4589–4596. [Google Scholar] [CrossRef]
  35. Wang, Z.; Liu, S.; Wang, Y.; Valbuena, R.; Wu, Y.; Kutia, M.; Zheng, Y.; Lu, W.; Zhu, Y.; Zhao, M.; et al. Tighten the Bolts and Nuts on GPP Estimations from Sites to the Globe: An Assessment of Remote Sensing Based LUE Models and Supporting Data Fields. Remote Sens. 2021, 13, 168. [Google Scholar] [CrossRef]
  36. Zhang, B.C.; Cao, J.J.; Bai, Y.F.; Yang, S.J.; Hu, L.; Ning, Z.G. Effects of cloudiness on carbon dioxide exchange over an irrigated maize cropland in northwestern China. Biogeosciences Discuss. 2011, 8, 1669–1691. [Google Scholar]
  37. Yuan, W.; Liu, S.; Zhou, G.; Zhou, G.; Tieszen, L.L.; Baldocchi, D.; Bernhofer, C.; Gholz, H.; Goldstein, A.H.; Goulden, M.L.; et al. Deriving a light use efficiency model from eddy covariance flux data for predicting daily gross primary production across biomes. Agric. For. Meteorol. 2007, 143, 189–207. [Google Scholar] [CrossRef] [Green Version]
  38. Pastorello, G.; Trotta, C.; Canfora, E.; Chu, H.; Christianson, D.; Cheah, Y.; Poindexter, C.; Chen, J.; Elbashandy, A.; Humphrey, M.; et al. The FLUXNET2015 dataset and the ONEFlux processing pipeline for eddy covariance data. Sci. Data 2020, 7, 1–27. [Google Scholar] [CrossRef]
  39. Buchard, V.; Randles, C.A.; da Silva, A.M.; Darmenov, A.; Colarco, P.R.; Govindaraju, R.; Ferrare, R.; Hair, J.; Beyersdorf, A.J.; Ziemba, L.D.; et al. The MERRA-2 aerosol reanalysis, 1980 onward. Part II: Evaluation and case studies. J. Clim. 2017, 30, 6851–6872. [Google Scholar] [CrossRef]
  40. Wielicki, B.A.; Barkstrom, B.R.; Harrison, E.F.; Lee, R.B., III; Smith, G.L.; Cooper, J.E. Clouds and the Earth’s Radiant Energy System (CERES): An earth observing system experiment. Bull. Am. Meteorol. Soc. 1996, 77, 853–868. [Google Scholar] [CrossRef] [Green Version]
  41. Sims, D.A.; Rahman, A.F.; Cordova, V.D.; Baldocchi, D.D.; Flanagan, L.B.; Goldstein, A.H.; Hollinger, D.Y.; Misson, L.; Monson, R.K.; Schmid, H.P.; et al. Midday values of gross CO2 flux and light use efficiency during satellite overpasses can be used to directly estimate eight-day mean flux. Agric. For. Meteorol. 2005, 131, 1–12. [Google Scholar] [CrossRef]
  42. Rap, A.; Scott, C.E.; Reddington, C.L.; Mercado, L.; Ellis, R.J.; Garraway, S.; Evans, M.J.; Beerling, D.J.; MacKenzie, A.R.; Hewitt, C.N.; et al. Enhanced global primary production by biogenic aerosol via diffuse radiation fertilization. Nat. Geosci. 2018, 11, 640–644. [Google Scholar] [CrossRef] [Green Version]
  43. Chai, T.; Draxler, R.R. Root mean square error (RMSE) or mean absolute error (MAE)?–Arguments against avoiding RMSE in the literature. Geosci. Model Dev. 2014, 7, 1247–1250. [Google Scholar] [CrossRef] [Green Version]
  44. Ozer, D.J. Correlation and the coefficient of determination. Psychol. Bull. 1985, 97, 307. [Google Scholar] [CrossRef]
  45. Leng, L.; Zhang, T.; Kleinman, L.; Zhu, W. Ordinary least square regression, orthogonal regression, geometric mean regression and their applications in aerosol science. J. Phys. Conf. Ser. 2007, 78, 012084. [Google Scholar] [CrossRef]
  46. Hengl, T.; Walsh, M.G.; Sanderman, J.; Wheeler, I.; Harrison, S.P.; Prentice, I.C. Global mapping of potential natural vegetation: An assessment of machine learning algorithms for estimating land potential. PeerJ 2018, 6, e5457. [Google Scholar] [CrossRef] [Green Version]
  47. Yan, H.; Wang, S.; Yu, K.; Wang, B.; Yu, Q.; Bohrer, G.; Billesbach, D.; Bracho, R.; Rahman, F.; Shugart, H.H. A novel diffuse fraction-based two-leaf light use efficiency model: An application quantifying photosynthetic seasonality across 20 AmeriFlux flux tower sites. J. Adv. Modeling Earth Syst. 2017, 9, 2317–2332. [Google Scholar] [CrossRef] [Green Version]
  48. Wang, S.; Huang, K.; Yan, H.; Yan, H.; Zhou, L.; Wang, H.; Zhang, J.; Yan, J.; Zhao, L.; Wang, Y.; et al. Improving the light use efficiency model for simulating terrestrial vegetation gross primary production by the inclusion of diffuse radiation across ecosystems in China. Ecol. Complex. 2015, 23, 1–13. [Google Scholar] [CrossRef]
  49. Mäkelä, A.; Kolari, P.; Karimäki, J.; Nikinmaa, E.; Perämäki, M.; Hari, P. Modelling five years of weather-driven variation of GPP in a boreal forest. Agric. For. Meteorol. 2006, 139, 382–398. [Google Scholar] [CrossRef]
  50. Verma, M.; Friedl, M.A.; Law, B.E.; Bonal, D.; Kiely, G.; Black, T.A.; Wohlfahrt, G.; Moors, E.J.; Montagnani, L.; Marcolla, B.; et al. Improving the performance of remote sensing models for capturing intra-and inter-annual variations in daily GPP: An analysis using global FLUXNET tower data. Agric. For. Meteorol. 2015, 214, 416–429. [Google Scholar] [CrossRef] [Green Version]
  51. Drolet, G.G.; Middleton, E.M.; Huemmrich, K.F.; Hall, F.G.; Amiro, B.D.; Barr, A.G.; Black, T.A.; McCaughey, J.H.; Margolis, H.A. Regional mapping of gross light-use efficiency using MODIS spectral indices. Remote Sens. Environ. 2008, 112, 3064–3078. [Google Scholar] [CrossRef]
  52. Propastin, P.; Ibrom, A.; Knohl, A.; Erasmi, S. Effects of canopy photosynthesis saturation on the estimation of gross primary productivity from MODIS data in a tropical forest. Remote Sens. Environ. 2012, 121, 252–260. [Google Scholar] [CrossRef]
  53. Zheng, Y.; Zhang, L.; Xiao, J.; Yuan, W.; Yan, M.; Li, T.; Zhang, Z. Sources of uncertainty in gross primary productivity simulated by light use efficiency models: Model structure, parameters, input data, and spatial resolution. Agric. For. Meteorol. 2018, 263, 242–257. [Google Scholar] [CrossRef]
  54. Wang, S.; Ibrom, A.; Bauer-Gottwein, P.; Garcia, M. Incorporating diffuse radiation into a light use efficiency and evapotranspiration model: An 11-year study in a high latitude deciduous forest. Agric. For. Meteorol. 2018, 248, 479–493. [Google Scholar] [CrossRef] [Green Version]
  55. Matsuda, R.; Ohashi-Kaneko, K.; Fujiwara, K.; Goto, E.; Kurata, K. Photosynthetic characteristics of rice leaves grown under red light with or without supplemental blue light. Plant Cell Physiol. 2004, 45, 1870–1874. [Google Scholar] [CrossRef] [PubMed]
  56. Chen, M.; Zhuang, Q. Evaluating aerosol direct radiative effects on global terrestrial ecosystem carbon dynamics from 2003 to 2010. Tellus B Chem. Phys. Meteorol. 2014, 66, 21808. [Google Scholar] [CrossRef] [Green Version]
  57. Chen, M.; Zhuang, Q.; He, Y. An efficient method of estimating downward solar radiation based on the MODIS observations for the use of land surface modeling. Remote Sens. 2014, 6, 7136–7157. [Google Scholar] [CrossRef] [Green Version]
  58. Gelybó, G.; Barcza, Z.; Kern, A.; Kljun, N. Effect of spatial heterogeneity on the validation of remote sensing based GPP estimations. Agric. For. Meteorol. 2013, 174, 43–53. [Google Scholar] [CrossRef]
  59. Butt, N.; New, M.; Lizcano, G.; Malhi, Y. Spatial patterns and recent trends in cloud fraction and cloud-related diffuse radiation in Amazonia. J. Geophys. Res. Atmos. 2009, 114, 100760. [Google Scholar] [CrossRef] [Green Version]
  60. Still, C.J.; Riley, W.J.; Biraud, S.C.; Noone, D.C.; Buenning, N.H.; Randerson, J.T.; Torn, M.S.; Welker, J.; White, J.W.C.; Vachon, R.; et al. Influence of clouds and diffuse radiation on ecosystem-atmosphere CO2 and CO18O exchanges. J. Geophys. Res. Biogeosciences 2009, 114, 108849. [Google Scholar] [CrossRef] [Green Version]
  61. Lu, Z.; Liu, X.; Zhang, Z.; Zhao, C.; Meyer, K.; Rajapakshe, C.; Penner, J.E. Biomass smoke from southern Africa can significantly enhance the brightness of stratocumulus over the southeastern Atlantic Ocean. Proc. Natl. Acad. Sci. USA 2018, 115, 2924–2929. [Google Scholar] [CrossRef] [PubMed] [Green Version]
  62. Zhao, S.; Zhang, H.; Feng, S.; Fu, Q. Simulating direct effects of dust aerosol on arid and semi-arid regions using an aerosol–climate coupled system. Int. J. Climatol. 2015, 35, 1858–1866. [Google Scholar] [CrossRef]
  63. Yue, X.; Unger, N.; Harper, K.; Xia, X.; Liao, H.; Zhu, T.; Xiao, J.; Feng, Z.; Li, J. Ozone and haze pollution weakens net primary productivity in China. Atmos. Chem. Phys. 2017, 17, 6073–6089. [Google Scholar] [CrossRef] [Green Version]
  64. Niyogi, D. Direct observations of the effects of aerosol loading on net ecosystem CO2 exchanges over different landscapes. Geophys. Res. Lett. 2004, 31, L20506. [Google Scholar] [CrossRef] [Green Version]
  65. Rap, A.; Spracklen, D.V.; Mercado, L.; Reddington, C.L.; Haywood, J.M.; Ellis, R.J.; Phillips, O.L.; Artaxo, P.; Bonal, D.; Restrepo Coupe, N.; et al. Fires increase Amazon forest productivity through increases in diffuse radiation. Geophys. Res. Lett. 2015, 42, 4654–4662. [Google Scholar] [CrossRef]
  66. Gu, L.; Baldocchi, D.D.; Wofsy, S.C.; Munger, J.W.; Michalsky, J.J.; Urbanski, S.P.; Boden, T.A. Response of a deciduous forest to the Mount Pinatubo eruption: Enhanced photosynthesis. Science 2003, 299, 2035–2038. [Google Scholar] [CrossRef] [Green Version]
  67. Alton, P. Reduced carbon sequestration in terrestrial ecosystems under overcast skies compared to clear skies. Agric. For. Meteorol. 2008, 148, 1641–1653. [Google Scholar] [CrossRef]
  68. Williams, M.; Rastetter, E.B.; van der Pol, L.; Shaver, G.R. Arctic canopy photosynthetic efficiency enhanced under diffuse light, linked to a reduction in the fraction of the canopy in deep shade. New Phytol. 2014, 202, 1267–1276. [Google Scholar] [CrossRef]
  69. Oliveira, P.J.; Davin, E.L.; Levis, S.; Seneviratne, S.I. Vegetation-mediated impacts of trends in global radiation on land hydrology: A global sensitivity study. Glob. Chang. Biol. 2011, 17, 3453–3467. [Google Scholar] [CrossRef]
  70. Wang, Y.-P.; Leuning, R. A two-leaf model for canopy conductance, photosynthesis and partitioning of available energy I: Model description and comparison with a multi-layered model. Agric. For. Meteorol. 1998, 91, 89–111. [Google Scholar] [CrossRef]
  71. Zhang, M.; Yu, G.-R.; Zhang, L.-M.; Sun, X.-M.; Wen, X.-F.; Han, S.-J.; Yan, J.-H. Impact of cloudiness on net ecosystem exchange of carbon dioxide in different types of forest ecosystems in China. Biogeosciences 2010, 7, 711–722. [Google Scholar] [CrossRef] [Green Version]
  72. Gu, L.; Baldocchi, D.D.; Wofsy, S.C.; Munger, J.W.; Michalsky, J.J.; Urbanski, S.P.; Boden, T.A. Flood or drought: How do aerosols affect precipitation? Science 2008, 321, 1309–1313. [Google Scholar]
  73. Costantino, L.; Bréon, F.-M. Aerosol indirect effect on warm clouds over South-East Atlantic, from co-located MODIS and CALIPSO observations. Atmos. Chem. Phys. 2013, 13, 69–88. [Google Scholar] [CrossRef] [Green Version]
  74. Loeb, N.G.; Schuster, G.L. An observational study of the relationship between cloud, aerosol and meteorology in broken low-level cloud conditions. J. Geophys. Res. Atmos. 2008, 113, 4. [Google Scholar] [CrossRef] [Green Version]
  75. Sekiguchi, M. A study of the direct and indirect effects of aerosols using global satellite data sets of aerosol and cloud parameters. J. Geophys. Res. Atmos. 2003, 108, 30073–30089. [Google Scholar] [CrossRef]
  76. Tan, B.; Woodcock, C.E.; Hu, J.; Zhang, P.; Ozdogan, M.; Huang, D.; Yang, W.; Knyazikhin, Y.; Myneni, R.B. The impact of gridding artifacts on the local spatial properties of MODIS data: Implications for validation, compositing, and band-to-band registration across resolutions. Remote Sens. Environ. 2006, 105, 98–114. [Google Scholar] [CrossRef]
  77. Xiao, J.; Davis, K.J.; Urban, N.M.; Keller, K.; Saliendra, N.Z. Upscaling carbon fluxes from towers to the regional scale: Influence of parameter variability and land cover representation on regional flux estimates. J. Geophys. Res. Biogeosci. 2011, 116, 112893. [Google Scholar] [CrossRef] [Green Version]
  78. Damm, A. Modeling the impact of spectral sensor configurations on the FLD retrieval accuracy of sun-induced chlorophyll fluorescence. Remote Sens. Environ. 2011, 115, 1882–1892. [Google Scholar] [CrossRef]
  79. Susan, M.; Ray, D.J.; Philip, N.S.; Philippe, M.T. Evaluation of simplified procedures for retrieval of land surface reflectance factors from satellite sensor output. Remote Sens. Environ. 1992, 41, 169–184. [Google Scholar]
Figure 1. Geographical distribution of the eddy covariance (EC) flux sites used in this study. Green circles stand for sites used for calibration, while blue triangles indicate sites used for validation.
Remotesensing 14 02759 g001
Figure 2. The spatial distribution of annual mean values of (a) AOD, (b) PARdir (W m−2), (c) PARdif (W m−2), and (d) PARtotal (W m−2) from 2000 to 2014 globally.
Remotesensing 14 02759 g002
Figure 3. The spatial distribution of the trends in mean of (a) AOD, (b) PARdir (W m−2), (c) PARdif (W m−2), and (d) PARtotal (W m−2) from 2000 to 2014. The map insets in (ad) show the significance level of the trends of AOD, PARdif, PARdir, and PARtotal, respectively, with the red area indicating significant trends (p-value < 0.05) and the black area indicating insignificant trends. The temporal variation of annual AOD, PARdir, PARdif and PARtotal that were spatially averaged over the globe are illustrated in (eh), respectively; the red lines are the fitting lines.
Remotesensing 14 02759 g003
Figure 4. Scatter plot of daily diffuse fraction (Df) and daily AOD of flux tower sites globally. The red line is fitted by the Michaelis–Menten equation in clear sky. Vmax represents the maximum Df, and Km represents the AOD value at half of the maximum Df.
Remotesensing 14 02759 g004
Figure 5. (a) Comparison of GPP (g C m−2 day−1) calculated by EC-LUE model and AOD-LUE model with GPP based on EC flux towers. The dotted red line shows the intersection of the two models. (b) illustrates how the AOD-LUE model compares with the EC-LUE model when the changed percentage value of R2 ((AOD-LUE − EC-LUE)/EC-LUE) × 100) varies with the R2 value of the EC-LUE model.
Remotesensing 14 02759 g005
Figure 6. The spatial distribution of aerosol effects on global (a) ΔGPP (g C m−2 yr−1) and the variation of its annual (b) latitude from 2000 to 2019.The percentage changes in the spatial distribution of (c) ΔGPP (%) (GPP(AOD-LUE) − GPP(EC-LUE)/GPP(EC-LUE) × 100) caused by aerosols and the variation of its (d) latitude from 2000 to 2019.
Remotesensing 14 02759 g006
Figure 7. Percentage changes in GPP caused by aerosols globally and in different biomes: Crop (CRO). Closed Shrub (CSH), Deciduous Broadleaf Forest (DBF), Evergreen Broadleaf Forest (EBF), Evergreen Needleleaf Forest (ENF), Grassland (GRA), Mixed Forest (MF), Open Shrub (OSH), Wetlands (WET), Woody Savanna (WSA).
Remotesensing 14 02759 g007
Table 1. The performance of AOD-LUE and EC-LUE in simulating GPP for each vegetation type.
EC-LUEAOD-LUE
Vegetation TypesAbbreviationRMSESDRMSESD
CropCRO0.78 ***3.046.200.80 ***2.975.64
Closed ShrubCSH0.18 **2.761.880.29 **2.591.69
Deciduous Broadleaf ForestDBF0.79 ***2.795.780.81 ***2.775.23
Evergreen Broadleaf ForestEBF0.35 **2.212.070.45 **2.091.87
Evergreen Needleleaf ForestENF0.61 ***1.792.030.66 ***1.731.86
GrasslandGRA0.72 ***2.823.260.76 ***2.712.95
Mixed ForestMF0.71 ***1.913.050.77 ***1.752.68
Open ShrubOSH0.65 ***0.660.810.68 ***0.590.74
WetlandsWET0.68 ***2.404.510.72 ***2.214.14
Woody SavannaWSA0.63 ***1.601.800.67 ***1.461.65
*** p <0.001; ** 0.001≤ p < 0.01 (2-tailed).
Publisher’s Note: MDPI stays neutral with regard to jurisdictional claims in published maps and institutional affiliations.

