
Fire Monitoring Algorithm and Its Application on the Geo-Kompsat-2A Geostationary Meteorological Satellite


Abstract
:1. Introduction
2. Date and Method
2.1. Study Area
2.2. Instrument Features
2.3. Data Preprocessing
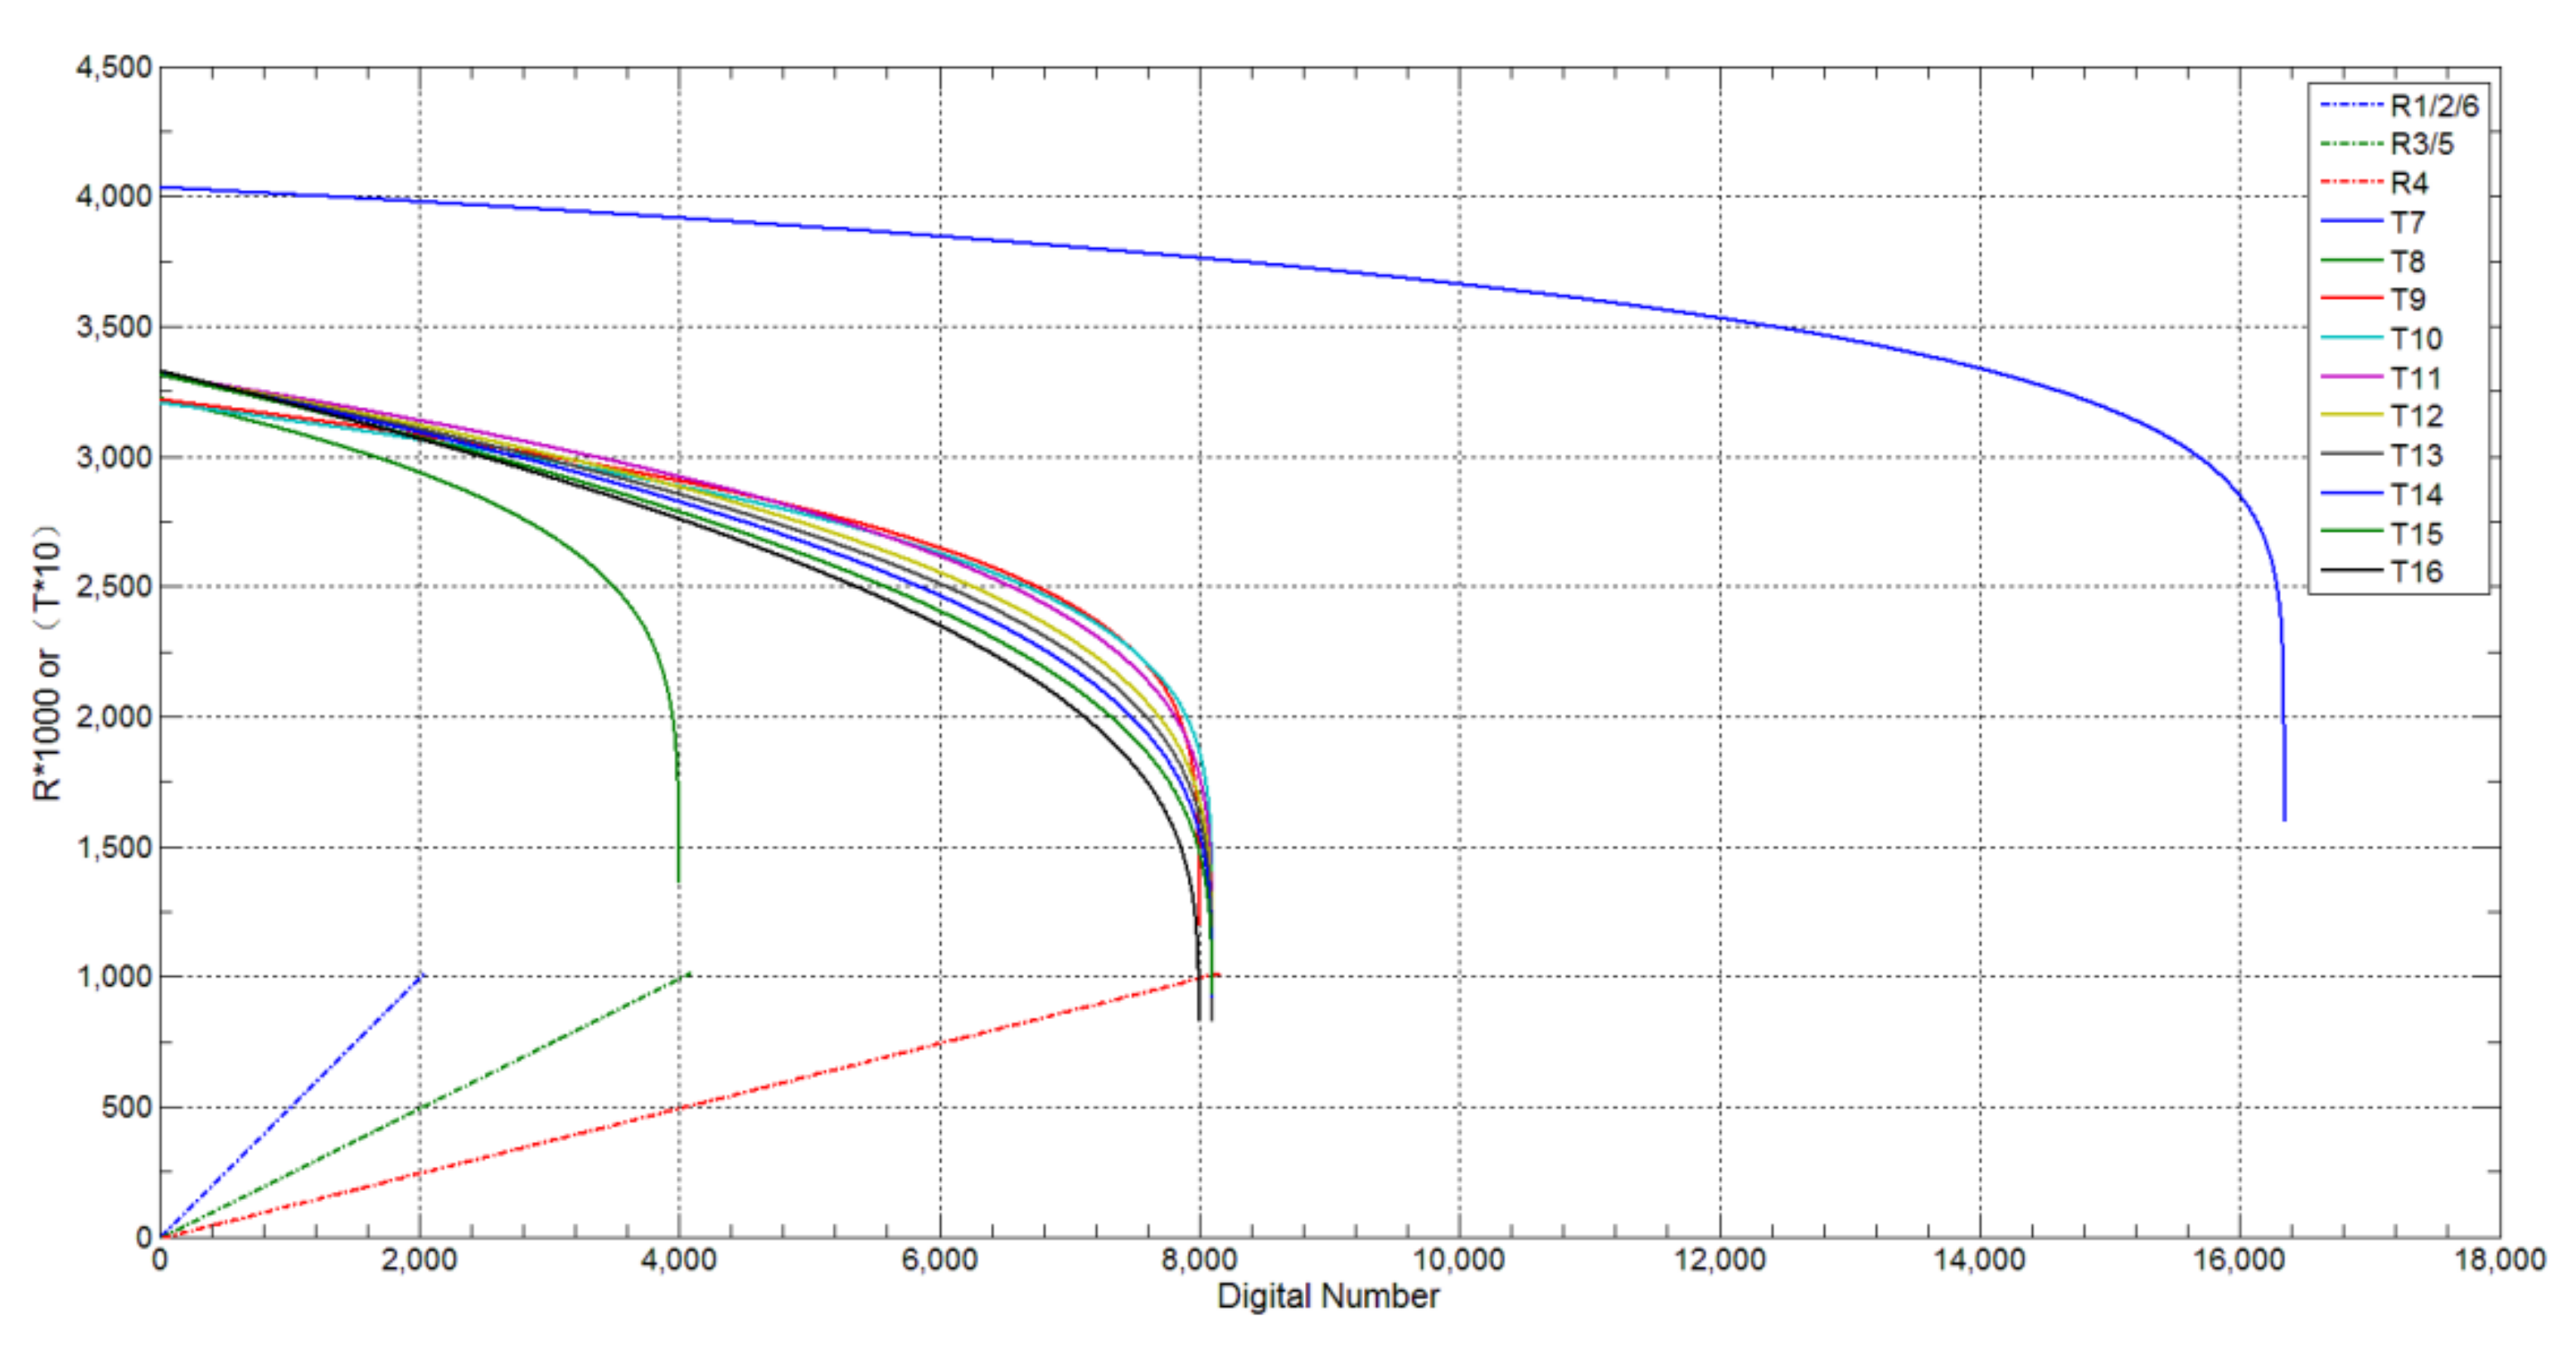
2.3.1. Channel Calibration and Reflectivity Correction
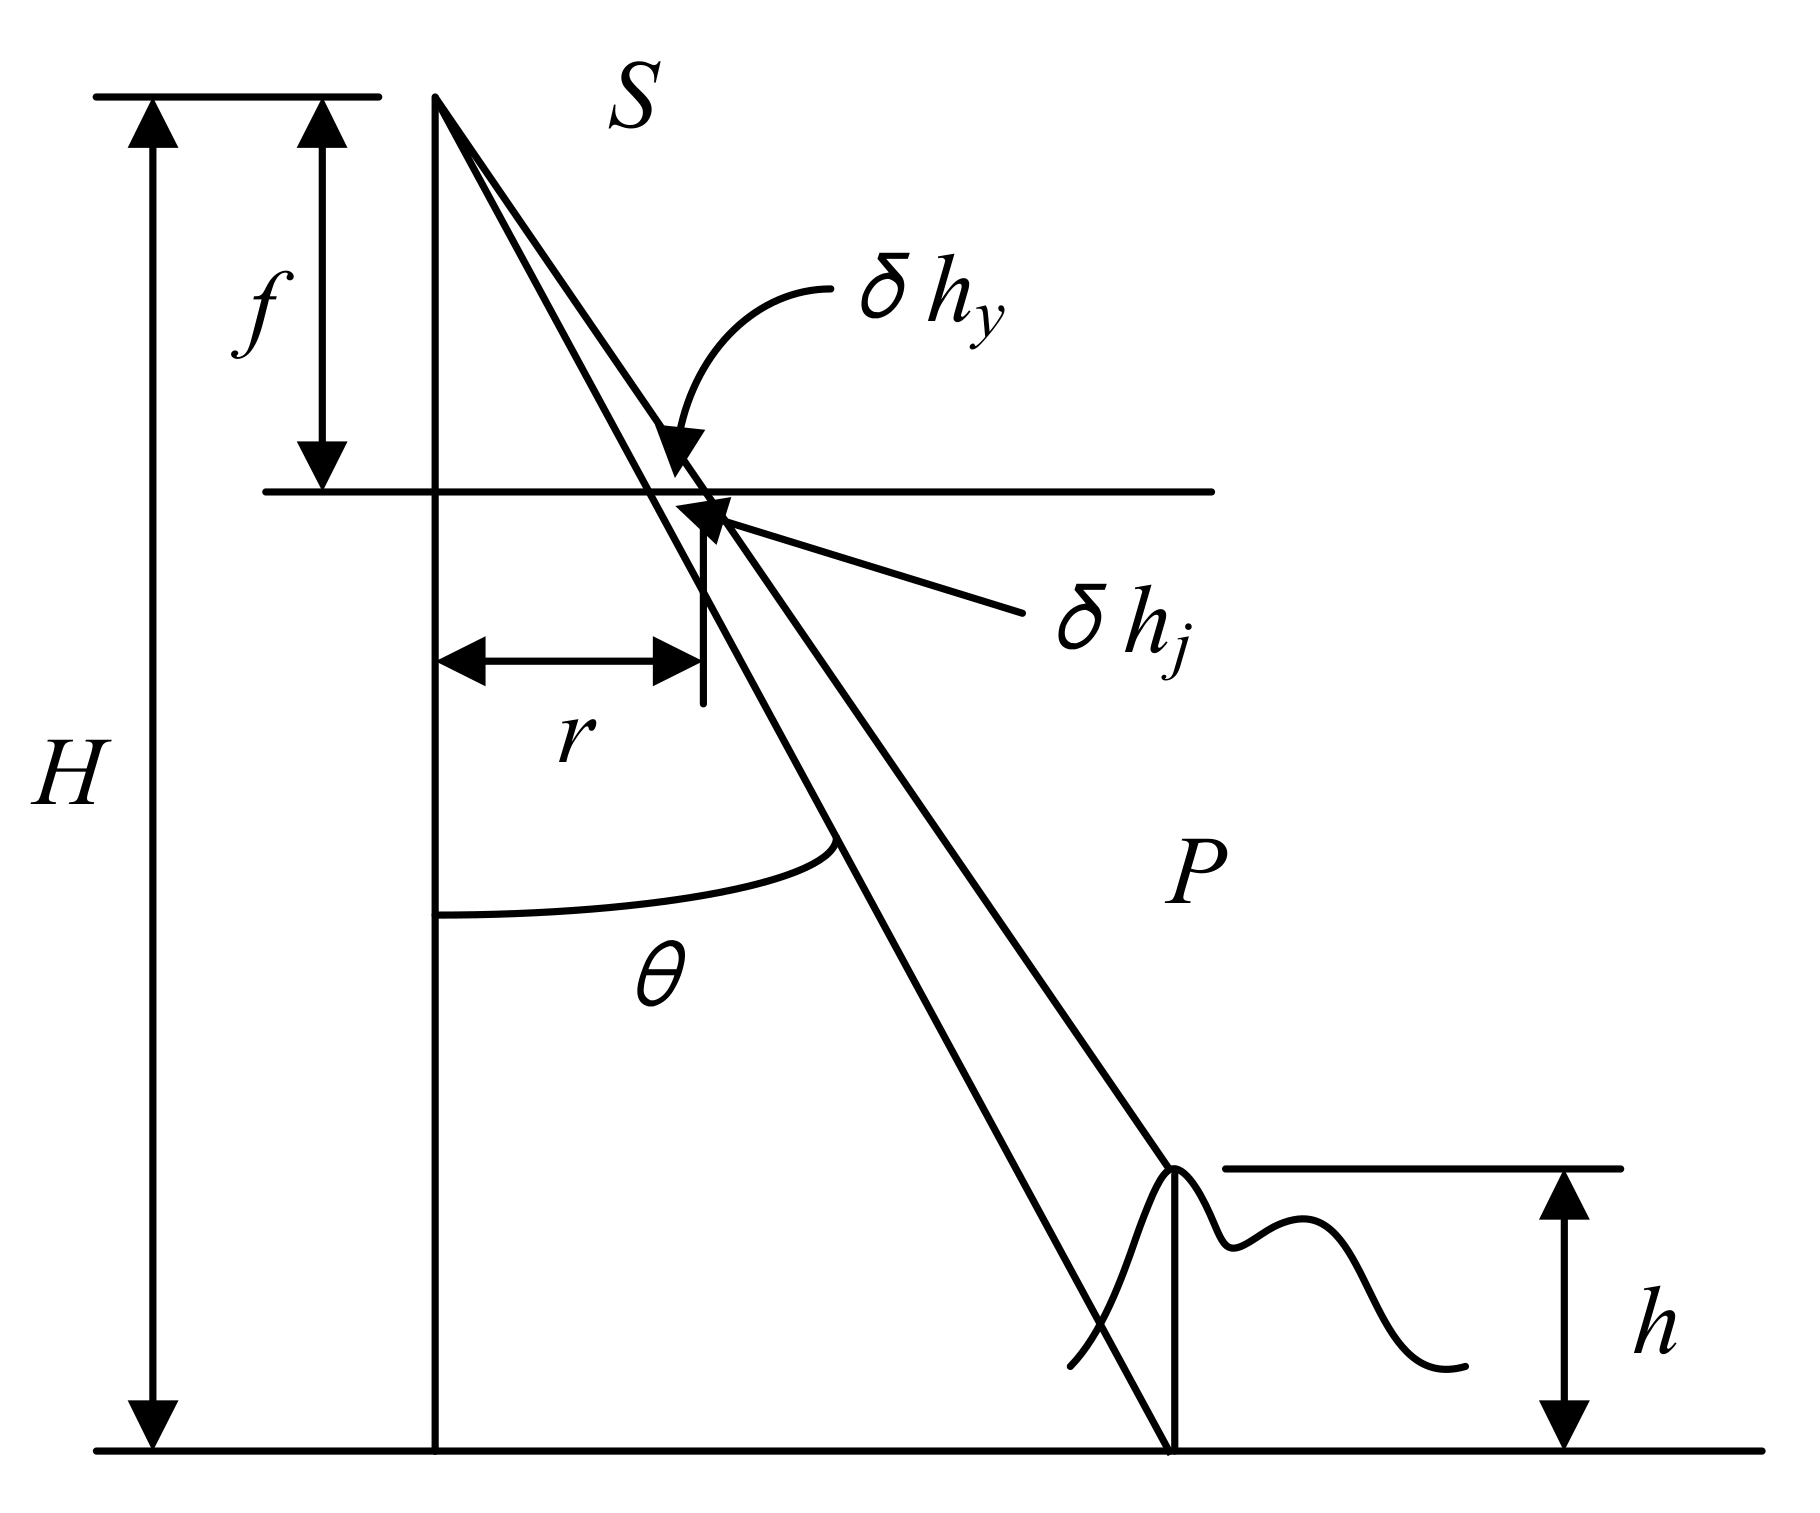
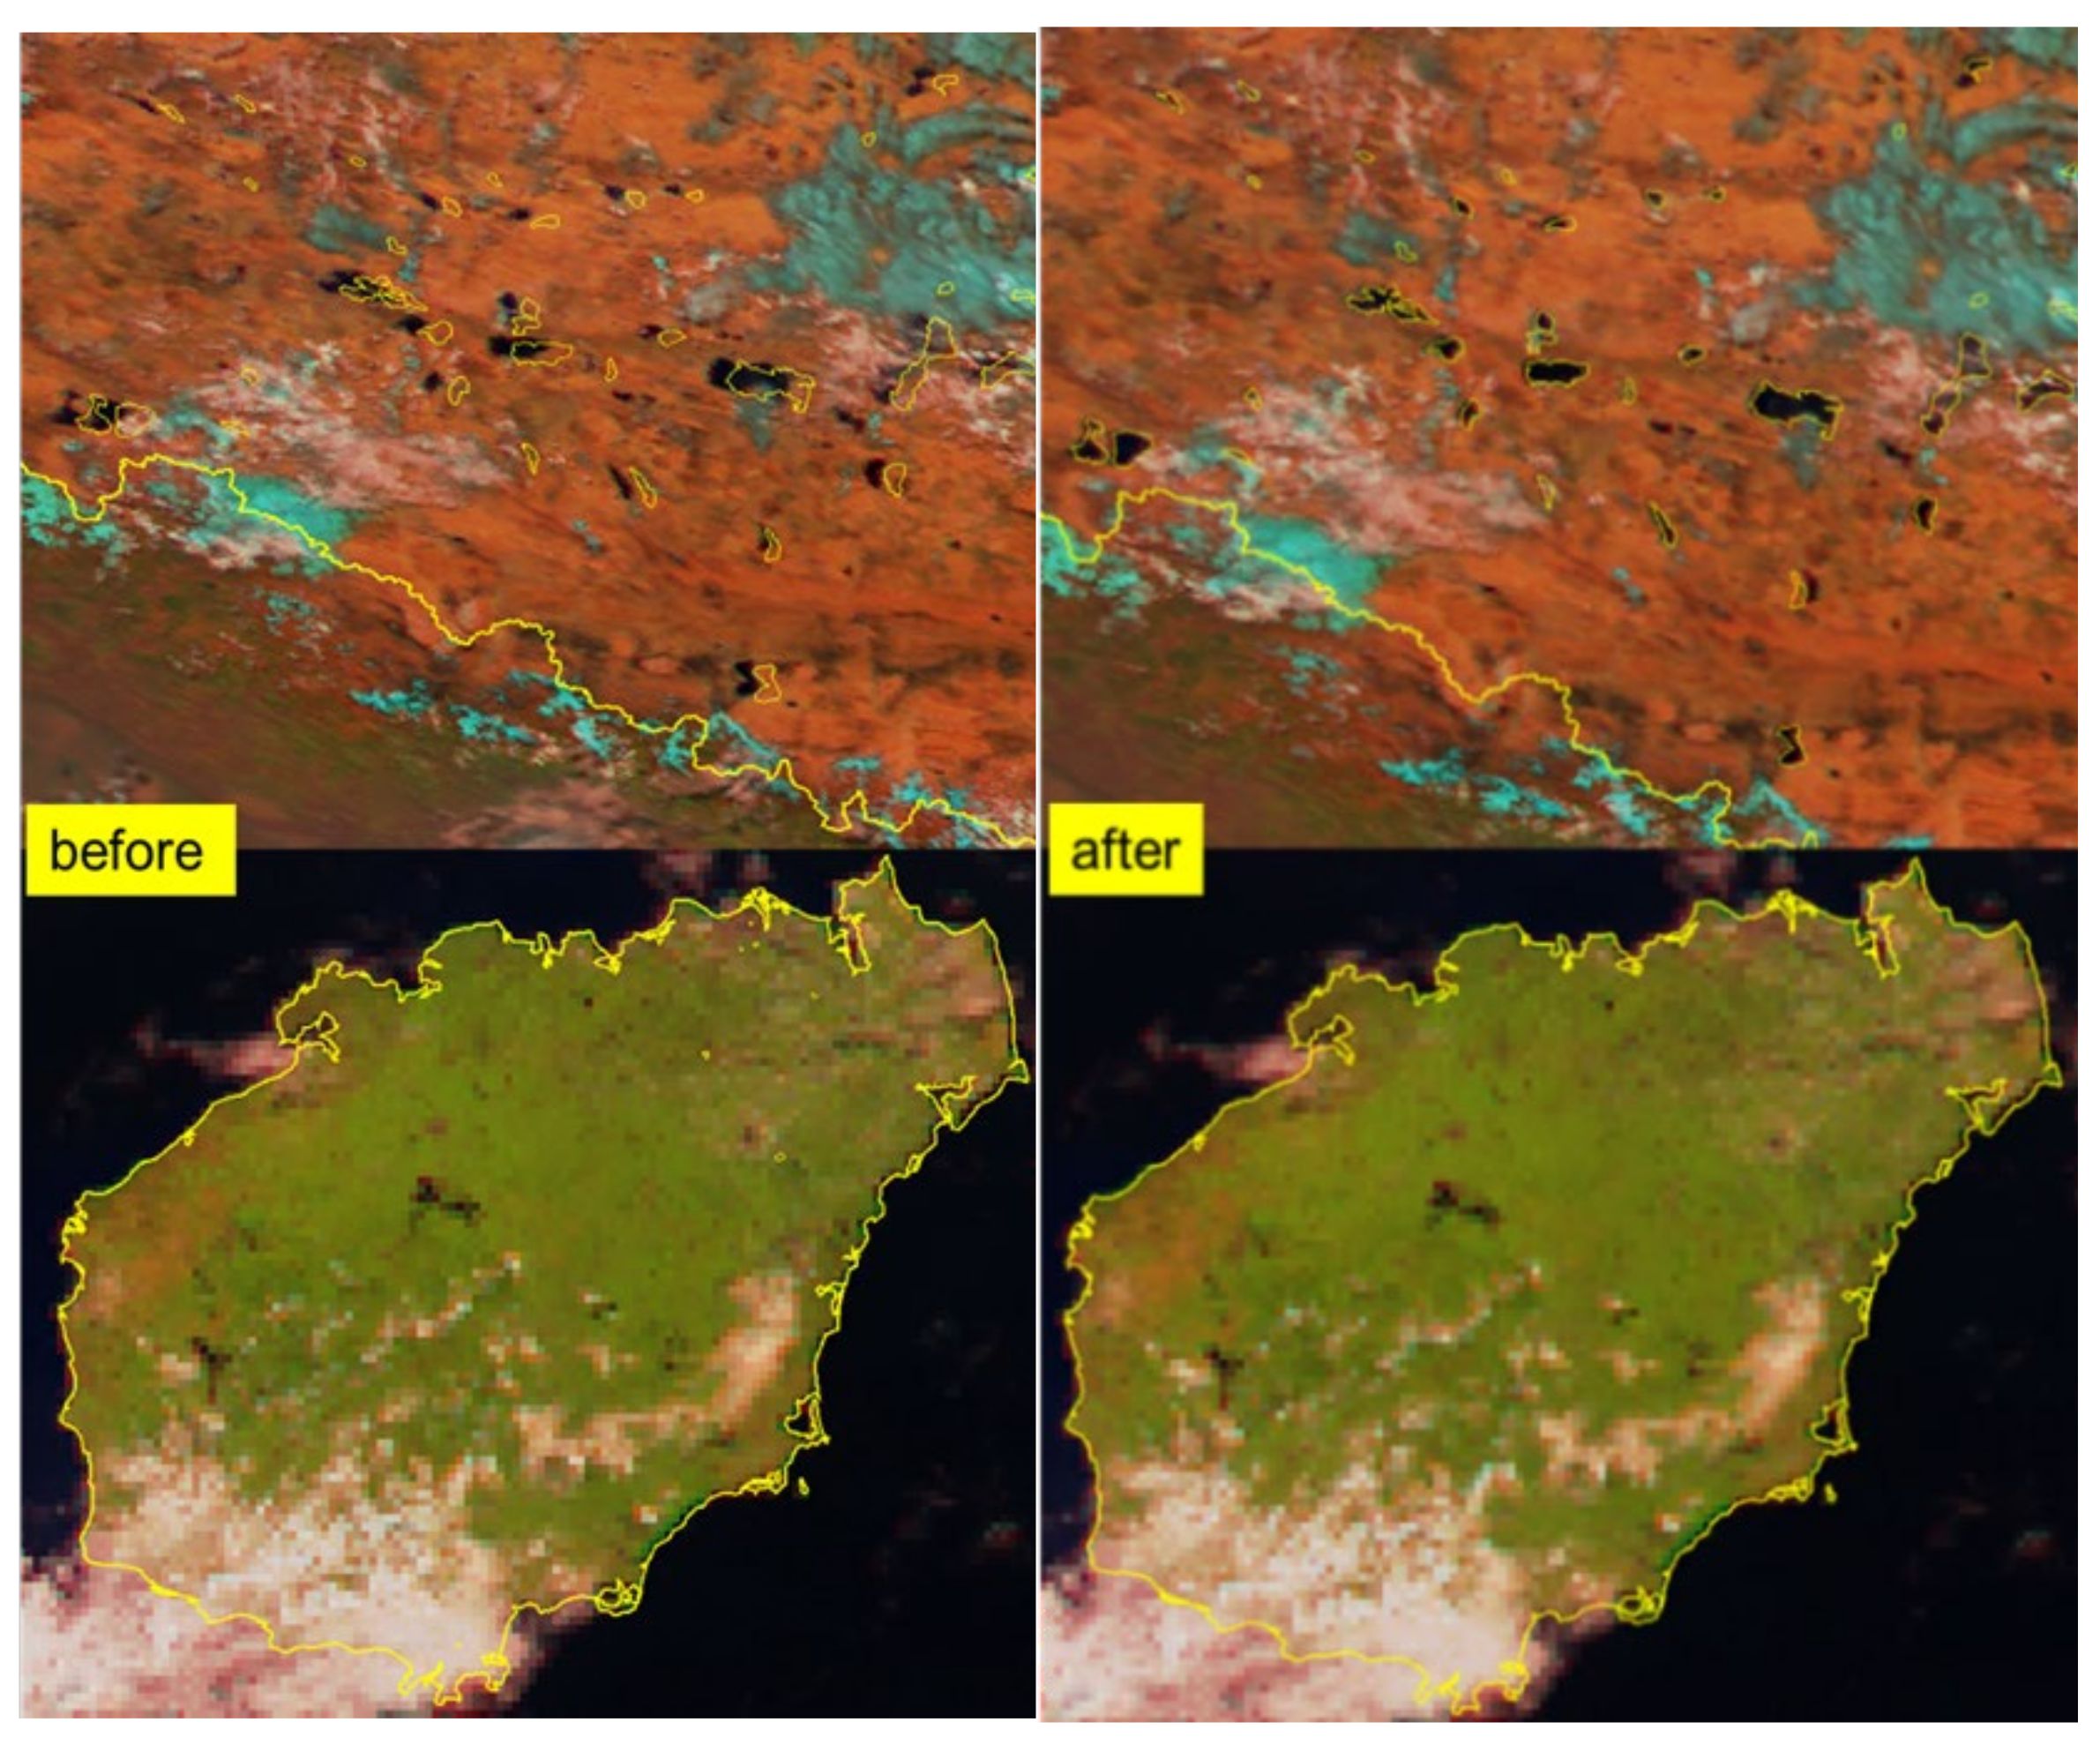
2.3.2. Location Correction
2.4. Method
2.4.1. Principle
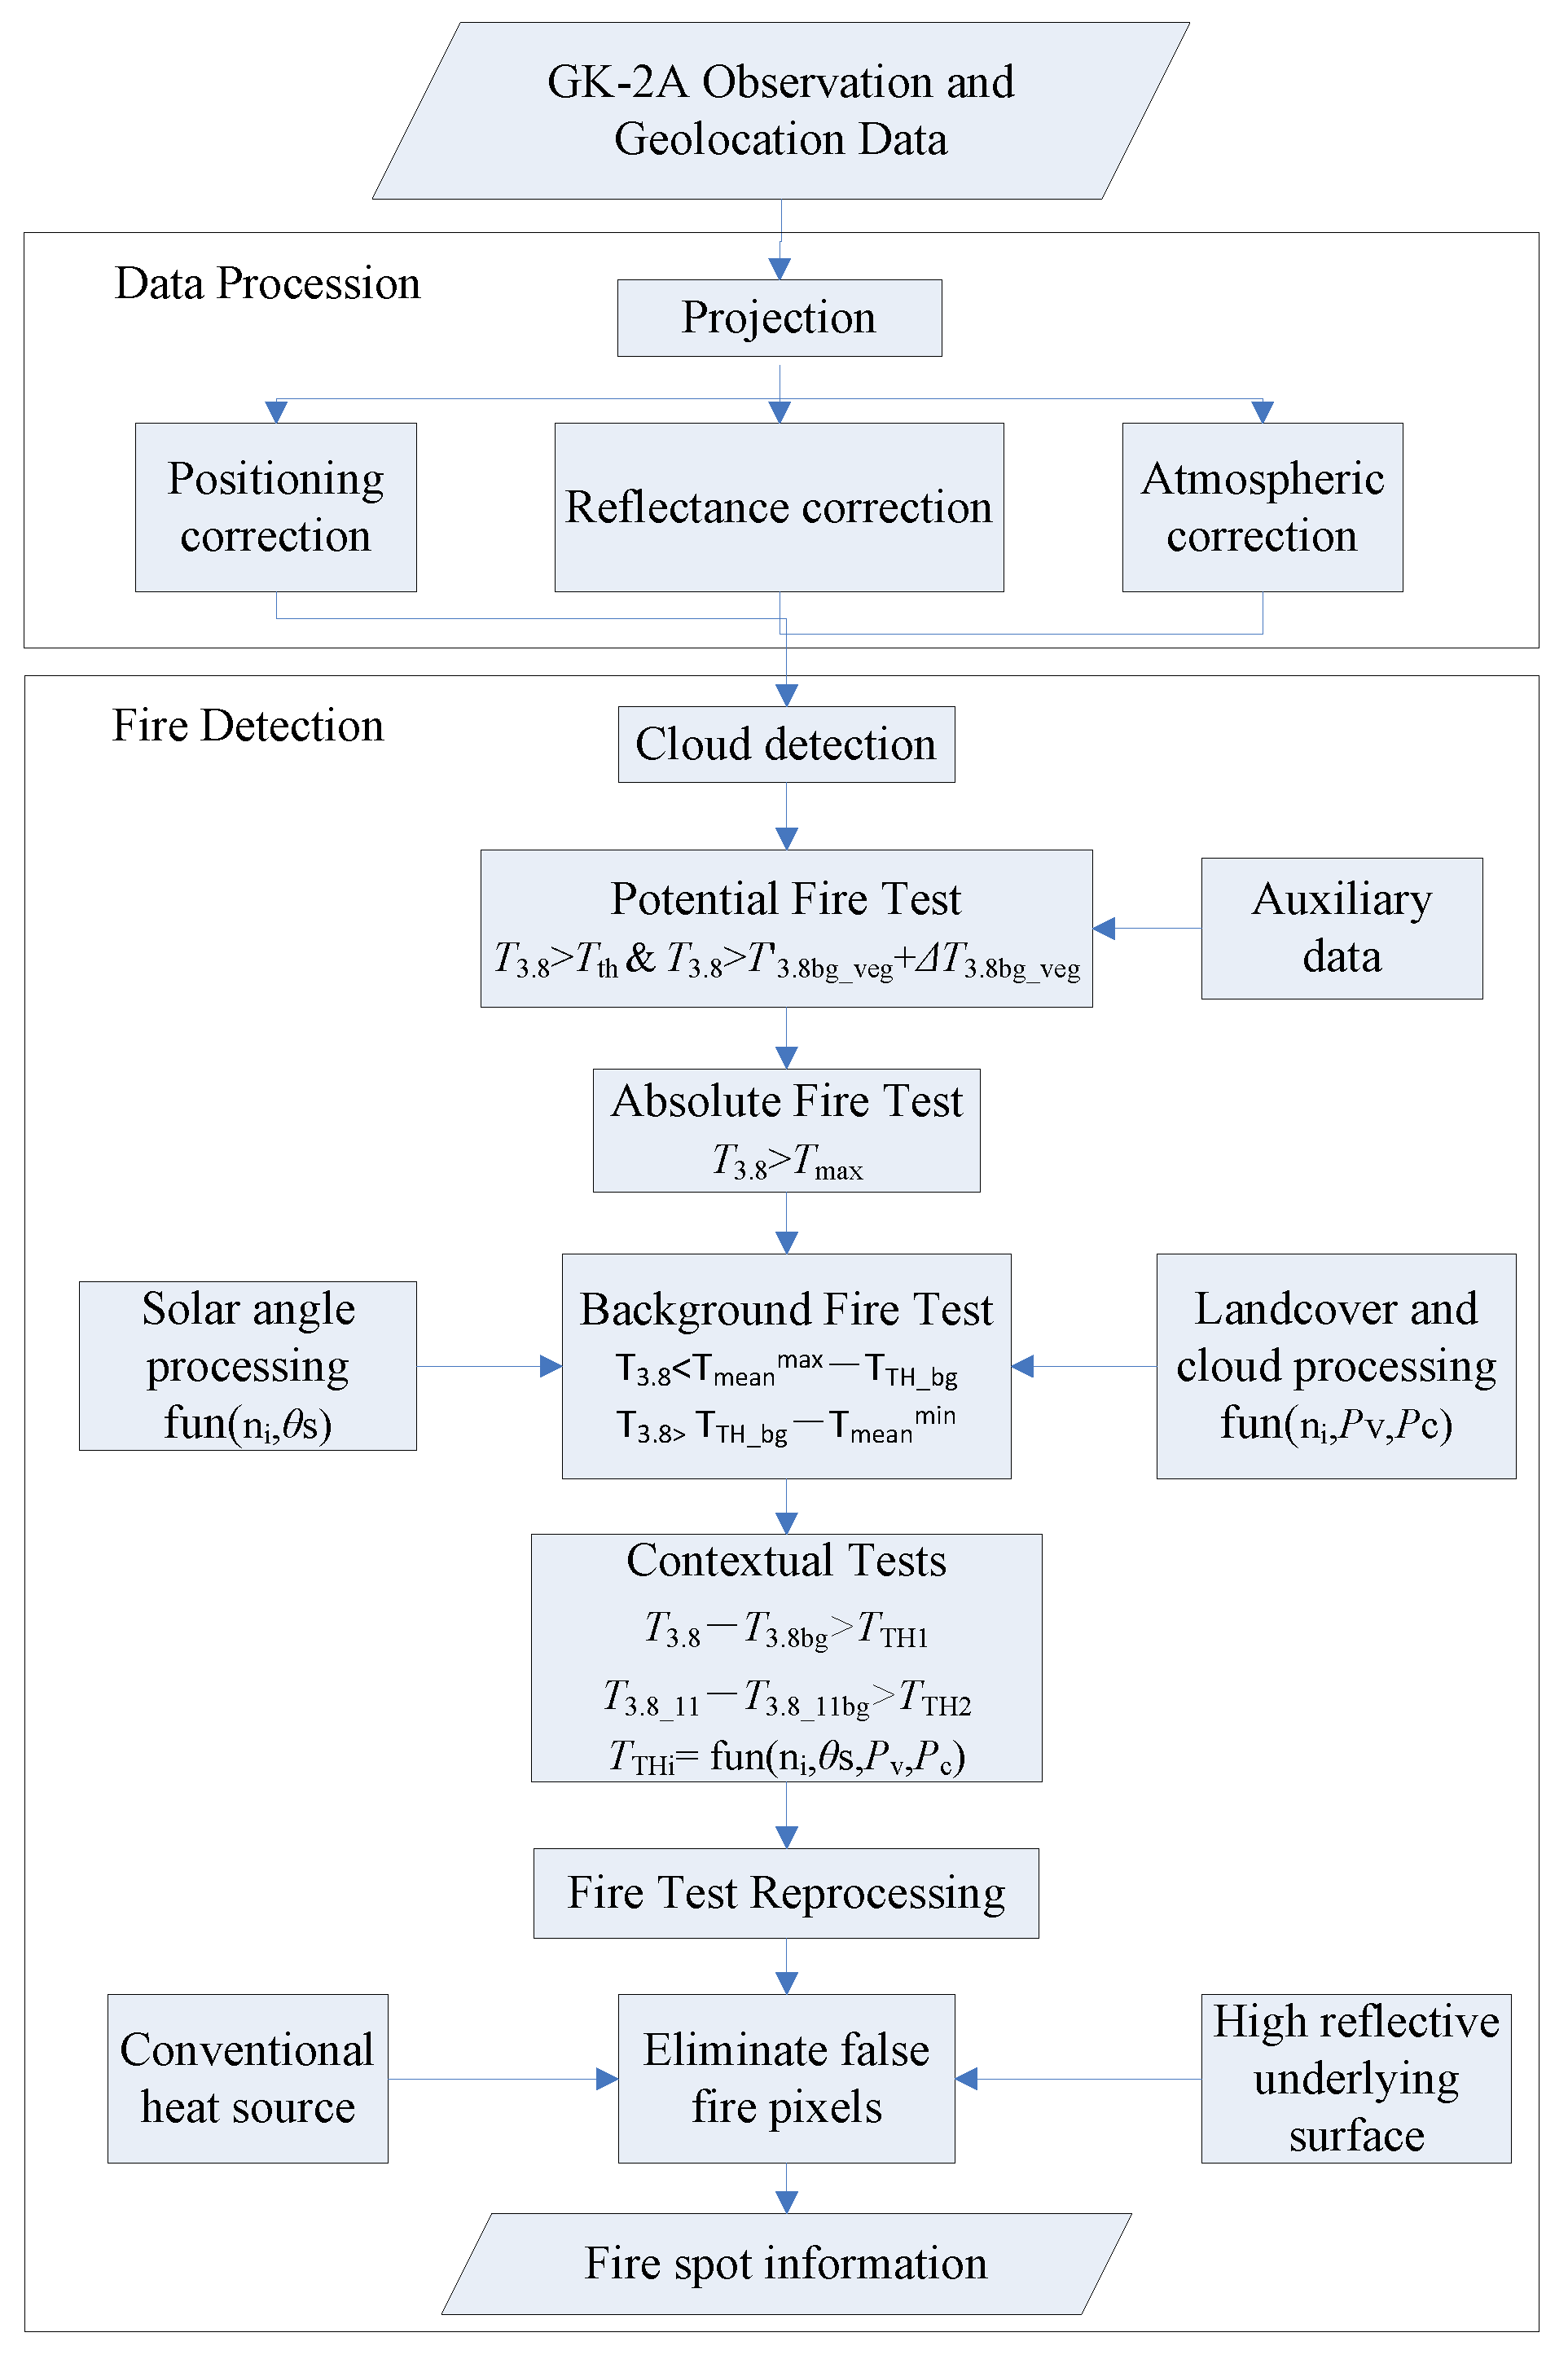
2.4.2. Algorithm
Calculation of Brightness Temperature at Background Pixels
Confirmation of Fire Spot Pixels
Treatment of Solar Zenith Angle and Special Underlying Surface
- (1)
- Treatment of solar altitude angle and fractional vegetation coverage
- (2)
- Treatment of cloud interference effects
Elimination of False Fire Spots
3. Results and Discussion
3.1. Improved Fire Monitoring Algorithm
3.2. Fire Point Monitoring Algorithm Accuracy of Himawari-8 and GK-2A
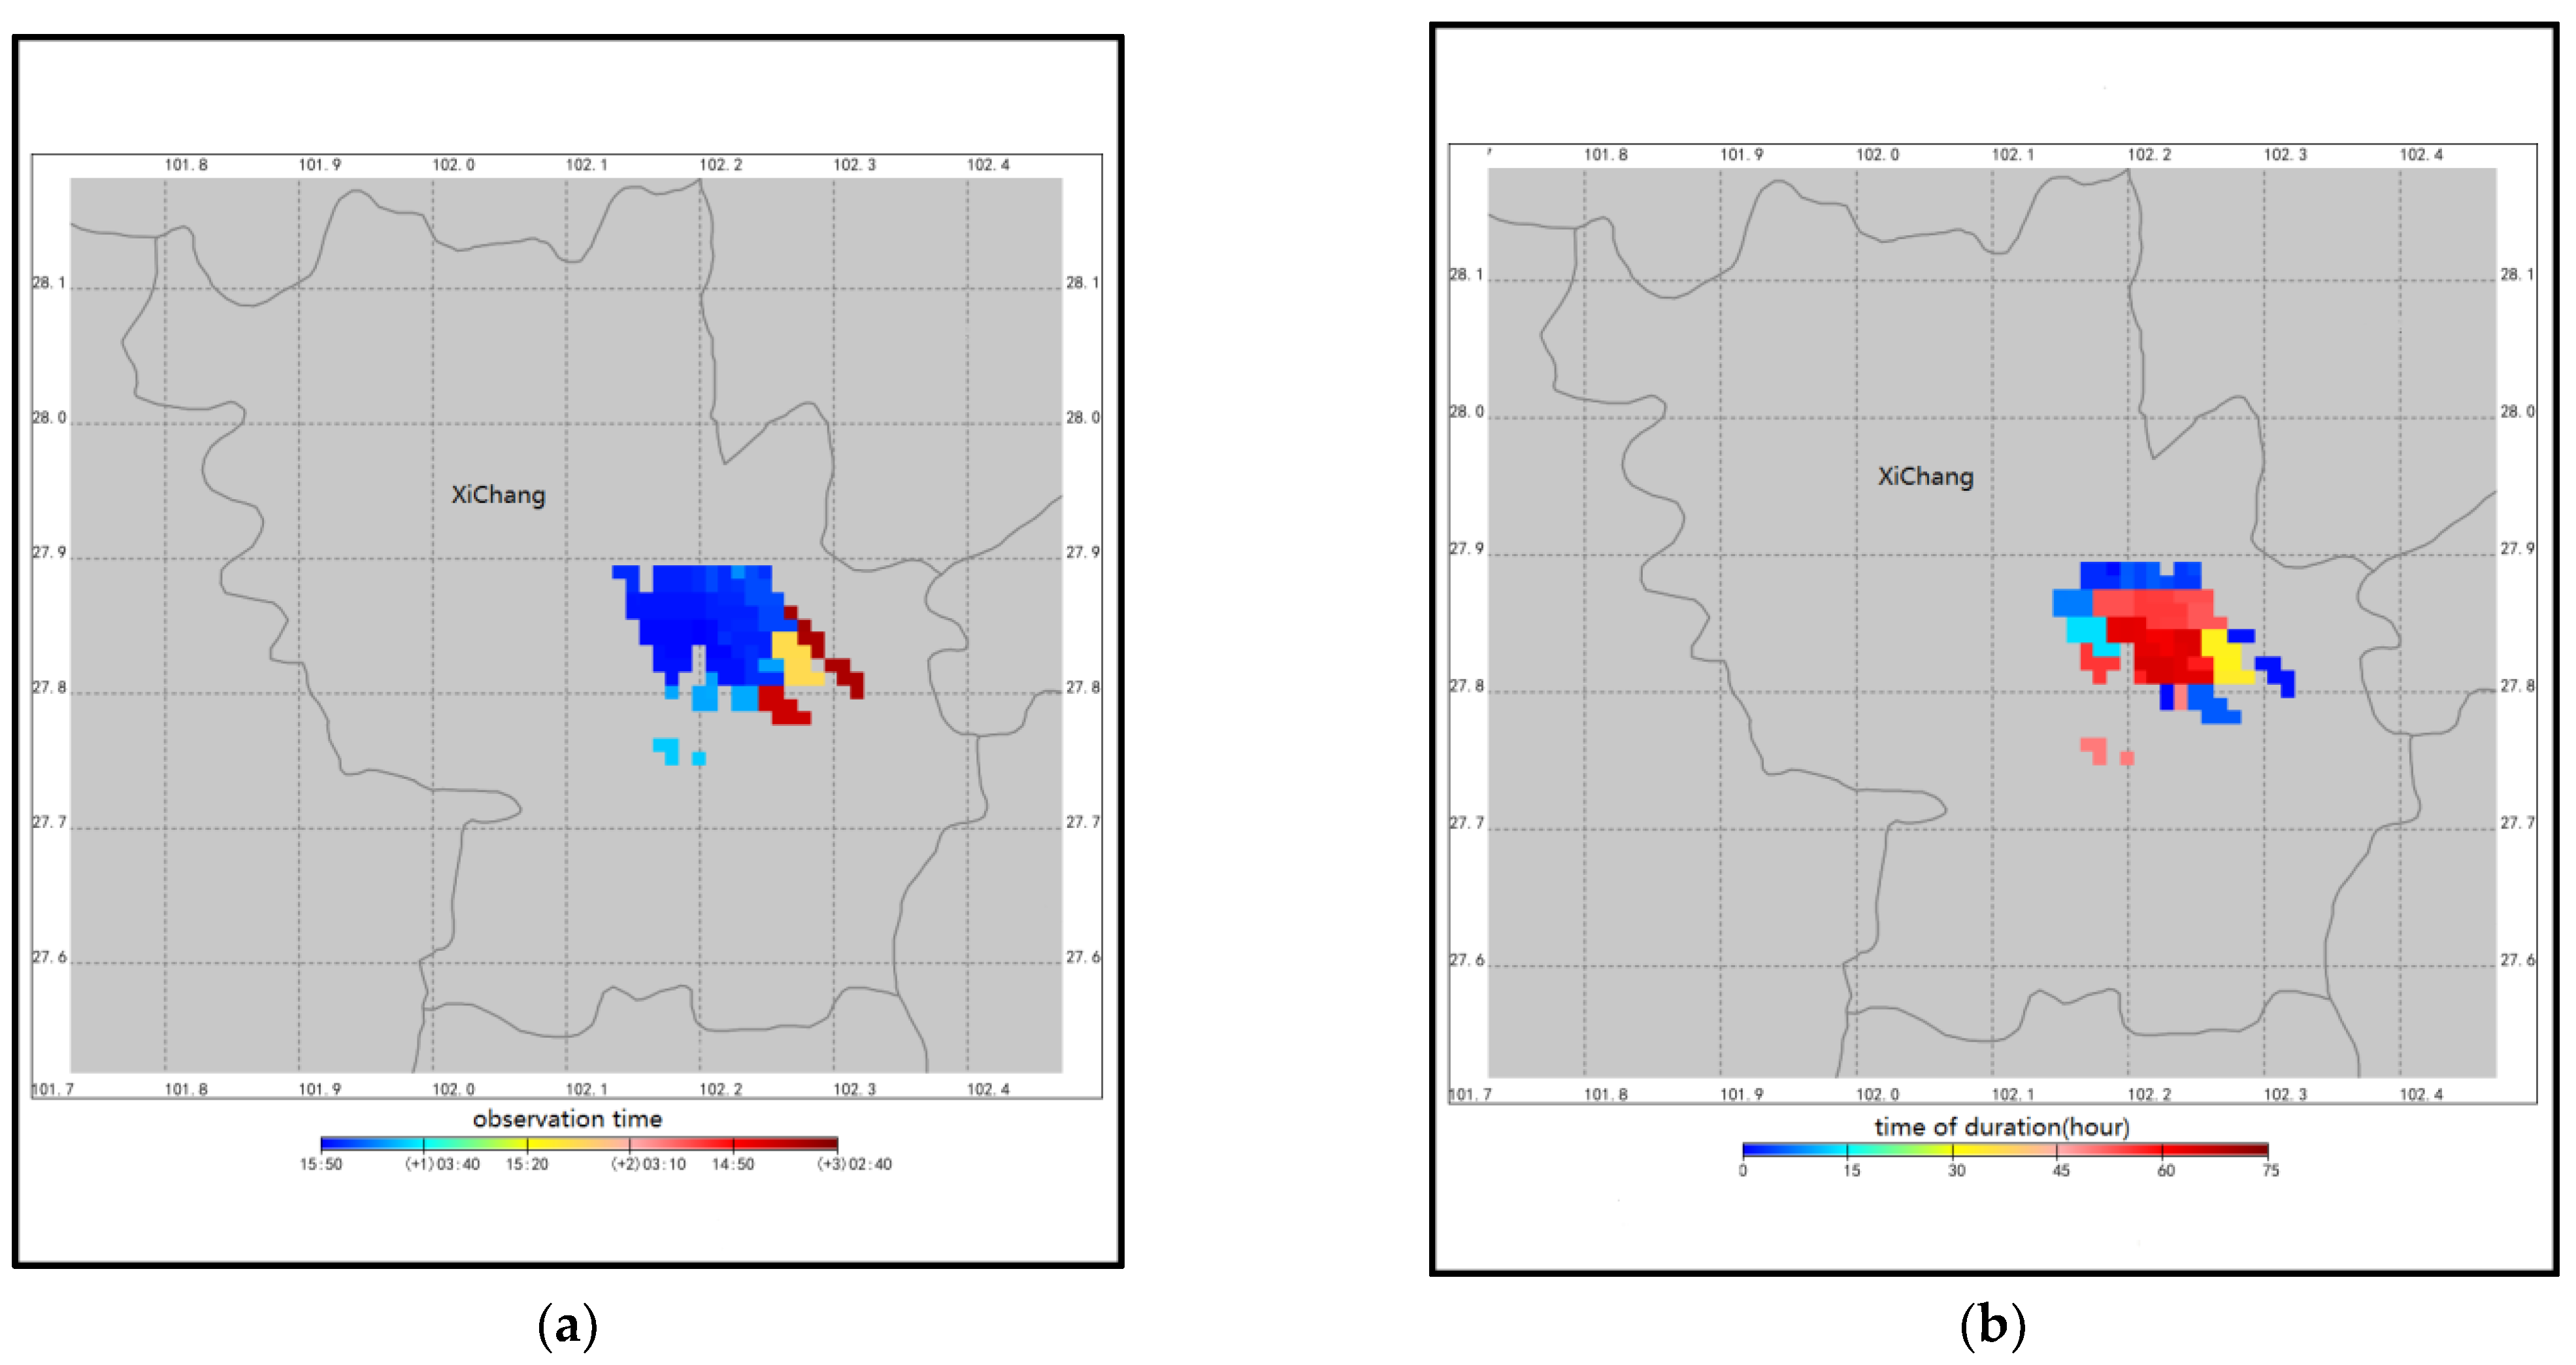
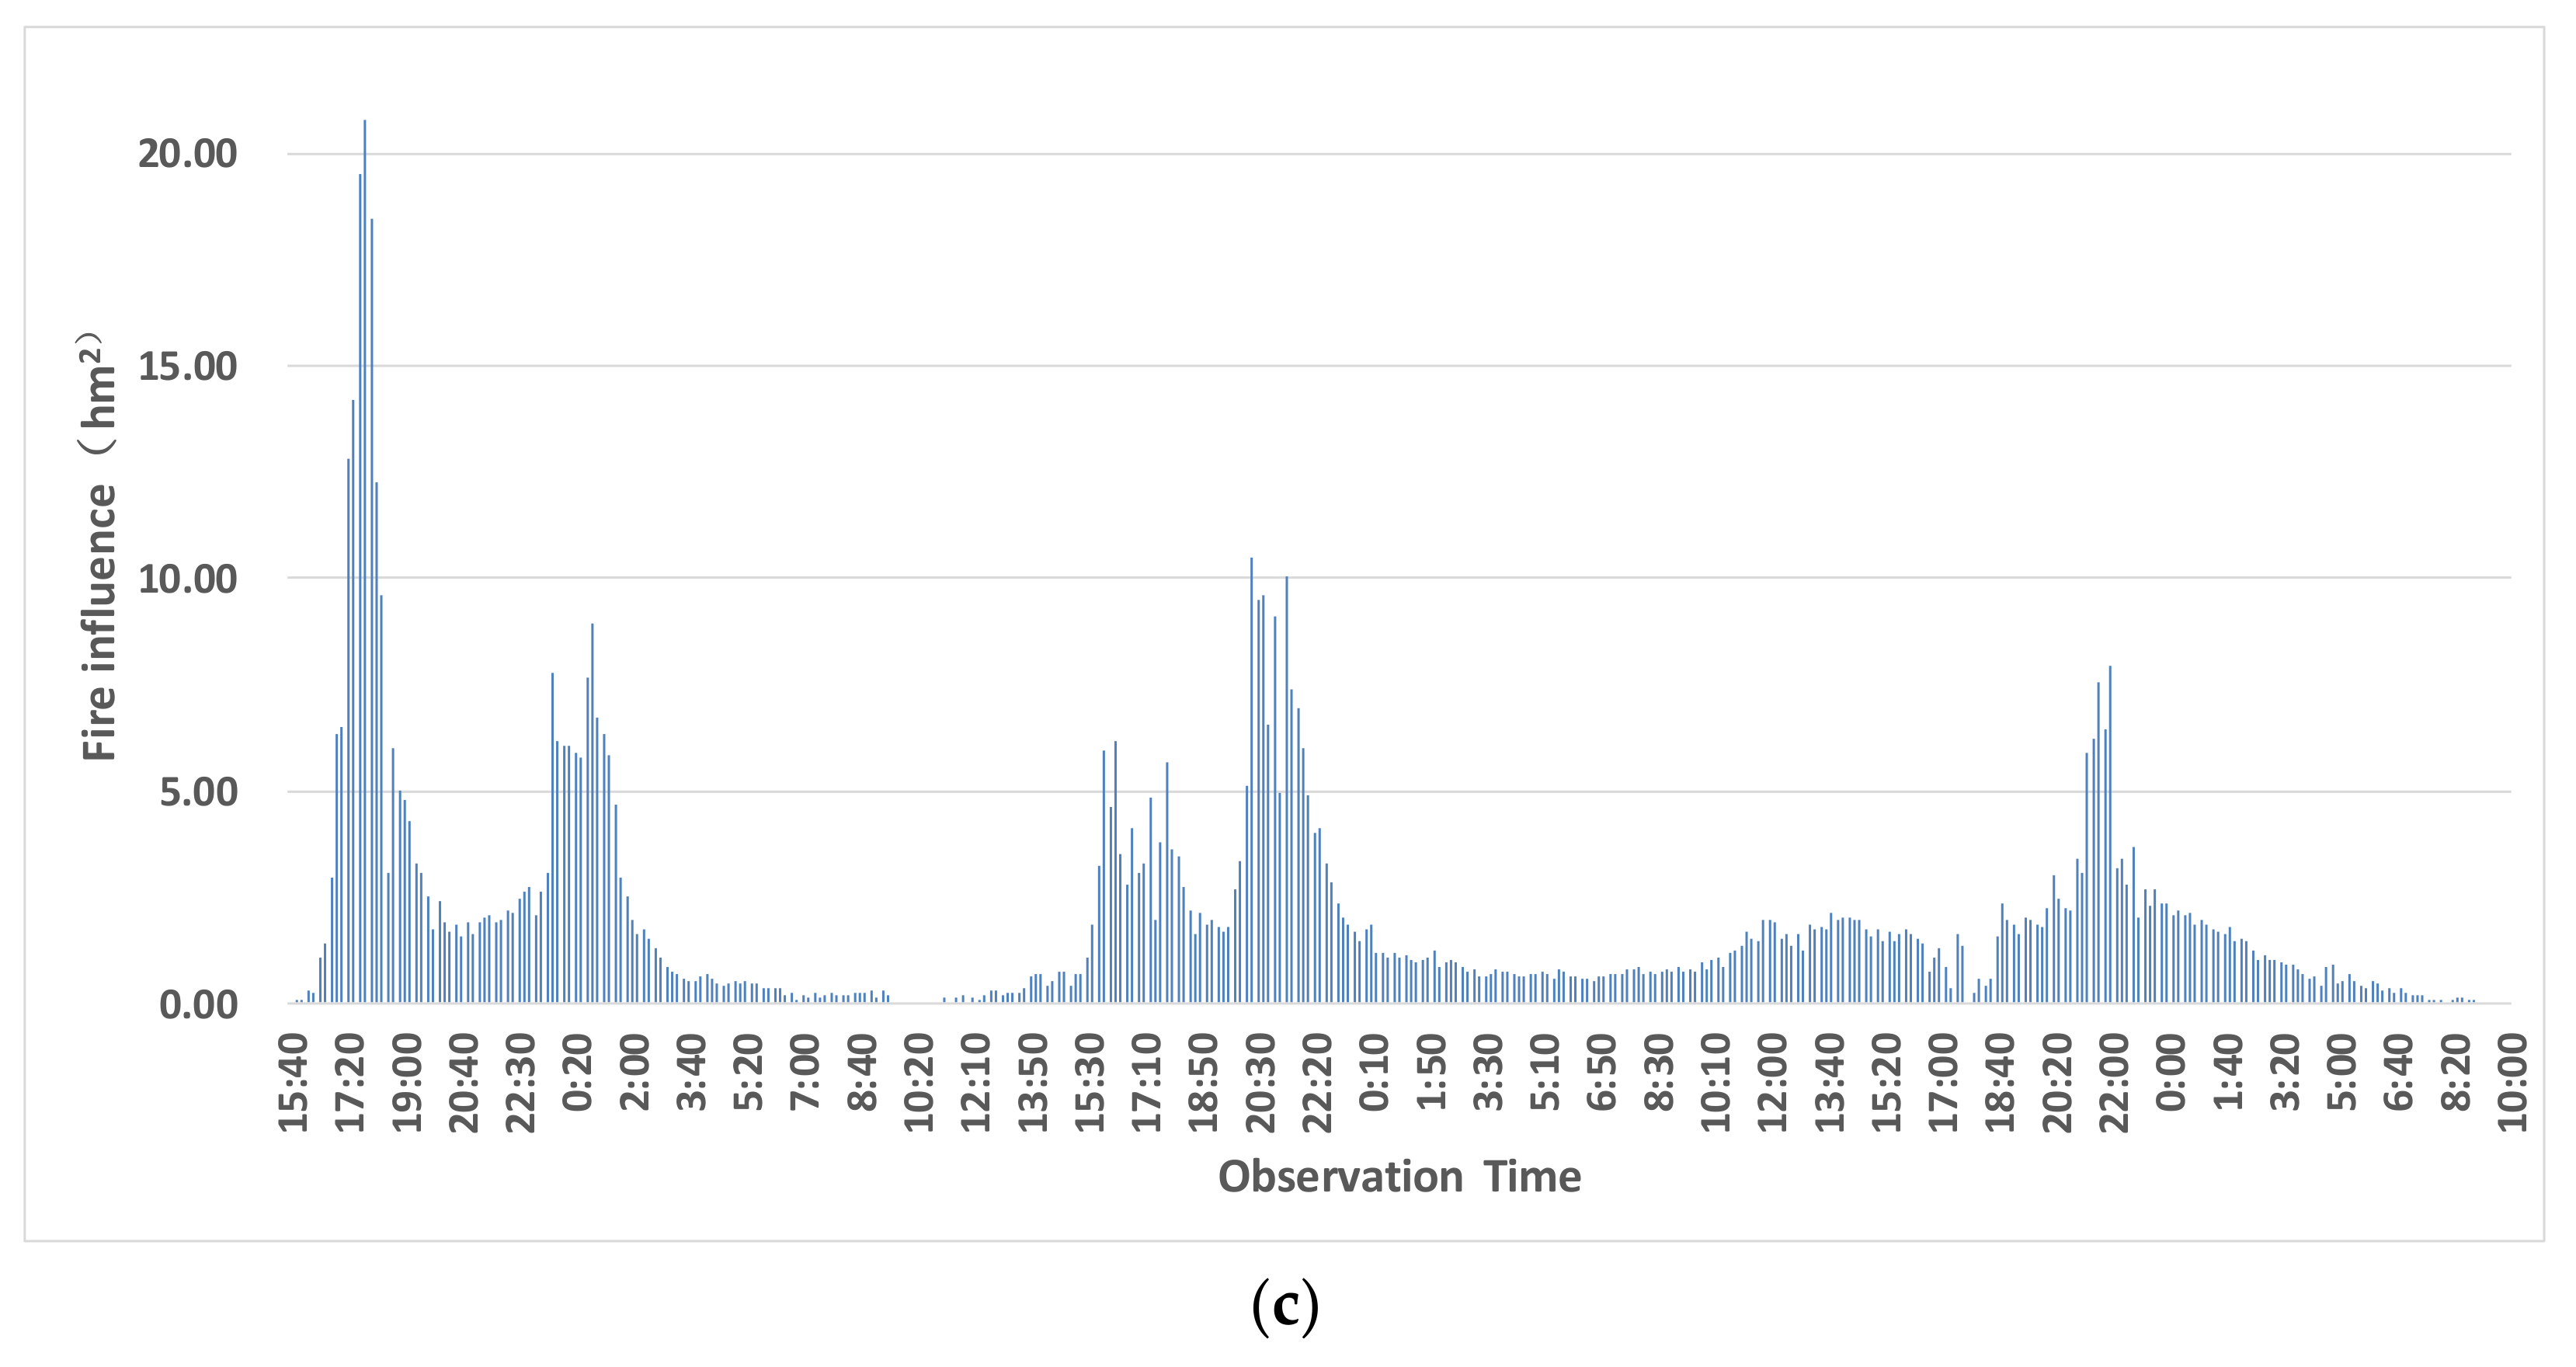
3.3. Application
4. Conclusions
Author Contributions
Funding
Conflicts of Interest
References
- Lu, A.; Tian, H.; Liu, Y. State-of-the-Art in quantifying fire disturbance and ecosystem carbon cycle. Acta Ecol. Sinca 2005, 25, 2734–2743. [Google Scholar]
- Abram, N.J.; Henley, B.J.; Sen Gupta, A.; Lippmann, T.J.R.; Clarke, H.; Dowdy, A.J.; Sharples, J.J.; Nolan, R.H.; Zhang, T.R.; Wooster, M.J.; et al. Connections of climate change and variability to large and extreme forest fires in southeast Australia. Commun. Earth Environ. 2021, 2, 8. [Google Scholar] [CrossRef]
- Brandes, A.F.D.; Sanchez-Tapia, A.; Sansevero, J.B.B.; Albuquerque, R.P.; Barros, C.F. Fire records in tree rings of Moquiniastrum polymorphum: Potential for reconstructing fire history in the Brazilian Atlantic Forest. Acta Bot. Bras. 2019, 33, 61–66. [Google Scholar] [CrossRef]
- White, B.L.A. Spatiotemporal variation in fire occurrence in the state of Amazonas, Brazil, between 2003 and 2016. Acta Amazonica 2018, 48, 358–367. [Google Scholar] [CrossRef]
- Soro, T.D.; Koné, M.; N’Dri, A.B.; Touré, N.E. Identified main fire hotspots and seasons in Cote d’lvoire (West Africa) using MODIS fire data. S. Afr. J. Sci. 2021, 117, 1–13. [Google Scholar] [CrossRef]
- Giglio, L.; Csiszar, I.; Justice, C.O. Global distribution and seasonality of active fires as observed with the Terra and Aqua Moderate Resolution Imaging Spectroradiometer (MODIS) sensors. J. Geophys. Res. Biogeosci. 2006, 111, G02016. [Google Scholar] [CrossRef]
- Le Page, Y.; Oom, D.; Silva, J.M.N.; Jonsson, P.; Pereira, J.M.C. Seasonality of vegetation fires as modified by human action: Observing the deviation from eco-climatic fire regimes. Glob. Ecol. Biogeogr. 2010, 19, 575–588. [Google Scholar] [CrossRef]
- Fusco, E.J.; Finn, J.T.; Abatzoglou, J.T.; Balch, J.K.; Dadashi, S.; Bradley, B.A. Detection rates and biases of fire observations from MODIS and agency reports in the conterminous United States. Remote Sens. Environ. 2019, 220, 30–40. [Google Scholar] [CrossRef]
- Lin, Z.Y.; Chen, F.; Li, B.; Yu, B.; Shirazi, Z.; Wu, Q.C.; Wu, W. FengYun-3C VIRR Active Fire Monitoring: Algorithm Description and Initial Assessment Using MODIS and Landsat Data. IEEE Trans. Geosci. Remote Sens. 2017, 55, 6420–6430. [Google Scholar] [CrossRef]
- Shan, T.C.; Zheng, W.; Chen, J.; Tang, S.H. A burned area mapping method for the FY-3D MERSI based on the single-temporal L1 data and multi-temporal daily active fire products. Int. J. Remote Sens. 2021, 42, 1292–1310. [Google Scholar] [CrossRef]
- Zhang, J.H.; Yao, F.M.; Liu, C.; Yang, L.M.; Boken, V.K. Detection, Emission Estimation and Risk Prediction of Forest Fires in China Using Satellite Sensors and Simulation Models in the Past Three Decades—An Overview. Int. J. Environ. Res. Public Health 2011, 8, 3156–3178. [Google Scholar] [CrossRef] [PubMed] [Green Version]
- Eskandari, S.; Ghadikolaei, J.O.; Jalilvand, H.; Saradjian, M.R. Evaluation of the MODIS Fire-Detection Product in Neka-Zalemroud Fire-Prone Forests in Northern Iran. Pol. J. Environ. Stud. 2015, 24, 2305–2308. [Google Scholar]
- Chuvieco, E.; Lizundia-Loiola, J.; Pettinari, M.L.; Ramo, R.; Padilla, M.; Tansey, K.; Mouillot, F.; Laurent, P.; Storm, T.; Heil, A.; et al. Generation and analysis of a new global burned area product based on MODIS 250 m reflectance bands and thermal anomalies. Earth Syst. Sci. Data 2018, 10, 2015–2031. [Google Scholar] [CrossRef] [Green Version]
- Giglio, L.; Schroeder, W.; Justice, C.O. The collection 6 MODIS active fire detection algorithm and fire products. Remote Sens. Environ. 2016, 178, 31–41. [Google Scholar] [CrossRef] [Green Version]
- Boschetti, L.; Roy, D.P.; Justice, C.O.; Humber, M.L. MODIS-Landsat fusion for large area 30 m burned area mapping. Remote Sens. Environ. 2015, 161, 27–42. [Google Scholar] [CrossRef]
- Gong, A.D.; Li, J.; Chen, Y.L. A Spatio-Temporal Brightness Temperature Prediction Method for Forest Fire Detection with MODIS Data: A Case Study in San Diego. Remote Sens. 2021, 13, 2900. [Google Scholar] [CrossRef]
- Bessho, K.; Date, K.; Hayashi, M.; Ikeda, A.; Imai, T.; Inoue, H.; Kumagai, Y.; Miyakawa, T.; Murata, H.; Ohno, T.; et al. An Introduction to Himawari-8/9-Japan’s New-Generation Geostationary Meteorological Satellites. J. Meteorol. Soc. Japan 2016, 94, 151–183. [Google Scholar] [CrossRef] [Green Version]
- Liu, X.; He, B.; Quan, X.; Yebra, M.; Qiu, S.; Yin, C.; Liao, Z.; Zhang, H. Near Real-Time Extracting Wildfire Spread Rate from Himawari-8 Satellite Data. Remote Sens. 2018, 10, 1654. [Google Scholar] [CrossRef] [Green Version]
- Giglio, L.; Descloitres, J.; Justice, C.O.; Kaufman, Y.J. An Enhanced Contextual Fire Detection Algorithm for MODIS. Remote Sens. Environ. 2003, 87, 273–282. [Google Scholar] [CrossRef]
- Kaufman, Y.J.; Justice, C.O.; Flynn, L.P.; Kendall, J.D.; Prins, E.M.; Giglio, L.; Ward, D.E.; Menzel, W.P.; Setzer, A.W. Potential global fire monitoring from EOS-MODIS. J. Geophys. Res. 1998, 103, 32215–32238. [Google Scholar] [CrossRef]
- Xu, G.; Zhong, X. Real time wildfire detection and tracking in Australia using geostationary satellite:Himawari 8. Remote Sens. Lett. 2017, 8, 1052–1061. [Google Scholar] [CrossRef]
- Wickramasinghe, C.; Wallace, L.; Reinke, K.; Jones, S. Intercomparison of Himawari-8 AHI-FSA with MODIS and VIIRS active fire products. Int. J. Digit. Earth 2020, 13, 457–473. [Google Scholar] [CrossRef]
- Chang, K.K.; Kim, H.G.; Kang, Y.H.; Yun, C.Y.; Lee, Y.G. Intercomparison of Satellite-Derived Solar Irradiance from the GEO-KOMSAT-2A and HIMAWARI-8/9 Satellites by the Evaluation with Ground Observations. Remote Sens. 2020, 12, 2149. [Google Scholar]
- Chen, J.; Zheng, W.; Liu, C. Application of grassland fire monitoring based on Himawari-8 geostationary meteorological satellite data. J. Nat. Disasters 2017, 26, 197–204. [Google Scholar]
- Zhou, Y.; Sui, S.; Chen, J.; Zhou, E.; Huang, Y.; Wang, T. Monitoring and Alarm Technology of Wildfire Occurrences in Transmission Lines Corridors Based on Himawari-8 Geostationary Meteorological Satellite. High Volt. Eng. 2020, 46, 2561–2569. [Google Scholar]
- Zhao, W.; Shan, H.; Zhang, Y. Approach to the fire detection technology and the algorithm from the geostationary Himawari-8. J. Saf. Environ. 2019, 19, 2063–2073. [Google Scholar]
- Lee, K.S.; Chung, S.R.; Lee, C.; Seo, M.; Choi, S.; Seong, N.H.; Jin, D.; Kang, M.; Yeom, J.M.; Roujean, J.L.; et al. Development of Land Surface Albedo Algorithm for the GK-2A/AMI Instrument. Remote Sens. 2020, 12, 2500. [Google Scholar] [CrossRef]
- Oh, S.M.; Borde, R.; Carranza, M.; Shin, I.C. Development and Intercomparison Study of an Atmospheric Motion Vector Retrieval Algorithm for GEO-KOMPSAT-2A. Remote Sens. 2019, 11, 2054. [Google Scholar] [CrossRef] [Green Version]
- Wang, J.; Liu, C.; Yang, L.; Shang, J.; Zhang, Z. Calculation of Geostationary Satellites′ Nominal Fixed Grid and Its Application in FY-4A Advanced Geosynchronous Radiation Imager. Acta Optica Sinica 2018, 38, 1211001-1–1211001-9. [Google Scholar] [CrossRef]
- Goncalves, H.; Goncalves, J.A.; Corte-Real, L. Measures for an Objective Evaluation of the Geometric Correction Process Quality. IEEE Geosci. Remote Sens. Letters 2009, 6, 292–296. [Google Scholar] [CrossRef]
- Di Biase, V.; Laneve, G. Geostationary sensor based forest fire detection and monitoring: An improved version of the SFIDE algorithm. Remote Sens. 2018, 10, 741. [Google Scholar] [CrossRef] [Green Version]
- Filizzola, C.; Corrado, R.; Marchese, F.; Mazzeo, G.; Paciello, R.; Pergola, N.; Tramutoli, V. RST-FIRES, an exportable algorithm for early-fire detection and monitoring: Description, implementation, and field validation in the case of the MSG-SEVIRI sensor. Remote Sens. Environ. 2016, 186, 196–216. [Google Scholar] [CrossRef]
- Schroeder, W.; Oliva, P.; Giglio, L.; Csiszar, I.A. The new VIIRS 375 m active fire detection data product: Algorithm description and initial assessment. Remote Sens. Environ. 2014, 143, 85–96. [Google Scholar] [CrossRef]
- Na, L.; Zhang, J.; Bao, Y.; Bao, Y.; Na, R.; Tong, S.; Si, A. Himawari-8 satellite based dynamic monitoring of grassland fire in China-Mongolia border regions. Sensors 2018, 18, 276. [Google Scholar] [CrossRef] [Green Version]
- Jang, E.; Kang, Y.; Im, J.; Lee, D.W.; Yoon, J.; Kim, S.K. Detection and Monitoring of Forest Fires Using Himawari-8 Geostationary Satellite Data in South Korea. Remote Sens. 2019, 11, 271. [Google Scholar] [CrossRef] [Green Version]


| Index | Specifications |
|---|---|
| Altitude control | Three-axis stabilization |
| Size during operation | Launch: 2.9 × 2.4 × 4.6 (m) Orbit: 3.8 × 8.9 × 4.6 (m) |
| Mass | Launch mass:3.2ton@mission period 3.5ton@max availability |
| Design lifetime | Meteorological Mission:10 years |
| Geostationary position | 128.2 degrees East |
| Imager | Advanced Meteorological Imager (AMI) |
| Space weather monitor | Particle detector (PD) Magnetometer (MG) Charging monitor (CM) |
| Communication | AMI data transmission AMI data broadcast system Command and telemetry |
| Bands | Center Wavelength | Band Width (max, μm) | Resolution (km) | Bite Depth | |
|---|---|---|---|---|---|
| Min (μm) | Max (μm) | ||||
| VIS0.4 | 0.431 | 0.479 | 0.075 | 1 | 11 |
| VIS0.5 | 0.5025 | 0.5175 | 0.0625 | 1 | 11 |
| VIS0.6 | 0.625 | 0.66 | 0.125 | 0.5 | 12 |
| VIS0.8 | 0.8495 | 0.8705 | 0.0875 | 1 | 13 |
| NIR1.3 | 1.373 | 1.383 | 0.03 | 2 | 12 |
| NIR1.6 | 1.601 | 1.619 | 0.075 | 2 | 11 |
| IR3.8 | 3.74 | 3.96 | 0.5 | 2 | 14 |
| IR6.3 | 6.061 | 6.425 | 1.038 | 2 | 12 |
| IR6.9 | 6.89 | 7.01 | 0.5 | 2 | 13 |
| IR7.3 | 7.258 | 7.433 | 0.688 | 2 | 13 |
| IR8.7 | 8.44 | 8.76 | 0.5 | 2 | 13 |
| IR9.6 | 9.543 | 9.717 | 0.475 | 2 | 13 |
| IR10.5 | 10.25 | 10.61 | 0.875 | 2 | 13 |
| 11.2 | 11.08 | 11.32 | 1.0 | 2 | 13 |
| 12.3 | 12.15 | 12.45 | 1.25 | 2 | 13 |
| 13.3 | 13.21 | 13.39 | 0.75 | 2 | 13 |
| MODIS(VIIRS) | Himawari-8 | GK-2A | |
|---|---|---|---|
| Potential Fire Test | Daytime: T4 > 310 & ΔT > 10 Nighttime: T4 > 305 & ΔT > 10 (T4 > Tmin ΔT > ΔTmin) | T3.9 > Tth T3.9 > T’3.9bg_veg + ΔT3.9bg_veg | T3.8 > Tth T3.8 > T’3.8bg_veg + ΔT3.8bg_veg |
| Absolute Fire Test | Daytime: T4 > 360 Nighttime: T4 > 320 (T4 > Tabs) | T3.9 > Tmax | T3.8 > Tmax |
| Background Fire Test | Daytime: T4 > 325&ΔT > 20 Nighttime: T4 > 310 & ΔT > 10 | T3.9 > T3.9bg + T | T3.8 T3.8 − |
| Contextual Tests | ΔT > ΔTb + 3.5×δ ΔT ΔT > ΔTb + 6 k T4 > T4b + 3 × δ4 T11 > T11b + δ11 − 4 k δ’4 > 5 k | T3.9 > T3.9bg + n1 × δT3.9bg ΔT3.9_11 > ΔT3.9_11bg + n2 × δT3.9_11bg | T3.8 − T3.8bg > TTH1 T3.8_11 − T3.8_11bg > TTH2 TTHi = fun(ni,θs,Pv,Pc) |
| Satellite | Province | Total | Unconfirmed | Confirm | Discrimination Accuracy (%) | Average Precision (%) |
|---|---|---|---|---|---|---|
| Himawari-8 | Guangdong | 142 | 32 | 110 | 77.5 | 77.3 |
| Guangxi | 303 | 64 | 239 | 78.9 | ||
| Yunnan | 444 | 97 | 347 | 78.2 | ||
| Guizhou | 91 | 29 | 62 | 68.1 | ||
| Hainan | 31 | 8 | 23 | 74.2 | ||
| GK-2A | Guangdong | 142 | 19 | 123 | 86.5 | 86.4 |
| Guangxi | 303 | 38 | 265 | 87.3 | ||
| Yunnan | 444 | 58 | 386 | 86.9 | ||
| Guizhou | 91 | 17 | 74 | 80.9 | ||
| Hainan | 31 | 5 | 26 | 84.5 |
| Percent (%) | T3.8 (K) | ΔT3.8 (K) | T11 (K) | ΔT11 (K) | |
|---|---|---|---|---|---|
| Early | 47.1 | 294.3 | 6.72 | 287.4 | 0.27 |
| Same | 33.2 | 299.7 | 8.12 | 291.2 | 0.44 |
| Delay | 19.7 | 296.8 | 7.57 | 286.7 | 0.11 |
| Time | Solar Zenith Angle | Pixel Temperature (K) | The Temperature of Background (K) | Correction Coefficient | Fire (Yes/No) | |||
|---|---|---|---|---|---|---|---|---|
| New | Original | New | Original | New | Original | |||
| 15:40 | 41.71 | 310.2 | 307.9 | 308.1 | 4.1 | 4.3 | × | × |
| 15:50 | 43.72 | 314.5 | 307.8 | 308.2 | 4.2 | 4.7 | √ | × |
| 16:00 | 45.71 | 315.4 | 307.9 | 308.6 | 5.1 | 5.8 | √ | × |
| 16:10 | 47.74 | 323.4 | 309.2 | 310.4 | 5.2 | 5.8 | √ | √ |
| 16:20 | 49.70 | 322.7 | 309.4 | 310.5 | 5.1 | 6.0 | √ | √ |
| 16:30 | 51.88 | 335.4 | 311.4 | 313.7 | 5.6 | 6.9 | √ | √ |
| 16:40 | 53.98 | 341.8 | 313.3 | 315.2 | 5.9 | 6.8 | √ | √ |
| 16:50 | 56.10 | 355.9 | 312.2 | 314.8 | 6.0 | 7.2 | √ | √ |
| 17:00 | 58.24 | 383.4 | 314.7 | 316.9 | 6.3 | 7.6 | √ | √ |
| 17:10 | 60.39 | 387.4 | 312.8 | 315.6 | 6.4 | 7.8 | √ | √ |
| 17:20 | 62.55 | 392.2 | 316.2 | 320.1 | 6.5 | 7.7 | √ | √ |
| 17:30 | 64.72 | 394.6 | 313.7 | 316.8 | 6.5 | 7.8 | √ | √ |
| 17:40 | 66.90 | 401 | 314.8 | 317.5 | 6.6 | 7.9 | √ | √ |
| 17:50 | 69.09 | 400.1 | 315.1 | 318.4 | 6.6 | 7.9 | √ | √ |
| 18:00 | 71.28 | 397.9 | 318.5 | 322.1 | 6.5 | 7.8 | √ | √ |
Publisher’s Note: MDPI stays neutral with regard to jurisdictional claims in published maps and institutional affiliations. |
© 2022 by the authors. Licensee MDPI, Basel, Switzerland. This article is an open access article distributed under the terms and conditions of the Creative Commons Attribution (CC BY) license (https://creativecommons.org/licenses/by/4.0/).
Share and Cite
Chen, J.; Zheng, W.; Wu, S.; Liu, C.; Yan, H. Fire Monitoring Algorithm and Its Application on the Geo-Kompsat-2A Geostationary Meteorological Satellite. Remote Sens. 2022, 14, 2655. https://doi.org/10.3390/rs14112655
Chen J, Zheng W, Wu S, Liu C, Yan H. Fire Monitoring Algorithm and Its Application on the Geo-Kompsat-2A Geostationary Meteorological Satellite. Remote Sensing. 2022; 14(11):2655. https://doi.org/10.3390/rs14112655
Chicago/Turabian StyleChen, Jie, Wei Zheng, Shuang Wu, Cheng Liu, and Hua Yan. 2022. "Fire Monitoring Algorithm and Its Application on the Geo-Kompsat-2A Geostationary Meteorological Satellite" Remote Sensing 14, no. 11: 2655. https://doi.org/10.3390/rs14112655
APA StyleChen, J., Zheng, W., Wu, S., Liu, C., & Yan, H. (2022). Fire Monitoring Algorithm and Its Application on the Geo-Kompsat-2A Geostationary Meteorological Satellite. Remote Sensing, 14(11), 2655. https://doi.org/10.3390/rs14112655