Article

The Urban Seismic Observatory of Catania (Italy): A Real-Time Seismic Monitoring at Urban Scale

1
Isitituto Nazionale di Geofisica e Vulcanologia, Sezione di Catania-Osservatorio Etneo, 95125 Catania, Italy
2
Meridionale Impianti S.p.A., 20867 Caponago, Italy
3
Isitituto Nazionale di Geofisica e Vulcanologia, Osservatorio Vesuviano, 80124 Napoli, Italy
*
Author to whom correspondence should be addressed.
Remote Sens. 2022, 14(11), 2583; https://doi.org/10.3390/rs14112583
Submission received: 12 April 2022 / Revised: 24 May 2022 / Accepted: 24 May 2022 / Published: 27 May 2022
(This article belongs to the Special Issue Urban Sensing Methods and Technologies)

Abstract

:
We describe the first dense real-time urban seismic–accelerometric network in Italy, named OSU-CT, located in the historic center of Catania. The city lies in the region with the greatest danger, vulnerability, and earthquake exposure in the entire Italian territory. OSU-CT was planned and realized within the project called EWAS “an Early WArning System for cultural heritage”, aimed at the rapid assessment of earthquake-induced damage and the testing of an on-site earthquake early warning system. OSU-CT is mainly based on low-cost instrumentation realized ad hoc by using cutting-edge technologies and digital MEMS (micro-electro-mechanical systems) triaxial accelerometers with excellent resolution and low noise. Twenty of the forty scheduled stations have already been set up on the ground floor of significant historic public buildings. In order to assess the performance of an earthquake early warning (EEW) on-site system, we also installed wide-band velocimeters (ETL3D/5s) in three edifices chosen as test sites, which will be instrumented for a structural health monitoring (SHM). In addition to several laboratory and field validation tests on the developed instruments, an effective operational test of OSU-CT was the Mw 4.3 earthquake occurring on 23 December 2021, 16 km west, south-west of Catania. Peak ground accelerations (4.956 gal to 39.360 gal) recorded by the network allowed obtaining a first urban shakemap and determining a reliable distribution of ground motion in the historical center of the city, useful for the vulnerability studies of the historical edifices.

1. Introduction

Italy has one of the highest concentrations of archeological, architectural, cultural, and monumental properties of any country. The architectural fragility, climatic changes, and seismic and hydrogeological threats necessitate ongoing efforts to restore and protect this heritage, which is the national historic landscape’s uniqueness and value. Considering the high vulnerability of historic buildings and artistic heritage, the seismic hazard is one of the most important components in risk assessment in large areas of the country. During the last 150 years, Italy has been hit by as many as 36 disastrous earthquakes, on average one event every 4–5 years. These earthquakes have caused over 200,000 victims and seriously damaged about 1600 locations, including several major cities. In the last 50 years alone, the cost of reconstruction has been estimated as at least three billion euros per year, without considering the earthquakes that struck Central Italy in 2016. Therefore, both moderate and large earthquakes (M ≥ 5) pose threats to the safety of individuals and the national economy, infrastructure, and cultural heritage.
The impact of large earthquakes on urban centers prone to disastrous seismic events can be reduced by adopting appropriate and timely actions after the event. In the case of earthquakes, the number of casualties in urban areas can be reduced if the location and severity of damages are rapidly assessed through the information provided by rapid response systems. Today, modern technologies, such as micro-electro-mechanical systems (MEMS), make measurements of strong ground motion possible in near-real-time [1,2,3,4]. In urban areas exposed to seismic risk, this could allow the centers of emergency management of both public and private sectors to allocate and prioritize resources in order to enhance the capabilities of emergency response, mobilize rescue teams, minimize loss of life, facilitate evacuations, permit rapid and effective deployment of emergency operations.
Related to these important issues, the urban- and building-scale monitoring networks move in the same direction, and represent the most innovative and cutting-edge solutions to start the test of an early warning system and achieve an effective system for post-earthquake rapid disaster assessment. Urban-scale networks focus on the mapping of the earthquake intensity and the implementation of early warning systems [5,6]. Building-scale monitoring networks, on the other hand, are devoted to structural health monitoring (SHM) [7,8,9,10] and on-site earthquake early warning (EEW) [11] systems; currently, real-time urban seismic networks for SHM and EEW are practically absent in Italy. The SHM itself is still rarely applied, mainly due to the high costs involved and the logistical difficulties in maintaining long-term campaigns and monitoring with traditional commercial instruments. The only example of SHM at the urban scale in Italy is that by the Department of Civil Protection (DPC) through activities foreseen in the Seismic Observatory of Structures (OSS) Project [12] (http://www.protezionecivile.gov.it/jcms/en/osservatorio.wp, accessed on 2 February 2022). However, the OSS provides for the seismic monitoring of isolated civil structures only for 129 public constructions (121 buildings, 7 bridges, and 1 dam), spread over the 20 Italian regional administrative units with a distribution that reflects the different seismic hazards of the respective territories.
In this paper, we describe the overall architecture of the urban seismic observatory OSU-CT, noting the progress made since its initial installation and its future development and expansion, and also discussing the most important aspects of its design and improvement. Then, we present the main characteristics of the realized seismic accelerometric stations, above all in terms of performances, and show the results obtained from the early tests by using earthquake data. We compare them with those obtained by using the seismic data acquired by commercial seismic stations and sensors regularly used by INGV for seismic monitoring. Finally, a recent Mw 4.3 earthquake, occurring in the volcanic district of Mount Etna, has enabled generating the first example of an urban map of the intensity of ground shaking (shakemap) in Italy, marking an important milestone toward the evaluation of how environmental threats affect the built heritage.

1.1. Urban Seismic Network and Structural Health Monitoring (SHM)

Urban seismology is now an important field of research both from seismological and engineering points of view [13,14,15,16]. It finds the most important applications in seismic microzonation studies in densely inhabited areas and monitoring historical buildings [15,17]. As is well known, in urban areas the seismic signal is strongly dominated by man-made activities at high frequencies, with high energy during working hours (Figure 1) and much lower energy at night and weekends.
Significant variations in the ground motion in the urban areas [18] have also been clearly observed during the most recent strong Italian earthquakes [19,20,21]. In fact, the local geological and geophysical conditions are able to produce amplification effects and differential damages within small distances [22]. Consequently, the adoption of the single seismic hazard zone, typically proposed for large regions or areas by the National Seismic Codes, is certainly inadequate.
In the last twenty years, the urban seismology in densely populated areas has grown in popularity, with the aim of obtaining microzonation maps, for engineering purposes such as the SHM of historical and monumental buildings, as well as traffic monitoring. Great strides in seismic monitoring have been achieved thanks to the technological advances in instrumentation and sensors. Many of the limitations of traditional devices, (i.e., large and expensive instruments) have been overcome, and today the progress made by MEMS technology and wireless data transmission has opened the way to new applications in several fields of seismology [23,24,25,26,27].
The choice of the sensors to use in setting up a monitoring system in a wide urban area is one of the most critical aspects to take into account. For example, in the case of SHM of buildings, often having heterogeneous characteristics, the choice of type and number of sensors to be installed notably affects the final cost and the performance of the system. Following the US Geological Survey standardized classification of sensing devices (ANSS 2008), the expensive class A accelerometers (20 to 26 bits resolution) are the ones generally used in the seismological field, including the EEW. However, effort must be made to optimize cost-effectiveness, without compromising the basic requirement of the application, and today is possible to consider the best sensors in class B (16 to 19 bits resolution, or higher) and some of those in class C (12 to 15 bits resolution) for our purposes.
The effectiveness and reliability of seismic urban networks, partially or entirely consisting of MEMS sensors, have been evaluated in numerous works together with the ability to record strong regional earthquakes [28,29,30,31] or even low to moderate (M ≥ 3) local earthquakes [32]. Other networks using MEMS sensors have mainly been designed for the seismic warning system (SWS) and many of these have already been implemented or are being set up in different countries [33,34,35]. Additionally, for SHM, MEMS technology, thanks to its low-cost production, will enable overcoming the issue of high-cost sensors in a short time. In addition, the development and improvement of wireless systems for sensor networks (WSN), allow for the achievement of effective continuous and high spatial density monitoring for long-term applications [36].
It is noteworthy that in Italy the SHM of buildings and/or civil infrastructures (viaducts, bridges, dams, etc.), still has few applications, and is often carried out for short periods with a high-cost sensor. The most significant improvements in this field, unfortunately, were obtained after the most recent strong earthquakes that hit central Italy [37]. In general, both natural and anthropogenic degradation, (e.g., seismic events, atmospheric agents, vibrations due to traffic, applied loads) reduce the structural resistance over time, inducing potential long-term risks.
The SHM therefore should be considered fundamental, at least for public buildings with a strategic function and also for historical and monumental edifices.

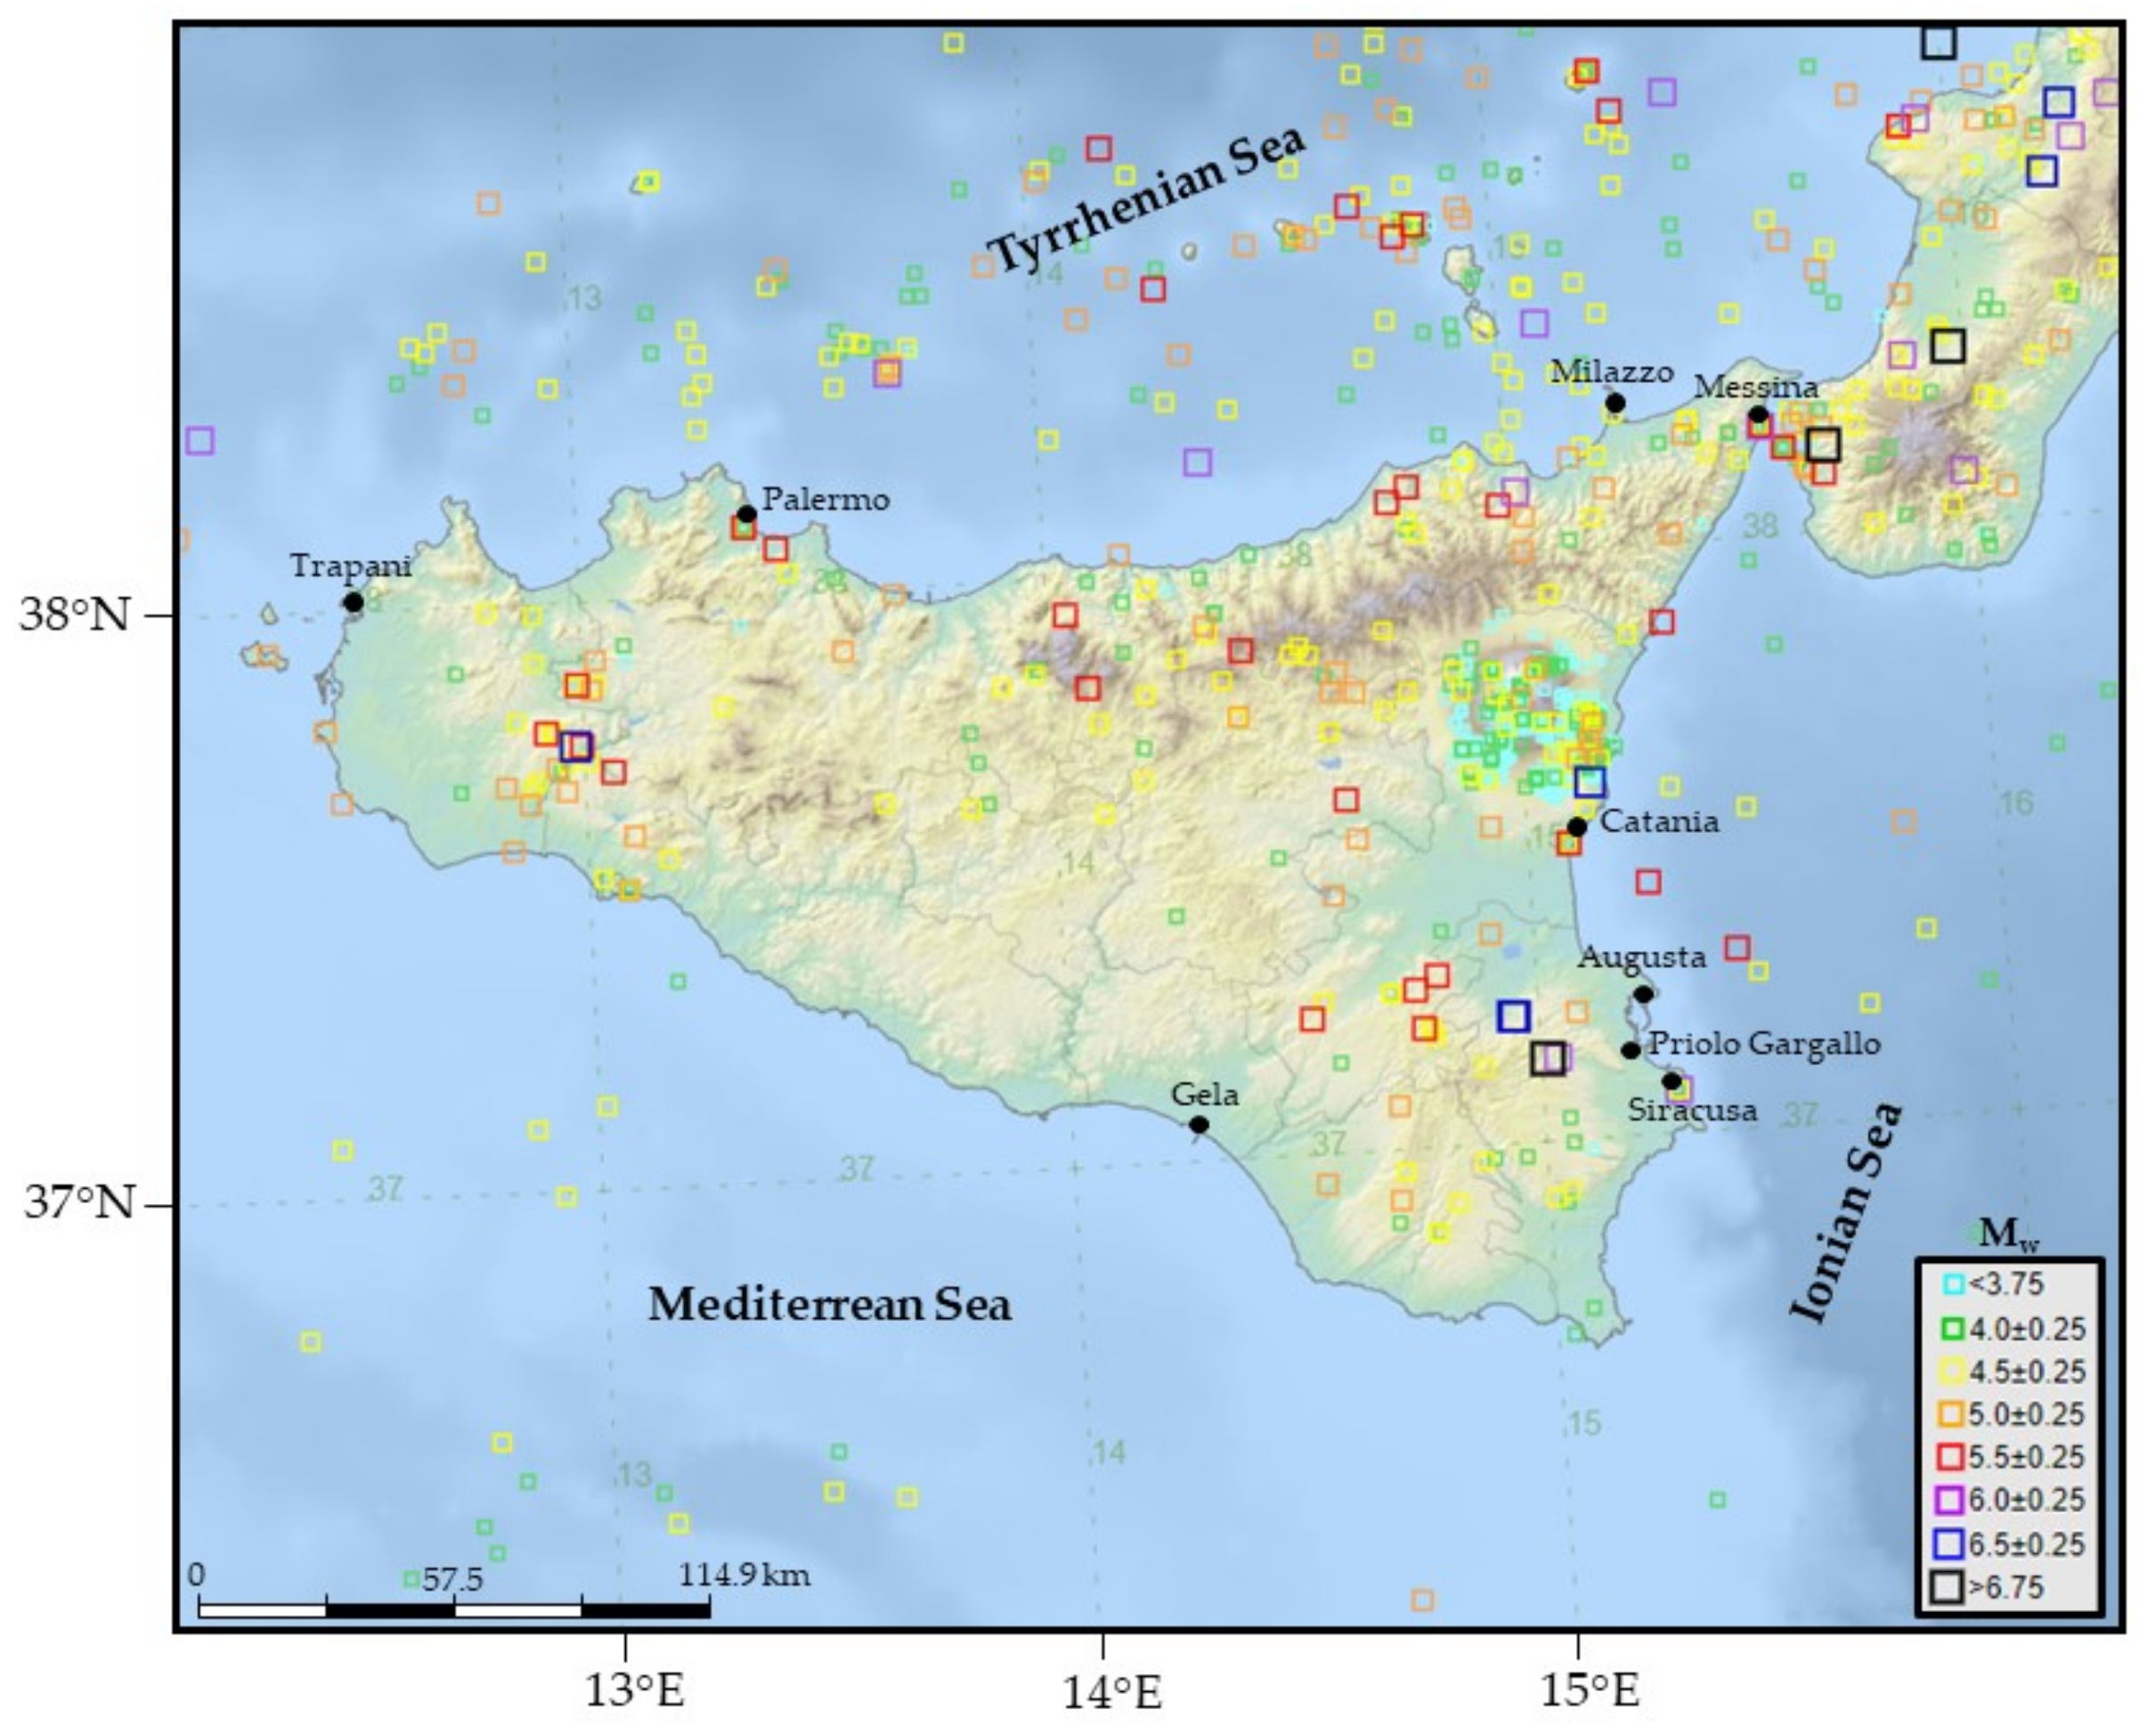
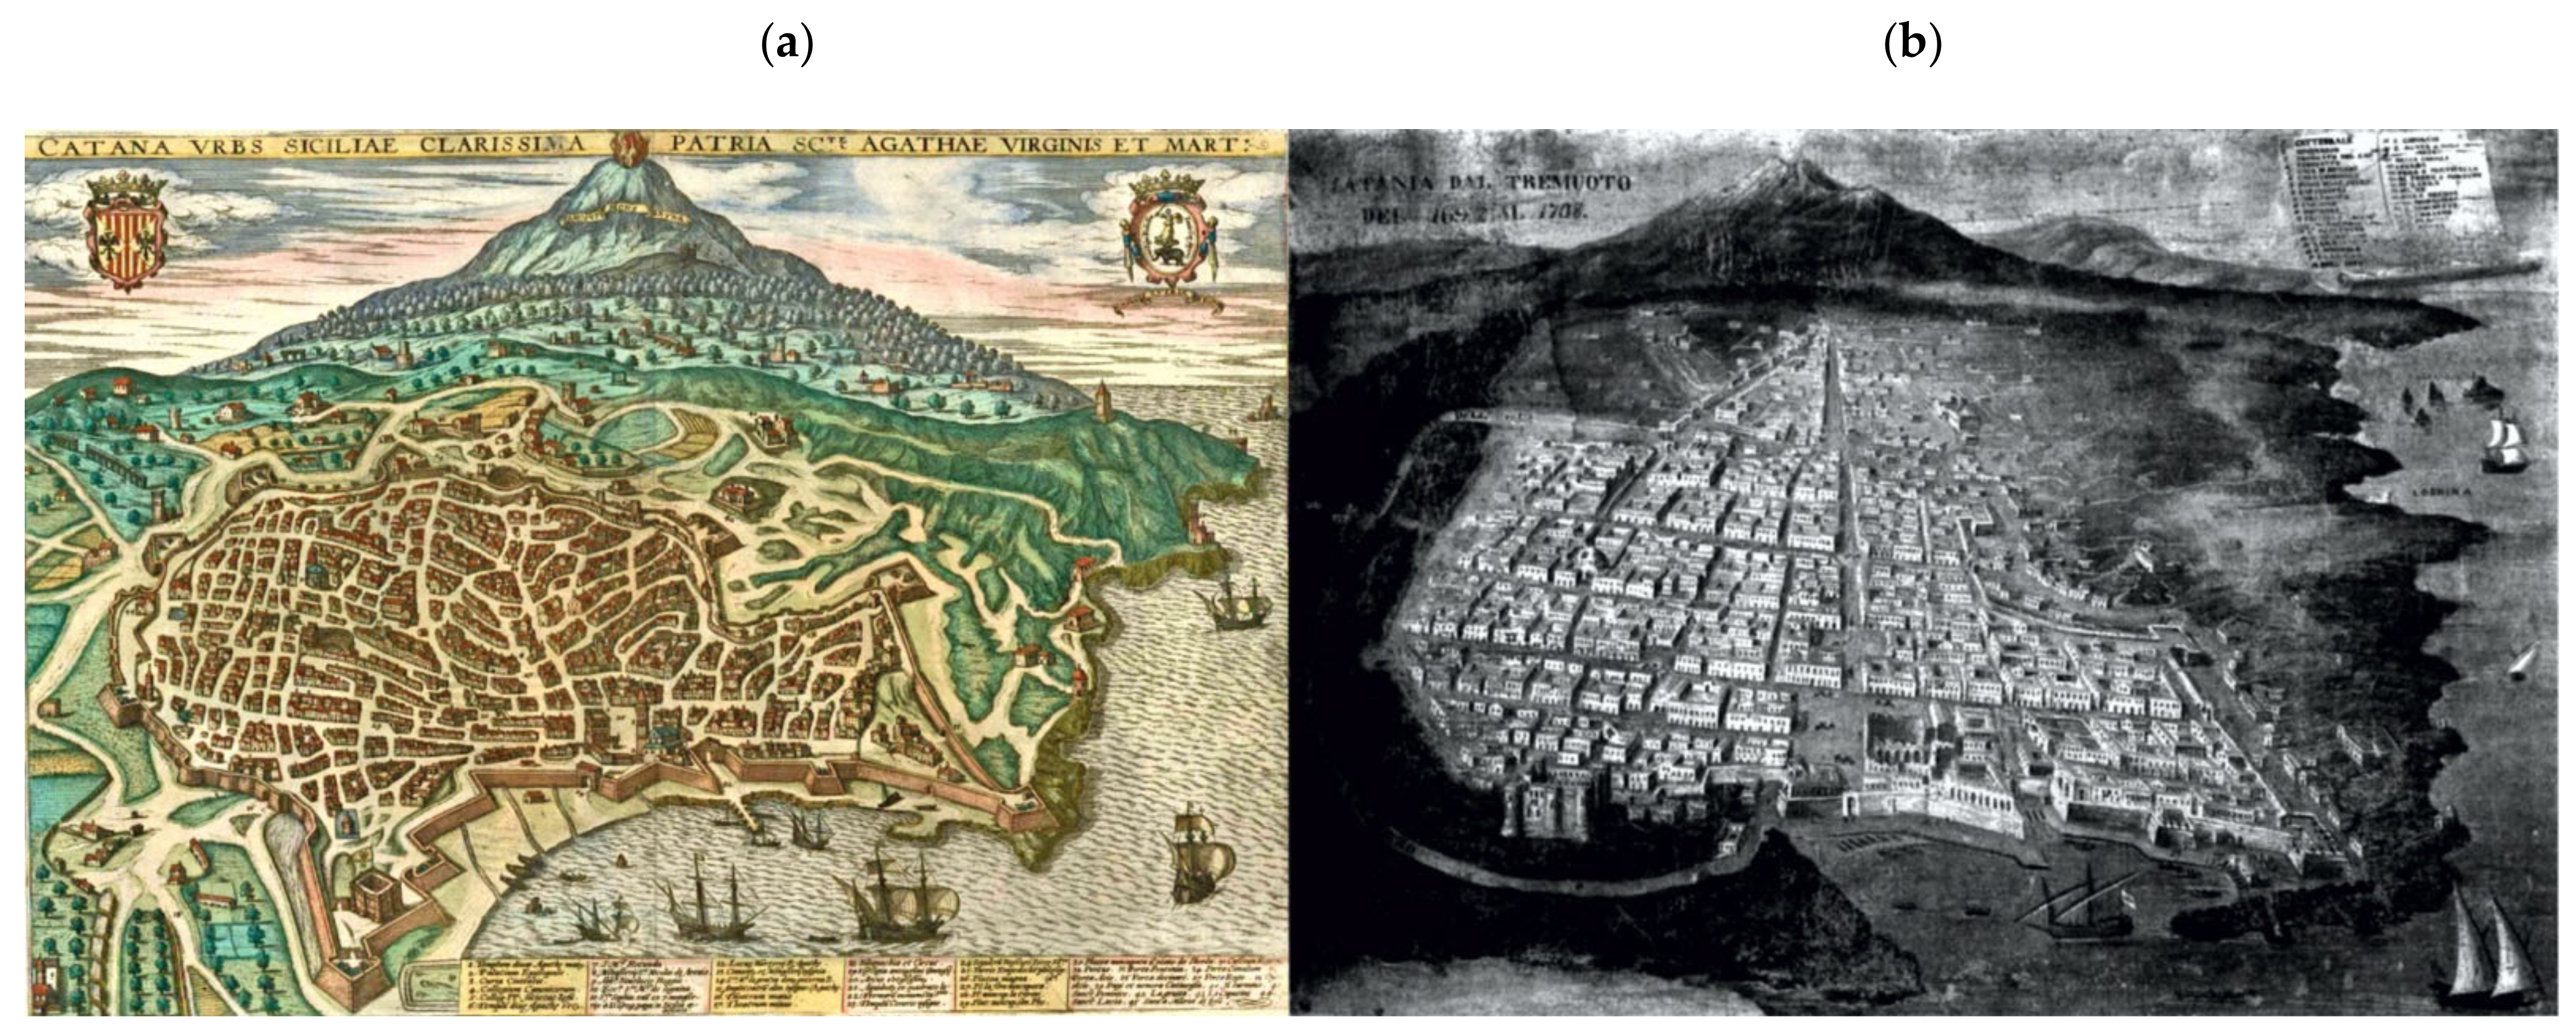
1.2. Why an Urban Seismic Observatory in Catania?

Sicily has historically suffered numerous catastrophic earthquakes (M ≥ 7), among the worst in Italy in terms of the number of victims. The 1693 Val di Noto and the 1908 Messina earthquakes are certainly the best known and affected the entire eastern sector of Sicily. However, the western area of the region was also severely impacted by the destructive effects of the 1968 Belice Valley earthquakes. Additionally, there are many so-called “moderate earthquakes” (M 5–6) that widely affect the entire Sicilian territory, and are capable of causing serious damage and localized destruction. The map in Figure 2 shows both the historical (starting from the year 1000) and the recent instrumental (1985–2019) seismicity, which highlights some of the main Sicilian seismic areas. In addition to the three large metropolitan areas of Palermo, Catania, Messina, and the more densely inhabited centers, among the areas at greatest seismic risk in Sicily are the three petrochemical hubs built close to the towns of Priolo Gargallo, Augusta, Gela, and Milazzo. These industrial centers are located in densely populated areas where about 150,000 people live, not considering the population of Siracusa, Messina, and other nearby towns.
The high level of seismicity and a population of more than 1 million people means that the Catania metropolitan area is amongst those areas with the highest seismic risk in Italy. As testified by the seismic catalogs, Catania was destroyed twice in the last 1000 years, due to 1169, and 1693 earthquake events [38]. Other events, such as those in 1542, 1716, 1818, 1848, and 1990, produced less damaging effects, even though very serious [38]. The earthquakes occurring in the coastal sector of the Hyblean foreland are those mainly responsible for the destruction or severe damage. Moderate or slighter effects are usually caused by the seismic events taking place along the seismogenic structures of the Strait of Messina and the inner part of the Hyblean region [39].
Together with another seven Late Baroque cities, Catania belongs to the Noto Valley which became one of the Italian UNESCO World Heritage Sites in 2002. Before the catastrophic seismic event of 1693, this attractive city had the typical characteristics of a medieval town, configured on the pre-existing Roman settlement, with short and narrow streets and the main road that ran through the city from south to north. The town was surrounded by walls having a perimeter of about 5 km, with eight bastions and eight gates (Policastro, 1952 (Figure 3a). Following the 1693 seismic event, Catania was fully rebuilt exactly in the same site, according to the Baroque stylistic model flourishing in Europe in the 17th and early 18th centuries (Figure 3b). The 1693 earthquake was one of the most violent and destructive events ever to strike Sicily. The tragic outcome was over 60,000 deaths, about 16,000 in the city of Catania alone, and the total destruction of 45 villages in eastern Sicily.
From the post-earthquake reconstruction of 1693 to almost the entire 19th century, Catania underwent only limited growth and modest changes in its urban fabric. Subsequently, the growth processes in the period between the 1970s and 1990s led to the current urban system, but without adequate urban planning tools.
After the earthquake of 13 December 1990 (ML 5.4), during which Catania underwent minor damage compared with the many affected towns in south-eastern Sicily, the city was at the center of intense research activity both at the national and European level. The results obtained by the “Catania Project” and the “European Risk-UE” project, on the whole, suggested that the number of human losses and the expected damage in Catania are such to deem it necessary to acquire a deeper and more detailed knowledge of the territory and the building context, starting with a prevention policy. Given the presumable high vulnerability, this is necessary not only for the historic buildings but also for the smaller and more recent buildings in reinforced concrete built before the seismic regulations of 1981. Finally, it is important to point out that the Italian seismic hazard map indicates the city of Catania among the areas where the greatest peak accelerations of ground motion in the entire country are expected (PCM Ordinance n. 3519 of 28 April 2006).

2. Method

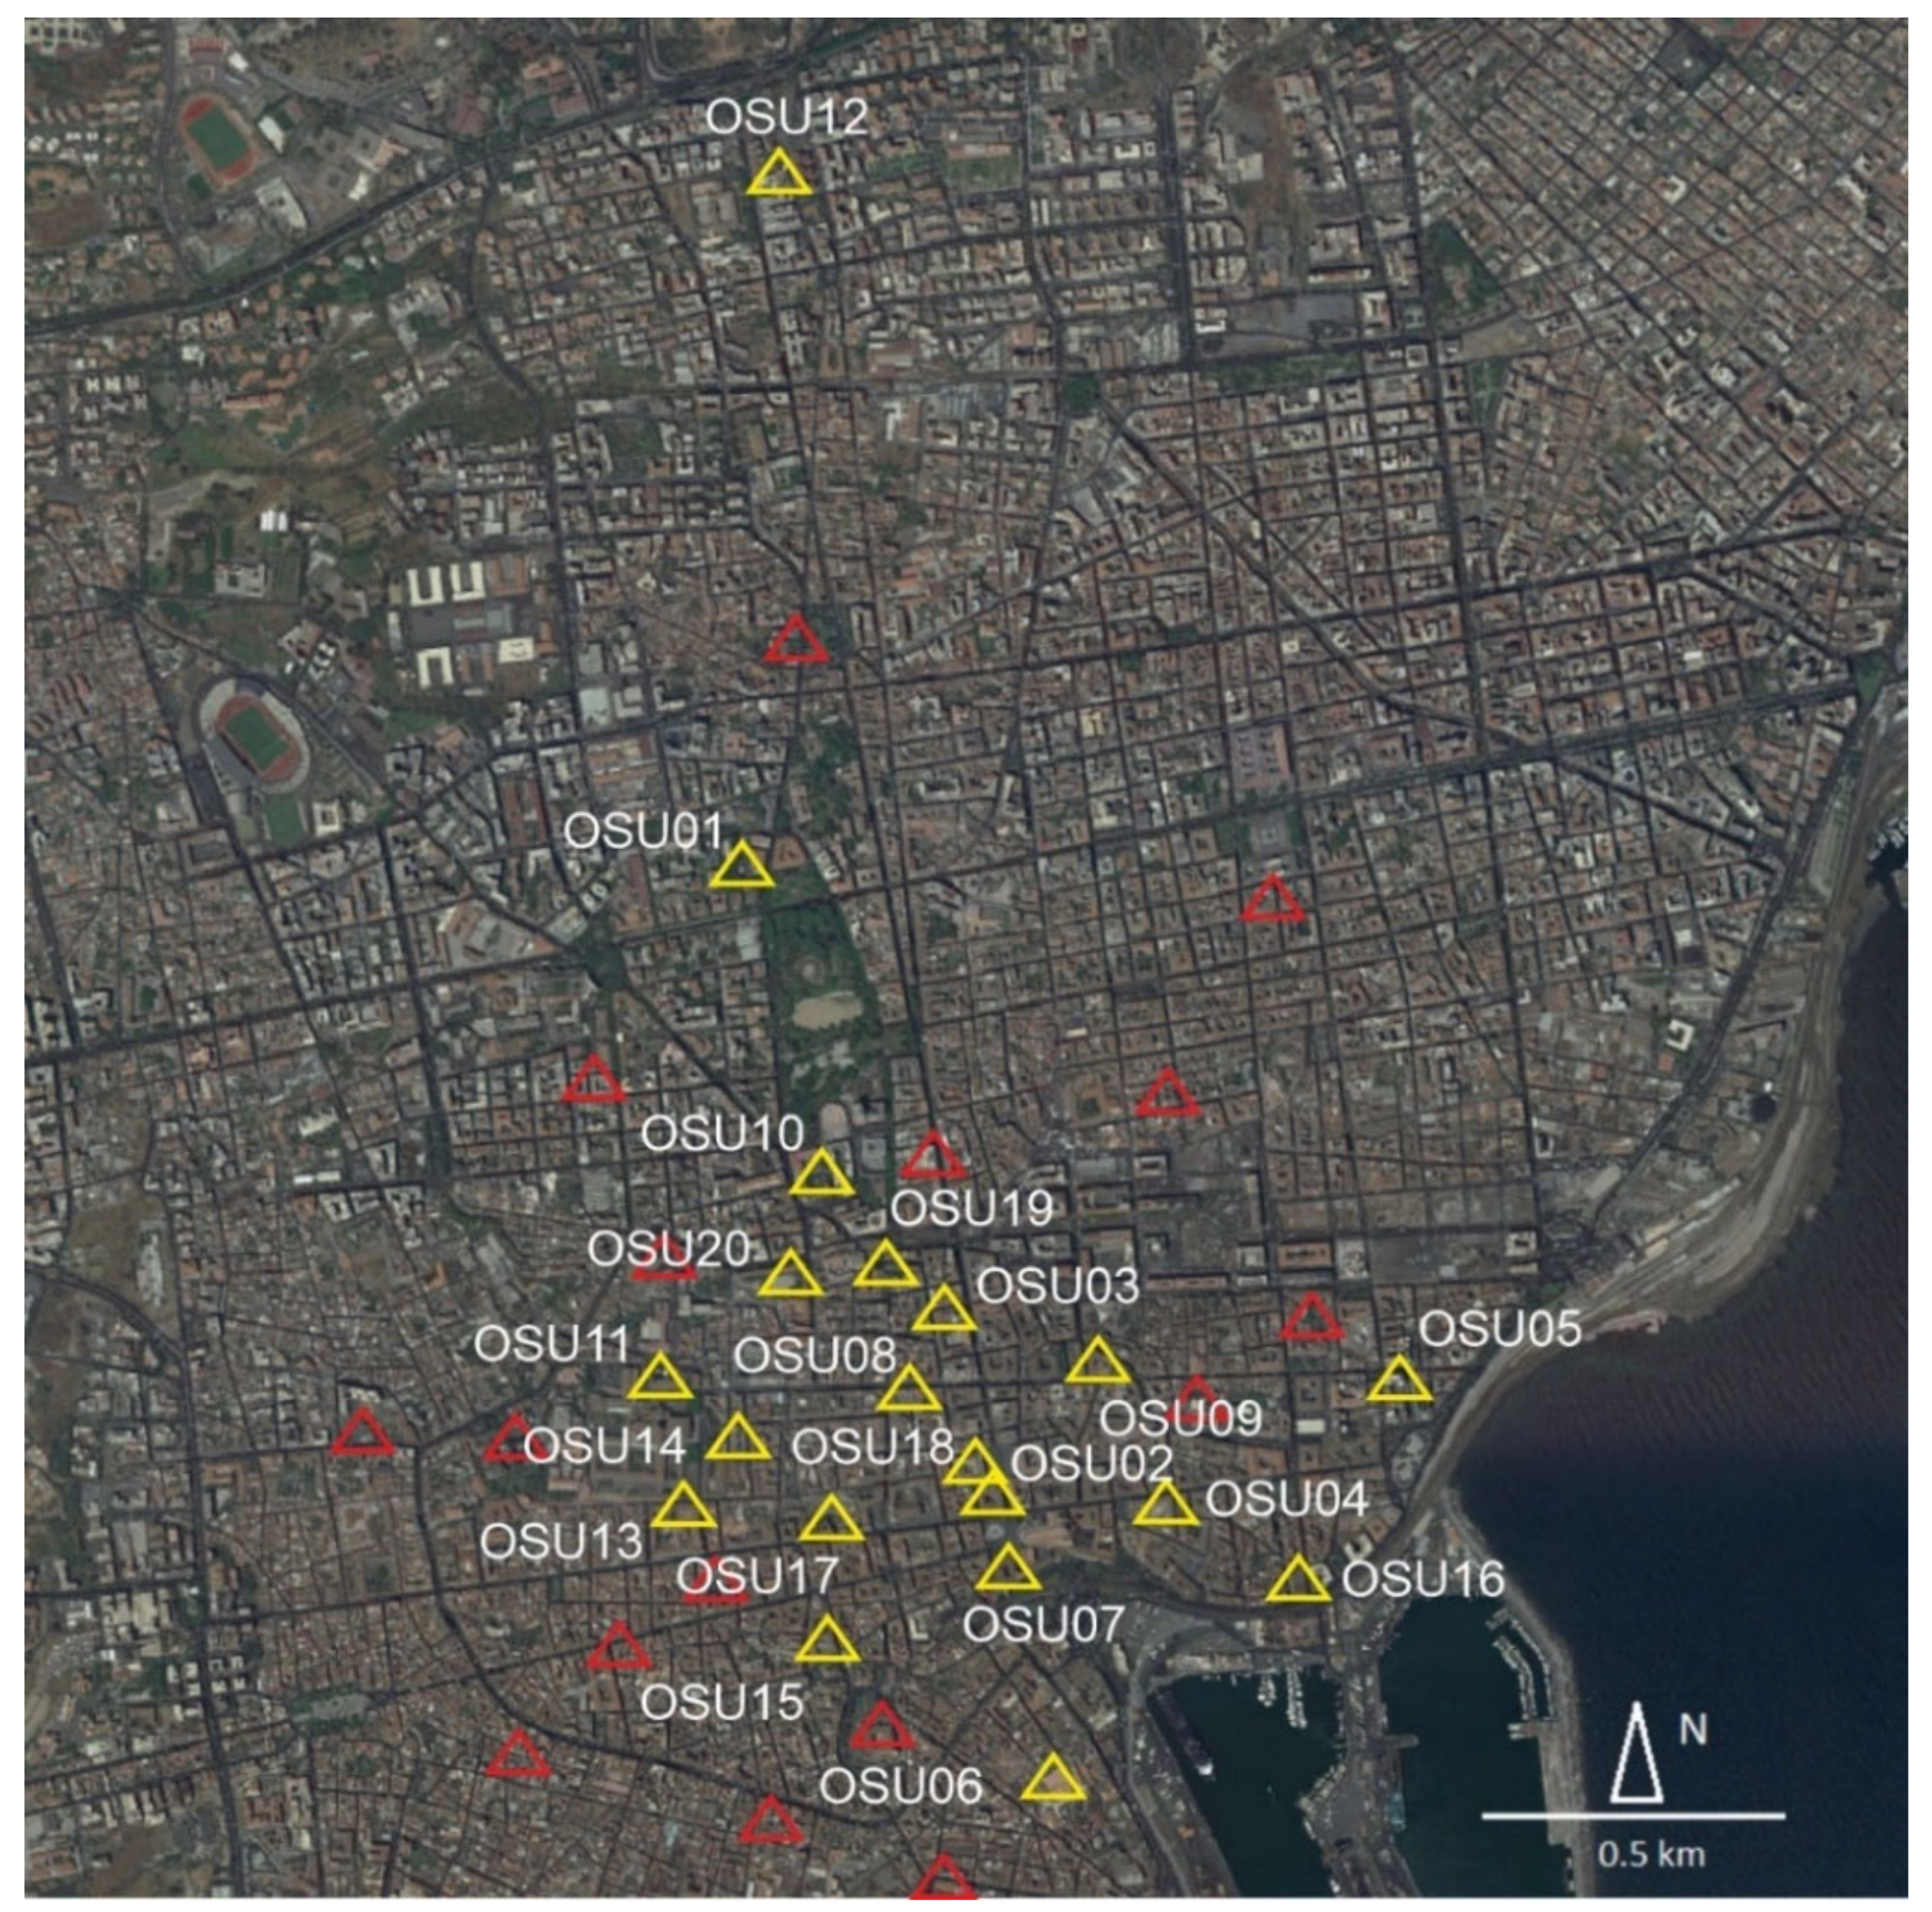
2.1. OSU-CT: The Urban Seismic Observatory in the City of Catania

Establishing an urban seismic observatory in the city of Catania (OSU-CT) was planned in 2018 thanks to a Memorandum of Understanding (MoU) with the municipality of Catania. Since 2019, the observatory is being developed within the EWAS (an Early WArning System for cultural heritage) Project [40] funded by the National Operational Program on Research and Innovation (PON R and I) 2014–2020 (specialization area PNR 2015–2020, «Cultural Heritage»), managed by the Italian Ministry of Education, University and Research (MIUR), and coordinated by INGV—Etnean Observatory (INGV-OE).
The overriding concept behind the OSU-CT is the real-time seismic monitoring through a high-density network of more than 40 stations installed in the urban area of Catania, 20 of which are already operative in its historic center (Figure 4). A dense network produces important consequences from various points of view. Firstly, it helps to better sample the effects of soil condition and its variation on the ground shaking intensity. At the same time, the real-time data ensures a faster alert on measured parameters, a key factor for the experimentation of an EEW “on-site” system. Additionally, shake maps can be produced by using the experimental data, without applying any model-based interpolation which needs knowledge of the epicentral coordinates.
Accelerometers are the most common type of sensors used for structural monitoring and represent the key elements for OSU-CT. Commercial data loggers and delicate force-balanced (FB) type accelerometer systems, rather expensive, can be considered inadequate to realize a dense seismic network in a populated city such as Catania. A line of less expensive sensors, maintenance-free, and adaptable to this field, are MEMS. Evans et al. (2005) were the first to propose the use of MEMS sensors to devise a seismic network. These sensors are now much more sensitive, cheaper, and comparable to expensive force-feedback sensors in terms of performance, and are currently revolutionizing earthquake observations, seismic surveying, and imaging, as well as the structural health monitoring of buildings.
The data acquisition system (data loggers and sensors) used to set up OSU-CT is OSU-AQ2, which represents an optimized and re-engineering version of the first prototype OSU-AQ1. The sensors are oriented with the x-axis pointing east, y-axis pointing north, and the z-axis pointing upward. The station, installed on the ground floor of the selected edifices, includes a 3G/4G router with an M2M sim (machine-to-machine), and a dynamic Internet protocol (IP) address is allocated to each sensor. All sensors are maintained and managed through these IP addresses. In so doing, every node can be accessed remotely to fix possible problems or perform eventual updates of the software. Therefore, the network topology chosen for OSU-CT is a star network where each node is connected to a central hub with a point-to-point connection. This design was chosen because it satisfies both flexibility and reliability requirements.
The ground motion data of each node of OSU-CT are sent in “real-time” (every 1 s), in miniSEED format, to a server located at Osservatorio Etneo of INGV. Several linear connections can be established from the hub, and stations can be added or removed without affecting the network. Furthermore, for redundancy, several hubs can be present on the territory, two or more networks can be merged into a single network by simply connecting their hubs, and two or more end-points can be merged into a sub-network. OSU-CT is managed by the software SeisComP4 (https://www.seiscomp.de, accessed on 1 January 2022) developed in Germany by the geoscience research center (GFZ, Potsdam). Acquisition, processing, interactive analysis, and data release are included in SeisComP. The server receives miniSEED files from the stations and reassembles them into daily traces (one trace per component) that are archived on an NAS. The system can also function as a ringserver, disseminating data to seismic rooms.

2.2. Hardware Design

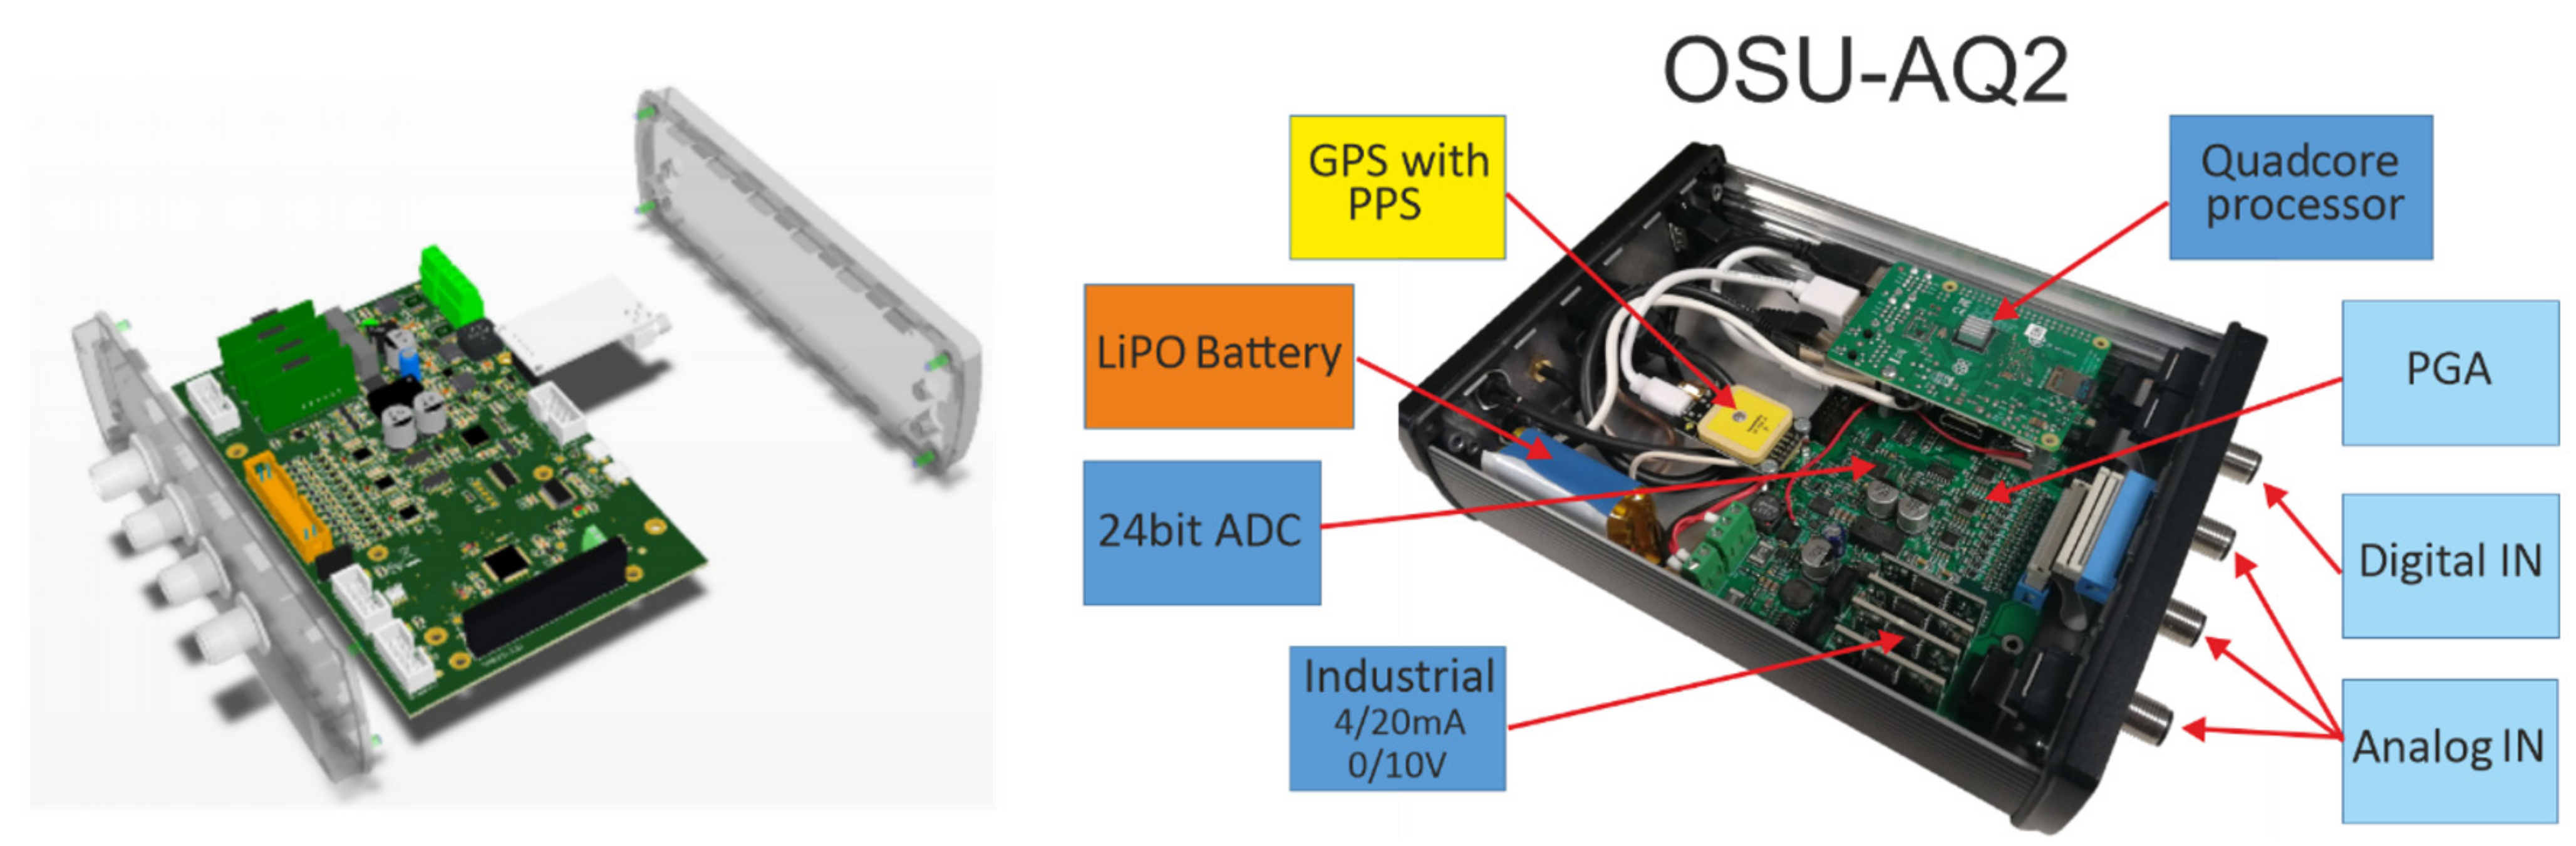
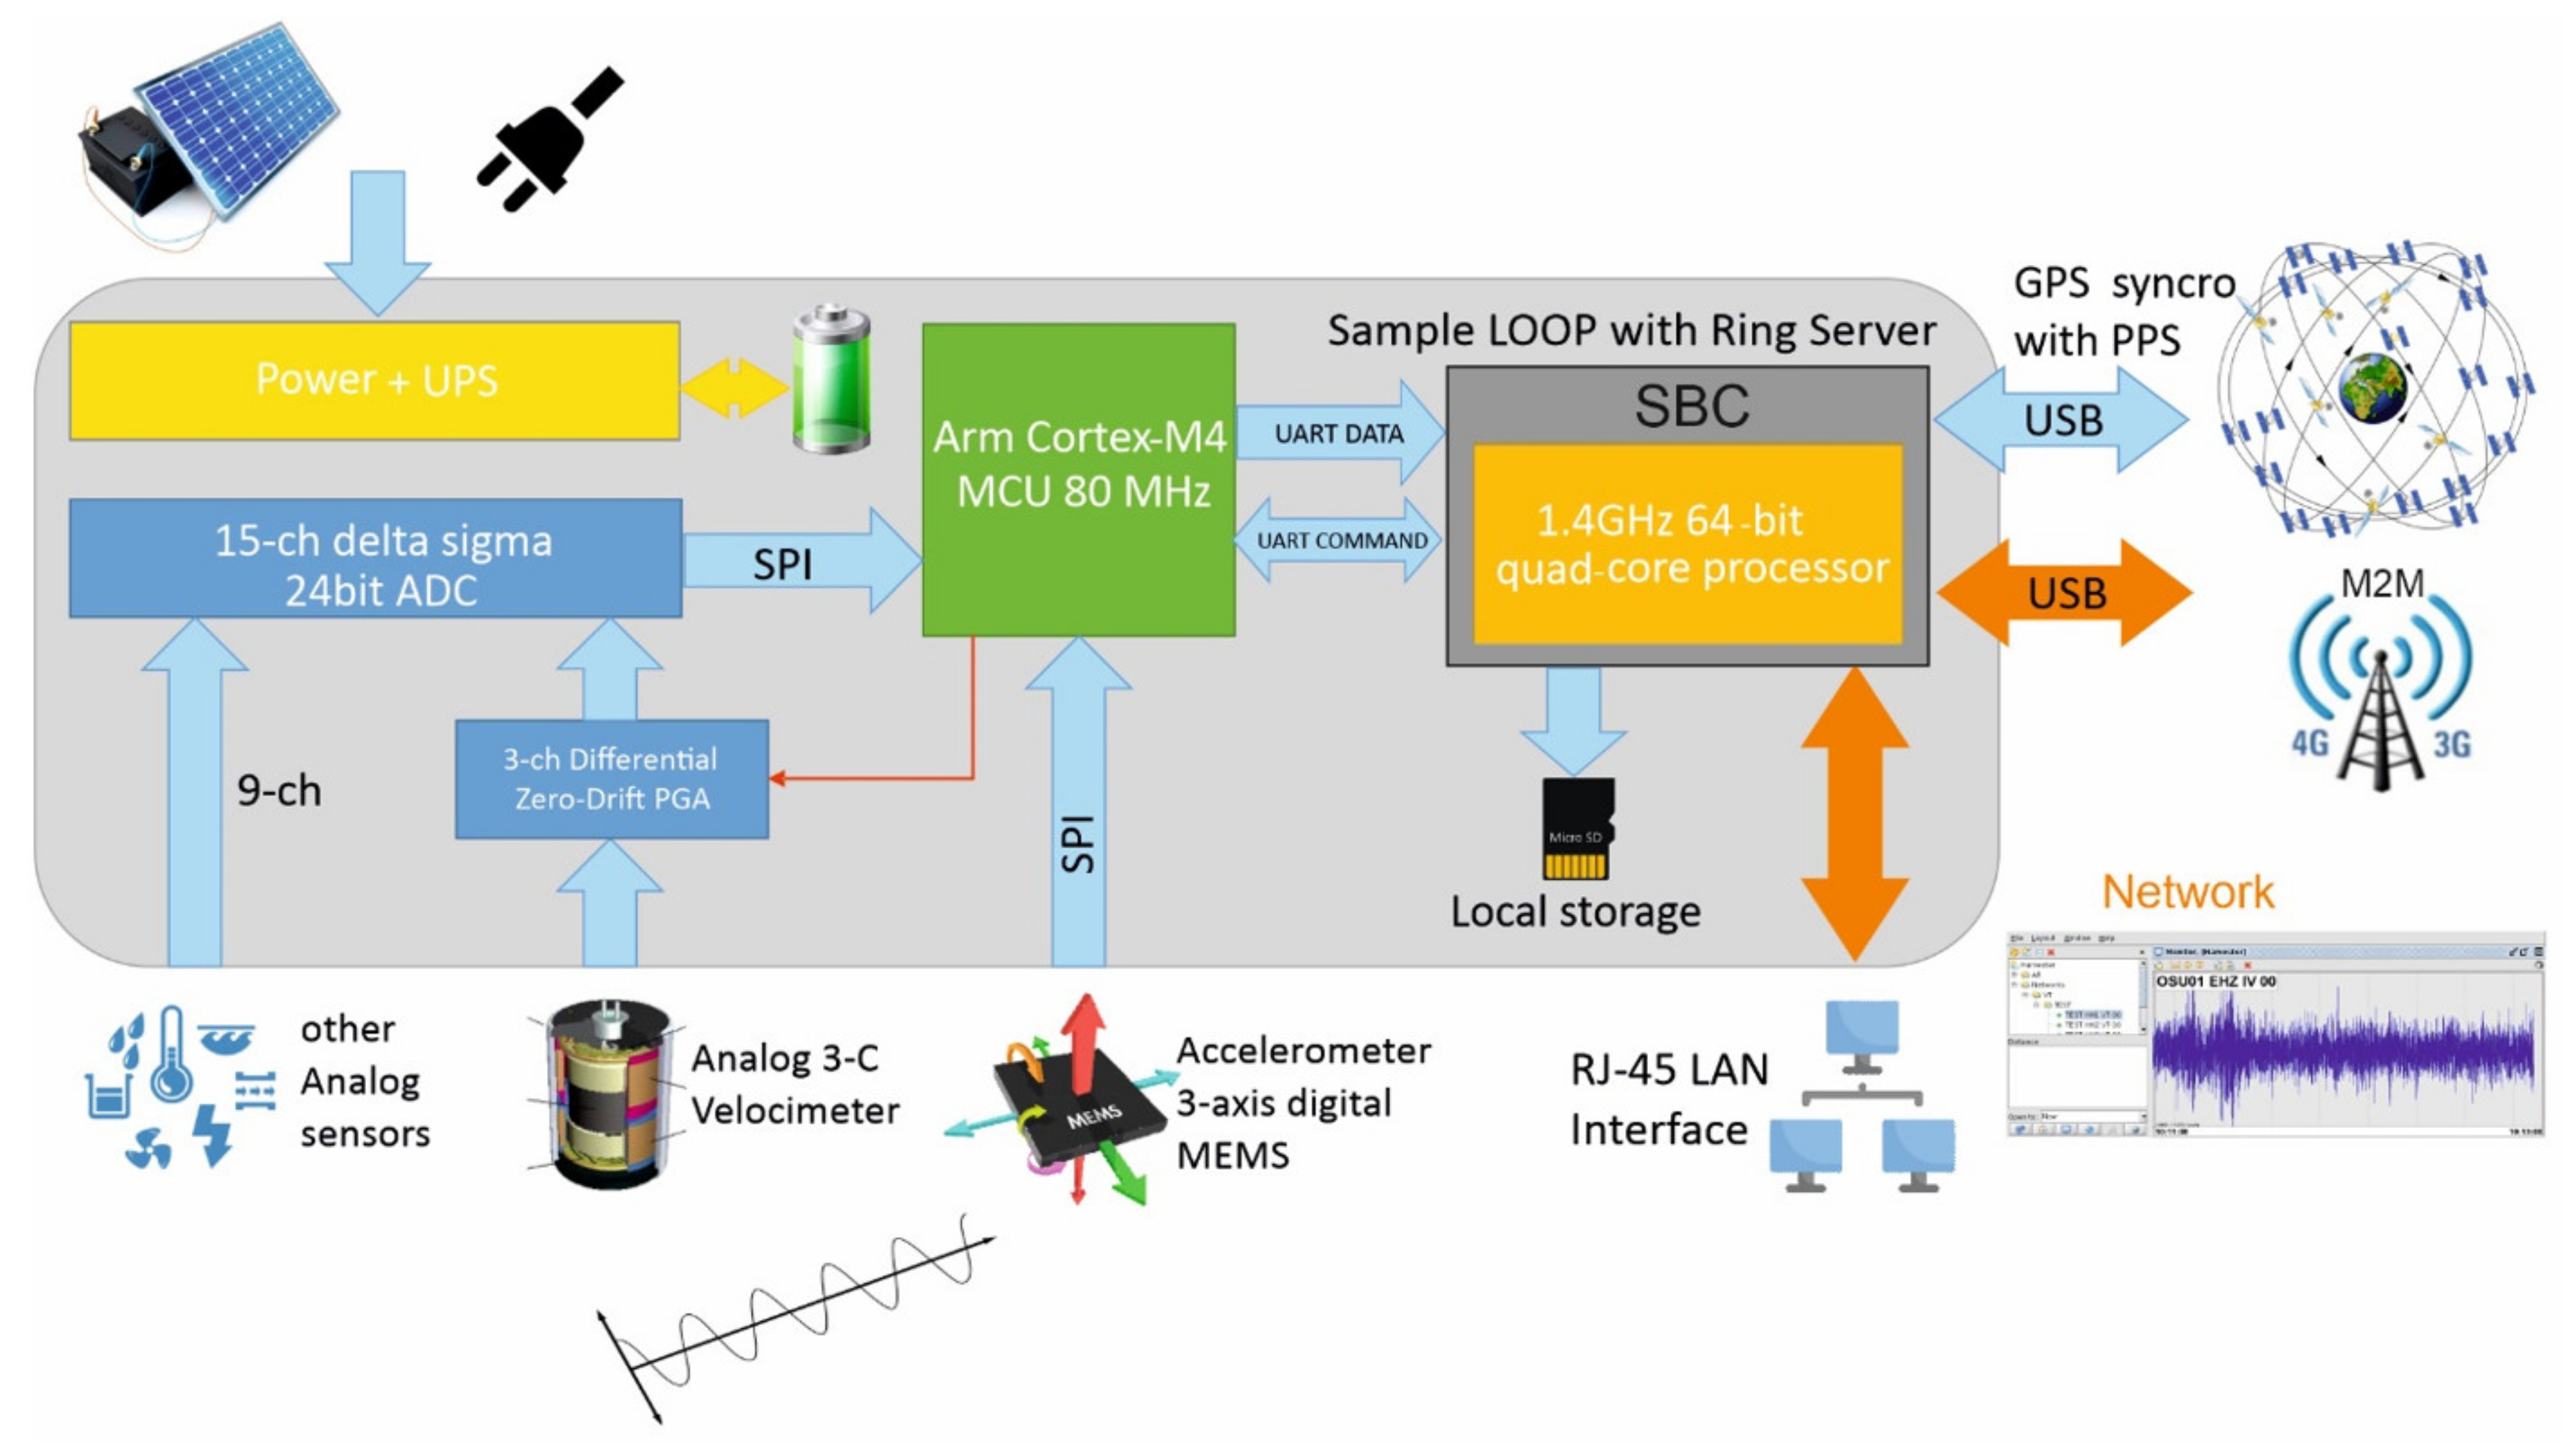
2.2.1. The OSU-AQ2 Data Logger

The OSU-AQ1 smart data logger is an earlier version of the multi-parameter data acquisition system currently used, named OSU-AQ2. It was released in 2019, and only a small batch of prototypes was assembled. It was improved and re-engineered after one year of field testing, leading to the making of the OSU-AQ2 version in 2020. In order to reduce the development time and production costs, the components were chosen among commercial parts and their assemblage has been customized. The OSU-AQ2 permits digital and analog sensors to be connected (Figure 5).
The main board of the OSU-AQ2 includes:
  • A 24-bit, 16-channel (multiplexed) delta-sigma analog to digital converter (ADC) ADS1258 from Texas Instruments;
  • An analog interface with a very low noise programmable gain amplifier PGA281 from Texas instruments and passive low-pass 100 Hz antialiasing filters;
  • A microcontroller Arm Cortex M4 MCU 80 MHz STM32F405, which has three main functions: reading samples from the analog and digital sensors, generating a data frame including the sample number and timestamp, and finally transmitting data to a single board computer (SBC).
The integration of an SBC, a Raspberry Pi Model 3+, allows for data management and storage, network connectivity settings, and the execution of software code, such as that which enables the earthquake early warning on-site.
Due to the need for a multi-parametric data logger with more than 6 channels, robust performance, and low cost, the Texas Instruments ADS1258 was chosen as an excellent compromise for the project’s objectives. This ADC features a sigma-delta architecture for high effective resolution and an integrated multiplexer for reduced board size. The output sampling rate is selectable by means of a set of configurable digital filters which reduce the external computational overhead. The programmable gain amplifier PGA281 was added to perform adjustable gains (0.125, 0.25, 0.5, 1, 2, 4, 8, 16, 32, 64, and 128) on three channels in single-ended or 6 channels in differential mode. This allows varying the dynamics of input according to the sensor type. Moreover, the amplifier stage enables minimizing noise and obtaining more stable measurements, even with sensors that produce very weak signals. For example, for the microtremors analysis, where the signals are weak and there is no risk of saturation, the gain can be significantly increased and noise minimized.
The OSU-AQ2 integrates a GPS receiver Ublox NEO-7M and a 3G/4G modem based on SIM7600E-H. The use of a GPS receiver card, equipped with a PPS output (1 pulse per second), ensures synchronicity and precision from the point of view of timing. An autonomy of about 2 h is guaranteed by a power bank that works as a UPS and makes up for any lack of external power supply. In Figure 6 a simplified working scheme of the OSU-AQ2 is shown.

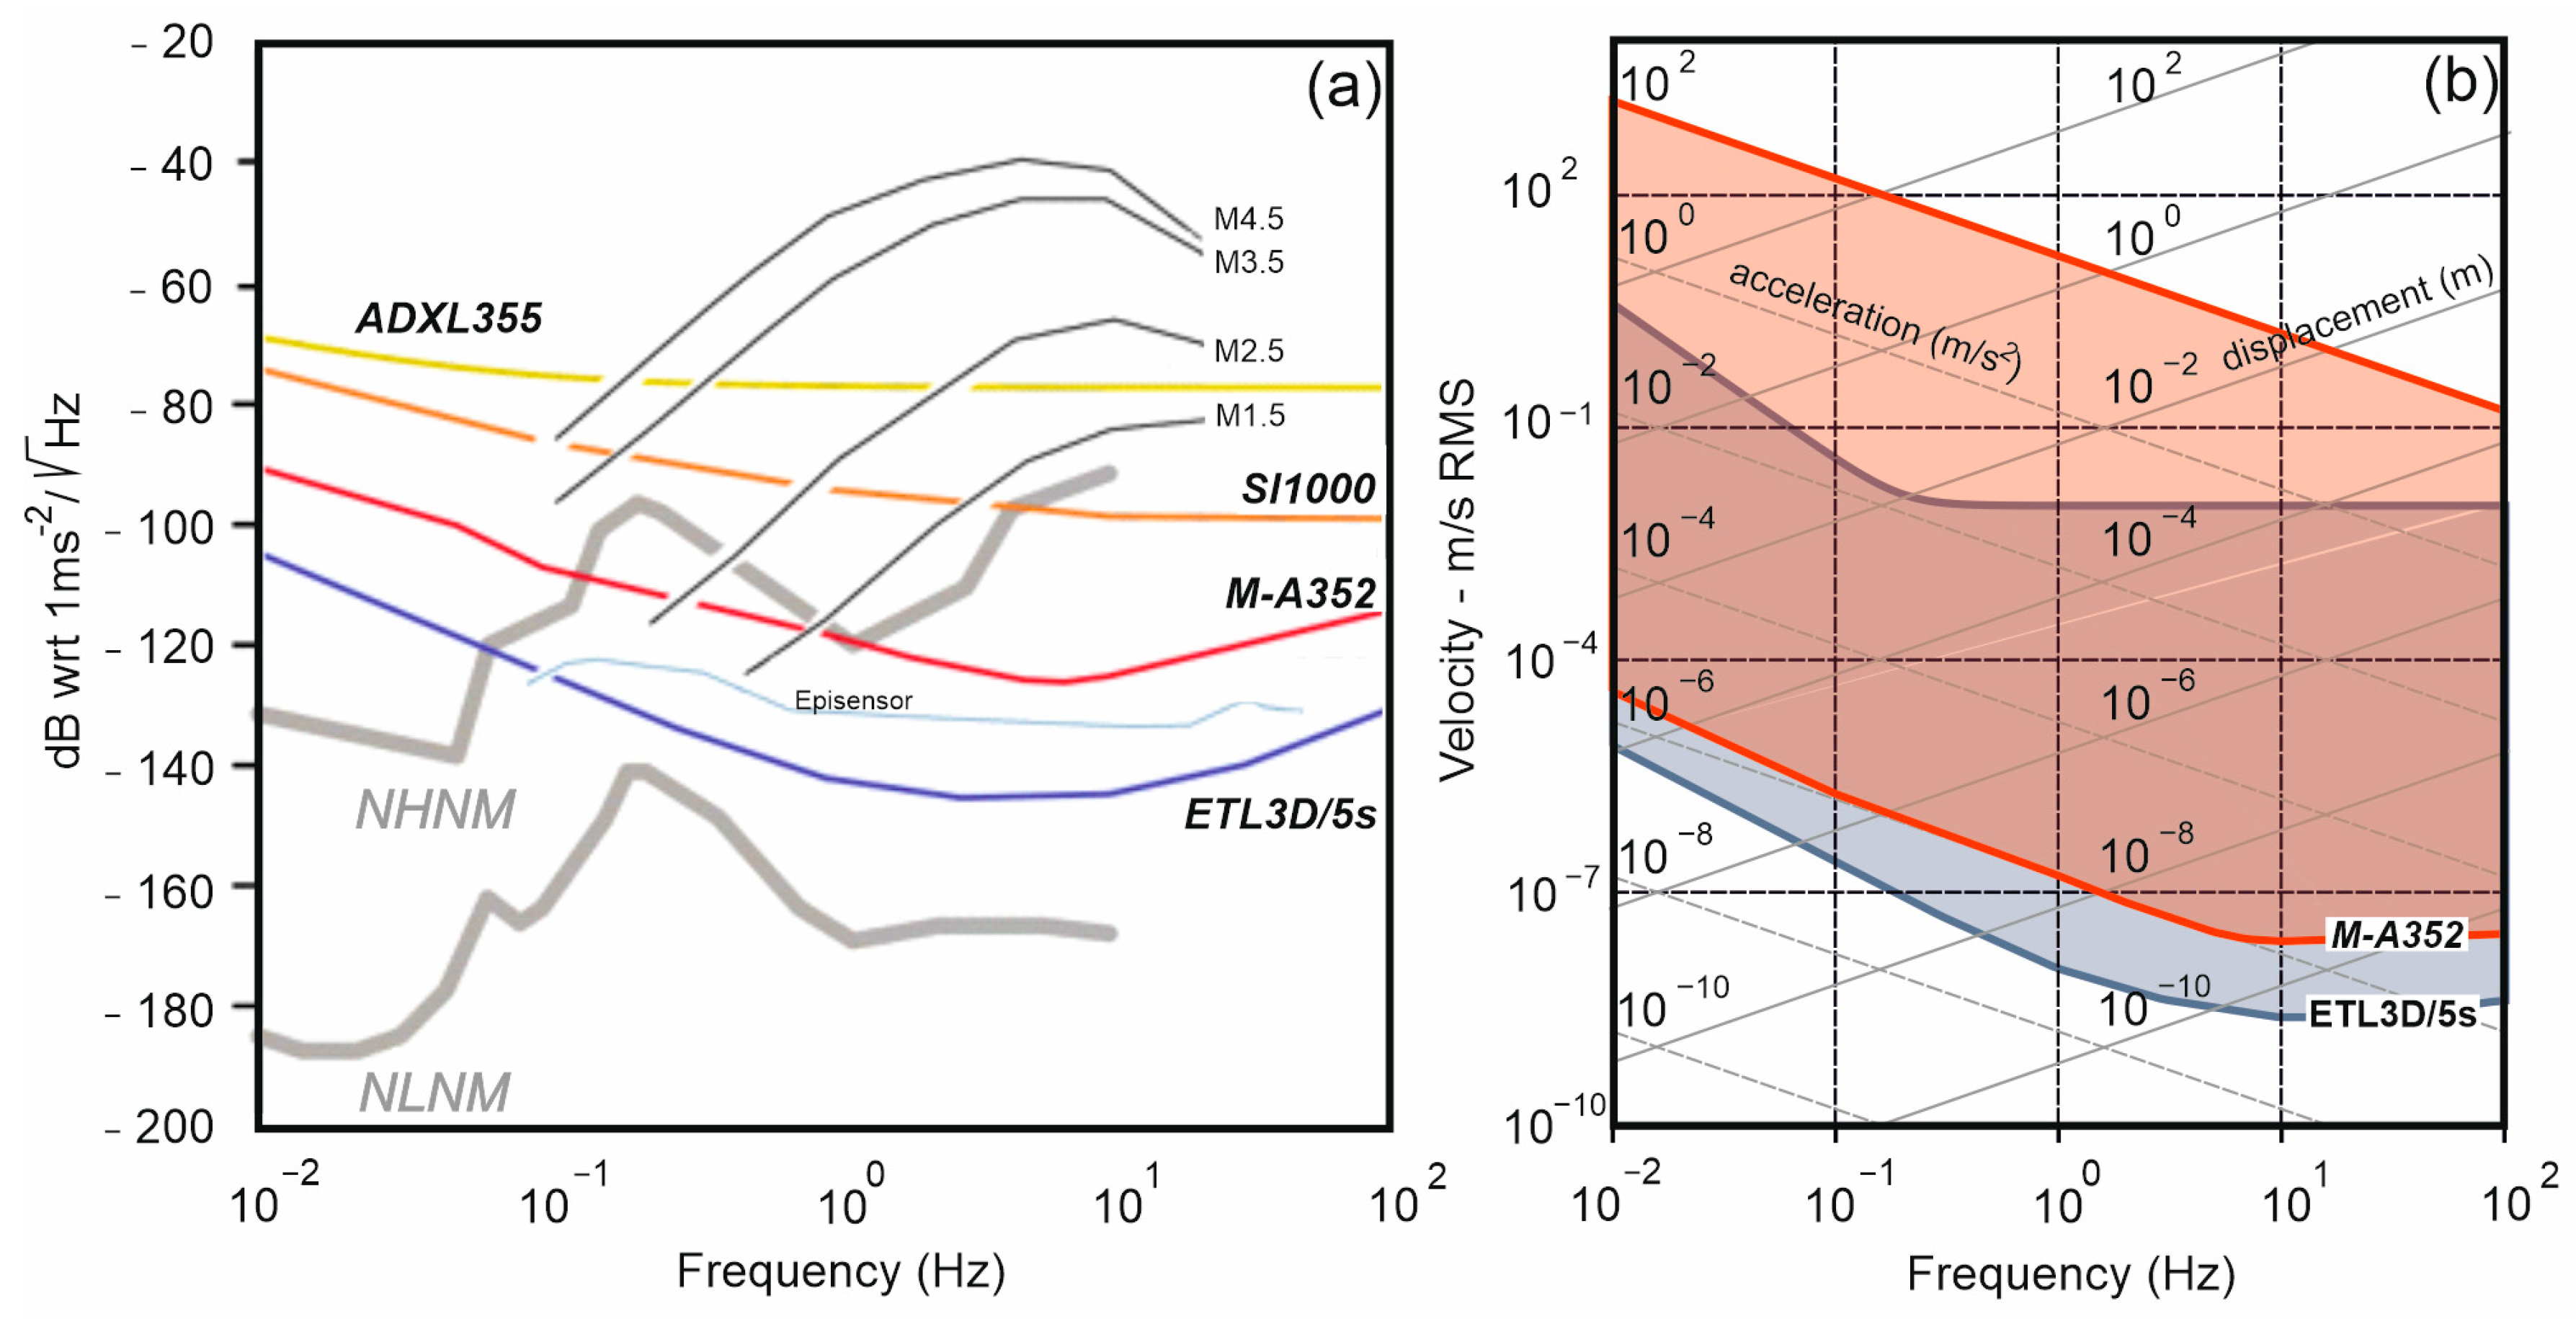
2.2.2. Sensors: Velocimeter and MEMS Accelerometers

Within the project EWAS, and for the OSU-CT purposes, a three-component velocimeter with 5 s period and 100 Hz high cut-off frequency (noise floor of 10 (nm/s)/√Hz at 1 Hz), has been designed ad hoc and realized (the ETL3D/5s [41]). The velocimeter was planned for monitoring local and medium-range earthquakes, and for environmental noise measurements, (e.g., for HVSR analysis and microzonation studies). The sensor is very small in size (97 mm diameter, 117 mm height) and low in weight (1.7 kg). Its low-power electronics consume only 75 mW of quiescent power. The ETL3D/5s is based on a set of three geophones arranged on an orthogonal triad, combined with low power and low noise amplifier. The sensor implements a temperature compensation scheme that mitigates the effect of temperature variations, keeping period and gain stable. The housing, made of AISI 316L stainless steel, is resistant to atmospheric agents and is IP67 waterproof (Figure 7).
Earthquake engineering is, however, more interested in vibration and strong motion measurements, and therefore accelerometers are preferred even though are less sensitive to wide band excitation. Low-noise accelerometers can be used both for the measurement of small acceleration signals directly and, as the first, low-noise stage of the instruments measuring low-noise velocity signals. There are several types of seismic accelerometers that vary in construction and operating principle. Ultra-low-noise seismic piezoelectric accelerometers with integral electronics (IEPE) are the most used in the engineering field. In addition to the IEPE type, accelerometers can be designed as variable capacitance MEMS. The IEPE and MEMS seismic accelerometers are the types that are most widely used in the industry and in the monitoring of structures. Currently, on the market, there are many MEMS accelerometers. One of the crucial parameters for seismological and vibration applications and for SHM is the noise density of the accelerometer [1,42]. A high noise density MEMS, around 100 µg/√Hz, such as that of the Phidget, was initially used for the first version of the OSU-CT accelerometric station. However, it was subsequently deemed inadequate for our purposes. We then investigated and verified MEMS accelerometers having low-noise density (≤50 µg/√Hz) and ultra-low-noise density (≤1 µg/√Hz). The key parameters of the evaluated accelerometers can be seen in Table 1, where low noise and very low noise MEMS accelerometers, the Kinemetrics force balance ES-T, and also two standard piezo types (Piezotronics PCB393B12 and PCB 393B04), widely used in engineering measurements, are reported.
After several tests, for the sensing element of the OSU-CT node, we decided on the low noise tri-axial MEMS ADXL355 accelerometer, which represents the main goal of the network designed in EWAS and that is less expensive with respect to the velocimeter and to the other chosen accelerometer, the ultra-low-noise QMEMS M-A352. Contemporaneously, for a better and more complete installation in a part of nodes, further development of the ETL3D/5s seismic sensor has been conducted, which led to the realization of two versions of a hybrid seismometer. The cheapest one, named ETL3D/5s-H1, integrates the three-axis Class C MEMS ADXL355 with the noise density of 25 µg/√Hz, while the more expensive one, the ETL3D/5s-H2, includes the high-performance tri-axial Class B QMEMS M-A352 accelerometer with an ultra-low noise density of 0.2 µg/√Hz). In more detail:
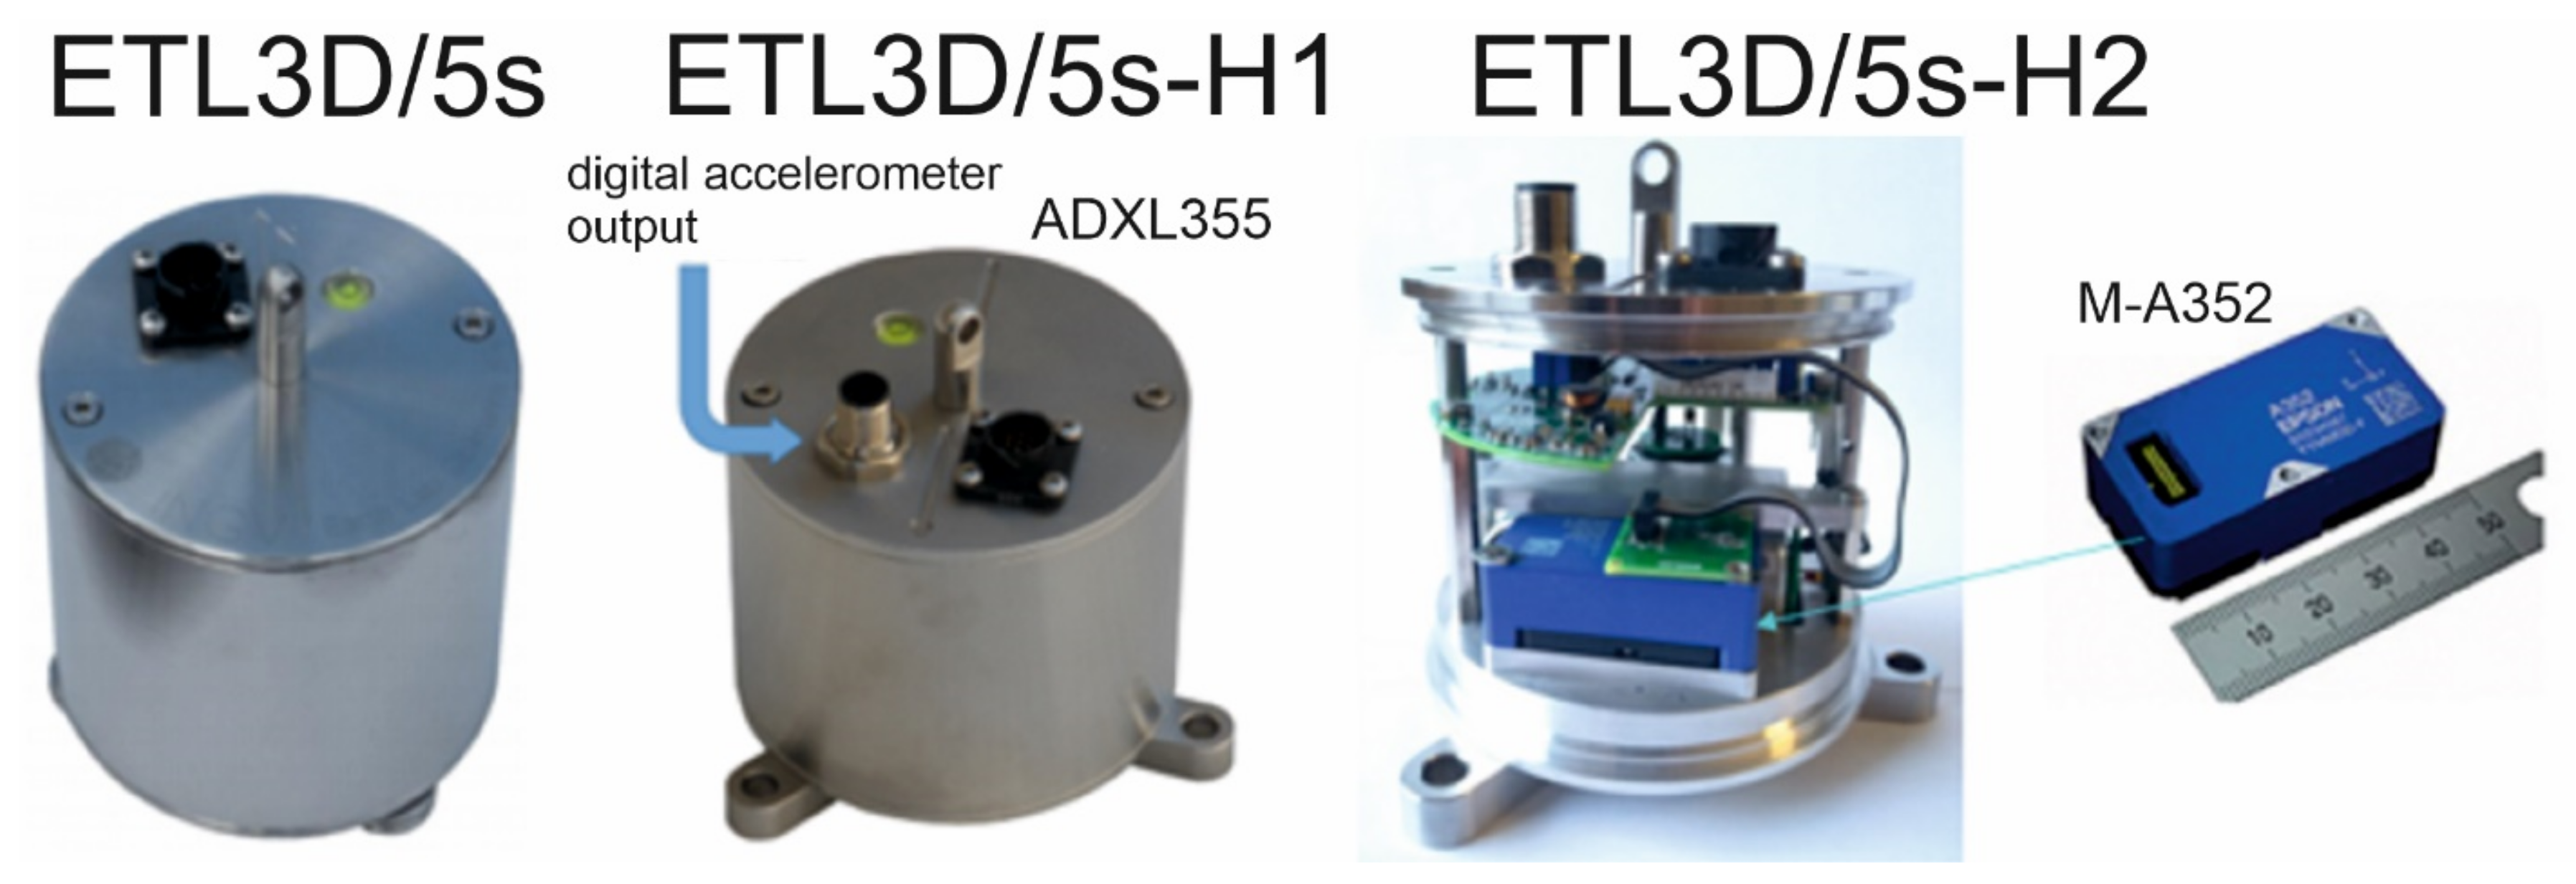
  • The ADXL355 (analog device) is a high-performance three-axis Class C MEMS accelerometer. Output is 20 bits for acceleration data and its dynamic range can be selected by initial SPI commands (±2/4/8 g) and ±2 g is used in our case. It presents a digital SPI or I2C interface (SPI is used in our case) and has an output resolution of 3.9 µg/LSB (on average at ±2 g). This sensor is connected to the OSU-AQ2 device using an SPI interface for communication (Figure 6). The accelerometer also has other digital interface signals (INT1, INT2, and DRDY), which are used for additional communication with microcontroller and SBC.
  • The M-A352 (Seiko Epson Corporation, San Jose, CA, USA) high-sensitivity, ultra-low noise, and low-power digital Q-MEMS accelerometer, features among the highest resolution levels in this class of commercial accelerometers. The M-A352 output of 30-bit (24 effective) has a resolution of 0.06 µg/LSB (average) with a wider dynamic range of ±15 g while supporting a frequency bandwidth up to 400 Hz. The M-A352 can be connected to the OSU-AQ2 device using an SPI interface in the same way as the ADXL355 (Figure 6).
The M-A352 was chosen for its performance as the definitive sensor for the integration in the velocimeter ETL3D/5s (Figure 7). The small size of the accelerometer allowed its integration through the remodeling of the internal spaces, but without changing the external dimensions of the ETL3D/5s housing.
Figure 8a compares the PSD curves of the ADXL355 and M-A352 accelerometers to that of the Safran SI1000 accelerometer, which has been examined as another suitable accelerometer to be used for OSU-CT; the PSDs of the Episensor force balance accelerometer and of the ETL3D/5s velocimeter is also shown. The noise density of the best one, M-A352, is well-suited for seismological applications (Figure 7) and SHM measurements, and it is worth noting that it is comparable to the more sensitive Episensor and also to the typical piezoelectric accelerometers mainly used in the SHM application (Table 1). In Figure 8b, we compare the dynamic range of the M-A352 accelerometer and ETL3D/5s velocity sensor. Each point in the velocity–frequency plane represents a possible combination of frequency and velocity root mean square (RMS) values. The colored area contains all the permissible combinations of velocity RMS and frequency for both sensors. For a given frequency, the minimum velocity is represented by RMS value of the instrument self-noise, band-pass filtered to an octave bandwidth around that frequency. The maximum velocity is the RMS value of a sine wave with peak velocity at the clip level of the instrument. The graph shows a set of constant acceleration (oblique lines with negative slope) and displacement curves (oblique lines with positive slope). The acceleration and displacement values used to mark the curves are RMS. The accelerometer can measure instantaneous accelerations up to 15 g (or 147 m/s2), within a bandwidth that goes from DC to a configurable cut-off frequency (9 to 460 Hz). The boundary at the bottom of the permissible region is the RMS value of the self-noise, according to the specifications, band-pass filtered to one-octave bandwidth. For the velocity sensor, the top boundary is flat within the sensor bandwidth but rises below the cutoff frequency with decreasing frequency. For that sensor, the clip level is about 14 mm/s and, as a result, the flat level in Figure 8b is about 10 mm/s RMS. The two regions partially overlap in the middle of the graph, but the accelerometer region stretches above that of the velocity sensor, reaching velocities up to 4 orders of magnitude larger than the latter (around 0.2 Hz). At the bottom, the boundary of the ETL3D/5s region is about one decade of magnitude lower than the corresponding boundary for the accelerometer, meaning that the ETL3D/5s can reveal smaller signals compared to the M-A352.
As shown in the following paragraph, the high intrinsic noise and poor sensitivity of the ADXL355 limit the magnitude detection threshold. However, for the OSU-CT deployments, we chose this accelerometer for the very low-cost and good performance to detect greater magnitude earthquakes or moderate earthquakes occurring at shorter distances, while for structure monitoring applications is more suitable the M-A352.
For almost all the stations of the network, equipped with ADXL355, the sampling rate has been settled at 125 Hz, and consequently, the cutoff frequency of the low-pass filter (it is a function of sampling rate) is 31.25 Hz. Conversely, for stations equipped with the M-A352 accelerometer the data acquisition system is settled at a sample rate equal to 200 Hz and the cutoff frequency of the low-pass is 60 Hz.
The drivers and software enabling OSU-AQ2 to work with the ADXL355, Epson M-A352 accelerometers, and the velocimeter ETL3D/5s have been developed ad hoc. The driver reads data from the sensors, processes them, and performs adjustments to the sensor in accordance with the user’s needs.

3. Results

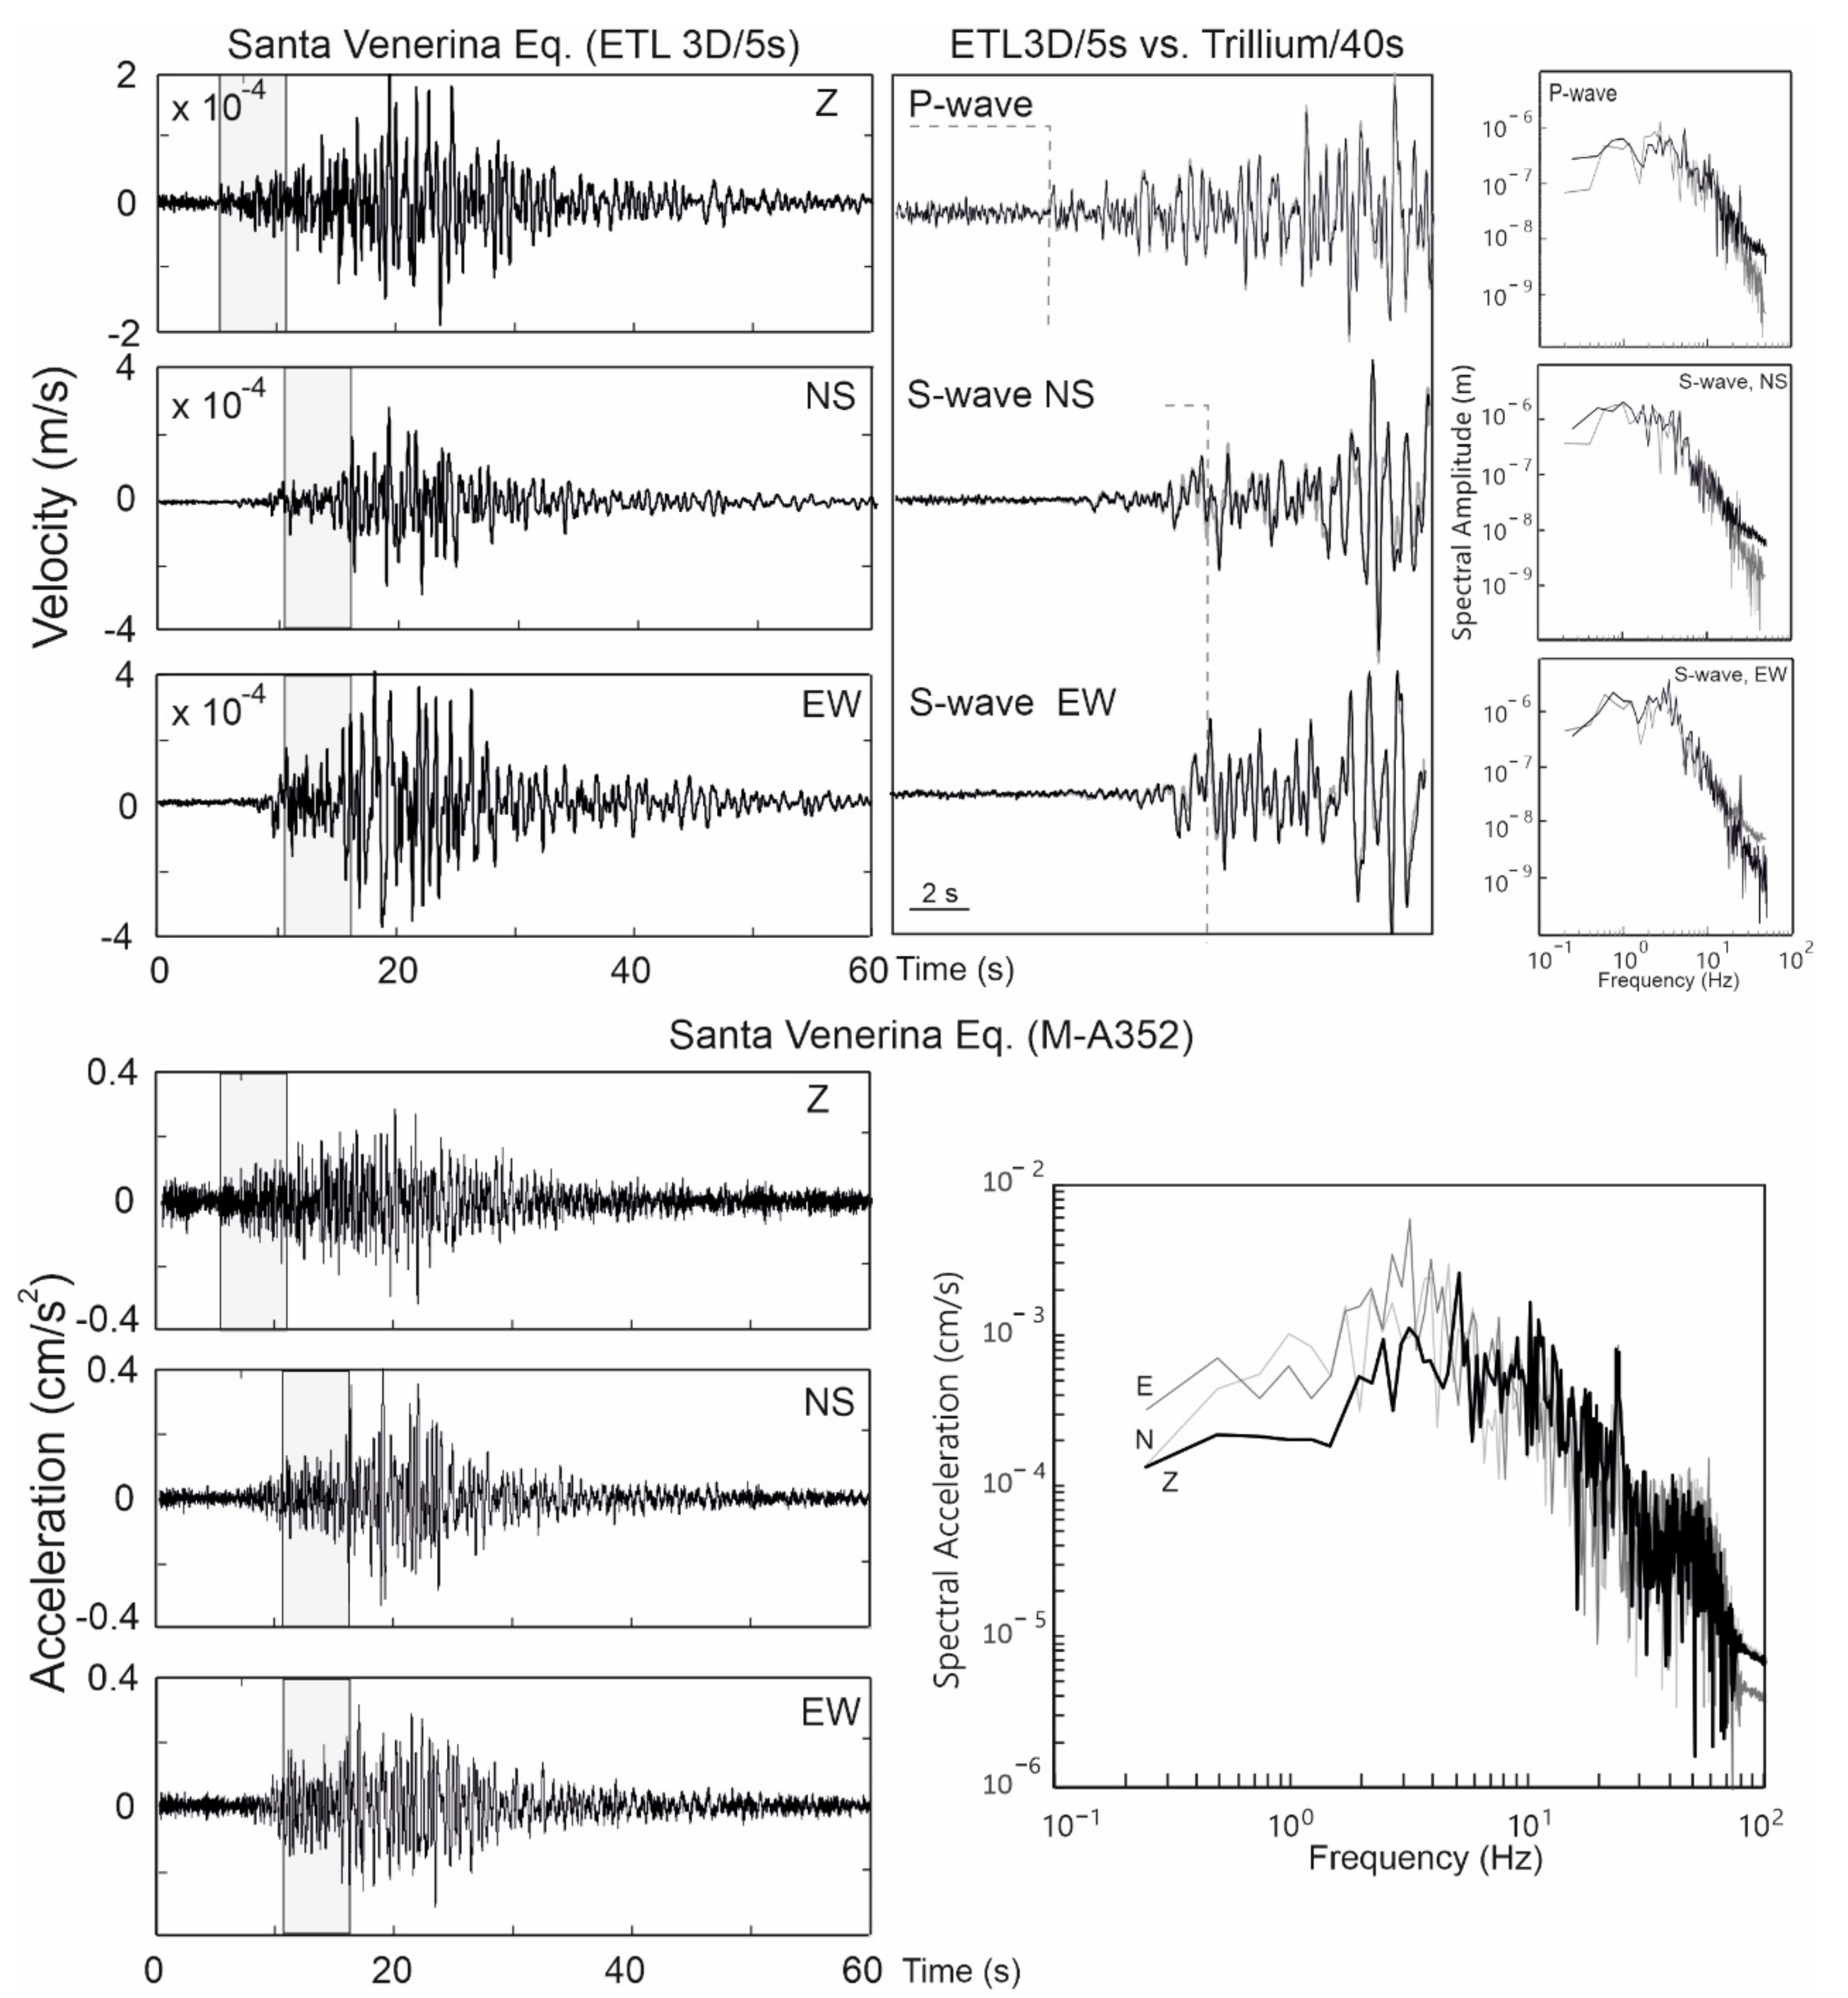
3.1. OSU-CT Earthquake Detection

This section provides some examples of the seismic recordings made at OSU stations, displaying the performance of the realized instruments and the earthquake detection capability of this urban network. Currently, the MEMS ADXL355 accelerometer is used in most of the OSU-CT stations, while the ETL3D/5s-H2 and ETL3D/S-H1 seismometers are actually used only in the OSU01 and OSU02 sites, respectively.
Since 2020, the velocimetric sensors installed at OSU01 and OSU02 have recorded many Etnean earthquakes with magnitudes greater than 2.5 and many of these earthquakes were also well-recorded by the accelerometer M-A352 incorporated in the ETL3D/5s-H2 (OSU01 station). Conversely, these microearthquakes are nearly indistinguishable at the station equipped with the ADXL355.
On 23 December 2021 at 21:33:45 (UTC), an earthquake of magnitude 4.3 struck Motta Sant’Anastasia (Lat. 37.484, Long. 14.918, Depth 11 km), about 15 km from Catania, generating panic in the city and its surroundings. It was preceded and followed by around 50 smaller earthquakes. Figure 9 shows accelerometric data from OSU01 and OSU19 for four earthquakes that occurred before the mainshock and had magnitudes ranging from 2.3 to 3.3. Given that the two stations have comparable epicentral distances and soil conditions, we can see in Figure 9 that the ADXL355 (OSU19) has a poor signal-to-noise ratio for values less than 1 cm/s2, whereas the M-A352 (OSU01) has a good signal-to-noise ratio for values less than 0.1 cm/s2, allowing for well-recorded events up to magnitude 2.0.
As a result, the M-A352 enables the identification of seismic phases for earthquakes with magnitudes greater than ca. 2.0, which is a functional detection to test the EEW throughout this range of distances.
It is worth noting that also for events of ML ca. 3.0, occurring at distances of ca. 70 km, the M-A352 again shows a very good signal-to-noise ratio, allowing for clear detection of the P and S phases. In Figure 10, both the velocigrams and accelerograms recorded at OSU01 for the magnitude 3.3 Santa Venerina earthquake, occurring on 5 February 2022, 28 km away from the station, are presented. Here the velocigrams recorded at ETL3D/5s-H2 are compared to those recorded at the co-located commercial nanometrics station, which includes a Trident datalogger and a Trillium 40 s velocimeter. For this event, the accelerograms for the vertical, NS, and EW components recorded by the M-A352 are also shown together with the related P and S wave spectra (lower part of Figure 10).
Despite the differences in the data loggers and velocimeters, as well as in the signal sampling setup (500 sps at the OSU-AQ2 and 100 sps at the Trident-Nanometrics), it is highlighted that: (1) the signals for each component correlate well both in terms of amplitude values and shapes; and (2) the P- and S-wave velocity spectra of recordings at the two stations are very similar until 30 Hz. Above this frequency the spectral shapes of signals diverge because the antialiasing filter at OSU-AQ2 is set to 100 Hz.

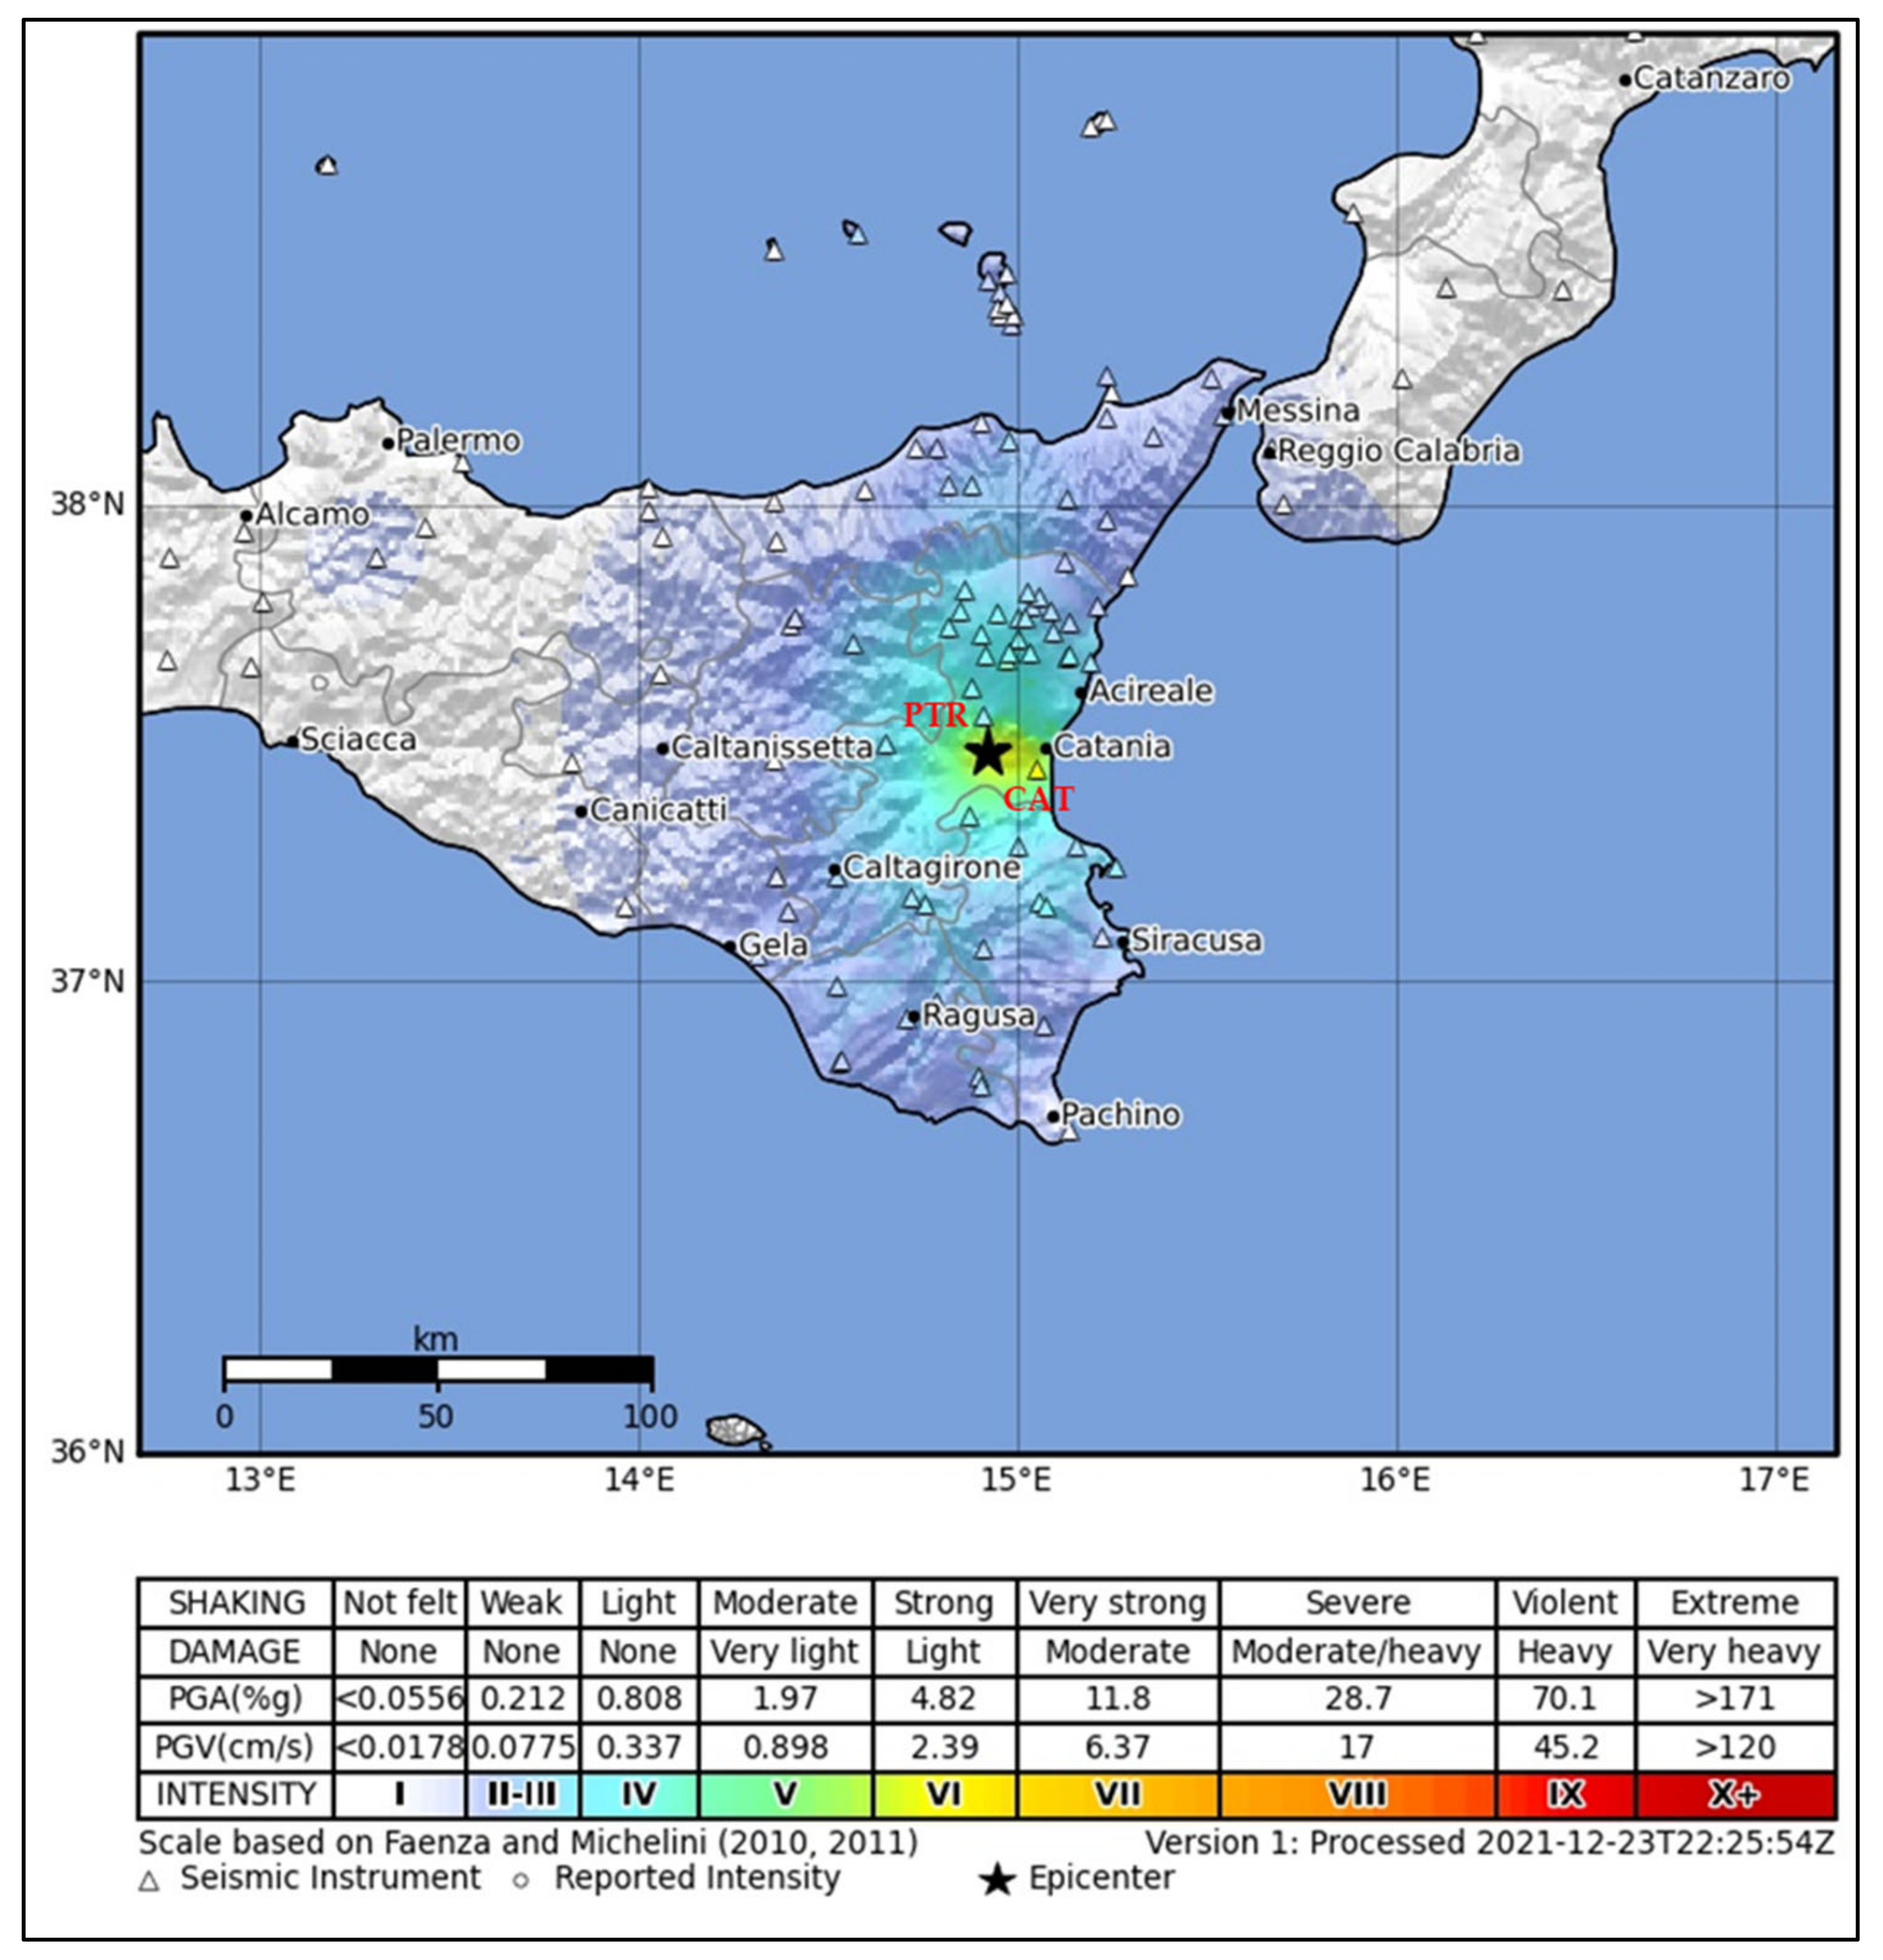
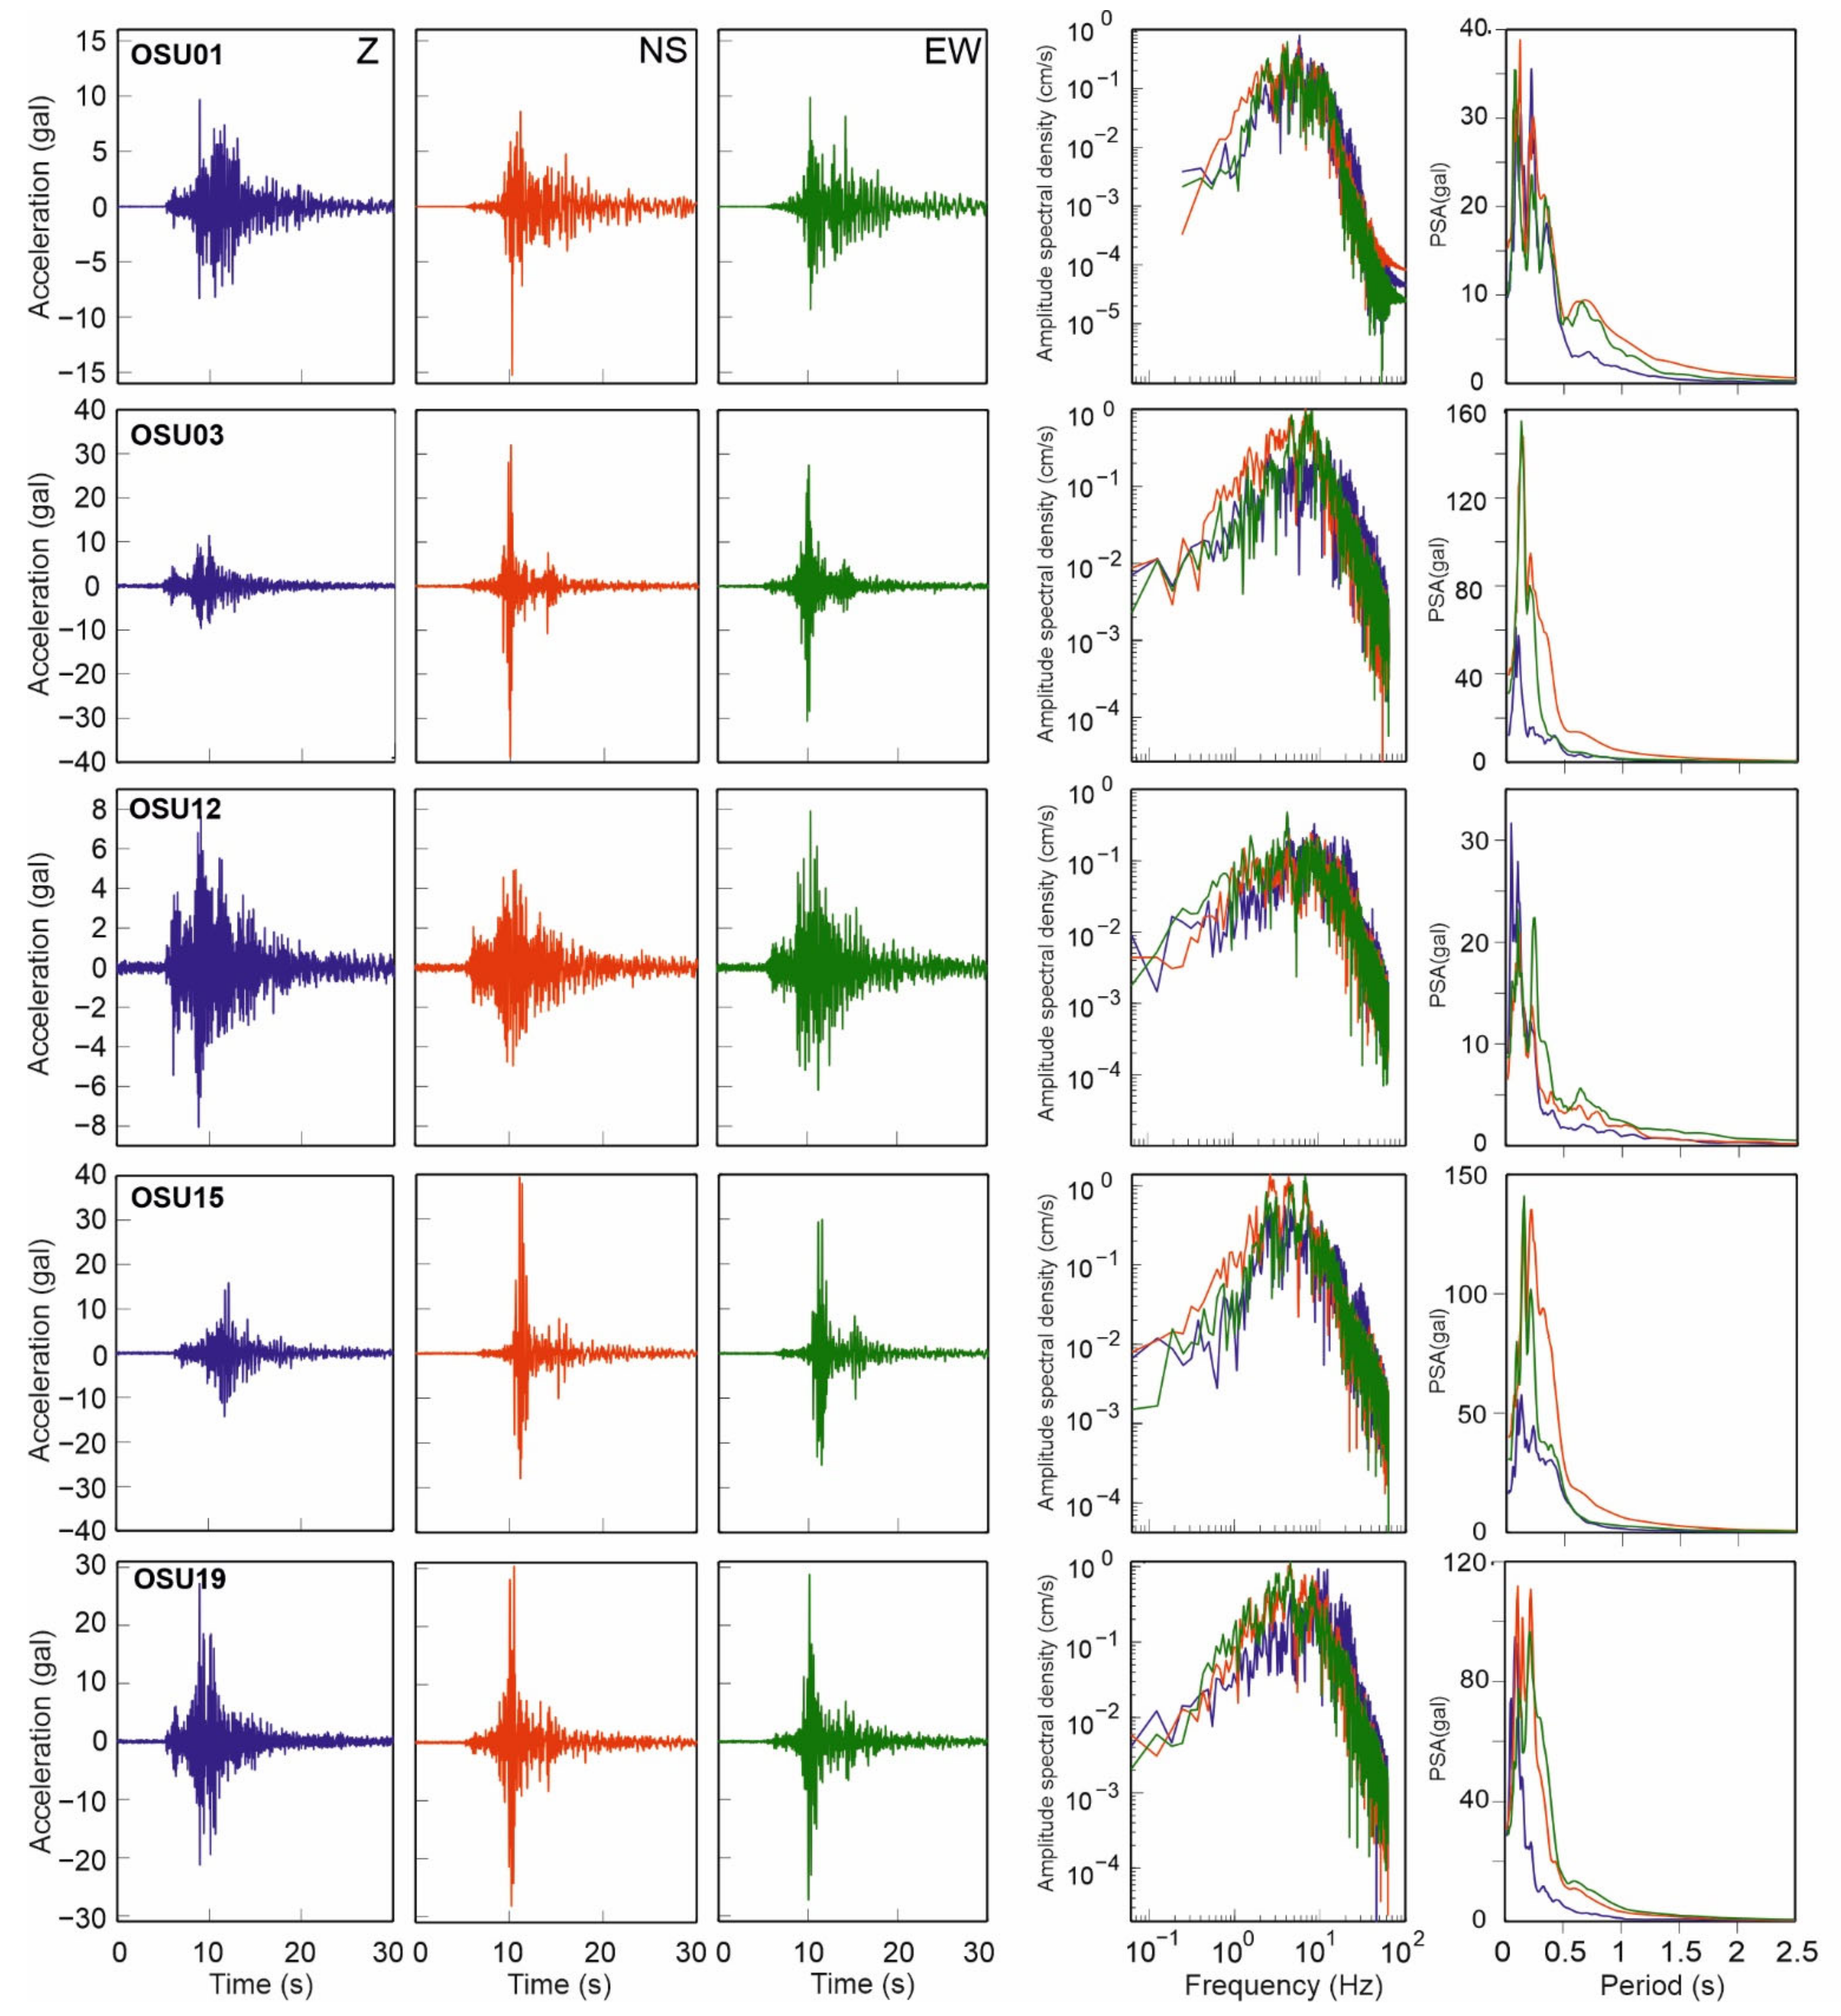
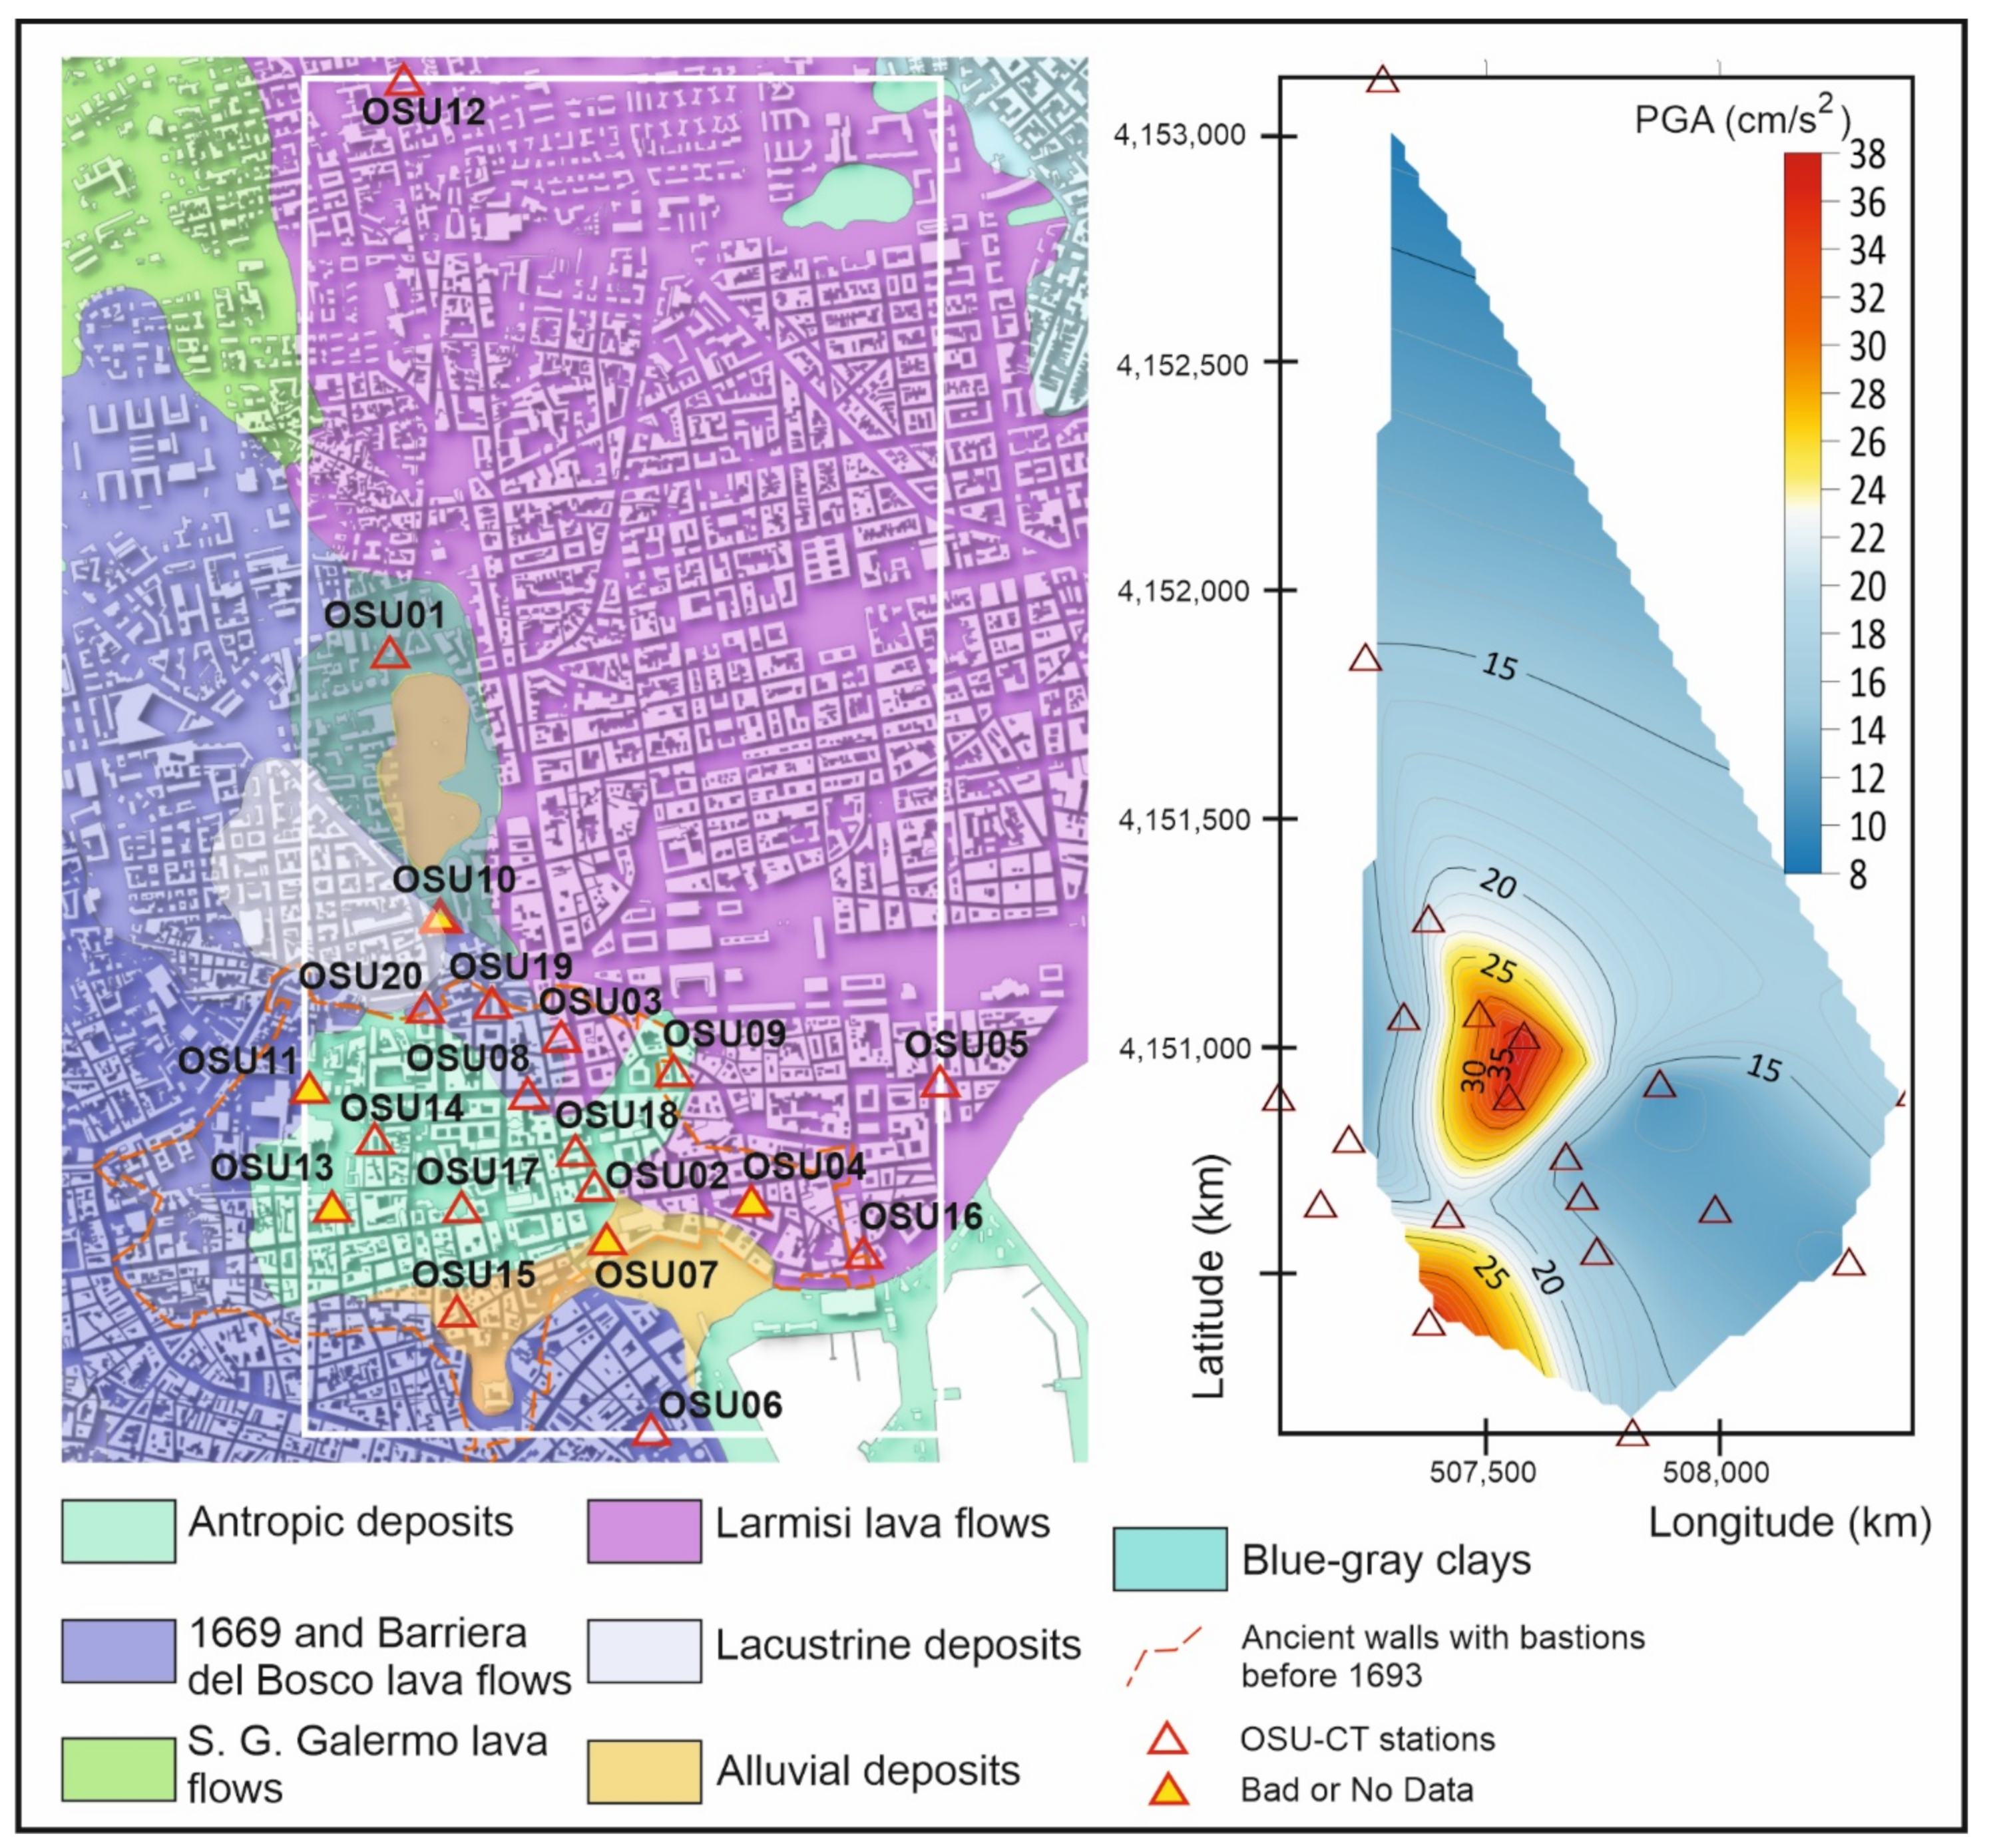
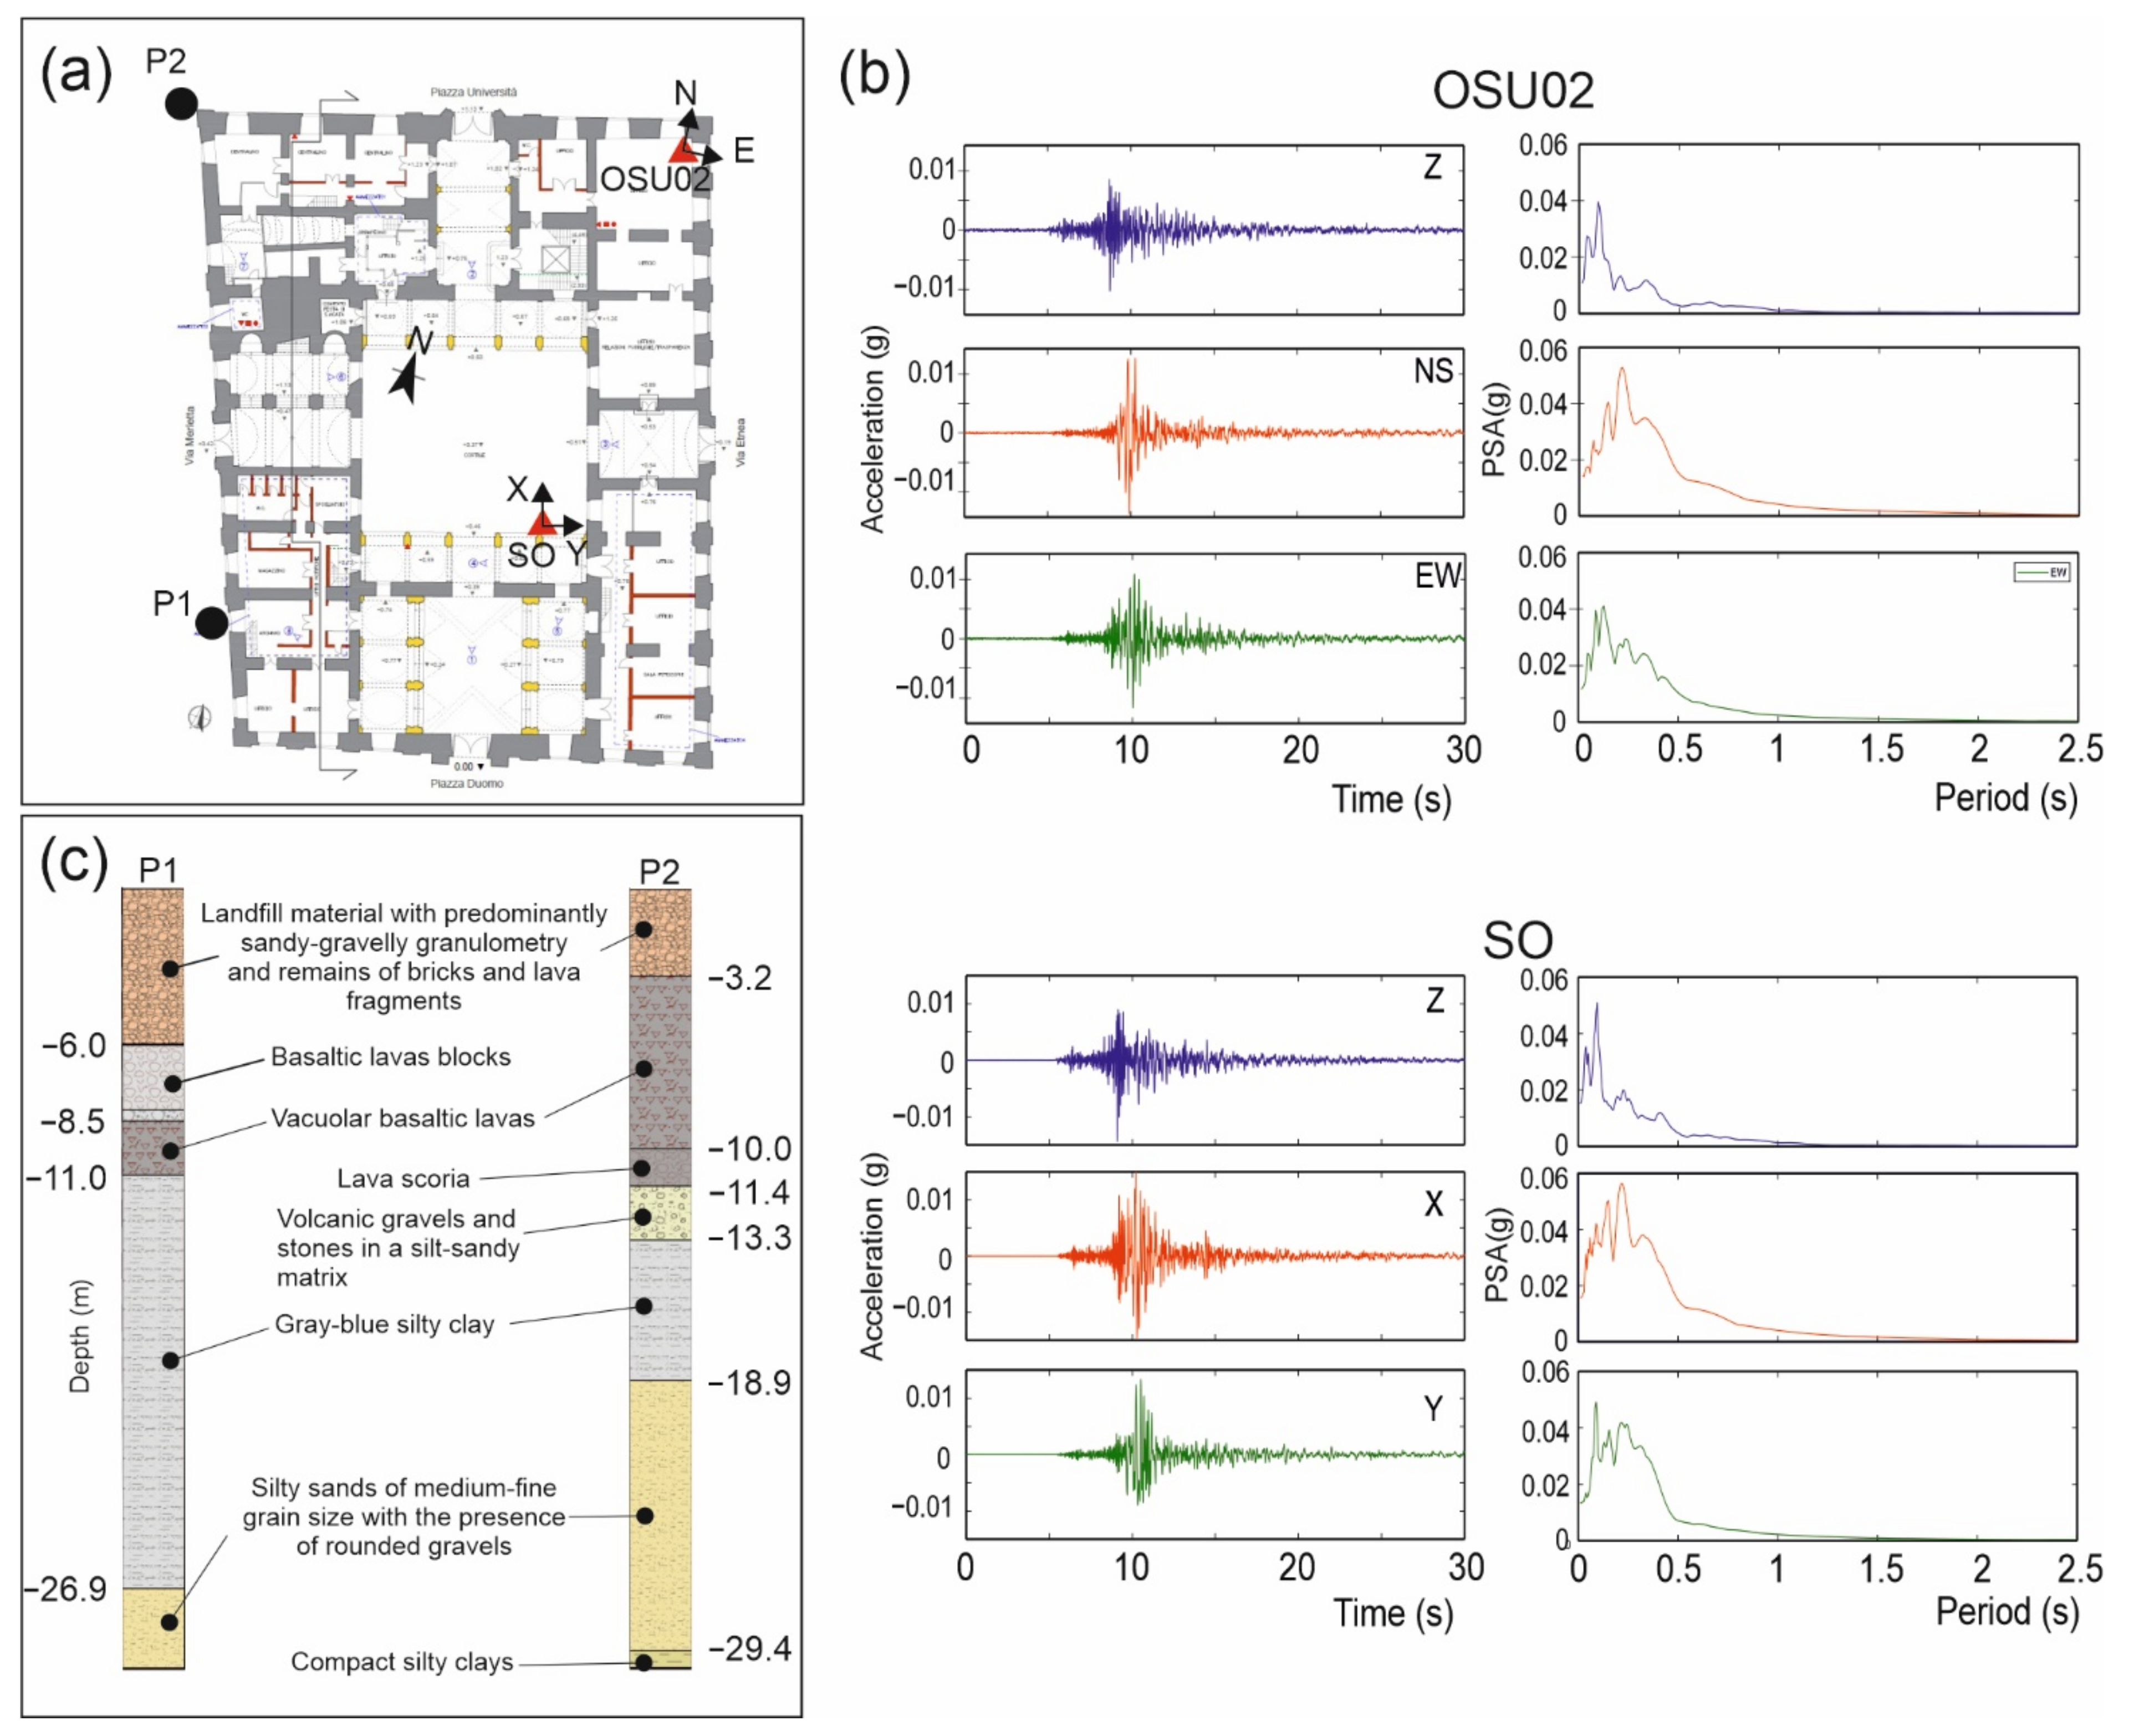
3.2. The 23 December 2021 Catania Plain Earthquake: The First Shakemap at Urban Scale in Italy

On 23 December 2021 at 21:33 GMT, an earthquake of Mw 4.3 was recorded by the stations of the National Seismic Network (Rete Sismica Nazionale, RSN) and other concerted networks both in Italy and in neighboring countries, about 10 km west, south-west of Catania. The event was clearly felt in Catania and the province, but reports came from the provinces of Siracusa, Ragusa, Enna, and Messina, as well. This earthquake, which fortunately did not cause any damage, represents the strongest event of a seismic sequence (Figure 11) comprising about 50 seismic events (1.2 ≤ ML ≤ 4.3), which started on 23 December at 19:49 GMT with an ML 1.5 earthquake. On the whole, the seismic sequence had a focal depth in the range of 8–10 km.
Figure 12 shows the map of the intensity of ground shaking of the Mw 4.3 earthquake. It was generated in near-real-time by INGV using the tool ShakeMap (https://earthquake.usgs.gov/data/shakemap/, accessed on 1 March 2022). The strong-motion data used to calculate the map are recorded by the accelerometric stations belonging to the Italian Strong Motion Network (Rete Accelerometrica Nazionale—RAN, operated by the Italian Civil Protection Department—DPC), and the National Seismic Network (Rete Sismica Nazionale—RSN, operated by INGV). The earthquake took place 12 km away from Catania, producing moderate-to-very strong seismic shaking over this area, with a maximum peak ground acceleration (PGA) value of approximately 0.08 g detected at the station CAT (belonging to the RAN) (ITACA database v3.2). This station is located in the Catania Plain, about 3 km from the coastline, and lies on the Holocene sequence of the soft alluvial fill of the same plain, which tends to amplify ground shaking. In fact, the site characterization of this recording site in terms of shear wave velocity profile (obtained through Multichannel Analysis of Surface Waves, MASW, within the DPC-INGV 2007-09-Project S4—The Italian strong motion database) leads to a weighted average of the shear wave velocity in the shallowest 30 m (VS,30) equal to 159.0 m/s, therefore placing the site in the soil class D accordingly the EUROCODE 8 [43]. Note that at station PTR (also belonging to the RAN), located at a distance of ca. 9 km from the epicenter and installed on basaltic rocks (EC8 soil class A), the PGA reached just 0.004 g (ITACA database v3.2 [44]).
Figure 13 shows the traces of the three-component accelerograms recorded during the Mw 4.3 seismic event at five selected stations of the OSU-CT network after removing the offset.
The earthquake was detected with a good signal-to-noise ratio and the arrivals of the various seismic phases are clearly identified. It is worth noting that all sensors were deployed at the ground level of the buildings and the distance between the two farthest stations is 1.7 km (distance between OSU01 and OSU16). As listed in Table 2, the horizontal PGAs (hereafter PGAh) range from 4.956 gal to 39.360 gal, this last measured in the NS-direction at the station OSU15 installed at the “Church of Santa Chiara Anagrafe”. The current structure of this Roman Catholic church, which was completed by 1760, was rebuilt on the ruins of a prior structure razed to the ground by the Mw 7.4 earthquake in 1693 and stands on alluvial deposits overlying the Barriera del Bosco lava flows (Figure 14).
Comparable values of PGAh were recorded at stations OSU03 (PGAh = 38.752 gal) installed at “Palazzo Minoriti”, which houses the Regional Province of Catania. Like the Church of Santa Chiara Anagrafe, the building was built in the 18th century on the ruins of a former convent totally destroyed by the above-mentioned earthquake of 1693. Located only 140 m away from the Palazzo Minoriti is the building that currently houses the headquarters of the Office of Production Policies (Municipality of Catania), where the station OSU08 recorded a PGAh value equal to 37.740 gal. Only a slightly lower PGAh was measured at station OSU19 (PGAh = 30.334 gal), 100 m away from OSU03, and installed inside Villa Cerami (currently houses the offices of the School of Jurisprudence of the University of Catania) which was built atop the ruins of a part of the Roman Amphitheater, and almost totally rebuilt after the devastation due to the 1693 earthquake. Conversely, the lowest PGA was measured at station OSU12 (PGAh = 4.956 gal) installed at Villa Zingali Tetto, in the northernmost part of the map shown in Figure 14. Designed at the beginning of the twentieth century, the villa is one of the finest examples of Art Nouveau buildings in Catania and stands on the prehistoric lava flows named Larmisi.
The pseudo-acceleration response spectra (PSA) show a general resemblance in the spectral shapes and no significant difference in the amplitudes in the NS and EW directions, suggesting that the monitored structures were subjected to fairly similar shakings in both directions. During the earthquake, the maximum values of spectral acceleration were recorded at OSU15 with values of 140 gal for T = 0.15 s and 135 gal for T = 0.2 s in the EW and NS directions, respectively. On the whole, the peaks of spectral acceleration are all in the period range below 0.4 s, with most of them at a period less than 0.3 s. According to the European seismic design regulation, Eurocodice 8, the empirical law of the correlation between the fundamental vibration period (T) of a building and its height (H) (T = 0.075H3/4, with T in s and H in m), T < 0.3 s suggests that adverse ground motion intensities might affect low rise structures (H less than about 10 m), therefore those considered to be of greatest interest for the historic center of Catania.
An interesting comparison can be made with instrumental data recorded by the stations installed at “Palazzo degli Elefanti”, currently housing the city’s town hall. This three-story public building is one of the 129 Italian structures monitored by the stations belonging to the permanent seismic network OSS (acronym of the Italian name “Osservatorio Sismico delle Strutture”) run by the Italian Department of Civil Protection [12]. The building is equipped with a complete monitoring system comprising 1 tri-axial force-balance (FB) type accelerometer (GeoSIG AC-63) at ground level, installed inside a small pit made in the inner courtyard (station S0 in Figure 15a), and 13 other accelerometers (2 tri-axial, 10 bi-axial, and 1 uni-axial, always GeoSIG) installed from the ground floor to the crawl space.
The station S0 of OSS is installed just a few metres from the station OSU02 and therefore they are suited to a further comparison between low cost MEMS accelerometers, such as the one installed at OSU02, and the FB type accelerometer systems, such as the one installed at S0. It is worth noting that the specification of the tri-axial accelerometer AC-63 is 10 Volt/g and the resolution is 10−5 g. Moreover, the level of dynamic range is ±1 g and the sampling rate is 200 sample/s (compared to 125 sample/s for station OSU02). Further information regarding the instrumentation adopted in the framework of OSS can be found in Dolce et al. [12]. In Figure 15b the three-component accelerograms recorded during the ML 4.3 earthquake by the stations OSU02 and SO and the relative pseudo-acceleration response spectra (PSA) are shown.
The PGAs estimated at S0 are 0.014 g, 0.015 g, and 0.013 g in Z, X, and Y directions, respectively, therefore slightly higher than those measured at OSU02. However, in interpreting these results we have to consider the differences characterizing the two stations. Firstly, the orientations of axes X and Y of S0 do not coincide with NS and EW directions, respectively, unlike the case for OSU02. Secondly, the type of installation of the two stations (on the floor and inside a box pit created for the purpose of OSU02 and S0, respectively), should be taken into account since this affects the coupling of the sensor to the soil. Finally, the different responses may be attributed to shallow subsurface geology which typifies the stations, as well. Indeed, as demonstrated by the stratigraphies shown in Figure 15c, relative to two cores drilled on the street running along “Palazzo degli Elefanti” (see Figure 15a for their location), the type of layers and their thickness can change significantly also between sites about 20–30 m from each other. This last aspect is an important element to consider since the local geological conditions can have a notable influence on the ground motion amplification and therefore on the associated local seismic hazard, also at an urban scale.

4. Conclusions

This paper describes the core of the Urban Seismic Observatory of Catania (OSU-CT) realized as a part of the EWAS “An Early WArning System for cultural heritage” project.
OSU-CT is based on a low-cost and real-time seismic accelerometric system developed with the aim of (i) rapid assessment of earthquake-induced damage for a prompt response, and (ii) testing of an earthquake early warning on-site system. It currently consists of 20 smart stations (of the 40 scheduled) dedicated to recording accelerometric and velocimetric signals acquired by triaxial MEMS/QMEMS and wide band (5 s) velocimeters (in three sites), respectively. All the sensors are installed on the ground floor of both historical and strategic buildings in the city center. The key components of OSU-CT are instruments developed ad hoc. They consist of the OSU-AQ2 datalogger and the low-cost ADXL355 MEMS accelerometer (noise density of 25 µg/√Hz); the latter presents in almost all nodes. The future development of OSUCT, in addition to increasing the seismic accelerometric nodes, plans to replace a percentage of the ADXL355 accelerometers with the hybrid seismometer HTL3D/5s-H2 that integrates the ultra-low-noise M-A352 Q-MEMS accelerometer (noise density of 0.2 µg/√Hz), having a sensitivity close to that of a force balance accelerometer, alongside a 5 s period velocity sensor (10 (nm/s)/√Hz at 1 Hz). Our tests have in fact indicated that this cost-effective accelerometer could play a key role in monitoring lower-level seismicity, and can be used in urban observatories and for SHM.
Our laboratory and field tests, as well as the recent seismic sequence (ca. 50 microearthquakes) preceding and accompanying the light Mw 4.3 Catania Plain main shock, demonstrated the ADXL355’s good performance in recording events with magnitude greater than 3.0, and at the same time the M-A352’s notable reliability for low magnitude (2.0 < ML < 3.0) seismicity monitoring from up to ca. 30 km. The light Mw 4.3 earthquake was detected with a good signal-to-noise ratio at all OSU-CT operative stations with arrivals of the various seismic phases clearly identifiable. The horizontal PGAs ranged from ca. 5 to 40 gal, while PSAs were all in the period below 0.4 s, with most of them at periods less than 0.3 s. According to the Eurocodice 8, periods T < 0.3 s, suggest that adverse ground motion intensities affect low rise structures (H less than about 10 m), such as those that are mainly present in the historic center of the city, therefore potentially having a very strong impact on the buildings in the historic center of Catania.
PGAs recorded by OSU-CT accelerometric stations allowed us to obtain the first Shakemap at an urban scale in Italy. We determined a reliable distribution of ground motion in the historical center of the city, which represents a valuable ingredient for the vulnerability studies of the historical edifices.
Although the shaking scenario is limited to a moderate earthquake (fortunately) and only to a part of Catania’s historical downtown, it represents the first and sole pilot example for characterizing the expected behavior of the historical buildings. In fact, a well-defined shaking pattern inferred also from small earthquakes can help identify local side effects that are often overlooked.
OSU-CT, and its future development, might then become a powerful and effective instrument to acquire an overview of the entire historic area and assist decision-makers in determining the priority for building checks and initiating appropriate safety measures.
Following the planned implementation of the EEW on-site in all stations (already in test on OSU01 and OSU02) and realizing the SHM in the three edifices chosen as test sites, the next step will be to measure the movement of buildings in different strategic points (so not only on the ground floor), in order to control and monitor the structural integrity through the analysis of modal properties. It is known, in fact, the relation between the earthquake-induced natural frequency reduction and the structural damage in buildings [49]. Additionally, the study of the modal characteristics will help to identify the eventual degradation/damage by comparing the deformations acquired during the seismic event and those of the 3D model of the intact structure. Modal shapes and modal damping change with increasing levels of accumulated damage and, in particular, modal damping ratio shift shows the strongest correlation with the system’s actual performance and gives the best representation of damage [50]. A further step could be the creation of an integrated control system to have an at-a-glance status of the “health” of multiple targets, in support of a decisional system to assist the stakeholders in managing potential emergencies.
In conclusion, OSU-CT can be considered a state-of-the-art project that, in the event of a major earthquake, will be able to provide shaking maps at an urban scale to the Department of Civil Protection and the assessment of the health conditions of the structurally monitored historic buildings. Finally, we believe that OSU-CT represents an example of a new best practice that should be extended to all major cities where the seismic hazard is high, and think that wider monitoring of cultural heritage, infrastructures, factories, and so on, could contribute to the risk mitigation.

Author Contributions

Conceptualization, D.P. and G.T.; methodology, D.P., G.T. and W.Y.; software, W.Y., C.M., S.M. and O.T.; formal analysis and validation, D.P. and G.T.; resources, W.Y., A.A., A.C. (Antonio Colino), A.C. (Antonio Costanza), G.F., G.D. and S.D.P.; data curation, W.Y., S.M. and O.T.; writing—original draft preparation, All authors; supervision, D.P. and G.T.; funding acquisition and project administration, D.P. All authors have read and agreed to the published version of the manuscript.

Funding

The research activities have been funded by the project PON EWAS, an “Early WArning System for cultural heritage”, ARS 00926, through funds PON R&I 2014–2020 and FSC “Avviso per la presentazione di Progetti di Ricerca Industriale e Sviluppo Sperimentale nelle 12 aree di Specializzazione individuate dal PNR 2015–2020”.

Data Availability Statement

The data presented in this study are available on request from the corresponding author.

Acknowledgments

The authors would like to thank the municipality of Catania and the University of Catania for hosting the accelerometric stations of the urban seismic network. We are also grateful to the Seismic Observatory of Structures (OSS) for providing the data acquired at the municipality building.

Conflicts of Interest

The authors declare no conflict of interest.

References

  1. Evans, J.R.; Allen, R.M.; Chung, A.I.; Cochran, E.S.; Guy, R.; Hellweg, M.; Lawrence, J.F. Performance of Several Low-Cost Accelerometers. Seismol. Res. Lett. 2014, 85, 147–158. [Google Scholar] [CrossRef]
  2. Fu, J.; Li, Z.; Meng, H.; Wang, J.; Shan, X. Performance Evaluation of Low-Cost Seismic Sensors for Dense Earthquake Early Warning: 2018–2019 Field Testing in Southwest China. Sensors 2019, 19, 1999. [Google Scholar] [CrossRef] [PubMed] [Green Version]
  3. Rovithis, E.; Makra, K.; Savvaidis, A.; Kirtas, E. The accelerometric network of the Indes-Musa project in the Kalochori area: Configuration, documentation and preliminary data interpretation, Proceedings of the 14th International Congress, Thessaloniki May 2016. Bull. Geolog. Soc. Greece 2016, 50, 1110–1119. [Google Scholar]
  4. Pierleoni, P.; Marzorati, S.; Ladina, C.; Raggiunto, S.; Belli, A.; Palma, L.; Cattaneo, M.; Valenti, S. Performance Evaluation of a Low-Cost Sensing Unit for Seismic Applications: Field Testing During Seismic Events of 2016–2017 in Central Italy. IEEE Sens. J. 2018, 18, 6644–6658. [Google Scholar] [CrossRef]
  5. Papanikolaou, V.K.; Karakostas, C.Z.; Theodoulidis, N.P. A Low-Cost Instrumentation System for Seismic Hazard Assessment in Urban Areas. Sensors 2021, 21, 3618. [Google Scholar] [CrossRef]
  6. Esposito, M.; Palma, L.; Belli, A.; Sabbatini, L.; Pierleoni, P. Recent Advances in Internet of Things Solutions for Early Warning Systems: A Review. Sensors 2022, 22, 2124. [Google Scholar] [CrossRef]
  7. Federici, F.; Graziosi, F.; Faccio, M.; Gattulli, V.; Lepidi, M.; Potenza, F. An integrated approach to the design of Wireless Sensor Networks for structural health monitoring. Int. J. Distrib. Sens. Netw. 2012, 8, 594842. [Google Scholar] [CrossRef]
  8. Lin, J.F.; Li, X.Y.; Wang, J.; Wang, L.X.; Hu, X.X.; Liu, J.X. Study of Building Safety Monitoring by Using Cost-Effective MEMS Accelerometers for Rapid After-Earthquake Assessment with Missing Data. Sensors 2021, 21, 7327. [Google Scholar] [CrossRef]
  9. Francisco, J.; Pallarés, M.B.; Bartoli, G.; Pallarés, L. Structural health monitoring (SHM) and Nondestructive testing (NDT) of slender masonry structures: A practical review. Constr. Build. Mater. 2021, 297, 123768. [Google Scholar] [CrossRef]
  10. Liang, Q.; Tani, A.; Yamabe, Y. Fundamental Tests on a Structural Health Monitoring System for Building Structures Using a Single-board Microcontroller. J. Asian Arch. Build. Eng. 2015, 14, 663–670. [Google Scholar] [CrossRef] [Green Version]
  11. Picozzi, M.; Emolo, A.; Martino, C.; Zollo, A.; Miranda, N.; Verderame, G.; Boxberger, T. and the REAKT Working, Group Earthquake Early Warning System for Schools: A Feasibility Study in Southern Italy. Seism. Res. Lett. 2015, 86, 2A. [Google Scholar] [CrossRef] [Green Version]
  12. Dolce, M.; Nicoletti, M.; De Santis, A.; Marchesini, S.; Spina, D.; Talanas, F. Osservatorio sismico delle strutture: The Italian structural seismic monitoring network. Bull. Earth. Eng. 2017, 15, 621–641. [Google Scholar] [CrossRef] [Green Version]
  13. Groos, J.C.; Ritter, J.R.R. Time domain classification and quantification of seismic noise in an urban environment. Geophys. J. Int. 2009, 179, 1213–1231. [Google Scholar] [CrossRef] [Green Version]
  14. Diaz, J.; Schimmel, M.; Ruiz, M.; Carbonell, R. Seismometers Within Cities: A Tool to Connect Earth Sciences and Society. Front. Earth Sci. 2020, 8, 9. [Google Scholar] [CrossRef] [Green Version]
  15. Vassallo, M.; De Matteis, R.; Bobbio, A.; Di Giulio, G.; Adinolfi, G.M.; Cantore, L.; Cogliano, R.; Fodarella, A.; Maresca, R.; Pucillo, S.; et al. Seismic noise cross-correlation in the urban area of Benevento city (Southern Italy). Geophys. J. Int. 2019, 217, 1524–1542. [Google Scholar] [CrossRef]
  16. Olivito, R.S.; Porzio, S.; Scuro, C.; Carnì, D.L.; Lamonaca, F. Inventory and monitoring of historical cultural heritage buildings at the territorial scale. A preliminary study of SHM based on CARTIS approach. Acta IMEKO 2021, 10, 9. [Google Scholar] [CrossRef]
  17. Azzara, R.M.; Girardi, M.; Iafolla, V.; Padovani, C.; Pellegrini, D. Long-Term Dynamic Monitoring of Medieval Masonry Towers. Front. Built Environ. 2020, 6, 9. [Google Scholar] [CrossRef]
  18. Chatzopoulos, G.; Papadopoulos, I.; Vallianatos, F.; Makris, J.P.; Kouli, M. Strong Ground Motion Sensor Network for Civil Protection Rapid Decision Support Systems. Sensors 2021, 21, 2833. [Google Scholar] [CrossRef]
  19. De Luca, G.; Marcucci, S.; Milana, G.; Sano, T. Evidence of Low-Frequency Amplification in the City of L’Aquila, Central Italy, through a Multidisciplinary Approach Including Strong- and WeakMotion Data, Ambient Noise, and Numerical Modeling. Bull. Seismol. Soc. Am. 2005, 95, 1469–1481. [Google Scholar] [CrossRef] [Green Version]
  20. Bindi, D.; Pacor, F.; Luzi, L.; Massa, M.; Ameri, G. The Mw 6.3, 2009 L’Aquila earthquake: Source, path and site effects from spectral analysis of strong motion data. Geophys. J. Int. 2009, 179, 1573–1579. [Google Scholar] [CrossRef] [Green Version]
  21. Sextos, A.; De Risi, R.; Pagliaroli, A.; Foti, F.; Passeri, F.; Ausilio, E.; Cairo, R.; Capatti, M.C.; Chiabrando, F.; Chiaradonna, A.; et al. Local Site Effects and Incremental Damage of Buildings during the 2016 Central Italy Earthquake Sequence. Earthq. Spectra 2019, 34, 1639–1669. [Google Scholar] [CrossRef] [Green Version]
  22. Di Giulio, G.; Azzara, R.M.; Cultrera, G.; Giammarinaro, M.S.; Vallone, P.; Rovelli, A. Effect of Local Geology on Ground Motion in the City of Palermo, Italy, as Inferred from Aftershocks of the 6 September 2002 Mw 5.9 Earthquake. Bull. Seismol. Soc. Am. 2005, 95, 2328–2341. [Google Scholar] [CrossRef]
  23. Nof, R.N.; Chung, A.I.; Rademacher, H.; Dengler, L.; Allen, R.M. MEMS Accelerometer Mini-Array (MAMA): A Low-Cost Implementation for Earthquake Early Warning Enhancement. Earthq. Spectra 2019, 35, 21–38. [Google Scholar] [CrossRef]
  24. Chung, A.I.; Cochran, E.S.; Kaiser, A.E.; Christensen, C.M.; Yildirim, B.; Lawrence, J.F. Improved rapid magnitude estimation for a community-based, low-cost MEMS accelerometer network. Bull. Seismol. Soc. Am. 2015, 105, 1314–1323. [Google Scholar] [CrossRef] [Green Version]
  25. Clayton, R.W.; Heaton, T.; Kohler, M.; Chandy, M.; Guy, R.; Bunn, J. Community seismic network: A dense array to sense earthquake strong motion. Seismol. Res. Lett. 2015, 86, 1354–1363. [Google Scholar] [CrossRef] [Green Version]
  26. Horiuchi, S.; Horiuchi, Y.; Yamamoto, S.; Nakamura, H.; Wu, C.; Rydelek, P.A.; Kachi, M. Home seismometer for earthquake early warning. Geophys. Res. Lett. 2009, 36. [Google Scholar] [CrossRef] [Green Version]
  27. Zheng, H.; Shi, G.; Zeng, T.; Li, B. Wireless earthquake alarm design based on MEMS accelerometer. In Proceedings of the 2011 International Conference on Consumer Electronics, Communications and Networks (CECNet), Xianning, China, 16–19 April 2011; pp. 5481–5484. [Google Scholar]
  28. Peng, C.; Peng, J.; Chen, Q.; Ma, Q.; Yang, J. Performance Evaluation of a Dense MEMS-Based Seismic Sensor Array Deployed in the Sichuan-Yunnan Border Region for Earthquake Early Warning. Micromachines 2019, 10, 735. [Google Scholar] [CrossRef] [Green Version]
  29. Yang, B.M.; Mittal, H.; Wu, Y.-M. Real-Time Production of PGA, PGV, Intensity, and Sa Shakemaps Using Dense MEMS-Based Sensors in Taiwan. Sensors 2021, 21, 943. [Google Scholar] [CrossRef]
  30. Lawrence, J.F.; Cochran, E.S.; Chung, A.; Kaiser, A.; Christensen, C.M.; Allen, R.; Baker, J.W.; Fry, B.; Heaton, T.; Kilb, D.; et al. Rapid Earthquake Characterization Using MEMS Accelerometers and Volunteer Hosts Following the M 7.2 Darfield, New Zealand, Earthquake. Bull. Seismol. Soc. Am. 2014, 104, 184–192. [Google Scholar] [CrossRef] [Green Version]
  31. Tanırcan, G.; Hakan Alçık, H.; Beyen, K. Reliability of MEMS accelerometers for instrumental intensity mapping of earthquakes. Ann. Geophys. 2017, 60 (Suppl. 6), SE673. [Google Scholar] [CrossRef] [Green Version]
  32. Holland, A. Earthquake data recorded by the MEMS accelerometer: Field testing in Idaho. Seismol. Res. Lett. 2003, 74, 20–26. [Google Scholar] [CrossRef]
  33. Pozzi, M.; Zonta, D.; Trapani, D.; Athanasopoulos, N.; Amditis, A.; Bimpas, M.; Garetsos, A.; Stratakos, Y.; Ulieru, D. MEMS-based sensors for post-earthquake damage assessment. J. Phys. Conf. Ser. 2011, 305, 012100. [Google Scholar] [CrossRef]
  34. Kim, Y.; Kang, T.S.; Rhie, J. Development and Application of a Real-Time Warning System Based on a MEMS Seismic Network and Response Procedure for the Day of the National College Entrance Examination in South Korea. Seismol. Res. Lett. 2017, 88, 1322–1326. [Google Scholar] [CrossRef]
  35. Peng, C.; Chen, Y.; Chen, Q.; Yang, J.; Wang, H.; Zhu, X.; Xu, Z.; Zheng, Y. A new type of tri-axial accelerometers with high dynamic range MEMS for earthquake early warning. Comput. Geosci. 2017, 100, 179–187. [Google Scholar] [CrossRef]
  36. Lynch, J.P.; Loh, K.J. A Summary Review of Wireless Sensors and Sensor Networks for Structural Health Monitoring. Shock Vib. Dig. 2006, 38, 91–128. [Google Scholar] [CrossRef] [Green Version]
  37. Gattulli, G.; Marco Lepidi, M.; Potenza, F. Dynamic testing and health monitoring of historic and modern civil structures in Italy. Struct. Monit. Maint. 2016, 3, 71–90. [Google Scholar] [CrossRef]
  38. Azzaro, R.; Barbano, M.S.; Moroni, A.; Mucciarelli, M.; Stucchi, M. The seismic history of Catania. J. Seismol. 1999, 3, 235–252. [Google Scholar] [CrossRef]
  39. Azzaro, R.; Barbano, M.S. Analysis of seismicity of Southeastern Sicily: Proposal of a tectonic interpretation. Ann. Geophys. 2000, 43, 171–188. [Google Scholar] [CrossRef]
  40. Patanè, D.; Malfitana, D.; Mazzaglia, A. Dalla conoscenza all’azione. Il progetto PON EWAS: Un sistema di allerta precoce per la salvaguardia del patrimonio culturale. In Monitoraggio e Manutenzione Delle Aree Archeologiche Cambiamenti Climatici, Dissesto Idrogeologico, Degrado Chimico-Ambientale, AA.VV. Atti del Convegno Internazionale di Studi, Roma, Curia Iulia, 20–21 Marzo 2019, Collana Bibliotheca Archaeologica; L’ERMA di BRETSCHNEIDER: Roma, Italy, 2020; Volume 65, pp. 187–197. [Google Scholar]
  41. Fertitta, G.; Costanza, A.; D’anna, G.; Patanè, D. The Earth Lab 5s (ETL3D/5s) seismic sensor. Design and test. Ann. Geophys. 2020, 63, 2. [Google Scholar] [CrossRef]
  42. Ribeiro, R.R.; Lameiras, R.M. Evaluation of low-cost MEMS accelerometers for SHM: Frequency and damping identification of civil structures. Ibero-Latin American congress on computational methods in engineering. Lat. Am. J. Solids Struct. 2019, 16, 7. [Google Scholar] [CrossRef] [Green Version]
  43. CEN European Committee for Standardization. EUROCODE 8: Design of Structures for Earthquake Resistance—Part 1: General Rules, Seismic Action and Rules for Buildings; CEN European Committee for Standardization: Bruxelles, Belgium, 2003. [Google Scholar]
  44. Russo, E.; Felicetta, C.; D’Amico, M.; Sgobba, S.; Lanzano, G.; Mascandola, C.; Pacor, F.; Luzi, L. Italian Accelerometric Archive v3.2—Istituto Nazionale di Geofisica e Vulcanologia, Dipartimento della Protezione Civile Nazionale; CEN: Bruxelles, Belgium, 2022. [Google Scholar] [CrossRef]
  45. Faenza, L.; Michelini, A. Regression analysis of MCS intensity and ground motion parameters in Italy and its application in ShakeMap. Geophys. J. Int. 2010, 180, 1138–1152. [Google Scholar] [CrossRef] [Green Version]
  46. Faenza, L.; Michelini, A. Regression analysis of MCS intensity and ground motion spectral accelerations (SAs) in Italy. Geophys. J. Int. 2011, 186, 1415–1439. [Google Scholar] [CrossRef] [Green Version]
  47. Locati, M.; Camassi, R.; Rovida, A.; Ercolani, E.; Bernardini, F.; Castelli, V.; Caracciolo, C.H.; Tertulliani, A.; Rossi, A.; Azzaro, R.; et al. Database Macrosismico Italiano (DBMI15); versione 4.0; Istituto Nazionale di Geofisica e Vulcanologia (INGV): Rome, Italy, 2022. [CrossRef]
  48. Magli, A.; Branca, S.; Speranza, F.; Risica, G.; Siravo, G.; Giordano, G. Paleomagnetic dating of prehistoric lava flows from the urban district of Catania (Etna volcano, Italy). GSA Bull. 2022, 134, 616–662. [Google Scholar] [CrossRef]
  49. Sivori, D.; Cattari, S.; Lepidi, M. A methodological framework to relate the earthquake-induced frequency reduction to structural damage in masonry buildings. Bull. Earthq. Eng. 2022, 1–36. [Google Scholar] [CrossRef]
  50. Kouris, L.A.S.; Penna, A.; Magenes, G. Dynamic modification and damage propagation of a two-storey full-scale masonry building. Adv. Civ. Eng. 2019, 2019, 2396452. [Google Scholar] [CrossRef]
Figure 1. Examples of seismic signals generated by road traffic during a working day as recorded by one of the seismic stations belonging to the OSU-CT network. (a) Vertical components of the seismic velocity and (b) acceleration of ground motion. The spectrograms are relative to the time period highlighted in yellow. Night and day variations are apparent.
Remotesensing 14 02583 g001
Figure 2. Sicily’s historical and instrumental seismicity from 1000 to 2019, represented by moment magnitude (Mw) classes (size and colour of squares) (modified from Catalogo Parametrico dei Terremoti Italiani CPTI15 by Rovida et al., 2021.
Remotesensing 14 02583 g002
Figure 3. Urban layout of the city of Catania (a) before and (b) after the earthquake of 1693.
Remotesensing 14 02583 g003
Figure 4. Map of historical center of Catania. The circles indicate the location of stations belonging to the urban network OSU-CT installed so far (yellow triangles) and scheduled to be installed (red triangles).
Remotesensing 14 02583 g004
Figure 5. Images showing the OSU-AQ2 main board (left) and the data-logger assembled without upper cover (right).
Remotesensing 14 02583 g005
Figure 6. Simplified working scheme of the OSU-AQ2 smart low-cost seismic station.
Remotesensing 14 02583 g006
Figure 7. Photos of the ETL3D/5 s and of its hybrid evolution, which integrates the ADXL355 (ver. H1) and M-A352 (ver. H2) accelerometers.
Remotesensing 14 02583 g007
Figure 8. (a) Comparison of power spectral densities (PSD) of noise for the ADXL355 (yellow line), Safran SI1003 (orange line), and Epson M-A352 MEMS accelerometers (red line). PSDs of a Class A force-balance accelerometer (Episensor, light blue line), and of the ETL3D/5s velocimeter (electric blue line), are also shown together with the low noise model and high noise model curves (thick grey lines) from Peterson (1993), and spectra representing earthquakes of different magnitudes measured at 10 km from the epicenter (gray lines). (b) Comparison of the dynamic range of Epson M-A352 MEMS accelerometer and ETL3D/5s velocimeter. The coloured areas indicate all the permissible combinations of the velocity RMS and frequency value pairs (see the text for more details).
Remotesensing 14 02583 g008
Figure 9. Accelerograms from OSU01 and OSU19 for four earthquakes with magnitudes ranging from 2.3 to 3.3, recorded before the mainshock. On the right, the zoom of the ML 2.4 event highlighted in grey on the left.
Remotesensing 14 02583 g009
Figure 10. Top, comparison of time histories and spectra of the Santa Venerina ML 3.3 earthquake recorded at the ETL3D/5s-H2 (OSU01) (black line) and at the co-located Trillium 40s (grey line) velocimeters. In the central part, the superimposed waveforms recorded at the two sensors are shown for the P- and S-phases (in grey the Trillium recordings). The comparison of velocity spectra computed for P and S phases (grey region in the seismograms) recorded at the two sensors is also displayed for each component (Z, north-south, and east-west) on the right. Bottom, the time history recorded at the M-A352 accelerometer and the P- (black line) and S-phases (light and dark grey lines) spectra.
Remotesensing 14 02583 g010
Figure 11. Map of earthquake epicenters (blue circles) from the seismic sequence began on 23 December 2021 at 19:49 GMT and ending on 25 December 2021 at 04:10 GMT, about 10 km WSW of Catania. The largest single event was the Mw 4.3 earthquake on 24 December at 21:33 GMT. The size of the circle indicates the different classes of magnitude (modified from http://terremoti.ingv.it/, accessed on 1 March 2022).
Remotesensing 14 02583 g011
Figure 12. Map of distribution of instrumental intensities for the Mw 4.3 earthquake generated near-real-time by INGV using the tool ShakeMap. The intensity is derived through the empirical law by Faenza and Michelini [45,46] that correlates the recorded values of actual ground shaking with the macroseismic intensity for Italian earthquakes (see [47] the Italian Macroseismic Database, DBMI15, https://doi.org/10.13127/DBMI/DBMI15.4, accessed on 1 March 2022). The black star indicates the epicenter. The triangles show the accelerometric or velocimetric stations used in the calculation, colored according to the recorded shaking (http://terremoti.ingv.it/en/event/, accessed on 1 March 2022).
Remotesensing 14 02583 g012
Figure 13. Samples of raw acceleration time histories of Z, NS, and EW components of the 23 December 2021 (Mw 4.3) earthquake at 5 selected stations of OSU-CT network, and their corresponding Fourier amplitude spectrum (FAS) and 5% damped pseudo-acceleration (PSA) response spectra.
Remotesensing 14 02583 g013
Figure 14. On the right, simplified geological map of part of the present urban district of Catania which includes the oldest area of the city bordered by the ancient walls (modified from [48], and reproduced with permission from S. Branca). The white rectangle represents the area corresponding to the shakemap on the left. The shakemap has been constructed by natural neighbor interpolation of PGAmax values.
Remotesensing 14 02583 g014
Figure 15. (a) Ground floor plan of “Palazzo degli Elefanti” with the location of accelerometric stations OSU02 (belonging to the network OSU-CT) and S0 (belonging to the network OSS) (red triangles). P1 and P2 indicate the core drilling sites (30 m core), (b) the 3-component accelerograms recorded during the ML 4.3 earthquake by the stations OSU02 (top) and SO (bottom), and the relative pseudo-acceleration response spectra (c) stratigraphies of the drilled points P1 and P2.
Remotesensing 14 02583 g015
Table 1. Comparison characteristics of the evaluated accelerometers. The selected accelerometers for OSU-CT are indicated in bold.
CompanyProductTypeNumber of ComponentNoise Floor [µg/√Hz]Sens [mV/g]Sens. [µg/LSB]Full Scale Range Dynamic RangeBandwidht
Analog DeviceADXL355Digital 20 bit MEMS325 at ±2 g 3.9±2 g to ±8 g
~90 dB
1–1000 Hz
EpsonM-A352Digital 30 bit MEMS30.2 at 0.2–40 Hz (±15 g) 0.06± 15 g
~123 dB
0–460 Hz
ColibrysSI1000Analog MEMS10.7 at 0.1–100 Hz900 ± 3 g
108.5 dB (0.1–100 Hz)
0–500 Hz (±3 g)
KinemetricsEpisensor ES-TForce Balance30.06 at 1 Hz (±0.25 g)10,000 (±2.5 V) ± 0.25 g
to ±4 g 155 dB
0–200 Hz
PiezotronicsPCB393B12Analog Piezoelectric11.30 at 1 Hz, 0.32 at 10 Hz, 0.1 at 100 Hz10,000 ±0.5 g0.15–1000 Hz
PiezotronicsPCB393B04Analog Piezoelectric10.3 at 1 Hz, 0.1 at 10 Hz, 0.04 at 100 Hz1000 ±5 g0.06–450 Hz
Table 2. Peak ground acceleration measured at the operational stations of OSU during the ML 4.3 earthquake.
StationCompPGA (gal)Epicentral Distance (km)AccelerometerLocation
OSU01HNZ9.66214.8375Epson M-A352INGV-OE
OSU01HNN15.24414.8375
OSU01HNE9.84914.8375
OSU02HNZ10.27015.0731ADXL355P.zzo degli Elefanti
OSU02HNN13.77515.0731
OSU02HNE11.52715.0731
OSU03HNZ11.76415.0048ADXL355P.zzo Minoriti
OSU03HNN38.51415.0048
OSU03HNE31.14415.0048
OSU05HNZ8.33915.8086ADXL355P.zzo Gandolfo
OSU05HNN9.03315.8086
OSU05HNE18.18115.8086
OSU06HNZ7.93715.1566ADXL355Centro Polifunzionale Zurria
OSU06HNN16.07015.1566
OSU06HNE10.35415.1566
OSU08HNZ14.30014.9329ADXL355P.zzo Attività Produttive
OSU08HNN37.74014.9329
OSU08HNE26.22914.9329
OSU09HNZ4.14115.2780ADXL355P.zzo Urbanistica
OSU09HNN10.85215.2780
OSU09HNE7.58115.2780
OSU12HNZ7.96015.1933ADXL355Villa Zingali Tetto
OSU12HNN5.00715.1933
OSU12HNE7.93015.1933
OSU14HNZ7.55814.5967ADXL355ARPA
OSU14HNN11.42714.5967
OSU14HNE9.58114.5967
OSU15HNZ16.10814.7061ADXL355Santa Chiara Anagrafe
OSU15HNN37.38414.7061
OSU15HNE29.37414.7061
OSU16HNZ4.38615.6155ADXL355Politiche Sociali
OSU16HNN10.24015.6155
OSU16HNE11.33515.6155
OSU17HNZ8.21714.7819ADXL355Teatro Greco
OSU17HNN20.63614.7819
OSU17HNE10.61114.7819
OSU18HNZ8.45415.0525ADXL355P.zzo Università
OSU18HNN11.71415.0525
OSU18HNE12.94815.0525
OSU19HNZ26.44014.9180ADXL355Villa Cerami
OSU19HNN29.70314.9180
OSU19HNE28.39714.9180
OSU20HNZ11.50414.7614ADXL355Ex Chiesa Purità
OSU20HNN13.59114.7614
OSU20HNE14.84014.7614
Publisher’s Note: MDPI stays neutral with regard to jurisdictional claims in published maps and institutional affiliations.

