Assessment of Invasive and Weed Species by Hyperspectral Imagery in Agrocenoses Ecosystem
Abstract
:1. Introduction
2. Materials and Methods
2.1. Research Region
2.2. Research Methods
3. Results
3.1. Statistical Methods of Data Analysis
3.2. Search Methods of Data Analysis
3.2.1. Principal Component Analysis (PCA)
3.2.2. Decision Tree (DT)
3.2.3. Random Forest (RF)
4. Discussion
4.1. Using Spectral Channels and Vis
4.2. Comparison of the Result Obtained by Different Methods
4.3. Significance of Weed and Invasive Species Identification Results
5. Conclusions
Supplementary Materials
Author Contributions
Funding
Data Availability Statement
Acknowledgments
Conflicts of Interest
References
- Tokhtar, V.; Groshenko, S.A. Differentiation of the Climatic Niches of the Invasive Oenothera L. (Subsect. Oenothera, Onagraceae) Species in the Eastern Europe. Adv. Environ. Biol. 2014, 8, 529–531. [Google Scholar] [CrossRef]
- Tokhtar, V.K. Advanced Approaches to the Visualization of Data Characterizing Distribution Features of Alien Plant Species. Russ. J. Biol. Invasions 2018, 9, 263–269. [Google Scholar] [CrossRef]
- Bzdęga, K.; Zarychta, A.; Urbisz, A.; Szporak-Wasilewska, S.; Ludynia, M.; Fojcik, B.; Tokarska-Guzik, B. Geostatistical models with the use of hyperspectral data and seasonal variation—A new approach for evaluating the risk posed by invasive plants. Ecol. Indic. 2021, 121, 107204. [Google Scholar] [CrossRef]
- McGeoch, M.A.; Butchart, S.H.M.; Spear, D.; Marais, E.; Kleynhans, E.J.; Symes, A.; Chanson, J.; Hoffmann, M. Global indicators of biological invasion: Species numbers, biodiversity impact and policy responses. Divers. Distrib. 2010, 16, 95–108. [Google Scholar] [CrossRef]
- Van Kleunen, M.; Weber, E.; Fischer, M. A meta-analysis of trait differences between invasive and non-invasive plant species. Ecol. Lett. 2010, 13, 235–245. [Google Scholar] [CrossRef] [Green Version]
- Lu, B.; Dao, P.; Liu, J.; He, Y.; Shang, J. Recent Advances of Hyperspectral Imaging Technology and Applications in Agriculture. Remote Sens. 2020, 12, 2659. [Google Scholar] [CrossRef]
- Kok, L. Classical Biological Control of Nodding and Plumeless Thistles. Biol. Control 2001, 21, 206–213. [Google Scholar] [CrossRef] [Green Version]
- Gerhards, R.; Oebel, H. Practical experiences with a system for site-specific weed control in arable crops using real-time image analysis and GPS-controlled patch spraying. Weed Res. 2006, 46, 185–193. [Google Scholar] [CrossRef]
- Slaughter, D.; Giles, D.; Downey, D. Autonomous robotic weed control systems: A review. Comput. Electron. Agric. 2008, 61, 63–78. [Google Scholar] [CrossRef]
- Sheffield, K.J.; Dugdale, T.M. Supporting Urban Weed Biosecurity Programs with Remote Sensing. Remote Sens. 2020, 12, 2007. [Google Scholar] [CrossRef]
- Everitt, J.H.; Alaniz, M.A.; Escobar, D.E.; Davis, M.R. Using Remote Sensing to Distinguish Common (Isocoma coronopifolia) and Drummond Goldenweed (Isocoma drummondii). Weed Sci. 1992, 40, 621–628. [Google Scholar] [CrossRef]
- Lamb, D.W.; Brown, R.B. PA—Precision Agriculture: Remote-sensing and mapping of weeds in crops. J. Agric. Eng. Res. 2001, 78, 117–125. [Google Scholar] [CrossRef]
- Brown, R.B.; Steckler, J.-P.G.A.; Anderson, G.W. Remote sensing for identifcation of weeds in no-till corn. Trans. ASAE 1994, 37, 297–302. [Google Scholar] [CrossRef]
- Shearer, S.A.; Holmes, R.G. Plant identication using color co occurrence matrices. Trans. ASAE 1990, 33, 2037–2044. [Google Scholar] [CrossRef]
- Liakos, K.G.; Busato, P.; Moshou, D.; Pearson, S.; Bochtis, D. Machine learning in agriculture: A review. Sensors 2018, 18, 2674. [Google Scholar] [CrossRef] [Green Version]
- Chandler, J.; Cooke, F. Economics of cotton losses caused by weeds. In Weeds Cotton: Characterization and Control; The Cotton Foundation: Memphis, TN, USA, 1992; pp. 85–116. [Google Scholar]
- Su, W.-H. Advanced Machine Learning in Point Spectroscopy, RGB- and Hyperspectral-Imaging for Automatic Discriminations of Crops and Weeds: A Review. Smart Cities 2020, 3, 767–792. [Google Scholar] [CrossRef]
- Suzuki, Y.; Okamoto, H.; Kataoka, T. Image Segmentation between Crop and Weed using Hyperspectral Imaging for Weed Detection in Soybean Field Environ. Control Biol. 2008, 46, 163–173. [Google Scholar] [CrossRef] [Green Version]
- Bayer, B. Color Imaging Array. U.S. Patent 3,971,065, 20 July 1976. [Google Scholar]
- Manh, A.-G.; Rabatel, G.; Assemat, L.; Aldon, M.-J. AE—Automation and Emerging Technologies: Weed Leaf Image Segmentation by Deformable Templates. J. Agric. Eng. Res. 2001, 80, 139–146. [Google Scholar] [CrossRef]
- Su, W.-H.; Sun, D.-W. Facilitated wavelength selection and model development for rapid determination of the purity of organic spelt (Triticum spelta L.) flour using spectral imaging. Talanta 2016, 155, 347–357. [Google Scholar] [CrossRef]
- El-Faki, M.S.; Zhang, N.; Peterson, D.E. Factors affecting color-based weed detection. Trans. ASAE 2000, 43, 1001–1009. [Google Scholar] [CrossRef]
- Noble, S.; Crowe, T. Plant discrimination based on leaf reflectance. In Proceedings of the 2001 ASAE Annual International Meeting, Meeting Paper No. 011150, Sacramento, CA, USA, 30 July–1 August 2001; ASAE: St Joseph, MI, USA, 2001. [Google Scholar] [CrossRef]
- Terawaki, M.; Kataoka, T.; Okamoto, H.; Hata, S. Distinction between sugar beet and weeds based on shape characteristics using image processing technique. J. JSAM 2002, 64, 93–101. [Google Scholar]
- Okamoto, H.; Murata, T.; Kataoka, T.; Hata, S.-I. Plant classification for weed detection using hyperspectral imaging with wavelet analysis. Weed Biol. Manag. 2007, 7, 31–37. [Google Scholar] [CrossRef]
- Burks, T.; Shearer, S.; Payne, F. Classification of weed species using color texture features and discriminant analysis. Trans. ASAE 2000, 43, 441–448. [Google Scholar] [CrossRef]
- Peerbhay, K.; Mutanga, O.; Ismail, R. The identification and remote detection of alien invasive plants in commercial forests: An Overview. S. Afr. J. Geomat. 2016, 5, 49–67. [Google Scholar]
- Ishii, J.; Washitani, I. Early detection of the invasive alien plant Solidago altissima in moist tall grassland using hyperspectral imagery. Int. J. Remote Sens. 2013, 34, 5926–5936. [Google Scholar] [CrossRef]
- Andrew, M.E.; Susan, L. Ustin The role of environmental context in mapping invasive plants with hyperspectral image data. Remote Sens. Environ. 2008, 112, 4301–4317. [Google Scholar] [CrossRef]
- Maes, W.H.; Steppe, K. Estimating evapotranspiration and drought stress with ground-based thermal remote sensing in agriculture: A review. J. Exp. Bot. 2012, 63, 4671–4712. [Google Scholar] [CrossRef] [Green Version]
- Panov, V.D.; Lurie, P.M.; Larionov, Y.A. The Climate of the Rostov Region: Yesterday, Today, Tomorrow; Donskoy Publishing House: Rostov-on-Don, Russia, 2006; p. 488. [Google Scholar]
- Bareth, G.; Aasen, H.; Bendig, J.; Gnyp, M.L.; Bolten, A.; Jung, A.; Michels, R.; Soukkamäki, J. Low-weight and UAV-based hyperspectral full-frame cameras for monitoring crops: Spectral comparison with portable spectroradiometer measurements. Photogr. Fernerkund. Geoinf. 2015, 1, 69–79. [Google Scholar] [CrossRef]
- Aasen, H.; Burkart, A.; Bolten, A.; Bareth, G. Generating 3D hyperspectral information with lightweight UAV snapshot cameras for vegetation monitoring: From camera calibration to quality assurance. ISPRS J. Photogramm. Remote Sens. 2015, 108, 245–259. [Google Scholar] [CrossRef]
- Boochs, F.; Kupfer, G.; Dockter, K.; Kühbauch, W. Shape of the red edge as vitality indicator for plants. Int. J. Remote Sens. 1990, 11, 1741–1753. [Google Scholar] [CrossRef]
- Kim, M.; Daughtry, C.; Chappelle, E.; McMurtrey, J.; Walthall, C. The use of high spectral resolution bands for estimating absorbed photosynthetically active radiation (Apar). In Proceedings of the Sixth Symposium on Physical Measurements and Sig-natures in Remote Sensing, Val d’Isère, France, 17–21 January 1994; Volume 17, pp. 299–306. [Google Scholar]
- Carter, G.A. Ratios of leaf reflectances in narrow wavebands as indicators of plant stress. Int. J. Remote Sens. 1994, 15, 697–703. [Google Scholar] [CrossRef]
- Zarco-Tejada, P.J.; Pushnik, J.C.; Dobrowski, S.; Ustin, S.L. Steady-state chlorophyll a fluorescence detection from canopy derivative reflectance and double-peak red-edge effects. Remote Sens. Environ. 2003, 84, 283–294. [Google Scholar] [CrossRef]
- Gitelson, A.A.; Gritz, Y.; Merzlyak, M.N. Relationships between leaf chlorophyll content and spectral reflectance and algorithms for non-destructive chlorophyll assessment in higher plant leaves. J. Plant Physiol. 2003, 160, 271–282. [Google Scholar] [CrossRef] [PubMed]
- Oppelt, N.; Mauser, W. Hyperspectral monitoring of physiological parameters of wheat during a vegetation period using AVIS data. Int. J. Remote Sens. 2004, 25, 145–159. [Google Scholar] [CrossRef]
- Datt, B. Visible/near infrared reflectance and chlorophyll content in Eucalyptus leaves. Int. J. Remote Sens. 1999, 20, 2741–2759. [Google Scholar] [CrossRef]
- Datt, B. Remote Sensing of Chlorophyll a, Chlorophyll b, Chlorophyll a+b, and Total Carotenoid Content in Eucalyptus Leaves. Remote Sens. Environ. 1998, 66, 111–121. [Google Scholar] [CrossRef]
- Le Maire, G.; François, C.; Dufrêne, E. Towards universal broad leaf chlorophyll indices using PROSPECT simulated database and hyperspectral reflectance measurements. Remote Sens. Environ. 2004, 89, 1–28. [Google Scholar] [CrossRef]
- Apan, A.; Held, A.; Phinn, S.; Markley, J. Detecting sugarcane ‘orange rust’ disease using EO-1 Hyperion hyperspectral imagery. Int. J. Remote Sens. 2004, 25, 489–498. [Google Scholar] [CrossRef] [Green Version]
- Penuelas, J.; Gamon, J.A.; Fredeen, A.L.; Merino, J.; Field, C.B. Reflectance indices associated with physiological-changes in nitrogen-limited and water-limited sun ower leaves. Remote Sens. Environ. 1994, 48, 135–146. [Google Scholar] [CrossRef]
- Huete, A.; Liu, H.Q.; Batchily, K.; van Leeuwen, W. A comparison of vegetation indices over a global set of TM images for EOS–MODIS. Remote Sens. Environ. 1997, 59, 440–451. [Google Scholar] [CrossRef]
- Smith, R.; Adams, J.; Stephens, D.; Hick, P. Forecasting wheat yield in a Mediterranean-type environment from the NOAA satellite. Aust. J. Agric. Res. 1995, 46, 113–125. [Google Scholar] [CrossRef]
- Gitelson, A.; Buschmann, C.; Lichtenthaler, H. The chlorophyll fluorescence ratio F735/F700 as an accurate measure of the chlorophyll content in plants—Experiments with autumn chestnut and maple leaves. Remote Sens. Environ. 1999, 69, 296–302. [Google Scholar] [CrossRef]
- Gitelson, A.A.; Kaufman, Y.J.; Merzlyak, M.N. Use of a green channel in remote sensing of global vegetation from EOS-MODIS. Remote Sens. Environ. 1996, 58, 289–298. [Google Scholar] [CrossRef]
- Maccioni, A.; Agati, G.; Mazzinghi, P. New vegetation indices for remote measurement of chlorophylls based on leaf directional reflectance spectra. J. Photochem. Photobiol. B Biol. 2001, 61, 52–61. [Google Scholar] [CrossRef]
- Daughtry, C.; Walthall, C.; Kim, M.; Brown de Colstoun, E.; McMurtrey, J.E., III. Estimating corn leaf chlorophyll concentration from leaf and canopy reflectance. Remote Sens. Environ. 2000, 74, 229–239. [Google Scholar] [CrossRef]
- Hernández-Clemente, R.; Navarro-Cerrillo, R.M.; Suárez, L.; Morales, F.; Zarco-Tejada, P.J. Assessing structural effects on PRI for stress detection in conifer forests. Remote Sens. Environ. 2011, 115, 2360–2375. [Google Scholar] [CrossRef]
- Qi, J.; Chehbouni, A.; Huete, A.R.; Kerr, Y.H.; Sorooshian, S. A modified soil adjusted vegetation index. Remote Sens. Environ. 1994, 48, 119–126. [Google Scholar] [CrossRef]
- Chen, J.M. Evaluation of Vegetation Indices and a Modified Simple Ratio for Boreal Applications. Can. J. Remote Sens. 1996, 22, 229–242. [Google Scholar] [CrossRef]
- Dash, J.; Curran, P.J. The MERIS terrestrial chlorophyll index. Int. J. Remote Sens. 2004, 25, 5403–5413. [Google Scholar] [CrossRef]
- Haboudane, D.; Miller, J.R.; Tremblay, N.; Zarco-Tejada, P.J.; Dextraze, L. Integrated narrow-band vegetation indices for prediction of crop chlorophyll content for application to precision agriculture. Remote Sens. Environ. 2002, 81, 416–426. [Google Scholar] [CrossRef]
- Tucker, C.J. Red and photographic infrared linear combinations for monitoring vegetation. Remote Sens. Environ. 1979, 8, 127–150. [Google Scholar] [CrossRef] [Green Version]
- Gitelson, A.; Merzlyak, M.N. Quantitative estimation of chlorophyll-a using reflectance spectra: Experiments with autumn chestnut and maple leaves. J. Photochem. Photobiol. B Biol. 1994, 22, 247–252. [Google Scholar] [CrossRef]
- Gandia, S.; Fernandez, G.; Garcia, J.; Moreno. Retrieval of vegetation biophysical variables from CHRIS/PROBA data in the SPARC campaign. Esa SP 2004, 578, 40–48. [Google Scholar]
- Rondeaux, G.; Steven, M.; Baret, F. Optimization of soil-adjusted vegetation indices. Remote Sens. Environ. 1996, 55, 95–107. [Google Scholar] [CrossRef]
- Wu, C.; Niu, Z.; Tang, Q.; Huang, W. Estimating chlorophyll content from hyperspectral vegetation indices: Modeling and validation. Agric. For. Meteorol. 2008, 148, 1230–1241. [Google Scholar] [CrossRef]
- Chappelle, E.W.; Kim, M.S.; McMurtrey, J.E. Ratio analysis of reflectance spectra (rars)—An algorithm for the remote esti-mation of the concentrations of chlorophyll-a, chlorophyll-b, and carotenoids in soybean leaves. Remote Sens. Environ. 1992, 39, 239–247. [Google Scholar] [CrossRef]
- Gamon, J.; Penuelas, J.P.; Field, C. A narrow-waveband spectral index that tracks diurnal changes in photosynthetic effi-ciency. Remote Sens. Environ. 1992, 41, 35–44. [Google Scholar] [CrossRef]
- Zarco-Tejada, P.J.; Gonzalez-Dugo, V.; Williams, L.E.; Suárez, L.; Berni, J.A.J.; Goldhamer, D.; Fereres, E. A PRI-based water stress index combining structural and chlorophyll effects: Assessment using diurnal narrow-band airborne imagery and the CWSI thermal index. Remote Sens. Environ. 2013, 138, 38–50. [Google Scholar] [CrossRef]
- Garrity, S.R.; Eitel, J.U.; Vierling, L.A. Disentangling the relationships between plant pigments and the photochemical re-flectance index reveals a new approach for remote estimation of carotenoid content. Remote Sens. Environ. 2011, 115, 628–635. [Google Scholar] [CrossRef]
- Merzlyak, M.N.; Gitelson, A.A.; Chivkunova, O.B.; Rakitin, V.Y. Non-destructive optical detection of pigment changes during leaf senescence and fruit ripening. Physiol. Plant. 1999, 106, 135–141. [Google Scholar] [CrossRef] [Green Version]
- Blackburn, G.A. Quantifying Chlorophylls and Caroteniods at Leaf and Canopy Scales: An Evaluation of Some Hyperspectral Approaches. Remote Sens. Environ. 1998, 66, 273–285. [Google Scholar] [CrossRef]
- Roujean, J.-L.; Breon, F.-M. Estimating PAR absorbed by vegetation from bidirectional reflectance measurements. Remote Sens. Environ. 1995, 51, 375–384. [Google Scholar] [CrossRef]
- Guyot, G.; Baret, F. Utilisation de la haute resolu-tion spectrale pour suivre l’etat des couverts vegetaux. Spectr. Signat. Objects Remote Sens. 1988, 287, 279–286. [Google Scholar]
- Huete, A.R. A soil-adjusted vegetation index (SAVI). Remote Sens. Environ. 1988, 25, 295–309. [Google Scholar] [CrossRef]
- Vincini, M.; Frazzi, E.; D’Alessio, P. Angular dependence of maize and sugar beet VIs from directional CHRIS/PROBA data. In Proceedings of the Fourth ESA CHRIS PROBA Workshop ESRIN, Frascati, Italy, 19–21 September 2006. [Google Scholar]
- Jordan, C.F. Derivation of Leaf-Area Index from Quality of Light on the Forest Floor. Ecology 1969, 50, 663–666. [Google Scholar] [CrossRef]
- Gitelson, A.A.; Merzlyak, M.N. Remote estimation of chlorophyll content in higher plant leaves. Int. J. Remote Sens. 1997, 18, 2691–2697. [Google Scholar] [CrossRef]
- McMurtrey, J.E.; Chappelle, E.W.; Kim, M.S.; Meisinger, J.J.; Corp, L.A. Distinguishing nitrogen fertilization levels in field corn (Zea mays L.) with actively induced fluorescence and passive reflectance measurements. Remote Sens. Environ. 1994, 47, 36–44. [Google Scholar] [CrossRef]
- Zarco-Tejada, P.J.; Miller, J.R. Land cover mapping at BOREAS using red edge spectral parameters from CASI imagery. J. Geophys. Res. Earth Surf. 1999, 104, 27921–27933. [Google Scholar] [CrossRef]
- Hernandez-Clemente, R.; Navarro-Cerrillo, R.M.; Zarco-Tejada, P.J. Carotenoid content estimation in a heterogeneous co-nifer forest using narrowband indices and PROSPECT + DART simulations. Remote Sens. Environt. 2012, 127, 298–315. [Google Scholar] [CrossRef]
- Elvidge, C.D.; Chen, Z.K. Comparison of broad-band and narrow-band red and near-infrared vegetation indices. Remote Sens. Environ. 1995, 54, 38–48. [Google Scholar] [CrossRef]
- Filella, I.; Penuelas, J. The red edge position and shape as indicators of plant chlorophyll content, biomass and hydric status. Int. J. Remote Sens. 1994, 15, 1459–1470. [Google Scholar] [CrossRef]
- Hunt, E.R., Jr.; Doraiswamy, P.C.; McMurtrey, J.E.; Daughtry, C.S.T.; Perry, E.M.; Akhmedov, B. A visible band index for remote sensing leaf chlorophyll content at the canopy scale. Int. J. Appl. Earth Obs. Geoinf. 2013, 21, 103–112. [Google Scholar] [CrossRef] [Green Version]
- Broge, N.H.; Leblanc, E. Comparing prediction power and stability of broadband and hyperspectral vegetation indices for estimation of green leaf area index and canopy chlorophyll density. Remote Sens. Environ. 2001, 76, 156–172. [Google Scholar] [CrossRef]
- Vogelmann, J.E.; Rock, B.N.; Moss, D.M. Red edge spectral measurements from sugar maple leaves. Int. J. Remote Sens. 1993, 14, 1563–1575. [Google Scholar] [CrossRef]
- Lehnert, L.W.; Meyer, H.; Obermeier, W.A.; Silva, B.; Regeling, B.; Thies, B.; Bendix, J. Hyperspectral data analysis in R: The hsdar package. J. Stat. Softw. 2019, 89, 1–23. [Google Scholar] [CrossRef] [Green Version]
- Candiago, S.; Remondino, F.; De Giglio, M.; Dubbini, M.; Gattelli, M. Evaluating Multispectral Images and Vegetation Indices for Precision Farming Applications from UAV Images. Remote Sens. 2015, 7, 4026–4047. [Google Scholar] [CrossRef] [Green Version]
- Farooq, A.; Hu, J.; Jia, X. Analysis of Spectral Bands and Spatial Resolutions for Weed Classification via Deep Convolutional Neural Network. IEEE Geosci. Remote Sens. Lett. 2018, 16, 183–187. [Google Scholar] [CrossRef]
- Farooq, A.; Jia, X.; Hu, J.; Zhou, J. Multi-Resolution Weed Classification via Convolutional Neural Network and Superpixel Based Local Binary Pattern Using Remote Sensing Images. Remote Sens. 2019, 11, 1692. [Google Scholar] [CrossRef] [Green Version]
- Ronay, I.; Ephrath, J.E.; Eizenberg, H.; Blumberg, D.G.; Maman, S. Hyperspectral Reflectance and Indices for Characterizing the Dynamics of Crop–Weed Competition for Water. Remote Sens. 2021, 13, 513. [Google Scholar] [CrossRef]
- De Sá, N.C.; Castro, P.; Carvalho, S.; Marchante, E.; López-Núñez, F.A.; Marchante, H. Mapping the flowering of an invasive plant using unmanned aerial vehicles: Is there potential for biocontrol monitoring? Front. Plant Sci. 2018, 9, 1–13. [Google Scholar] [CrossRef] [Green Version]
- Franklin, S.E.; Ahmed, O.S. Deciduous tree species classification using object-based analysis and machine learning with unmanned aerial vehicle multispectral data. Int. J. Remote Sens. 2018, 39, 5236–5245. [Google Scholar] [CrossRef]
- Miyoshi, G.T.; Imai, N.N.; Tommaselli, A.M.G.; de Moraes, M.V.A.; Honkavaara, E. Evaluation of hyperspectral multitem-poral information to improve tree species identification in the highly diverse atlantic forest. Remote Sens. 2020, 12, 244. [Google Scholar] [CrossRef] [Green Version]
- Dash, J.P.; Watt, M.S.; Paul, T.S.H.; Morgenroth, J.; Pearse, G.D. Early Detection of Invasive Exotic Trees Using UAV and Manned Aircraft Multispectral and LiDAR Data. Remote Sens. 2019, 11, 1812. [Google Scholar] [CrossRef] [Green Version]
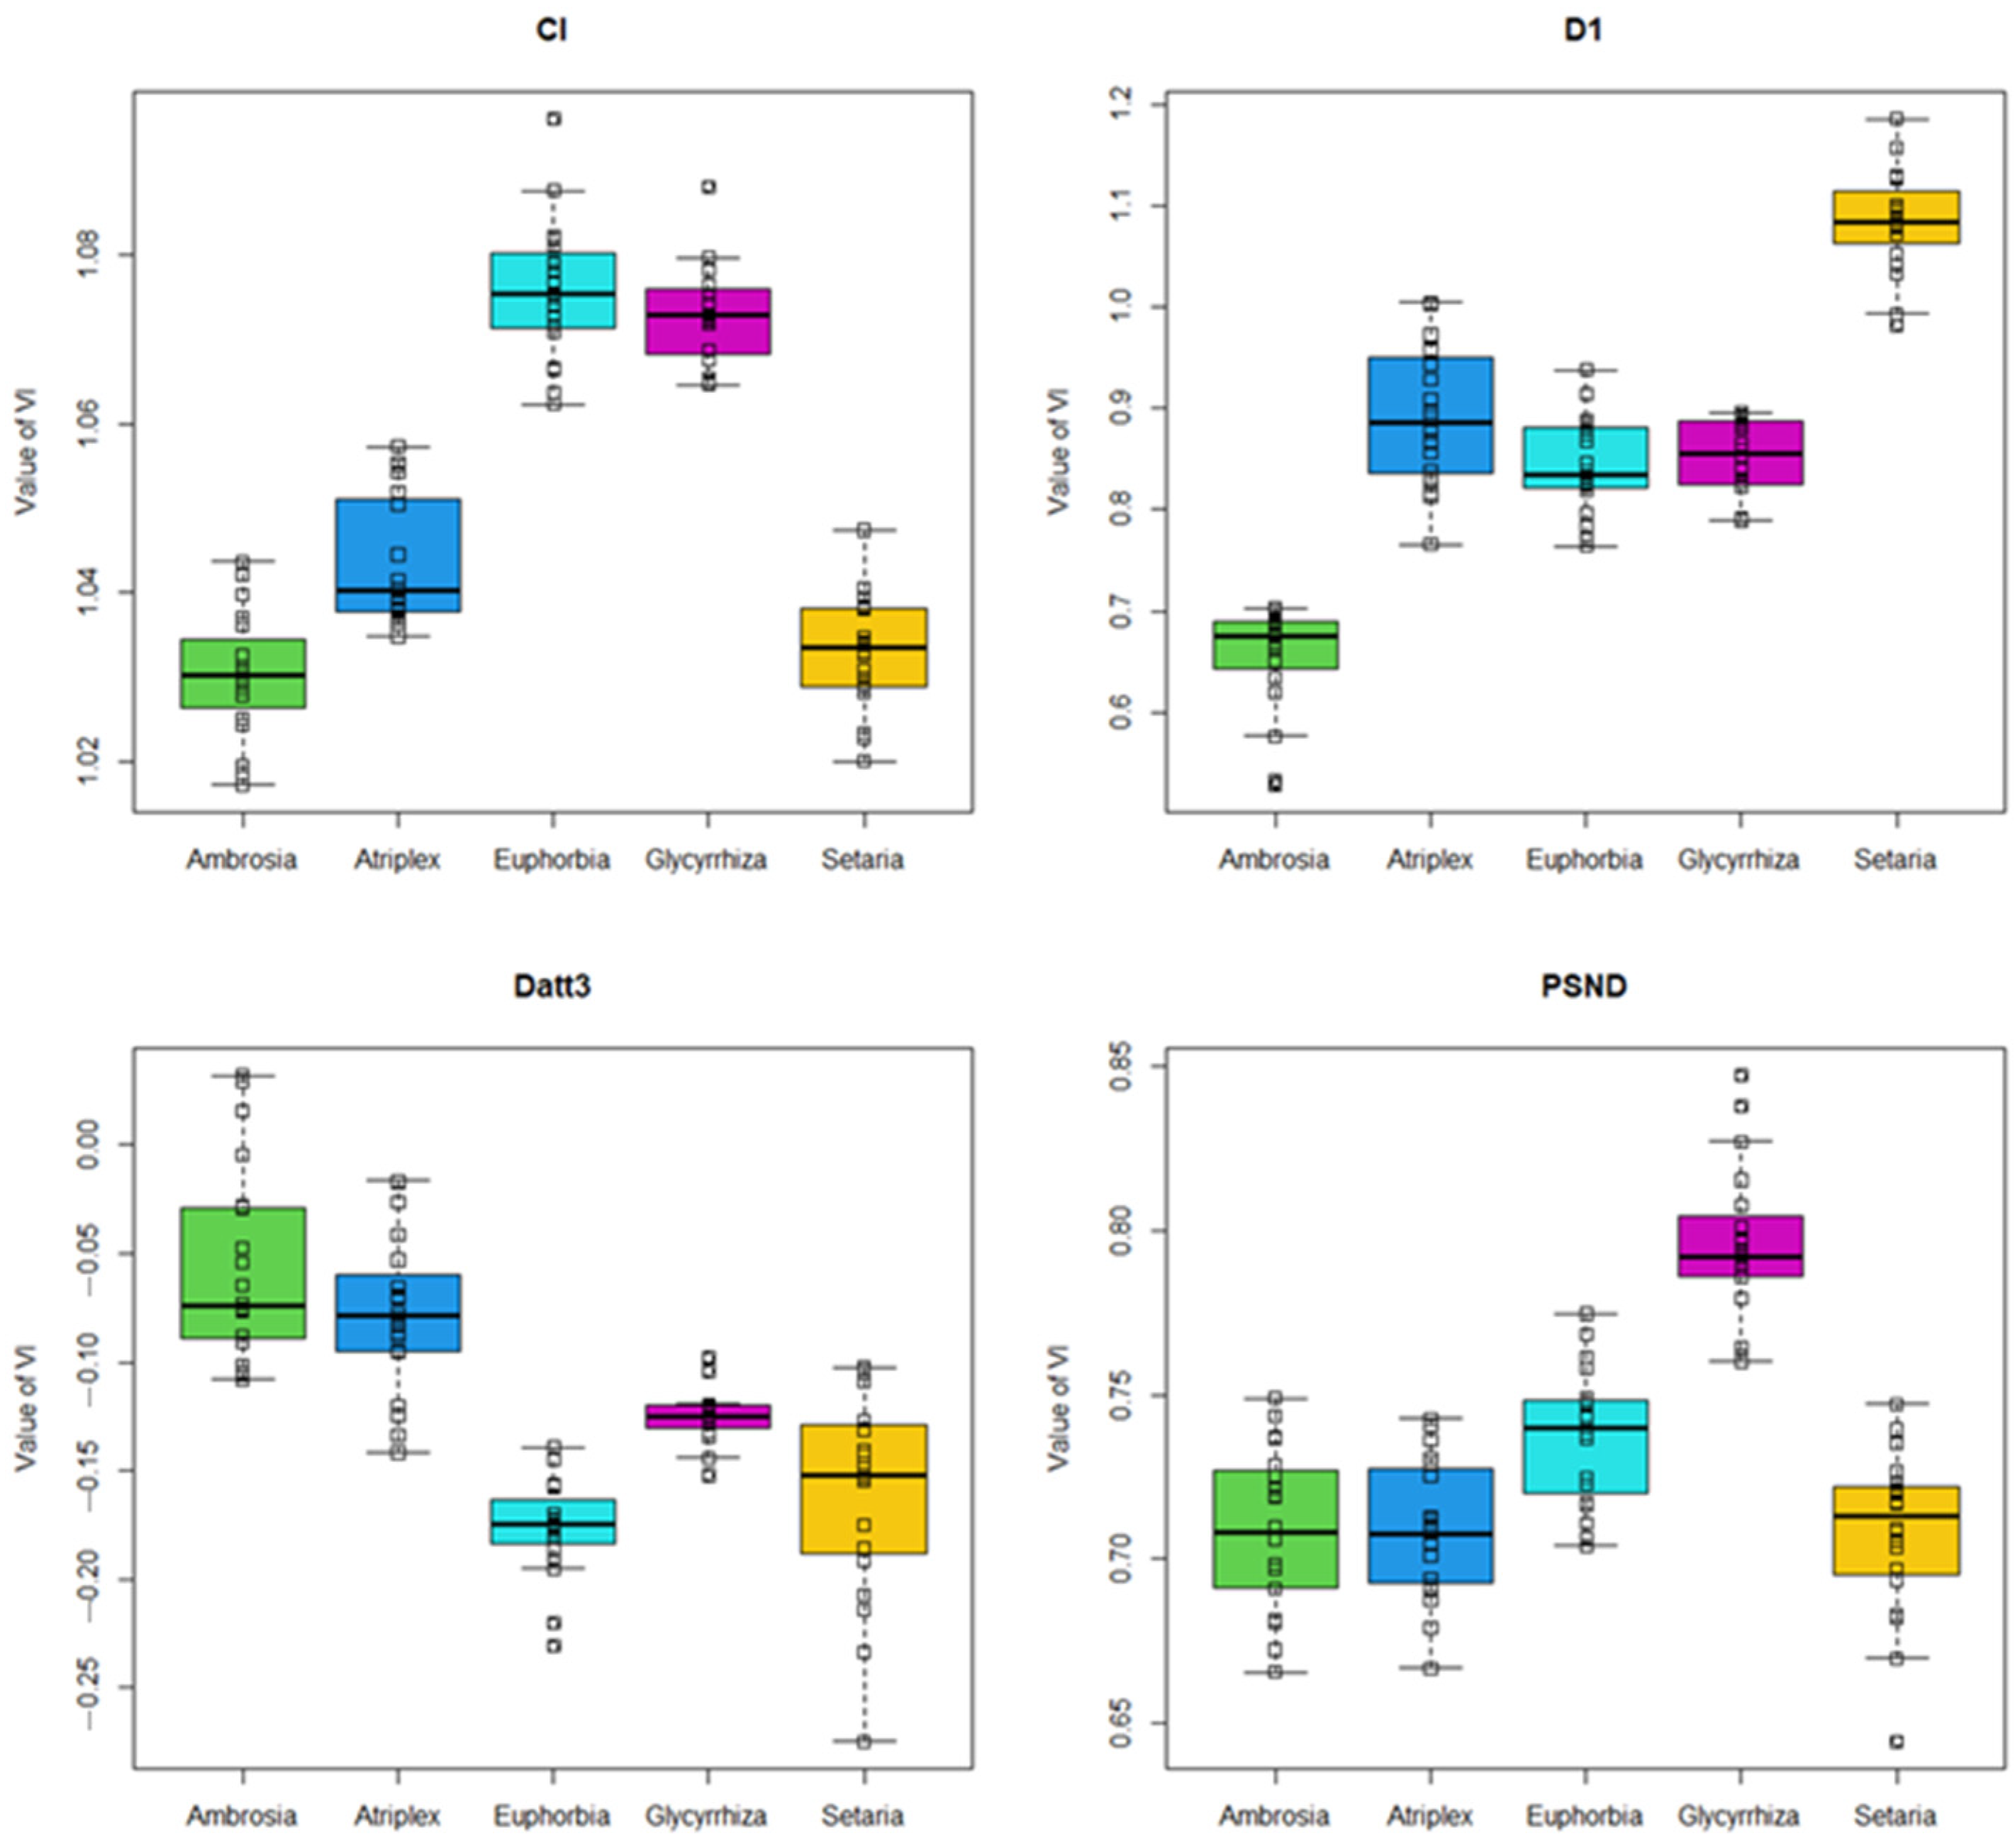

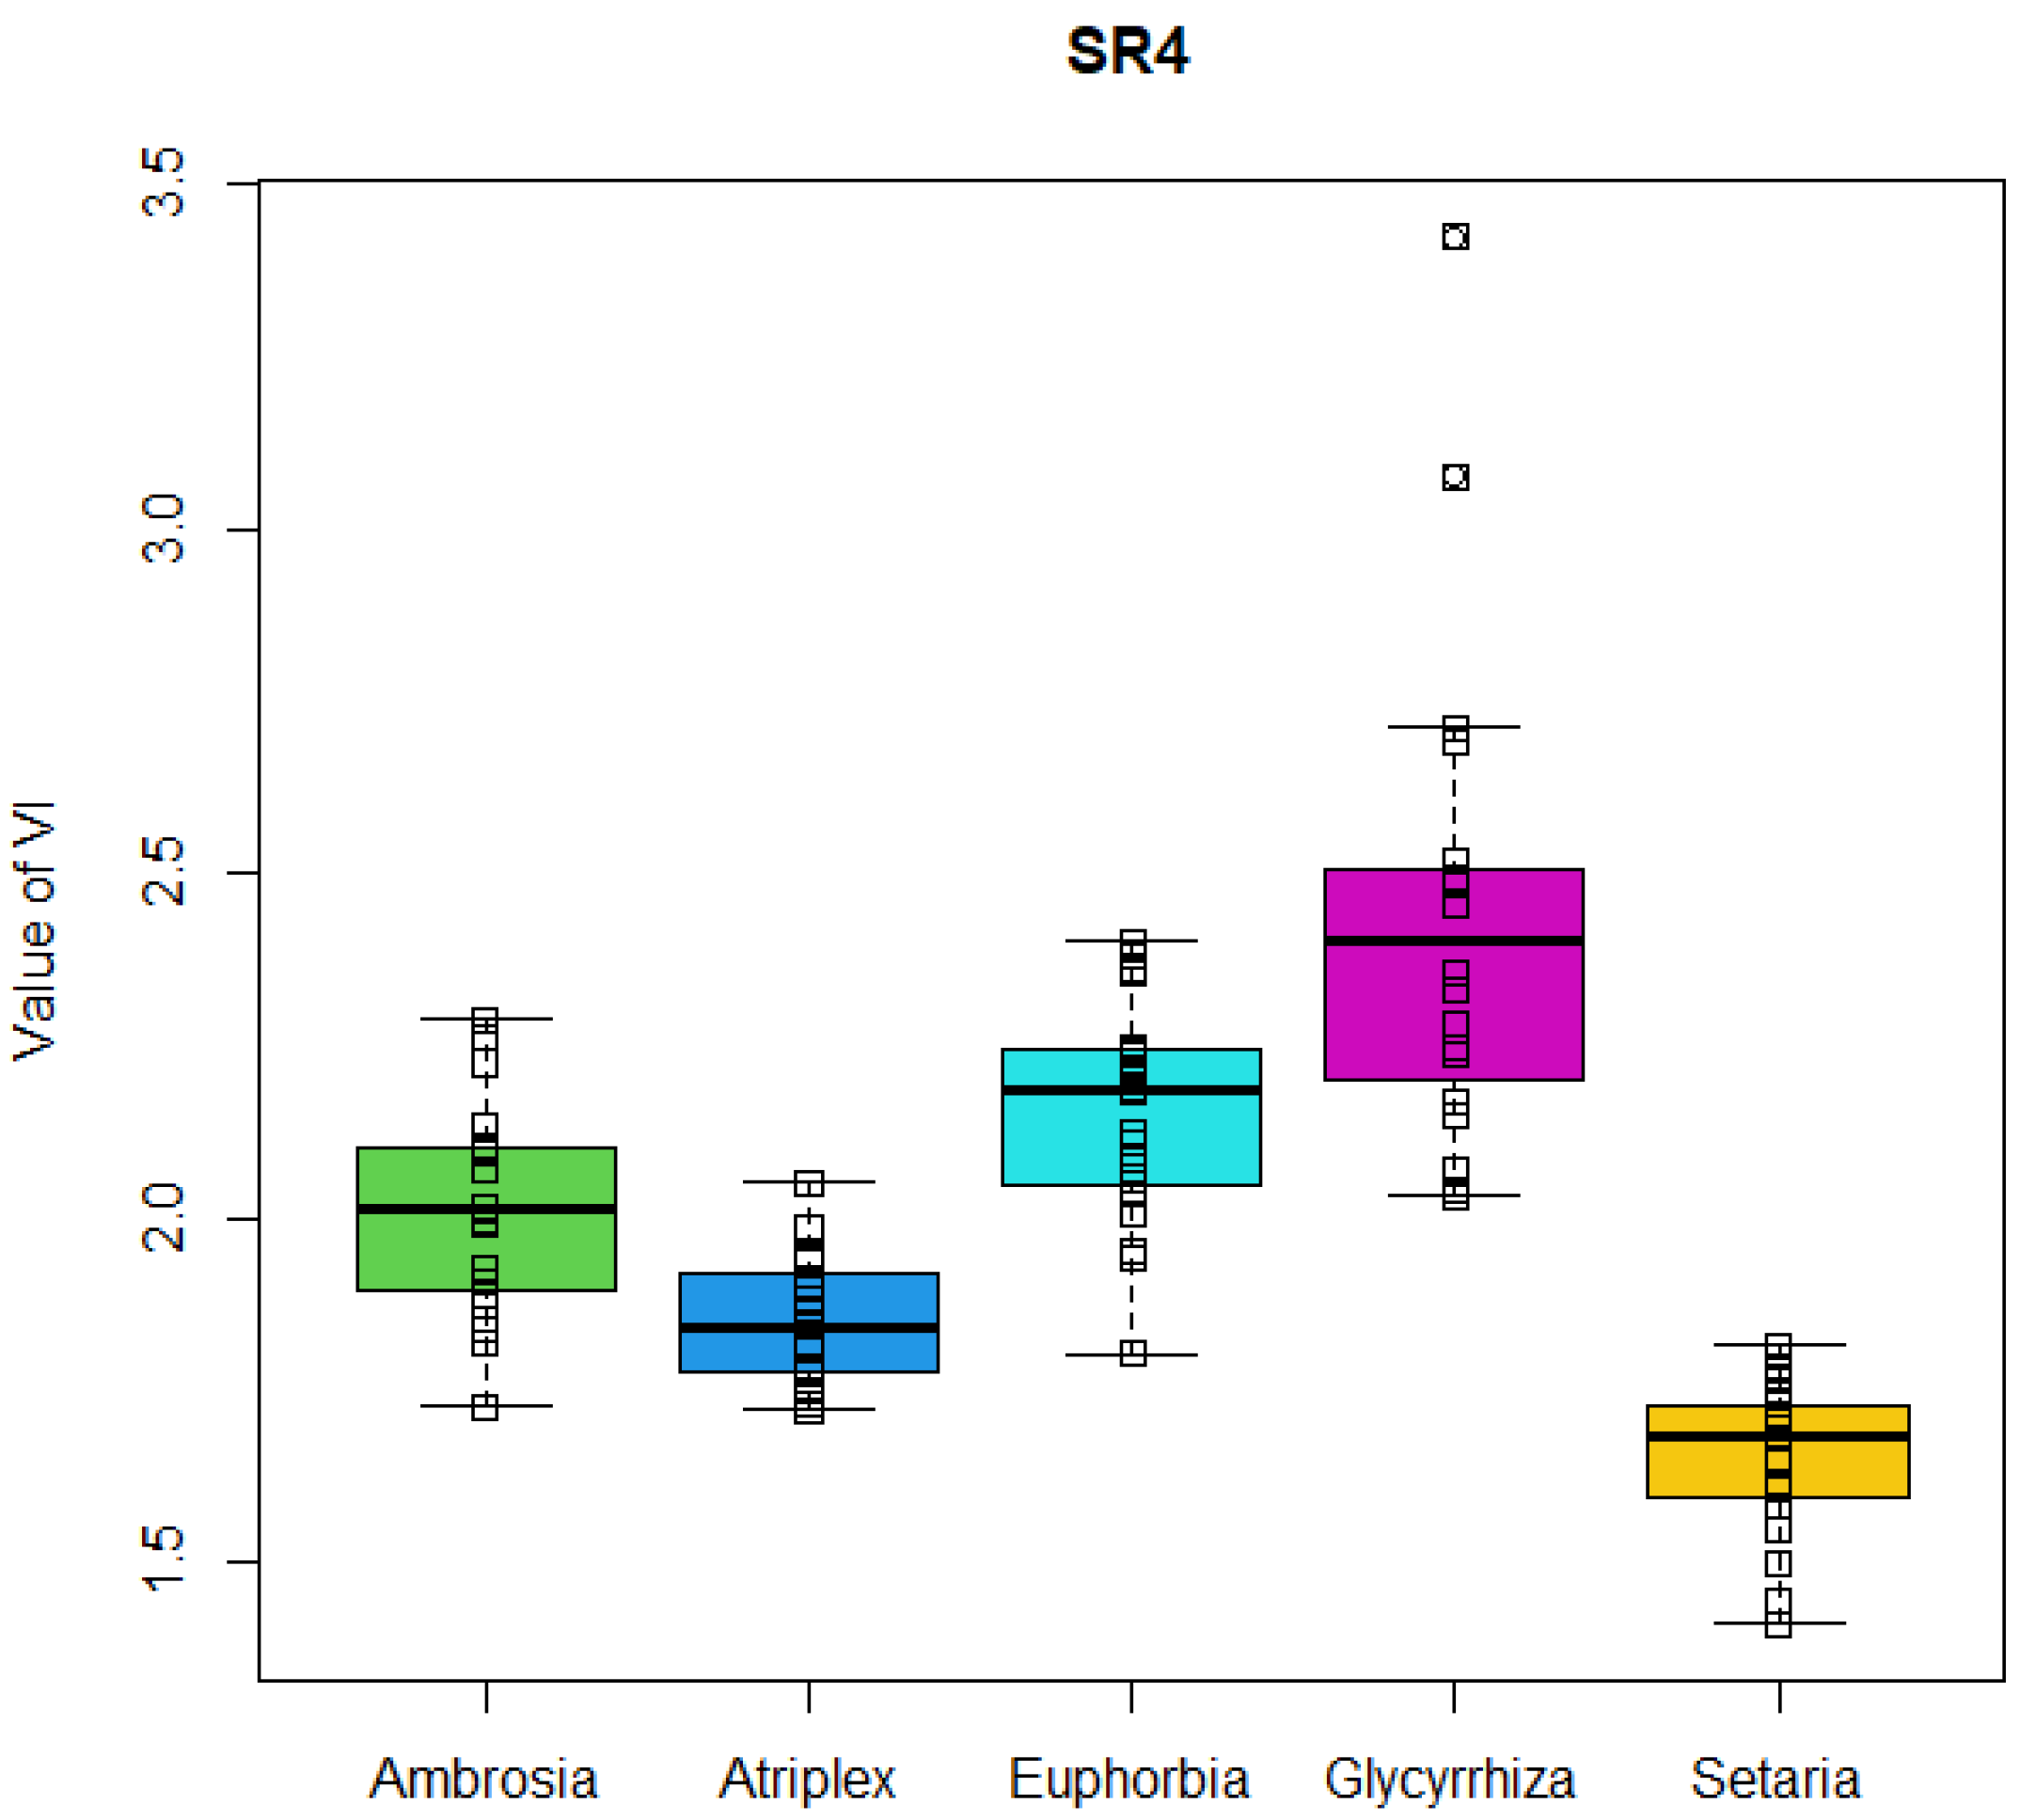
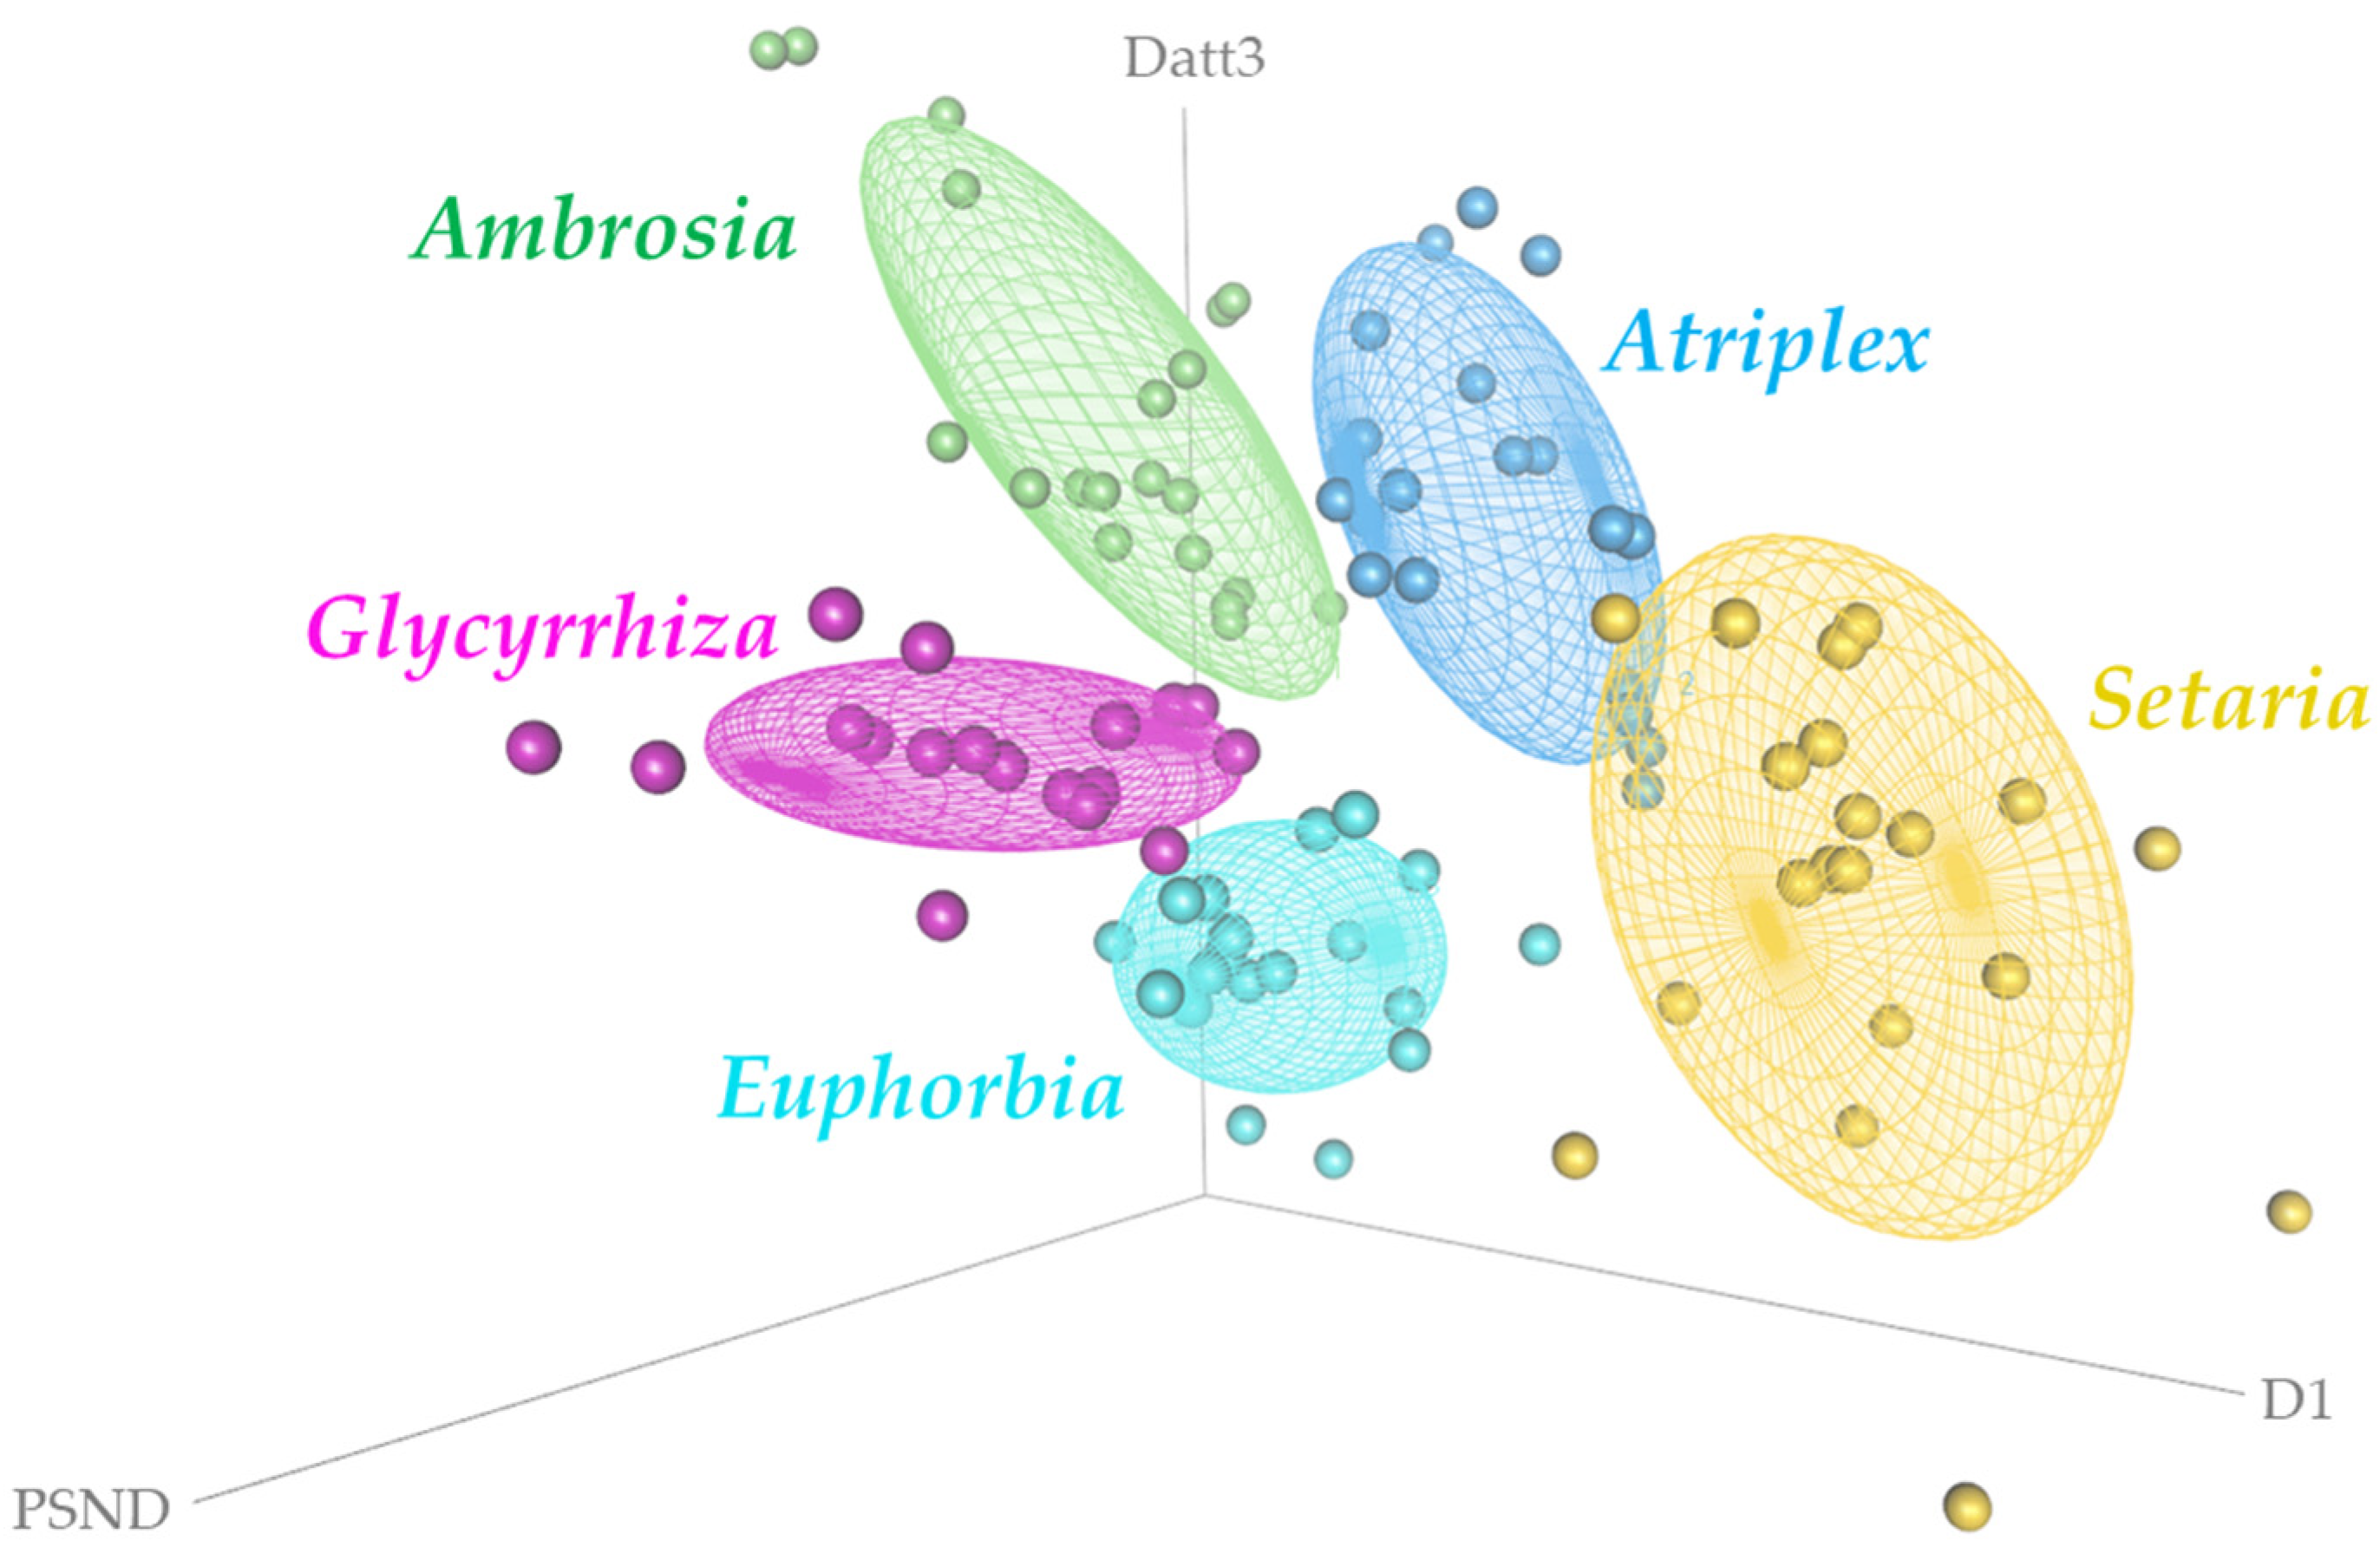

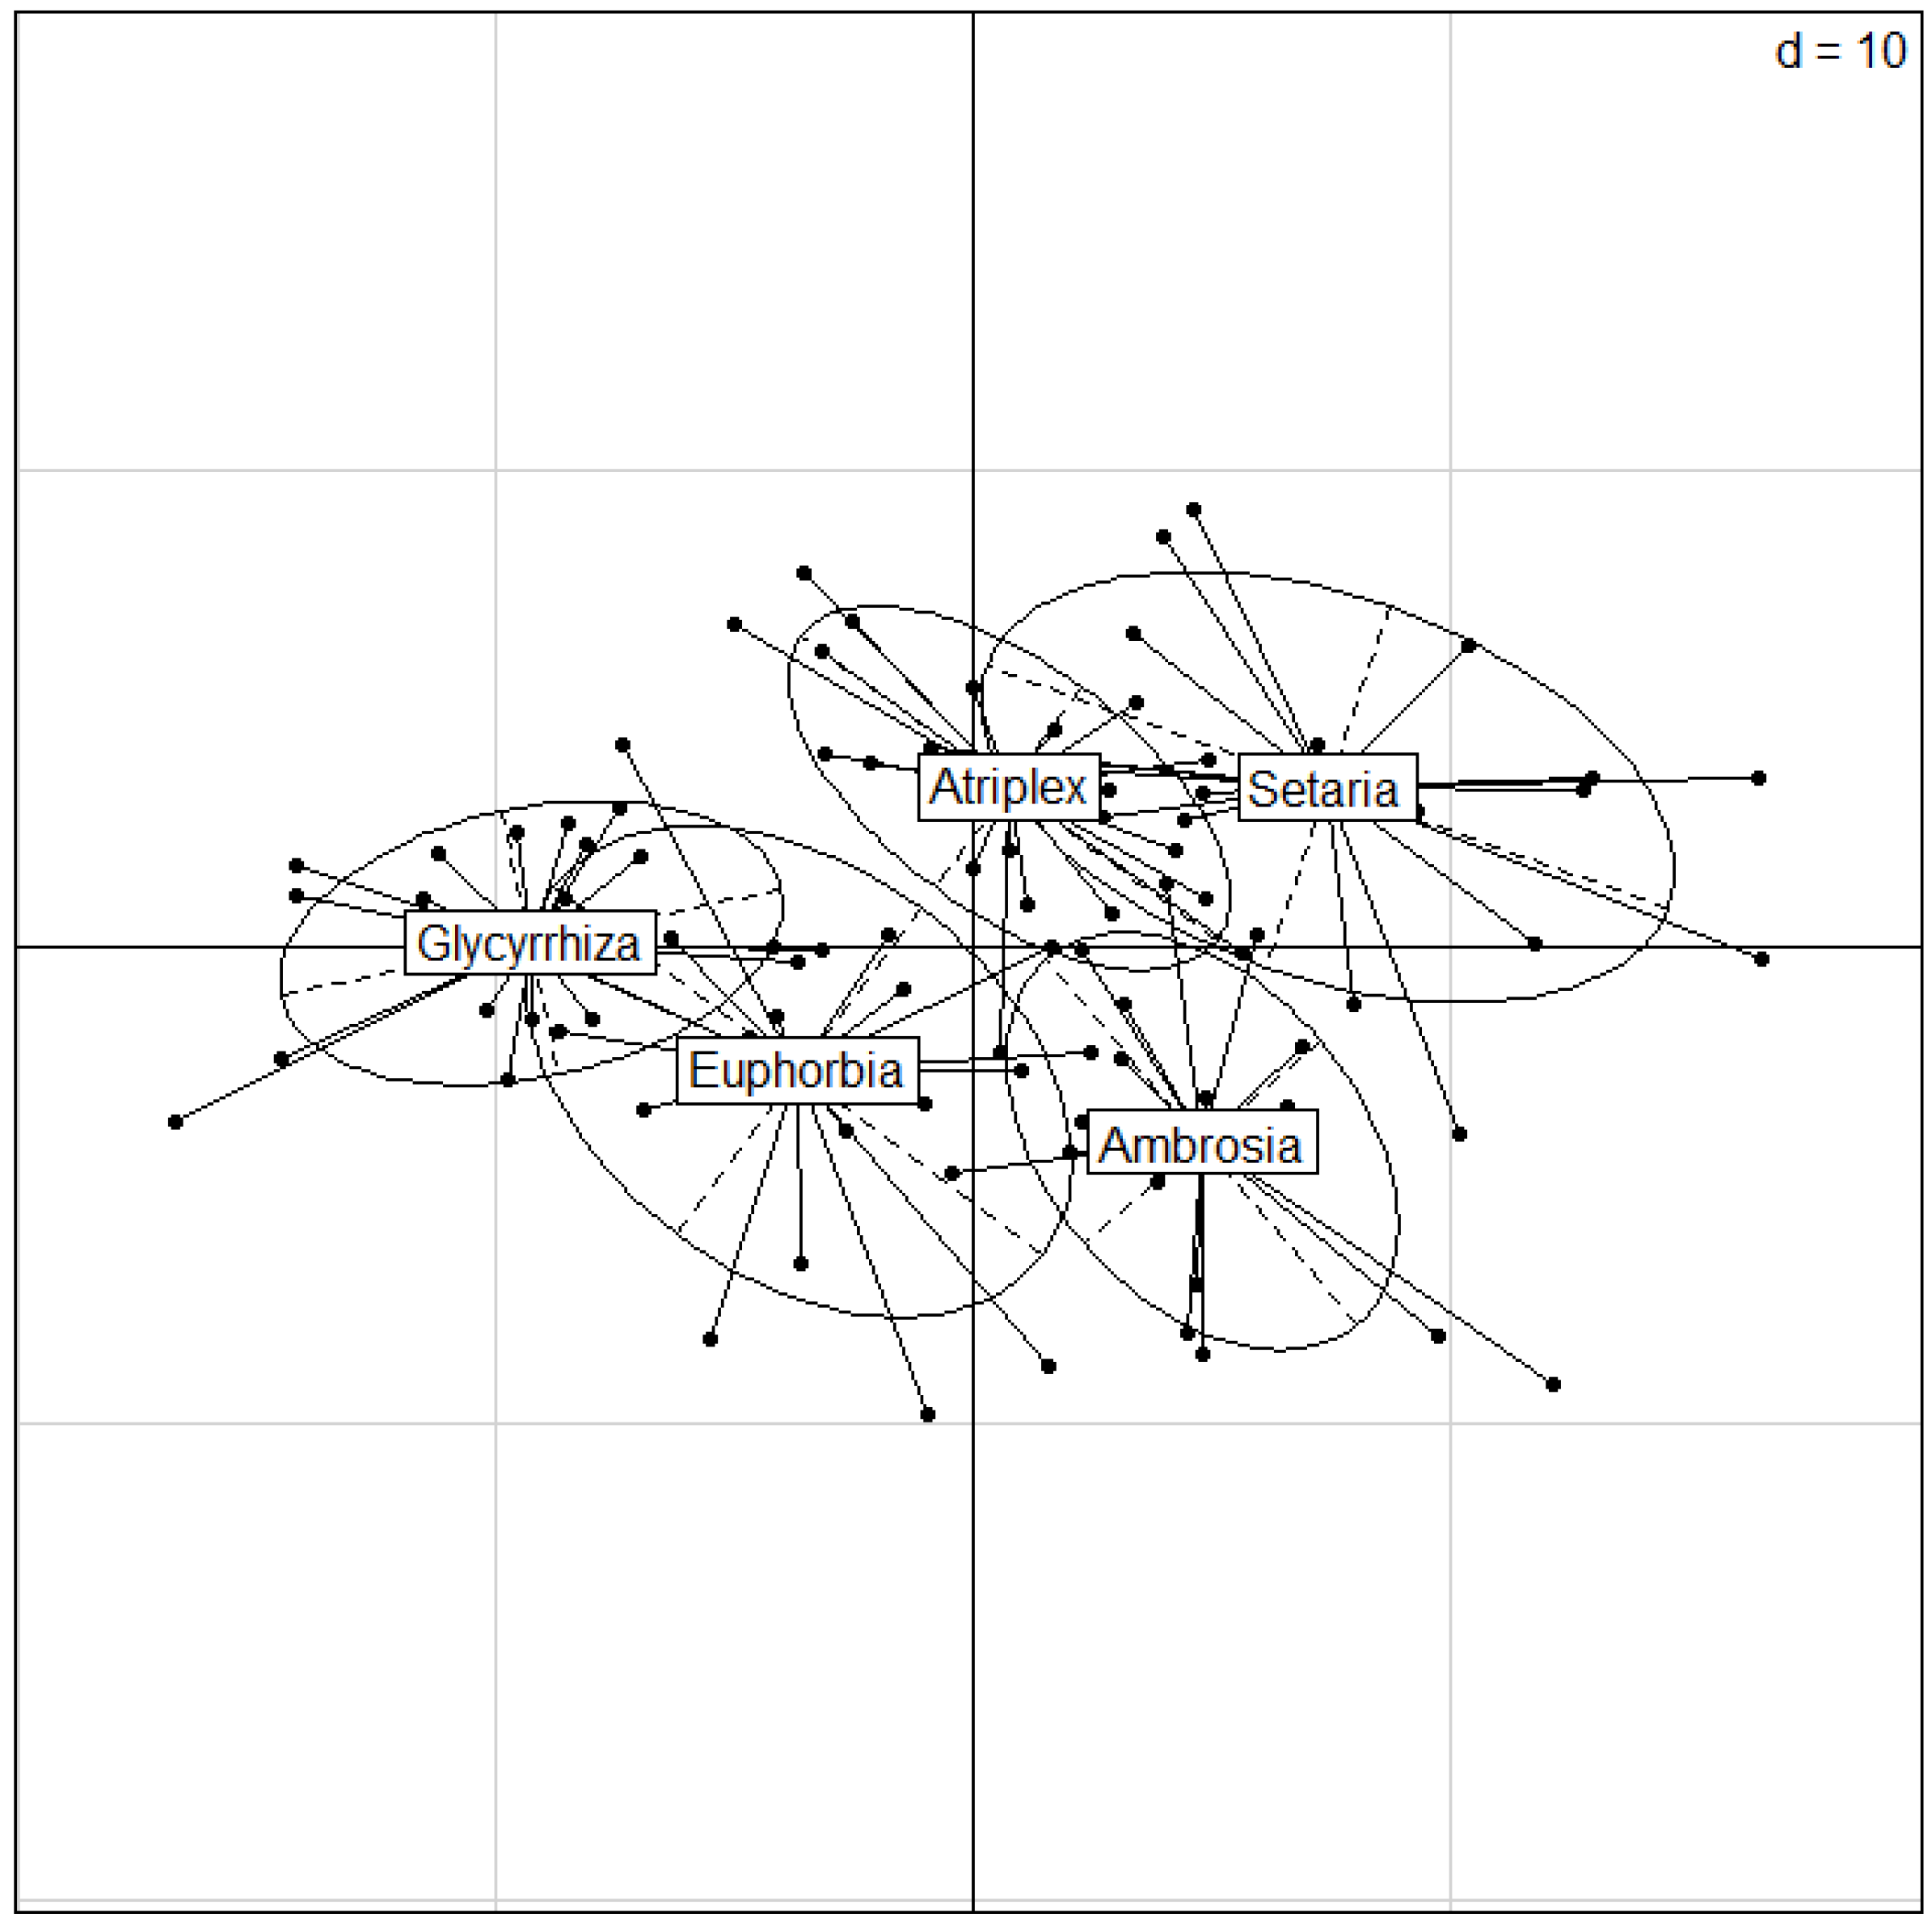
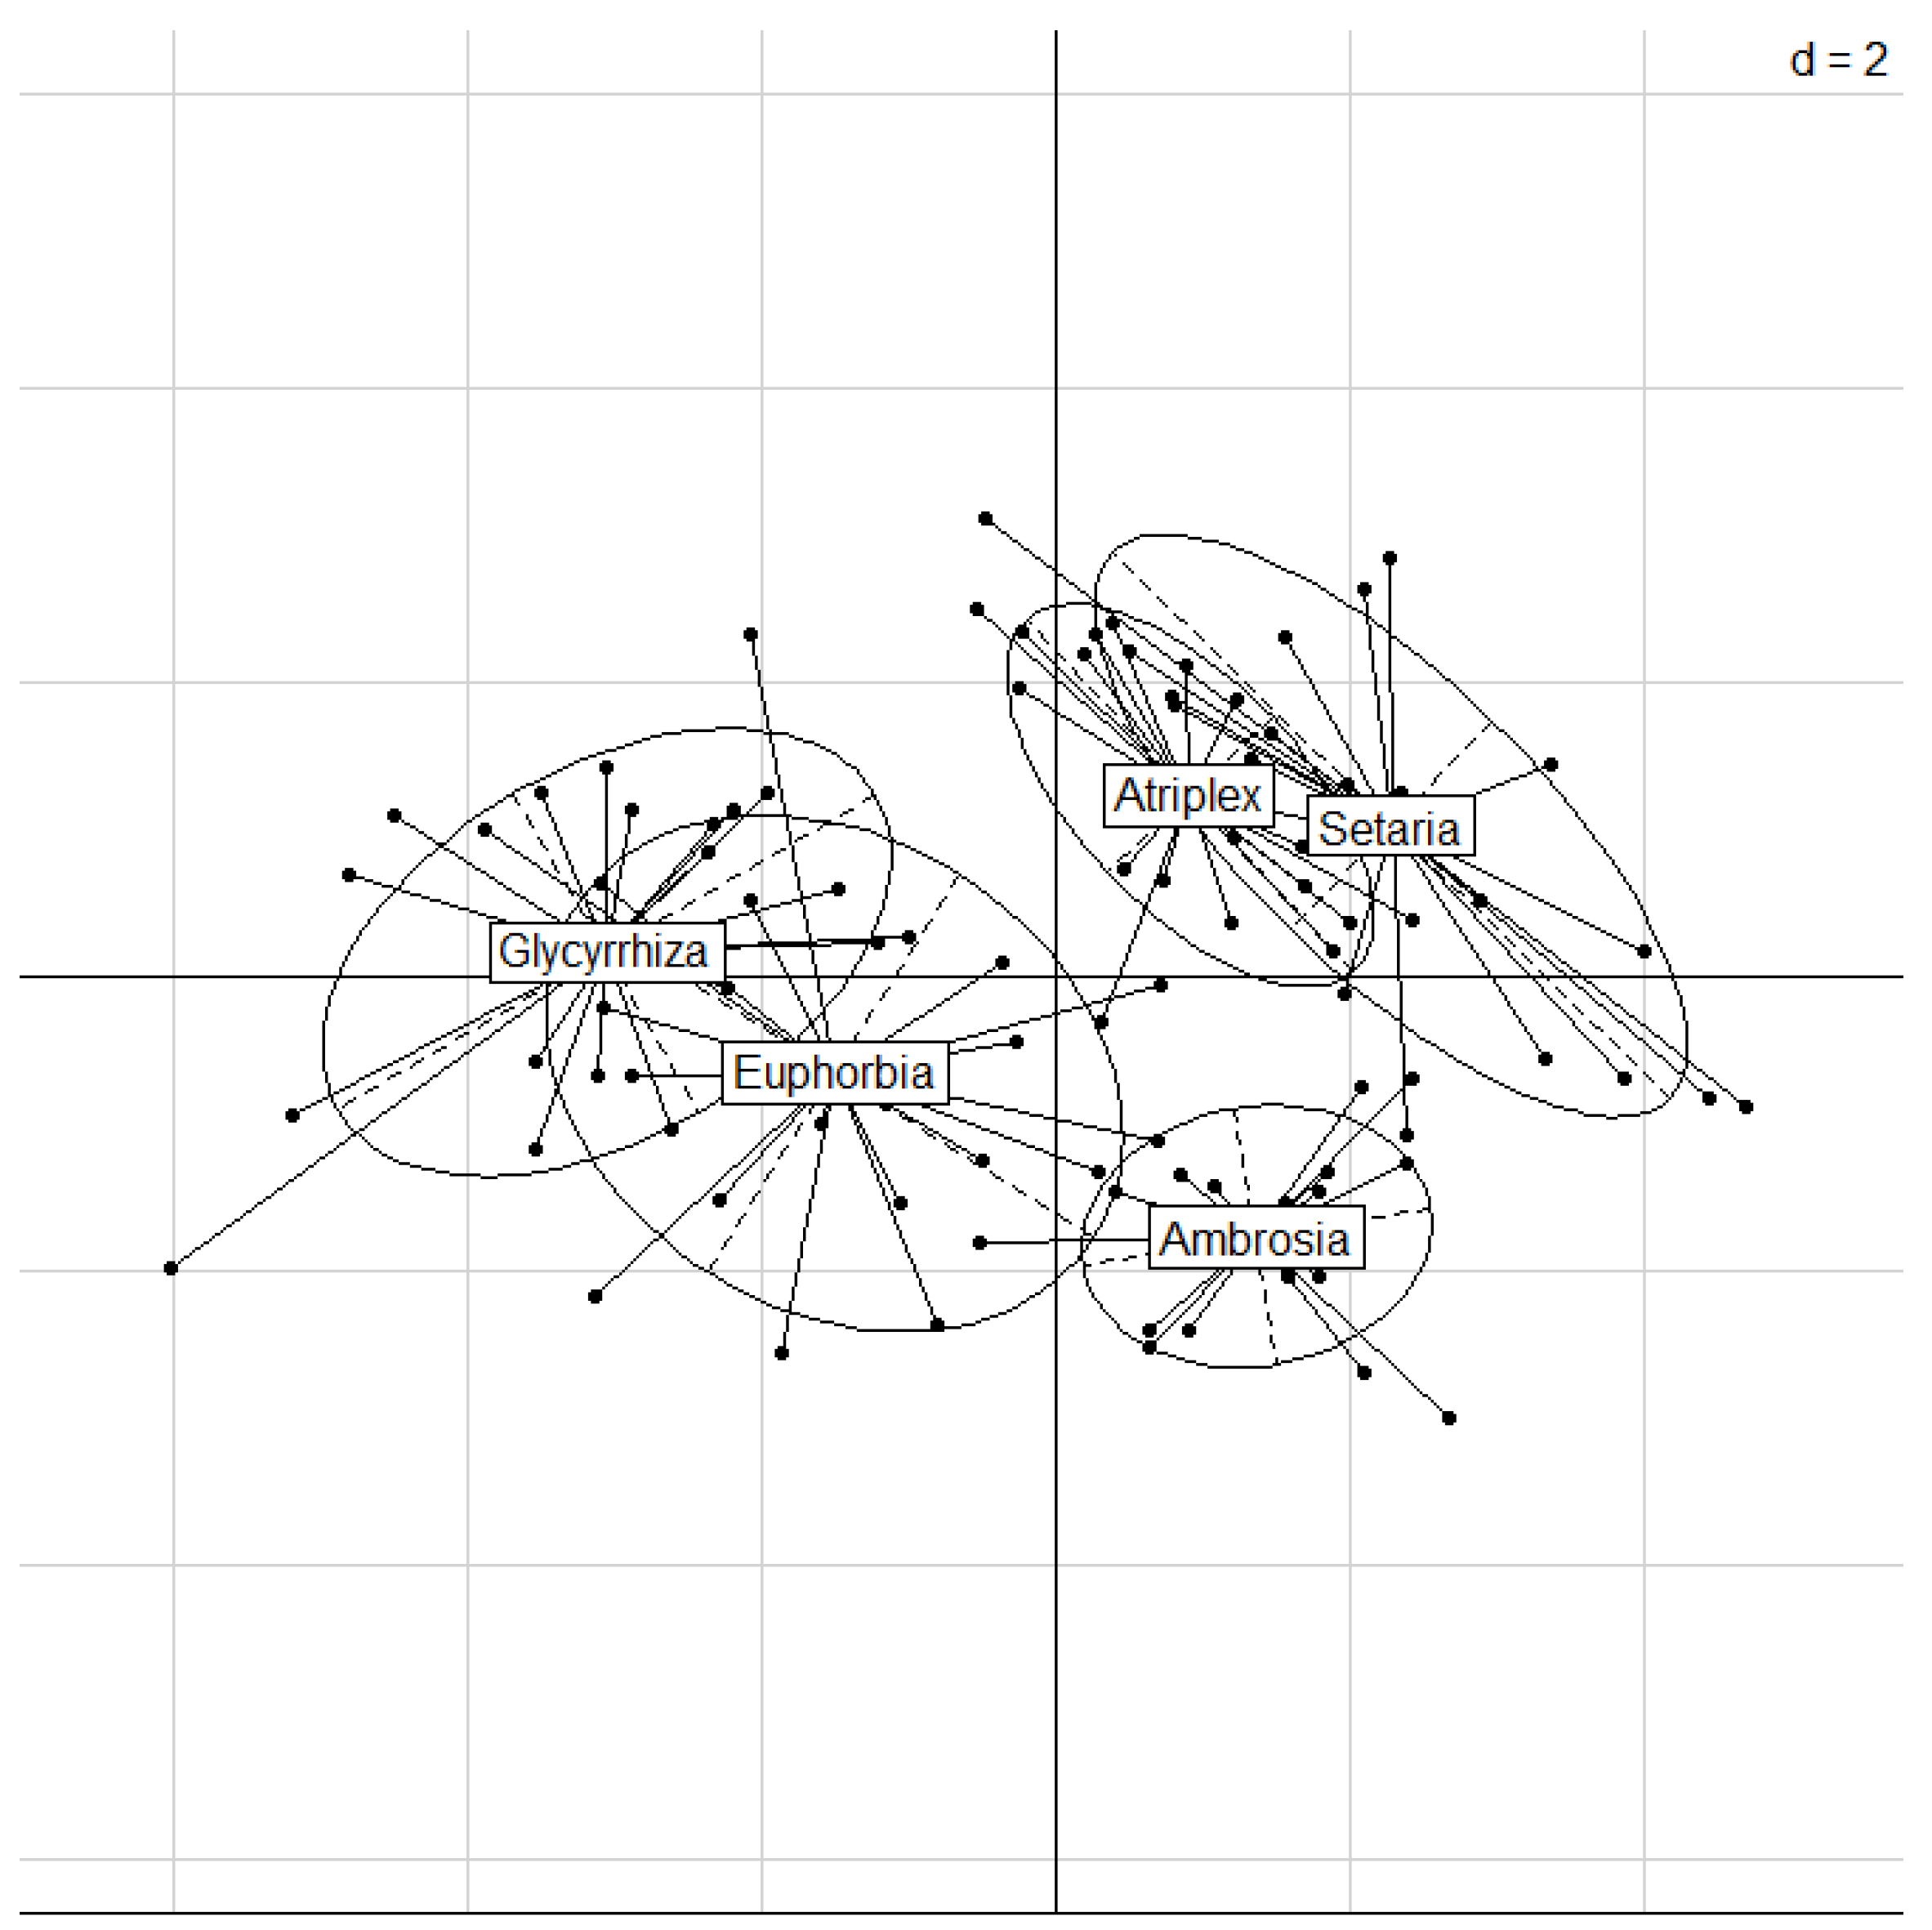
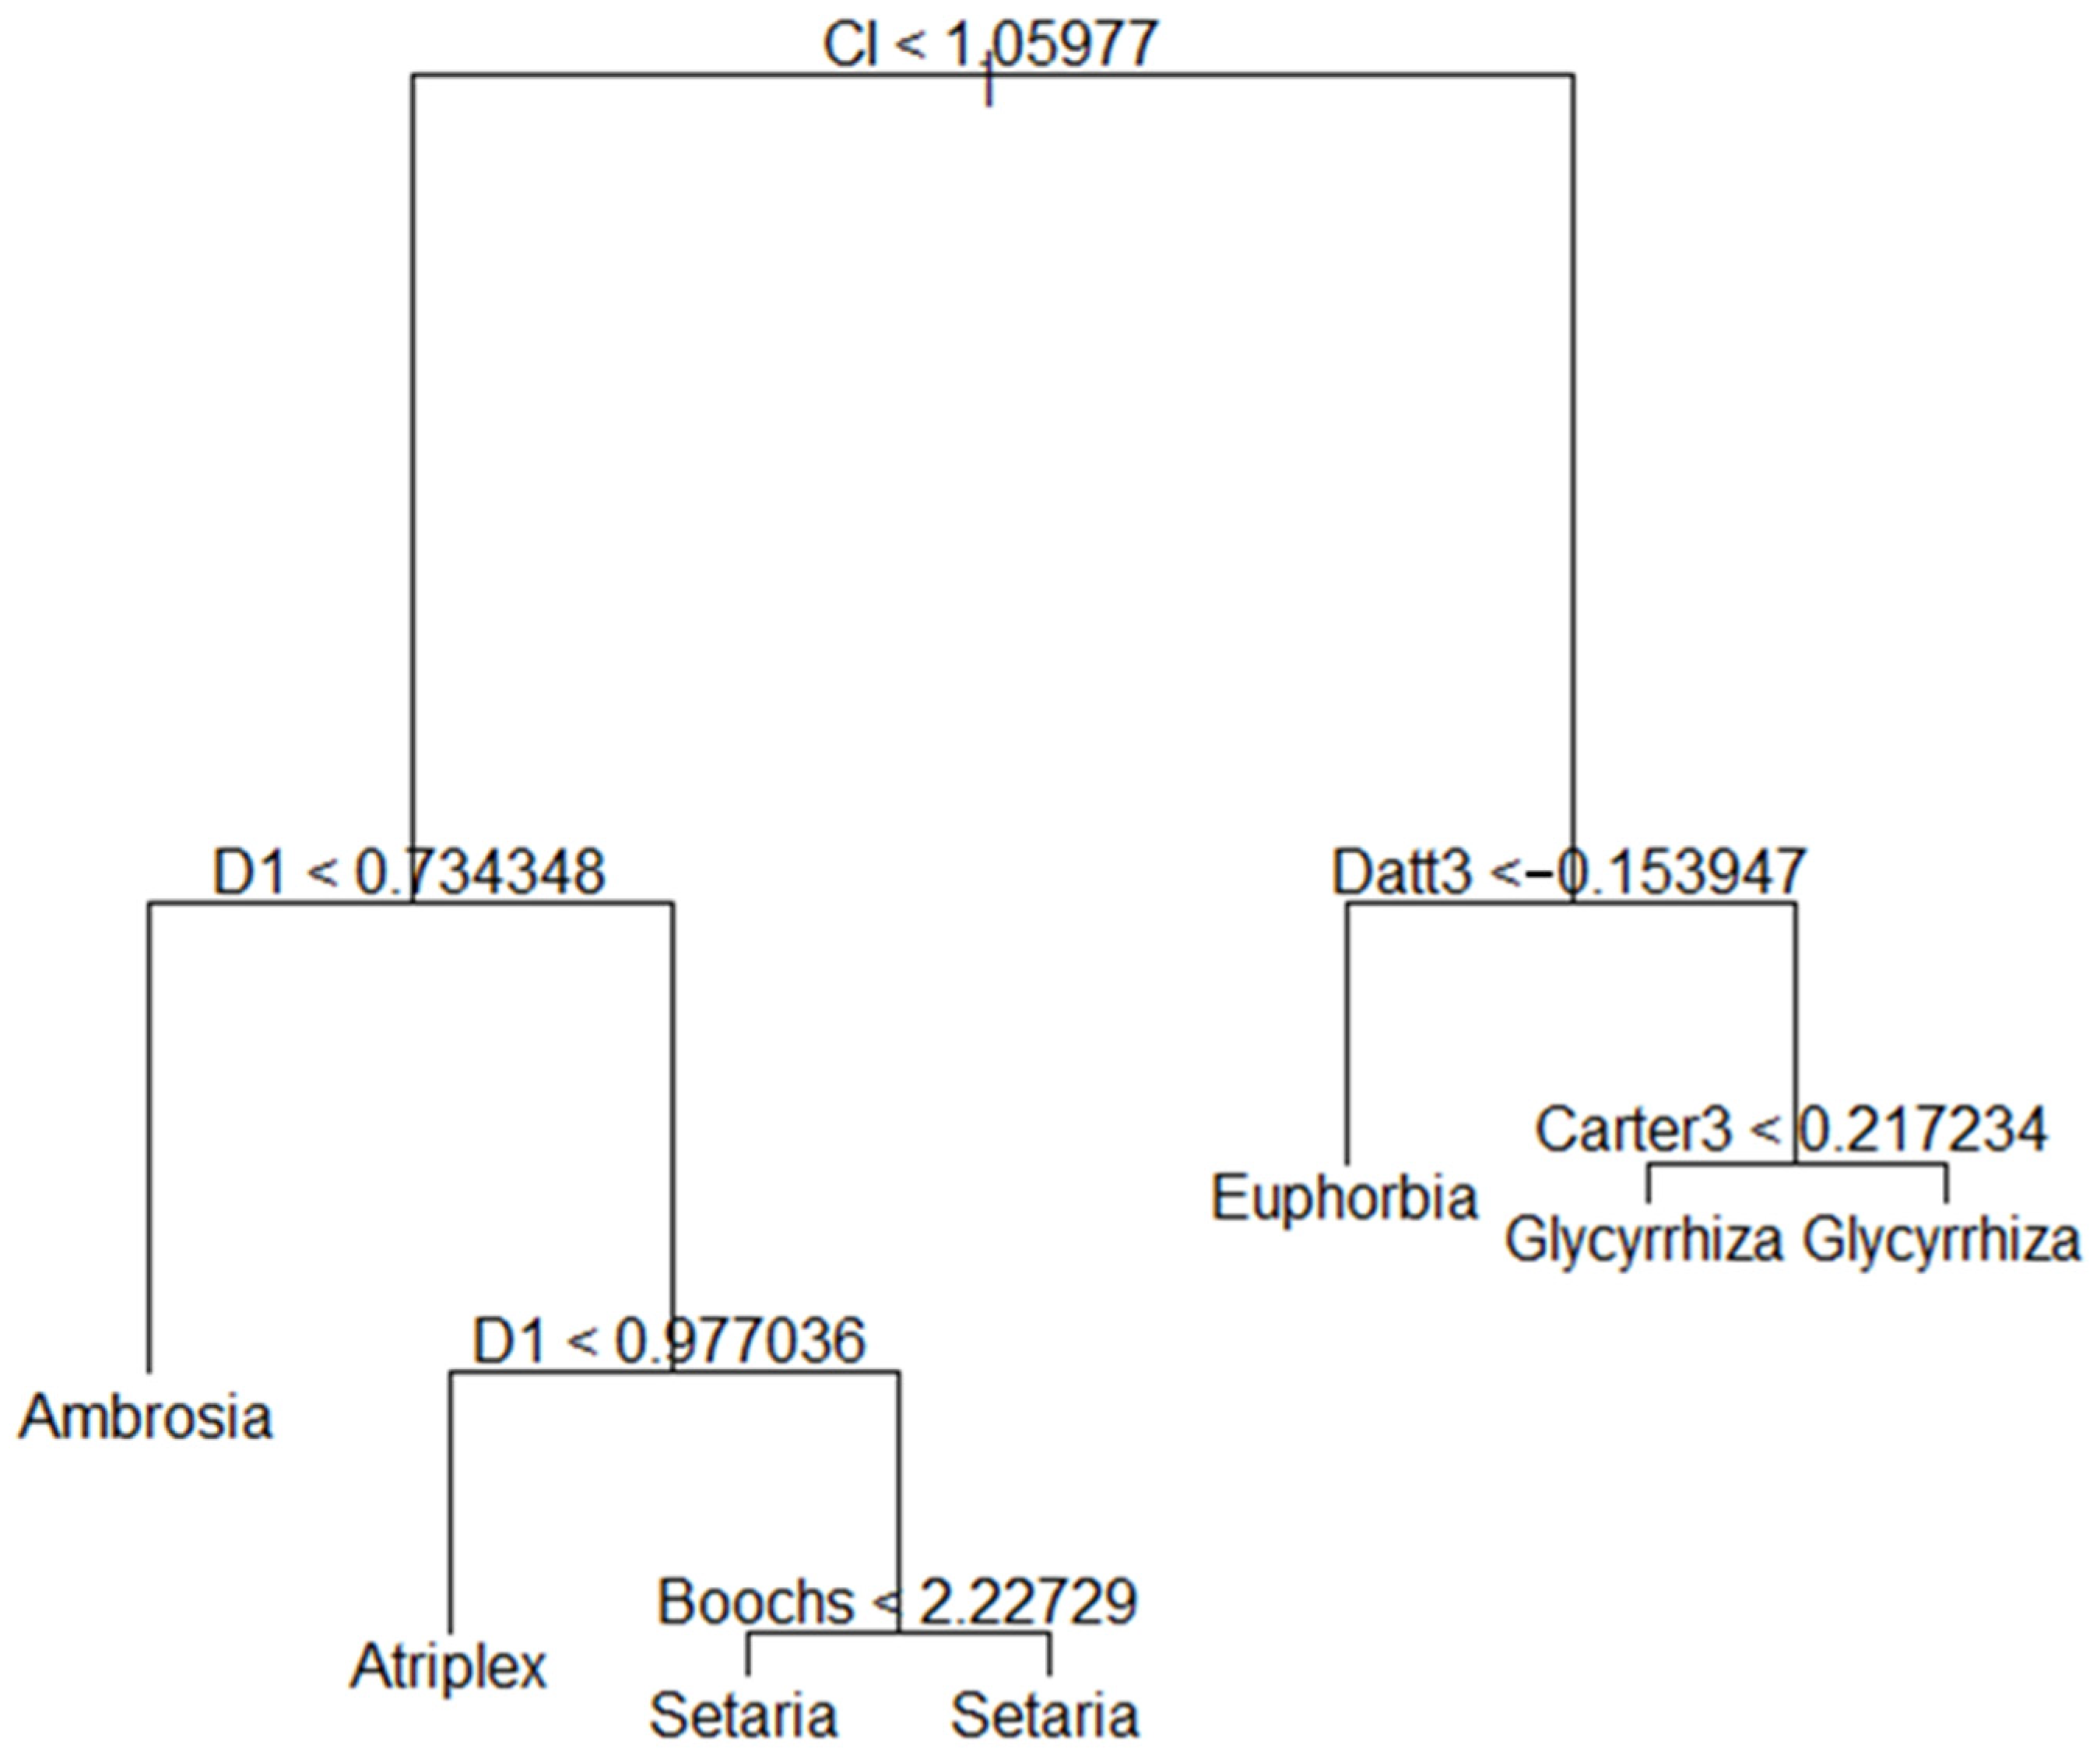
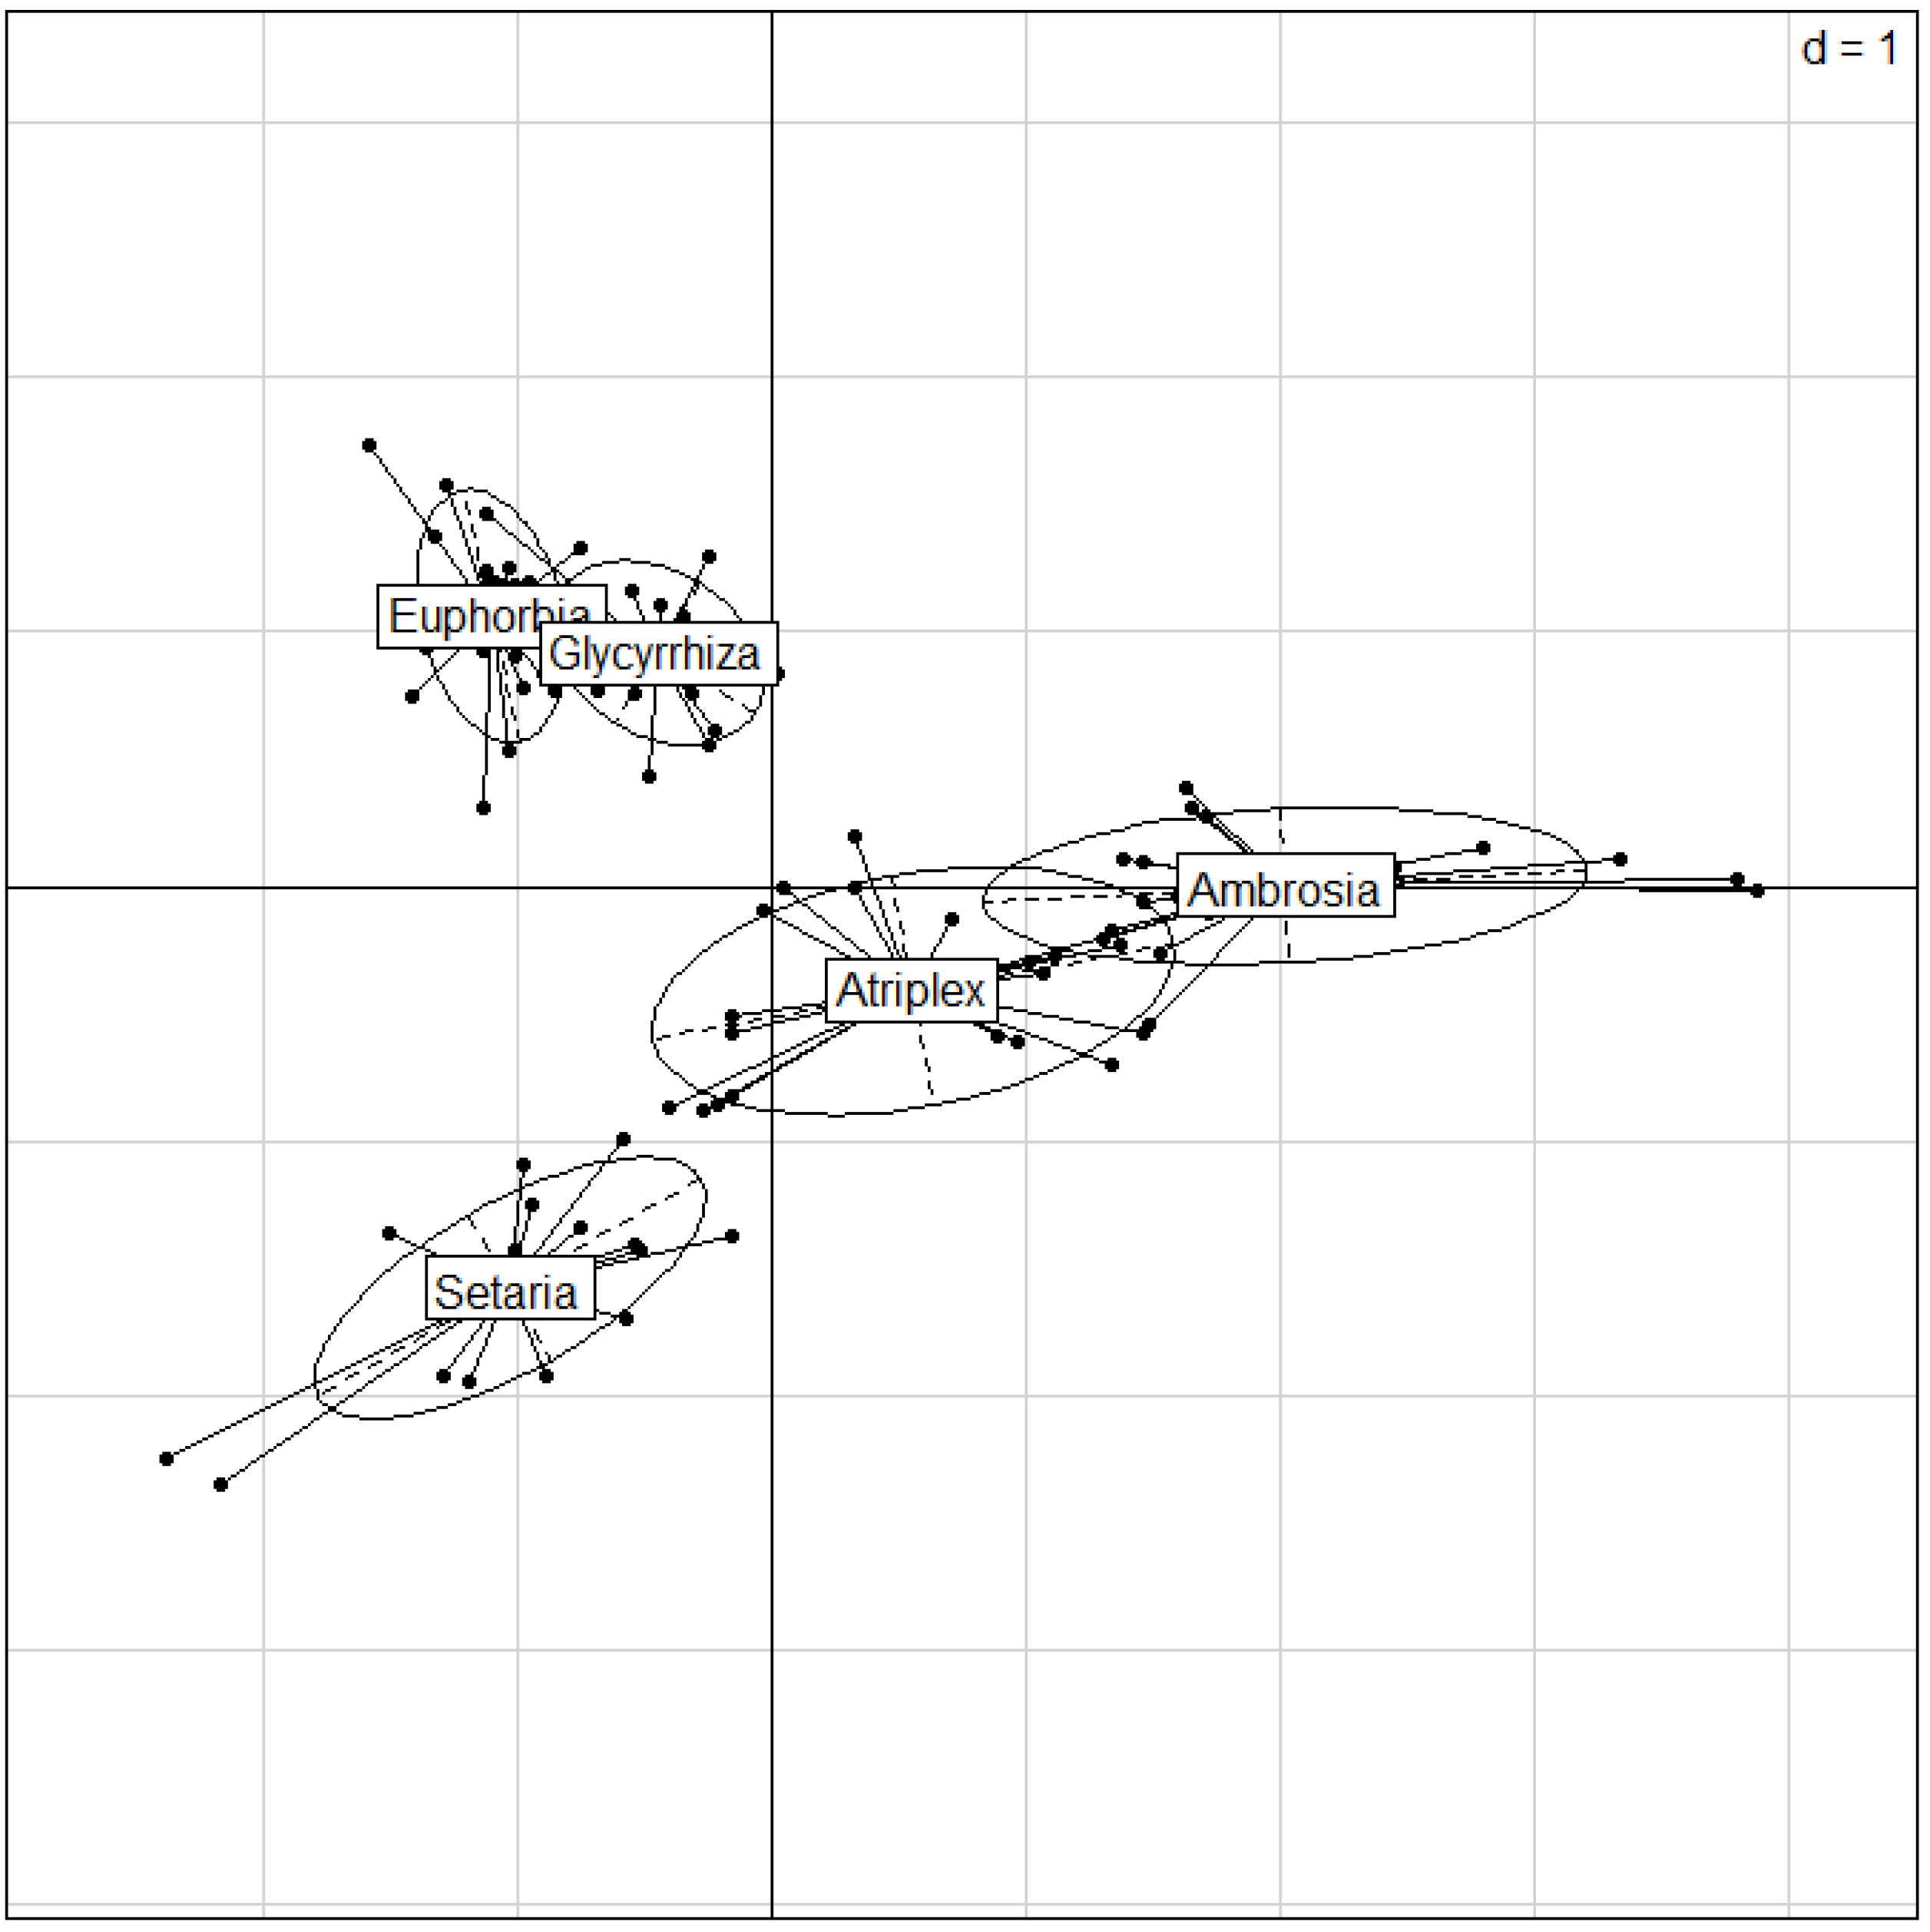
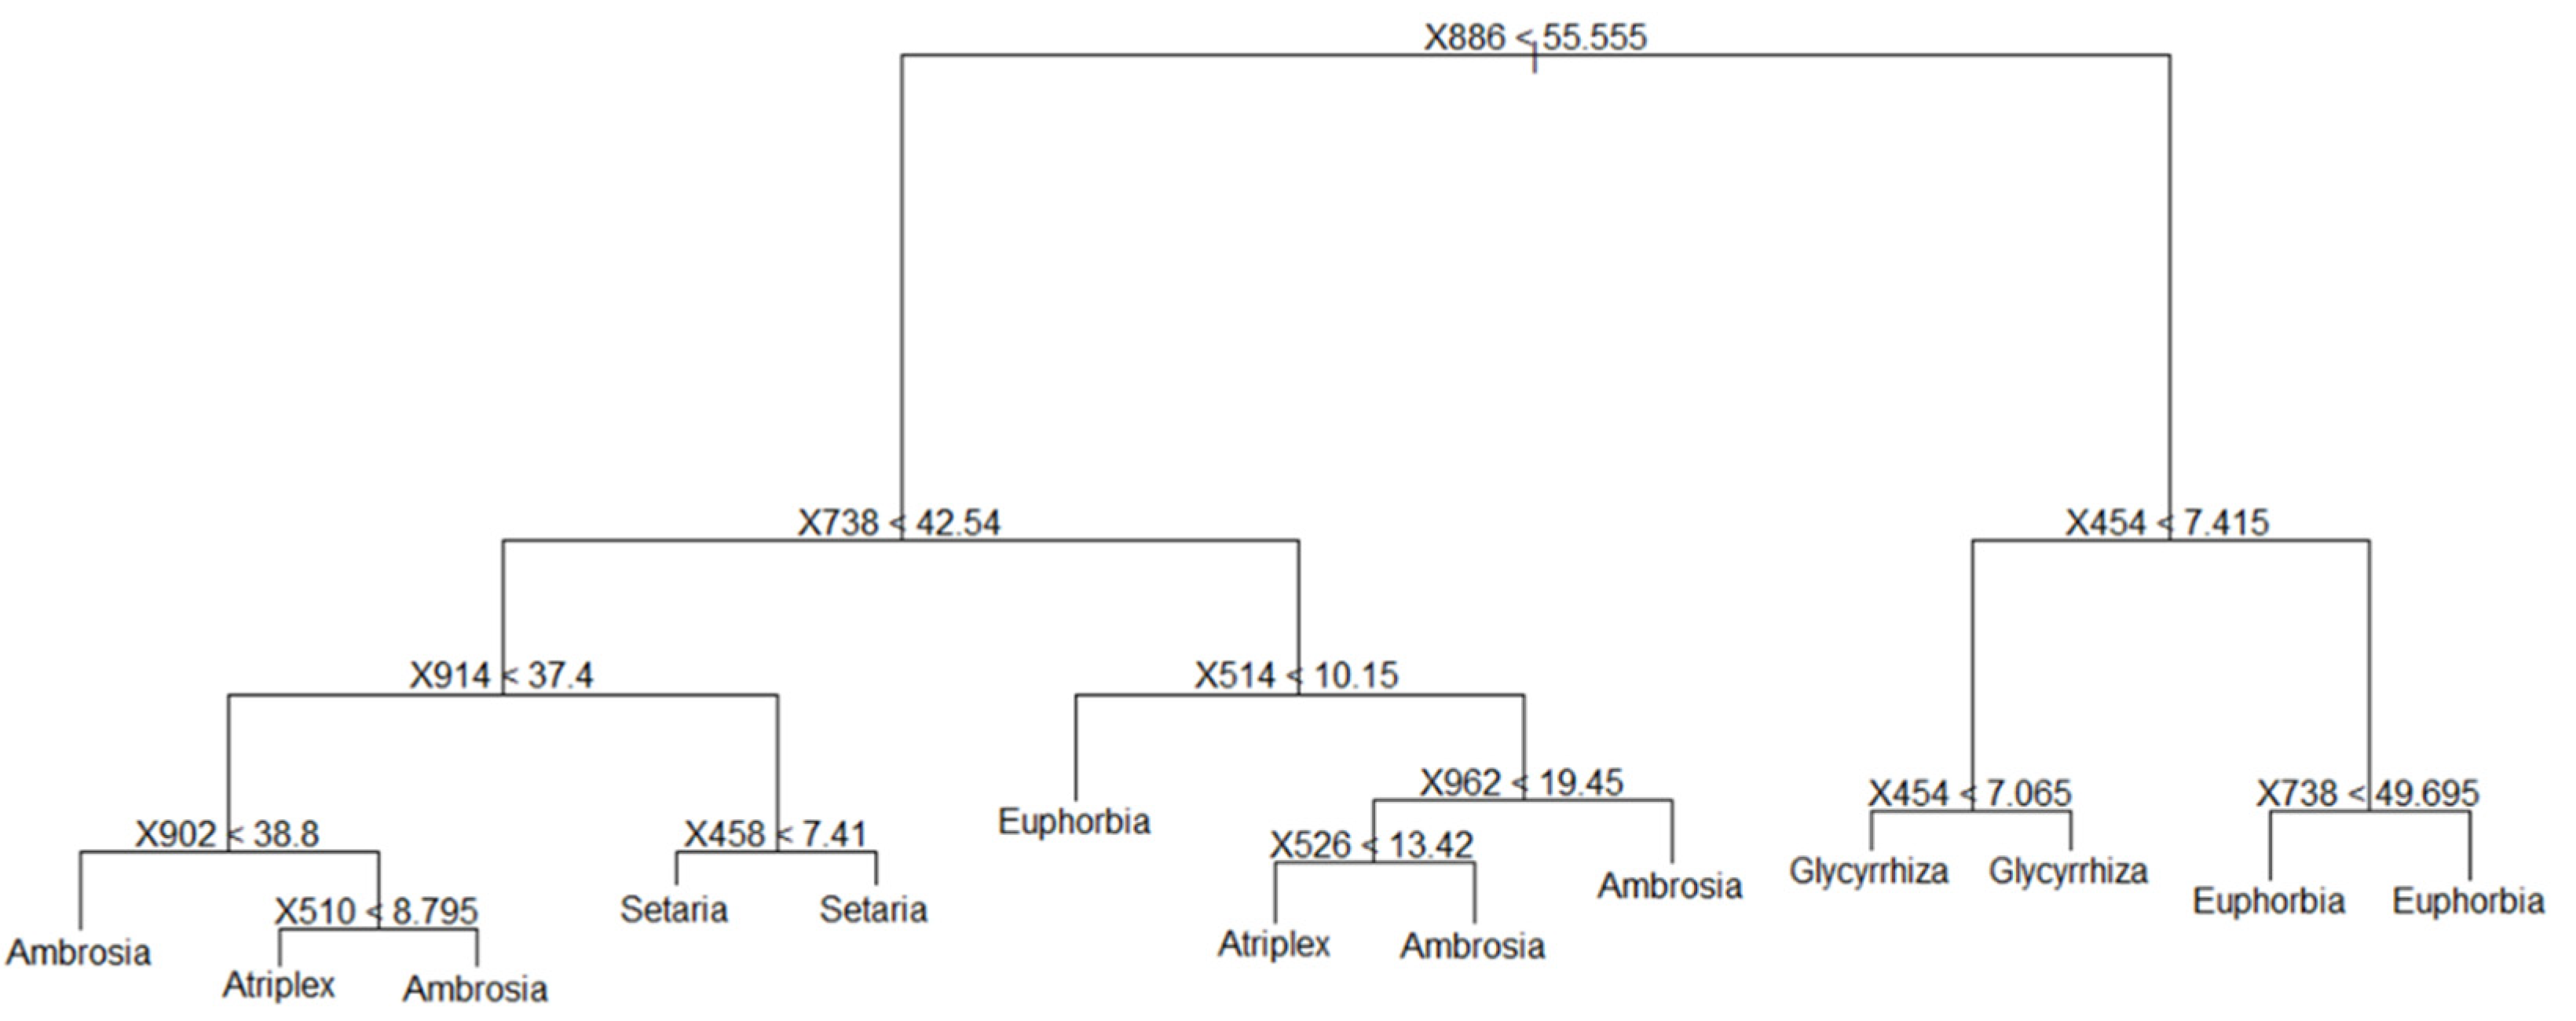

| Technology | MPS |
|---|---|
| The number of spectral channels | 125 |
| Spectral productivity | 2500 spectra |
| Spectral range | 450–950 nm |
| Spectral resolution | 4 nm |
| Type of the camera | Frame |
| Sensor type | Si CCD |
| Signal width | 12 bit |
| Signal to noise ratio | 58 dB |
| Dynamic range | 68 dB |
| Focal length | 10 mm |
| Index Name | Formula for Calculating | References |
|---|---|---|
| Boochs | D703 | [34] |
| Boochs2 | D720 | [34] |
| CARI | R700 × abs(a × 670 + R670 + b)/R670 × (a2 + 1) × 0.5 a = (R700 × R550)/150, b = R550 − (a × 550) | [35] |
| Carter2 | R695/R760 | [36] |
| Carter3 | R605/R760 | [36] |
| Carter4 | R710/R760 | [36] |
| Carter5 | R695/R670 | [36] |
| Carter6 | R550 | [36] |
| CI | R675 × R690/R2683 | [37] |
| CI2 | R760/R700 − 1 | [38] |
| ClAInt | [39] | |
| CRI1 | 1/R515 − 1/R550 | [38] |
| CRI2 | 1/R515 − 1/R770 | [38] |
| CRI3 | 1/R515 − 1/R550 × R770 | [38] |
| CRI4 | 1/R515 − 1/R700 × R770 | [38] |
| D1 | D730/D706 | [37] |
| D2 | D705/D722 | [37] |
| Datt | (R850 − R710)/(R850 − R680) | [40] |
| Datt2 | R850/R710 | [40] |
| Datt3 | D754/D704 | [40] |
| Datt4 | R672/(R550 × R708) | [41] |
| Datt5 | R672/R550 | [41] |
| Datt6 | R860/R550 × R708 | [41] |
| DD | (R749 − R720) − (R701 − R672) | [42] |
| DDn | 2 × (R710 − R660 − R760) | [42] |
| DPI | D688 × D710/D2697 | [37] |
| DWSI4 | R550/R680 | [43] |
| EGFN | (max(D650:750) + max(D500:550))/(max(D650:750) + max(D500:550)) | [44] |
| EGFR | max(D650:750)/max(D500:550) | [44] |
| EVI | 2.5 × ((R800 − R670)/(R800 − 6 × R670 − 7.5 × R475 + 1)) | [45] |
| GI | R554/R677 | [46] |
| Gitelson | 1/R700 | [47] |
| Gitelson2 | (R750 − R800/R695 − R740) − 1 | [38] |
| GMI1 | R750/R550 | [38] |
| GMI2 | R750/R700 | [38] |
| Green NDVI | (R800 − R550)/(R800 + R550) | [48] |
| Maccioni | (R780 − R710)/(R780 − R680) | [49] |
| MCARI | ((R700 − R670) − 0.2 × (R700 − R550)) × (R700 − R670) | [50] |
| MCARI2 | ((R700 − R670) − 0.2 × (R700 − R550)) × (R700/R670) | [50] |
| MPRI | (R515 − R530)/(R515 + R530) | [51] |
| MSAVI | 0.5 × (2 × R800 + 1 − ((2 × R800 + 1)2 − 8 × (R800 − R670))0.5) | [52] |
| mSR2 | (R750/R705) − 1/(R750/R705 + 1) × 0.5 | [53] |
| MTCI | (R754 − R709)/(R709 − R681) | [54] |
| MTVI | 1.2 × (1.2 × (R800 − R550) − 2.5 × (R670 − R550)) | [55] |
| NDVI | (R800 − R680)/(R800 + R680) | [56] |
| NDVI2 | (R750 − R705)/(R750 + R705) | [57] |
| NDVI3 | (R682 − R553)/(R682 + R553) | [58] |
| OSAVI | (1 + 0.16) × (R800 − R670)/(R800 + R670 + 0.16) | [59] |
| OSAVI2 | (1 + 0.16) × (R750 − R705)/(R750 + R705 + 0.16) | [60] |
| PARS | R746/R513 | [61] |
| PRI | (R531 − R570)/(R531 + R570) | [62] |
| PRI_norm | PRI × (−1)/(RDVI × R700/R670) | [63] |
| PRI*CI2 | PRI × CI2 | [64] |
| PSRI | (R678 − R500)/R750 | [65] |
| PSSR | R800/R635 | [66] |
| PSND | (R800 − R470)/(R800 − R470) | [66] |
| RDVI | (R800 − R670)/(R800 + R670)0.5 | [67] |
| REP_Li | 700 + 40 × ((Rre − R700)/(R740 − R700)Rre = (R670 − R780)/2 | [68] |
| SAVI | (1 + L)/(R800 − R670)/(R800 + R670 + L) | [69] |
| SPVI | 0.4 × 3.7 × (R800 − R670) − 1.2 × ((R530 − R670)2) × 0.5 | [70] |
| SR | R800/R680 | [71] |
| SR1 | R750/R700 | [72] |
| SR2 | R752/R690 | [72] |
| SR3 | R750/R550 | [72] |
| SR4 | R700/R670 | [73] |
| SR5 | R675/R700 | [61] |
| SR6 | R750/R710 | [74] |
| SR8 | R515/R550 | [75] |
| Sum_Dr1 | [76] | |
| Sum_Dr2 | [77] | |
| TCARI | 3 × ((R700 − R670) − 0.2 × (R700 − R550) × (R700/R670)) | [55] |
| TCARI/OSAVI | TCARI/OSAVI | [55] |
| TCARI2 | 3 × ((R750 − R705) − 0.2 × (R750 − R550) × (R750/R705)) | [60] |
| TCARI2/OSAVI2 | TCARI2/OSAVI2 | [60] |
| TGI | –0.5 × (190 × (R670 − R550) − 120 × (R670 − R480)) | [78] |
| TVI | 0.5 × (120 × (R750 − R550) − 200 × (R670 − R550)) | [79] |
| Vogelmann | R740/R720 | [80] |
| Vogelmann2 | (R734 − R747)/(R715 + R726) | [80] |
| Vogelmann3 | D715/D705 | [80] |
| Vogelmann4 | (R734 − R747)/(R715 + R720) | [80] |
| Species | Ambrosia | Atriplex | Euphorbia | Glycyrrhiza | Setaria |
|---|---|---|---|---|---|
| Ambrosia | - | 50 | 69 | 76 | 40 |
| Atriplex | 50 | - | 57 | 65 | 54 |
| Euphorbia | 69 | 57 | - | 54 | 61 |
| Glycyrrhiza | 76 | 65 | 54 | - | 68 |
| Setaria | 40 | 54 | 61 | 68 | - |
| Compared Species | Vegetation Index (VI) |
|---|---|
| Ambrosia vs. Atriplex | Boochs2, CARI, Carter2, Carter3, Carter4, Carter5, CI, CI2, CRI3, CRI4, D1, D2, Datt, Datt2, Datt4, Datt6, DD, EGFN, EGFR, Gitelson, GMI1, GMI2, Green_NDVI, Maccioni, MCARI, MCARI2, mSR2, MTCI, NDVI, NDVI2, OSAVI2, PRI.CI2, PSRI, PSSR, REP_Li, SR, SR1, SR2, SR3, SR4, SR6, SR8, TCARI, TCARI.OSAVI, TCARI2, TGI, Vogelmann, Vogelmann2, Vogelmann3, and Vogelmann4 |
| Ambrosia vs. Euphorbia | Boochs, Boochs2, Carter2, Carter3, Carter4, CI, CI2, CRI1, CRI3, CRI4, D1, D2, Datt, Datt2, Datt3, Datt4, Datt5, Datt6, DD, DDn, DPI, DWSI4, EGFN, EGFR, EVI, GI, Gitelson2, GMI1, GMI2, Green_NDVI, Maccioni, MCARI, MCARI2, MSAVI, mSR2, MTCI, MTVI, NDVI, NDVI2, NDVI3, OSAVI, OSAVI2, PARS, PRI, PRI.CI2, PRI_norm, PSND, PSRI, PSSR, RDVI, REP_Li, SAVI, SPVI, SR, SR1, SR2, SR3, SR4, SR5, SR6, SR8, Sum_Dr1, Sum_Dr2, TCARI2, TCARI2.OSAVI2, TVI, Vogelmann, Vogelmann2, and Vogelmann4 |
| Ambrosia vs. Glycyrrhiza | Boochs, Boochs2, Carter2, Carter3, Carter4, Carter5, Carter6, CI, CI2, ClAInt, CRI1, CRI2, CRI3, CRI4, D1, D2, Datt, Datt2, Datt3, Datt4, Datt5, Datt6, DD, DDn, DPI, DWSI4, EGFN, EGFR, EVI, GI, Gitelson, Gitelson2, GMI1, GMI2, Green_NDVI, Maccioni, MCARI, MCARI2, MPRI, MSAVI, mSR2, MTCI, MTVI, NDVI, NDVI2, NDVI3, OSAVI, OSAVI2, PARS, PRI, PRI.CI2, PRI_norm, PSND, PSRI, PSSR, RDVI, REP_Li, SAVI, SPVI, SR, SR1, SR2, SR3, SR4, SR5, SR6, SR8, Sum_Dr1, Sum_Dr2, TCARI.OSAVI, TCARI2, TVI, Vogelmann, Vogelmann2, Vogelmann3, and Vogelmann4 |
| Ambrosia vs. Setaria | Boochs, CARI, Carter5, D1, D2, Datt, Datt2, Datt3, Datt4, Datt5, Datt6, DD, DPI, DWSI4, EGFN, EGFR, GI, Maccioni, MCARI, MTCI, MTVI, NDVI3, PRI, PRI.CI2, PRI_norm, PSRI, RDVI, REP_Li, SPVI, SR4, SR5, Sum_Dr2, TCARI, TCARI.OSAVI, TCARI2.OSAVI2, TGI, TVI, Vogelmann, Vogelmann2, and Vogelmann4 |
| Atriplex vs. Euphorbia | Boochs, Boochs2, CARI, Carter3, Carter5, Carter6, CI, CRI1, D1, D2, Datt, Datt3, Datt4, Datt5, DD, DPI, DWSI4, EGFN, EGFR, EVI, GI, Gitelson, Gitelson2, Maccioni, MCARI, MCARI2, MSAVI, MTCI, MTVI, NDVI, NDVI3, OSAVI, PARS, PRI, PRI.CI2, PRI_norm, PSND, PSRI, PSSR, RDVI, REP_Li, SAVI, SPVI, SR, SR2, SR4, SR5, SR8, Sum_Dr1, Sum_Dr2, TCARI, TCARI. OSAVI, TCARI2, TCARI2.OSAVI2, TGI, TVI, and Vogelmann3 |
| Atriplex vs. Glycyrrhiza | Boochs, Boochs2, CARI, Carter2, Carter3, Carter4, Carter5, CI, CI2, CRI1, CRI2, CRI3, CRI4, D2, Datt2, Datt3, Datt4, Datt5, DPI, DWSI4, EGFN, EGFR, EVI, GI, Gitelson2, GMI1, GMI2, Green_NDVI, MCARI, MCARI2, MPRI, MSAVI, mSR2, MTVI, NDVI, NDVI2, NDVI3, OSAVI, OSAVI2, PARS, PRI, PRI.CI2, PRI_norm, PSND, PSRI, PSSR, RDVI, SAVI, SPVI, SR, SR1, SR2, SR3, SR4, SR5, SR6, SR8, Sum_Dr1, Sum_Dr2, TCARI, TCARI2, TGI, TVI, Vogelmann, and Vogelmann3 |
| Atriplex vs. Setaria | Boochs, Boochs2, Carter2, Carter3, Carter4, Carter5, CI, CI2, CRI3, CRI4, D1, Datt3, Datt4, Datt5, DPI, DWSI4, EGFN, EGFR, EVI, GI, GMI1, GMI2, MCARI, MCARI2, MSAVI, mSR2, MTVI, NDVI, NDVI2, NDVI3, OSAVI, OSAVI2, PRI, PRI.CI2, PRI_norm, PSRI, PSSR, RDVI, SAVI, SPVI, SR, SR1, SR2, SR3, SR4, SR5, SR6, SR8, Sum_Dr1, Sum_Dr2, TCARI, TCARI2, TVI, and Vogelmann3 |
| Euphorbia vs. Glycyrrhiza | Boochs2, Carter2, Carter3, Carter4, Carter5, Carter6, CI2, ClAInt, CRI1, CRI2, CRI3, CRI4, D2, Datt, Datt2, Datt3, Datt6, DD, DPI, EVI, Gitelson, GMI1, GMI2, Green_NDVI, Maccioni, MCARI2, MPRI, MSAVI, mSR2, MTCI, NDVI, NDVI2, OSAVI, OSAVI2, PARS, PSND, PSSR, RDVI, REP_Li, SAVI, SR, SR1, SR2, SR3, SR4, SR5, SR6, SR8, TCARI.OSAVI, TCARI2.OSAVI2, Vogelmann, Vogelmann2, Vogelmann3, and Vogelmann4 |
| Euphorbia vs. Setaria | Boochs, Boochs2, CARI, Carter2, Carter3, Carter4, Carter5, CI, CI2, CRI1, CRI3, CRI4, D1, Datt, Datt4, Datt5, DDn, DWSI4, EVI, GI, Gitelson2, GMI1, GMI2, Green_NDVI, MCARI, MCARI2, MSAVI, mSR2, MTVI, NDVI, NDVI2, NDVI3, OSAVI, OSAVI2, PARS, PRI, PRI.CI2, PRI_norm, PSND, PSRI, PSSR, RDVI, SAVI, SPVI, SR, SR1, SR2, SR3, SR4, SR5, SR6, SR8, Sum_Dr1, Sum_Dr2, TCARI, TCARI.OSAVI, TCARI2, TCARI2.OSAVI2, TGI, TVI, and Vogelmann |
| Glycyrrhiza vs. Setaria | Boochs, Boochs2, CARI, Carter2, Carter3, Carter4, Carter5, CI, CI2, ClAInt, CRI1, CRI2, CRI3, CRI4, D1, Datt, Datt2, Datt3, Datt4, Datt5, Datt6, DDn, DPI, DWSI4, EVI, GI, Gitelson2, GMI1, GMI2, Green_NDVI, MCARI, MCARI2, MPRI, MSAVI, mSR2, MTVI, NDVI, NDVI2, NDVI3, OSAVI, OSAVI2, PARS, PRI, PRI.CI2, PRI_norm, PSND, PSRI, PSSR, RDVI, SAVI, SPVI, SR, SR1, SR2, SR3, SR4, SR5, SR6, SR8, Sum_Dr1, Sum_Dr2, TCARI, TCARI2, TCARI2.OSAVI2, TGI, TVI, Vogelmann, and Vogelmann3 |
| Statistics | Comp.1 | Comp.2 | Comp.3 | Comp.4 | Comp.5 |
|---|---|---|---|---|---|
| Standard deviation | 7.52233 | 6.207426 | 1.448625 | 1.175973 | 0.51599 |
| Proportion of variance | 0.57157 | 0.389214 | 0.021197 | 0.013969 | 0.002689 |
| Cumulative proportion | 0.57157 | 0.960784 | 0.981981 | 0.99595 | 0.998639 |
| Statistics | Comp.1 | Comp.2 | Comp.3 | Comp.4 | Comp.5 | Comp.6 |
|---|---|---|---|---|---|---|
| Standard deviation | 6.96777 | 4.118203 | 2.448039 | 2.019743 | 1.087375 | 0.979837 |
| Proportion of Variance | 0.613003 | 0.214136 | 0.075668 | 0.051507 | 0.014929 | 0.012122 |
| Cumulative Proportion | 0.613003 | 0.827139 | 0.902807 | 0.954314 | 0.969243 | 0.981365 |
| Statistics | Comp.1 | Comp.2 | Comp.3 |
|---|---|---|---|
| Standard deviation | 2.27126 | 1.503265 | 0.521665 |
| Proportion of variance | 0.651341 | 0.285329 | 0.03436 |
| Cumulative proportion | 0.651341 | 0.93667 | 0.97103 |
| VI | Comp.1 | Comp.2 |
|---|---|---|
| Boochs | 0.405 | 0.191 |
| Datt2 | 0.331 | −0.427 |
| MCARI | 0.367 | 0.336 |
| PRI*CI2 | 0.379 | 0.233 |
| SR8 | −0.364 | −0.219 |
| TVI | 0.417 | 0.124 |
| Vogelmann2 | −0.263 | 0.528 |
| Vogelmann4 | −0.269 | 0.521 |
| Statistics | Comp.1 | Comp.2 | Comp.3 |
|---|---|---|---|
| Standard deviation | 1.282888 | 1.00116 | 0.567342 |
| Proportion of variance | 0.554142 | 0.337482 | 0.108376 |
| Cumulative proportion | 0.554142 | 0.891624 | 1 |
| VI | Comp.1 | Comp.2 |
|---|---|---|
| CI | 0.401 | 0.818 |
| D1 | 0.578 | −0.576 |
| Datt3 | −0.710 | 0 |
| Statistics | Comp.1 | Comp.2 | Comp.3 |
|---|---|---|---|
| Standard deviation | 2.2567781 | 1.7478754 | 0.77501095 |
| Proportion of variance | 0.5716103 | 0.3428809 | 0.06741212 |
| Cumulative proportion | 0.5716103 | 0.9144911 | 0.98190325 |
| Wavelength, nm | Comp.1 | Comp.2 |
|---|---|---|
| 886 | 0.357 | 0.313 |
| 738 | 0.355 | 0.208 |
| 454 | 0.309 | −0.384 |
| 914 | 0.356 | 0.325 |
| 514 | 0.301 | −0.413 |
| 902 | 0.358 | 0.328 |
| 962 | 0.315 | 0.195 |
| 510 | 0.287 | −0.429 |
| 526 | 0.351 | −0.326 |
| Confusion Matrix | Ambrosia | Atriplex | Euphorbia | Glycyrrhiza | Setaria | Class error |
|---|---|---|---|---|---|---|
| Ambrosia | 20 | 0 | 0 | 0 | 0 | 0 |
| Atriplex | 0 | 20 | 0 | 0 | 0 | 0 |
| Euphorbia | 0 | 1 | 16 | 3 | 0 | 0.2 |
| Glycyrrhiza | 0 | 0 | 1 | 19 | 0 | 0.05 |
| Setaria | 0 | 1 | 0 | 0 | 19 | 0.05 |
| Confusion Matrix | Ambrosia | Atriplex | Euphorbia | Glycyrrhiza | Setaria | Class Error |
|---|---|---|---|---|---|---|
| Ambrosia | 20 | 0 | 0 | 0 | 0 | 0 |
| Atriplex | 0 | 20 | 0 | 0 | 0 | 0 |
| Euphorbia | 0 | 0 | 18 | 2 | 0 | 0.10 |
| Glycyrrhiza | 0 | 0 | 2 | 18 | 0 | 0.10 |
| Setaria | 0 | 0 | 0 | 0 | 20 | 0 |
| Confusion Matrix | Ambrosia | Atriplex | Euphorbia | Glycyrrhiza | Setaria | Class Error |
|---|---|---|---|---|---|---|
| Ambrosia | 20 | 0 | 0 | 0 | 0 | 0 |
| Atriplex | 0 | 20 | 0 | 0 | 0 | 0 |
| Euphorbia | 0 | 0 | 18 | 2 | 0 | 0.10 |
| Glycyrrhiza | 0 | 0 | 1 | 19 | 0 | 0.05 |
| Setaria | 0 | 0 | 1 | 0 | 19 | 0.05 |
| Confusion Matrix | Ambrosia | Atriplex | Euphorbia | Glycyrrhiza | Setaria | Class Error |
|---|---|---|---|---|---|---|
| Ambrosia | 20 | 0 | 0 | 0 | 0 | 0 |
| Atriplex | 0 | 20 | 0 | 0 | 0 | 0 |
| Euphorbia | 0 | 0 | 19 | 1 | 0 | 0.10 |
| Glycyrrhiza | 0 | 0 | 1 | 19 | 0 | 0.05 |
| Setaria | 0 | 0 | 2 | 0 | 18 | 0.05 |
| Analysis Method | VI |
|---|---|
| ANOVA, t-критерий | D1, Datt3, PSND |
| Principal component analysis | Boochs, Datt2, MCARI, PRI*CI2, SR8, TVI, Vogelmann2, Vogelmann4 |
| Decision tree | CI, D1, Datt3 |
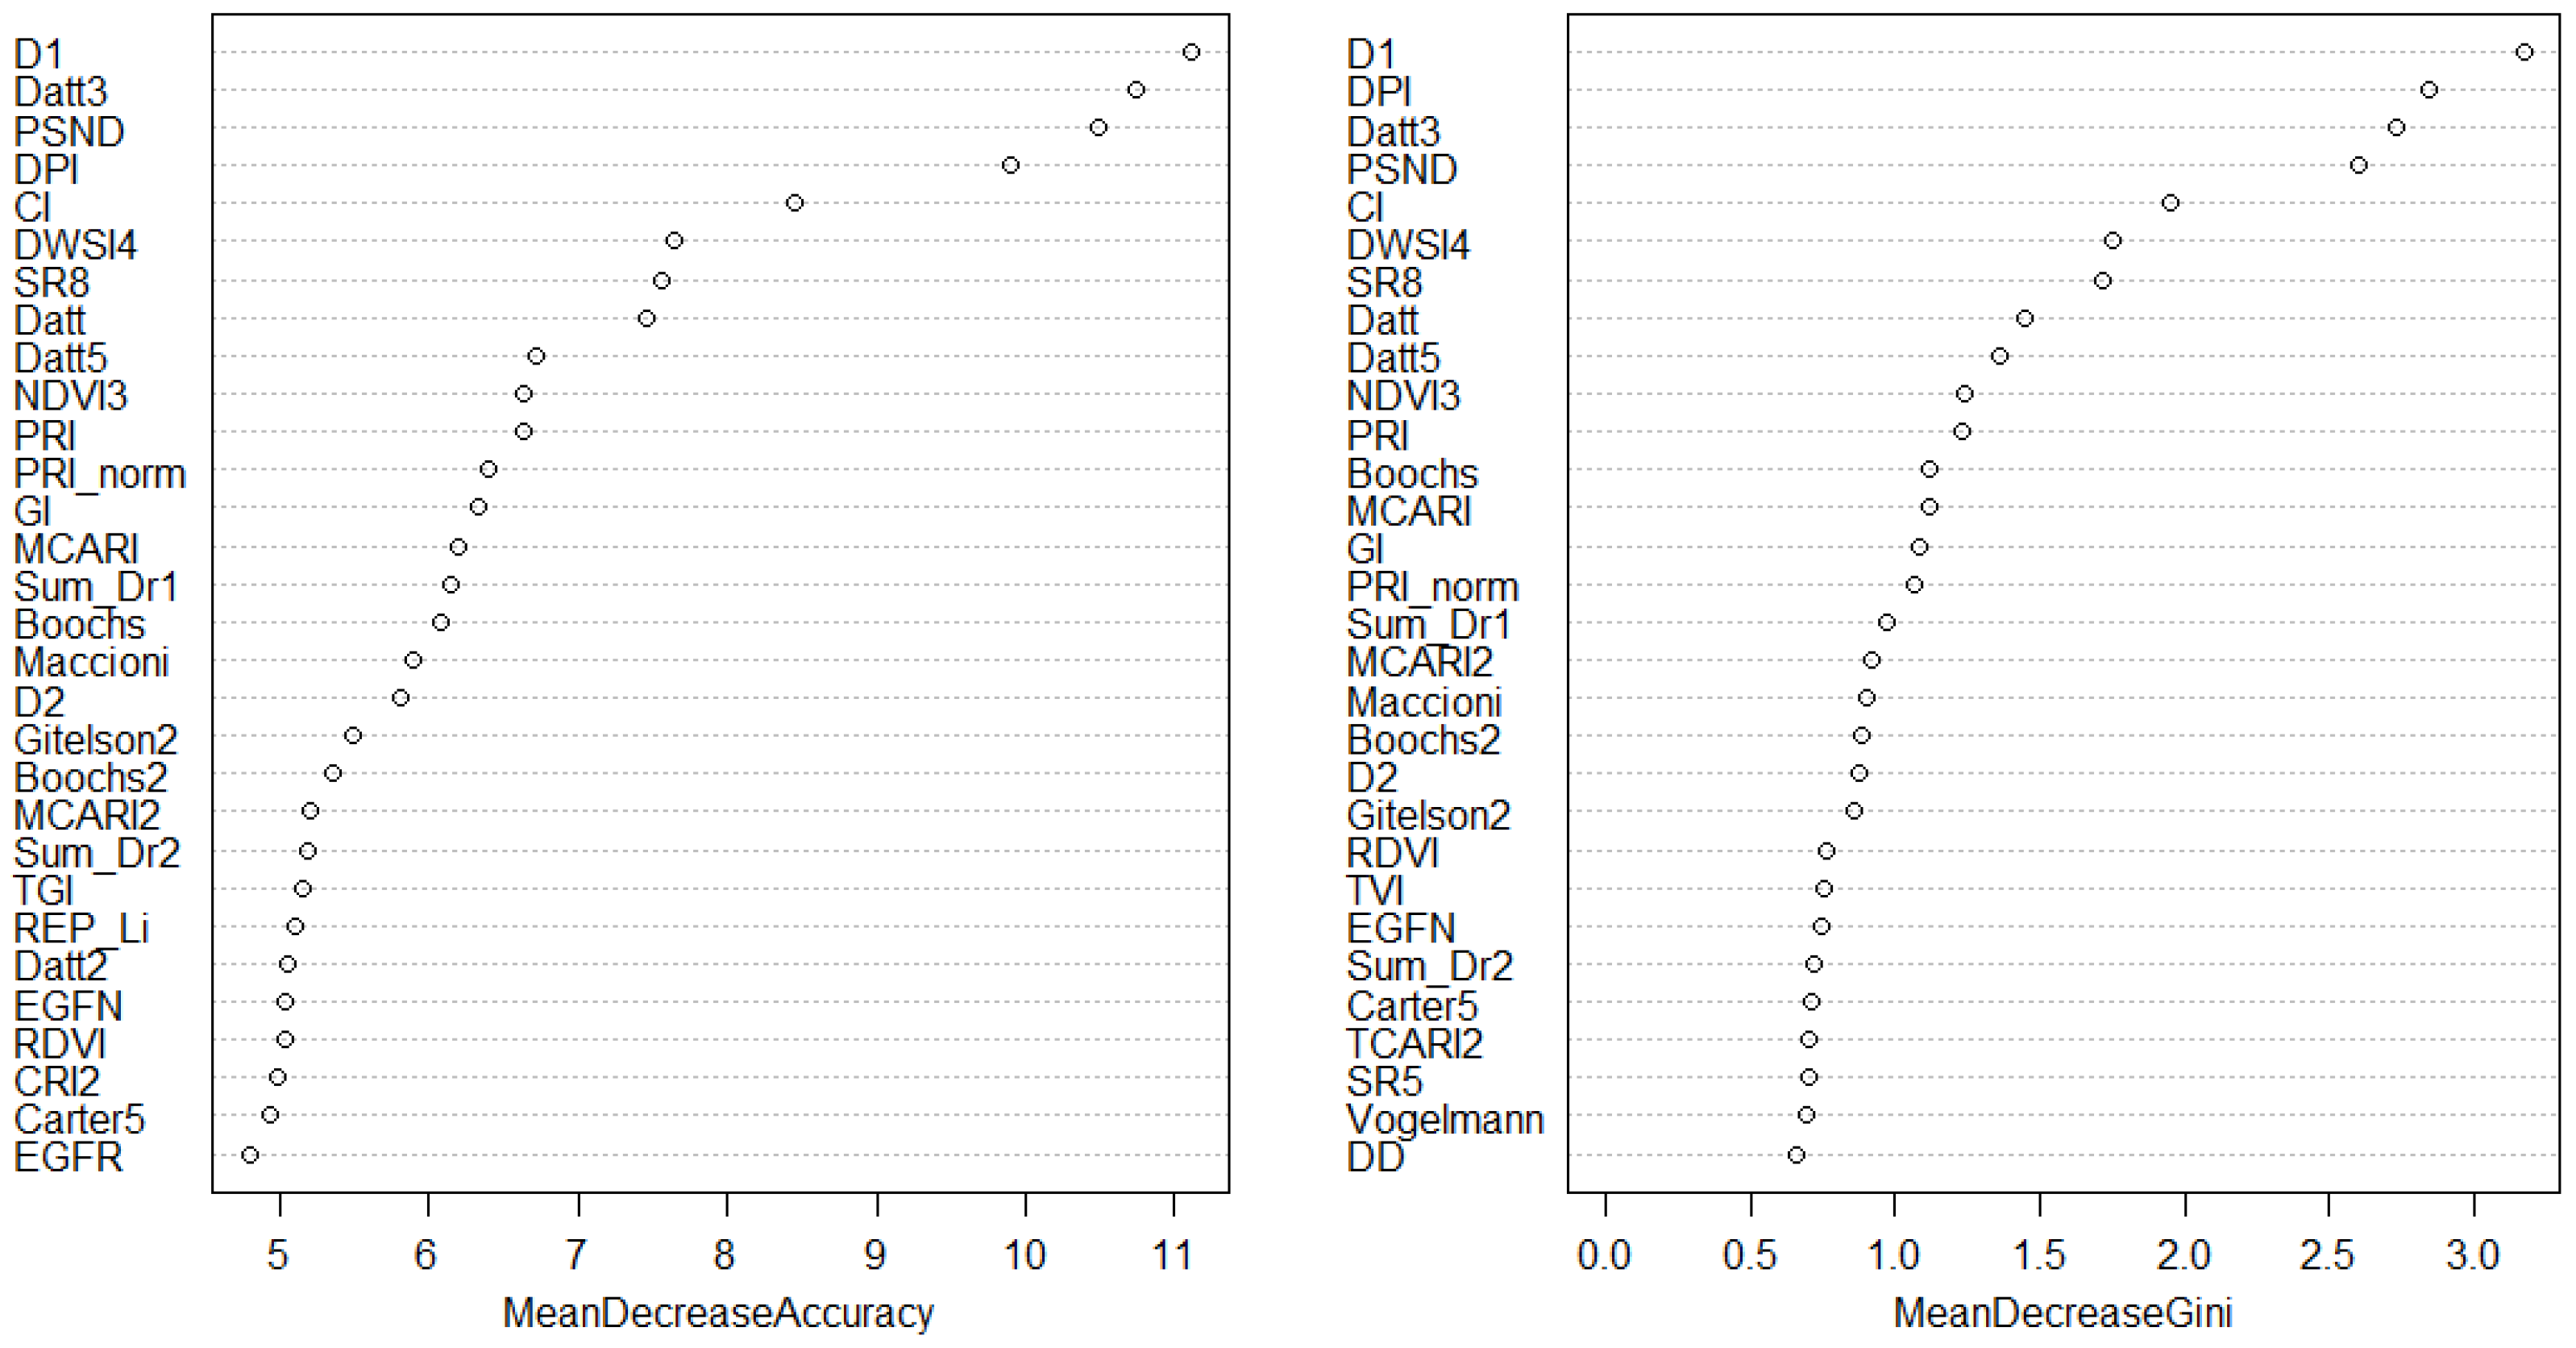
| Random forest | D1, Datt3, PSND, DPI. |
Publisher’s Note: MDPI stays neutral with regard to jurisdictional claims in published maps and institutional affiliations. |
© 2022 by the authors. Licensee MDPI, Basel, Switzerland. This article is an open access article distributed under the terms and conditions of the Creative Commons Attribution (CC BY) license (https://creativecommons.org/licenses/by/4.0/).
Share and Cite
Dmitriev, P.A.; Kozlovsky, B.L.; Kupriushkin, D.P.; Dmitrieva, A.A.; Rajput, V.D.; Chokheli, V.A.; Tarik, E.P.; Kapralova, O.A.; Tokhtar, V.K.; Minkina, T.M.; et al. Assessment of Invasive and Weed Species by Hyperspectral Imagery in Agrocenoses Ecosystem. Remote Sens. 2022, 14, 2442. https://doi.org/10.3390/rs14102442
Dmitriev PA, Kozlovsky BL, Kupriushkin DP, Dmitrieva AA, Rajput VD, Chokheli VA, Tarik EP, Kapralova OA, Tokhtar VK, Minkina TM, et al. Assessment of Invasive and Weed Species by Hyperspectral Imagery in Agrocenoses Ecosystem. Remote Sensing. 2022; 14(10):2442. https://doi.org/10.3390/rs14102442
Chicago/Turabian StyleDmitriev, Pavel A., Boris L. Kozlovsky, Denis P. Kupriushkin, Anastasia A. Dmitrieva, Vishnu D. Rajput, Vasily A. Chokheli, Ekaterina P. Tarik, Olga A. Kapralova, Valeriy K. Tokhtar, Tatiana M. Minkina, and et al. 2022. "Assessment of Invasive and Weed Species by Hyperspectral Imagery in Agrocenoses Ecosystem" Remote Sensing 14, no. 10: 2442. https://doi.org/10.3390/rs14102442
APA StyleDmitriev, P. A., Kozlovsky, B. L., Kupriushkin, D. P., Dmitrieva, A. A., Rajput, V. D., Chokheli, V. A., Tarik, E. P., Kapralova, O. A., Tokhtar, V. K., Minkina, T. M., & Varduni, T. V. (2022). Assessment of Invasive and Weed Species by Hyperspectral Imagery in Agrocenoses Ecosystem. Remote Sensing, 14(10), 2442. https://doi.org/10.3390/rs14102442


