Abstract
Marine heatwaves (MHWs) have recently been at the forefront of climate research due to their devastating impacts on the marine environment. In this study, we have evaluated the spatiotemporal variability and trends of sea surface temperature (SST) and MHWs in the Black Sea. Furthermore, we investigated the relationship between the El Niño–Southern Oscillation (ENSO) and MHW frequency. This is the first attempt to investigate MHWs and their characteristics in the Black Sea using high-resolution remote-sensing daily satellite SST data (0.05° × 0.05°) from 1982 to 2020. The results showed that the spatial average of the SST warming rate over the entire basin was about 0.65 ± 0.07 °C/decade. Empirical orthogonal function (EOF) analysis revealed that SST in the Black Sea exhibited inter-annual spatiotemporal coherent variability. The maximum spatial SST variability was discovered in the central Black Sea, whereas the lowest variability was in the Batumi and Caucasus anti-cyclonic eddies in the eastern Black Sea. The highest SST temporal variability was found in 1994. More than two-thirds of all MHW events were recorded in the last decade (2010–2020). The highest annual MHW durations were reported in 1994 and 2020. The highest MHW frequency was detected in 2018 (7 waves). Over the whole study period (1982–2020), a statistically significant increase in annual MHW frequency and duration was detected, with trends of 1.4 ± 0.3 waves/decade and 2.8 ± 1.3 days/decade, respectively. A high number of MHW events coincided with El Niño (e.g., 1996, 1999, 2007, 2010, 2018, and 2020). A strong correlation (R = 0.90) was observed between the annual mean SST and the annual MHW frequency, indicating that more MHWs can be expected in the Black Sea, with serious consequences for the marine ecosystem.
1. Introduction
The Black Sea is warming rapidly and is considered a marine “hotspot” of climate change [1,2]. Marine heatwaves (MHWs) have recently been recognized as a major consequence of climate change [3,4]. According to [5,6], MHWs are defined as “discrete periods of abnormally warm water event that persist five days or longer with temperatures above the 90th of SST climatology threshold”. Over the last decade, MHWs are becoming more regular and severe in the world’s oceans and seas [3,4,5,6,7,8,9,10,11]. This leads to loss of coastal and marine habitats, stressed ecosystems, and decreased productivity, all of which have an influence on fisheries [7,12]. This will have an impact on people in a region who rely on coastal and marine ecosystems for food security [12]. Similarly, biodiversity loss due to climate change is creating a threat to the Black Sea tourist business. These extreme MHW events caused widespread mortality of benthic invertebrates in the Mediterranean Sea in 2003 [8] and the disappearance of seagrass meadows in Cabrera National Park (Balearic Islands, Spain) [9]. Policymakers and stakeholders now need to address the impacts and consequences of MHWs on the marine life of the Black Sea. To date, there have been no studies on MHWs in the Black Sea. However, extensive work has been done to examine SST observations (i.e., satellite and in situ) in the Black Sea [2,13,14,15,16,17]. The authors of [18] revealed dramatic and sudden changes in the Black Sea environment mostly due to intense surface cooling in the 1980s followed by strong warming in the 1990s [19,20]. The authors of [21] demonstrated that the interannual variability in hydrological fields and river discharges in the northwestern Black Sea is primarily caused by the ENSO (air pressure difference between Darwin and Tahiti, Pacific Ocean). They also noted that the relationship between SST climatology and ENSO is unclear.
One of the most important features in the Black Sea is the seasonal thermocline, which forms a double pycnocline structure that permits a cold intermediate layer (CIL) to occur (i.e., a layer with minimum temperature situated between the halocline and the thermocline) [22]. The warming trend of the CIL from March 2005 to December 2018 was ~0.05 °C/year, as recently documented [23].
The seasonal and interannual variations in the Black Sea SST were studied in [2] using a satellite Advanced Very High-Resolution Radiometer (AVHRR) from November 1981 to December 2000. The authors detected a positive trend in the mean SST in the Black Sea of about 0.9 °C/decade. They mentioned that the western deep-sea region warms more slowly (approximately 0.8 °C/decade) than the eastern one (around 1.1 °C/decade). The SST variability in the Black Sea was investigated in [14] over the 20th century using a 0.25° climatology grid of SST data from the World Ocean Database 2001 (WOD01) for the period 1900–2000. The study found a nonsignificant cooling trend (−0.02 ± 0.03 °C/decade) across the Black Sea. The “cold years” of the 1980s (i.e., 1982, 1985, and 1987) were detected in both air and sea surface temperatures in localized areas near the center of the Black Sea. The authors noted that a warming trend began over the Black Sea in the 1990s. The authors of [15] reported an SST trend of 0.75 °C/decade in the Black Sea from 1985 to 2005. The SST trend in the Black Sea from 1982 to 2015 was about 0.64 °C/decade [13]. Recently, [1] analyzed the daily fluctuations in Black Sea SST in 2015. The data collected by the Spinning Enhanced Visible and Infrared Imager (SEVIRI) scanner in 2015 with an hourly time step were used to investigate the seasonal and spatial variability of the Black Sea’s diurnal SST cycle. They discovered that the amplitude of the SST diurnal cycle can exceed 5 °C and possibly reach extreme values of up to 7 °C.
The main objective of this study is to analyze the spatial and temporal variability and trends of SST and MHW characteristics in the Black Sea from 1982 to 2020 using high resolution (0.05° × 0.05°) SST satellite data. In addition, we investigate the interannual SST variability using empirical orthogonal function (EOF) analysis. We also investigate the possible link between MHW frequency and ENSO. Finally, we identify the most intense MHW events observed in the Black Sea throughout the study period.
2. Methods
2.1. Description of the Study Area
The Black Sea is a semi-enclosed basin that receives salty Mediterranean water through the Marmara Sea via the Bosphorus channel (Figure 1). The surface layer of the Black Sea is particularly vulnerable to changing environmental and climatic conditions [24,25,26]. The Black Sea is the largest inland basin in the world, with an area of approximately 4.2 × 10⁵ km2, a volume of 5.3 × 10⁵ km3, and a maximum depth of 2200 m [22,26]. The northwestern region of the Black Sea is classified as an estuary, with a positive net freshwater balance (i.e., precipitation >> evaporation) [27,28]. It has a nearly 200-km-wide shelf that accounts for around 13% of the total area of the Black Sea and receives fresh water from the Danube, Dniester, and Dnieper rivers [29,30]. The Danube River is by far the most important river, contributing over 75% of the total river inflow into the Black Sea [31]. The surface circulation of the Black Sea (Figure 1), based on the mean dynamic topography (MDT) from 1993–2012 (https://doi.org/10.48670/moi-00138, accessed on 31 March 2022), consists of a persistent cyclonic coastal current known as the Rim Current (Figure 1) and multiple seasonal mesoscale anticyclonic eddies located between the Rim Current and the coast [24,25,32]. The circulation structure is primarily determined by wind stress curl and influenced by the seasonal evolution of surface thermohaline fluxes [16]. The anticyclonic eddies of Batumi and Sevastopol are the most permanent mesoscale structures in the Black Sea [25,33,34,35].
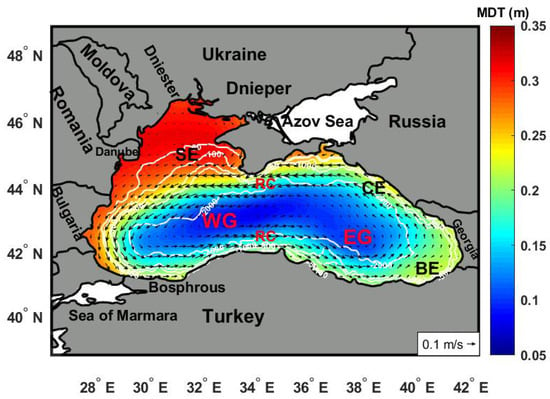
Figure 1.
The mean dynamic topography (MDT) from 1993–2012 (shading, in meters) and general geostrophic circulation (arrows, in m/sec) of the Black Sea obtained from SEALEVEL_BLK_PHY_MDT_L4_STATIC_008_067 (Data | Copernicus Marine, accessed on 31 March 2022), with the main geographic features (e.g., countries and rivers). Isobaths of 50, 100, 500, 1000, and 2000 m are shown as white contours obtained from General Bathymetric Chart of the Oceans (GEBCO) (www.gebco.net) (last access on 15 November 2021). Where the names of structures and currents are listed: WG Western Gyre, EG eastern Gyre, RC Rim Current, BE Batumi Eddy, CE Caucasus Eddy, SE Sevastopol Eddy.
2.2. Datasets
The daily SST data used in this study were freely downloaded from the Copernicus Marine Environment Monitoring Service website (CMEMS, https://resources.marine.copernicus.eu/product-detail/SST_BS_SST_L4_REP_OBSERVATIONS_010_022/DATA-ACCESS; accessed 3 November 2021) and cover the period from 1 January 1982 to 31 December 2020. The CMEMS SST reprocessed (REP) dataset for the Black Sea provides a reliable and consistent long-term SST time series for the Black Sea created for climatic applications [36,37]. This product consists of daily optimally interpolated (L4) satellite-based estimates of the foundation SST with a horizontal resolution of 1/20-degree for a domain covering the Black Sea. It is a multisensor Level 4 analysis which aims to provide an estimate of the night-time SST based on original SST observations. Drifters, Argo floats, mooring buoys, and CTD data were used to evaluate this product (https://catalogue.marine.copernicus.eu/documents/QUID/CMEMS-SST-QUID-010-021-022.pdf, accessed 3 November 2021). The Black Sea CMEMS_REP_BS_SST dataset contains a 19254-point regularly gridded dataset encompassing 14,245 days from 1 January 1982, to 31 December 2020.
The normalized El Niño–Southern Oscillation (ENSO) dataset was obtained from https://www.ncdc.noaa.gov/teleconnections/enso/soi (accessed on 3 April 2022). The Southern Oscillation Index (SOI) is a standardized index that is based on observed changes in sea level pressure (SLP) between Tahiti and Darwin, Australia. The Southern Oscillation Index (SOI) is one measure of large-scale air pressure oscillations that occur between the western and eastern tropical Pacific (i.e., the state of the Southern Oscillation) between El Niño and La Niña events.
2.3. SST Trend and Interannual Variability
The empirical orthogonal function (EOF) approach [38] was used to assess the dominant spatiotemporal patterns in SST variability (1982–2020). EOF analysis is one of the most extensively used and recognized approaches to understanding the variability in climate data [39,40,41]. EOFs have been extensively examined in the literature, largely oriented toward atmospheric scientific applications [42,43,44]. This method fundamentally captures the nonlinearity and high-dimensional characteristics of a given dataset while preserving the key patterns and their variability, allowing users to derive useful information for data interpretation and analysis [39,40]. Here, we focused on the nonseasonal modes of SST: Before decomposing the EOF, we subtracted the seasonal cycles and trends from the monthly SST means at each grid location; furthermore, the SST was normalized by dividing each grid-point time series by its standard deviation [45]. The substantial seasonal signal was eliminated from the data at each grid-point to produce de-seasoned maps and time series, according to [46,47]. This is done by removing the climatological SST mean for each calendar month from the corresponding months over all years.
To proceed with the EOF analysis, the data matrix F was constructed from the set of SST maps as F (m, n), where m is the number of spatial grid-points (Lon. × Lat. = 321 × 200) and n is the number of months (468). The covariance matrix D was calculated from F to find its eigenvectors and eigenvalues according to [42,43,44,48,49,50], as follows:
D = FtF
Using the classical EOF approach [38,40,41,51,52], we solve the eigenvalue problem:
where E is a diagonal matrix containing the eigenvalues (λi) of D (i = 1, …, n). The eigenvectors (the EOF spatial patterns) of D corresponding to the eigenvalues λi are the ei column vectors of E. The dimension of E is n × n. Each eigenvalue λi corresponds to an eigenvector ei (the EOF spatial pattern), while the temporal patterns (principal components, PCs) obtained when an EOF is plotted as a map represent standing oscillations. In an EOF analysis, a significance test based on the Monte Carlo technique [53], known as Rule N [43], is used to choose eigenvalues that are significant at a 95% confidence interval.
D E = E λi
To estimate linear trends in de-seasoned monthly SSTA, the least-squares method [49] is utilized. The modified Mann–Kendall (MMK) test [50,54] was used to examine the statistical significance of the estimated trends. In this study, the level of significance was established at α = 0.05 (p ≤ 0.05) to ensure that all presented trends were statistically significant at least at the 95% confidence level. The uncertainty of the SST linear trend was estimated by a standard statistical method [38].
2.4. Marine Heatwave (MHW) Calculations
We followed the definitions in [5] to detect MHWs in the Black Sea using daily SST data for the period 1982–2020. The MATLAB toolbox algorithm [55] was used to identify all MHW characteristics (frequency, total days, duration, mean intensity, cumulative intensity, and maximum intensity) based on 39 years of baseline climatology (1982–2020). We used a seasonally varying 90th percentile threshold, which allowed us to detect MHWs throughout the year, not only during the summer months. The equations for the main characteristics of MHWs are described in more detail in [5,56,57]. As described in [58], each MHW event has a start and end date indicated by the mean and maximum intensity in °C (i.e., mean and maximum SSTs relative to the 90th threshold during the event duration (in days). The MHW cumulative intensity in °C days is the sum of daily SSTs relative to the 90th threshold over the event duration according to [58]. Following the methodology, the annual statistics were calculated, including the annual MHW event frequency. The total number of MHW days in each year can be used to find out how the MHW frequency of events has changed over time by using the metrics for each grid-point [5].
3. Results
3.1. SST Climatology, Trends, and Interannual Variability
Figure 2a demonstrates the superposition of 39 annual cycles of SST averaged over the entire Black Sea, giving us an indication of the SST variability range for each month/season. This time series shows a strong annual cycle, with lower values (~7 °C) from February to March and the highest values in summer (~25 °C), mainly in July and August. The annual cycle range (i.e., summer maxima–winter minima) is about 17 °C, in agreement with [1,15]. It is worth noting that most of the years with temperatures above the climatic mean (the solid blue line in Figure 2a) occurred after 2010 (the solid yellow lines). Figure 2b shows the monthly SSTA time series and trends over the study period (1982–2020). The highest SSTA values were observed in the last two decades of the study period (i.e., 2001–2020). The lowest anomalies were noticed in 1985 and 1987, which is consistent with [14]. Over the last two decades (2001–2020), a statistically significant (p < 0.05) increase in SST temporal trend of about 0.71 ± 0.19 °C/decade was detected over the entire Black Sea (the solid red line in Figure 2b), whereas this trend value was about 0.40 ± 0.21 °C/decade during the first period (1982–2000, the continuous blue line in Figure 2b). During the entire study period (1982–2020), the average warming rate of the Black Sea SST was about 0.65 ± 0.07 °C/decade (the solid black line in Figure 2b).
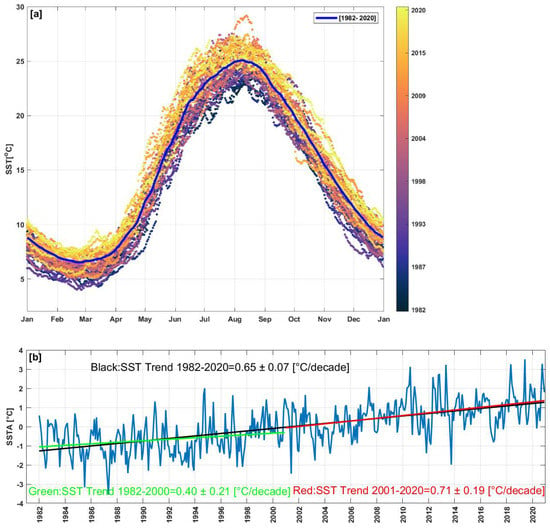
Figure 2.
(a) Annual cycle for the mean Black Sea SST from 1982 to 2020. Each line represents a year in the study period, and the solid black line indicates the climatic mean. (b) The de-seasoned monthly SST time series (blue line) from 1982 to 2020, with the SST trend (black line). The green and red lines show the SST trends for 1982–2000 and 2001–2020, respectively.
Figure 3a–c depicts the spatial distribution of mean SST in the Black Sea, the SSTA trend, and its uncertainty from 1982 to 2020. The Black Sea is characterized by a minimum mean SST of 12.5 °C (Figure 3a) in the northern shelf area, close to the Dnieper and Dniester rivers estuary (Figure 1), with a warmer area (>16.4 °C) in the eastern part of the basin, possibly due to the warm anomaly caused by the permanent Batumi anticyclone eddy (see [15,34,59]). A statistically significant (p < 0.05) trend was detected across the whole basin (Figure 3b). The average SST warming rate in the basin was about 0.67 ± 0.08 °C/decade. The Caucasus anticyclone eddy off the Russian coast has the highest SST trend (up to 0.75 °C/decade), whereas the lowest value (~0.55 °C/decade) was found off the southeastern Ukrainian coast. In general, the linear SST trend gradually increases from the western to eastern basins of the Black Sea in agreement with [2]. In comparison with the trend values, the spatial pattern of the SST uncertainty trend is small (<0.08) across most of the Black Sea (Figure 3c).
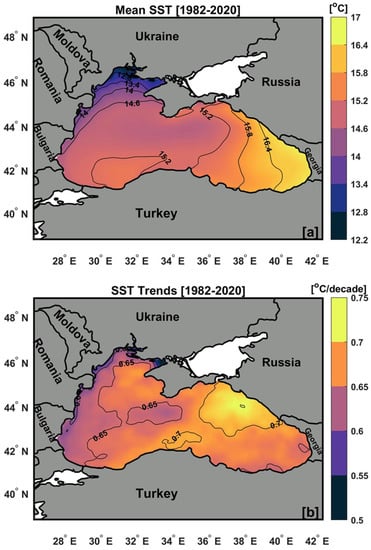
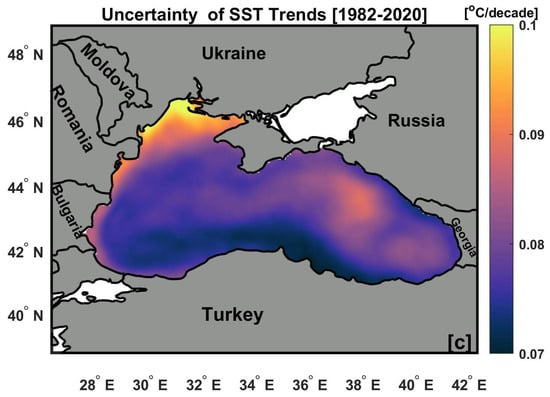
Figure 3.
Spatial map of the Black Sea SST. (a) The climatological mean, (b) trend, and (c) uncertainty from 1982 to 2020. The modified Mann–Kendall test indicates that the trend patterns are statistically significant (p < 0.05) at each grid point.
The first two SST EOF modes (Figure 4a,b) account for about 85% of the total nonseasonal variance. The other EOF modes fail a statistical significance test based using a Monte Carlo technique [53]. The spatial pattern of the first EOF1 mode (Figure 4a) explains the greatest percentage (77.1%) of the nonseasonal SST variance. This pattern exhibits coherent behavior (i.e., an in-phase oscillation) across the entire Black Sea (Figure 4a). The maximum variability was observed over the central and western Black Sea, while the lowest variability was found over the Batumi anticyclone eddy zone, over the Caucasus anticyclone eddy, and south of the Azov Sea entrance. This lower variability could be attributed to the warm anomaly produced by the periodically recurring (quasi-permanent) Batumi and Caucasus anti-cyclonic eddies [15,34,59]. The corresponding amplitude of the first mode (PC1) has significant interannual fluctuations (Figure 4c), peaking in the summers of 1994, 2010, 2013, 2018, and 2019. The winters of 1985, 1987, 1997, 2001, 2011, and 2013 had the highest negative maxima (i.e., cold periods) (Figure 4c). In addition, this mode exhibited a strong decadal signal with an interval of around 4–6 years, which is consistent with [15]. The second EOF2 mode (which accounts for around 8% of the nonseasonal variance) showed a dipole opposite variation between the western and eastern basin of the Black Sea (i.e., positive anomalies in the western basin and negative anomalies in the eastern basin) (Figure 4b). The temporal coefficient of the second mode (PC2) varies between positive and negative patterns during the 1982–2020 study period (Figure 4d), with the highest value in 1994.
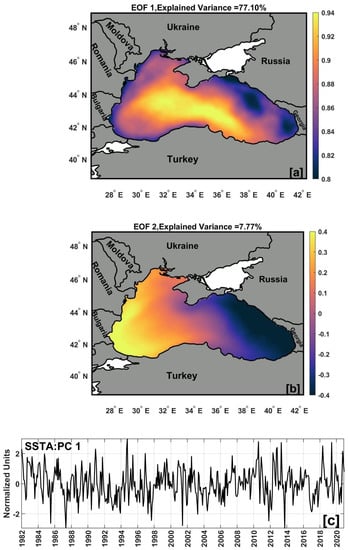

Figure 4.
The dominant patterns of the Black Sea SST variability over the period from 1982 to 2020. (a) The spatial principal mode (EOF1) and (c) its corresponding temporal evolution (PC1). (b) The spatial second mode (EOF2) and (d) its corresponding temporal evolution (PC2). Temporal evolution for (PC1-2) in normalized variance units.
3.2. Marine Heatwaves (MHWs) Main Characteristics and Trends
The means and spatial trends of the main characteristics of MHWs, i.e., frequency, days, duration, and cumulative intensity over the entire study period (1982–2020), are shown in Figure 5a–f. The annual average MHW frequency ranged from 1.2 to 2.4 waves (Figure 5a), with maximal values (>2 waves) recorded in the northernmost part of the Black Sea (i.e., the Caucasus and Sevastopol anticyclonic eddy regions). The trends in the MHW frequency are statistically significant (p < 0.05) over the entire Black Sea. The MHW frequency trend (Figure 5b) varies from 0.8 to 2 waves/decade. The highest significant MHW frequency trend (>1.8/decade; p < 0.05) was detected mostly in the center and northeast of the Black Sea basin (i.e., the Caucasus anticyclone eddy region), whereas southeast of the Black Sea (i.e., the Batumi anticyclonic eddy) has the lowest MHW frequency trend (<0.8/decade) (Figure 5b).
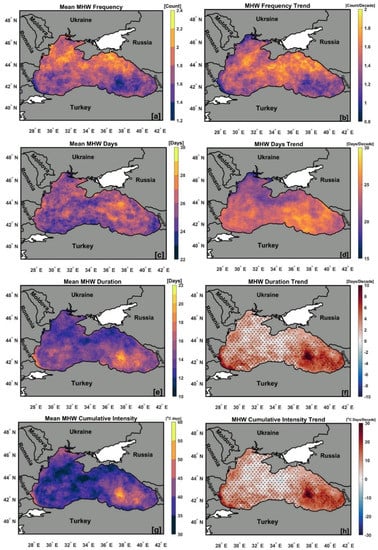
Figure 5.
The annual means and trends of the main MHW characteristics in the Black Sea during (1982–2020). (a) Mean frequency (Count), (b) frequency trend (Count/Decade), (c) mean total days (Days), (d) days trend (Days/Decade), (e) duration (Days), (f) duration trend (Days/Decade), (g) cumulative intensity (°C Days), and (h) cumulative intensity trend (°C Days/Decade). The black dots indicate that the change is not significantly different (p > 0.05).
The annual mean total MHW days (Figure 5c) in the study period (1982–2020) vary between 22 and 30 days, with maximum values (>26 days) observed in the eastern basin of the Black Sea. In general, the eastern basin of the Black Sea has more total MHW days than the western part. We discovered that the total MHW day trend (Figure 5d) values are statistically significant (p < 0.05) for the whole Black Sea domain. The southeastern Black Sea basin (i.e., the eastern cyclonic gyre region) has the greatest significant total MHW day trend values (>28 days/decade). The lowest total MHW day trend (<17 days; Figure 5d) is found off the southeastern Ukrainian coast (i.e., the Dnieper River discharge area).
The annual mean duration of an MHW (Figure 5e) ranged between 10 and 22 days, with the highest values (>20 days) found in the southeastern Black Sea basin (i.e., the eastern cyclonic gyre region). A significant (p < 0.05) MHW duration trend (>8 days/decade) is recorded only in two locations: off the southeastern Bulgarian coast and in the southeastern Black Sea basin (i.e., the eastern cyclonic gyre). There is an interesting similarity between the MHW duration and the cumulative intensity spatial patterns in terms of significant and nonsignificant regions (Figure 5e,g). Annual mean MHW cumulative intensity values varied from 30 to 60 °C days, with the greatest value of >50 °C days occurring at the same location as the highest MHW duration values. The highest MHW cumulative significant intensity trend values (p < 0.05; >10 °C days/decade) are found in the same locations as the MHW duration trends (Figure 5f,h).
3.3. Marine Heatwaves (MHWs) Temporal Variation
In this part, we demonstrate the temporal variability of the basin’s average annual MHW main characteristics (frequency, duration, and cumulative intensity) and their relationships with SST (Figure 6a,d) from 1982 to 2020. Figure 6a clearly reveals that the highest MHW frequency was recorded in 2018 with a value of 7 waves. The annual mean MHW frequency was <4 from 1982 to 2009 (Figure 6a), but from 2010 to 2020, the frequency rose dramatically, reaching a peak in 2018 (~7). We found that the average MHW frequency increased by 66% over the last decade (2010–2020). These findings are consistent with the maximum SST time records (Figure 2b) for the same period (2010–2020). We found that there were no MHWs in 1985, 1987, and 1993, which were the coldest years during the study period (1982–2020). We observed a strong correlation (R = 0.90) between annual MHW frequency and annual mean SST (Figure 6b), indicating that MHW frequency in the Black Sea is likely to increase as global warming continues.
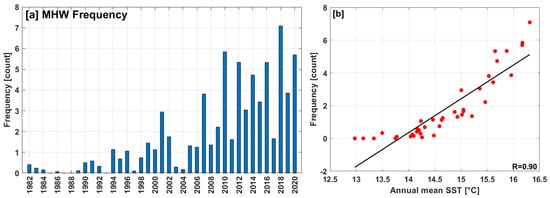
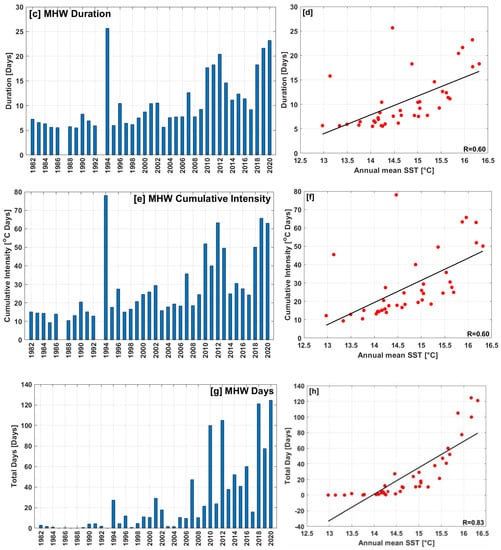
Figure 6.
Regional averages of the annual mean (a) MHW frequency, (c) MHW duration, and (e) MHW cumulative intensity, (g) total MHW days. The scatter plots of the annual mean SST and (b) MHW frequency, (d) MHW duration, (f) MHW cumulative intensity, and (h) total MHW days over the Black Sea from 1982 to 2020, with the black lines representing the best-fit linear curve.
The longest MHW duration (Figure 6c) was detected in 1994 and lasted 26 days; however, this only represents one MHW in that year, as can be seen in the annual MHW frequency (Figure 5a). This could be related to the highest SST variability in 1994, as shown in the EOF analysis (Figure 4c,d). In addition, [2,26] found a warm peak in 1994 occurring in the second half of the year, confirming our results. Except for 1994, the temporal basin’s average MHW duration (Figure 6c) shows a general increase from roughly 6 days to >10 days in the last decade (2010–2020), with a maximum of ~24 days in 2020. The annual MHW duration shows a correlation (R) of 0.60 with the annual mean SST (Figure 6d). The annual average basin MHW cumulative intensity (Figure 6e) ranged from 8 °C days to 80 °C days. The greatest annual MHW cumulative intensity (78 °C days) was recorded in the same year (i.e., 1994) as the MHW duration. The annual average MHW cumulative intensity was approximately 44 °C days over the last decade (2010–2020) (Figure 6e), with the highest value in 2019.
The correlation coefficient between MHW cumulative intensity and annual mean SST (Figure 6f) was 0.60. The years with the maximum total annual MHW days (>100 days) were observed in the last decade: 2012, 2018, and 2020. (Figure 6g), whereas the correlation coefficient between total MHW days and SST was 0.84 (Figure 6h). Overall, we found a statistically significant increase in annual MHW frequency and duration over the study period (1982–2020), with trends of 1.4 ± 0.3 waves/decade and 2.8 ± 1.3 days/decade, respectively.
3.4. Relations between MHW and ENSO
In this section, we investigate the relationship between ENSO and annual MHW frequency throughout the study period (1982–2020), as shown in the dual-scale graph (Figure 7). ENSO has two opposite extreme phases referred to as El Niño (the warm phase, in red) and La Niña (the cold phase, in blue) as represented in Figure 7. The results revealed a high number of MHW events that coincided with El Niño (i.e., 1996, 1999, 2007, 2010, 2018, and 2020), with a correlation coefficient (R) between them of 0.22. For example, more than five MHW events were observed during the strongest El Niño event in 2010. In contrast, the fewest MHW events were associated with La Niña (i.e., 1987, 1993, 1997, 2004, 2015, and 2019). Over the last two decades (2000–2020), we found that 45% of the total annual MHW frequency coincided with the strong positive El Niño phases.
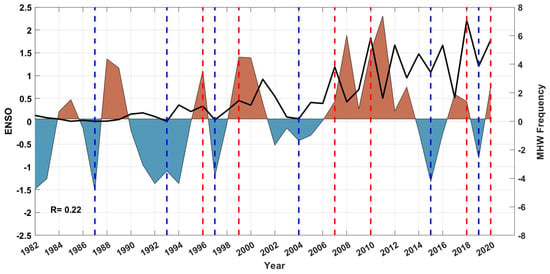
Figure 7.
The annual normalized time series of El Niño-Southern Oscillation (ENSO) (left y-axis) and total MHW frequency (events) (right y-axis) over the study period (1982–2020). The vertical dashed red lines indicate the positive phase of ENSO (El Niño), and the vertical dashed blue lines indicate the negative phase of ENSO (La Niña).
3.5. MHW Event Examples
In this part, we present two examples of MHW events found between 1982 and 2020. The first is the longest MHW event, which occurred in 1994, and the second is the most intense MHW event, which occurred in 2018.
3.5.1. The Longest MHW Event
The results of the average annual temporal basin MHW main characteristics (Figure 6a,c) indicate that one MHW event in 1994 had the longest duration (26 days) and had the highest cumulative intensity (78 °C days) in our study period (i.e., 1982–2020). The longest MHW duration event involved a large area in the Black Sea extending from 42°N to 45.5°N and from 30°E to 38°E, with a maximum intensity of 2.1 °C and a mean intensity of 1.35 °C from 18 September to 13 October 1994. (Figure 8a,b). This event may be linked to the high variability observed in the EOF analysis (Figure 4c,d). This showed that the second half of 1994 had the highest variability over the entire study period, confirming prior research findings [2,26].
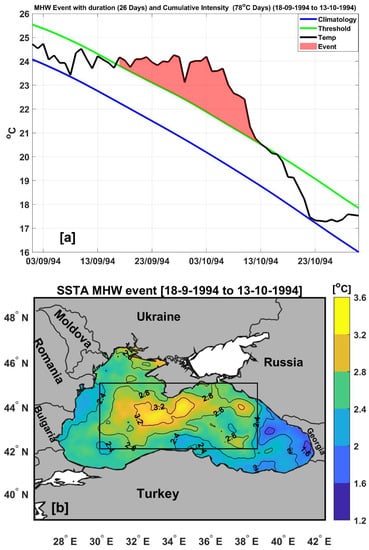
Figure 8.
The longest MHW event observed in the region, inside the black rectangle, which lasted 26 days (from 18 September to 13 October 1994). (a) SST climatology (blue), 90th percentile SST threshold (green), and SST time series (black) for that MHW event. The pink filled area represents the period associated with the identified MHW. (b) The spatial mean SST anomaly distribution during this event.
3.5.2. The Most Intense MHW Event
We found that the highest-intensity (~6 °C) MHW event occurred from 26 April 2018 to 12 May 2018 at longitude 29°E and latitude 46°N over sea areas near the Danube River runoff zone (Figure 9a,b). The mean intensity for this MHW event was 3.1 °C, with a cumulative intensity of about 51 °C days. This MHW event was associated with a positive SSTA pattern >2 °C across the entire Black Sea basin (Figure 9a).
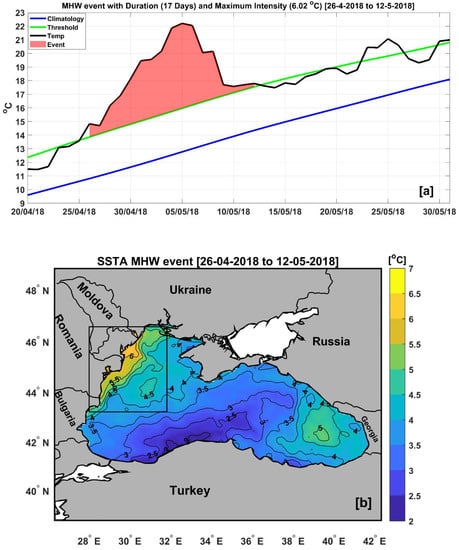
Figure 9.
The most intense MHW event (maximum intensity of 6.02 °C) observed in 2018, in the region inside the black rectangle (from 26 April to 12 May 2018). (a) SST climatology (blue), 90th percentile SST threshold (green), and SST time series (black) for that MHW event. The pink filled area represents the period associated with the identified MHW. (b) The spatial mean SST anomaly distribution during this event.
4. Discussion
The Black Sea has a strong annual SST cycle with a range of around 17 °C and with the coldest temperature (i.e., 7 °C) in winter and the warmest temperature (i.e., 25 °C) in summer (Figure 2a). The seasonal SST cycle range results are in agreement with [1,2,15]. The highest SSTA values in the Black Sea were reported in the last decade of the study period (i.e., 2010–2020), while the lowest anomalies were observed in 1985 and 1987, which is consistent with [2,15].
We detected an increase in the SST temporal trend (0.71 ± 0.19 °C/decade) for the entire Black Sea over the last two decades (2001–2020; Figure 2b), whereas this trend value was around 0.40 ± 0.21 °C/decade in the first period (1982–2000; Figure 2b). This result was quite close to findings in [13] that the Black Sea SST trend was roughly 0.64 °C/decade from 1982 to 2015. However, it was lower than in [2]; those researchers found a positive trend of roughly 0.9 °C/decade for the SST study period (1981–2000). A statistically significant spatial SST trend was found across the whole Black Sea (Figure 3b): The basin’s spatial average SST warming rate was around 0.67 ± 0.08 °C/decade. The Caucasus anticyclone eddy off the Russian coast had the highest SST trend (up to 0.75 °C/decade), while the lowest values (~0.55 °C/decade) were discovered off the southeastern Ukrainian coast. A gradual increase in the linear SST trend from the western to the eastern basins of the Black Sea was observed in agreement with [2]. This could be related to the Black Sea bathymetry features (deep in the east and shallow in the west) as well as the Rim cyclonic circulation system [16,35,59]. The cyclonic Rim Current and nearshore anticyclonic eddies exhibit higher velocities than those in the central gyres or the northwestern shelf area [60].
The first two SST EOF modes (Figure 4a,b) accounted for ~85% of the total nonseasonal variance. The pattern of the first EOF1 mode exhibited coherent behavior (i.e., an in-phase oscillation) throughout the entire Black Sea (Figure 4a). The central and western Black Sea had the most variability (Figure 4a), while the Batumi anticyclone eddy zone (Figure 1), the Caucasus anticyclone eddy zone, and south of the Azov Sea entrance had the least variability. This lower variability could be related to the warm anomaly produced by the periodically recurring (quasi-permanent) Batumi and Caucasus anti-cyclonic eddies [15,34,59]. Equivalent PC1 peaks were observed in the summers of 1994, 2010, 2013, 2018, and 2019. The most negative maxima variability occurred in the winters of 1985, 1987, 1997, 2001, 2011, and 2013 (Figure 4c).
In terms of MHWs, we discovered a statistically significant increase in annual MHW frequency and duration over the whole study period (1982–2020), with temporal trend values of approximately 1.4 ± 0.3 waves/decade and 2.8 ± 1.3 days/decade, respectively. The frequency trend result was slightly higher than that estimated in the eastern Mediterranean [56] (1.2/decade) over the same study period. Furthermore, the trend in MHW frequency for Black Sea MHWs was greater than the global frequency trend (0.45 waves/decade) and the duration trend (1.3 days/decade) for the global SST study (from 1982 to 2016) conducted in [6]. In the last decade (2010–2020), we found that the average MHW frequency increased by 66% compared with 1982–2009. The spatial distribution of the MHW frequency and the total-day trend maps (Figure 5b,d) were statistically significant (p < 0.05) over the whole Black Sea (1982–2020). The highest significant MHW frequency trend (>1.8 waves/decade; p < 0.05) was detected in the central basin and the Caucasus anticyclone eddy region. The Batumi anticyclonic eddy region exhibited the lowest MHW frequency trend (<0.8/decade). The study revealed that the eastern basin of the Black Sea has more total MHW days than the western part (Figure 5c), which coincides with the spatial SST trend pattern (Figure 3b). The eastern cyclonic gyre region has the highest significant (p < 0.05) total MHW day trend values (>28 days/decade). The Dnieper River discharge area had the shortest total MHW days (<17 days, Figure 5d). The highest MHW cumulative intensity trend values that were significant (p < 0.05; >10 °C days/decade) were observed in the same regions as the MHW duration trend (Figure 5f,h). The increased number of MHW events corresponded to a strong positive El Niño phase (Figure 7). In contrast, there are no or few MHWs associated with La Niña events (the cold phase of ENSO).
The longest MHW event was observed in the region from 42°N to 45.5°N and 30°E to 38°E and lasted for 26 days (from September 18 to October 13, 1994), with a cumulative intensity of 78 °C days, a maximum MHW intensity of 2.1 °C, and mean MHW intensity of 1.35 °C (Figure 8a,b). This event could be linked to the high SST variability reported in the EOF analysis (Figure 4c,d), which agrees with [2,26], whose authors discovered that the summer of 1994 was the longest, with quite high SST values (>20 °C) that were still observed during most of October.
The most intense MHW event (~6 °C) was recorded over the northwestern Black Sea (near the Danube outflow zone) from April 26 to October 13 in 2018 (Figure 9a,b). This most intense MHW event in 2018 may be related to our results in Figure 7, which coincided with the positive phase of ENSO (El Niño) during this year. This result is in the same line with [21], whose authors generally found that the interannual variability of hydrological fields and river discharges in the northwestern Black Sea is primarily caused by ENSO.
5. Conclusions
This work provides a rigorous analysis of SST trends, variability, and spatiotemporal patterns of marine heatwaves in the Black Sea from 1982 to 2020 using high-resolution SST satellite data. To the best of our knowledge, this is the first study to analyze MHWs in the Black Sea and their relationships to ENSO. During the study period, an increasing SST warming rate was observed in the Black Sea, which was coupled with a high MHW frequency trend, especially in the last two decades (2001–2020). A steadily increasing linear SST trend was observed from the western to the eastern basins of the Black Sea. A strong correlation (R = 0.90) was observed in the Black Sea between the annual MHW frequency and the annual mean SST. A high number of MHW events coincided with El Niño (i.e., 1996, 1999, 2007, 2010, 2018, and 2020).
The frequency of marine heatwaves is likely to increase in the future as global warming continues. Therefore, additional research is needed to investigate the severity of marine heatwaves and their main drivers in the Black Sea, such as oceanic and atmospheric factors. Future MHW studies should incorporate multiple GHG emission climate scenario ensembles over longer time periods up to the year 2099.
Author Contributions
Conceptualization, B.M., O.I., and H.N.; methodology, H.N., O.I., and B.M.; formal analysis, B.M., H.N., and O.I.; investigation, B.M., O.I., and H.N.; resources, O.I., B.M., and H.N.; data curation, O.I., H.N., and B.M.; writing—original draft preparation, B.M., O.I., and H.N.; writing—review and editing, H.N., B.M., and O.I.; visualization, O.I., B.M., and H.N.; supervision, H.N., O.I., and B.M. All authors have read and agreed to the published version of the manuscript.
Funding
This research received no external funding.
Institutional Review Board Statement
Not applicable.
Informed Consent Statement
Not applicable.
Data Availability Statement
The datasets used in this work are publicly available online through the Copernicus Marine Environment Monitoring Service (CMEMS) project (https://resources.marine.copernicus.eu/product-detail/SST_BS_SST_L4_REP_OBSERVATIONS_010_022/DATA-ACCESS; accessed on 3 November 2021).
Acknowledgments
The authors would like to express their gratitude to the Copernicus Marine Environment Monitoring Service (CMEMS) project for supplying the SST dataset used in this investigation. We would like to thank the anonymous reviewers for their valuable comments. The authors would like to express their gratitude to Joseph McGovern from the Marine Institute in Ireland for his assistance in the linguistic editing of our manuscript.
Conflicts of Interest
The authors declare no conflict of interest.
References
- Rubakina, V.A.; Kubryakov, A.A.; Stanichny, S.V. Seasonal variability of the diurnal cycle of the black sea surface temperature from the SEVIRI satellite measurements. Phys. Oceanogr. 2019, 26, 157–169. [Google Scholar] [CrossRef]
- Ginzburg, A.I.; Kostianoy, A.G.; Sheremet, N.A. Seasonal and interannual variability of the Black Sea surface temperature as revealed from satellite data (1982–2000). J. Mar. Syst. 2004, 52, 33–50. [Google Scholar] [CrossRef]
- Marx, W.; Haunschild, R.; Bornmann, L. Heat waves: A hot topic in climate change research. Theor. Appl. Climatol. 2021, 146, 781–800. [Google Scholar] [CrossRef] [PubMed]
- Pörtner, H.-O.; Roberts, D.C.; Masson-Delmotte, V.; Zhai, P.; Tignor, M.; Poloczanska, E.; Mintenbeck, K.; Alegría, A.; Nicolai, M.; Okem, A.; et al. (Eds.) The ocean and cryosphere in a changing climate. In IPCC Special Report on the Ocean and Cryosphere in a Changing Climate; IPCC: Paris, France, 2019. [Google Scholar]
- Hobday, A.J.; Alexander, L.V.; Perkins, S.E.; Smale, D.A.; Straub, S.C.; Oliver, E.C.J.; Benthuysen, J.A.; Burrows, M.T.; Donat, M.G.; Feng, M.; et al. A hierarchical approach to defining marine heatwaves. Prog. Oceanogr. 2016, 141, 227–238. [Google Scholar] [CrossRef]
- Hobday, A.J.; Oliver, E.C.J.; Sen Gupta, A.; Benthuysen, J.A.; Burrows, M.T.; Donat, M.G.; Holbrook, N.J.; Moore, P.J.; Thomsen, M.S.; Wernberg, T.; et al. Categorizing and naming marine heatwaves. Oceanography 2018, 31, 162–173. [Google Scholar] [CrossRef]
- Pranovi, F.; Monti, M.A.; Brigolin, D.; Zucchetta, M. The influence of the spatial scale on the fishery landings-SST relationship. Front. Mar. Sci. 2016, 3, 143. [Google Scholar] [CrossRef]
- Garrabou, J.; Coma, R.; Bensoussan, N.; Bally, M.; Chevaldonné, P.; Cigliano, M.; Diaz, D.; Harmelin, J.G.; Gambi, M.C.; Kersting, D.K.; et al. Mass mortality in Northwestern Mediterranean rocky benthic communities: Effects of the 2003 heat wave. Glob. Chang. Biol. 2009, 15, 1090–1103. [Google Scholar] [CrossRef]
- Marbà, N.; Duarte, C.M. Mediterranean warming triggers seagrass (Posidonia oceanica) shoot mortality. Glob. Chang. Biol. 2010, 16, 2366–2375. [Google Scholar] [CrossRef]
- Mohamed, B.; Nilsen, F.; Skogseth, R. Marine Heatwaves Characteristics in the Barents Sea Based on High Resolution Satellite Data (1982–2020). Front. Mar. Sci. 2022, 9, 4436. [Google Scholar] [CrossRef]
- Oliver, E.C.J.J.; Donat, M.G.; Burrows, M.T.; Moore, P.J.; Smale, D.A.; Alexander, L.V.; Benthuysen, J.A.; Feng, M.; Sen Gupta, A.; Hobday, A.J.; et al. Longer and more frequent marine heatwaves over the past century. Nat. Commun. 2018, 9, 1324. [Google Scholar] [CrossRef]
- Colloca, F.; Demirel, N.; Morello, E.B.; Salihoglu, B.; Arkin, S.S.; Akoglu, E.; Fach, B.A. Evolution of Future Black Sea Fish Stocks under Changing Environmental and Climatic Conditions. Front. Mar. Sci. 2017, 4, 339. [Google Scholar] [CrossRef]
- Sakalli, A.; Başusta, N. Sea surface temperature change in the Black Sea under climate change: A simulation of the sea surface temperature up to 2100. Int. J. Climatol. 2018, 38, 4687–4698. [Google Scholar] [CrossRef]
- Shapiro, G.I.; Aleynik, D.L.; Mee, L.D. Long term trends in the sea surface temperature of the Black Sea. Ocean Sci 2010, 6, 491–501. [Google Scholar] [CrossRef]
- Buongiorno Nardelli, B.; Colella, S.; Santoleri, R.; Guarracino, M.; Kholod, A. A re-analysis of Black Sea surface temperature. J. Mar. Syst. 2010, 79, 50–64. [Google Scholar] [CrossRef]
- Kubryakov, A.A.; Stanichny, S.V.; Zatsepin, A.G.; Kremenetskiy, V.V. Long-term variations of the Black Sea dynamics and their impact on the marine ecosystem. J. Mar. Syst. 2016, 163, 80–94. [Google Scholar] [CrossRef]
- Akpinar, A.; Fach, B.A.; Oguz, T. Observing the subsurface thermal signature of the Black Sea cold intermediate layer with Argo profiling floats. Deep Sea Res. Part I Oceanogr. Res. Pap. 2017, 124, 140–152. [Google Scholar] [CrossRef]
- Oguz, T.; Gilbert, D. Abrupt transitions of the top-down controlled Black Sea pelagic ecosystem during 1960–2000: Evidence for regime-shifts under strong fishery exploitation and nutrient enrichment modulated by climate-induced variations. Deep Sea Res. Part I Oceanogr. Res. Pap. 2007, 54, 220–242. [Google Scholar] [CrossRef]
- Oguz, T.; Cokacar, T.; Malanotte-Rizzoli, P.; Ducklow, H.W. Climatic warming and accompanying changes in the ecological regime of the Black Sea during 1990s. Global Biogeochem. Cycles 2003, 17, 1088. [Google Scholar] [CrossRef]
- Oguz, T.; Dippner, J.W.; Kaymaz, Z. Climatic regulation of the Black Sea hydro-meteorological and ecological properties at interannual-to-decadal time scales. J. Mar. Syst. 2006, 60, 235–254. [Google Scholar] [CrossRef]
- Polonsky, A.; Voskresenskaya, E.; Belokopytov, V. Variability of Northwestern Black Sea Hydrography and River Discharges as Part of Global Ocean-Atmosphere Fluctuations. Sensit. Chang. Black Sea Balt. Sea North Sea 1997, 11–24. [Google Scholar] [CrossRef]
- Özsoy, E.; Ünlüata, Ü. Oceanography of the Black Sea: A review of some recent results. Earth-Sci. Rev. 1997, 42, 231–272. [Google Scholar] [CrossRef]
- Stanev, E.V.; Peneva, E.; Chtirkova, B. Climate Change and Regional Ocean Water Mass Disappearance: Case of the Black Sea. J. Geophys. Res. Ocean. 2019, 124, 4803–4819. [Google Scholar] [CrossRef]
- Ciliberti, S.A.; Jansen, E.; Coppini, G.; Peneva, E.; Azevedo, D.; Causio, S.; Stefanizzi, L.; Creti’, S.; Lecci, R.; Lima, L.; et al. The Black Sea Physics Analysis and Forecasting System within the Framework of the Copernicus Marine Service. J. Mar. Sci. Eng. 2022, 10, 48. [Google Scholar] [CrossRef]
- Oguz, T.; Latun, V.S.; Latif, M.A.; Vladimirov, V.V.; Sur, H.I.; Markov, A.A.; Özsoy, E.; Kotovshchikov, B.B.; Eremeev, V.V.; Ünlüata, Ü. Circulation in the surface and intermediate layers of the Black Sea. Deep Sea Res. Part I Oceanogr. Res. Pap. 1993, 40, 1597–1612. [Google Scholar] [CrossRef]
- Lima, L.; Ciliberti, S.A.; Aydoğdu, A.; Masina, S.; Escudier, R.; Cipollone, A.; Azevedo, D.; Causio, S.; Peneva, E.; Lecci, R.; et al. Climate Signals in the Black Sea from a Multidecadal Eddy-Resolving Reanalysis. Front. Mar. Sci. 2021, 1214. [Google Scholar] [CrossRef]
- Kara, A.B.; Helber, R.W.; Boyer, T.P.; Elsner, J.B. Mixed layer depth in the Aegean, Marmara, Black and Azov Seas: Part I: General features. J. Mar. Syst. 2009, 78, S169–S180. [Google Scholar] [CrossRef]
- Volkov, D.L.; Landerer, F.W. Internal and external forcing of sea level variability in the Black Sea. Clim. Dyn. 2015, 45, 2633–2646. [Google Scholar] [CrossRef]
- Oguz, T.; Aubrey, D.G.; Latun, V.S.; Demirov, E.; Koveshnikov, L.; Sur, H.I.; Diaconu, V.; Besiktepe, S.; Duman, M.; Limeburner, R.; et al. Mesoscale circulation and thermohaline structure of the Black Sea observed during HydroBlack’91. Deep Sea Res. Part I Oceanogr. Res. Pap. 1994, 41, 603–628. [Google Scholar] [CrossRef]
- Rachev, N.H.; Stanev, E.V. Eddy Processes in Semienclosed Seas: A Case Study for the Black Sea. J. Phys. Oceanogr. 1997, 27, 1581–1601. [Google Scholar] [CrossRef]
- Capet, A.; Barth, A.; Beckers, J.M.; Marilaure, G. Interannual variability of Black Sea’s hydrodynamics and connection to atmospheric patterns. Deep Sea Res. Part II Top. Stud. Oceanogr. 2012, 77–80, 128–142. [Google Scholar] [CrossRef]
- Staneva, J.V.; Dietrich, D.E.; Stanev, E.V.; Bowman, M.J. Rim current and coastal eddy mechanisms in an eddy-resolving Black Sea general circulation model. J. Mar. Syst. 2001, 31, 137–157. [Google Scholar] [CrossRef]
- Ciliberti, S.A.; Grégoire, M.; Staneva, J.; Palazov, A.; Coppini, G.; Lecci, R.; Peneva, E.; Matreata, M.; Marinova, V.; Masina, S.; et al. Monitoring and Forecasting the Ocean State and Biogeochemical Processes in the Black Sea: Recent Developments in the Copernicus Marine Service. J. Mar. Sci. Eng. 2021, 9, 1146. [Google Scholar] [CrossRef]
- Korotaev, G.; Oguz, T.; Nikiforov, A.; Koblinsky, C. Seasonal, interannual, and mesoscale variability of the Black Sea upper layer circulation derived from altimeter data. J. Geophys. Res. Ocean. 2003, 108, 3122. [Google Scholar] [CrossRef]
- Korotaev, G.K.; Oguz, T.; Dorofeyev, V.L.; Demyshev, S.G.; Kubryakov, A.I.; Ratner, Y.B. Development of Black Sea nowcasting and forecasting system. Ocean Sci. 2011, 7, 629–649. [Google Scholar] [CrossRef]
- Merchant, C.J.; Embury, O.; Bulgin, C.E.; Block, T.; Corlett, G.K.; Fiedler, E.; Good, S.A.; Mittaz, J.; Rayner, N.A.; Berry, D.; et al. Satellite-based time-series of sea-surface temperature since 1981 for climate applications. Sci. Data 2019, 6, 223. [Google Scholar] [CrossRef] [PubMed]
- Pisano, A.; Buongiorno Nardelli, B.; Tronconi, C.; Santoleri, R. The new Mediterranean optimally interpolated pathfinder AVHRR SST Dataset (1982–2012). Remote Sens. Environ. 2016, 176, 107–116. [Google Scholar] [CrossRef]
- Emery, W.J.; Thomson, R.E. Data Analysis Methods in Physical Oceanography; Newnes: Oxford, UK, 1997; ISBN 0080314341. [Google Scholar]
- Hannachi, A.; Jolliffe, I.T.; Stephenson, D.B. Empirical orthogonal functions and related techniques in atmospheric science: A review. Int. J. Climatol. 2007, 27, 1119–1152. [Google Scholar] [CrossRef]
- Menna, M.; Gačić, M.; Martellucci, R.; Notarstefano, G.; Fedele, G.; Mauri, E.; Gerin, R.; Poulain, P.-M. Climatic, Decadal, and Interannual Variability in the Upper Layer of the Mediterranean Sea Using Remotely Sensed and In-Situ Data. Remote Sens. 2022, 14, 1322. [Google Scholar] [CrossRef]
- Gupta, N.; Bhaskaran, P.K.; Dash, M.K. Dipole behaviour in maximum significant wave height over the Southern Indian Ocean. Int. J. Climatol. 2017, 37, 4925–4937. [Google Scholar] [CrossRef]
- Von Storch, H.; Zwiers, F.W. Statistical Analysis in Climate Research; Cambridge University Press: Cambridge, UK, 1999. [Google Scholar] [CrossRef]
- Preisendorfer, R.W. Principal component analysis in meteorology and oceanography. Princ. Compon. Anal. Meteorol. Oceanogr. 1988, 17, 425. [Google Scholar]
- Chatfield, C.; Collins, A.J. Introduction to Multivariate Analysis; Springer: New York, NY, USA, 1980. [Google Scholar] [CrossRef]
- Mohamed, B.; Mohamed, A.; Alam El-Din, K.; Nagy, H.; Elsherbiny, A. Sea level changes and vertical land motion from altimetry and tide gauges in the Southern Levantine Basin. J. Geodyn. 2019, 128, 1–10. [Google Scholar] [CrossRef]
- Skliris, N.; Sofianos, S.; Gkanasos, A.; Mantziafou, A.; Vervatis, V.; Axaopoulos, P.; Lascaratos, A. Decadal scale variability of sea surface temperature in the Mediterranean Sea in relation to atmospheric variability. Ocean Dyn. 2012, 62, 13–30. [Google Scholar] [CrossRef]
- Mohamed, B.; Skliris, N. Steric and atmospheric contributions to interannual sea level variability in the eastern mediterranean sea over 1993–2019. Oceanologia 2022, 64, 50–62. [Google Scholar] [CrossRef]
- Ercha, A.; Zhang, D.; Ridley, A.J.; Xiao, Z.; Hao, Y. A global model: Empirical orthogonal function analysis of total electron content 1999–2009 data. J. Geophys. Res. Space Phys. 2012, 117, A03328. [Google Scholar]
- Wilks, D.S. Statistical Methods in the Atmospheric Sciences; Academic Press: New York, NY, USA, 2011; ISBN 0123850223. [Google Scholar]
- Hamed, K.H.; Ramachandra Rao, A. A modified Mann-Kendall trend test for autocorrelated data. J. Hydrol. 1998, 204, 182–196. [Google Scholar] [CrossRef]
- Jolliffe, I.T.; Uddin, M.; Vines, S.K. Simplified EOFs three alternatives to rotation. Clim. Res. 2002, 20, 271–279. [Google Scholar] [CrossRef][Green Version]
- Krzanowski, W.J. Principles of Multivariate Analysis: A User’s Perspective, 2nd ed.; Oxford University Press: Oxford, UK, 2000. [Google Scholar]
- James, E.; Overland, R.W. Preisendorfer A Significance Test for Principal Components Applied to a Cyclone Climatology. Mon. Weather Rev. 1982, 110, 1–4. [Google Scholar]
- Wang, F.; Shao, W.; Yu, H.; Kan, G.; He, X.; Zhang, D.; Ren, M.; Wang, G. Re-evaluation of the Power of the Mann-Kendall Test for Detecting Monotonic Trends in Hydrometeorological Time Series. Front. Earth Sci. 2020, 8, 14. [Google Scholar] [CrossRef]
- Zhao, Z.; Marin, M. A MATLAB toolbox to detect and analyze marine heatwaves. J. Open Source Softw. 2019, 4, 1124. [Google Scholar] [CrossRef]
- Ibrahim, O.; Mohamed, B.; Nagy, H. Spatial variability and trends of marine heat waves in the eastern mediterranean sea over 39 years. J. Mar. Sci. Eng. 2021, 9, 643. [Google Scholar] [CrossRef]
- Mohamed, B.; Nagy, H.; Ibrahim, O. Spatiotemporal Variability and Trends of Marine Heat Waves in the Red Sea over 38 Years. J. Mar. Sci. Eng. 2021, 9, 842. [Google Scholar] [CrossRef]
- Darmaraki, S.; Somot, S.; Sevault, F.; Nabat, P.; Cabos Narvaez, W.D.; Cavicchia, L.; Djurdjevic, V.; Li, L.; Sannino, G.; Sein, D.V. Future evolution of Marine Heatwaves in the Mediterranean Sea. Clim. Dyn. 2019, 53, 1371–1392. [Google Scholar] [CrossRef]
- Gunduz, M.; Özsoy, E.; Hordoir, R. A model of Black Sea circulation with strait exchange (2008–2018). Geosci. Model Dev. 2020, 13, 121–138. [Google Scholar] [CrossRef]
- Toderascu, R.; Rusu, E. Evaluation of the Circulation Patterns in the Black Sea Using Remotely Sensed and in Situ Measurements. Int. J. Geosci. 2013, 4, 1009–1017. [Google Scholar] [CrossRef]
Publisher’s Note: MDPI stays neutral with regard to jurisdictional claims in published maps and institutional affiliations. |
© 2022 by the authors. Licensee MDPI, Basel, Switzerland. This article is an open access article distributed under the terms and conditions of the Creative Commons Attribution (CC BY) license (https://creativecommons.org/licenses/by/4.0/).