Abstract
Understanding the spatiotemporal evolution and driving mechanisms of landslides following a mega-earthquake at the catchment scale can lead to improved landslide hazard assessment and reduced related risk. However, little effort has been made to undertake such research in the Wenchuan earthquake-affected region, outside Sichuan Province, China. In this study, we used the Goulinping valley in the Bailong River basin in southern Gansu Province, China, as an example. By examining the multitemporal inventory, we revealed various characteristics of the spatiotemporal evolution of landslides over the past 13 years (2007–2020). We evaluated the activity of landslides using multisource remote-sensing technology, analyzed the driving mechanisms of landslides, and further quantified the contribution of landslide evolution to debris flow in the catchment. Our results indicate that the number of landslides increased by nearly six times from 2007 to 2020, and the total volume of landslides approximately doubled. The evolution of landslides in the catchment can be divided into three stages: the earthquake driving stage (2008), the coupled driving stage of earthquake and rainfall (2008–2017), and the rainfall driving stage (2017–present). Landslides in the upstream limestone area were responsive to earthquakes, while the middle–lower loess–phyllite-dominated reaches were mainly controlled by rainfall. Thus, the current landslides in the upstream region remain stable, and those in the mid-downstream are vigorous. Small landslides and mid-downstream slope erosion can rapidly provide abundant debris flow and reduce its threshold, leading to an increase in the frequency and scale of debris flow. This study lays the foundation for studying landslide mechanisms in the Bailong River basin or similar regions. It also aids in engineering management and landslide risk mitigation under seismic activity and climate change conditions.
1. Introduction
Landslides cause catastrophic and significant economic and human losses worldwide [1]. In recent years, the incidence of landslides has increased owing to climate change and seismic activity [2,3,4]. Fragile rocks, fault structures, frequent earthquakes, and heavy and concentrated rainfall during monsoon periods make the eastern margin of the Tibetan Plateau a notable hotspot for landslide risk [5,6]. The Wenchuan earthquake in the region posed a great threat to people’s lives and property safety, triggered more than 15,000 landslides, and caused the deaths of more than 20,000 people in Sichuan Province [7,8,9]. Except for Sichuan Province, the Bailong River basin is one of the areas most seriously affected by the Wenchuan earthquake [10]. More than 800 landslides were triggered by seismic shaking along the Zhouqu–Wudu section [11,12]. Meanwhile, the earthquake reactivated the ancient landslides, such as the Sanjiadi and Hongtupo landslides [13,14]. According to the State Council Information Office of the People’s Republic of China (https://www.scio.gov.cn (accessed on 15 March 2022)), the Wenchuan earthquake caused 10,523 casualties (including 365 deaths) in the Gansu Province and the three hardest-hit areas were in the Bailong River basin. However, the landslide evolution and driving mechanisms of the catchment or region scale in this region are unclear, thus warranting the undertaking of relevant research.
Clarifying the spatiotemporal evolution pattern of landslides is vital for landslide-prone areas to better predict and mitigate disasters [15,16]. Most studies of rainfall- or earthquakes-induced landslides were focused on identifying the spatial pattern and potential risk of landslides, whereas the dynamic evolution processes of landslides at catchment or regional scale was ignored [17,18,19]. However, the evolution characteristics of landslides at the catchment scale can be well-reflected by spatiotemporal landslide inventories [20,21,22,23]. The spatial and temporal completeness of multitemporal inventories is of utmost importance in the study of landslide evolution at the catchment scale. Recently, many researchers have devoted themselves to researching the spatiotemporal evolution of landslides covering different types and mechanisms at the catchment scale following the Wenchuan earthquake to evaluate the long-term impacts of the earthquake on geological hazards [16,24,25,26,27,28]. In areas affected by such large earthquakes, the threat of landslides persists in the years following the earthquake, as intensified landslides and landscape erosion are induced by coseismic mass wasting [23,24]. However, these studies are mainly concentrated in Sichuan Province, while the effects on the Bailong River basin, which was also severely affected by the Wenchuan earthquake, remain poorly understood.
The classification of landslide activity can reflect the driving mechanisms of landslides and guide land-use planning, thus effectively reducing social and economic costs [29]. The evaluation of landslide activity is mainly based on optical images or interferometric synthetic aperture radars (InSAR) [24,25,30]. Optical remote sensing has great potential for monitoring seasonal changes in landslides [31]. In the last decade, unmanned aerial vehicles (UAV) have been widely used in landslide studies, offering users a more convenient way to obtain high-spatial-resolution optical images [32]. Even so, it is difficult to quantitatively analyze optical remote-sensing data and determine the process of landslide activity [22]. InSAR is a powerful technique with a comprehensive area coverage and high sensitivity to surface displacement [33,34]. It has good monitoring capability for quantitative analysis, but has limitations in terms of monitoring fast deformation areas, and some regions are decorrelated [22,31]. Using a single remote-sensing technology is often inefficient in accurately classifying the activity of all landslides in the region; thus, it is necessary to combine multiple remote-sensing techniques to enhance the accuracy of evaluating landslide activity.
Understanding the relationship between landslides and their driving mechanisms forms the basis for predicting future landslides and assessing landslide hazards [35,36,37]. Previous studies have shown that rainfall and earthquakes are the two principal mechanisms that induce landslides [37,38,39]. Several attempts have been made to establish relationships between rainfall levels and landslides [40,41,42,43,44]. In earthquake-affected areas, long-term slope destabilization was predicted because of monsoonal climatic conditions and the seismodynamic setting [45,46,47,48]. The spatial distribution and topographic context of rainfall-triggered and coseismic landslides in the same study area may differ [9,49]. Therefore, the coupling of the postearthquake effect and rainfall has been widely studied [45,46,47]. During the wet season, vast amounts of deposits loosened by landslides may lose stability due to rainfall infiltration and can easily evolve into deadly debris flows and trigger impressive chains of geohazards [23,49]. Hence, clarifying landslide spatial likelihood and driving mechanisms is critical for mitigating risk through proper countermeasures and reconstruction strategies.
In this study, we explored the spatiotemporal evolution pattern and driving mechanisms of landslides in a valley of the Bailong River basin, China, in the Wenchuan earthquake-affected region. To this end, we generated a multitemporal landslide inventory map and used multisource remote-sensing technology to classify landslide activity. Furthermore, we quantified the potential contribution of landslides to debris flows in this catchment. The novelty of this study is that combined multiple remote-sensing approaches to investigate the evolution pattern of landslides and the potential contribution of landslides to debris flow at the catchment scale in the Wenchuan earthquake-affected area outside Sichuan Province. It provides a valuable basis for constraining the control of landscape evolution and improving landslide risk management.
2. Study Area
The Bailong River basin is located in the transition zone between the Tibetan Plateau, Loess Plateau, and Sichuan basin in China, featuring high-relief and steeply-incised valleys [50,51]. Across the region, faults are extensively developed, and neotectonic movements are frequent, resulting in the widespread formation of fragmented rocks coupled with frequent downpours, making the region one of the four most disastrous areas in China [52]. There are 171 tributary valleys in the middle reaches of the Bailong River basin, and the intermediate-sized tributary valleys account for a primary proportion in this section. Most of them have hypsometric integrals values between 0.41 and 0.60, and relief between 1645 and 2405 m [53].
The Goulinping (GLP) valley is located in the middle section of the Bailong River basin. It is a representative small–medium tributary valley in this area in terms of relief, drainage, and hypsometric integrals [53]. It has high mountains and narrow valleys, with a watershed area of 20.15 km2 and a relief of 1947 m. The main channel is the first-level branch of the Bailong River, with a length of approximately 6.1 km and average ratio of approximately 17%, as shown in Figure 1. It is sourced from a high-relief carboniferous limestone area and subsequently passes through a low-relief Silurian phyllite area covered by Quaternary loess, before finally entering the Bailong River. The tectonic structure in the GLP was developed, and the Jiudun fault, which is the secondary fault of the Diebu–Bailongjiang fault zone, passes through the watershed. The rock layers have many folds, faults, and joints, and their lithology is weak and broken, providing prerequisites for geohazards, as is shown in Figure 2.
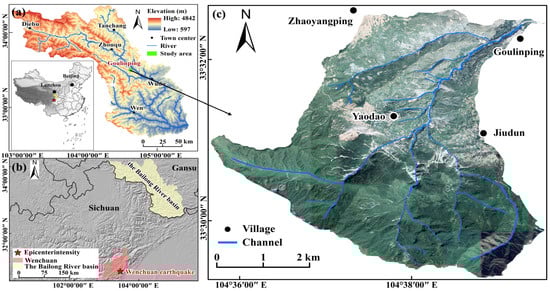
Figure 1.
Location of the study area. (a) Location of the Bailong River basin; (b) location of the Wenchuan earthquake epicenter; (c) location of the GLP (the optical image was produced in 2019).
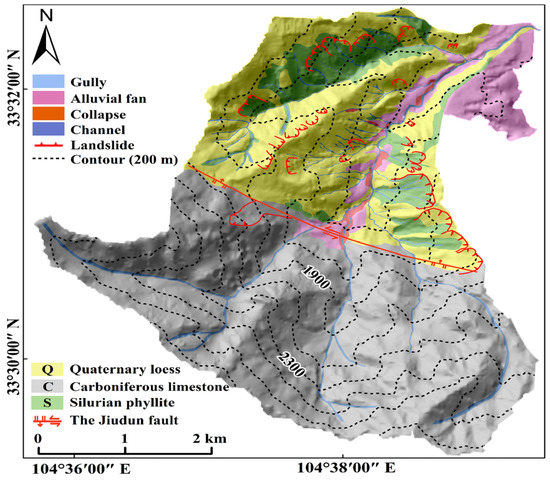
Figure 2.
Geomorphic map of the GLP.
Climatically, the monsoon strongly influences the study area, which is warm and humid in summer and cold and dry in winter [52]. The annual precipitation of the area is 487.2 mm, 75 to 85% of which falls between May and September [53]. The average annual precipitation varies across the valley, with the largest cumulative precipitation occurring in the upper–middle reaches and decreasing downstream (Figure 3). It should be emphasized that there have been several extreme rainfall events in recent years, the most serious being in August 2020, with an annual precipitation of nearly 800 mm. In this region, the average precipitation of August in the past 30 years was 59.4 mm, while it quadrupled to 258.9 in August 2020. Climatic conditions have triggered geohazards in the study area.
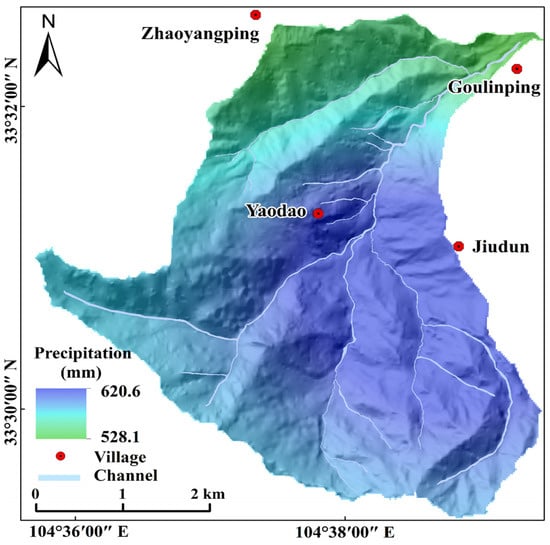
Figure 3.
Spatial distribution of rainfall in the GLP.
GLP has an active crust and is affected by surrounding mega-earthquakes, such as the 1654 Lixian M8.0 earthquake, the 1879 Southern Wudu (Wenxian) M8.0 earthquake, the 2008 Wenchuan M8.0 earthquake, and the 2017 Jiuzhaigou M7.0 earthquake. The study area is located in the VI intensity of the 1654 Lixian earthquake and the X intensity of the 1879 Southern Wudu (Wenxian) earthquake (Figure 4a,b). These two earthquakes triggered massive landslides in history, of which the 1879 Southern Wudu (Wenxian) earthquake had a more serious impact [54,55]. The mountain ecosystems have a strong resiliency following major geologic disturbances [56]. The 1879 Southern Wudu (Wenxian) earthquake occurred more than 100 years ago. As the landscape has evolved, the scars can be covered with vegetation, which makes them difficult to identify on remote-sensing images [57]. Due to the long history and sparse data of the 1879 Southern Wudu (Wenxian) earthquake, it is hard to make explicit its coseismic landslides, whereas it can be speculated that parts of the landslides in the study area before 2008 were affected by this earthquake. According to the China Earthquake Administration survey, the intensity of the Wenchuan earthquake in the study area is VII, while that of the Jiuzhaigou earthquake is less than VI (Figure 4c,d). The coseismic displacement of the Wenchuan earthquake measured using GPS is 53 mm [58]. Therefore, the Wenchuan earthquake is considered a mega-earthquake that has had a great impact on the study area in recent years. The research focuses on the landslide evolution after the Wenchuan earthquake.
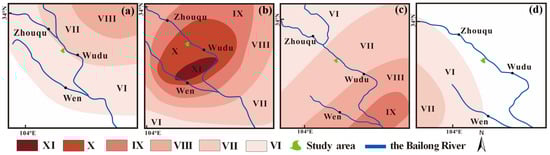
Figure 4.
The intensity of different earthquakes in the study area. (a) The intensity of the 1654 Lixian earthquake (Adapted with permission from Ref. [54]. 2017, Yuan et al.); (b) the intensity of the 1879 Southern Wudu (Wenxian) earthquake (Adapted with permission from Ref. [55]. 2014, Yuan et al.); (c) the intensity of the 2008 Wenchuan earthquake (the data comes from the China Earthquake Administration); (d) the intensity of the 2017 Jiuzhaigou earthquake (the data comes from the China Earthquake Administration).
3. Materials and Methods
3.1. Data
In this study, we used optical images from 2007 to 2020 (Table 1) for the landslide inventory, extraction of geomorphic factors based on digital elevation model (DEM) data with a resolution of 12.5 m from the advanced land-observing satellite (ALOS), small baseline subset (SBAS) InSAR calculated using SAR data from ENVISAT ASAR 2003–2010 and Sentinel-1A 2014–2020, precise orbit determination (POD) data, and a resolution of 30 m SRTM data; detailed information of the SAR data is presented in Table 2, and the coverages are shown in Figure 5. We used the moisture balance drought index (MBDI) to indicate regional soil moisture [59]. Sunshine, air temperature, and precipitation data were obtained from the Wudu meteorological station, while the rest of the precipitation data were obtained from rain gauges installed by our team in the study area, the detailed information of precipitation data is showed in Table 3.

Table 1.
Optical image data sources and information.
Table 2.
ENVISAT ASAR data and Sentinel-1A data information.
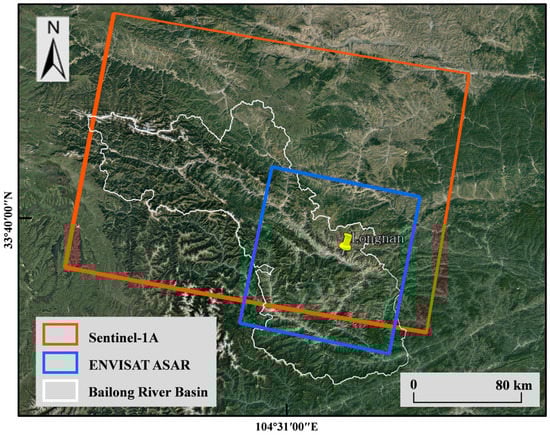
Figure 5.
ENVISAT ASAR data and Sentinel-1A data coverage.
Table 3.
Annual precipitation data of the study area.
3.2. Landslide Inventory
In this study, landslide catalogues were interpreted using multiple optical images from 2007 to 2020 and verified by field investigation in 2020. Owing to the limited image data, different data sources and time gaps exist. Landslides are interpreted according to image features, including shape, size, color, tone, spot, and texture [25,60,61,62,63,64,65]. Owing to the differences in the resolution of optical images from different sources, we considered only landslide areas larger than 100 m2, to avoid the impact on the subsequent statistical analysis. During the field investigation, the landslide cataloguing results were verified and supplemented. In addition, we collected the basic characteristic parameters of the landslides. According to the landslide classification criteria of Varnes (1978) and Hungr et al. (2014), landslides are classified into fall, slide, and flow, as is shown in Figure 6 [66,67].
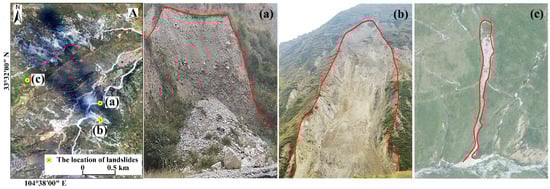
Figure 6.
Classification of landslides. A: The location of landslides; (a) fall; (b) slide; (c) flow.
3.3. SBAS–InSAR Technology
The SBAS–InSAR technology uses a multimaster image to obtain the interferogram of a short time and spatial baseline and extract the distributed point that maintains coherence in a period, which is suitable for the deformation monitoring of natural surfaces [68,69]. In this study, SBAS–InSAR technology based on SARscape software was used to process the ENVISAT ASAR datasets from 2003 to 2010 and Sentinel-1A datasets from 2014 to 2020. The SAR data were divided into three groups, and the connection graphs are shown in Figure 7; this was generated according to the maximum temporal baseline of 1000 days (2003–2008), 100 days (2008–2010), and 160 days (2014–2020) and the maximum normal baseline of 45%. The Goldstein filtering method was used to improve the signal-to-noise ratio of the differential interferogram, and the image pairs with low coherence, poor unwrapping effect, and serious influence of atmosphere and terrain were deleted. To eliminate the influence of the residual terrain phase on the results, 20 ground control points (GCPs), which were coherently higher than 0.85 and confirmed in the stable region by field investigation, were selected in the study area. The unwrapping phase obtained after removing the terrain phase was used to derive the remaining height and initial displacement using a linear model, and the singular value decomposition method was applied to search the least-squares solution for each coherent pixel and estimate the nonlinear deformation. After subtracting the estimated atmospheric artefacts and orbital ramps, the ultimate time-series deformation was inverted [70].
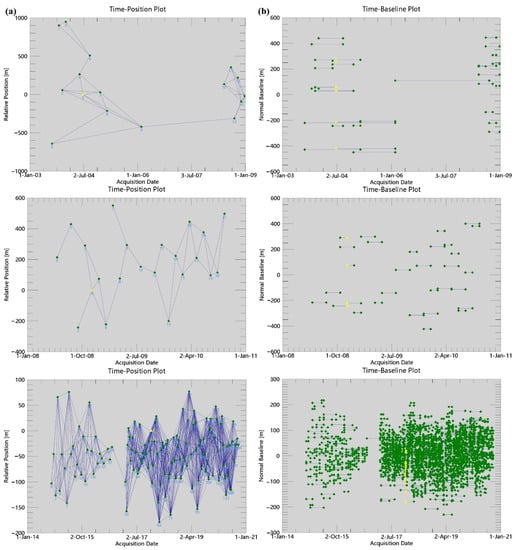
Figure 7.
Spatial and temporal baseline of the SAR image interferogram. (a) Time–position of SAR image interferometric pairs; (b) time–baseline of SAR image interferometric pairs. (The yellow points denote the master image, the green points denote the slave images, and the blue lines represent interferometric pairs.)
4. Results
4.1. Spatiotemporal Evolution of Landslides
Figure 8 and Figure 9a,b show the spatiotemporal inventory of landslides, changes in the number and area of landslides, and changes in the number and area of different types of landslides. The landslide area ranged from 102 m2 to 192,208 m2. Seventy-one landslides were developed in 2007, covering 8.78% of the study area and concentrated in the loess and weathered phyllite in the middle–lower reaches; their type was mainly slides. Compared to 2007, the number and area of landslides doubled in 2008. Most of the added landslides were developed in the upstream limestone area, mainly in falls and flows. The falls were developed on the steep slope with good free-face condition and the flows were developed on the concave slope covered by debris deposits; the number and area of landslides in subsequent years exhibited a moderate rise, and the spatial distribution of new landslides gradually shifted to the middle–lower reaches. Compared with previous years, the number and area increased significantly in 2020, with a total of 408 landslides developing and covering 17.7% of the study area. The new landslides are concentrated in the middle and lower reaches, and their spatial distribution is consistent with that in 2007; the type of these was mainly slides.
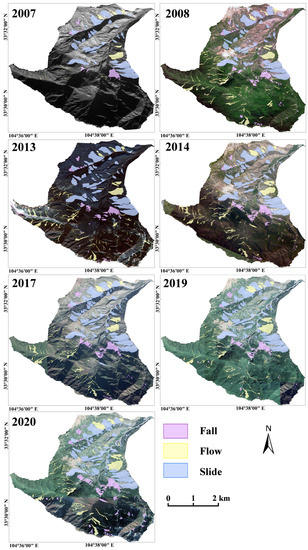
Figure 8.
Spatiotemporal inventory of landslides.
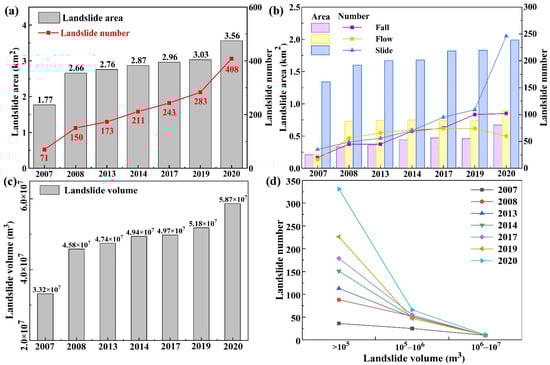
Figure 9.
Landslide change trends. (a) Changes in the number and area of landslides; (b) changes in the number and area of different types of landslides; (c) changes in the volume of landslides; (d) changes in the number of landslides with different volumes.
We estimated the landslide volume based on the field survey, literature data, and area–volume geometric scaling relationships, defined as:
where V is the landslide volume, A is the landslide area, a is a fit parameter, and b is the power-law exponent [71]. The method of calculating the volume of landslides was used in many studies [72,73,74]. We used 60 landslide data in an area range of 1.0 × 101–6.33 × 10⁵ m2 and volume range of 1.7 × 101–2.26 × 10⁷ m3 for fitting and obtained the fitting formula with V = 0.5505A1.3163 (R2 = 0.9538) to estimate the remaining landslide quantity in the study area. The accuracy of the total landslide volume depends on the quality of the individual volume measurements and the completeness of the landslide inventory. The landslide depth is an important parameter for landslide volume [75]. Most of the landslides are shallow in the study area; thus, we measured the depth of the landslide scarp with a laser rangefinder to represent its depth [76,77]. The volume of landslides measured in the field was obtained as the product of landslide area and the average landslide depth, meaning that the volume of landslides was probably overestimated [71]. Therefore, the area–volume empirical formula has certain uncertainties. Owing to the limitations of remote-sensing image resolution and terrain, some boundaries of small landslides which were located in unreachable mountain areas cannot be interpreted and verified precisely. Meanwhile, the connected small landslides were possibly delineated with a larger boundary. Therefore, the areas of small landslides may be enlarged and the volume was probably overestimated. However, the uncertainties do not affect the variation trend of landslide volume. Figure 9c,d show that the total volume of landslides increased from 3.32 × 10⁷ m3 (2007) to 5.87 × 10⁷ m3 (2020). Moreover, the volume of most landslides was less than 105 m3, and this number increased annually. The number of landslides increased at a constant rate from 2007 to 2019, and the growth rate in 2020 was relatively large compared to that in the previous period. A rapid growth was evident in the number of landslides with a volume between 105 and 106 m3 in 2008 and 2020, while the number of landslides in other years varied little. However, the number of landslides with a volume between 106 and 107 m3 remained unchanged for many years.
V = aAb
4.2. Effect of Terrain and Geomorphic Factors on Landslides
Terrain and geomorphic conditions control the distribution, scale, and types of landslides. The spatial distribution of landslides in various terrains and geomorphic factors in the study area is shown in Figure 10. Landslides were mainly distributed at 1300–1900 m, and their peak value shifted from to 1500–1700 m to 1300–1500 m from 2019. Simultaneously, the number of landslides higher than 1900 m increased after 2008 (Figure 10a). The landslides were mostly distributed at a slope gradient of 30–40°. However, compared to other years, the number of landslides at a slope gradient of 40–50° increased in 2008. Additionally, the number of landslides at a slope gradient of 20–30° increased considerably in 2020 (Figure 10b). Landslides occurred in all slope aspects but were mainly distributed in the SE direction in all years (Figure 10c). In terms of geomorphic distribution, the landslides were concentrated on slopes consisting of loess, phyllite, and limestone (Figure 10d). In 2007, the most landslides occurred in loess slopes. After 2008, the number of landslides that developed on limestone slopes increased markedly and then declined in 2020. In 2020, the number of landslides that developed in loess slopes reached a record high, and the geomorphic distribution trend of landslides recovered from a rate consistent with that of 2007.
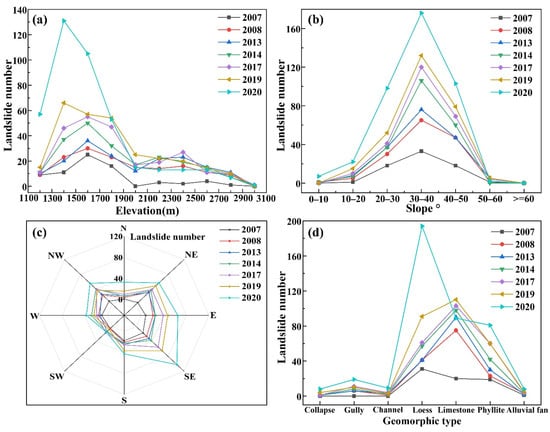
Figure 10.
Various characteristics of landslide distribution. (a) Elevation distribution of landslides; (b) slope distribution of landslides; (c) aspect distribution of landslides; (d) geomorphic distribution of landslides.
4.3. Landslide Activity
4.3.1. InSAR Results
By processing ENVISAT ASAR and Sentinel-1A data with the SBAS–InSAR technique, we obtained the surface deformation rates in the line-of-sight (LOS) of the study area from 2003 to 2020. Owing to the different data used, we transformed the results along the LOS into the slope direction based on the methods of Zhao et al. (2012) [78]. The formula used was the following:
where VSlope is the deformation in the slope direction; VLos is the deformation in the LOS direction; θ is the incidence angle; α is the satellite flight azimuth; β is the slope angle above the horizontal surface; ϕ is the slope azimuth. According to the formula, when the numerator approaches zero, the VSlope tends to infinity. Therefore, we used 0.3 to replace the value of 0 to 0.3 and used −0.3 to replace the value of −0.3 to 0. When the VSlope was greater than 0, the material moved upwards along the slope direction. This situation generally does not exist, except for the rock layer reverse. Therefore, we removed VSlope values greater than zero (Figure 11). The results show that from 2003 to 2006 (Figure 11a), in the phyllite slope in the north of Jiudun (Figure 11d), the maximum deformation rate was −60 mm/a, and the deformation region was small. The deformation was more significant from 2008 to 2010 (Figure 11b) than during the previous stage. The deformation region was enlarged within the red circle and was more severe, reaching −105 mm/a. After 2014 (Figure 11c), the slopes near Jiudun village and some parts of the branch ditch gradually formed major deformations. Compared with the previous stage, the deformation of the slope in the northern part of Jiudun was exacerbated, and the maximum deformation rate increased to −120 mm/a. Based on the field investigation, flow landslide with serious erosion is marked with a red circle in Figure 10d. Additionally, we found the seepage of rock mass in the lower part of the landslide (Figure 11e), which indicates that pore or fissure water were developed in the landslide, the strength of rock decreased, and the deformation of the slope was aggravated.
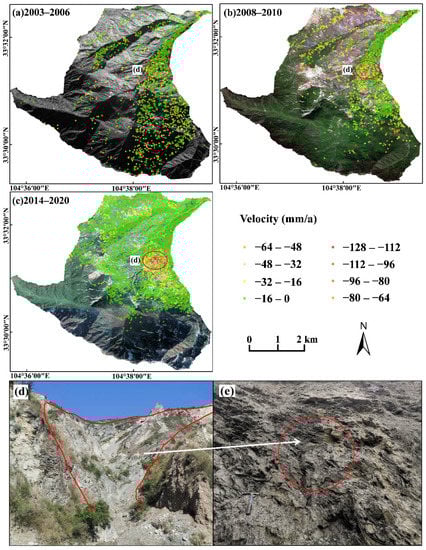
Figure 11.
Deformation rate in the slope direction and severely deformed slope. (a) Deformation from 2003 to 2006; (b) deformation from 2008 to 2010; (c) deformation from 2014 to 2020; (d) severely deformed landslide; (e) position of water seepage.
4.3.2. Landslide Activity Based on Optical Remote-Sensing and InSAR Technology
In this study, we classified landslides as active, dormant, reactivated, and new according to the definitions of landslide activity by UNESCO-WP/WLI (1993) [79]. Using SBAS–InSAR technology, we chose peak velocities to represent landslide motion and evaluated landslide activity by comparing the historical (VH) and present (VP) representative velocities of each landslide [30,80]. Thus, we gave the maximum possible sliding or reactivation range. Owing to the lack of SAR data, the SBAS–InSAR results from 2003 to 2006 represented the landslide activity before the earthquake. Based on the SBAS–InSAR results, the stable threshold was set to −16 mm/a through statistical analysis of the results and field investigations [81,82]. The complex relief and rapid deformation in some parts of the study area will lead to the incoherence of InSAR results [73]. A reliable and robust interpretation of landslide motion rates includes those phenomena with a density of coherent targets (CTs) of up to 20–30 km2 and at least three within the landslide [30,83]. Thus, when the number of CTs was insufficient, a comparison of the two optical images before and after was used to supplement the activity of some landslides [24]. The classification criteria are presented in Table 4.
Table 4.
Classification criteria of landslide activity in this study.
The distribution of landslide activity is shown in Figure 12, and the quantitative statistics are shown in Figure 13. The results showed that 25 active landslides and 46 dormant landslides were initially detected (2007). The active landslides were concentrated near Jiudun village in the middle–upper reaches, and sporadic active landslides were also observed on both sides of the main and secondary channels. In 2008, many dormant landslides were reactivated, and abundant new landslides were found. Regarding landslide distribution, new landslides were located in high mountain limestone. From 2017 to 2019, the number of dormant landslides exhibited a steady upward trend. The restored stable landslides were mainly coseismic landslides of the Wenchuan earthquake, while the concentrated areas of active, new, and reactivated landslides gradually recovered to the same level as that before the Wenchuan earthquake. However, many dormant landslides were reactivated in 2020. The number of active and new landslides increased, and the new landslides were mainly distributed in the middle–lower section. Based on the spatiotemporal distribution of active landslides, the landslides triggered by the Wenchuan earthquake were mainly located on the upstream and steep slopes, while the landslides induced by seasonal rainfall were mainly concentrated in the middle–lower reaches. The activity of coseismic landslides generated by the 2008 Wenchuan earthquake gradually decreased. Numerous coseismic landslides recovered to stability from 2017 to 2019, indicating that the postseismic effect of the Wenchuan earthquake on landslides lasted nearly 10 years. During these 10 years, the gradual weakening of the postseismic effect gradually led to the distribution of active landslides to the middle and lower reaches of the basin.
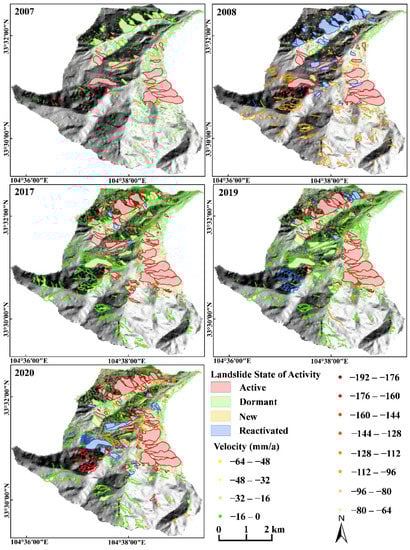
Figure 12.
Distribution of landslide activity in different years.
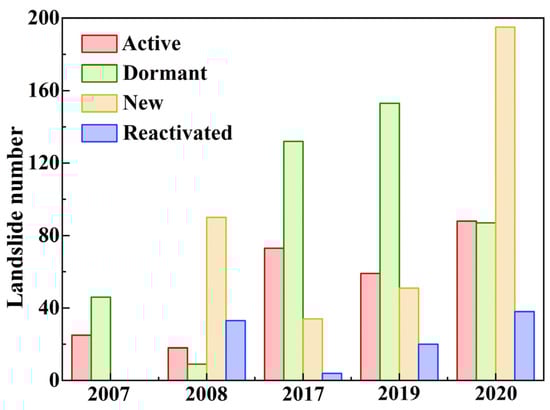
Figure 13.
Number of landslide activity types in different years.
4.3.3. Characteristics of Landslide Time Series
To quantify the variation in the landslide displacement rate over time and better reveal the process and stage of landslide deformation, we selected some representative landslides to study the characteristics of the landslide time series. Based on different landslide types and the distribution of the SBAS–InSAR results, we selected 11 landslides from 2008 to 2010 and 25 landslides from 2014 to 2020 as representative landslide sets in the study area. We selected the 75th percentile CTs values within the landslide body to observe temporal variation [84]. Landslides are caused by surface and subsurface saturation. Therefore, the landslide representative set velocity was normalized to analyze the relationship between the change in landslide velocity and MBDI, as shown in Figure 14. The time-series rate change of the landslides shows that the deformation presented continuous and seasonal changes. On a long-term scale, the deformation was related to the MBDI, and the landslide movement was most significant from May to October each year. On a short-term scale, there was hysteresis in the movement of landslides caused by water gradually infiltrating the slope through various pathways. The velocity of some landslides peaked after the Wenchuan earthquake, and it gradually decreased until the MBDI increased. In addition, some landslides did not reach their peak movement rate immediately after the earthquake, but their velocities increased significantly. Under the combined effect of water, landslide velocity peaked in August and September 2008 and then gradually decreased, showing seasonal cycle changes affected by MBDI. Owing to the heterogeneity of landslides, their response to soil moisture varied; however, it was clear that extreme rainfall events in August 2020 resulted in an increase in most landslide movement rates in the study area.
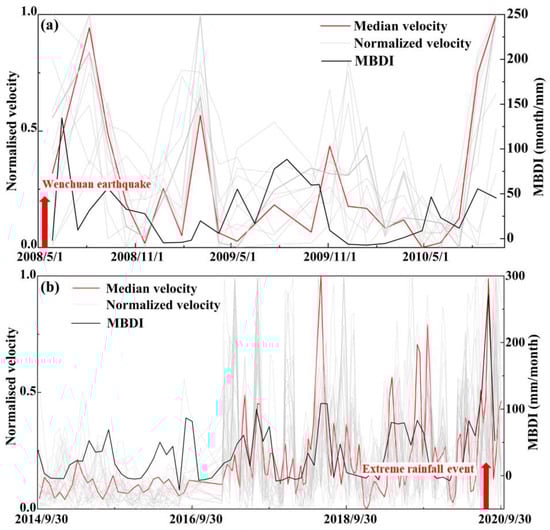
Figure 14.
Normalized velocity time series and the moisture balance drought index (MBDI). (a) Eleven representative landslides from 2008 to 2010; (b) twenty-five representative landslides from 2014 to 2020.
5. Discussion
5.1. Landslide Driving Mechanism and Evolution Pattern
After the earthquake, the landslide density of the areas at elevations above 1900 m exhibited an incremental trend (Figure 10a). A comparison of the data prior to and after the earthquake showed that few pre-earthquake landslides were distributed in locations with a slope in the 40–50°, while the opposite was true for coseismic and postseismic landslides (Figure 10b). Moreover, there were numerous new landslides at the ridge or areas with local variations in topography and morphology (Figure 8). Various studies have justified that the role of topographic amplification of ground motion accelerates the initiation of slope failures and significantly modifies across different parts of hillslopes [85,86,87,88]. The probability of slope failure becomes larger along ridgelines and changes in slope [86,87,88]. Furthermore, the contribution of amplification effects also appears at steep slopes and higher altitudes [85]. Thus, compared with the middle–lower reaches of the river valley, the Wenchuan earthquake has a greater impact on the upstream. After the earthquake, cracks formed on the slopes. The formation of cracks made slopes vulnerable to failure by subjecting them to rain seepage. Under the coupling effect of rainfall, the shear capacity of the slopes gradually decreased and eventually formed landslides. As these cracks led to the development of landslides, the postearthquake effects wore off. Therefore, the number of landslides in the upper limestone area increased between 2008 and 2014. From 2017 to 2019, the activity of landslides upstream decreased, and many coseismic landslides recovered and stabilized. It can be inferred that the study area was significantly affected by the postearthquake effects from 2008 to 2014, while the postearthquake effects gradually weakened after 2014, and the coseismic landslides were stable until approximately 2017.
As is shown in Figure 15, the number of landslides corresponds to annual precipitation. During heavy rainfall, the number of landslides increased significantly, while when the rainfall was slight, the increase in the number of landslides was not significant. By comparing the relationship between annual rainfall and landslide activity, we found that there were more active landslides in years with high rainfall. Figure 3 shows the rainfall distribution in the valley. Although rainfall was more abundant upstream, the impact of rainfall was unnoticeable owing to the shear strength of limestone. In the middle reaches near Jiudun-Yaodao, rainfall was heavy. This area consists of weak loess and weathered phyllite that can lead to landslides under the influence of rainfall. Before the earthquake, landslides were mainly distributed in the middle-lower reaches, and active landslides were concentrated in the vicinity of Jiudun-Yaodao. After the earthquake, with the weakening of the postearthquake effect, rainfall gradually enhanced landslide control in the study area. The new landslides gradually moved to the middle–lower reaches. When there was extreme rainfall in the valley in 2020, many reactivated and new landslides were concentrated in the middle–lower reaches. Therefore, in the study area, landslides triggered by rainfall were mainly concentrated in the middle–lower reaches and a few upstream regions. In addition, the rainfall in this region exhibited a trend of gradual increase, as is shown in Figure 15. Based on the five-year average rainfall of less than 400 mm in 1995–2000 to nearly 600 mm in 2015–2020, it can be inferred that rainfall will exhibit an upward trend in the future. An increase in rainfall may make the existing landslides more active, and more new landslides will occur.
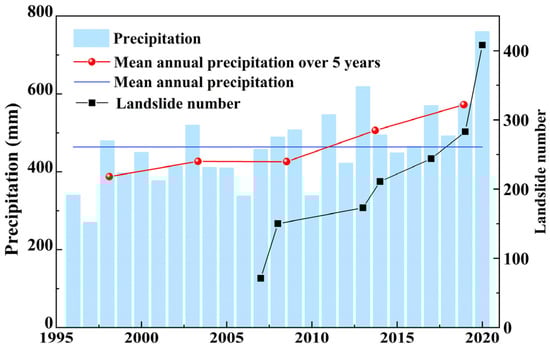
Figure 15.
Precipitation and landslide number.
The land use has changed slightly since 2007 (Figure 16). Road engineering is the most important triggering factor of anthropogenic nature. It has been reported that roads in the upstream limestone area were built after the 2008 earthquake. Building roads through mountains provides the slope with good free-face conditions, which can easily trigger landslides. As is shown in Figure 8, there were some landslides along the road upstream, which is another reason for the increase in the number of landslides in this region after 2008. In addition, there has been road construction near Jiudun and Yaodao villages in recent years. Owing to the destruction of the original slopes caused by various engineering constructions, landslides are easily formed under seasonal rainfall. Human activities will amplify the likelihood of landslides triggered by seasonal rainfall. However, compared with the landslides triggered by rainfall and earthquake, landslides caused by human activities were relatively rare, with 29 landslides located on road slopes until 2020, accounting for 7% of the total number of landslides. Therefore, road construction is not the dominant driving mechanism of landslides in the study area. The landslides associated with human activity have a weak influence on the overall evolution pattern of the study area, so we do not conduct in-depth discussion.
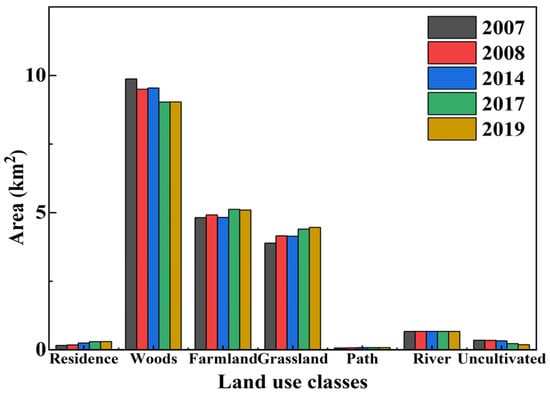
Figure 16.
Land use in different years.
Based on the landslide evolution and driving mechanisms in the study area, we developed a conceptual model for the landslide evolution of the catchment (Figure 17). Before the earthquake, the landslides were primarily controlled by rainfall, most landslides were in the middle–lower section, and a few landslides were active (Figure 17a). In the upper reaches, much landslides and slope damages were caused by the earthquake. At the same time, the earthquake enhanced the activity of the existing landslides (Figure 17b). After the earthquake, the coseismic landslides gradually stabilized. Under the coupling effect of rainfall, the cracks upstream gradually developed into landslides. The spatial distribution of active landslides gradually shifted to the middle–lower reaches. The loose sediment of the landslides accumulated on the slope and channel and provided plentiful material for debris flow (Figure 17c). Currently, landslides are mainly driven by rainfall, and most of them are small slide landslides that have developed in the middle–lower sections. Abundant materials were deposited in the channel (Figure 17d).
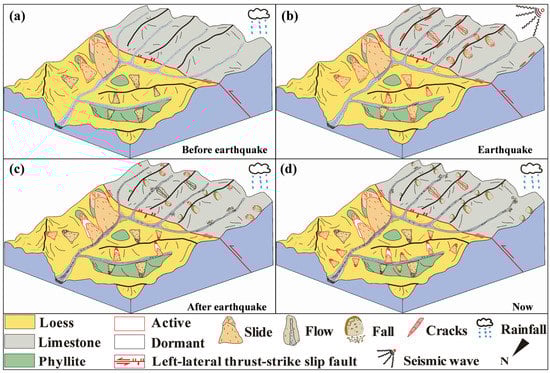
Figure 17.
Conceptual model of landslide evolution in the study area. (a) Before earthquake; (b) during the earthquake; (c) after earthquake; (d) now.
5.2. Contribution of Landslide and Surface Erosion to Debris Flow
The study area is a typical high-frequency debris flow catchment, with debris flows occurring six times per year on average [89]. Three main factors control debris flow formation [90]. The volume of source material in a catchment is the most significant. Many landslides cause loose material to accumulate on hillslopes and channels, which increases the susceptibility of debris flows. To quantify the potential debris flow source provided by landslides, we divided the catchment into 15 sub-catchments and combined them with the landslide sediment supply capacity (ISl) to estimate the landslide potential material source [91]. The potential source quantity provided by landslide sediment for debris flows each year is shown in Figure 18. The variation trend of the potential source provided by landslides was generally consistent with that of the number of landslides, except for 2017. As the ISl index decreased in 2017, the volume also decreased slightly. According to the existing debris flow records and information gathered from local villagers, in recent years, the number of debris flows occurring in the basin was the highest in 2020, and these scales were more prominent than in previous years. Corresponding to the potential source, the volume in 2020 increased significantly compared to those in previous years. The additional landslides in this year were mainly small landslides. Small landslides induced by heavy rainfall can rapidly change the volume of channel material [92]. Therefore, it can be inferred that small landslides are an important source of debris flows.
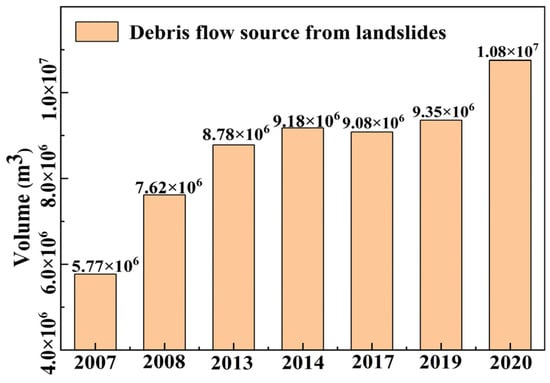
Figure 18.
Contribution of landslide sediment to debris flow.
Furthermore, the surface erosion of slopes also significantly contributes to debris flow material sources. In a debris flow gully, erosion is distributed throughout the entire catchment; therefore, based on the SBAS–InSAR results, the obtained deformation data were used to estimate the volume of erosion occurring in the entire basin via statistical calculations performed based on the method of Cao et al. (2021) [90]. From 2014 to 2020, the catchment generated approximately 3.90 × 10⁵ m3 of slope erosion. As is shown in Figure 11c, owing to excellent water retention, the slope erosion intensity of the upper reaches with high vegetation cover was low. Erosion principally occurred on both sides of the gully in the middle–lower reaches. Thus, the erosion material of the slope originated mainly from the middle to the lower reaches. Overall, the greater the rainfall, the greater the amount of erosion. The annual amount of erosion from January to October from 2017 to 2020 is shown in Figure 19a. The amount of erosion in 2018 was the lowest, approximately 3.05 × 10⁴ m3, and the amount of erosion in 2020 was the highest, at approximately 8.31 × 10⁴ m3. Taking 2020 as an example, the time-series analysis of slope erosion within a year showed that the slope erosion in summer and autumn was greater than that in spring and winter (Figure 19b). Existing debris flow records show that debris flow occurred mainly from May to October, corresponding to slope erosion and landslide movement [51]. At the same time, the debris flow events that occurred in August 2020, corresponding to landslide activity and surface erosion at that time, were relatively large. Therefore, the intensification of landslides and surface erosion increased the material source of debris flow and the risk of a disaster chain.
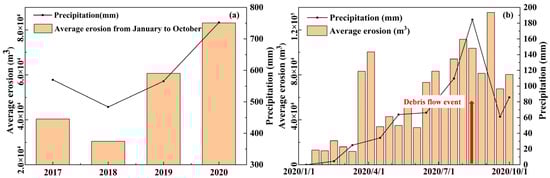
Figure 19.
Changes in the surface erosion of slopes. (a) Relationship between the average erosion and precipitation from January to October; (b) relationship between time-series erosion and precipitation in 2020.
As this study was based only on remote-sensing data and field investigations, it is impossible to determine the relevant landslide process from stability to activity. Therefore, it is necessary to conduct further studies based on field experiments or physical models in the later stages to explore the physical mechanisms triggering landslides from a microscopic perspective. In the future work, we will conduct geophysical investigation to obtain more accurate parameters. The connected landslides are partitioned into individual landslides based on the methods of Fan et al. (2019) [93]. Thus, the accuracy of landslide volume calculation can be improved and we will estimate a more exact contribution to debris flow.
6. Conclusions
In this study, Goulinping valley, a typical medium–small catchment in the Bailong River basin, was used as the research area. A multitemporal inventory map and field investigation results revealed the spatiotemporal evolution pattern of landslides. We used multisource remote-sensing technology to evaluate landslide activity and analyze the driving mechanisms of landslides. Moreover, we quantified the potential contribution of landslides to debris flows in this catchment. The following conclusions were drawn from this study:
- (1)
- The number of landslides increased nearly six times in 13 years (from 71 in 2007 to 408 in 2020), and the total volume of landslides approximately doubled (from 3.32 × 10⁷ m3 in 2007 to 5.87 × 10⁷ m3 in 2020). The growth was most significant in 2008 and 2020, and the volume of added landslides was less than 105 m3.
- (2)
- Landslides are mainly driven by rainfall and earthquake, and the responses of different lithologic strata to disturbances showed apparent differences. The evolution of landslides in the catchment can be divided into three stages. During the earthquake driving stage (2008), the coseismic landslides were mainly distributed in the limestone area, and the landslides in the catchment were primarily active. During the coupled driving stage of earthquake and rainfall (2008–2017), the damage of seismic rock mass in the limestone area developed into landslides, and the active landslides gradually concentrated in the loess–phyllite area. During the rainfall driving stage (2017–the present), rainfall triggered small landslides in the loess–phyllite region, the landslides in the limestone area were stable, and in the loess–phyllite area they were active. Human activities have a relatively small influence on landslides instead of the dominant control.
- (3)
- Small landslides and mid-downstream slope erosion mainly determine the frequency and scale of debris flow. Many small landslides can rapidly provide abundant debris flow sources and reduce the threshold of debris flow, leading to an increase in the frequency and scale of debris flow. The upper reaches, with good vegetation cover, had a certain degree of soil and water conservation. Hence, vast slope erosion materials originated from the middle–lower reaches. When the rainfall intensity was high, the slope erosion intensified, making an outstanding contribution to debris flow.
Author Contributions
L.L.: methodology, software, validation, formal analysis, investigation, data curation, writing—original draft preparation, writing—review and editing, visualization; G.C.: conceptualization, formal analysis, investigation, resources, writing—review and editing, supervision, project administration, funding acquisition; W.S.: methodology, software, investigation; J.J.: investigation, data curation; J.W.: investigation, data curation; F.H.: investigation, data curation; Y.C.: investigation, data curation; Y.M.: investigation; Y.L.: investigation, resources; Y.Z.: software, resources. All authors have read and agreed to the published version of the manuscript.
Funding
This study was supported by the Second Tibetan Plateau Scientific Expedition and Research Program (STEP) (Grant No. 2021QZKK0201), National Key Research and Development Program of China (Grant No. 2017YFC1501005), Key Research and Development Program of Gansu Province (Grant No. 20YF8FA074), Science and Technology Major Project of Gansu Province (Grant No. 19ZD2FA002), the Fundamental Research Funds for the Central Universities (Grant No. lzujbky-2021-16), Geohazard prevention project of Gansu Province (Grant No. CNPC-B-FS2021012).
Data Availability Statement
The ENVISAT ASAR, Sentinel-1A, and precise orbits dates were provided by the European Space Agency. The SRTM3 DEM data were provided by NASA. We thank Japan Aerospace Exploration Agency for providing the 12.5 m DEM data and China Meteorological Data Network for providing the meteorological data.
Acknowledgments
We thank Yan Zhao, Wanyu Jiang, Shiqiang Bian, Yunpeng Yang, Hongxue Zhang, Yuanxi Li, Yiwen Liang and Wangcai Liu for their suggestions on software operation and data analysis. We are grateful to the editorial office and four anonymous reviewers for their constructive suggestions and comments to improve the paper.
Conflicts of Interest
The authors declare no conflict of interest.
References
- Petley, D. Global patterns of loss of life from landslides. Geology 2012, 40, 927–930. [Google Scholar] [CrossRef]
- Crozier, M.J. Deciphering the effect of climate change on landslide activity: A review. Geomorphology 2010, 124, 260–267. [Google Scholar] [CrossRef]
- Haque, U.; Da Silva, P.F.; Devoli, G.; Pilz, J.; Zhao, B.; Khaloua, A.; Wilopo, W.; Andersen, P.; Lu, P.; Lee, J.; et al. The human cost of global warming: Deadly landslides and their triggers (1995–2014). Sci. Total Environ. 2019, 682, 673–684. [Google Scholar] [CrossRef] [PubMed]
- Fan, X.; Scaringi, G.; Korup, O.; West, A.J.; Westen, C.J.; Tanyas, H.; Hovius, N.; Hales, T.C.; Jibson, R.W.; Allstadt, K.E.; et al. Earthquake-Induced Chains of Geologic Hazards: Patterns, Mechanisms, and Impacts. Rev. Geophys. 2019, 57, 421–503. [Google Scholar] [CrossRef] [Green Version]
- Lin, Q.; Wang, Y. Spatial and temporal analysis of a fatal landslide inventory in China from 1950 to 2016. Landslides 2018, 15, 2357–2372. [Google Scholar] [CrossRef]
- Qi, T.; Meng, X.; Qing, F.; Zhao, Y.; Shi, W.; Chen, G.; Zhang, Y.; Li, Y.; Yue, D.; Su, X.; et al. Distribution and characteristics of large landslides in a fault zone: A case study of the NE Qinghai-Tibet Plateau. Geomorphology 2021, 379, 107592. [Google Scholar] [CrossRef]
- Yin, Y.; Wang, F.; Sun, P. Landslide hazards triggered by the 2008 Wenchuan earthquake, Sichuan, China. Landslides 2009, 6, 139–152. [Google Scholar] [CrossRef]
- Qi, S.; Xu, Q.; Lan, H.; Zhang, B.; Liu, J. Spatial distribution analysis of landslides triggered by 2008.5.12 Wenchuan Earthquake, China. Eng. Geol. 2010, 116, 95–108. [Google Scholar] [CrossRef]
- Bai, S.; Lu, P.; Thiebes, B. Comparing characteristics of rainfall- and earthquake-triggered landslides in the Upper Minjiang catchment, China. Eng. Geol. 2020, 268, 105518. [Google Scholar] [CrossRef]
- Zhong, X.; Chen, W.; Hou, J.; Yuan, X. Distribution rules of geo-hazards induced by Wenchuan Earthquake. Chin. J. Geotech. Eng. 2011, 33, 356–360. (In Chinese) [Google Scholar]
- Bai, S.; Cheng, C.; Wang, J.; Thiebes, B.; Zhang, Z. Regional scale rainfall- and earthquake-triggered landslide susceptibility assessment in Wudu County, China. J. Mt. Sci. Engl. 2013, 10, 743–753. [Google Scholar] [CrossRef]
- Bai, S.; Wang, J.; Zhang, Z.; Cheng, C. Combined landslide susceptibility mapping after Wenchuan earthquake at the Zhouqu segment in the Bailongjiang Basin, China. Catena 2012, 99, 18–25. [Google Scholar] [CrossRef]
- Liao, P.; Wu, W.; Zhe, X. Stability assessment and treatment for Hongtupo landslide in severe disaster area of southern Gansu induced by Wenchuan earthquake. J. Eng. Geol. 2012, 20, 204–212. (In Chinese) [Google Scholar] [CrossRef]
- Wu, W.; Liao, P. An analysis of the treatment effect for Sanjiadi landslide in Wudu county, a heavy disaster area during the Wenchuan earthquake. J. Lanzhou Univ. Nat. Sci. 2014, 50, 633–638. (In Chinese) [Google Scholar] [CrossRef]
- Guzzetti, F.; Mondini, A.C.; Cardinali, M.; Fiorucci, F.; Santangelo, M.; Chang, K. Landslide inventory maps: New tools for an old problem. Earth-Sci. Rev. 2012, 112, 42–66. [Google Scholar] [CrossRef] [Green Version]
- Chen, M.; Tang, C.; Xiong, J.; Shi, Q.Y.; Li, N.; Gong, L.F.; Wang, X.D.; Tie, Y. The long-term evolution of landslide activity near the epicentral area of the 2008 Wenchuan earthquake in China. Geomorphology 2020, 367, 107317. [Google Scholar] [CrossRef]
- Yang, H.; Yang, T.; Zhang, S.; Zhao, F.; Hu, K.; Jiang, Y. Rainfall-induced landslides and debris flows in Mengdong Town, Yunnan Province, China. Landslides 2020, 17, 931–941. [Google Scholar] [CrossRef]
- Xu, C.; Xu, X.; Shyu, J.B.H. Database and spatial distribution of landslides triggered by the Lushan, China Mw 6.6 earthquake of 20 April 2013. Geomorphology 2015, 248, 77–92. [Google Scholar] [CrossRef] [Green Version]
- Cevasco, A.; Pepe, G.; Brandolini, P. The influences of geological and land use settings on shallow landslides triggered by an intense rainfall event in a coastal terraced environment. Bull. Eng. Geol. Environ. 2014, 73, 859–875. [Google Scholar] [CrossRef]
- Guzzetti, F.; Reichenbach, P.; Cardinali, M.; Galli, M.; Ardizzone, F. Probabilistic landslide hazard assessment at the basin scale. Geomorphology 2005, 72, 272–299. [Google Scholar] [CrossRef]
- Galli, M.; Ardizzone, F.; Cardinali, M.; Guzzetti, F.; Reichenbach, P. Comparing landslide inventory maps. Geomorphology 2008, 94, 268–289. [Google Scholar] [CrossRef]
- Bozzano, F.; Mazzanti, P.; Perissin, D.; Rocca, A.; De Pari, P.; Discenza, M. Basin Scale Assessment of Landslides Geomorphological Setting by Advanced InSAR Analysis. Remote Sens. 2017, 9, 267. [Google Scholar] [CrossRef] [Green Version]
- Fan, X.; Juang, C.H.; Wasowski, J.; Huang, R.; Xu, Q.; Scaringi, G.; van Westen, C.J.; Havenith, H. What we have learned from the 2008 Wenchuan Earthquake and its aftermath: A decade of research and challenges. Eng. Geol. 2018, 241, 25–32. [Google Scholar] [CrossRef]
- Tang, C.; Westen, C.; Tanyaş, H.; Jetten, V.G. Analysing post-earthquake landslide activity using multi-temporal landslide inventories near the epicentral area of the 2008 Wenchuan earthquake. Nat. Hazard Earth Syst. 2016, 16, 2641–2655. [Google Scholar] [CrossRef] [Green Version]
- Yang, W.; Qi, W.; Wang, M.; Zhang, J.; Zhang, Y. Spatial and temporal analyses of post-seismic landslide changes near the epicentre of the Wenchuan earthquake. Geomorphology 2017, 276, 8–15. [Google Scholar] [CrossRef]
- Fan, X.; Domènech, G.; Scaringi, G.; Huang, R.; Xu, Q.; Hales, T.C.; Dai, L.; Yang, Q.; Francis, O. Spatio-temporal evolution of mass wasting after the 2008 Mw 7.9 Wenchuan earthquake revealed by a detailed multi-temporal inventory. Landslides 2018, 15, 2325–2341. [Google Scholar] [CrossRef]
- Zhang, S.; Zhang, L.; Lacasse, S.; Nadim, F. Evolution of Mass Movements near Epicentre of Wenchuan Earthquake, the First Eight Years. Sci. Rep. 2016, 6, 36154. [Google Scholar] [CrossRef] [Green Version]
- Zhang, S.; Zhang, L.M. Impact of the 2008 Wenchuan earthquake in China on subsequent long-term debris flow activities in the epicentral area. Geomorphology 2017, 276, 86–103. [Google Scholar] [CrossRef]
- Parise, M.; Wasowski, J.; Carrara, A.; Guzzetti, F. Landslide activity maps for landslide hazard evaluation; three case studies from southern Italy. Nat. Hazards 1999, 20, 159–183. [Google Scholar] [CrossRef]
- Cigna, F.; Bianchini, S.; Casagli, N. How to assess landslide activity and intensity with Persistent Scatterer Interferometry (PSI): The PSI-based matrix approach. Landslides 2013, 10, 267–283. [Google Scholar] [CrossRef] [Green Version]
- Stumpf, A.; Malet, J.; Delacourt, C. Correlation of satellite image time-series for the detection and monitoring of slow-moving landslides. Remote Sens. Environ. 2017, 189, 40–55. [Google Scholar] [CrossRef]
- Comert, R.; Avdan, U.; Gorum, T.; Nefeslioglu, H.A. Mapping of shallow landslides with object-based image analysis from unmanned aerial vehicle data. Eng. Geol. 2019, 260, 105264. [Google Scholar] [CrossRef]
- Strozzi, T.; Ambrosi, C.; Raetzo, H. Interpretation of Aerial Photographs and Satellite SAR Interferometry for the Inventory of Landslides. Remote Sens. 2013, 5, 2554–2570. [Google Scholar] [CrossRef] [Green Version]
- Akbarimehr, M.; Motagh, M.; Haghshenas-Haghighi, M. Slope Stability Assessment of the Sarcheshmeh Landslide, Northeast Iran, Investigated Using InSAR and GPS Observations. Remote Sens. 2013, 5, 3681–3700. [Google Scholar] [CrossRef] [Green Version]
- Borgomeo, E.; Hebditch, K.V.; Whittaker, A.C.; Lonergan, L. Characterising the spatial distribution, frequency and geomorphic controls on landslide occurrence, Molise, Italy. Geomorphology 2014, 226, 148–161. [Google Scholar] [CrossRef]
- Gibson, A.D.; Culshaw, M.G.; Dashwood, C.; Pennington, C.V.L. Landslide management in the UK—the problem of managing hazards in a ‘low-risk’ environment. Landslides 2013, 10, 599–610. [Google Scholar] [CrossRef] [Green Version]
- Schuster, R.L.; Nietothomas, A.S.; O’Rourke, T.D.; Crespo, E.; Plaza-Nieto, G. Mass wasting triggered by the 5 March 1987 ecuador earthquakes—ScienceDirect. Eng. Geol. 1996, 42, 1–23. [Google Scholar] [CrossRef]
- Keeper, D.K. Landslides caused by earthquakes. Bull. Geol. Soc. Am. 1984, 95, 406. [Google Scholar] [CrossRef]
- Crosta, G.B. Introduction to the special issue on rainfall-triggered landslides and debris flows. Eng. Geol. 2004, 73, 191–192. [Google Scholar] [CrossRef]
- Gabet, E.J.; Burbank, D.W.; Putkonen, J.K.; Pratt-Sitaula, B.A.; Ojha, T. Rainfall thresholds for landsliding in the Himalayas of Nepal. Geomorphology 2004, 63, 131–143. [Google Scholar] [CrossRef]
- Guzzetti, F.; Peruccacci, S.; Rossi, M.; Stark, C.P. Rainfall thresholds for the initiation of landslides in central and southern Europe. Meteorol. Atmos. Phys. 2007, 98, 239–267. [Google Scholar] [CrossRef]
- Peruccacci, S.; Brunetti, M.T.; Luciani, S.; Vennari, C.; Guzzetti, F. Lithological and seasonal control on rainfall thresholds for the possible initiation of landslides in central Italy. Geomorphology 2012, 139–140, 79–90. [Google Scholar] [CrossRef]
- Yang, H.; Wei, F.; Ma, Z.; Guo, H.; Su, P.; Zhang, S. Rainfall threshold for landslide activity in Dazhou, southwest China. Landslides 2020, 17, 61–77. [Google Scholar] [CrossRef]
- Jiang, W.; Chen, G.; Meng, X.; Jin, J.; Zhao, Y.; Lin, L.; Li, Y.; Zhang, Y. Probabilistic rainfall threshold of landslides in Data-Scarce mountainous Areas: A case study of the Bailong River Basin, China. Catena 2022, 213, 106190. [Google Scholar] [CrossRef]
- Lin, C.; Liu, S.; Lee, S.; Liu, C. Impacts of the Chi-Chi earthquake on subsequent rainfall-induced landslides in central Taiwan. Eng. Geol. 2006, 86, 87–101. [Google Scholar] [CrossRef]
- Chiou, S.; Cheng, C.; Hsu, S.; Lin, Y.; Chi, S. Evaluating Landslides and Sediment Yields Induced by the Chi-Chi Earthquake and Followed Heavy Rainfalls along the Ta-Chia River. J. GeoEng. 2007, 2, 73–82. [Google Scholar] [CrossRef]
- Weng, M.; Wu, M.; Ning, S.; Jou, Y. Evaluating triggering and causative factors of landslides in Lawnon River Basin, Taiwan. Eng. Geol. 2011, 123, 72–82. [Google Scholar] [CrossRef]
- Bontemps, N.; Lacroix, P.; Larose, E.; Jara, J.; Taipe, E. Rain and small earthquakes maintain a slow-moving landslide in a persistent critical state. Nat. Commun. 2020, 11, 780. [Google Scholar] [CrossRef]
- Zhang, S.; Zhang, L.M.; Glade, T. Characteristics of earthquake- and rain-induced landslides near the epicenter of Wenchuan earthquake. Eng. Geol. 2014, 175, 58–73. [Google Scholar] [CrossRef]
- Chen, G.; Meng, X.; Qiao, L.; Zhang, Y.; Wang, S. Response of a loess landslide to rainfall: Observations from a field artificial rainfall experiment in Bailong River Basin, China. Landslides 2018, 15, 895–911. [Google Scholar] [CrossRef]
- Li, Y.; Meng, X.; Guo, P.; Dijkstra, T.; Zhao, Y.; Chen, G.; Yue, D. Constructing rainfall thresholds for debris flow initiation based on critical discharge and S-hydrograph. Eng. Geol. 2021, 280, 105962. [Google Scholar] [CrossRef]
- Xiong, M.; Meng, X.; Wang, S.; Guo, P.; Li, Y.; Chen, G.; Qing, F.; Cui, Z.; Zhao, Y. Effectiveness of debris flow mitigation strategies in mountainous regions. Prog. Phys. Geog. 2016, 40, 768–793. [Google Scholar] [CrossRef]
- Li, Y.; Armitage, S.J.; Stevens, T.; Meng, X. Alluvial fan aggradation/incision history of the eastern Tibetan plateau margin and implications for debris flow/debris-charged flood hazard. Geomorphology 2018, 318, 203–216. [Google Scholar] [CrossRef]
- Yuan, D.; Lei, Z.; Wang, A. Additional Textual Criticism of Southern Tianshui M8 Earthquake in Gansu Province in 1654. China Earthq. Eng. J. 2017, 39, 509–520. (In Chinese) [Google Scholar]
- Yuan, D.; Lei, Z.; Yang, Q.; Wang, A.; Xie, H.; Su, Q. Seismic disaster features of the 1879 southern Wudu M8 earthquake in Gansu Province. J. Lanzhou Univ. Nat. Sci. 2014, 50, 611–621. (In Chinese) [Google Scholar] [CrossRef]
- Yang, W.; Qi, W.; Zhou, J. Effects of precipitation and topography on vegetation recovery at landslide sites after the 2008 Wenchuan earthquake. Land Degrad. Dev. 2018, 29, 3355–3365. [Google Scholar] [CrossRef]
- Li, X.; Cheng, X.; Chen, W.; Chen, G.; Liu, S. Identification of Forested Landslides Using LiDar Data, Object-based Image Analysis, and Machine Learning Algorithms. Remote Sens. 2015, 7, 9705–9726. [Google Scholar] [CrossRef] [Green Version]
- CMONOC. Coseismic displacement fields of the 2008 Wenchuan Ms 8.0 earthquake measured by GPS. Sci. Sin. Terrae. 2008, 38, 12. (In Chinese) [Google Scholar]
- Coe, J.A. Regional moisture balance control of landslide motion; implications for landslide forecasting in a changing climate. Geology 2012, 40, 323–326. [Google Scholar] [CrossRef]
- Miller, C.V. Photogeology; Mac Graw Hill Book Company Inc.: London, UK, 1961. [Google Scholar] [CrossRef]
- Allum, J.A.E. Photogeology and Regional Mapping; Pergamon Press: Oxford, UK, 1966. [Google Scholar]
- Zuidam, R.A.V. Aerial Photo-Interpretation in Terrain Analysis and Geomorphologic Mapping; ITC. Smits Publishers: The Hague, The Netherlands, 1985. [Google Scholar]
- Fiorucci, F.; Cardinali, M.; Carlà, R.; Rossi, M.; Mondini, A.C.; Santurri, L.; Ardizzone, F.; Guzzetti, F. Seasonal landslide mapping and estimation of landslide mobilization rates using aerial and satellite images. Geomorphology 2011, 129, 59–70. [Google Scholar] [CrossRef]
- Du, J.; Glade, T.; Woldai, T.; Chai, B.; Zeng, B. Landslide susceptibility assessment based on an incomplete landslide inventory in the Jilong Valley, Tibet, Chinese Himalayas. Eng. Geol. 2020, 270, 105572. [Google Scholar] [CrossRef]
- Shao, X.; Ma, S.; Xu, C.; Zhang, P.; Wen, B.; Tian, Y.; Zhou, Q.; Cui, Y. Planet Image-Based Inventorying and Machine Learning-Based Susceptibility Mapping for the Landslides Triggered by the 2018 Mw6.6 Tomakomai, Japan Earthquake. Remote Sens. 2019, 11, 978. [Google Scholar] [CrossRef] [Green Version]
- Varnes, D.J. Slope Movement Types and Processes; Landslides, Analysis and Control, Special Report 176; Schuster, R.L., Krizek, R.J., Eds.; Transportation Research Board, National Academy of Sciences: Washington, DC, USA, 1978; pp. 11–33. [Google Scholar]
- Hungr, O.; Leroueil, S.; Picarelli, L. The Varnes classification of landslide types, an update. Landslides 2014, 11, 167–194. [Google Scholar] [CrossRef]
- Berardino, P.; Fornaro, G.; Lanari, R.; Sansosti, E. A new algorithm for surface deformation monitoring based on small baseline differential SAR interferograms. IEEE Trans. Geosci. Remote 2002, 40, 2375–2383. [Google Scholar] [CrossRef] [Green Version]
- Tizzani, P.; Berardino, P.; Casu, F.; Euillades, P.; Manzo, M.; Ricciardi, G.; Zeni, G.; Lanari, R. Surface deformation of Long Valley caldera and Mono Basin, California, investigated with the SBAS-InSAR approach. Remote Sens. Environ. 2007, 108, 277–289. [Google Scholar] [CrossRef]
- Shi, W.; Chen, G.; Meng, X.; Jiang, W.; Chong, Y.; Zhang, Y.; Dong, Y.; Zhang, M. Spatial-Temporal Evolution of Land Subsidence and Rebound over Xi’an in Western China Revealed by SBAS-InSAR Analysis. Remote Sens. 2020, 12, 3756. [Google Scholar] [CrossRef]
- Guzzetti, F.; Ardizzone, F.; Cardinali, M.; Rossi, M.; Valigi, D. Landslide volumes and landslide mobilization rates in Umbria, central Italy. Earth Planet. Sc. Lett. 2009, 279, 222–229. [Google Scholar] [CrossRef]
- Jin, J.; Chen, G.; Meng, X.; Zhang, Y.; Shi, W.; Li, Y.; Yang, Y.; Jiang, W. Prediction of river damming susceptibility by landslides based on a logistic regression model and InSAR techniques: A case study of the Bailong River Basin, China. Eng. Geol. 2022, 299, 106562. [Google Scholar] [CrossRef]
- Zhang, Y.; Meng, X.M.; Dijkstra, T.A.; Jordan, C.J.; Chen, G.; Zeng, R.Q.; Novellino, A. Forecasting the magnitude of potential landslides based on InSAR techniques. Remote Sens. Environ. 2020, 241, 111738. [Google Scholar] [CrossRef]
- Larsen, I.J.; Montgomery, D.R.; Korup, O. Landslide erosion controlled by hillslope material. Nat. Geosci. 2010, 3, 247–251. [Google Scholar] [CrossRef]
- Jaboyedoff, M.; Carrea, D.; Derron, M.; Oppikofer, T.; Penna, I.M.; Rudaz, B. A review of methods used to estimate initial landslide failure surface depths and volumes. Eng. Geol. 2020, 267, 105478. [Google Scholar] [CrossRef]
- Cascini, L.; Ciurleo, M.; Di Nocera, S. Soil depth reconstruction for the assessment of the susceptibility to shallow landslides in fine-grained slopes. Landslides 2017, 14, 459–471. [Google Scholar] [CrossRef]
- Meier, C.; Jaboyedoff, M.; Derron, M.; Gerber, C. A method to assess the probability of thickness and volume estimates of small and shallow initial landslide ruptures based on surface area. Landslides 2020, 17, 975–982. [Google Scholar] [CrossRef]
- Zhao, C.; Lu, Z.; Zhang, Q.; de la Fuente, J. Large-area landslide detection and monitoring with ALOS/PALSAR imagery data over Northern California and Southern Oregon, USA. Remote Sens. Environ. 2012, 124, 348–359. [Google Scholar] [CrossRef]
- Wli, U. A suggested method for describing the activity of a landslide. B Int. Assoc. Eng. Geol. 1993, 47, 53–57. [Google Scholar] [CrossRef]
- Cruden, D.; Varnes, D. Landslide Types and Processes; Special Report; National Research Council; Transportation Research Board: Ottawa, ON, Canada, 1996; pp. 36–75.
- Wasowski, J.; Bovenga, F. Investigating landslides and unstable slopes with satellite Multi Temporal Interferometry: Current issues and future perspectives. Eng. Geol. 2014, 174, 103–138. [Google Scholar] [CrossRef]
- Novellino, A.; Cesarano, M.; Cappelletti, P.; Martire, D.D.; Calcaterra, D. Slow-moving landslide risk assessment combining Machine Learning and InSAR techniques. Catena 2021, 203, 105317. [Google Scholar] [CrossRef]
- Notti, D.; Davalillo, J.C.; Herrera, G.; Mora, O. Assessment of the performance of X-band satellite radar data for landslide mapping and monitoring: Upper Tena Valley case study. Nat. Hazard. Earth Syst. 2010, 10, 1865–1875. [Google Scholar] [CrossRef]
- Bayer, B.; Simoni, A.; Mulas, M.; Corsini, A.; Schmidt, D. Deformation responses of slow moving landslides to seasonal rainfall in the Northern Apennines, measured by InSAR. Geomorphology 2018, 308, 293–306. [Google Scholar] [CrossRef]
- Tang, C.; Zhu, J.; Qi, X.; Ding, J. Landslides induced by the Wenchuan earthquake and the subsequent strong rainfall event: A case study in the Beichuan area of China. Eng. Geol. 2011, 122, 22–33. [Google Scholar] [CrossRef]
- Luo, Y.; Fan, X.; Huang, R.; Wang, Y.; Yunus, A.P.; Havenith, H.B. Topographic and near-surface stratigraphic amplification of the seismic response of a mountain slope revealed by field monitoring and numerical simulations. Eng. Geol. 2020, 271, 105607. [Google Scholar] [CrossRef]
- Huang, R.; Pei, X.; Fan, X.; Zhang, W.; Li, S.; Li, B. The characteristics and failure mechanism of the largest landslide triggered by the Wenchuan earthquake, May 12, 2008, China. Landslides 2012, 9, 131–142. [Google Scholar] [CrossRef]
- Karpouza, M.; Chousianitis, K.; Bathrellos, G.D.; Skilodimou, H.D.; Kaviris, G.; Antonarakou, A. Hazard zonation mapping of earthquake-induced secondary effects using spatial multi-criteria analysis. Nat. Hazards 2021, 109, 637–669. [Google Scholar] [CrossRef]
- Zhao, Y.; Meng, X.; Qi, T.; Li, Y.; Chen, G.; Yue, D.; Qing, F. AI-based rainfall prediction model for debris flows. Eng. Geol. 2022, 296, 106456. [Google Scholar] [CrossRef]
- Cao, C.; Zhang, W.; Chen, J.; Shan, B.; Song, S.; Zhan, J. Quantitative estimation of debris flow source materials by integrating multi-source data: A case study. Eng. Geol. 2021, 291, 106222. [Google Scholar] [CrossRef]
- Xiong, J.; Tang, C.; Chen, M.; Gong, L.; Li, N.; Zhang, X.; Shi, Q. Long-term changes in the landslide sediment supply capacity for debris flow occurrence in Wenchuan County, China. Catena 2021, 203, 105340. [Google Scholar] [CrossRef]
- Fan, L.; Lehmann, P.; Zheng, C.; Or, D. The Lasting Signatures of Past Landslides on Soil Stripping From Landscapes. Water Resour. Res. 2021, 57, e2021WR030375. [Google Scholar] [CrossRef]
- Fan, R.L.; Zhang, L.M.; Shen, P. Evaluating volume of coseismic landslide clusters by flow direction-based partitioning. Eng. Geol. 2019, 260, 105238. [Google Scholar] [CrossRef]
Publisher’s Note: MDPI stays neutral with regard to jurisdictional claims in published maps and institutional affiliations. |
© 2022 by the authors. Licensee MDPI, Basel, Switzerland. This article is an open access article distributed under the terms and conditions of the Creative Commons Attribution (CC BY) license (https://creativecommons.org/licenses/by/4.0/).