
Detection and 3D Modeling of Potential Buried Archaeological Structures Using WorldView-3 Satellite Imagery


Abstract
:
1. Introduction
2. Research Aim
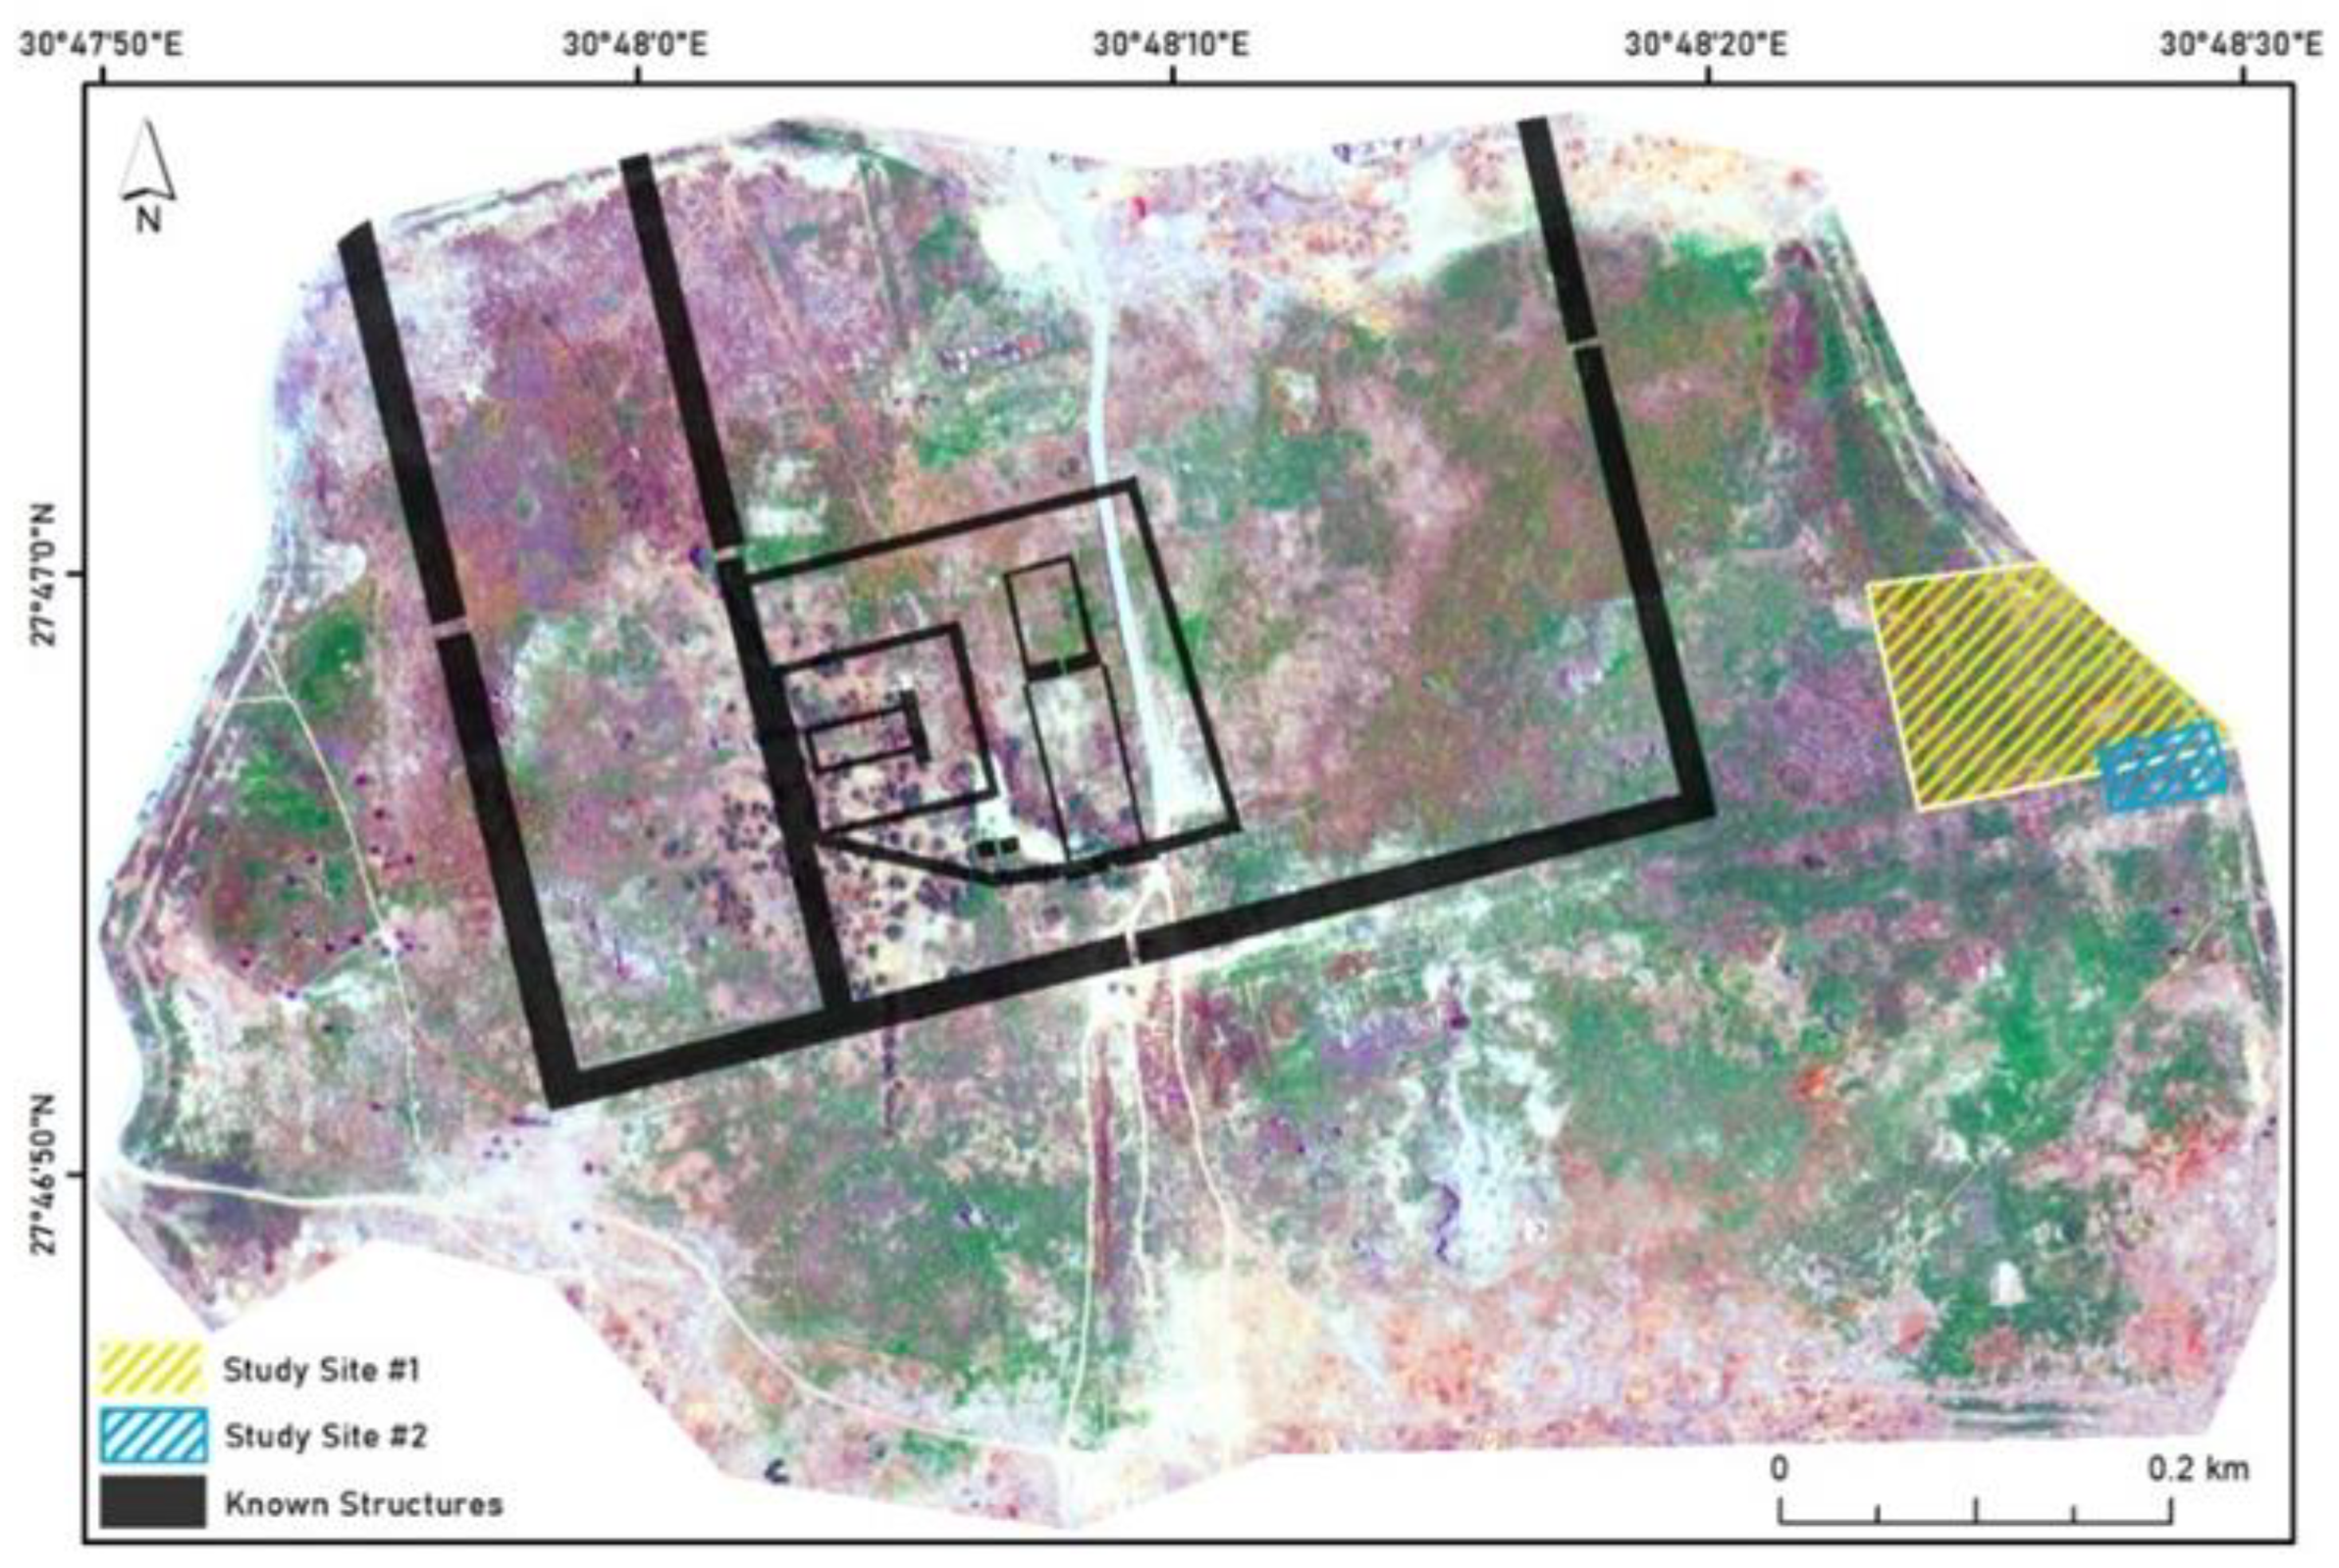
3. Study Area
4. Materials and Methods
4.1. Pre-Processing of Multispectral Imagery
4.2. Satellite Image Classification
4.3. Satellite Spectral Analysis
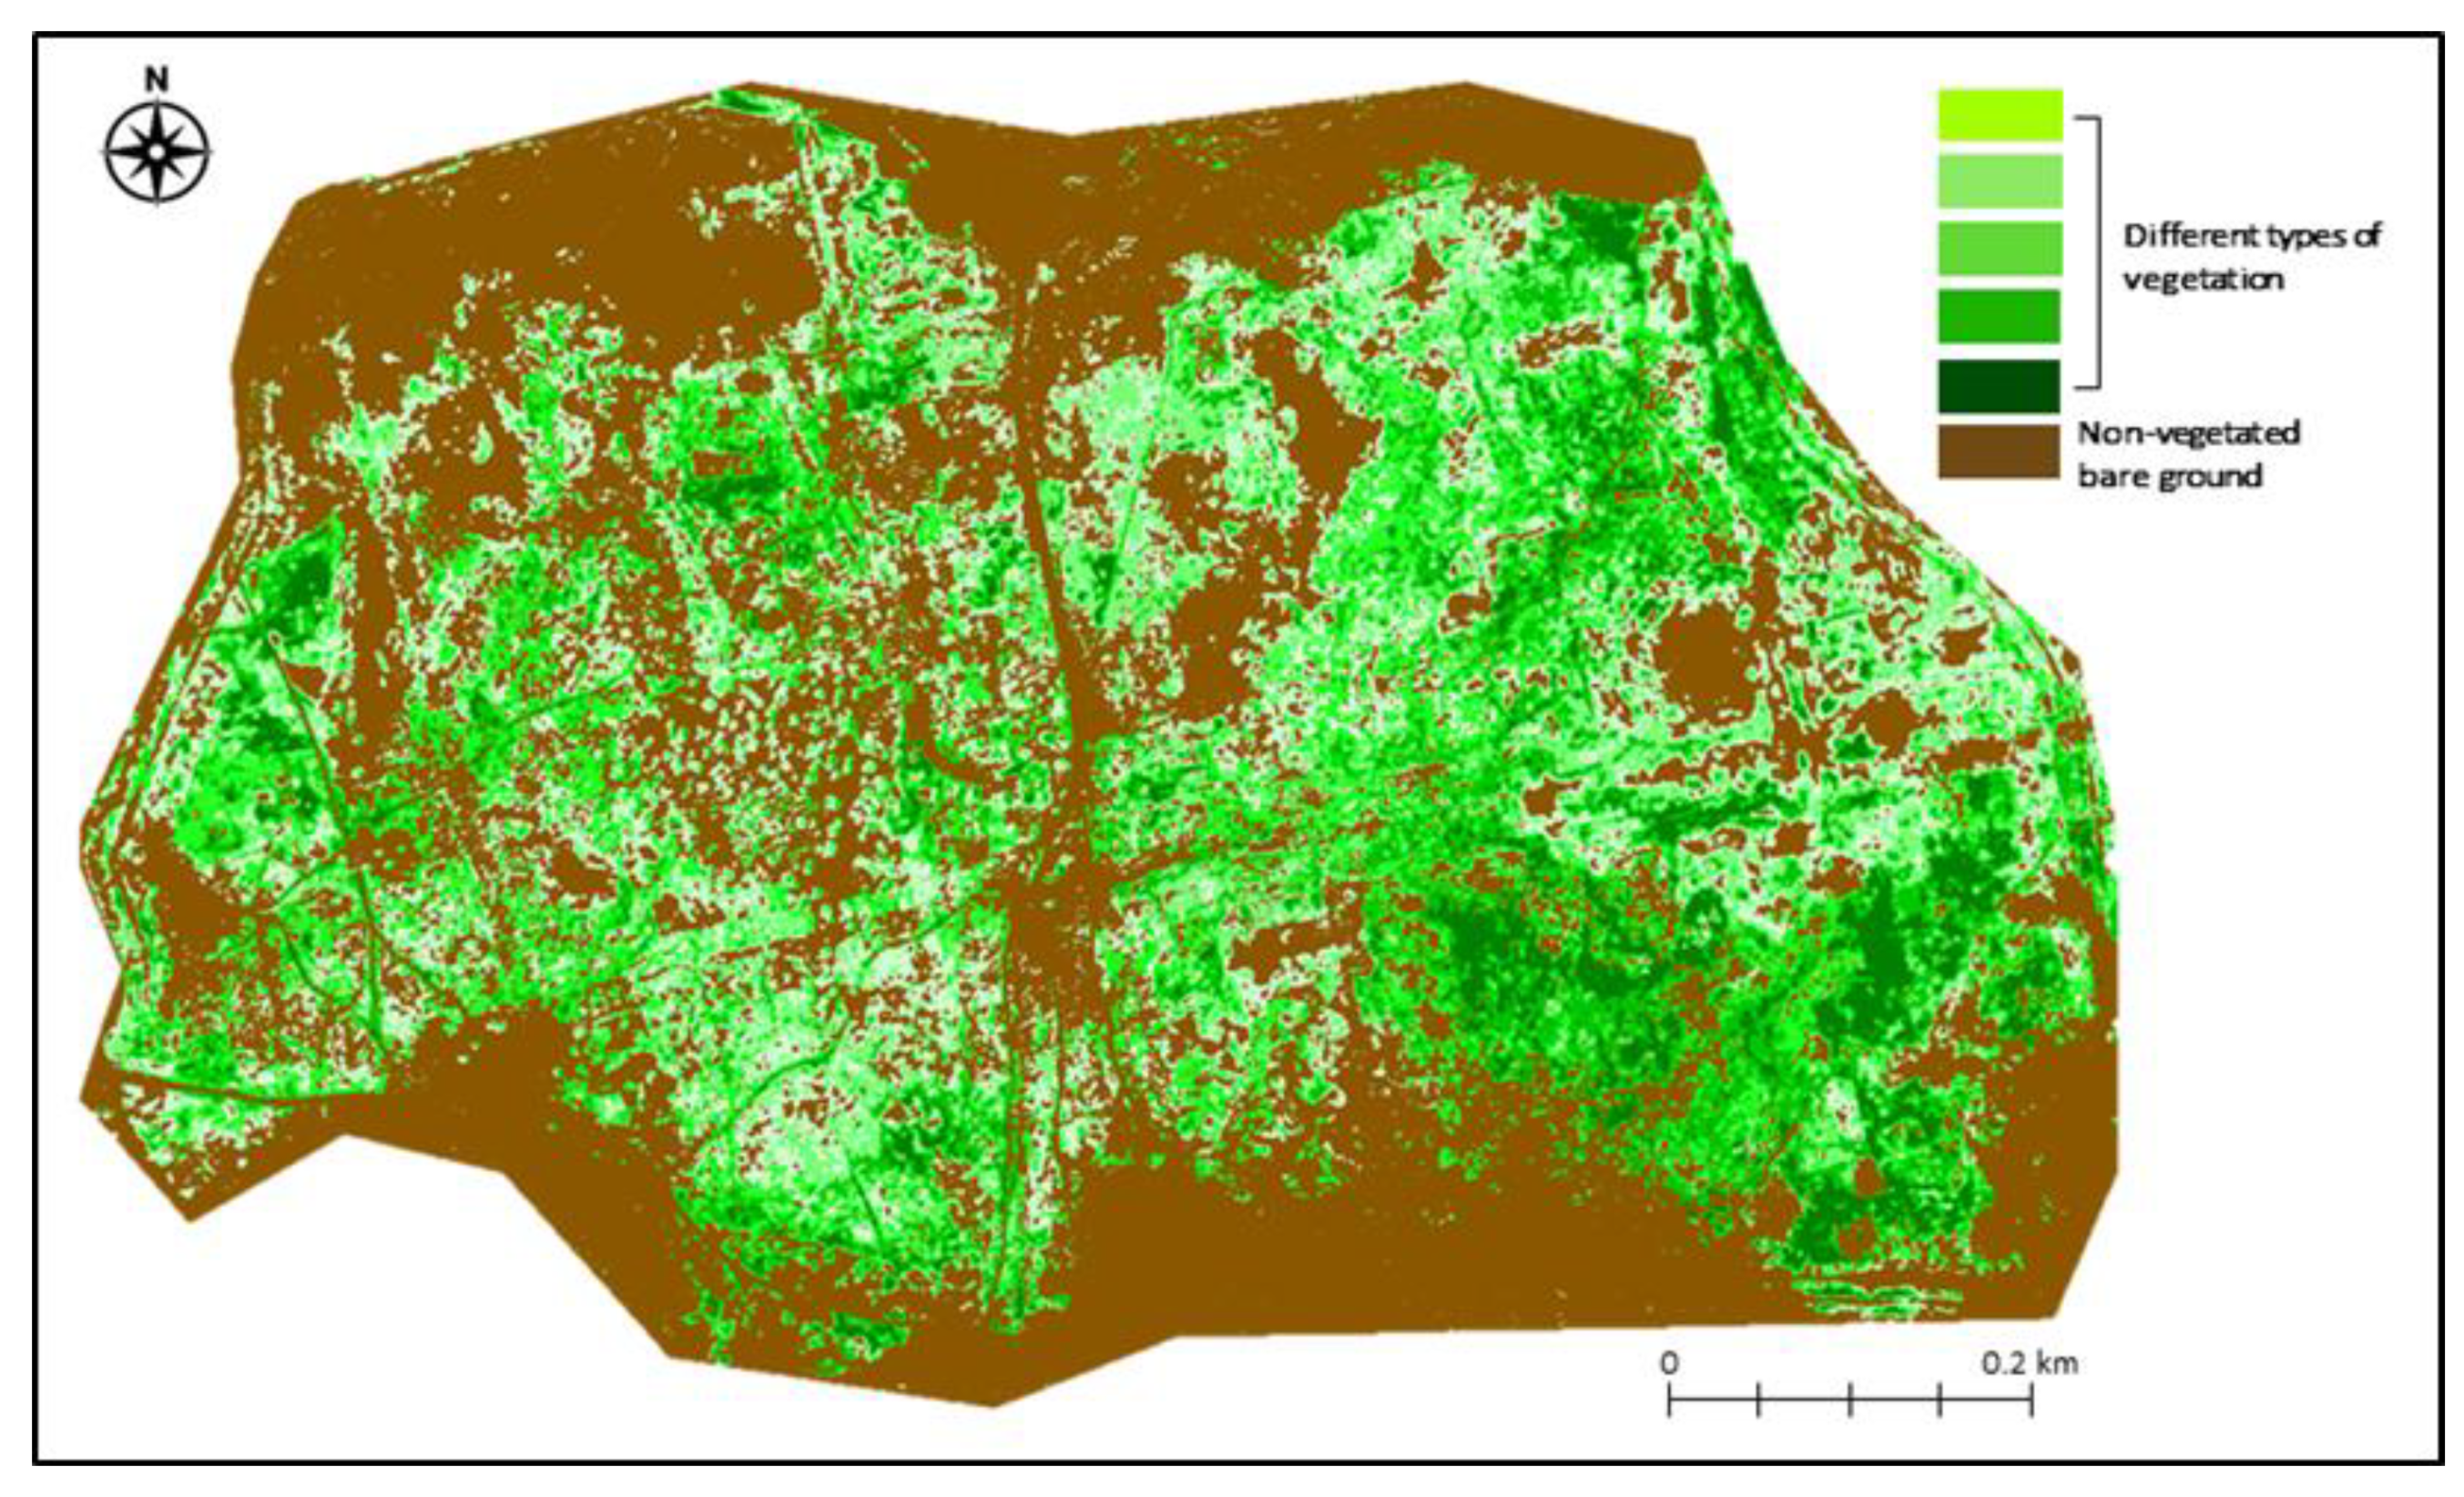
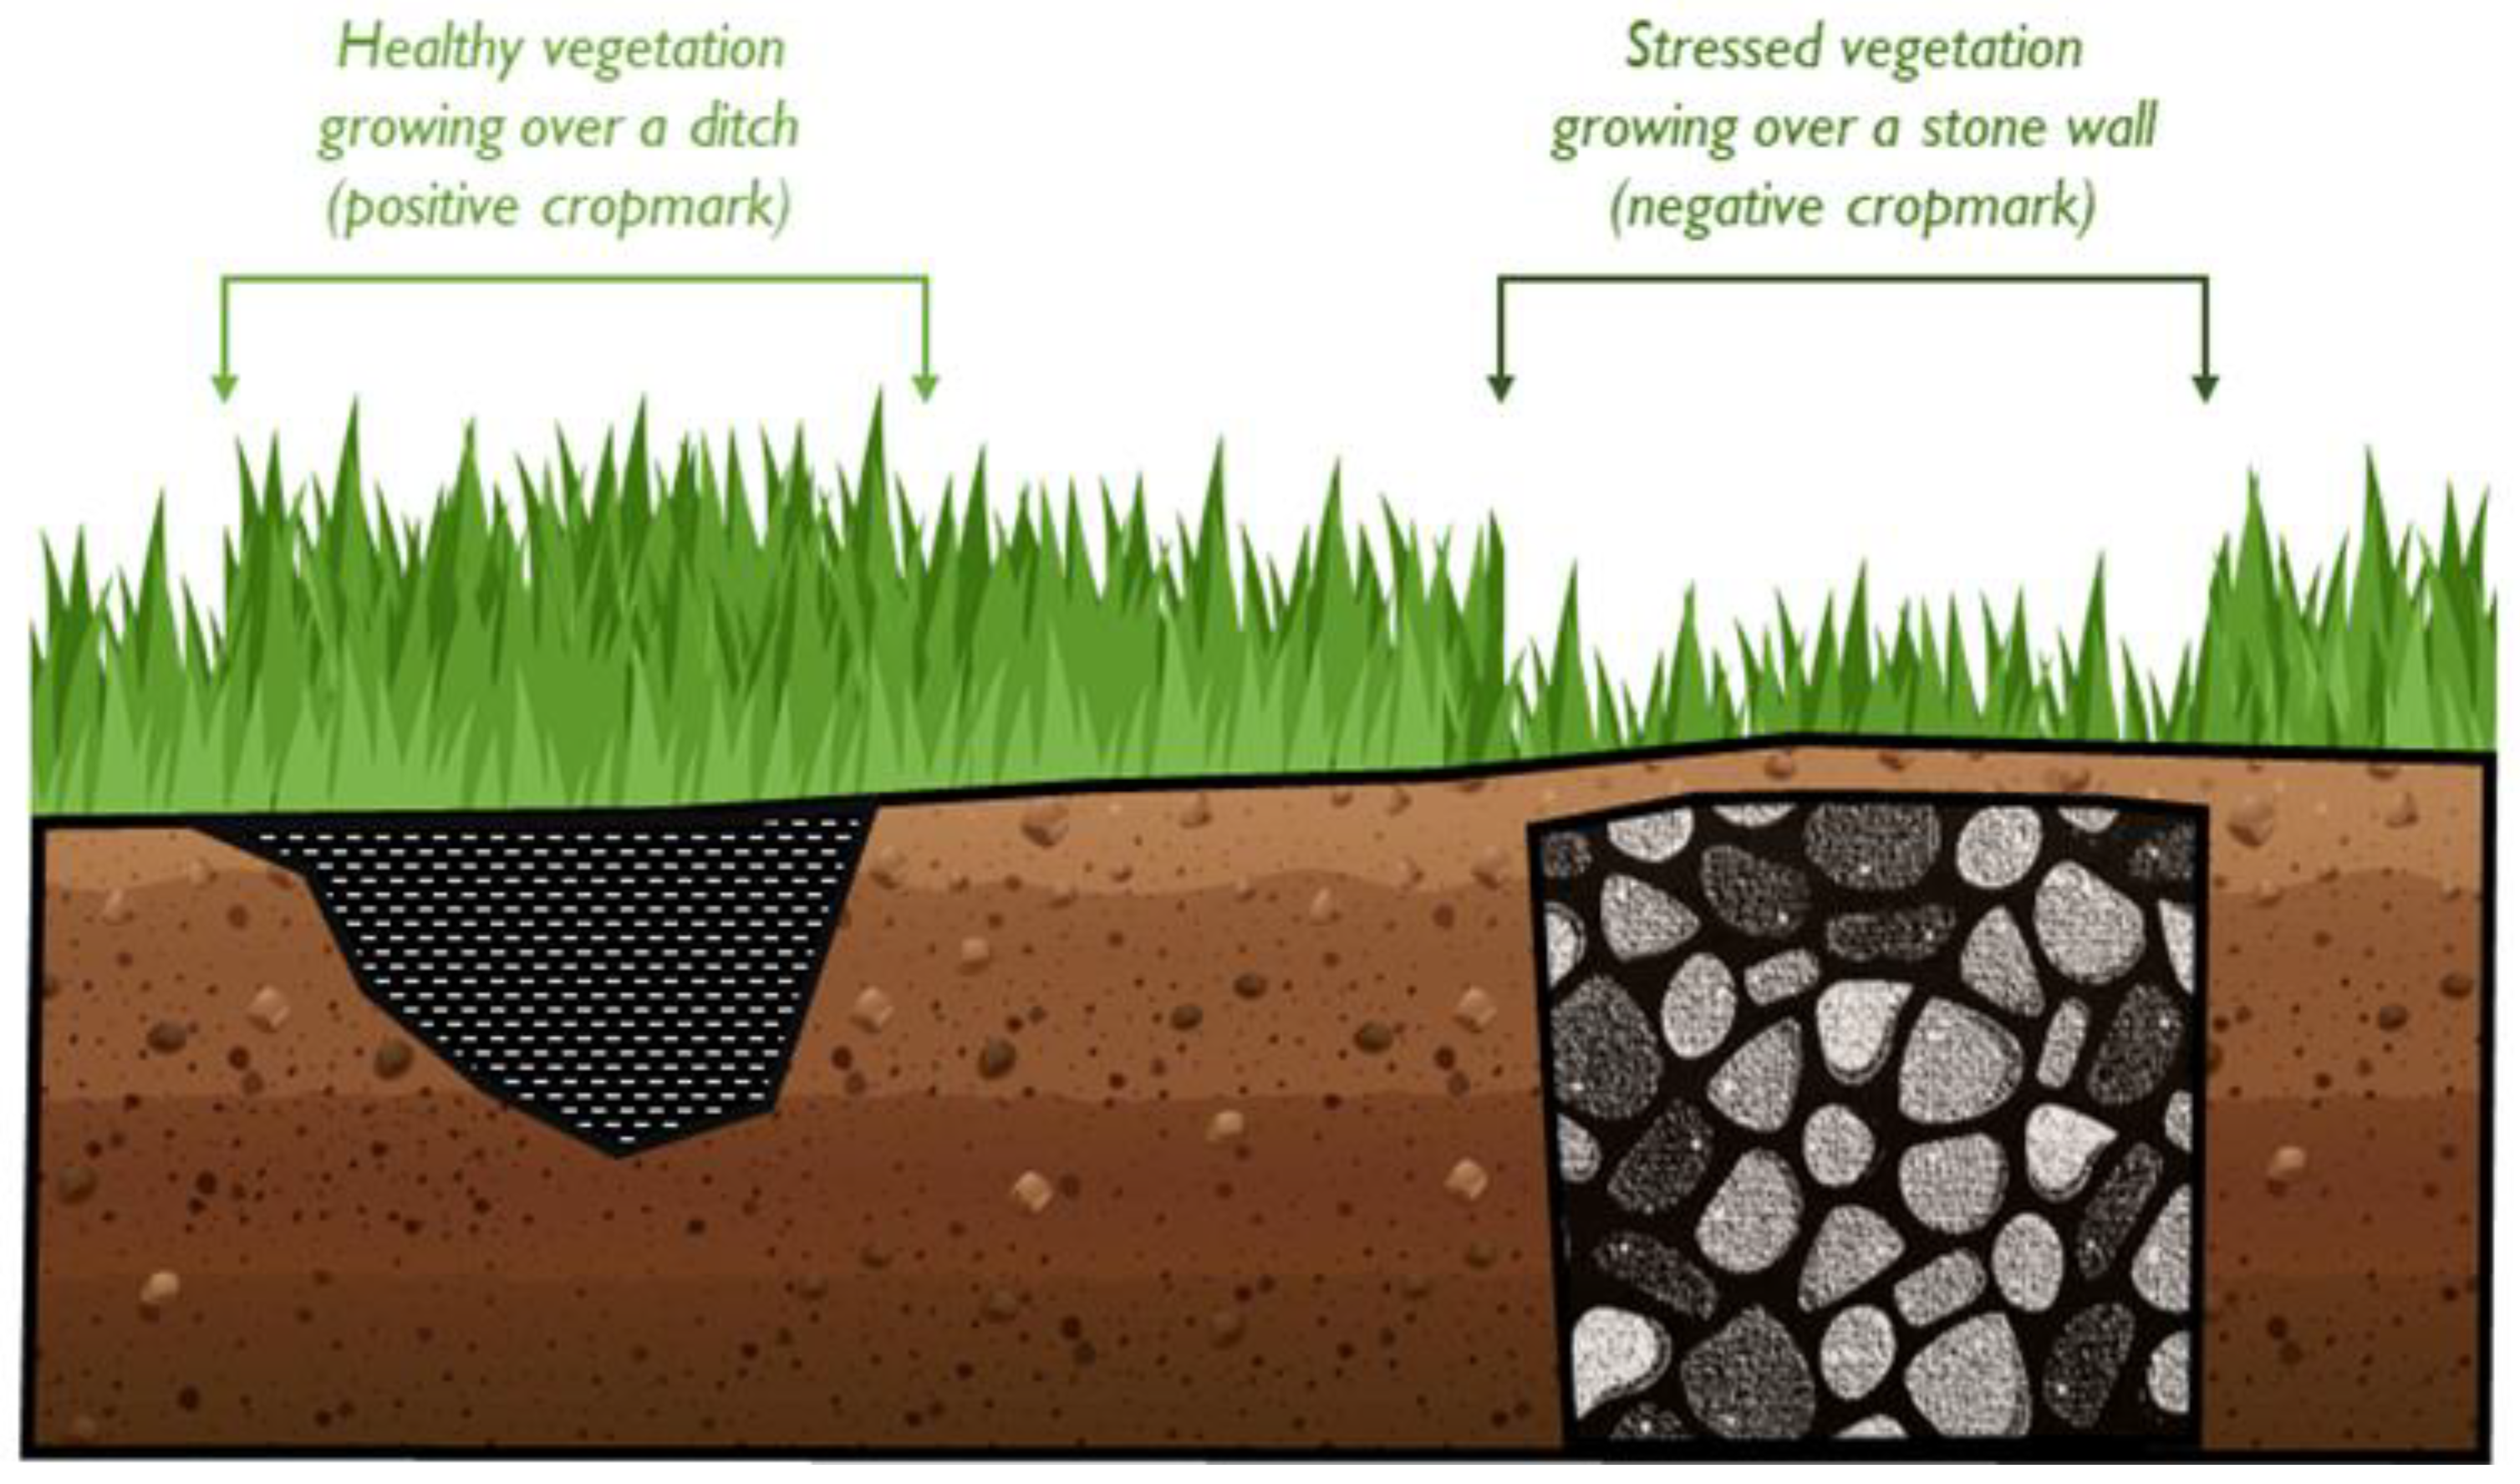
4.3.1. Spectral Analysis of Vegetation
4.3.2. Spectral Analysis of Iron Oxide
4.4. Satellite Spectral Analysis
5. Results and Discussion
5.1. Classification
5.2. Satellite Spectral Analysis
5.2.1. Spectral Analysis of Vegetation
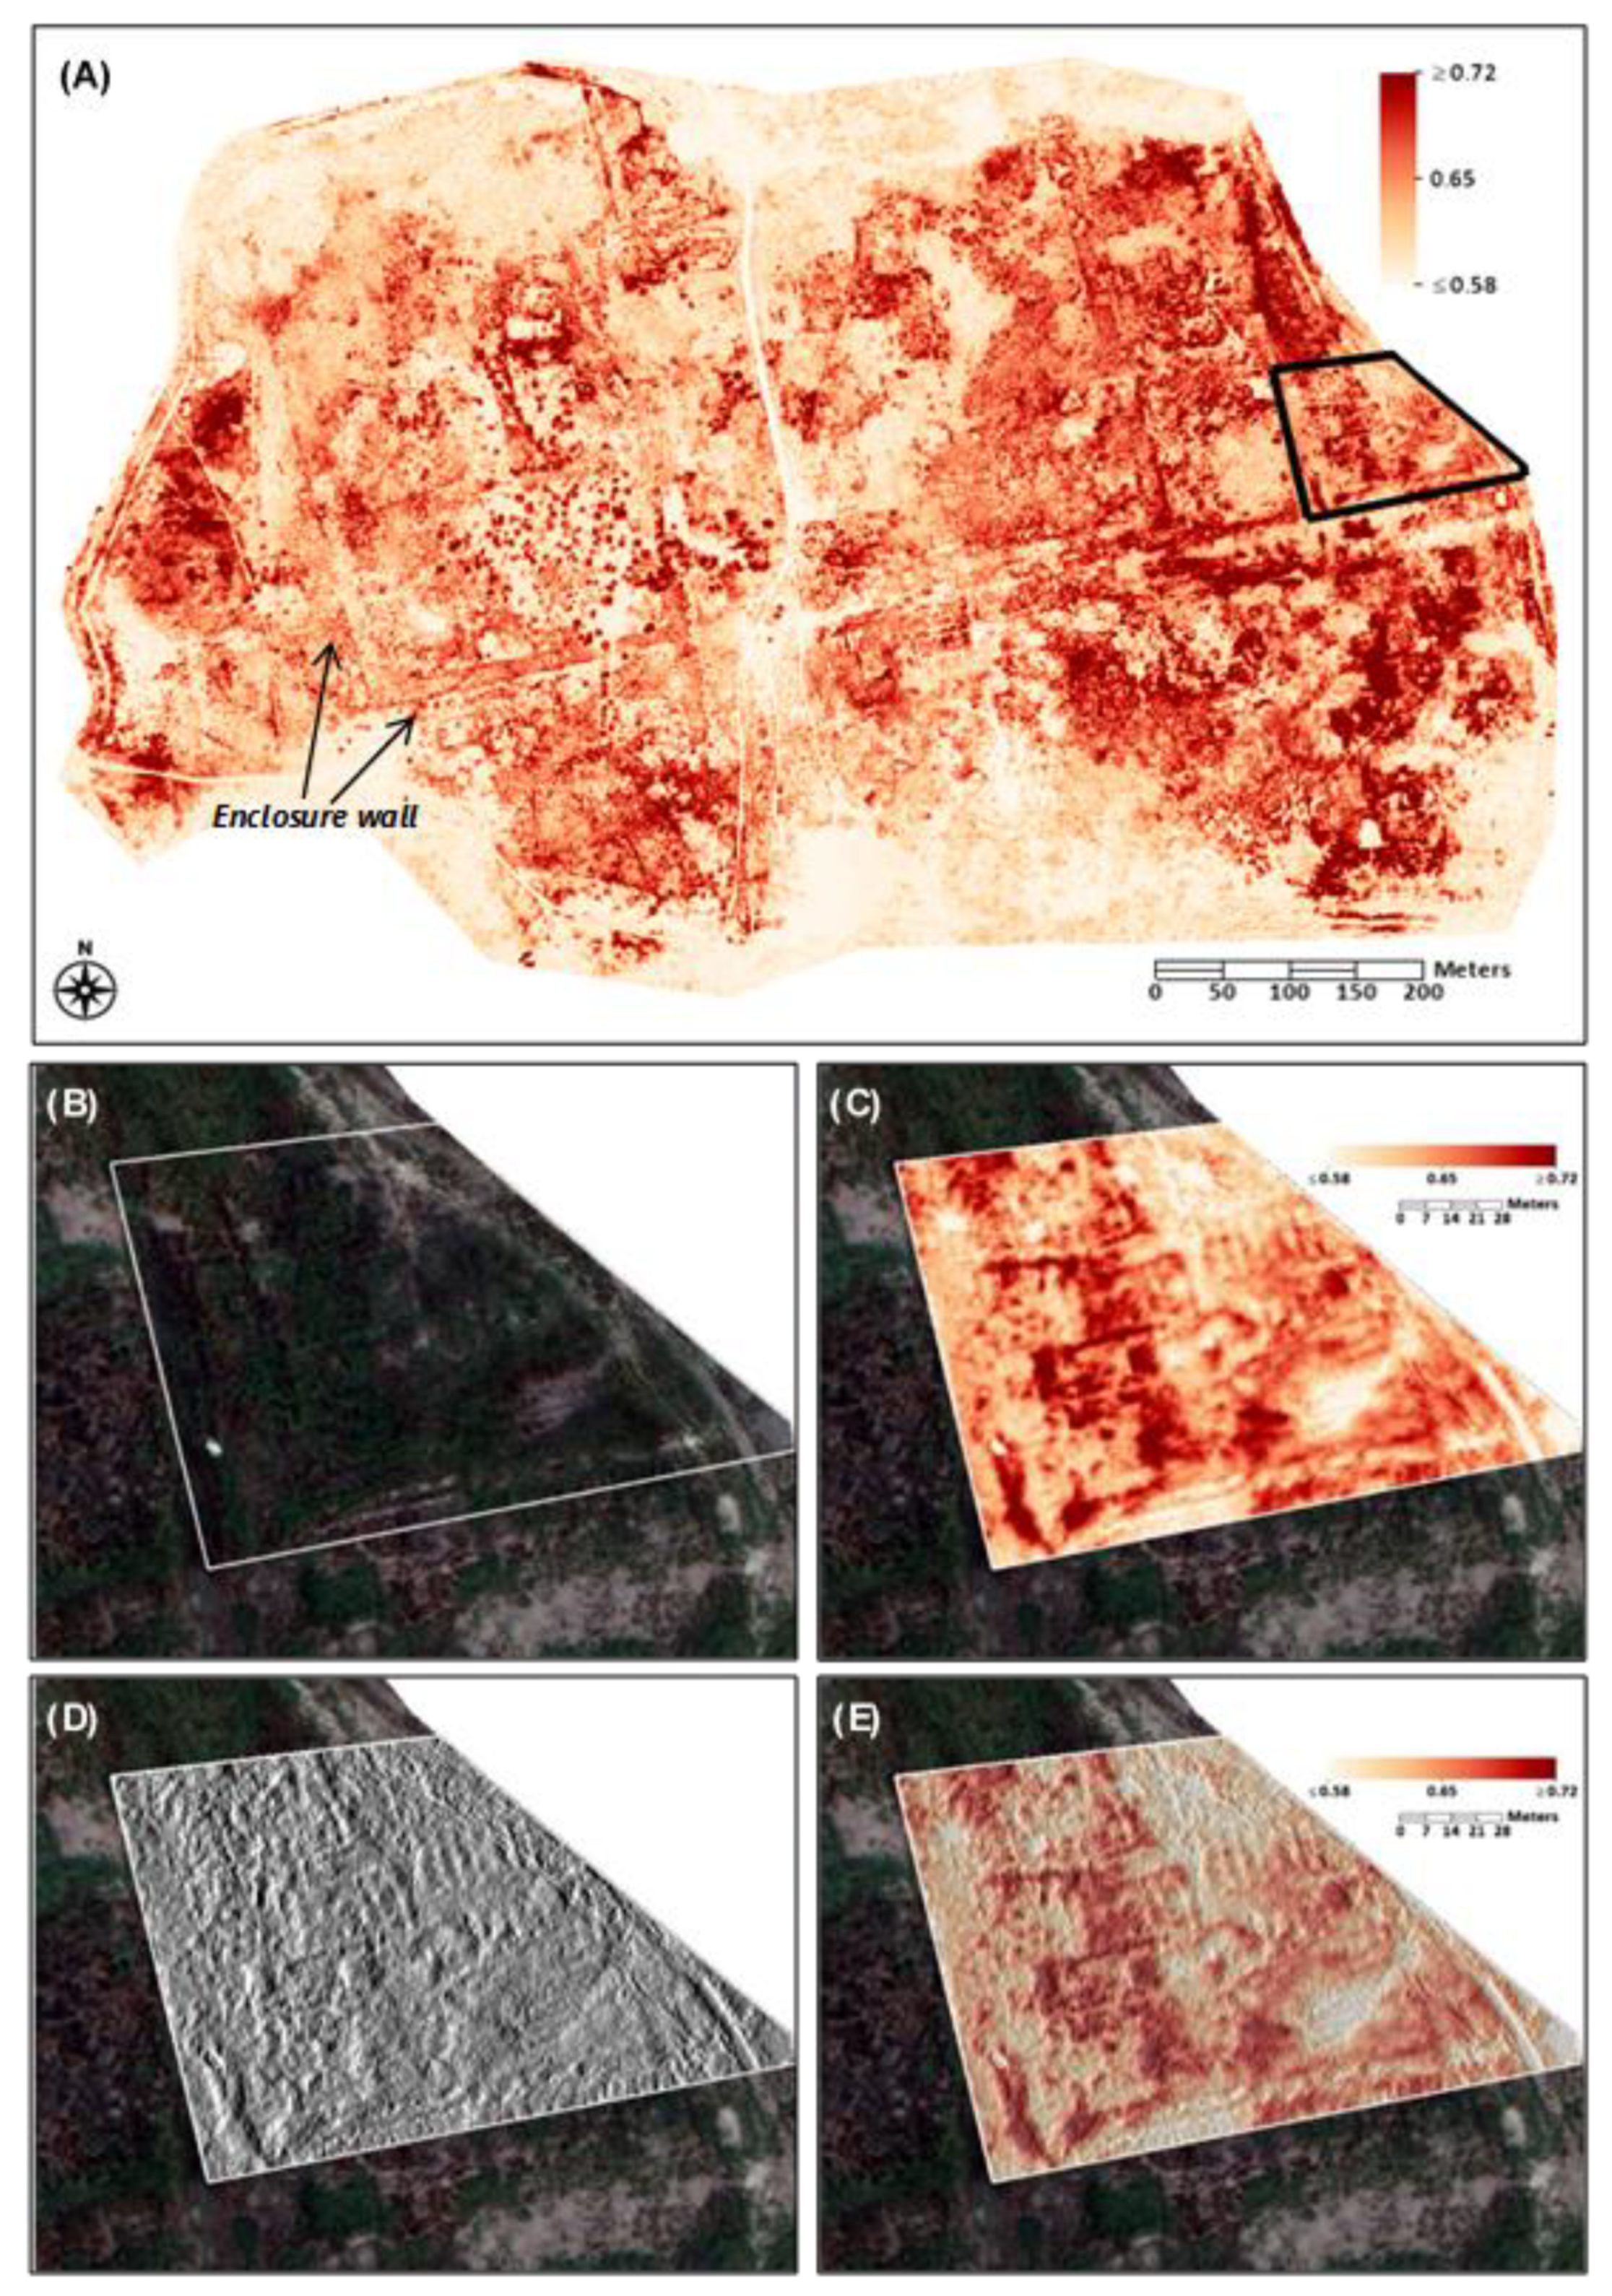
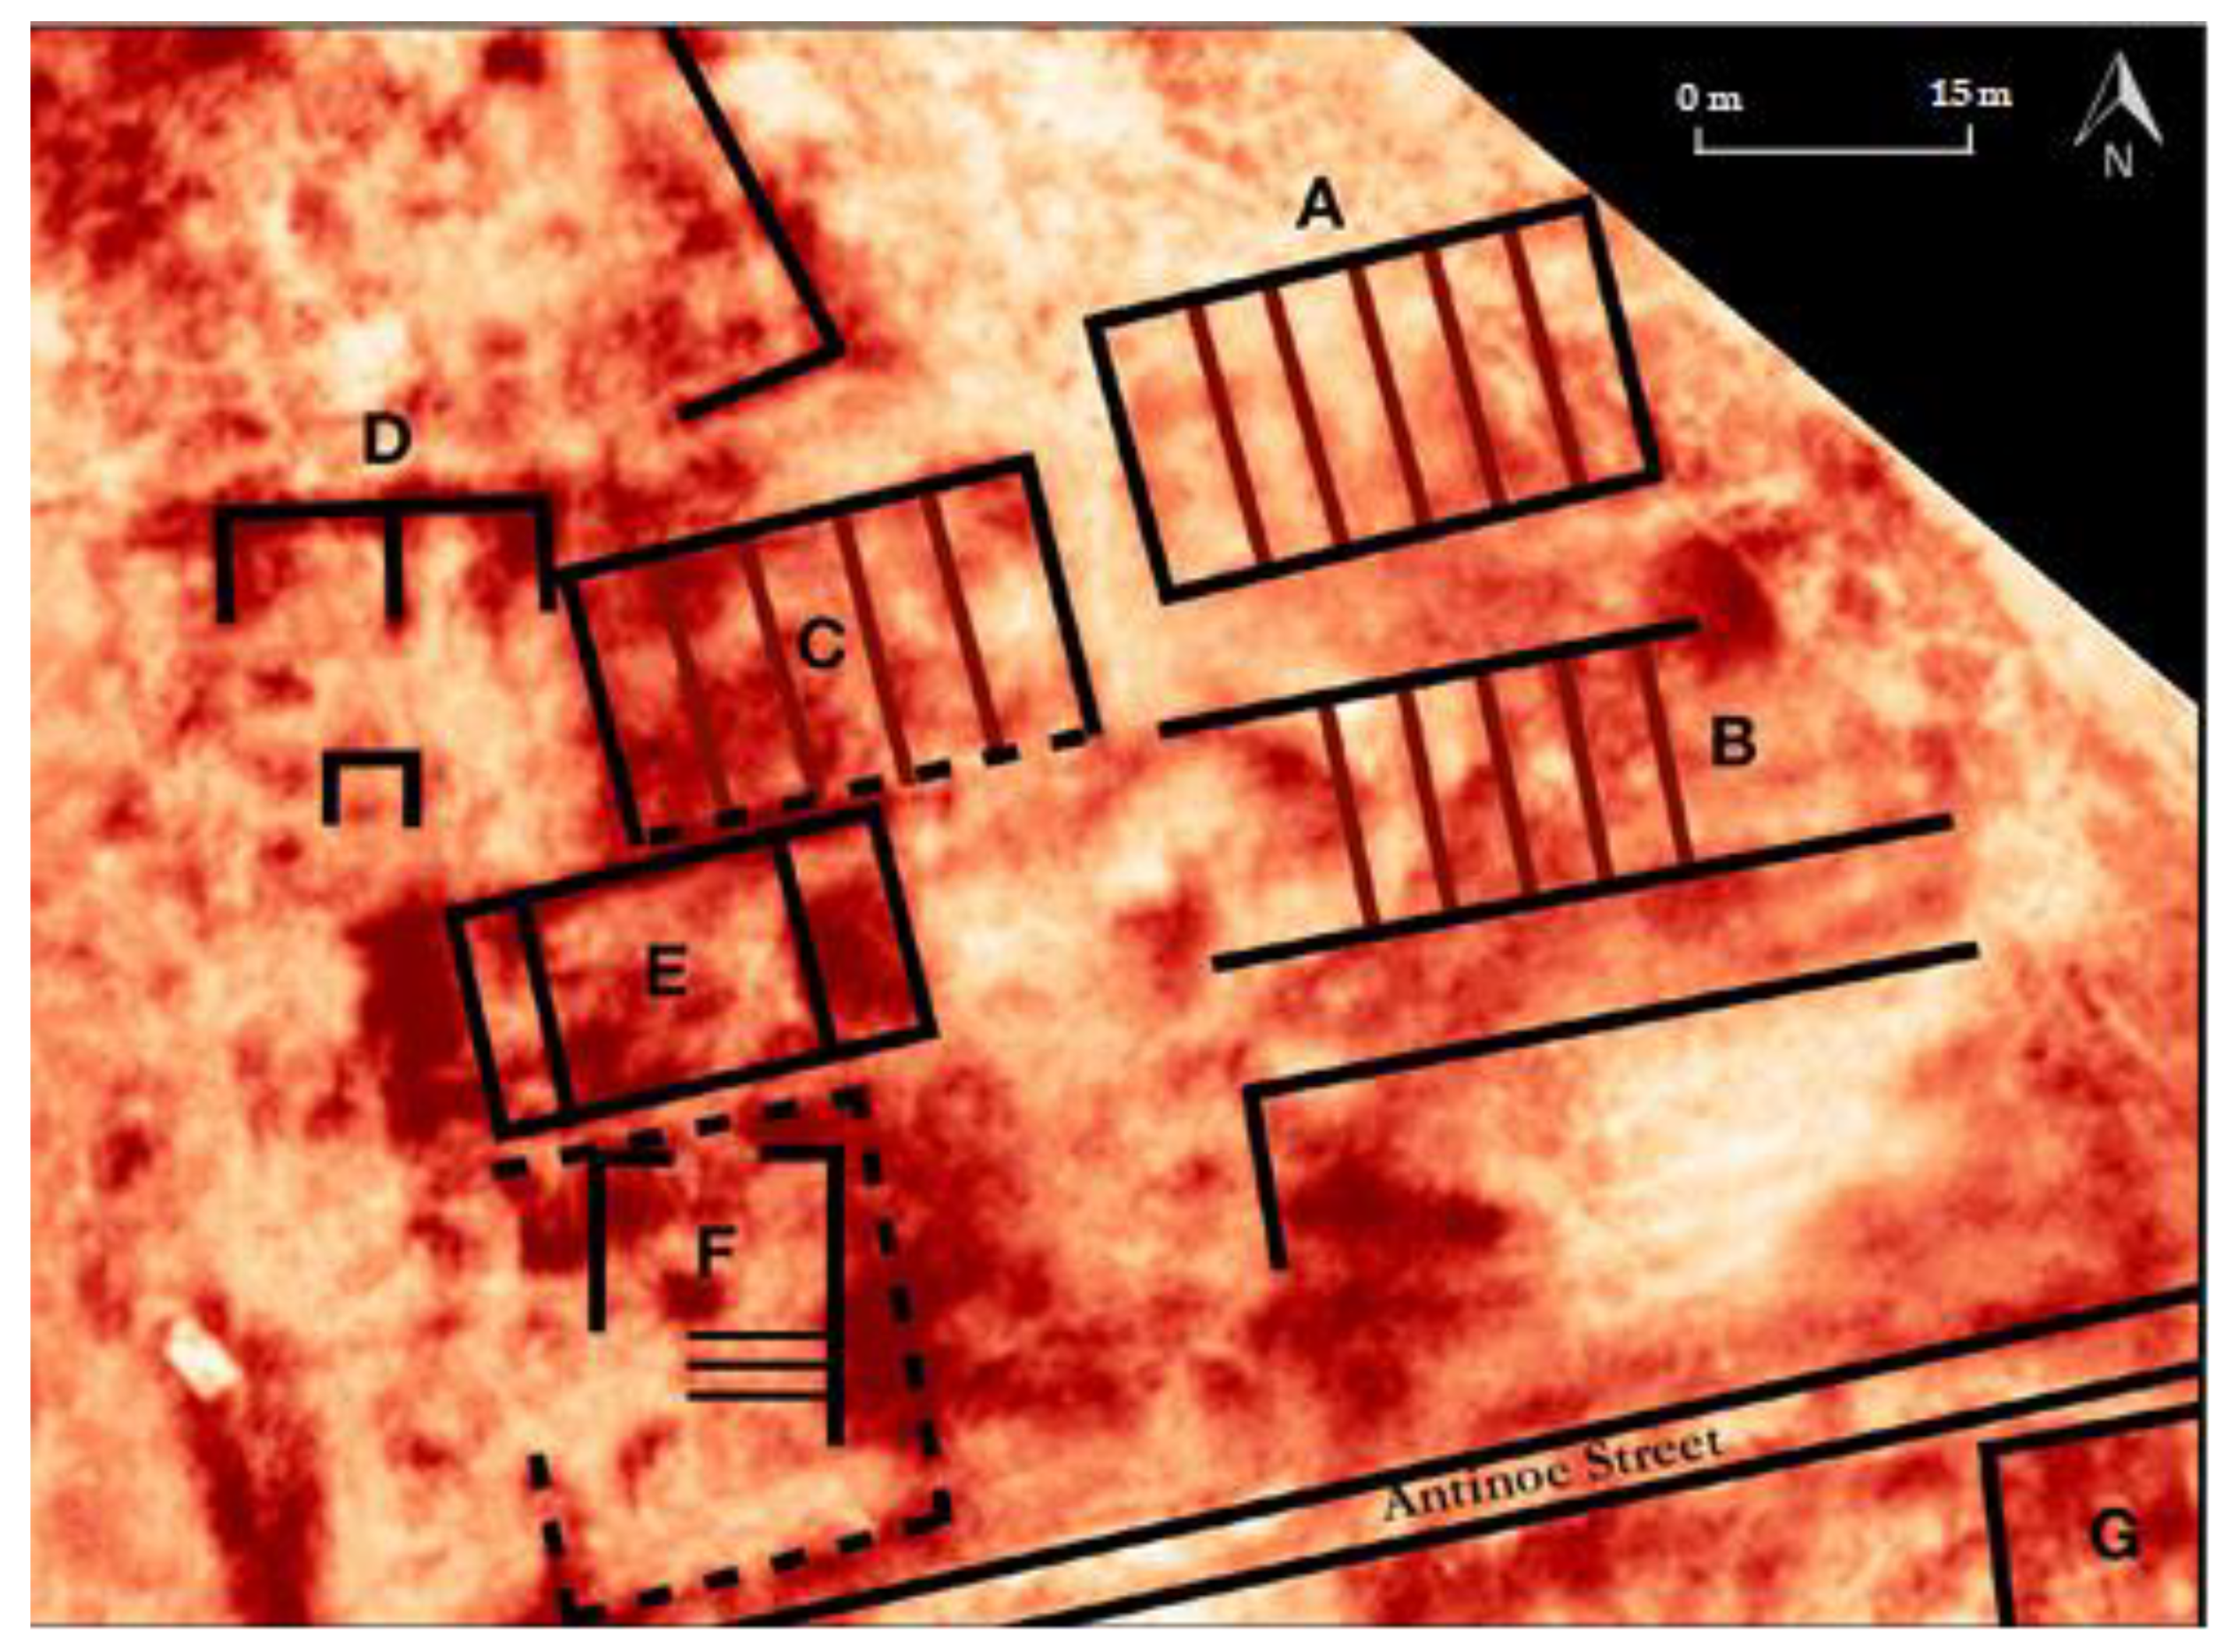
5.2.2. Spectral Analysis of Iron Oxide
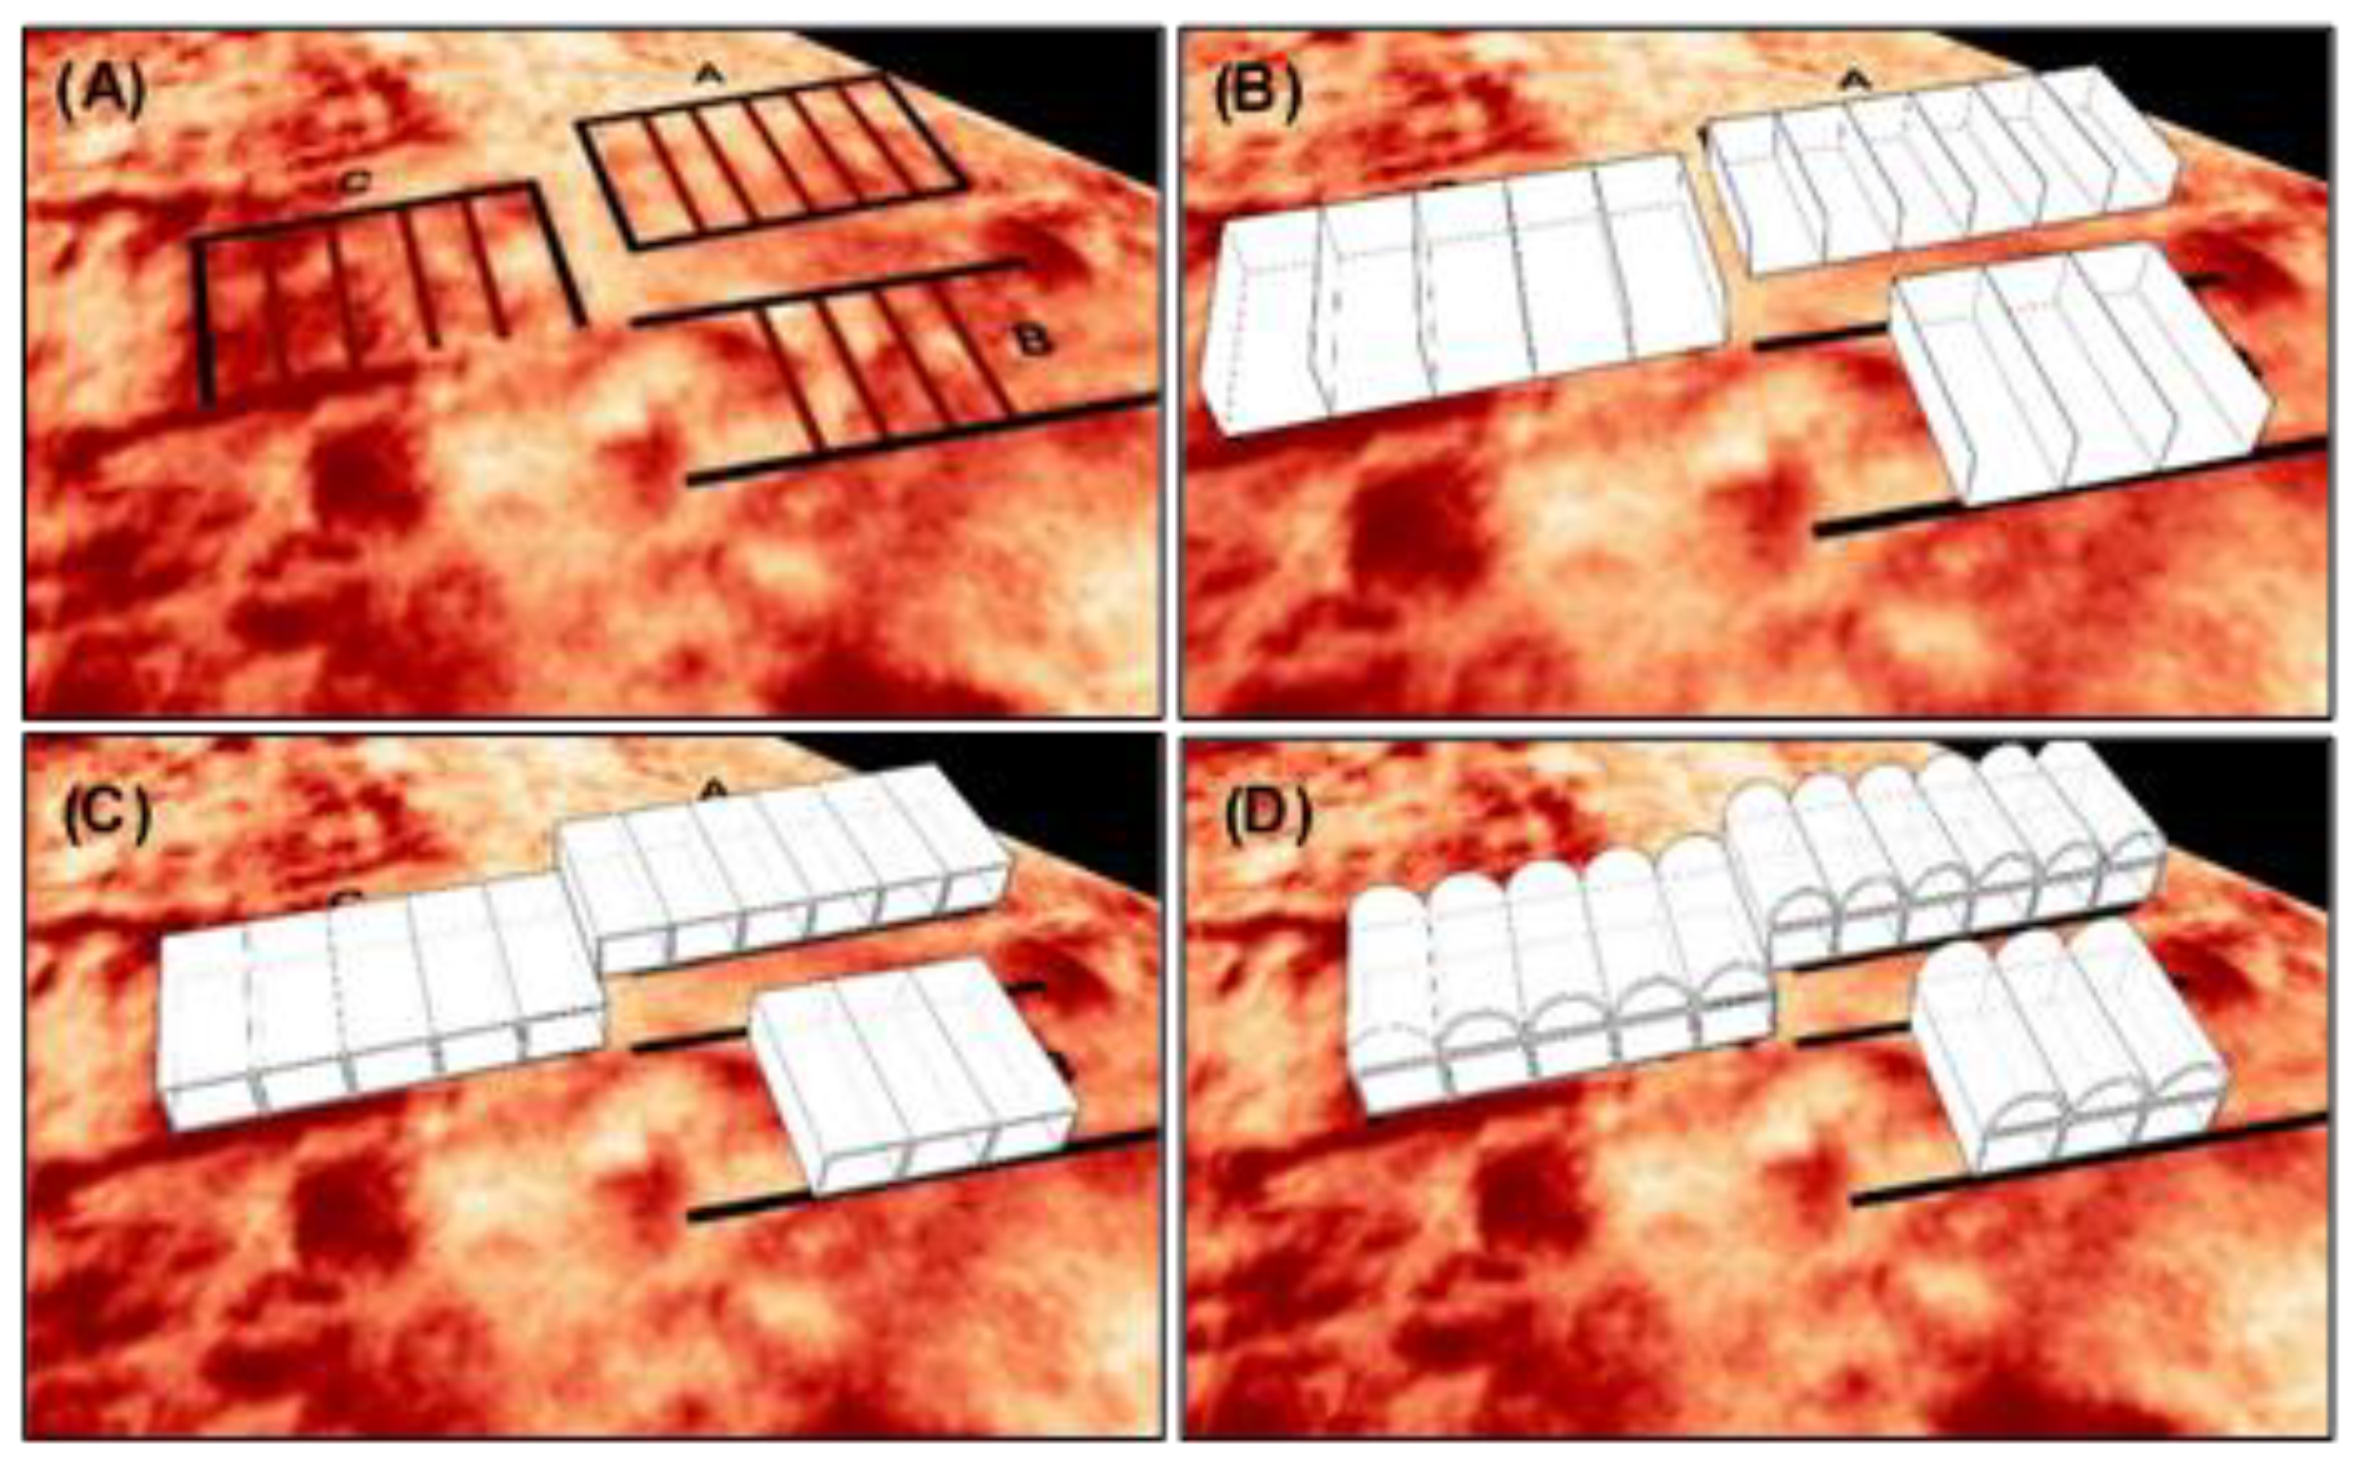
5.3. Creation of 3D Model
6. Conclusions
Funding
Acknowledgments
Conflicts of Interest
References
- Hillier, J.K.; Bunbury, J.M.; Graham, A. Monuments on a migrating Nile. J. Archaeol. Sci. 2007, 34, 1011–1015. [Google Scholar] [CrossRef] [Green Version]
- Parcak, S.H. Satellite Remote Sensing for Archaeology; Routledge: New York, NY, USA, 2009. [Google Scholar]
- Orengo, H.A.; Conesa, F.C.; Garcia-Molsosa, A.; Lobo, A.; Green, A.S.; Madella, M.; Petrie, C.A. Automated detection of archaeological mounds using machine-learning classification of multisensor and multitemporal satellite data. Proc. Natl. Acad. Sci. USA 2020, 117, 18240–18250. [Google Scholar] [CrossRef]
- Stubbs, J.H.; McKee, K.L. Applications of Remote Sensing to the Understanding and Management of Cultural Heritage Sites. In Remote Sensing in Archaeology; Wiseman, J., El-Baz, F., Eds.; Springer: New York, NY, USA, 2006; pp. 515–540. [Google Scholar]
- Agapiou, A.; Lysandrou, V.; Alexakis, D.; Themistocleous, K.; Cuca, B.; Argyriou, A.; Sarris, A.; Hadjimitsis, D. Cultural heritage management and monitoring using remote sensing data and GIS: The case study of Paphos area, Cyprus. Comput. Environ. Urban Syst. 2015, 54, 230–239. [Google Scholar] [CrossRef]
- El-Behaedi, R.; Ghoneim, E. Flood risk assessment of the Abu Simbel temple complex (Egypt) based on high-resolution spaceborne stereo imagery. J. Archaeol. Sci. Rep. 2018, 20, 458–467. [Google Scholar] [CrossRef]
- Keay, S.J.; Parcak, S.H.; Strutt, K.D. High resolution space and ground-based remote sensing and implications for landscape archaeology: The case from Portus, Italy. J. Archaeol. Sci. 2014, 52, 277–292. [Google Scholar] [CrossRef]
- Plekhov, D.; Gosner, L.R.; Smith, A.J.; Nowlin, J. Applications of Satellite Remote Sensing for Archaeological Survey: A Case Study from the Sinis Archaeological Project, Sardinia. Adv. Archaeol. Pr. 2020, 8, 192–205. [Google Scholar] [CrossRef]
- Goossens, R.; De Wulf, A.; Bourgeois, J.; Gheyle, W.; Willems, T. Satellite imagery and archaeology: The example of CORONA in the Altai Mountains. J. Archaeol. Sci. 2006, 33, 745–755. [Google Scholar] [CrossRef]
- Casana, J.; Cothren, J. Stereo analysis, DEM extraction and orthorectification of CORONA satellite imagery: Archaeological applications from the Near East. Antiquity 2008, 82, 732–749. [Google Scholar] [CrossRef] [Green Version]
- Parcak, S.; Tuttle, C.A.; Tuttle, S.P.A. Hiding in Plain Sight: The Discovery of a New Monumental Structure at Petra, Jordan, Using WorldView-1 and WorldView-2 Satellite Imagery. Bull. Am. Sch. Orient. Res. 2016, 375, 35–51. [Google Scholar] [CrossRef]
- Hammer, E.; Ur, J. Near Eastern Landscapes and Declassified U2 Aerial Imagery. Adv. Archaeol. Pr. 2019, 7, 107–126. [Google Scholar] [CrossRef] [Green Version]
- Gabellone, F.; Lanorte, A.; Masini, N.; Lasaponara, R. From remote sensing to a serious game: Digital reconstruction of an abandoned medieval village in Southern Italy. J. Cult. Heritage 2017, 23, 63–70. [Google Scholar] [CrossRef]
- Bennett, R.; Welham, K.; Hill, R.A.; Ford, A.L.J. The Application of Vegetation Indices for the Prospection of Archaeological Features in Grass-dominated Environments. Archaeol. Prospect. 2012, 19, 209–218. [Google Scholar] [CrossRef]
- Gitelson, A.A.; Merzlyak, M.N. Remote sensing of chlorophyll concentration in higher plant leaves. Adv. Space Res. 1998, 22, 689–692. [Google Scholar] [CrossRef]
- Xue, J.; Su, B. Significant Remote Sensing Vegetation Indices: A Review of Developments and Applications. J. Sens. 2017, 2017, 1–17. [Google Scholar] [CrossRef] [Green Version]
- Lasaponara, R.; Masini, N. Detection of archaeological crop marks by using satellite QuickBird multispectral imagery. J. Archaeol. Sci. 2007, 34, 214–221. [Google Scholar] [CrossRef]
- Zanni, S.; De Rosa, A. Remote Sensing Analyses on Sentinel-2 Images: Looking for Roman Roads in Srem Region (Serbia). Geosciences 2019, 9, 25. [Google Scholar] [CrossRef] [Green Version]
- Ullmann, T.; Nill, L.; Schiestl, R.; Trappe, J.; Lange-Athinodorou, E.; Baumhauer, R.; Meister, J. Mapping buried paleogeographical features of the Nile Delta (Egypt) using the Landsat archive. EG Quat. Sci. J. 2020, 69, 225–245. [Google Scholar] [CrossRef]
- De Laet, V.; Paulissen, E.; Waelkens, M. Methods for the extraction of archaeological features from very high-resolution Ikonos-2 remote sensing imagery, Hisar (southwest Turkey). J. Archaeol. Sci. 2007, 34, 830–841. [Google Scholar] [CrossRef]
- Agapiou, A.; Lysandrou, V.; Lasaponara, R.; Masini, N.; Hadjimitsis, D.G. Study of the Variations of Archaeological Marks at Neolithic Site of Lucera, Italy Using High-Resolution Multispectral Datasets. Remote Sens. 2016, 8, 723. [Google Scholar] [CrossRef] [Green Version]
- Ercek, R.; Viviers, D.; Warzée, N. 3D reconstruction and digitalization of an archeological site, Itanos, Crete. Virtual Archaeol. Rev. 2010, 1, 81–85. [Google Scholar] [CrossRef] [Green Version]
- Guidi, G.; Russo, M.; Angheleddu, D. 3D survey and virtual reconstruction of archeological sites. Digit. Appl. Archaeol. Cult. Heritage 2014, 1, 55–69. [Google Scholar] [CrossRef]
- Brůha, L.; Laštovička, J.; Palatý, T.; Štefanová, E.; Štych, P. Reconstruction of Lost Cultural Heritage Sites and Landscapes: Context of Ancient Objects in Time and Space. ISPRS Int. J. Geo-Inf. 2020, 9, 604. [Google Scholar] [CrossRef]
- Groen, I.I.; Baker, C.I. Scenes in the Human Brain: Comparing 2D versus 3D Representations. Neuron 2019, 101, 8–10. [Google Scholar] [CrossRef] [PubMed] [Green Version]
- Valenti, R.; Paternò, E. 3D Integrated Survey for the Study of Archaeological Sites: The Case Study of Euryalus Castle in Siracusa. IOP Conf. Ser. Earth Environ. Sci. 2021, 767, 012015. [Google Scholar] [CrossRef]
- Dawn, S.; Biswas, P. Technologies and Methods for 3D Reconstruction in Archaeology. Commun. Comput. Inf. Sci. 2019, 968, 443–453. [Google Scholar] [CrossRef]
- Aly, Z. A Propos of a Greek Inscription from Hermopolis Magna. Annu. Br. Sch. Athens 1951, 46, 219–231. [Google Scholar] [CrossRef]
- Nasser, M. The Path to the New Hermopolis: The History, Philosophy, and Future of the City of Hermes; Rubedo Press: Auckland, New Zealand, 2019. [Google Scholar]
- Ikram, S. Hermopolis Magna, Tuna-Gebel (Pharaonic). In The Encyclopedia of Ancient History; Bagnall, R.S., Brodersen, K., Champion, C., Erskine, A., Huebner, S., Eds.; Wiley-Blackwell: Hoboken, NJ, USA, 2013. [Google Scholar]
- Moeller, N. The Archaeology of Urbanism in Ancient Egypt: From the Predynastic Period to the End of the Middle Kingdom; Cambridge University Press: Cambridge, UK, 2016; pp. 216–217. [Google Scholar]
- Snape, S. The Complete Cities of Ancient Egypt; AUC Press: Cairo, Egypt, 2014; pp. 136–139, 164–165. [Google Scholar]
- Bard, K.A.; Shubert, S.B. el-Ashmunein. In Encyclopedia of the Archaeology of Ancient Egypt; Routledge: New York, NY, USA, 1999; pp. 167–171. [Google Scholar]
- El-Bayomi, G.; Ali, R. Assessment of Urban Sprawl on El Minya Archeological Sites, Egypt. J. Appl. Sci. 2015, 15, 264–270. [Google Scholar] [CrossRef]
- El-Sayed, S.; Atta, E.; Al-Ashri, K. Groundwater table rise in northwest Nile Delta: Problems and Recommendations. J. Radiat. Res. Appl. Sci. 2012, 15, 141–171. [Google Scholar]
- Bard, K. An Introduction to the Archaeology of Ancient Egypt, 2nd ed.; John Wiley & Sons: Hoboken, NJ, USA, 2015; pp. 55–56. [Google Scholar]
- Masseroni, D.; Ricart, S.; De Cartagena, F.R.; Monserrat, J.; Gonçalves, J.M.; De Lima, I.; Facchi, A.; Sali, G.; Gandolfi, C. Prospects for Improving Gravity-Fed Surface Irrigation Systems in Mediterranean European Contexts. Water 2017, 9, 20. [Google Scholar] [CrossRef] [Green Version]
- Ahmed, A.A.; Fogg, G.E. The impact of groundwater and agricultural expansion on the archaeological sites at Luxor, Egypt. J. Afr. Earth Sci. 2014, 95, 93–104. [Google Scholar] [CrossRef] [Green Version]
- Chavez, P.S., Jr.; Sides, S.C.; Anderson, J.A. Comparison of three different methods to merge multiresolution and multispectral data: Landsat TM and SPOT panchromatic. Photogramm. Eng. Remote Sens. 1991, 57, 295–303. [Google Scholar]
- Ghoneim, E.; Mashaly, J.; Gamble, D.; Halls, J.; AbuBakr, M. Nile Delta exhibited a spatial reversal in the rates of shoreline retreat on the Rosetta promontory comparing pre- and post-beach protection. Geomorphology 2015, 228, 1–14. [Google Scholar] [CrossRef]
- Ghoneim, E.M. Ibn-Batutah: A possible simple impact structure in southeastern Libya, a remote sensing study. Geomorphology 2009, 103, 341–350. [Google Scholar] [CrossRef]
- Boardman, J.W.; Kruse, F. Automatic Spectral Analysis: A Geological Example Using AVIRIS Data, North Grapevine Mountain, Nevada. In Proceedings of the 10th Thematic Conference on Geologic Remote Sensing, San Antonio, TX, USA, 9–12 May 1994; pp. 407–418. [Google Scholar]
- Stewart, C. Detection of Archaeological Residues in Vegetated Areas Using Satellite Synthetic Aperture Radar. Remote Sens. 2017, 9, 118. [Google Scholar] [CrossRef] [Green Version]
- Calleja, J.F.; Pagés, O.R.; Díaz-Álvarez, N.; Peón, J.; Gutiérrez, N.; Martín-Hernández, E.; Relea, A.C.; Melendi, D.R.; Álvarez, P.F. Detection of buried archaeological remains with the combined use of satellite multispectral data and UAV data. Int. J. Appl. Earth Obs. Geoinf. 2018, 73, 555–573. [Google Scholar] [CrossRef]
- Crippen, R. Calculating the vegetation index faster. Remote Sens. Environ. 1990, 34, 71–73. [Google Scholar] [CrossRef]
- Guo, W.; Li, D.; Watson, A. Directional filtering as a multi-purpose tool in image processing. In Proceedings of the 2001 International Conferences on Info-Tech and Info-Net. Proceedings (Cat. No.01EX479), Beijing, China, 29 October–1 November 2001; pp. 332–336. [Google Scholar]
- Nicholson, P.T.; Shaw, I. (Eds.) Including Mud-brick Architecture. In Ancient Egyptian Materials and Technology; Cambridge University Press: Cambridge, UK, 2009; pp. 78–103. [Google Scholar]
- Hool, G.A.; Johnson, N.C. Handbook of Building Construction: Data For Architects, Designing and Construction Engineers, and Contractors; Nabu Press: New York, NY, USA, 2010. [Google Scholar]
- Volta, B.; Levy, T.E.; Braswell, G. The virtual Chichén Itzá project: Modelling an ancient Maya city in Google SketchUp. Antiquity 2009, 83, 321. [Google Scholar]
- Douglass, M.J.; Day, Z.R.; Brunette, J.C.; Bleed, P.; Scott, D. Virtual Reconstruction as Archaeological Observation: Embracing New Ways of Treating Sites, Places and Landscapes. Adv. Archaeol. Pr. 2019, 7, 127–139. [Google Scholar] [CrossRef]
- Stewart, C.; Labrèche, G.; González, D. A Pilot Study on Remote Sensing and Citizen Science for Archaeological Prospection. Remote Sens. 2020, 12, 2795. [Google Scholar] [CrossRef]
- Manassa Darnell, C. Transition 18th–19th Dynasty. In UCLA Encyclopedia of Egyptology; Grajetzki, W., Wendrich, W., Eds.; UCLA Department of Near Eastern Languages and Cultures: Los Angeles, CA, USA, 2015; pp. 1–15. [Google Scholar]
- Lacovara, P. New Kingdom Royal City; Routledge: London, UK, 2013; pp. 44–45. [Google Scholar]
- El-Derby, A.A.; Elyamani, A. The Adobe Barrel Vaulted Structures in Ancient Egypt: A Study Of Two Case Studies For Conservation Purposes. Mediterr. Archaeol. Archaeom. 2016, 16, 295–315. [Google Scholar] [CrossRef]
- Lecuyot, G. The Ramesseum (Egypt): Recent Archaeological Research; CNRS: Paris, France, 2000; pp. 1–14. [Google Scholar]
- Roeder, G. Hermopolis 1929–1939: Ausgrabungen der Deutschen Hermopolis-Expedition in Hermopolis, Ober-Ägypten; Gerstenberg: Hildesheim, Germany, 1959. [Google Scholar]
- Lasaponara, R.; Masini, N. Identification of archaeological buried remains based on the normalized difference vegetation index (NDVI) from Quickbird satellite data. IEEE Geosci. Remote Sens. Lett. 2006, 3, 325–328. [Google Scholar] [CrossRef]
- Spencer, A.J. Excavations at Tell-Balamun, 2003–2008; British Museum Press: London, UK, 2009; pp. 106–107. [Google Scholar]
- Herbich, T. Magnetic survey of the Late Period grate temple enclosure in Tell el-Balamun, Egypt. ArchéoSciences 2009, 33, 77–79. [Google Scholar] [CrossRef]
- Malecka-Drozd, N. The Emergence and Development of Architecture on the Casemate Foundation Platforms in the Nile Delta. Rech. Archéologiques Nouv. 2012, 4, 69–96. [Google Scholar]
- Muhs, B. The Great Temenos of Naukratis. J. Am. Res. Cent. Egypt 1994, 31, 99. [Google Scholar] [CrossRef]
- Lucas, A. Ancient Egyptian Materials and Industries, 3rd ed.; Edward Arnold and Co.: London, UK, 1948; pp. 62–64. [Google Scholar]
- El Emam, A.; Abdallatif, T.; Suh, M.; Odah, H. Delineation of Egyptian mud bricks using magnetic gradiometer techniques. Arab. J. Geosci. 2014, 7, 489–503. [Google Scholar] [CrossRef]
- Emery, V. Mud-Brick. In UCLA Encyclopedia of Egyptology; Wendrich, W., Ed.; UCLA Department of Near Eastern Languages and Cultures: Los Angeles, CA, USA, 2011; pp. 1–10. [Google Scholar]


Publisher’s Note: MDPI stays neutral with regard to jurisdictional claims in published maps and institutional affiliations. |
© 2021 by the author. Licensee MDPI, Basel, Switzerland. This article is an open access article distributed under the terms and conditions of the Creative Commons Attribution (CC BY) license (https://creativecommons.org/licenses/by/4.0/).
Share and Cite
El-Behaedi, R. Detection and 3D Modeling of Potential Buried Archaeological Structures Using WorldView-3 Satellite Imagery. Remote Sens. 2022, 14, 92. https://doi.org/10.3390/rs14010092
El-Behaedi R. Detection and 3D Modeling of Potential Buried Archaeological Structures Using WorldView-3 Satellite Imagery. Remote Sensing. 2022; 14(1):92. https://doi.org/10.3390/rs14010092
Chicago/Turabian StyleEl-Behaedi, Raghda. 2022. "Detection and 3D Modeling of Potential Buried Archaeological Structures Using WorldView-3 Satellite Imagery" Remote Sensing 14, no. 1: 92. https://doi.org/10.3390/rs14010092
APA StyleEl-Behaedi, R. (2022). Detection and 3D Modeling of Potential Buried Archaeological Structures Using WorldView-3 Satellite Imagery. Remote Sensing, 14(1), 92. https://doi.org/10.3390/rs14010092