Abstract
It is crucial for a ballistic missile defense system to discriminate the true warhead from decoys. Although a decoy has a similar shape to the warhead, it is believed that the true warhead can be separated by its micro-Doppler features introduced by the precession and nutation. As is well known, the accuracy of the phase-derived range method, to extract micro-Doppler curves, can reach sub-wavelength. However, it suffers from an inefficiency of energy integration and high computational costs. In this paper, a novel phase-derived range method, using high-order multi-frame track-before-detect is proposed for micro-Doppler curve extraction under a low signal-to-noise ratio (SNR). First, the sinusoidal micro-Doppler range sequence is treated as the state, and the dynamic model is described as a Markov chain to obtain the envelopes and then the ambiguous phases. Instead of processing the whole frames, the proposed method only processes the latest frame at an arbitrary given time, which reduces the computational costs. Then, the correlation of all pairs of adjacent pulses is calculated along the slow time dimension to find the number of cells that the point scatterer crosses, which can be further used in phase unwrapping. Finally, the phase-derived range method is employed to get the micro-Doppler curves. Simulation results show that the proposed method is capable of extracting the micro-Doppler curves with sub-wavelength accuracy, even if SNR = −15 dB, with a lower computational cost.
1. Introduction
Discriminating warheads from decoys is one of the most significant and challenging tasks in a ballistic missile defense system [1,2,3]. Generally, decoys have a similar shape to the true warhead and are released in the mid-course stage to deceive the missile defense system. Fortunately, the warhead is usually heavier than the decoys, and it has micro-motions, such as spin and precession to keep a stable attitude in the mid-course phase, while the micro-motion forms of the decoy are mostly tumbling and large-scale nutation [4,5]. When using radar to observe the warheads and decoys, the different micro-motions will introduce different micro-Doppler features in the received echoes. This makes it possible to separate them from each other [6,7,8].
In the past few decades, various recognition methods have been proposed based on the micro-Doppler extraction, which can be roughly divided into five categories: radar cross-section (RCS) [4,9,10], high-resolution range profile (HRRP) [2,11], inverse synthetic aperture radar images [12,13,14], backscatter coefficient [15,16], and orbit information [17,18]. The RCS sequence is easy to obtain, and contains rich information about the target, such as the size, structure, surface material, and posture of the target [4]. However, RCS is affected by various factors, such as target material, target shape, etc. As a result, the micro-Doppler features extraction based on the RCS sequence may not be reliable enough [7]. Compared with RCS sequences, HRRP and inverse synthetic aperture radar images can obtain refined structure information of the target, which provides favorable conditions for high-precision micro-Doppler estimation [19,20]. However, with the development of the invade technique, the shape, size, and coating of the decoys are almost the same as the warheads, and it is hard for the methods based on HRRP and inverse synthetic aperture radar images to distinguish them, only according to their imaging results [2,4]. Note that, in the mid-course phase, motions of warheads and decoys are almost not affected by air resistance, so their translational motions are essentially the same. Consequently, using the orbit information to separate the two targets is difficult [2].
Recently, the envelope association method from the HRRP sequence for micro-Doppler curve extraction via wideband radar has attracted increasing attention [20,21,22]. In [20], the authors proposed a phase-derived range method for micro-Doppler parameter extraction. A one-order keystone transform is employed to fit the micro-Doppler envelope, which can achieve the straightening of the range migration without parameters. The one-order keystone transform is linear, but the warhead micro-Doppler envelope is sine-like and non-linear, and directly using the one-order Keystone transform cannot fit the envelope well. An improved second-order keystone transform was also developed in [23]. It can remove the first-order or second-order coupling, but suffers from complex phase residual terms.
The method based on extended Kalman filter (EKF) was introduced to deal with the non-linear motion in [24]. It first employs the Taylor expansion to obtain the local linearity of the non-linear motion and then uses the Kalman filter to estimate the motion state of the target. Note that when dealing with the motion with a high non-linearity degree, EKF will be degraded by the truncation error. Moreover, EKF is sensitive to the SNR, and low SNR will further deteriorate its performance. In [21], the authors proposed a modified Kalman filter for the envelope extraction of the cone-shaped targets, which is more robust and precise than the EKF. However, the performance of the modified Kalman filter is limited due to unknown noise covariance under low SNR conditions.
In recent years, methods based on track-before-detect (TBD) that directly process the raw data or the thresholded data with a small value, have been proposed for target detection under low SNR conditions [17,25]. Generally, such TBD methods can be divided into two categories: the single-frame and multiple-frames TBD [17]. Similar to the Kalman filter, the single-frame TBD methods estimate the target states by predicting and updating the posterior probability density, such as the random finite set algorithms [26,27], particle filter [28], and histogram probabilistic multi-hypothesis tracker [29]. Comparatively, multiple-frames TBD methods normally use a sliding window to jointly process multiple data frames at each measurement time, and are capable of achieving superior performance for target detection under low SNR conditions, at the expense of high computing complexity [17], such as dynamic programming TBD [30], Hough transform [31], velocity matched filtering [25], and maximum likelihood probabilistic data association [32].
In this paper, an improved phase-derived range method with a high-order multi-frame TBD (HO-MF-TBD) is presented to extract the micro-Doppler curves under low SNR circumstances. First, extracting the micro-Doppler sequence from the HRRP, and the micro-Doppler ranges form a Markov chain. Then, the HO-MF-TBD is employed to estimate the states of the Markov chain, and only the latest frame is processed at an arbitrary given time. The micro-Doppler curve envelopes and the ambiguous phase can be obtained. At the same time, one can calculate the correlation of two adjacent pulses of each segment to get the moving distance, or range migration units, of the target, which is reflected by the number of range cells it crosses on the HRRP from one pulse to the other. Then, the unambiguous Doppler phase can be easily obtained from the ambiguous Doppler phase and the range migration units. Finally, the micro-Doppler curve extraction can be done by the commonly-used phase-derived range method. The main contributions of this paper include: (1) The HO-MF-TBD method is proposed for envelope extraction, with model robustness and lower computational costs under low SNR conditions. (2) A new phase unwrapping technique, which calculates the moving distance from two adjacent frames, is proposed to improve the ranging accuracy.
The remainder of this paper is organized as follows. Section 2 gives the geometric model and signal model. Section 3 explains the micro-Doppler envelope extraction using the HO-MF-TBD algorithm. A new phase unwrapping method is presented in Section 4. In Section 5, several simulation results are presented to verify the proposed method. Concluding remarks are provided in Section 6.
2. Geometric Model and Signal Model
In this section, the geometric and signal model is introduced. To ease the reading, the main notations are listed in Table 1.

Table 1.
The main notations.
2.1. Geometric Model
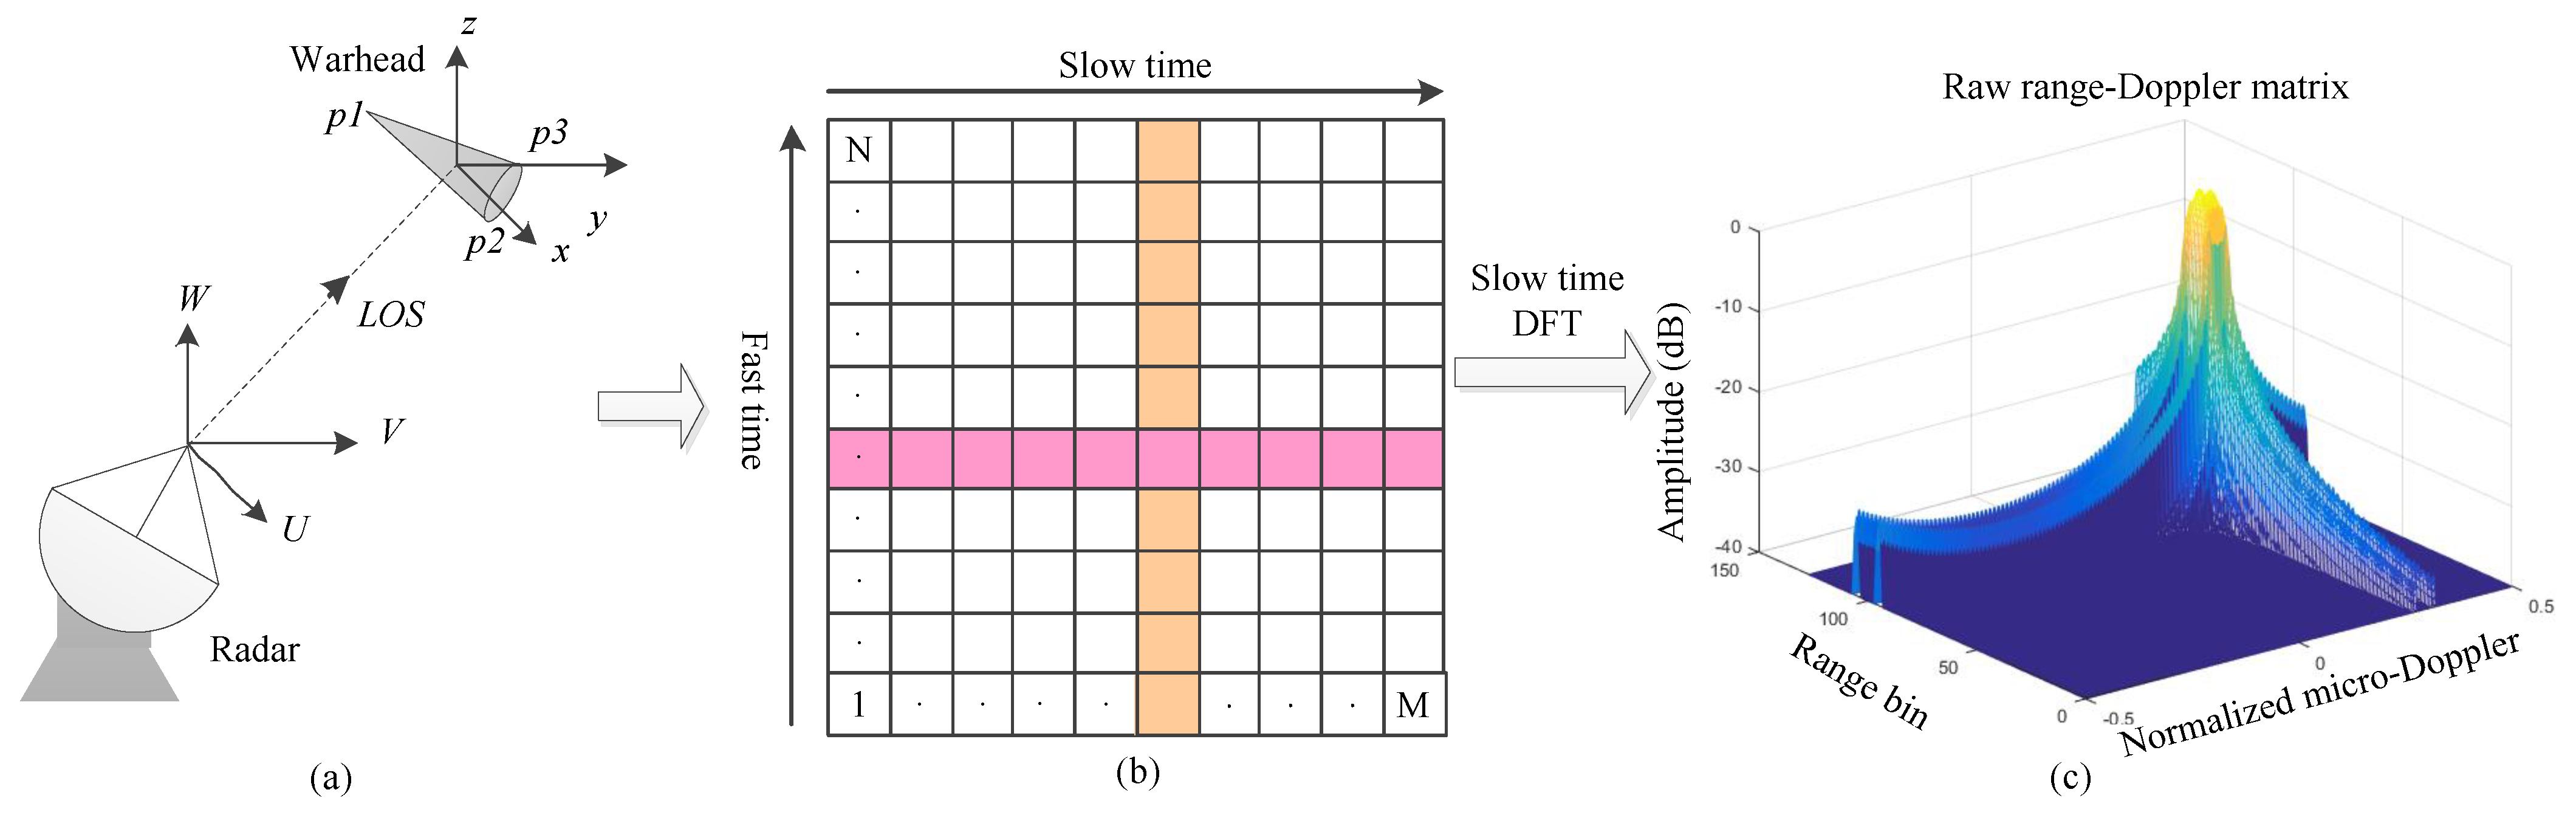
The geometric model used in this paper is based on the model in [2,7,22]. As shown in Figure 1a, the radar is located at the origin of the coordinate system , and remains stationary during observation. The target coordinate system takes the target centered as the coordinate origin, and the target is accompanied by cone rotation in flight. A smooth cone warhead contains three point scatterers, namely , , and , respectively. is fixed, while and change their positions with the changes of radar line of sight. The theoretical expression of the micro-Doppler curve from , , and to radar is
where , H, d, r, , and represent the distance from warhead centered to radar, the warhead height, the distance from warhead centered to warhead top, the warhead bottom radius, the angular velocity, and the initial phase, respectively. and denote the elevation angle of radar line of sight and precession angle, respectively. Generally, is occluded because of the occlusion effect [21].

Figure 1.
Geometric model and signal model: (a) target model; (b) series of M chirps. The baseband signal corresponding to each chirp is digitized and generated N samples. It is arranged in a matrix of elements; (c) the generated range-Doppler matrix.
2.2. Signal Model
The linear frequency modulation signal is widely used in wideband radar systems [11]. The transmitted linear frequency modulation signal can be expressed as
where , , , and denote the fast time, the slow time, the pulse duration, the carrier frequency, and the slope frequency modulation, respectively. Usually, the reference signal is used for de-chirp processing, which is a replica of the transmitted signal, and it can be expressed as
where denotes the time delay caused by the speed of light passing through the reference distance, represents the reference distance, and represents the length of the receiving window, which is larger than , so that the reference signal can cover the transmitted signal. Then, the echo signal from a point scatterer can be expressed as
where represents the amplitude containing the sinc function of point scatterer i, denotes the time caused by the motion change of point scatterer i, and is the receive noise with Gaussian distribution, the mean value is 0 and the variance is .
After de-chirp processing, the signal can be expressed as
where represents the amplitude containing the sinc function after de-chirp processing of point scatterer i.
Generally, the pulse width of the rectangular signal emitted by the radar is very narrow, so the distance change caused by the micro-movement of the target within can be ignored, and the translation of the target can be approximated as a uniform motion [11]. Therefore, the radial range from the target to the radar can be expressed as
where , and represent the radial range of the target centered, radial velocity, and range variation induced by micro-motion, respectively. Substituting (7) into (6) and performing fast Fourier transform on (6) can get the target’s HRRP. Reference (6) shows that the speed takes a great influence on the target’s HRRP, especially for high-speed ballistic targets. Therefore, speed compensation must be performed to obtain a usable HRRP image. Fortunately, the speed measurement accuracy of modern radars has already met the requirements of speed compensation [33]. Therefore, this article will not discuss the impact of target speed on HRRP. The target model is shown in Figure 1a. The HRRP of the target can be expressed as
where I, , and represent the number of point scatterers, the amplitude of the target contain sinc function, the wavelength of the carrier, and the complex white Gaussian noise after fast Fourier transform, respectively.
Generally, the attitude of the warhead is relatively stable in the mid-course phase, and the micro-Doppler of the wideband radar is easily extracted from the bulk motion [21]. Then the micro-Doppler model of the i-th point scatterer can be expressed as [11]
where , and represent the amplitude, angular velocity, and initial phase of the i-th micro-Doppler point scatterer, respectively. The micro-Doppler of the target is a sin function, as shown in the Formula (9), which is a high-order motion.
The echo is digitized, which is arranged in a matrix of grid of cells based on the resolution of radar, as shown in Figure 1b, where M and N represent the matrix length of the slow-time dimension and the fast-time dimension, respectively. Then, the pulse-echo signal of the slow-time dimension of the i-th point scatterer of Formula (8) can be rewritten as
where denotes the pulse repetition interval, . Figure 1c respects that the point scatterer across several range cells. Therefore, the HO-MF-TBD is employed to associate the envelope of the point scatterer optimally.
3. Micro-Doppler Envelope Extraction Using HO-MF-TBD
This section focuses on describing the HO-MF-TBD method of micro-Doppler envelope extraction.
3.1. Measurement Model
In Section 2, the HRRP sequence of each point scatterer is divided into cells based on the resolution of radar, namely , where and denote the resolutions of M and N directions, respectively. Take as measurement values, and the measurement intensity recorded in quantized cell in the mth frame can be formulated as
where , and , represents the additive white Gaussian noise with independently and identically distributed. The measurements of K frames in a multi-frame batch are denoted as
In this paper, an effective energy integration is presented for weak target detection with low thresholds. First, calculate the amplitude of all K frames in a processing batch, and record the cells with amplitude greater than 0. The amplitudes are assumed to be independently distributed in the map depending on the distribution of targets and noise. Therefore, the measurement can be expressed as
where denotes the amplitude of point scatterer, and represent the independent and identically distributed Gaussian noise with the zero mean and variances and , repressively.
3.2. Target Model
The target state in the mth frame is assumed to obey the first-order Markov process, which is express as
where p represents the probability density function, and denotes D-dimensional different state. According to the Bayesian estimation theory, the state transition equation is
where represents identity matrix, and ⊗ the Kronecker product.
3.3. HO-MF-TBD Method
According to the Bayesian estimation theory, the measurement model describing the relationship between the state and the measurements ,
where is a function of the state and the measured noise at the frame m. The track and measurement data of a target in a batch of K frames can be expressed as and , respectively. Based on the Bayesian estimation theory, the estimator of the state sequence can be obtained by the posterior probability density function of the state sequence , and
where represents the value function corresponding to the target state , is used to store the state transition relationship between frames, and represents the measurement plane likelihood function
where represents the likelihood function of the measured value . For ,
where represents the state range of the transition of the state within one frame time. The computational complexity of (21) is , it increases linearly with the number of scans K, and is a D-dimensional state space. The calculation amount is reduced by limiting the value range of , take equal to 5 as an example, the search range and accumulation method are shown in Figure 2. represents the cost function of the state transition. The estimated envelope is
where is a pre-set detection threshold, and if , then for ,
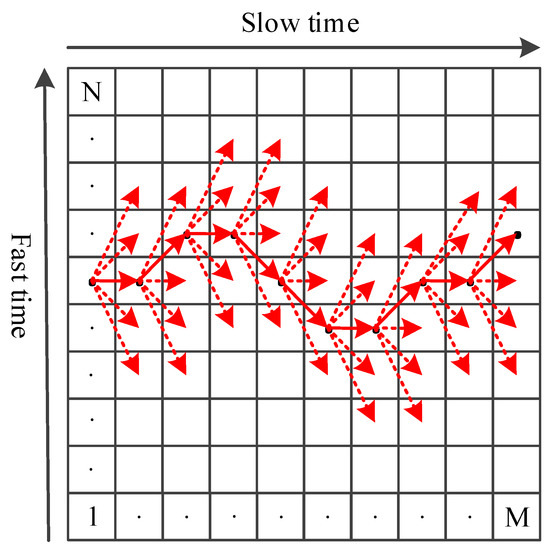
Figure 2.
Take as an example to illustrate the envelope extraction using the HO-MF-TBD method. The dotted arrow represents the search range, and the solid arrow represents the points selected from the search range to estimate the envelope.
In Figure 2, the dotted arrow represents the search range, and the solid arrow represents the points selected from the search range to estimate envelope . However, may deviate from the true path due to the influence of noise. Therefore, median filtering is introduced to reduce the error caused by noise. is recorded as after median filtering.
The ambiguous micro-Doppler phase can be obtained according to the envelope
where and denote the imaginary and real parts of . The unambiguous micro-Doppler phase can be obtained by the phase unwrapping method, which will be introduced in Section 4.
4. Phase Unwrapping
The mth ambiguous micro-Doppler phase obtained in Section 3 is defined as , and the unambiguous phase can be expressed as
where is an integer to ensure , and is the measurement error. The and are defined as the difference between the th and mth unambiguous and ambiguous micro-Doppler phase, respectively. Then
where = . The real difference between the mth and (m + 1)th echo signal pulse is . So the key point to get the .
It is known that the similarity between the two signals is measured by the correlation coefficient. Thus, the correlation of any adjacent pulse pairs is calculated along the slow time dimension to find the number of range cells is crossed by the point scatterer. The correlation between the mth and th pulse is expressed as
where denotes range cells the point scatterer across, and
where is the wavelength of the radar carrier, and respects resolution in the fast time direction. From (27) to (30), it can yield the . The real radial range can be obtained
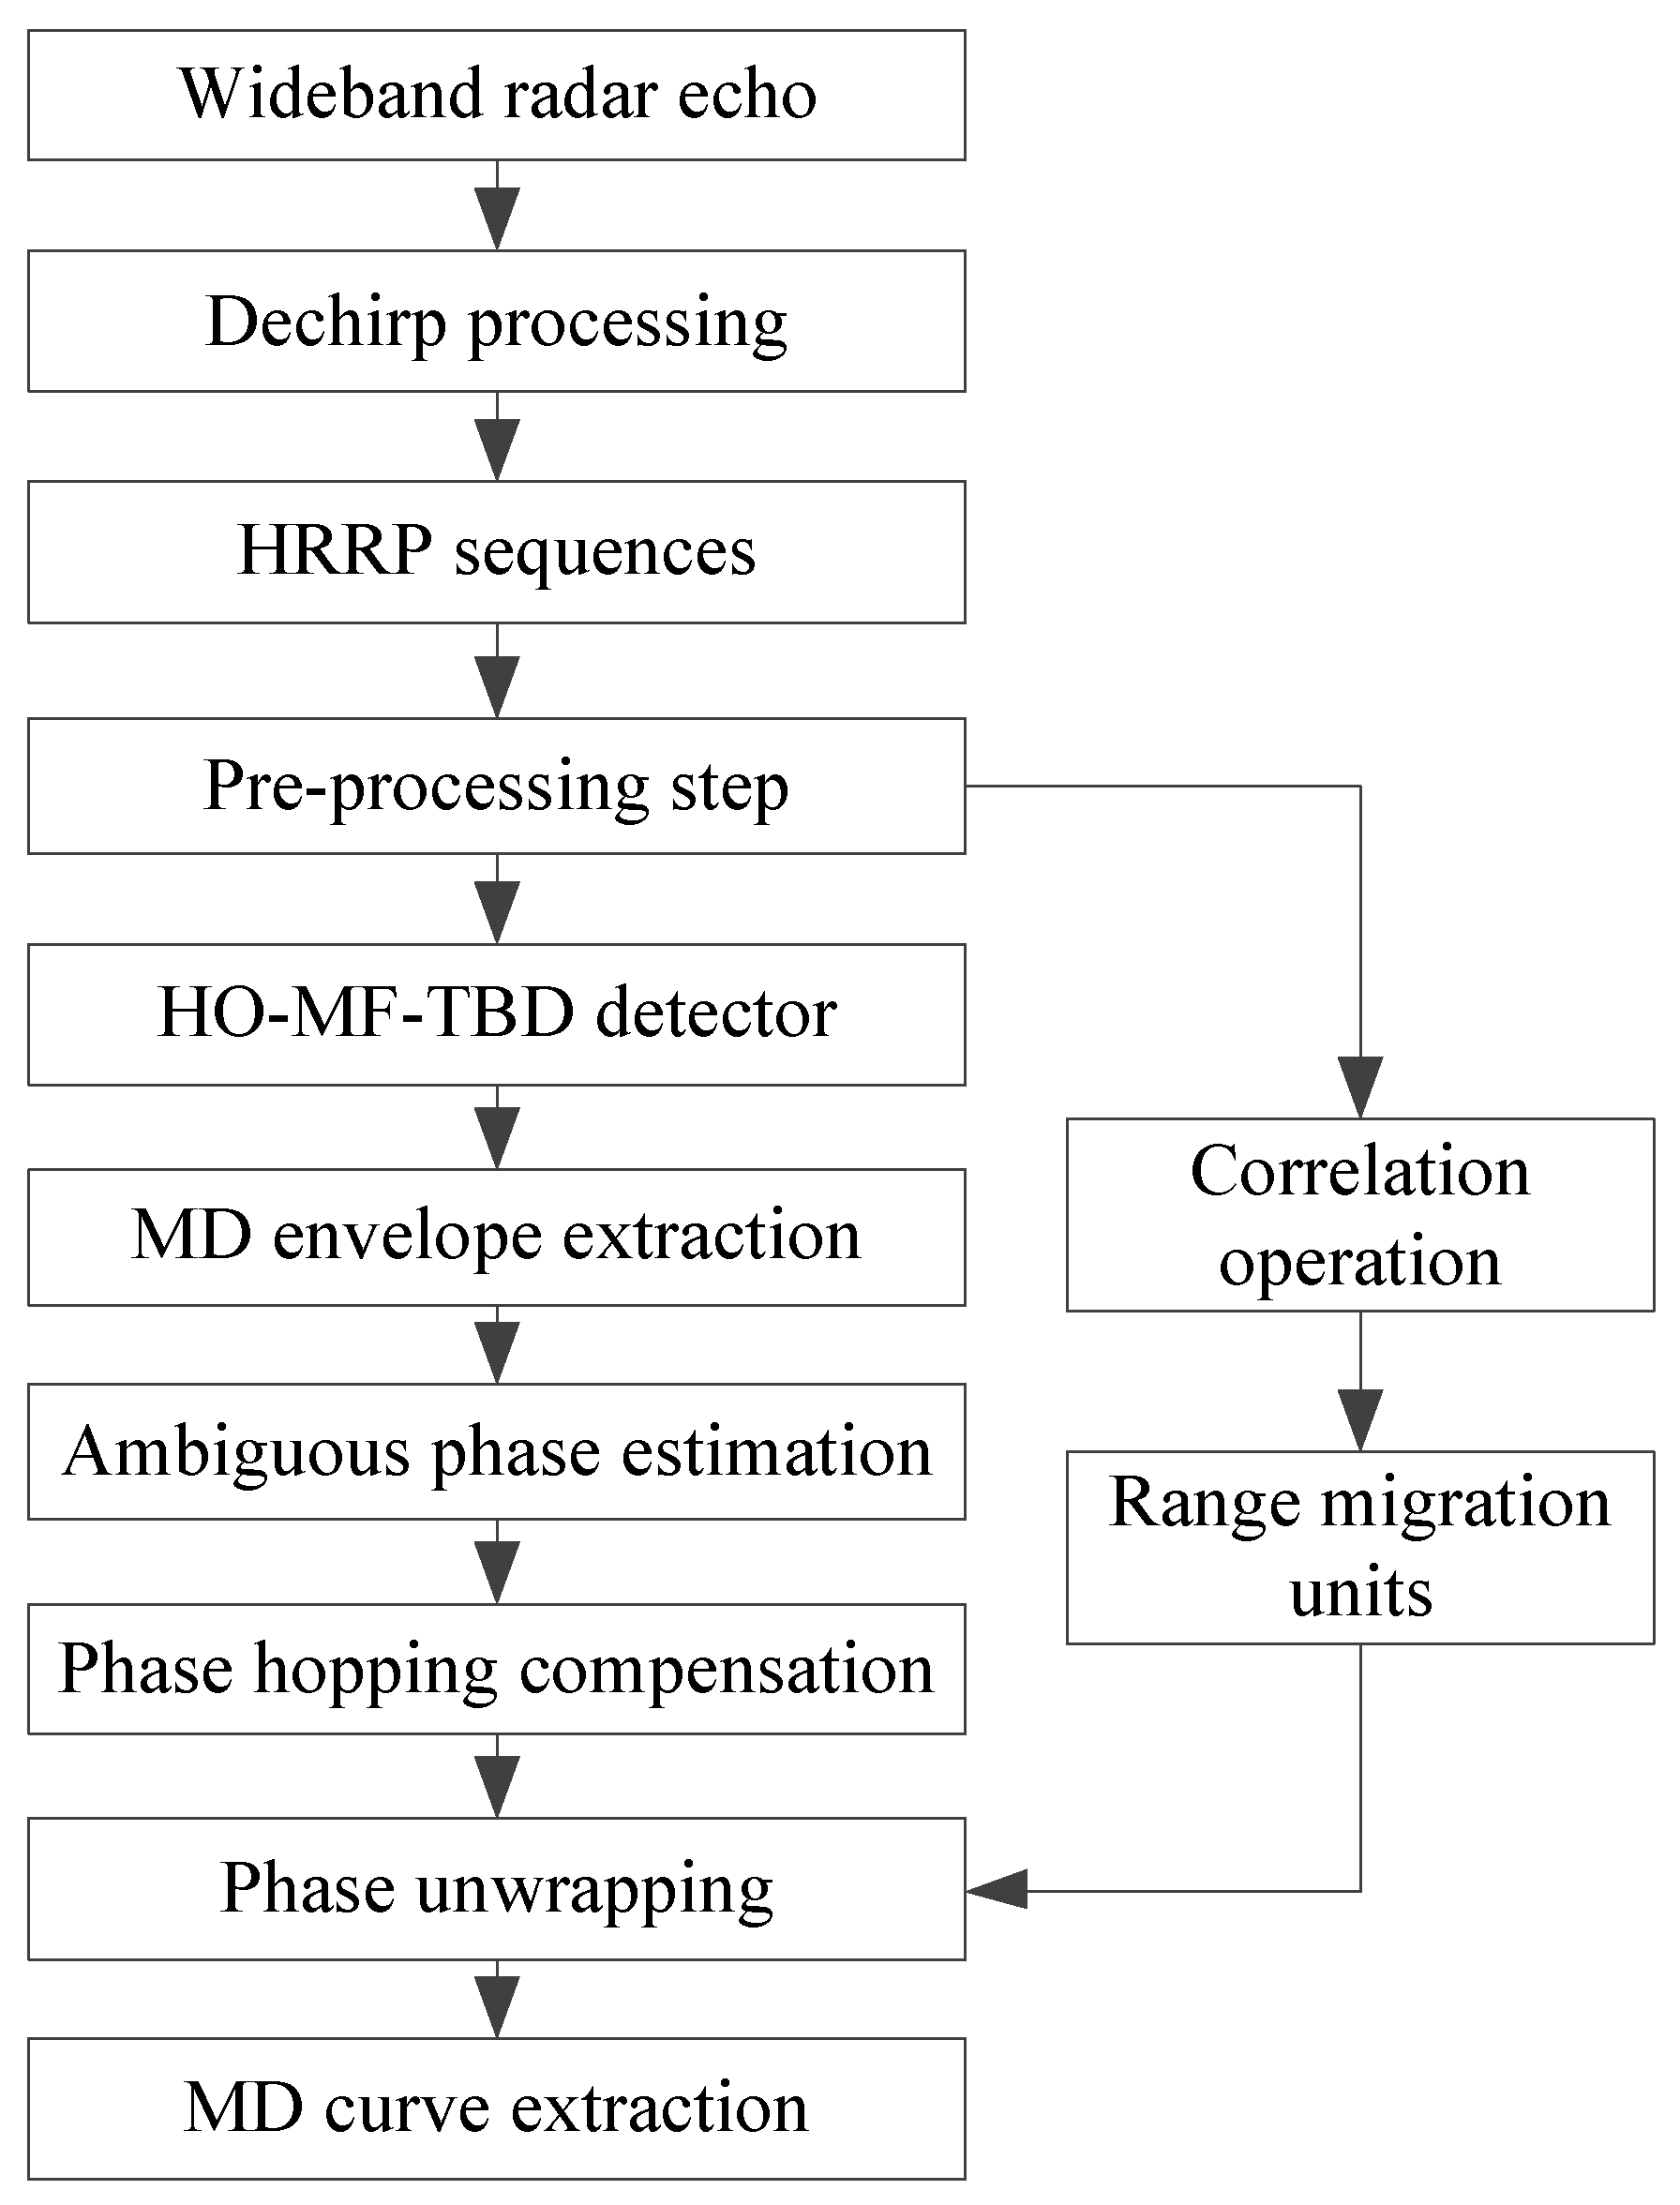
where . The flowchart for the implementation of the proposed method is shown in Figure 3.
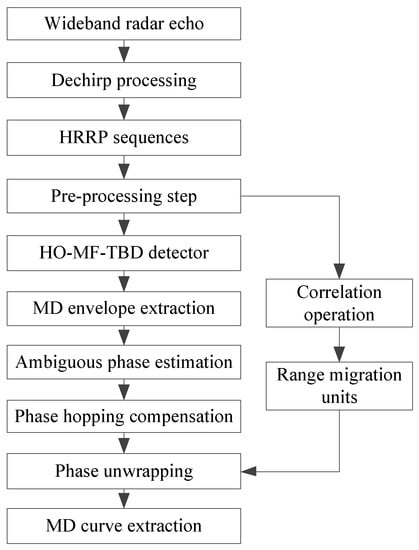
Figure 3.
Flowchart for the implementation of the proposed method.
5. Simulations and Discussion
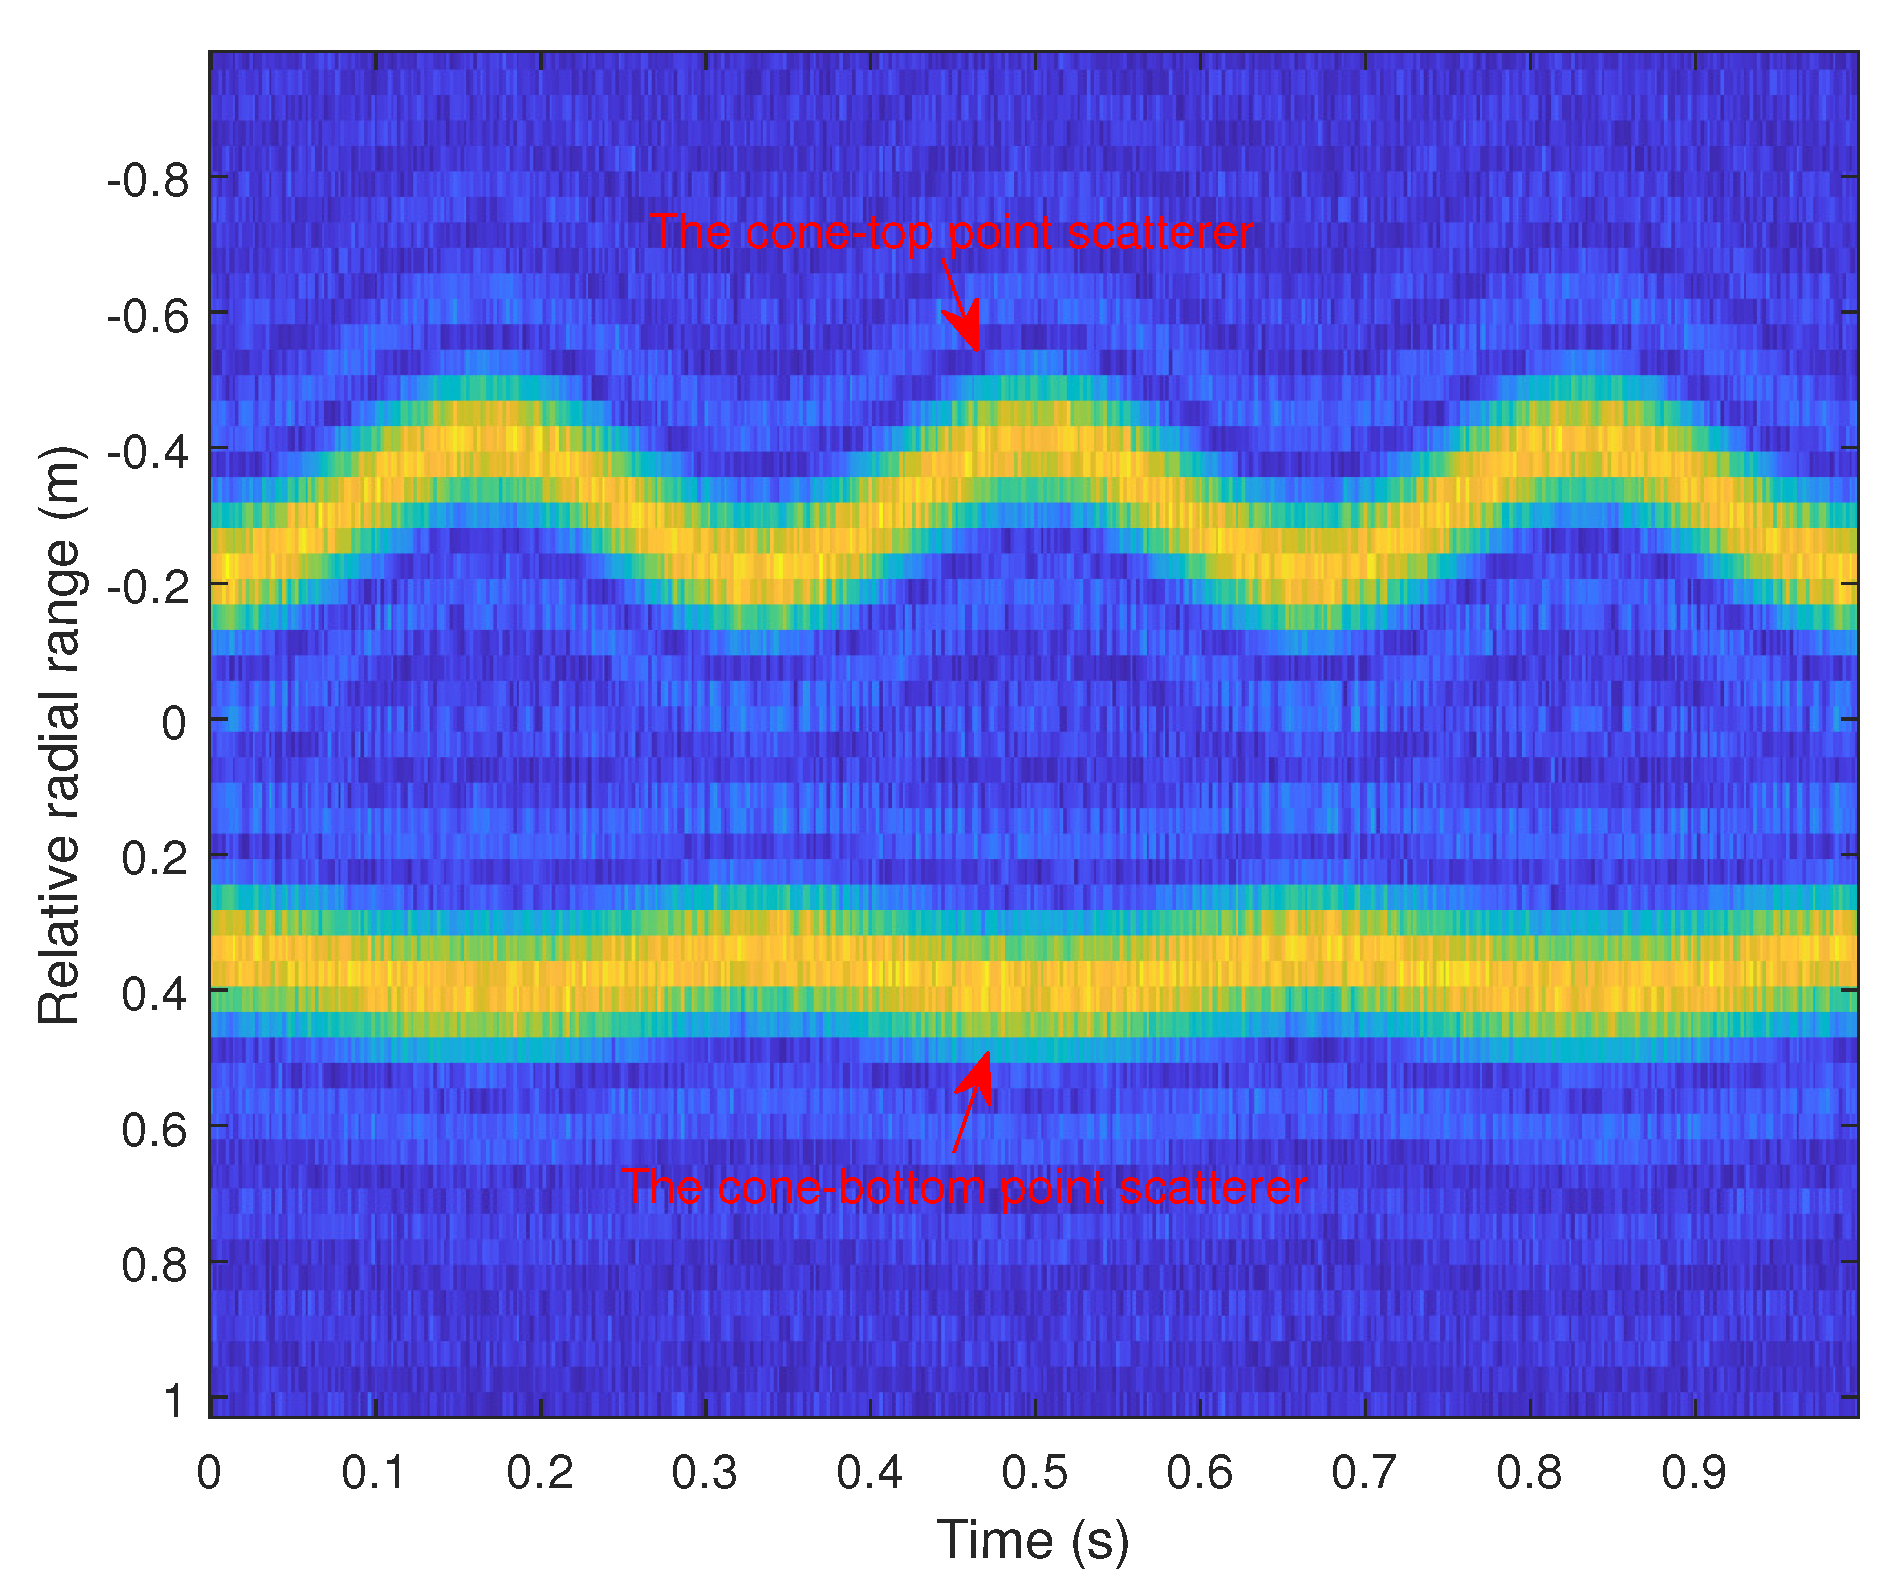
Some Monte Carlo simulation experiments are carried out to illustrate the performance of the proposed method. The height and radius of the metal cone are 0.96 and 0.25 m, respectively. The spin frequency, precession angle, pulse repetition period (PRF), and rotation frequency are 4 Hz, 10 degrees, 1 KHz, and 2 Hz, respectively. The radar works at the carrier frequency of 10 GHz and with a bandwidth of 2 GB. The parameters are shown in Table 2, and the warhead is shown in Figure 1a. Figure 4 shows the HRRP sequence according to the parameters in Table 2 with the SNR at −15 dB. Figure 4 shows that the target occupies some range bins due to the wideband radar and warhead volume.
Table 2.
Simulation parameters.

Figure 4.
HRRP sequence. Take SNR = −15 dB as an example for presentation the HRRP sequence.
5.1. Micro-Doppler Envelope Extraction Using HO-MF-TBD Method
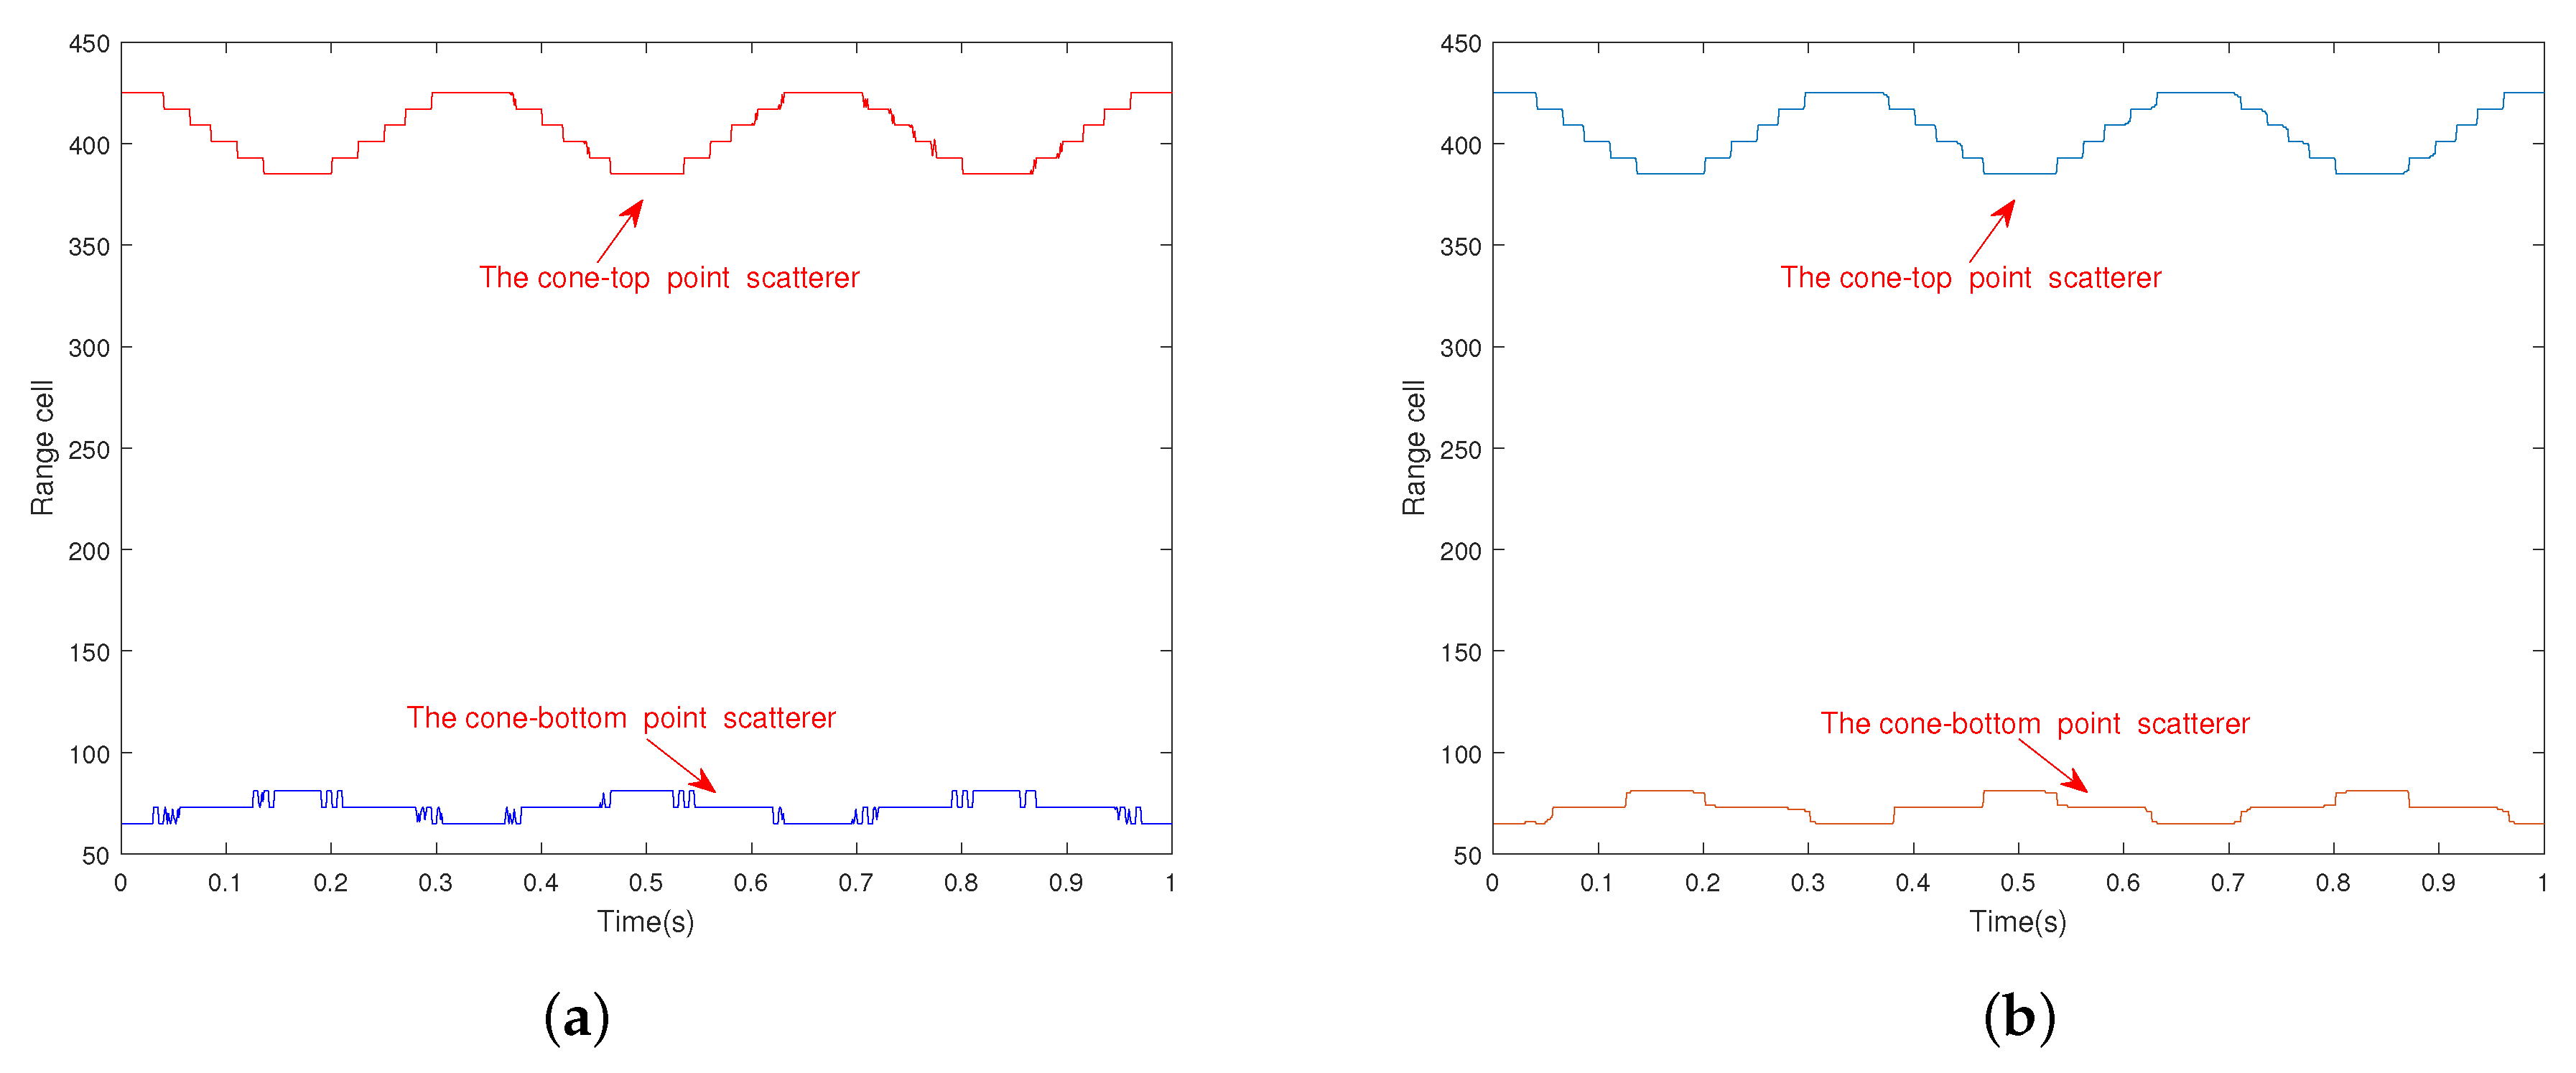
For each point scatterer, HO-MF-TBD is used to associate the envelope. The envelope extraction results are shown in Figure 5a. Figure 5a shows that there are errors in some range cells. Therefore, a median filter is used for smoothing to eliminate the accumulated error. The smoothed envelopes are shown in Figure 5b.
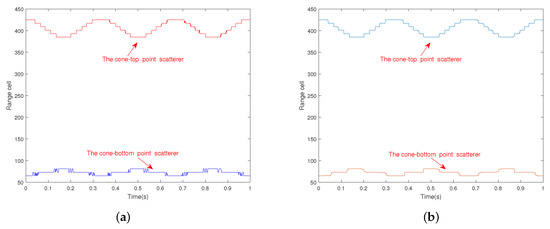
Figure 5.
Envelope extraction: (a) envelope extraction using HO-MF-TBD method; (b) envelopes after median filtering.
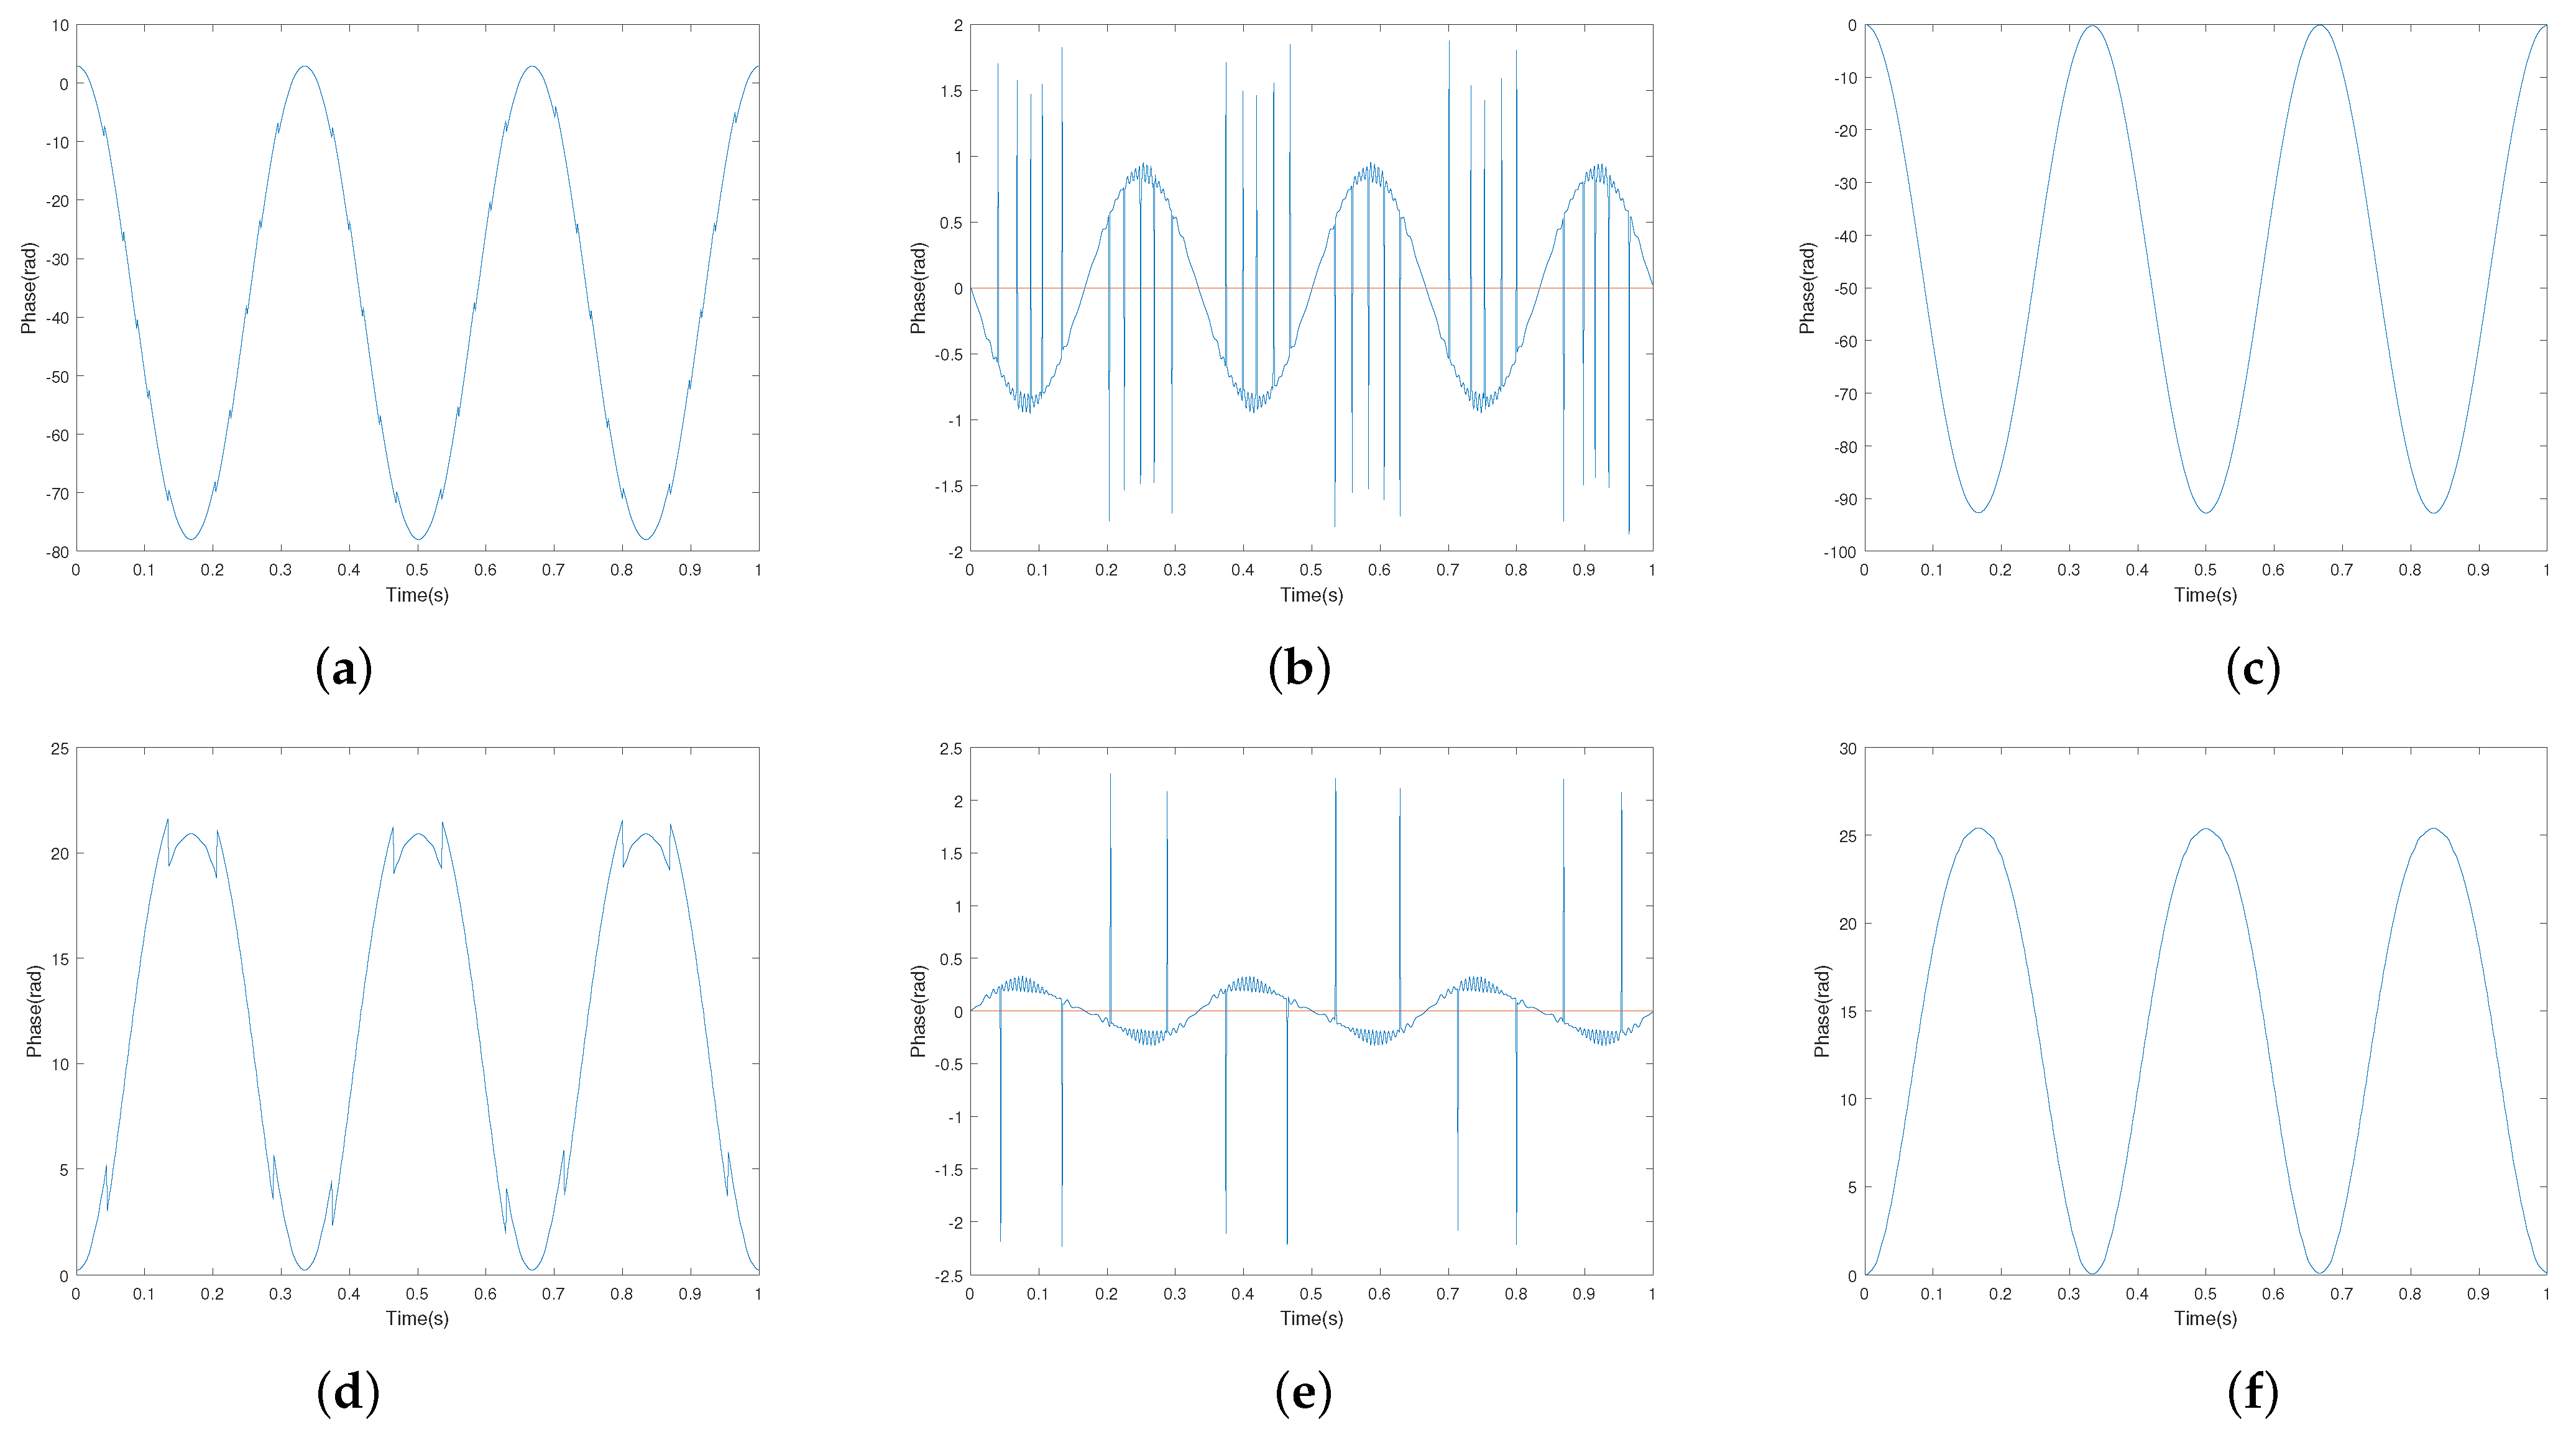
Based on the envelopes, the ambiguous Doppler phase is obtained directly, and presented in Figure 6a,d. The phase hopping occurs where the range changing is greater than one range bin in Figure 6d. Thus, phase compensation is required to be performed before the phase unwrapping to guarantee the unwrapping accuracy. The phase difference between two adjacent phases is calculated, and take the point where the difference is greater than 0.5 as phase hopping, as depicted in Figure 6b,e. Then, additional compensation or is carried out to obtain the smooth ambiguous Doppler phase, which is shown in Figure 6c,f.
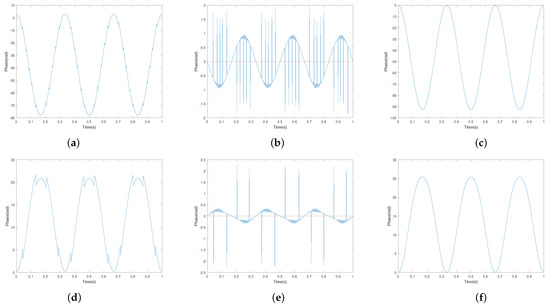
Figure 6.
Ambiguous phase extraction: (a) Doppler phase corresponding to the envelope of the cone-top point scatterer; (b) the difference between two adjacent pulse of (a); (c) phase after compensation of (a); (d) Doppler phase corresponding to the envelope of the cone-bottom point scatterer; (e) the difference between two adjacent pulse of (d); (f) phase after compensation of (d).
5.2. Phase Unwrapping
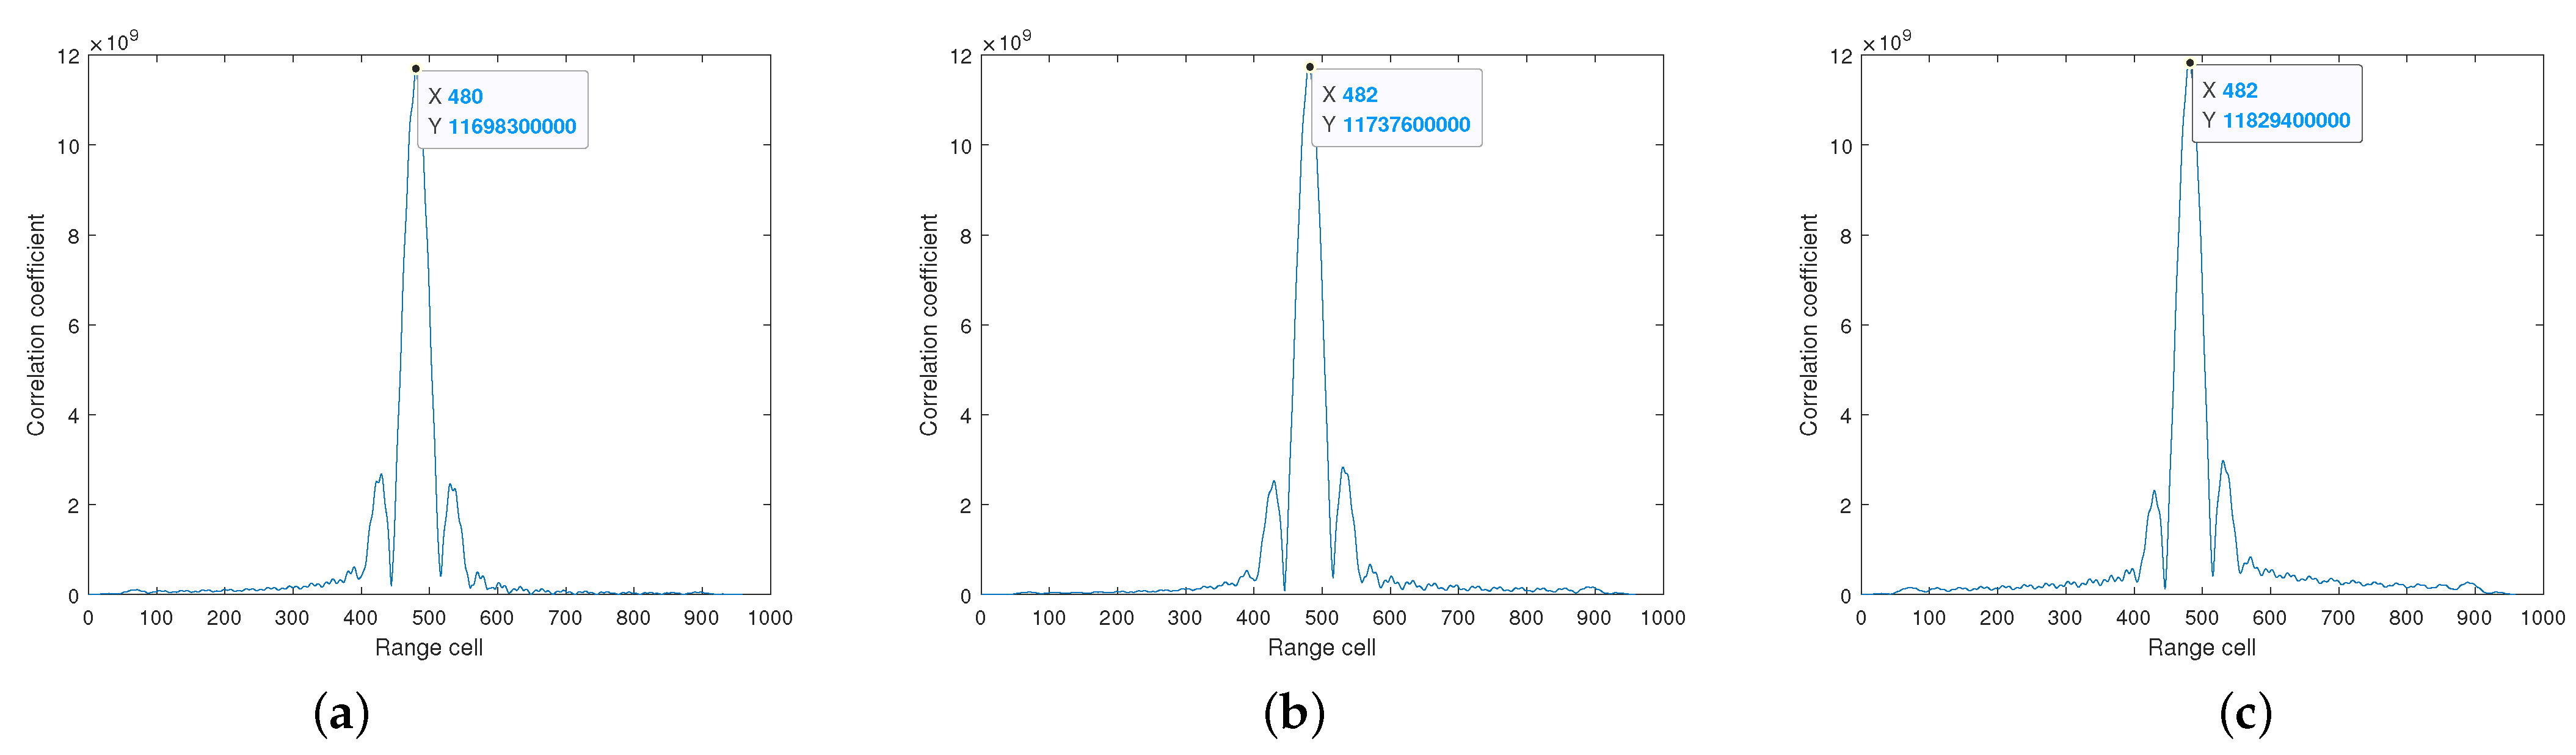
Correlation is the degree of similarity between two sequences. The correlation of any adjacent pulse pairs is calculated along the slow time dimension to find the number of range bins crossed by the point scatterer. For example, Figure 7a–c show the relevant results of the 45th and 46th, 46th and 47th, and 47th and 48th frames, respectively. Figure 7a–c have the highest correlation at the 480th, 482nd, and 482nd range cells, respectively, which means that the point scatterer moves from the 480th range cell to the 482nd range cell from frame the 46th to frame 47th, crossing two range cells. However, the point scatterer does not cross the range cell from frame 47 to frame 48. The number of range cells that the point scatterer crosses can be further used in phase unwrapping. Then, the micro-Doppler curve can be estimated accurately by the phase-derived range method.
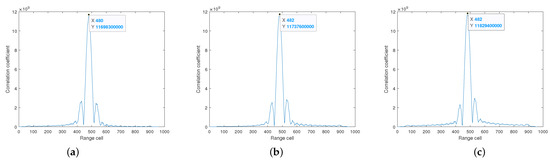
Figure 7.
The correlation results: (a) the correlation results of the 45th frame and 46th frame; (b) the correlation results of the 46th and 47th frames; (c) the correlation results of the 47th and 48th frames.
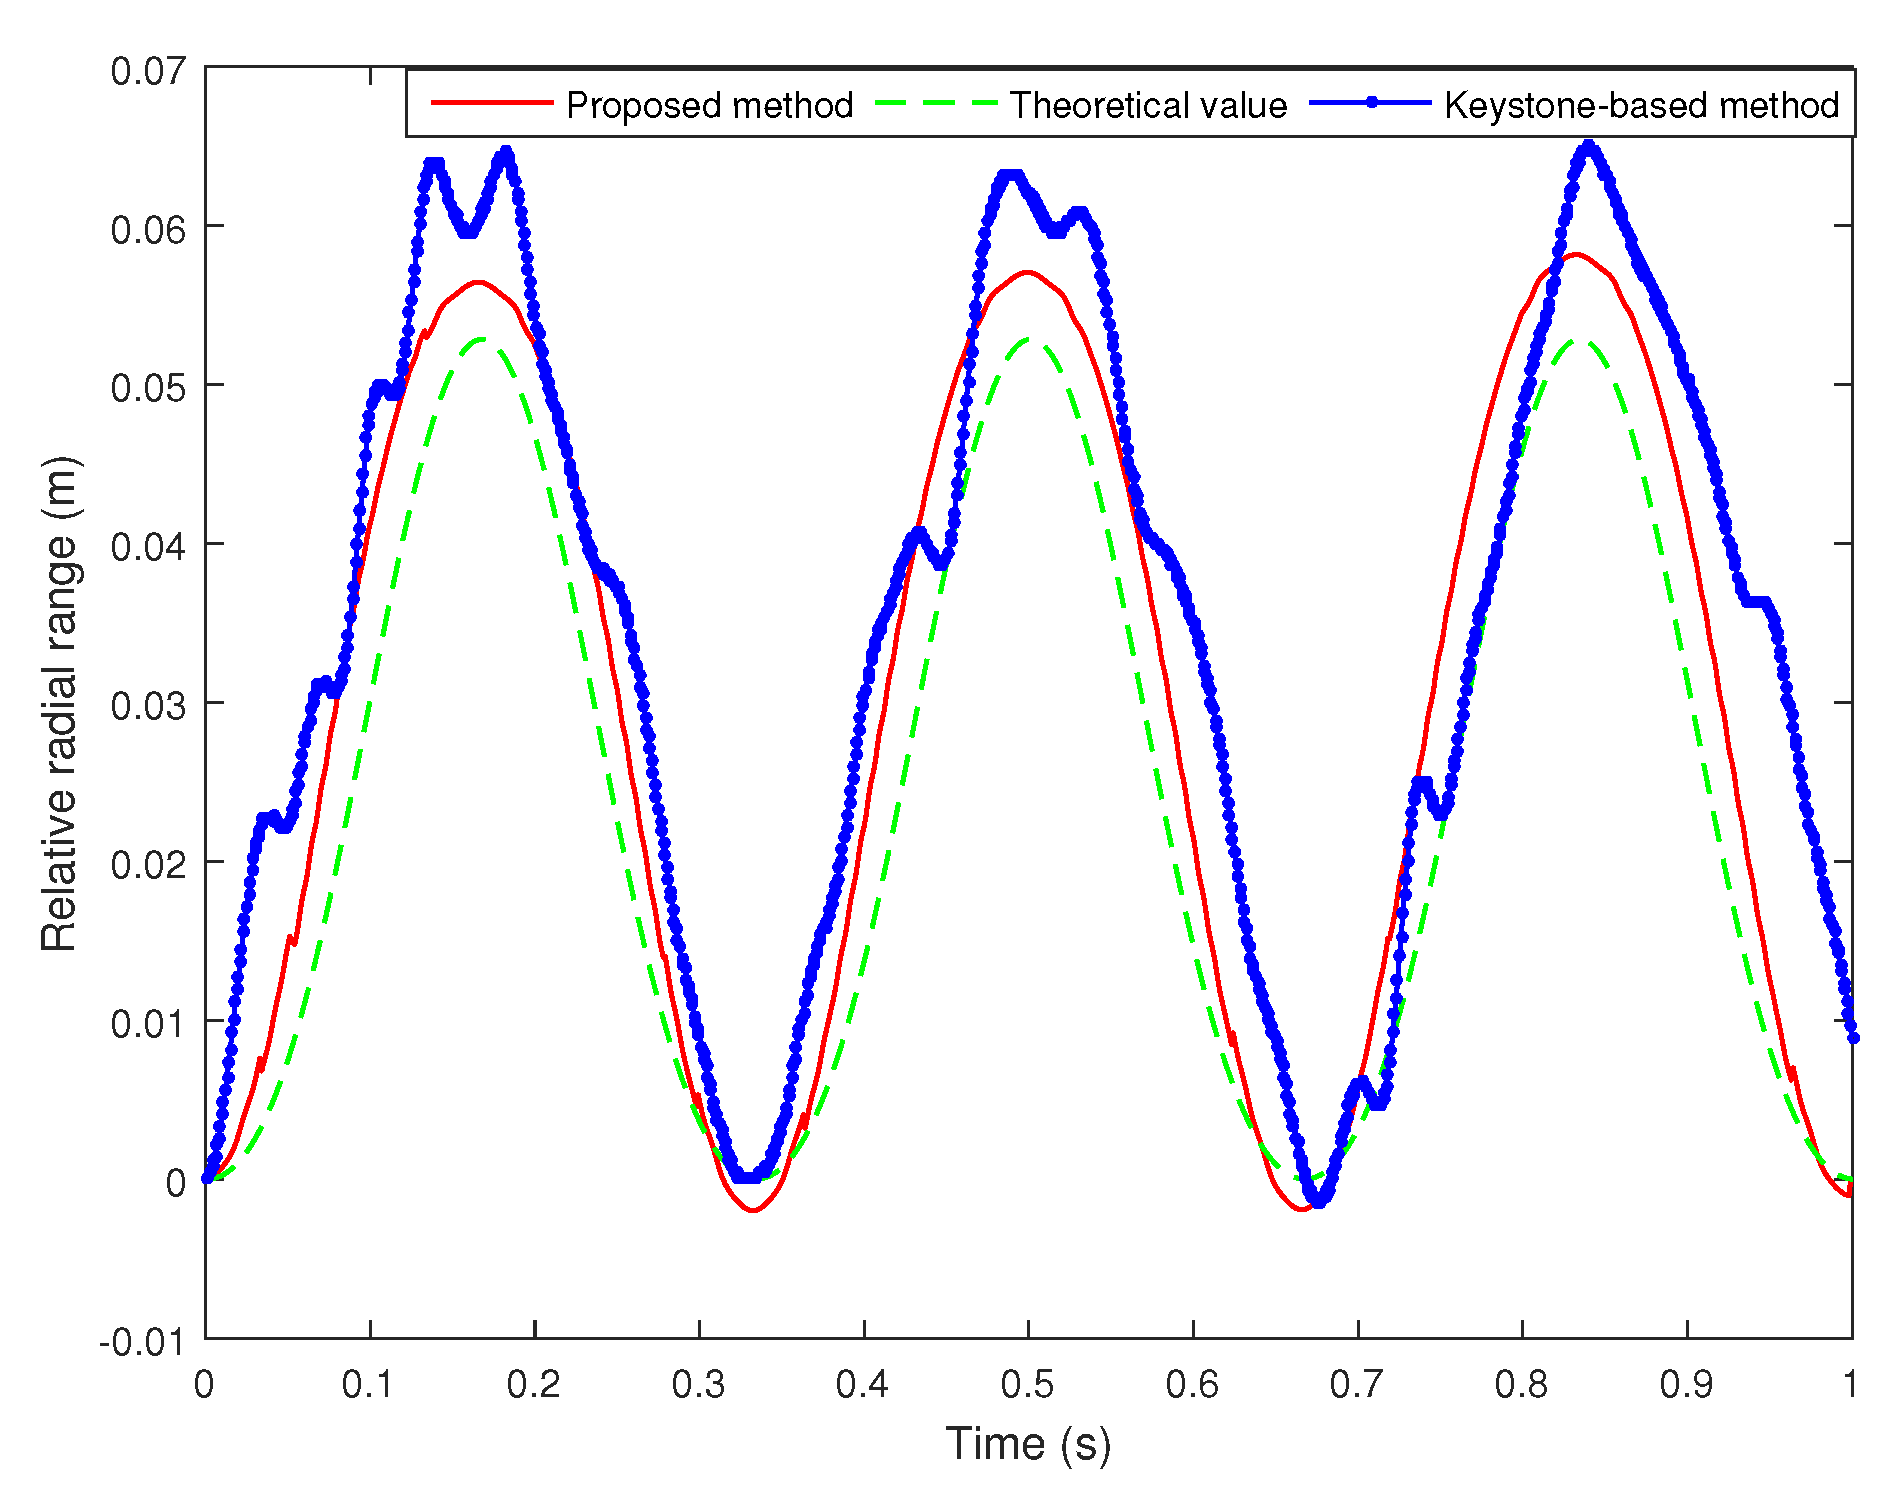
The comparison between the proposed method and the Keystone-based method is shown in Figure 8. It can be seen that the proposed algorithm is better than the keystone-based method. The main reason is that the approximate fitting is required to fit the high-order micro-Doppler model when using the keystone-based algorithm.
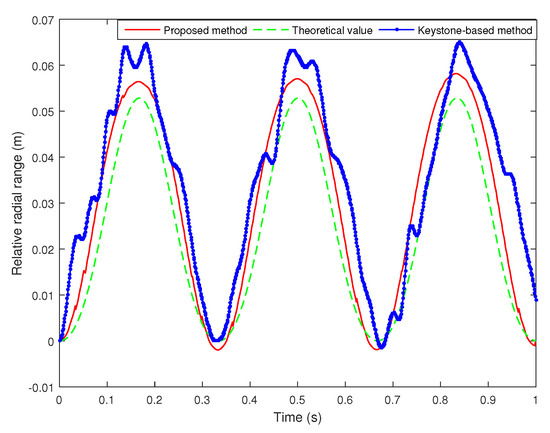
Figure 8.
Comparison of micro-Doppler curve extraction between HO-MF-TBD method and keystone method.
To further evaluate the performance of the proposed method, the RMSEs and the time cost comparisons among the proposed method, EKF method, dynamic programming TBD (DP-TBD) method, and the empirical mode decomposition (EMD) method under different SNRs are simulated. The RMSE is given by
where Y is the number of Monte Carlo trials, and represent the actual target position and the corresponding estimated position at time m in the Monte Carlo trial. denotes the Euclidean distance between and . The time cost is evaluated by the time running each of the four algorithms on the same computer. Only the time for envelope extraction is calculated.
In this experiment, the four algorithms mentioned above work in a unified radar system. The warhead parameters and the radar parameters are shown in Table 2. The SNRs are set as −15 to 10 dB, with 5 dB step lengths, and 100 Monte Carlo simulations are performed for each SNR. Only the envelope extraction are using different algorithms, while other steps are kept the same. The simulation results of RMSEs and time cost are shown in Table 3 and Table 4, respectively. Note that the time cost listed in Table 4 may be affected by CPU memory occupation. However, it can generally reflect the complexity of an algorithm.
Table 3.
Comparison of the RMSEs () (m) among the proposed method, the EKF method, the traditional DP-TBD method, and the EMD method with different SNR conditions.
Table 4.
Comparison of the time cost (s) among the proposed method, the EKF method, the traditional DP-TBD method, and the EMD method with different SNR conditions.
From the wavelength calculation formula, the wavelength can calculated as m. Table 3 illustrates that the RMSE of the proposed method, the EKF method, the traditional DP-TBD method, and the EMD method almost reach the sub-wavelength level accuracy using the phase-derived range method. Generally, the RMSE of the proposed algorithm is better than the EKF method, the traditional DP-TBD method, and the EMD method under low SNR conditions. The main reason is that according to the motion law, the envelope of the current frame is usually distributed near the envelope of the previous frame. Therefore, the error caused by noise can be eliminated by limiting the range of dynamic programming.
The EKF method takes the least time, while it has the worst RMSE performance. This is because of the influence of truncation error and the unknown noise covariance under low SNR conditions.
The RMSEs of the traditional DP-TBD method are similar to the proposed method, but among the four comparison algorithms, the traditional DP-TBD algorithm takes the longest time because the implementation process requires dynamic programming. Therefore, the classical DP-TBD algorithm needs to be optimized to meet the high real-time requirements of an anti-missile system.
In addition, the EMD method can decompose the non-stationary signal into a series of inherent modal functions, which can be used to reconstruct the non-stationary signal to form envelope correlation for envelope extraction [34]. However, it heavily depends on the extreme points of non-stationary signals. Therefore, as Table 3 shows, the performance of the EMD method becomes poor under low SNR conditions.
6. Conclusions
In this paper, an improved phase-derived range method based on high-order multi-frame TBD is proposed to conquer the difficulties in distinguishing the warheads from decoys. Specifically, the micro-Doppler range sequence is regarded as a state, and the HO-MF-TBD is used to obtain the envelope. In addition, a new phase unwrapping method is proposed to improve the accuracy of micro-Doppler curves extraction. This method reduces the computational complexity by limiting the scope of dynamic programming. The proposed method can estimate the micro-Doppler curves with high accuracy at a sub-wavelength level even when the SNR is lower than dB. Extensive simulation results validate the anti-noise performance of the proposed method. The directions of future research could be in distinguishing the electronic false targets.
Author Contributions
Conceptualization, N.Z.; methodology, N.Z. and S.X.; software, N.Z.; validation, N.Z. and X.F.; investigation, N.Z. and S.X.; data curation, N.Z. and S.X.; writing—original draft preparation, N.Z. and W.W.; writing—review and editing C.L., J.H., S.X. and Z.C.; supervision, S.X. and Z.C. All authors contributed to writing the final manuscript. All authors have read and agreed to the published version of the manuscript.
Funding
This research received no external funding.
Institutional Review Board Statement
Not applicable.
Informed Consent Statement
Not applicable.
Data Availability Statement
Not applicable.
Acknowledgments
The authors would like to thank Lei Zhang, Xueqing Fang, Guanghui Wu, and Xiping Sun for their valuable suggestions and technical support. This work is supported by the Science, Technology and Innovation Commission of Shenzhen Municipality (grant no. JCYJ20210324120002007) and Shenzhen Science and Technology Program (grant no. KQTD20190929172704911).
Conflicts of Interest
The authors declare no conflict of interest.
References
- Chen, V.C.; Li, F.; Ho, S.S.; Wechsler, H. Micro-Doppler effect in radar: Phenomenon, model, and simulation study. IEEE Trans. Aerosp. Electron. Syst. 2006, 42, 2–21. [Google Scholar] [CrossRef]
- Wang, Y.Z.; Feng, C.Q.; Hu, X.W.; Zhang, Y.S. Classification of Space Micromotion Targets With Similar Shapes at Low SNR. IEEE Geosci. Remote Sens. Lett. 2021, 1–5. [Google Scholar] [CrossRef]
- Choi, I.O.; Park, S.H.; Kang, K.B.; Lee, S.H.; Kim, K.T. Efficient parameter estimation for cone-shaped target based on distributed radar networks. IEEE Sens. J. 2019, 19, 9736–9747. [Google Scholar] [CrossRef]
- Chen, J.; Xu, S.Y.; Chen, Z.P. Convolutional neural network for classifying space target of the same shape by using RCS time series. IET Radar Sonar Navig. 2018, 12, 1268–1275. [Google Scholar] [CrossRef]
- Zhang, Y.P.; Zhang, Q.; Kang, L.; Zhang, L. End-to-End Recognition of Similar Space Cone-Cylinder Targets Based on Complex-Valued Coordinate Attention Networks. IEEE Trans. Geosci. Remote Sens. 2021, 1–14. [Google Scholar] [CrossRef]
- Zhao, M.; Zhang, Q.; Luo, Y.; Sun, L. Micromotion feature extraction and distinguishing of space group targets. IEEE Geosci. Remote Sens. Lett. 2017, 14, 174–178. [Google Scholar] [CrossRef]
- Zhu, N.N.; Hu, J.; Xu, S.Y.; Wu, W.Z.; Zhang, Y.F.; Chen, Z.P. Micro-Motion Parameter Extraction for Ballistic Missile with Wideband Radar Using Improved Ensemble EMD Method. Remote Sens. 2021, 13, 3545. [Google Scholar] [CrossRef]
- Shi, Y.C.; Jiu, B.; Liu, H.W. Optimization-Based Discontinuous Observation Strategy for Micro-Doppler Signature Extraction of Space Cone Targets. IEEE Access 2019, 7, 58915–58929. [Google Scholar] [CrossRef]
- Delisle, G.Y.; Zebbani, Z.; Charrier, C.; Cote, F. A novel approach to complex target recognition using RCS wavelet decomposition. IEEE Antennas Propag. Mag. 2005, 47, 35–55. [Google Scholar] [CrossRef]
- Wang, T.; Bi, W.; Zhao, Y.; Xue, W. Target recognition algorithm based on RCS observation sequence—Set-valued identification method. In Proceedings of the 33rd Chinese Control Conference, Nanjing, China, 28–30 July 2014. [Google Scholar]
- Xiong, X.; Liu, H.; Deng, Z.M.; Fu, M.; Qi, W.; Zhang, Y. Micro-Doppler Ambiguity Resolution with Variable Shrinkage Ratio Based on Time-Delayed Cross Correlation Processing for Wideband Radar. IEEE Trans. Geosci. Remote Sens. 2019, 57, 1906–1917. [Google Scholar] [CrossRef]
- Zhang, L.; Xing, M.; Qiu, C.; Bao, Z. Two-Dimensional Spectrum Matched Filter Banks for High-Speed Spinning-Target Three-Dimensional ISAR Imaging. IEEE Trans. Geosci. Remote Sens. 2009, 6, 368–372. [Google Scholar] [CrossRef]
- He, X.Y.; Tong, N.N.; Hu, X.W. High-Resolution Imaging and 3-D Reconstruction of Precession Targets by Exploiting Sparse Apertures. IEEE Trans. Aerosp. Electron. Syst. 2017, 53, 1212–1220. [Google Scholar] [CrossRef]
- Wang, T.; Wang, X.S.; Chang, Y.L.; Liu, J.; Xiao, S.P. Estimation of Precession Parameters and Generation of ISAR Images of Ballistic Missile Targets. IEEE Trans. Aerosp. Electron. Syst. 2010, 46, 1983–1995. [Google Scholar] [CrossRef]
- Persico, A.R.; Clemente, C.; Gaglione, D.; Ilioudis, C.V. On Model, Algorithms, and Experiment for Micro-Doppler-Based Recognition of Ballistic Targets. IEEE Trans. Aerosp. Electron. Syst. 2017, 53, 1088–1108. [Google Scholar] [CrossRef] [Green Version]
- Guo, K.Y.; Li, Q.; Sheng, Q. A Precise Recognition Method of Missile Warhead and Decoy in Multi-Target Scene. J. Electromagn. Wave Appl. 2012, 24, 641–652. [Google Scholar] [CrossRef]
- Yi, W.; Fang, Z.C.; Li, W.J.; Hoseinnezhad, R.; Kong, L.J. Multi-Frame Track-Before-Detect Algorithm for Maneuvering Target Tracking. IEEE Trans. Veh. Technol. 2020, 69, 4104–4118. [Google Scholar] [CrossRef]
- Hong, L.; Wang, X.; Liu, S. Micro-Doppler curves extraction based on high-order particle filter track-before detect. IEEE Geosci. Remote Sens. Lett. 2019, 16, 1550–1554. [Google Scholar] [CrossRef]
- Bai, X.; Bao, Z. Imaging of rotation-symmetric space targets based on electromagnetic modeling. IEEE Trans. Aerosp. Electron. Syst. 2014, 50, 1680–1689. [Google Scholar]
- Wei, J.Q.; Zhang, L.; Liu, H.W.; Zhou, Y.J. Micro-motion and gemetric parameters estimation of wide-band radar cone-shaped targets based on phase-derived range. J. Electr. Inf. Technol. 2018, 40, 2227–2234. [Google Scholar]
- Ren, K.; Du, L.; Lu, X.F.; Zhuo, Z.Y.; Li, L. Instantaneous Frequency Estimation Based on Modified Kalman Filter for Cone-Shaped Target. Remote Sens. 2020, 12, 2766. [Google Scholar] [CrossRef]
- Zhuo, Z.Y.; Zhou, Y.; Du, L.; Ren, K.; Li, Y. A Noise Robust Micro-Range Estimation Method for Precession Cone-Shaped Targets. Remote Sens. 2021, 13, 1820. [Google Scholar] [CrossRef]
- Zeng, C.; Li, D.; Luo, X.; Song, D.W.; Liu, H.Q.; Su, J. Ground Maneuvering Targets Imaging for Synthetic Aperture Radar Based on Second-Order Keystone Transform and High-Order Motion Parameter Estimation. IEEE J. Sel. Top. Appl. Earth Obs. Remote Sens. 2019, 12, 4486–4501. [Google Scholar] [CrossRef]
- Bellantoni, J.F.; Dodge, K.W. A square root formulation of the Kalman-Schmidt filter. AIAA J. 1967, 5, 1309–1314. [Google Scholar] [CrossRef]
- Zhou, G.; Wang, L. Pseudo-spectrum based speed square filter for track-before-detect in range-doppler domain. IEEE Trans. Signal Process. 2019, 67, 5596–5610. [Google Scholar] [CrossRef]
- Vo, B.N.; Vo, B.T.; Pham, N.T.; Suter, D. Joint detection and estimation of multiple objects from image observations. IEEE Trans. Signal Process. 2010, 58, 5129–5141. [Google Scholar] [CrossRef]
- Hoseinnezhad, R.; Vo, B.N.; Vo, B.T. Visual tracking in background subtracted image sequences via multi-bernoulli filtering. IEEE Trans. Signal Process. 2013, 61, 392–397. [Google Scholar] [CrossRef]
- Yi, W.; Fu, L.; García-Fernández, A.F.; Xu, L.; Kong, L. Particle filtering based track-before-detect method for passive array sonar systems. Signal Process. 2019, 165, 303–314. [Google Scholar] [CrossRef]
- Davey, S.J. Efficient histogram PMHT via single target chip processing. IEEE Signal Process. Lett. 2015, 22, 569–572. [Google Scholar] [CrossRef]
- Orlando, D.; Venturino, L.; Lops, M.; Ricci, G. Track-before-detect strategies for STAP radars. IEEE Trans. Signal Process. 2010, 58, 933–938. [Google Scholar] [CrossRef]
- Moyer, L.R.; Spak, J.; Lamanna, P. A multi-dimensional Hough transform-based track-before-detect technique for detecting weak targets in strong clutter backgrounds. IEEE Trans. Aerosp. Electron. Syst. 2011, 47, 3062–3068. [Google Scholar] [CrossRef]
- Ciuonzo, D.; Willett, P.K.; Bar-Shalom, Y. Tracking the tracker from its passive sonar ML-PDA estimates. IEEE Trans. Aerosp. Electron. Syst. 2014, 50, 573–590. [Google Scholar] [CrossRef] [Green Version]
- Thayaparan, T.; Abrol, S.; Riseborough, E.; Stankovic, L.; Lamothe, D.; Duff, G. Analysis of radar micro-Doppler signatures from experimental helicopter and human data. IET Radar Sonar Navig. 2007, 1, 289–299. [Google Scholar] [CrossRef] [Green Version]
- Huang, N.E.; Shen, Z.; Long, S.R.; Wu, M.C.; Shih, H.H.; Zheng, Q.; Yen, N.-C.; Tung, C.C.; Liu, H.H. The empirical mode decomposition and the Hilbert spectrum for nonlinear and non-stationary time series analysis. Math. Phys. Eng. Sci. 1988, 454, 903–995. [Google Scholar] [CrossRef]

Publisher’s Note: MDPI stays neutral with regard to jurisdictional claims in published maps and institutional affiliations. |
© 2021 by the authors. Licensee MDPI, Basel, Switzerland. This article is an open access article distributed under the terms and conditions of the Creative Commons Attribution (CC BY) license (https://creativecommons.org/licenses/by/4.0/).