Article

Feasibility of Using Small UAVs to Derive Morphometric Measurements of Australian Snubfin (Orcaella heinsohni) and Humpback (Sousa sahulensis) Dolphins

by
Anna I. Christie
1,*,
Andrew P. Colefax
2 and
Daniele Cagnazzi
1
1
Faculty of Science and Engineering, Southern Cross University, P.O. Box 157, Lismore, NSW 2480, Australia
2
Sci-Eye, P.O. Box 4202, Lismore, NSW 2480, Australia
*
Author to whom correspondence should be addressed.
Remote Sens. 2022, 14(1), 21; https://doi.org/10.3390/rs14010021
Submission received: 4 November 2021 / Revised: 15 December 2021 / Accepted: 17 December 2021 / Published: 22 December 2021
(This article belongs to the Special Issue Remote Sensing Applications in Marine Mammal Research)

Abstract

:
Analysis of animal morphometrics can provide vital information regarding population dynamics, structure, and body condition of cetaceans. Unmanned aerial vehicles (UAVs) have become the primary tool to collect morphometric measurements on whales, whereas on free ranging small dolphins, have not yet been applied. This study assesses the feasibility of obtaining reliable body morphometrics from Australian snubfin (Orcaella heinsohni) and humpback dolphins (Sousa sahulensis) using images collected from UAVs. Specifically, using a dolphin replica of known size, we tested the effect of the altitude of the UAV and the position of the animal within the image frame on the accuracy of length estimates. Using linear mixed models, we further assessed the precision of the total length estimates of humpback and snubfin dolphins. The precision of length estimates on the replica increased by ~2% when images were sampled at 45–60 m compared with 15–30 m. However, the precision of total length estimates on dolphins was significantly influenced only by the degree of arch and edge certainty. Overall, we obtained total length estimates with a precision of ~3% and consistent with published data. This study demonstrates the reliability of using UAV based images to obtain morphometrics of small dolphin species, such as snubfin and humpback dolphins.

1. Introduction

Anthropogenic disturbances can impair an animal’s ability to store energy reserves necessary for survival or reproduction. This may induce changes to the health and fitness of individuals and ultimately influence the long-term population viability [1,2]. In marine mammals, nutritive conditions have been used as proxies to assess individual and population health status, with variation in nutritive conditions reflecting changes in foraging success and ultimately affecting the animal’s fitness [3,4,5].
Morphometric sampling is an established method to assess nutritive state and has been used in cetaceans to estimate foraging success, fitness and health, and provide vital information on the animal’s life history [1,6]. Traditionally, morphometric data on cetaceans have been primarily collected through direct measurements of dead specimens from whaling [7,8], bycatch [9], and strandings [10,11,12] or live individuals in captivity [13,14] or more rarely collected for capture-release studies [15]. These approaches have provided important morphological information for taxonomic revisions, whereas, except for few species [8,11,16], the sample size is too small for demographic studies at population or species level [2,17].
In recent years, photogrammetry has become a primary noninvasive method for obtaining morphometric data on wild cetacean populations [1,6,18,19]. Photogrammetry has been applied on photographs collected from vessels, aircraft (helicopters and aeroplanes) and more recently from UAVs (unmanned aerial vehicles). Morphometric studies from vessels rely primarily on laser photogrammetry, which allows estimates of length for only the visible part of a dolphin, typically the blowhole to dorsal fin distance, from which the total length of the individual is estimated [20,21,22,23]. The use of crewed aircraft has further provided opportunities for photogrammetry, where the aerial imagery can capture the entire body of marine mammals from which various morphometric parameters can be derived, including body condition indices. [24,25]. The majority of published studies from crewed aircraft have been conducted on mysticetes, such as North Atlantic right whale (Eubalaena glacialis), Southern right whale (Eubalaena australis) [26], gray whale (Eschrichtius robustus) [25], fin whale (Balaenoptera physalus) [27] and large odontocetes, such as orca (Orcinus orca) [24,28] and beluga whale (Delphinapterus leucas) [29]. However, despite the historical utility, crewed aircraft lacks the ability to approach and follow small, highly mobile cetaceans at low altitudes, which often results in poor image quality that may not be appropriate to derive morphometric estimates [24,28,29,30]. Additionally, the use of crewed aircraft is expensive, potentially dangerous, and requires access to large infrastructures, such as aerodromes [28,31].
The introduction of UAVs has overcome many of the shortcomings of using crewed aircraft for morphometric studies. UAVs have allowed the collection of high-quality imagery of cetaceans at lower altitudes than crewed aircraft and can subsequently estimate morphometric measurements with greater reliability [32]. Nevertheless, UAV-based morphometric studies remain biased toward large species, especially mysticetes such as blue whales (Balaenoptera musculus) [19,33,34], humpback whales (Megaptera novaeangliae) [33,35], southern right whales [36,37], gray whales [19], Omura’s whales (Balaenoptera omurai) [38], and minke whales (Balaenoptera acutorostrata) [33]. On such large marine mammal species, UAV imagery has been further used to investigate the energy cost of reproduction of female humpback whales [35].
A limited number of UAV-based morphometric studies have been focused on medium to large sized odontocetes, including orcas [24,28,39], short-finned pilot whales (Globicephala macrorhynchus), long-finned pilot whales (Globicephala melas), [40,41], beluga whales [29] and Blainville’s beaked whales (Mesoplodon densirostris) [42]. A lesser number of studies have been conducted on marine mammals of small to medium size, such as pinnipeds, leopard seals (Hydrurga leptonyx) [43,44,45], fur seals (Arctocephalus sp.) [44,46], Southern elephant seals (Mirounga leonina) [44,47] Northern elephant seals (Mirounga angustirostris) [48] Crabeater seal (Lobodon carcinophagus), Weddell seal (Leptonychotes weddelli) [44] and Australian sea lions (Neophoca cinerea) [1]. Small odontocetes species (less than 4 m in length), such as dolphins, have been rarely the focus of UAV based photogrammetry studies [49]. As a result, there is a lack of reliable morphometric data from wild dolphin populations, especially for vulnerable species, such as Australian snubfin dolphin (Orcaella heinsohni) and Australian humpback dolphin (Sousa sahulensis).
Australian snubfin and humpback dolphins (hereafter referred to as snubfin and humpback dolphins) are small inshore species found primarily in tropical and sub-tropical northern Australia [50]. Snubfin dolphins reach 2.7 m in length and 133 kg in weight for males, and 2.3 m in length and 114 kg for females [51,52]. Humpback dolphins reach 2.8 m in length and 280 kg in weight [53,54] with males (mean length = 2.37 m ± 0.018 m) slightly larger than females (mean length = 2.31 ± 0.01695 m) [53]. Both species are classified as Vulnerable under the IUCN Red List and within the Queensland Nature Conservation Act 1992 [55,56]. Australian snubfin and humpback dolphins live in low population densities, primarily in murky coastal waters, and are typically characterised by displaying shy and erratic behaviour. These characteristics make them difficult to follow in the wild and to approach for photo-identification studies. The ability of UAVs to fly close to the ocean surface and follow small, highly mobile animals provides a unique opportunity to collect morphometric data for these elusive species. Furthermore, morphometric data, sampled from a large proportion of the populations is useful for effectively managing the health of these vulnerable species [1,57,58].
The aim of this study is to assess the feasibility of obtaining reliable body morphometric measurements of snubfin and humpback dolphins from aerial images recorded using UAVs. This study focused on snubfin and humpback dolphins in the Fitzroy River Catchment, Queensland, where both species have been studied for over ten years [59,60]. Specifically, we tested the reliability of deriving UAV-based length estimates on a dolphin replica, and further assessed the effect of the UAV’s altitude and the location of the replica within the image frame on the reliability of length estimates. We further assessed the level of precision of obtaining total length estimates of both dolphin species and tested whether the predicted precision was influenced by various factors, including the UAV’s altitude, the dolphin’s location in the image frame, as well as body characteristics. Finally, we describe the length distributions and discuss the utility of using UAVs to obtain morphometric measurements on such dolphin species.

2. Methods

2.1. Assessing the Accuracy and Precision of Morphometric Measurements Using a Dolphin Replica

A dolphin replica was used to test the effect of the UAV (DJI Phantom 4 Pro) altitude and the location of the dolphin replica within the image frame on the accuracy and precision of length estimates. The dolphin replica was made from foam and pool noodles to float on the water’s surface, resembling a ‘best case’ dolphin position for photogrammetry. The replica had a total length of 1.95 m, similar to a snubfin or humpback dolphin. The effects of UAV altitude on the reliability of measurements was tested by collecting multiple videos (4k UHD 3840 × 2160 pixel resolution) of the dolphin replica at altitudes of 15 m, 30 m, 45 m and 60 m. Fifteen meters was the minimum approaching distance to the dolphins allowed under the research permit, while 60 m was considered an appropriate altitude for maximising search width while maintaining reasonable detection rates [61,62], so it was considered an appropriate upper limit for morphometric sampling. The effect of the position of the replica within the image frame was tested by dividing the image frame into nine sections of equal size (‘quadrats’). The quadrats were numbered one to nine, starting in the top left, moving clockwise across the rows and ending in the bottom right. The dolphin replica was then sampled in each of the nine quadrats at each altitude across three separate flights, totalling 120 still images sampled.
To obtain UAV-derived morphometric measurements, we extracted still images from the video recordings. The stock camera on the Phantom 4 Pro is a 20-megapixel camera with a field-of-view of 84°. From the still images, the number of linear pixels across the length of the target was measured using AragoJ [63]. Repeated measurements on the replica were used to develop a linear equation to convert pixels to meters [64,65]. A common alternative method for developing an equation to convert pixels to meters is through using the manufacturers’ specifications of the sensor [35,66]. While both methods are valid, we chose to formulate the equation from field-based data collection of the replica, which was of similar size to target dolphin species and was sampled at the range of altitudes we anticipated to be a realistic target in the field. We also verified this by cross-checking the result with that of an equation derived using sensor specifications.
The pixel-to-meter equation was derived following the procedures outlined in [64]. We used still images (from video) taken in the middle section of the image frame from each of the altitude treatments of 15, 30, 45 and 60 m, with the replica orinated facing from left to right across the frame. The number of linear pixels across the 1.95 m replica were converted to pixels m−1 value. The resulting height to pixels-per-metre relationship was that of a power equation [64]. We used linear mixed modelling in R [67] with the lme4 package [68] to determine a linear equation for a line of best fit, while accounting for the repeated samples we conducted within each flight. Due to the relationship of the data, a log-transformation was applied to the response and dependant variables to confirm the data to a linear relationship. Specifically, the resulting linear mixed-effects model took a standard form [68].
log ( y i j ) = β 0 + β a l t log ( a l t i j ) + U j + i j
with
U j ~ N ( 0 ,   σ U 2 )
i j ~ N ( 0 ,   σ 2 )
where y i j was the predicted pixels-per-meter in the image for the i th replicate sample within a UAV flight j . This was to account for the nested structure of the data of having replicates sampled within on of the three flights. β 0 was a fixed intercept, with β regression coefficient for the fixed effect of altitude. U j was the random effect of flight j . i j was the residual error for the i th replicate sample within flight j .
The output formula (intercept and coefficient) was then used to predict the length of a target (i.e., a dolphin) in an image through inputting the number of linear pixels across the image (pixel length) and the calculated altitude of the UAV above the target. This equation was:
l e n g t h = p i x e 8.0701   × a l t 1.0315
where length was the estimated length (m), pix was the number of pixels across the object within the image, e was a mathematical constant (2.71828…), and alt was the overall height of the UAV above the water (including the takeoff height above the water) in meters.
The above equation was applied to all pixel measurements of the replica to establish if altitude and quadrat influenced the reliability (accuracy and precision) of the length estimates. For the analysis, the quadrats were combined to form three overarching positions: centre of the frame (quadrat 5), edges of the frame (quadrats 2, 4, 6, 8), and corners of the frame (quadrats 1, 3, 7, 9).
To test the reliability of estimating the length of the dolphin replica, the model held a similar form to the above for length. However, the dependent variable ( y i j ) was the absolute percentage difference between the estimated length and the true length of the replica (1.95 m). This is similar to the Levene’s test, but instead of using the median or mean of a group of samples, the actual size of the replica was known, and the test was presented in the form of a linear mixed-effects regression model. This model took the form:
y i j = β 0 + β a l t X i j a l t + β q u a d r a t X i j q u a d r a t + U j + i j
with
U j ~ N ( 0 ,   σ U 2 )
i j ~ N ( 0 ,   σ 2 )
where y i j was the absolute percentage error of the predicted length away from the true length (1.95 m) of the dolphin replica for the i th replicate sample within the flight number of the UAV j . This structure was to account for the nested nature of sampling from having mulitple samples taken within a flight of the UAV. β 0 was a fixed intercept, with β regression coefficients for each of the fixed effects of altitude (m) and quadrat. U j was the random effect of flight j . i j was the residual error for the i th replicate sample within flight j .
For all linear mixed-effects models, we used model selection which involved comparing all models comprising all possible combinations of independent variables. The most parsimonious model was determined using Akaike Information Criterion (AICc) and by further examining the model fit and influence of each parameter when the difference between AICc was small [69,70] Models were assessed for model fit and met assumptions of homoscedasticity and linearity. Further sensitivity analyses were conducted using Cooks distance [71], with models rerun excluding the outliers to determine their level of influence in the main outputs. Analysis of Deviance tables using Type II Wald Chi-square tests from the ‘car’ package [72] were used to assess the significance of fixed-effect coefficients in the final model. Pairwise comparisons using Tukey Contrasts using ‘multcomp’ [73] were also used to examine within-factor groups for variables in each final model.

2.2. Collection and Processing of Morphometric Data from Live Dolphins

Surveys to collect morphometric data on wild snubfin and humpback dolphins were conducted from a small research vessel (5.5 m) in August and September 2020 in the Fitzroy River Catchment (491 km2) along the Queensland coast, Australia (Figure 1). The UAV (DJI Phantom 4 Pro) was launched from the bow of the vessel and flown at an altitude of ~50–60 m until the dolphin group was visually located on the telemetry screen of the UAV (DJI Crystalsky 7.85-inch ultrabright). Once located, the UAV was positioned perpendicular above the dolphin group before starting to record the video. Attempts were made to record videos of the group at altitudes of 60 m, 45 m, 30 m and 15 m (the same altitudes used for the replica). Multiple flights were conducted to record as many dolphins in the group as possible. The video captions function was enabled to allow easy extraction of altitude information from video/still images in post-processing. Data specific to each drone flight was documented, noting the start and finish time of each video taken within the flight and notes regarding the group size and composition (adult, juvenile and calf). For both species, adults were defined as individuals of 2–3 m in length often showing spotting and pigmentation loss on the dorsal fin and body extremities, juveniles were about two thirds the length of adults and of a uniform gray colour, and calves were less than half the length of adults, generally swimming close beside or slightly behind an adult [50,74,75]. This information was used to divide individuals into age classes during post-processing.
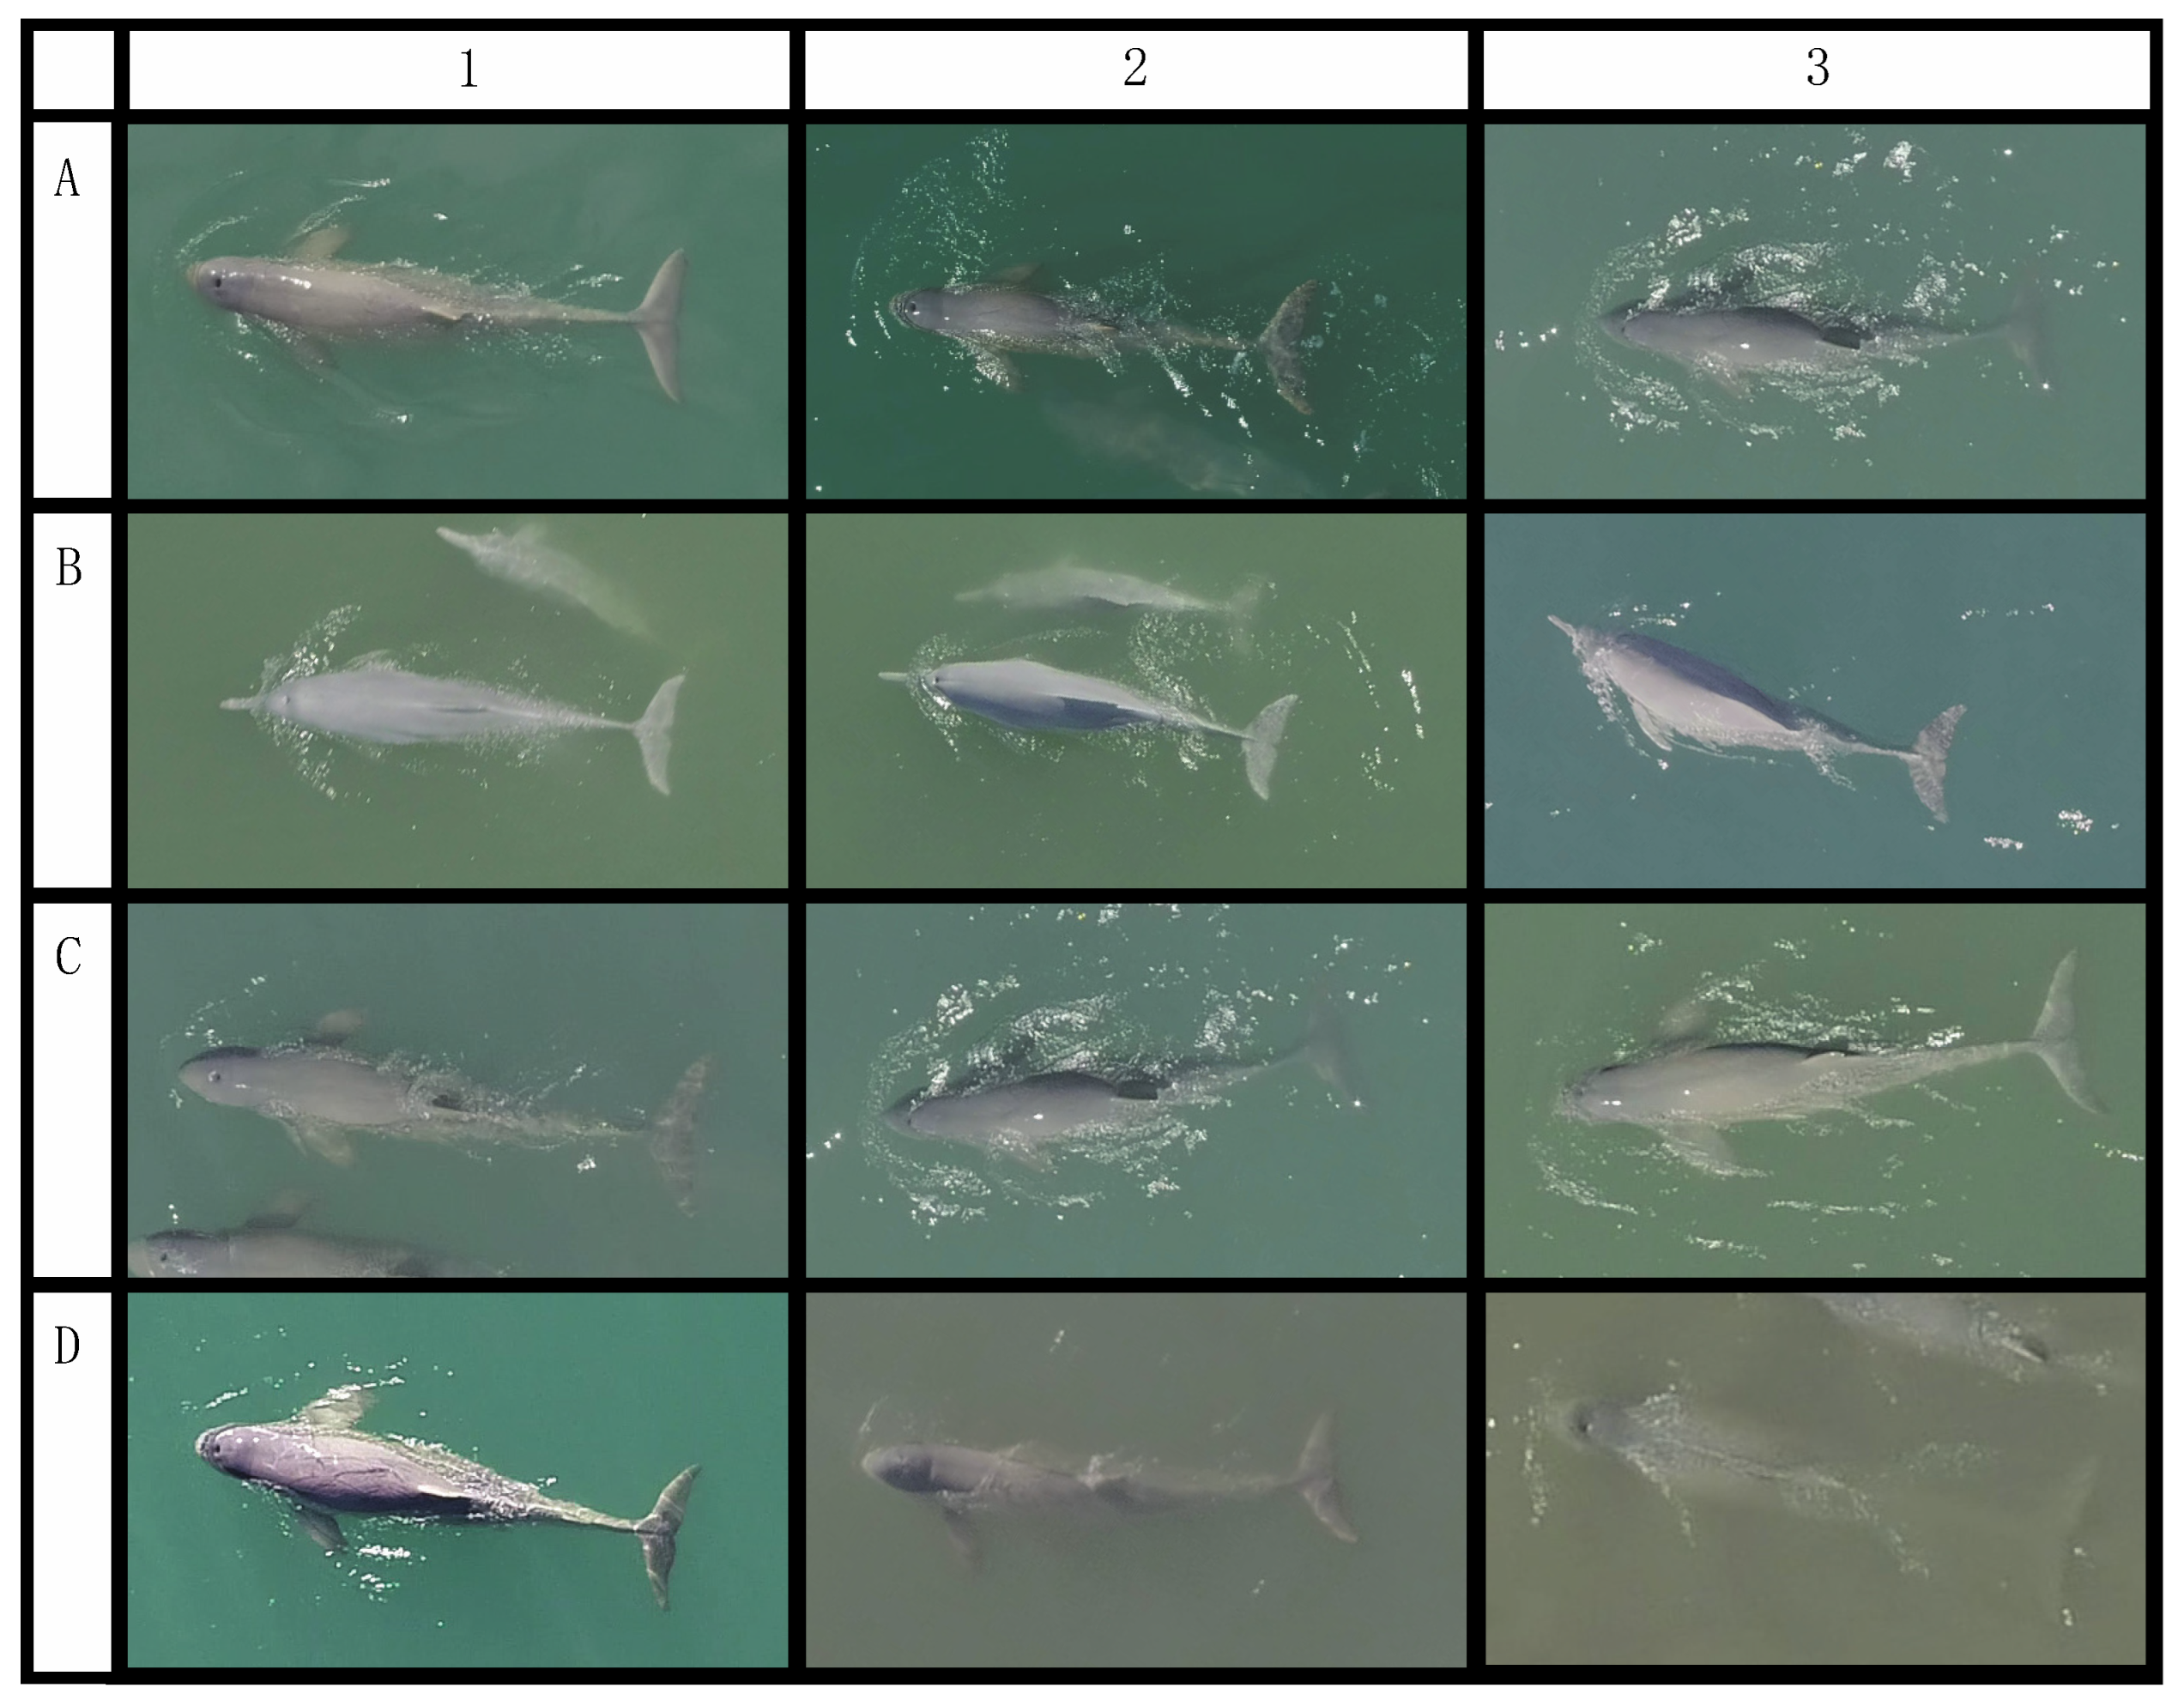
Each video was visually processed to extract still images of dolphins at the surface with the least degree of arch in the dolphin’s body position. When possible, multiple images of the same individual were extracted at different surfacing intervals. Within each group, dolphins were distinguished using distinctive scars and markings or following individuals underwater when the animal’s shallow depth and/or water clarity allowed. For each image, we considered two main variables that may affect the precision of morphometric estimates, the position of the dolphin’s body in the water (body position) and the clarity of the body margin against the background (edge certainty). The body position was assessed by grading three covariates: degree of arch (amount of flex of the body on the dorsal plane), degree of straightness (amount of flex of the body on the lateral plane), and body roll (amount of rotation of the body on the lateral plane) [37]. These covariates were scored from one to four according to predetermined criteria (Table 1, Figure 2). Images that resulted in a score of four for quality on any of the variables were excluded from the analysis. The position of the dolphin in the frame was also noted according to the procedure used with the replica.
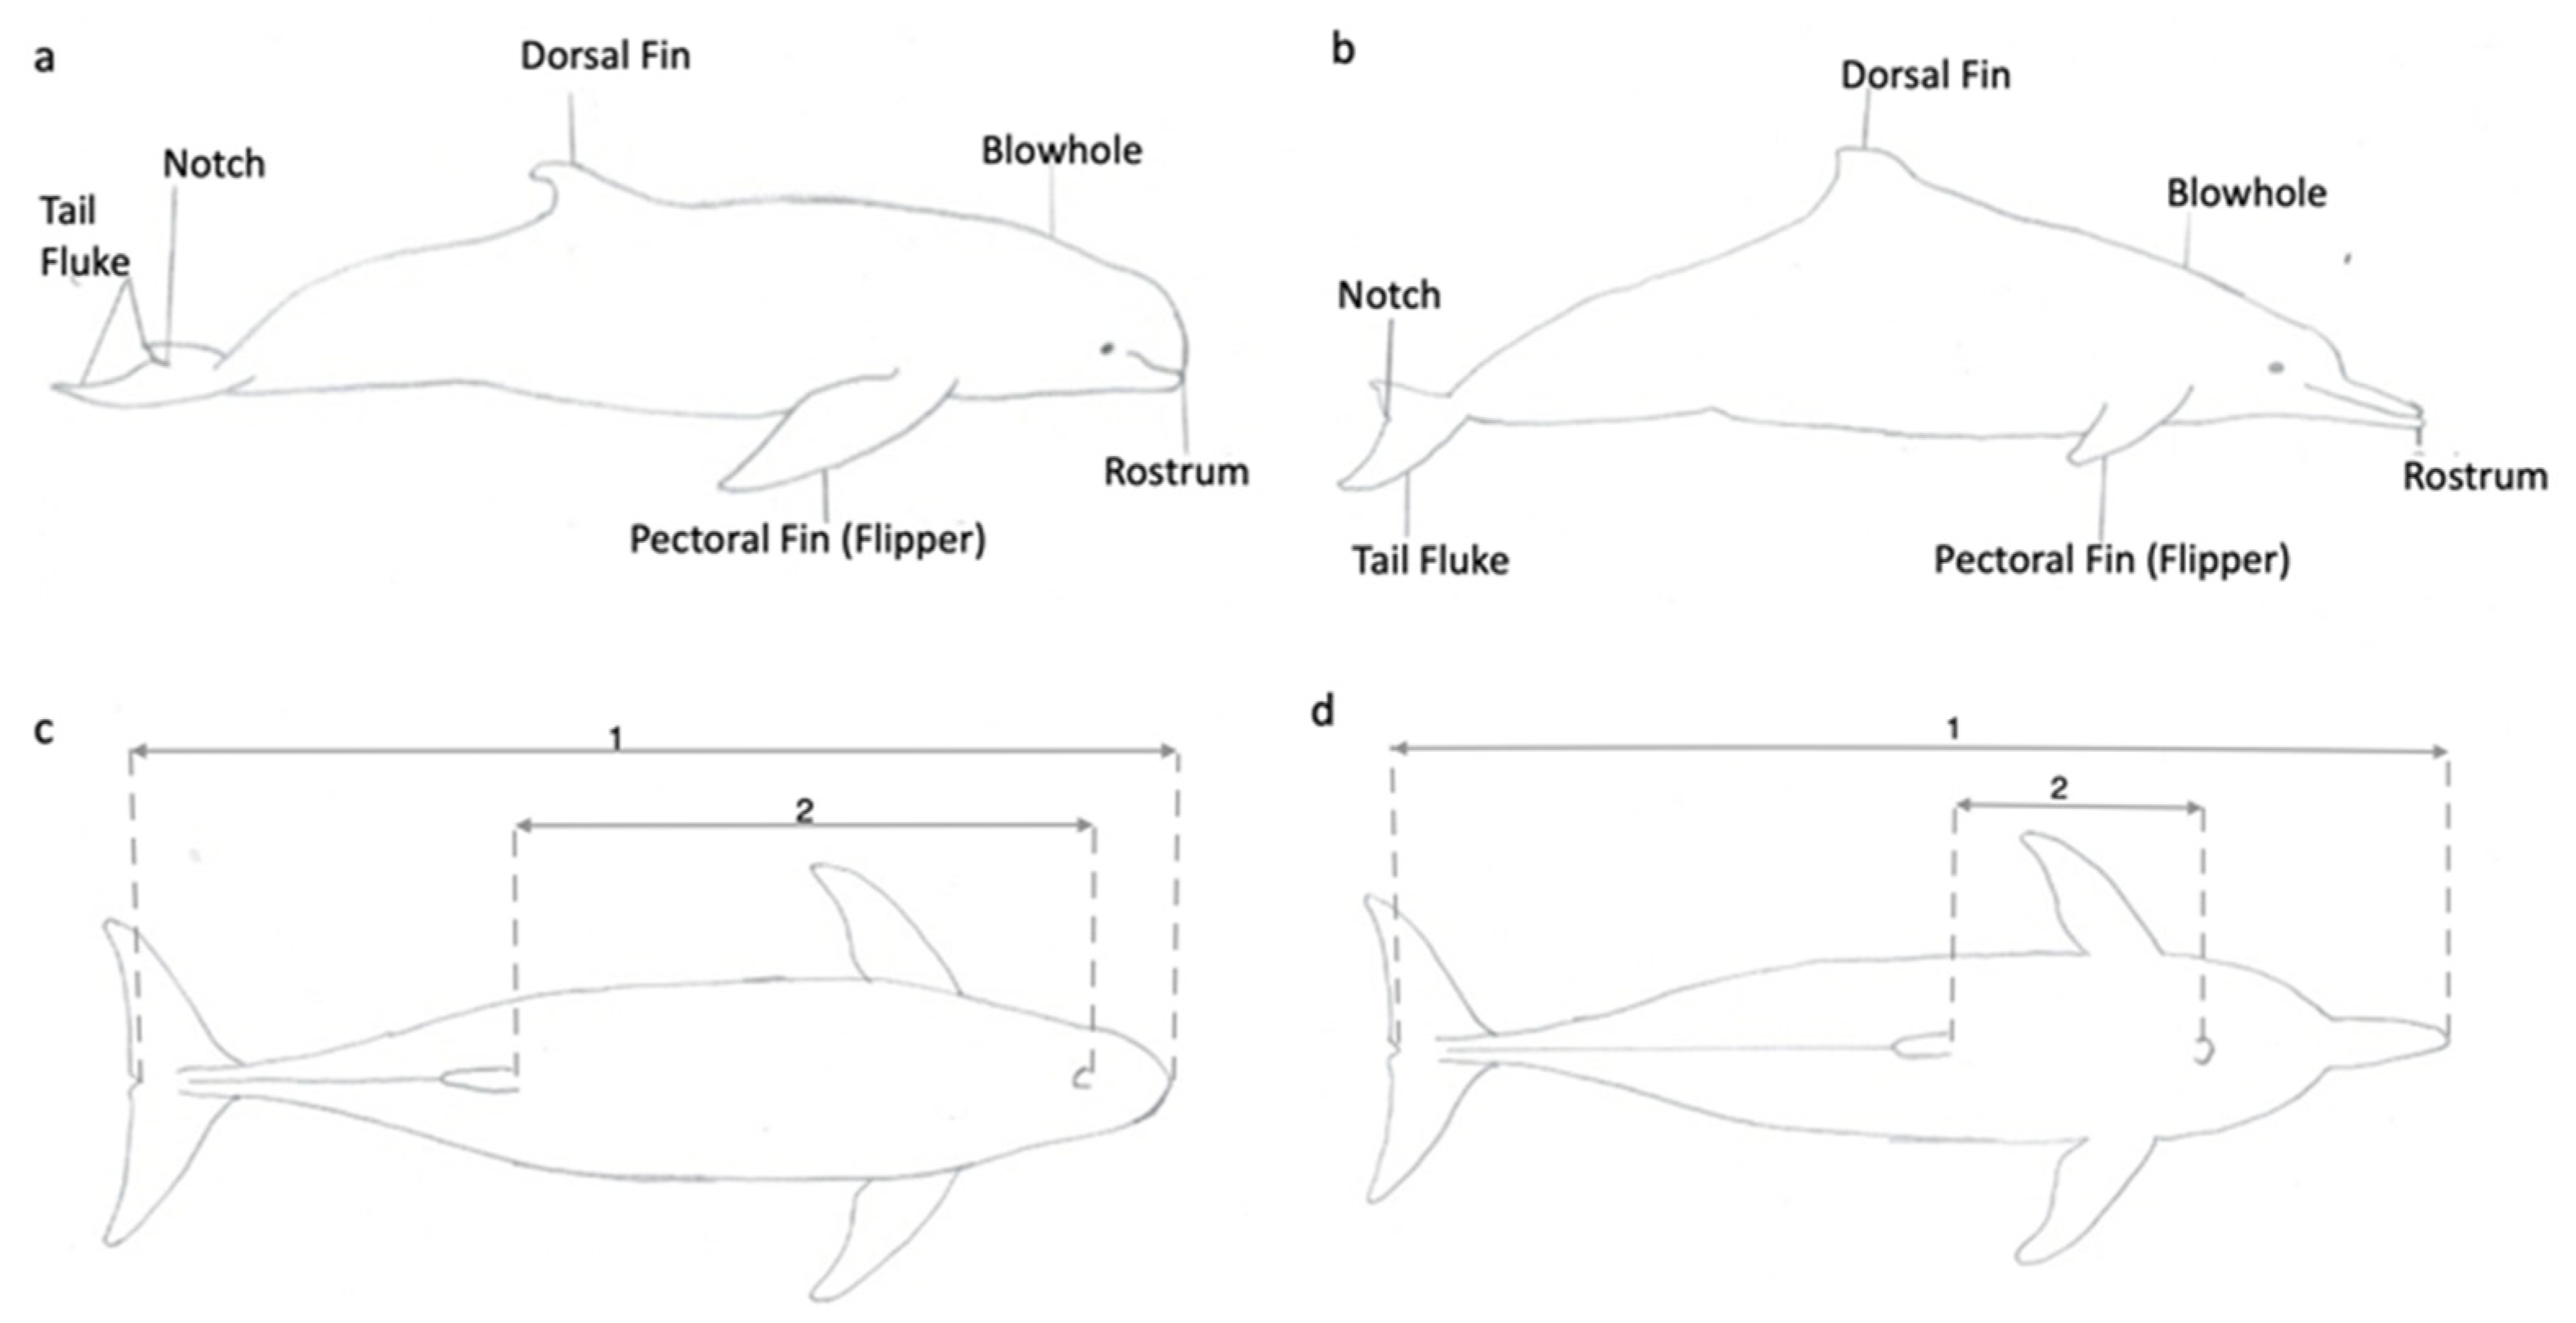
For each image, we measured the length in pixels for two morphometric parameters: (1) total body length from the rostrum to the notch in the fluke (TBL); and (2) length from the centre of the blowhole to the front of the dorsal fin (BHDF); (Figure 3). The number of pixels was calculated and subsequently converted to meters using the same methods adopted for the dolphin replica.

2.3. Reliability of Morphometric Measurements on Live Dolphins

Linear mixed-effects models were used to examine the level of precision in TBL estimates for snubfin and humpback dolphins (separately) by limiting analysis only to individual dolphins with repeated measures (191 photographs from 68 individuals for snubfin dolphins and 160 photographs from 41 individuals for humpback dolphins). The mean TBL for each individual was used as a reference point for which the absolute percentage deviation away from the mean TBL of all measures for all individuals was calculated. We then assessed whether the degree of precision error was statistically influenced by the altitude of the UAV, position of the dolphins within the frame, edge certainty, and the degree of arch, straightness, and body roll.
Due to the non-linear relationship of precision error with altitude, and that dolphins were generally sampled close to an ‘altitude treatment’, altitude was converted to a factor according to ~15, 20, 30, 40 and 50 m (<17.5 m, 17.5–25 m, 25–35 m, 35–45 m, >45 m). Altitudes of 60 m often resulted in unusable images due to coinciding with poor edge certainty. In the dataset of snubfin dolphin measures, only two cases scored a degree of straightness equal to three, and so were condensed to a binary factor of either straight (degree of straightness = 1) or having a degree of bend (degree of straightness = 2 and 3) (Table 1; Figure 2). Similarly, the dataset of humpback dolphin measures included only four cases of having a straightness score of three, so data was condensed to a binary factor of either ‘straight’ (degree of straightness = 1) or not (degree of straightness = 2 and 3) (Table 1; Figure 2). These models took the forms:
y i j = β 0 + β a l t X i p a l t + β q u a d r a t X i p q u a d r a t + β b e n d i n e s s X i p b e n d i n e s s + β s i d e b e n d X i p s i d e b e n d + β a s p e c t X i p a s p e c t + β e d g e c e r t a i n t y X i p e d g e c e r t a i n t y + U p + i p
with
U j ~ N ( 0 ,   σ U 2 )
i j ~ N ( 0 ,   σ 2 )
where y i j was the absolute percentage error of the predicted length away from the mean estimated length of the individual dolphin for the i th replicate sample within dolphin group p . β 0 was a fixed intercept, with β regression coefficients for each of the fixed effects of altitude (m), quadrats, degree of arch, straightness, body roll, and edge certainty. U p was the random effect of group p . i p was the residual error for the i th replicate sample within group p .
To determine the consistency of estimating the TBL of snubfin and humpback dolphins from BHDF, we conducted further intercept-only linear mixed-effects models for each of the two measures for each species. The global mean ratio of TBL (m) to BHDF (m) was calculated for each species. We then took the global mean for each dataset, taking into account repeated samples at the individual level, and calculated the absolute percentage deviation of individual ratios away from the global mean. The linear mixed-effects models took a form similar to above, with the random intercept accounting for repeated measures at the individual level.

3. Results

3.1. Assessing the Accuracy of Estimating the Size of the Replica

Of the 120 measurements of the dolphin replica, the mean length estimate was 1.95 m (±0.01 SE), corresponding to the actual replica size. An intercept only model indicated the overall predicted error on the size estimates of the replica to be 3.57% (±0.62 SE). The model showed strong statistical evidence (significance) for the accuracy of the size estimates to be influenced by the altitude of the drone (χ2 = 42.43, p < 0.001) and further statistical evidence size estimates to be influenced by the position of the replica within the image frame (χ2 = 9.21, p = 0.010). However, it was noted that the model was heavily influenced by two outlying datapoints, which had the size of the replica overestimated by ~17% on one of the flights while the drone was at 15 m, and with the replica in the centre of the frame. While the underlying cause of the outliers is uncertain, when these data points were excluded from the analysis, the model showed no evidence to support a change in the error rate of size estimates associated with the position of the replica within the image frame. Altitude, however, remained significant. The model predicted a decline in the precision error associated with size estimates from images sampled at the higher altitudes of ~45–60 m compared with ~15–30 m. The predicted mean error at 15 and 30 m was 4.51% (±0.64 SE) and 4.00 (±0.46 SE), respectively, whereas at 45 and 60 m the predicted mean error decreased significantly to 2.27% (±0.48 SE) and 1.95% (±0.46 SE), respectively (Figure 4). No significant difference was found in the predicted error of the size estimates between 15 and 30 m, or between 45 and 60 m. Further explorations of the data did not uncover signs of obvious biasing towards over or underestimating the size of the dolphin replica associated with the position of the replica within the frame or with altitude.

3.2. Accuracy of UAV Derived Length Measurements of Australian Snubfin and Humpback Dolphins

3.2.1. Data Collection

Across 15 days of sampling, 44 groups of dolphins were sampled, including 24 groups of snubfin dolphins, 19 of humpback dolphins and one mixed species group (comprising both snubfin and humpback dolphins). We recorded 295 videos from which we extracted 739 photos (Table 2). Of these photographs, 511 were of snubfin dolphins, including 190 repeated measures, and 228 were of humpback dolphins, including 159 repeated measures.

3.2.2. Morphometric Measurements of Australian Snubfin Dolphins

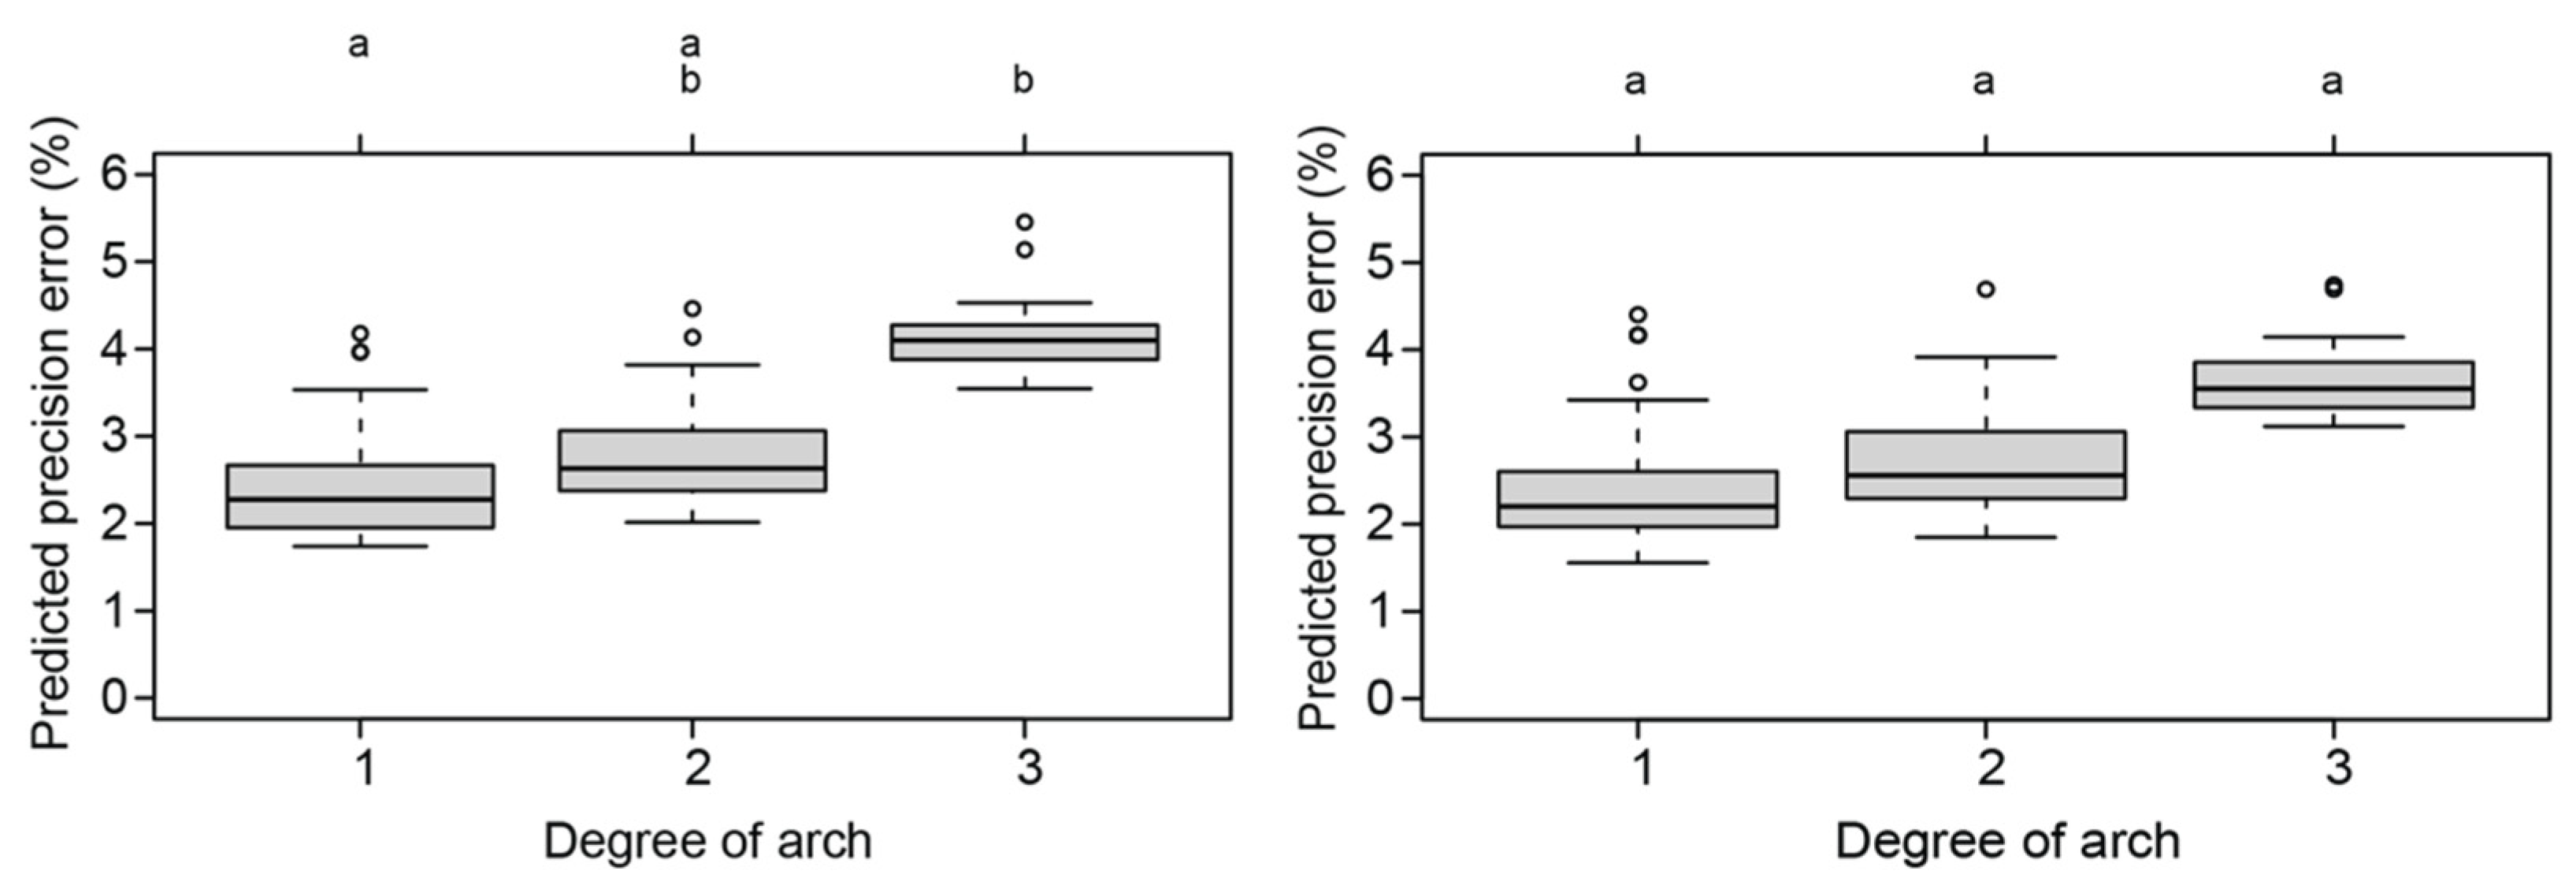
The overall mean precision error for estimating the TBL of snubfin dolphins was predicted to be 2.68% (±0.28 SE). The models for assessing the influence of the covariates (edge certainty, degree of arch, degree of straightness, degree of body roll, altitude, and position within the image frame) on the precision of TBL estimates on snubfin dolphins indicated that the model retaining degree of arch and degree of body roll to be the most parsimonious (Table S1). As anticipated, the precision error increased with increasing degrees of arch and body roll, with the model showing the degree of arch to be significant (Table 3). The model predicted that the precision error away from the mean increased by 1.60% (±0.58 SE) with a high degree of arch (degree of arch of three) compared to no degree of arch (arch score of one). However, model confidence in the effect of degree of arch was reduced following the removal of an outlying data point, which maintained a high error (8.23% away from the mean) with a dolphin body arch of three (Figure 5, Table 3). After rerunning the model process, the statistical confidence (within 95% confidence intervals) was reduced to no longer support associations of arch or body roll influencing the level of precision on length estimates of snubfin dolphins with high certainty.
When assessing the ratios of TBL to blowhole-to-dorsal fin BHDF on the entire snubfin dolphin dataset (accounting for nested repeated sampling), the model predicted a mean ratio of 2.35, with the predicted precision error of 3.86% (±0.18 SE).

3.2.3. Morphometric Measurements of Australian Humpback Dolphins

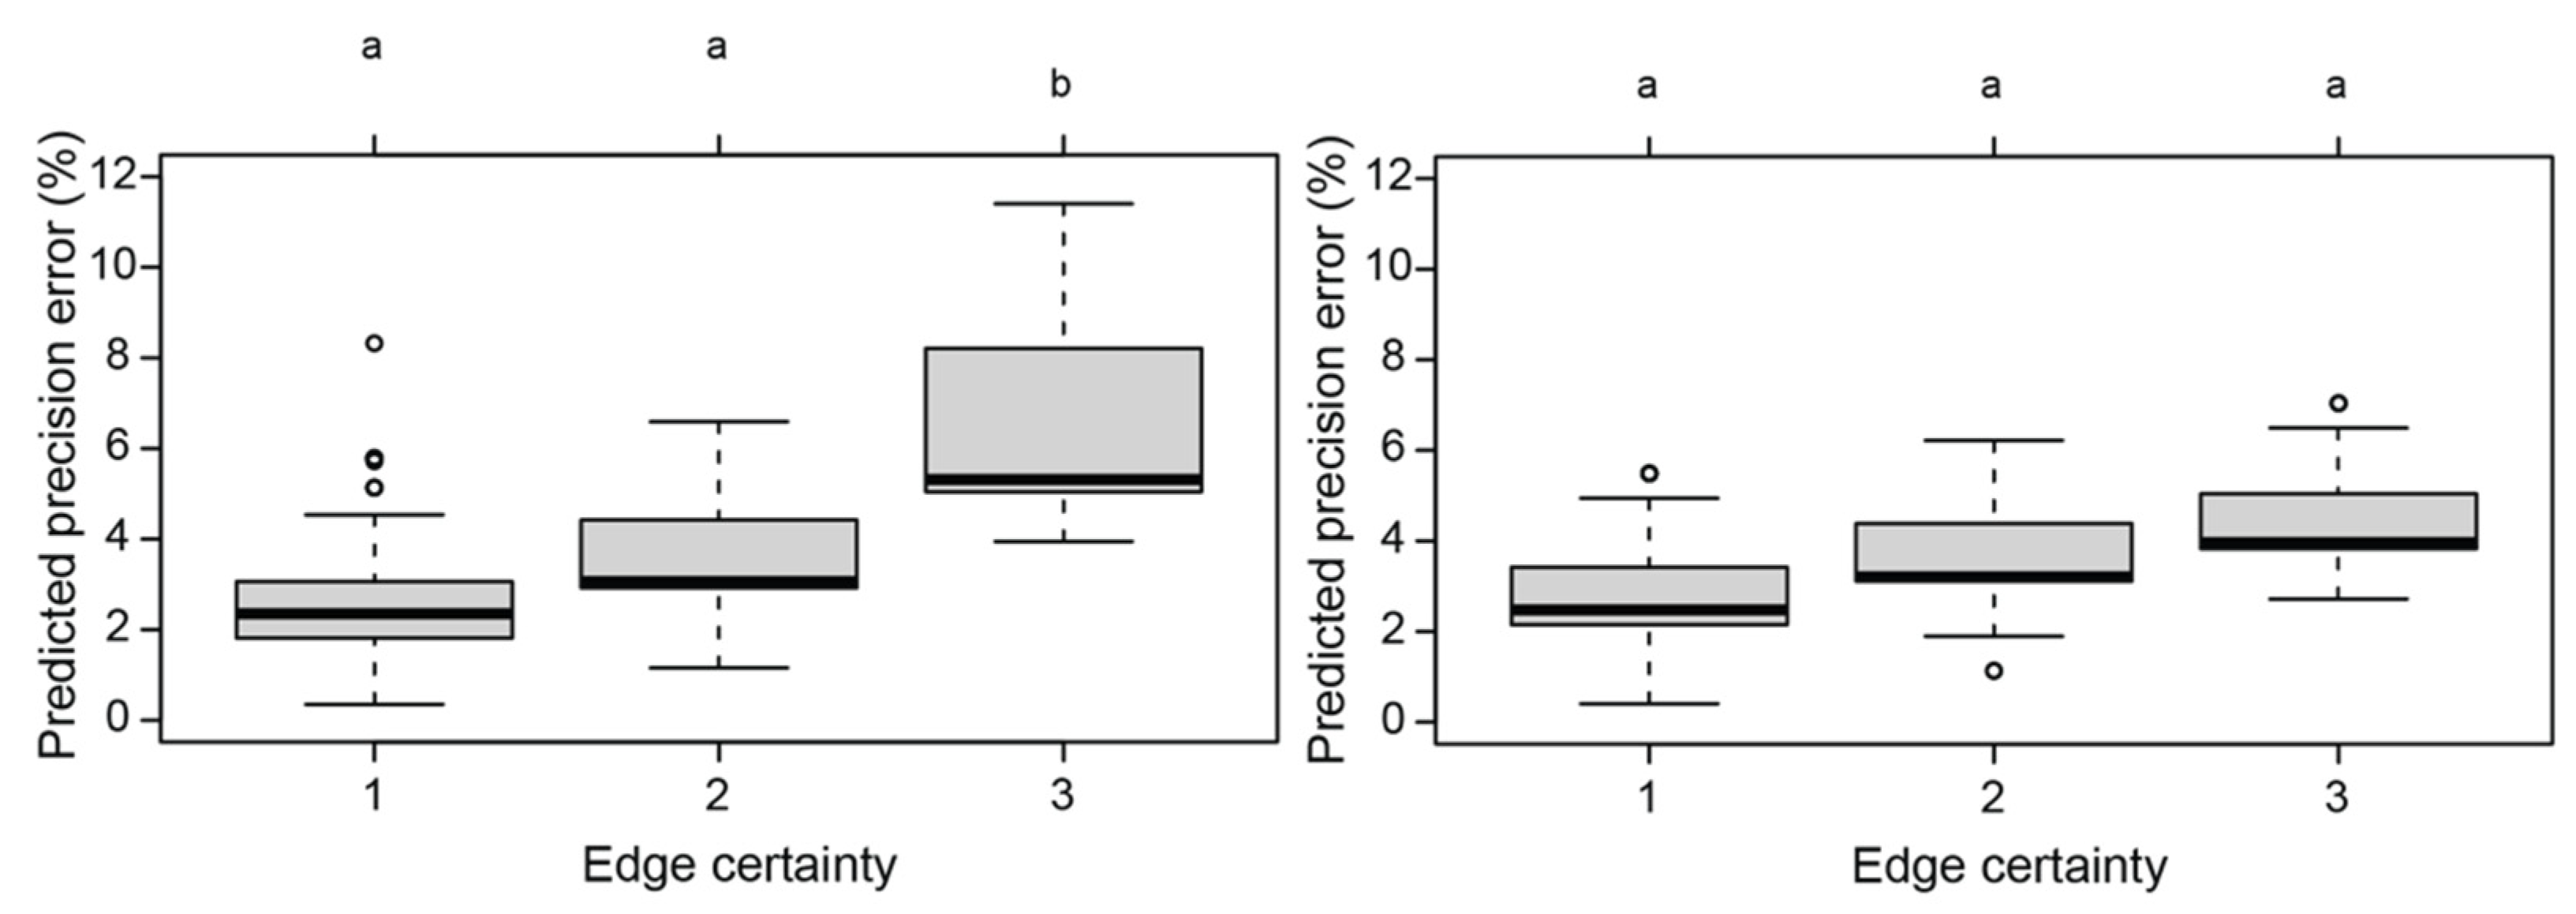
The overall mean precision error for humpback dolphin measurements was predicted to be 2.68% ± 0.28 SE). The model retaining edge certainty, straightness and position within the frame was the most parsimonious (Table S1). The influence of these covariates on precision error was in the direction anticipated (error increasing with poorer scores). Of these influential variables, there was particular statistical evidence for edge certainty to influence precision error of length estimates (χ2 = 11.44, p = 0.003; Table 3), with a predicted increase in the precision error of 2.27% (±0.89 SE) when the edge certainty was scored three compared with one. However, model confidence was reduced following the removal of three outliers (Figure 6, Table 3), for which two of these outliers had especially high precision errors of 24.69% and 25.56% associated with edge certainty scores of three.
Finally, when assessing the ratios of TBL to BHDF for humpback dolphins (accounting for nested repeated sampling), the model predicted a mean ratio of 3.24, with a predicted precision error of 8.61% (±0.57 SE).

3.3. Morphometric Characteristics

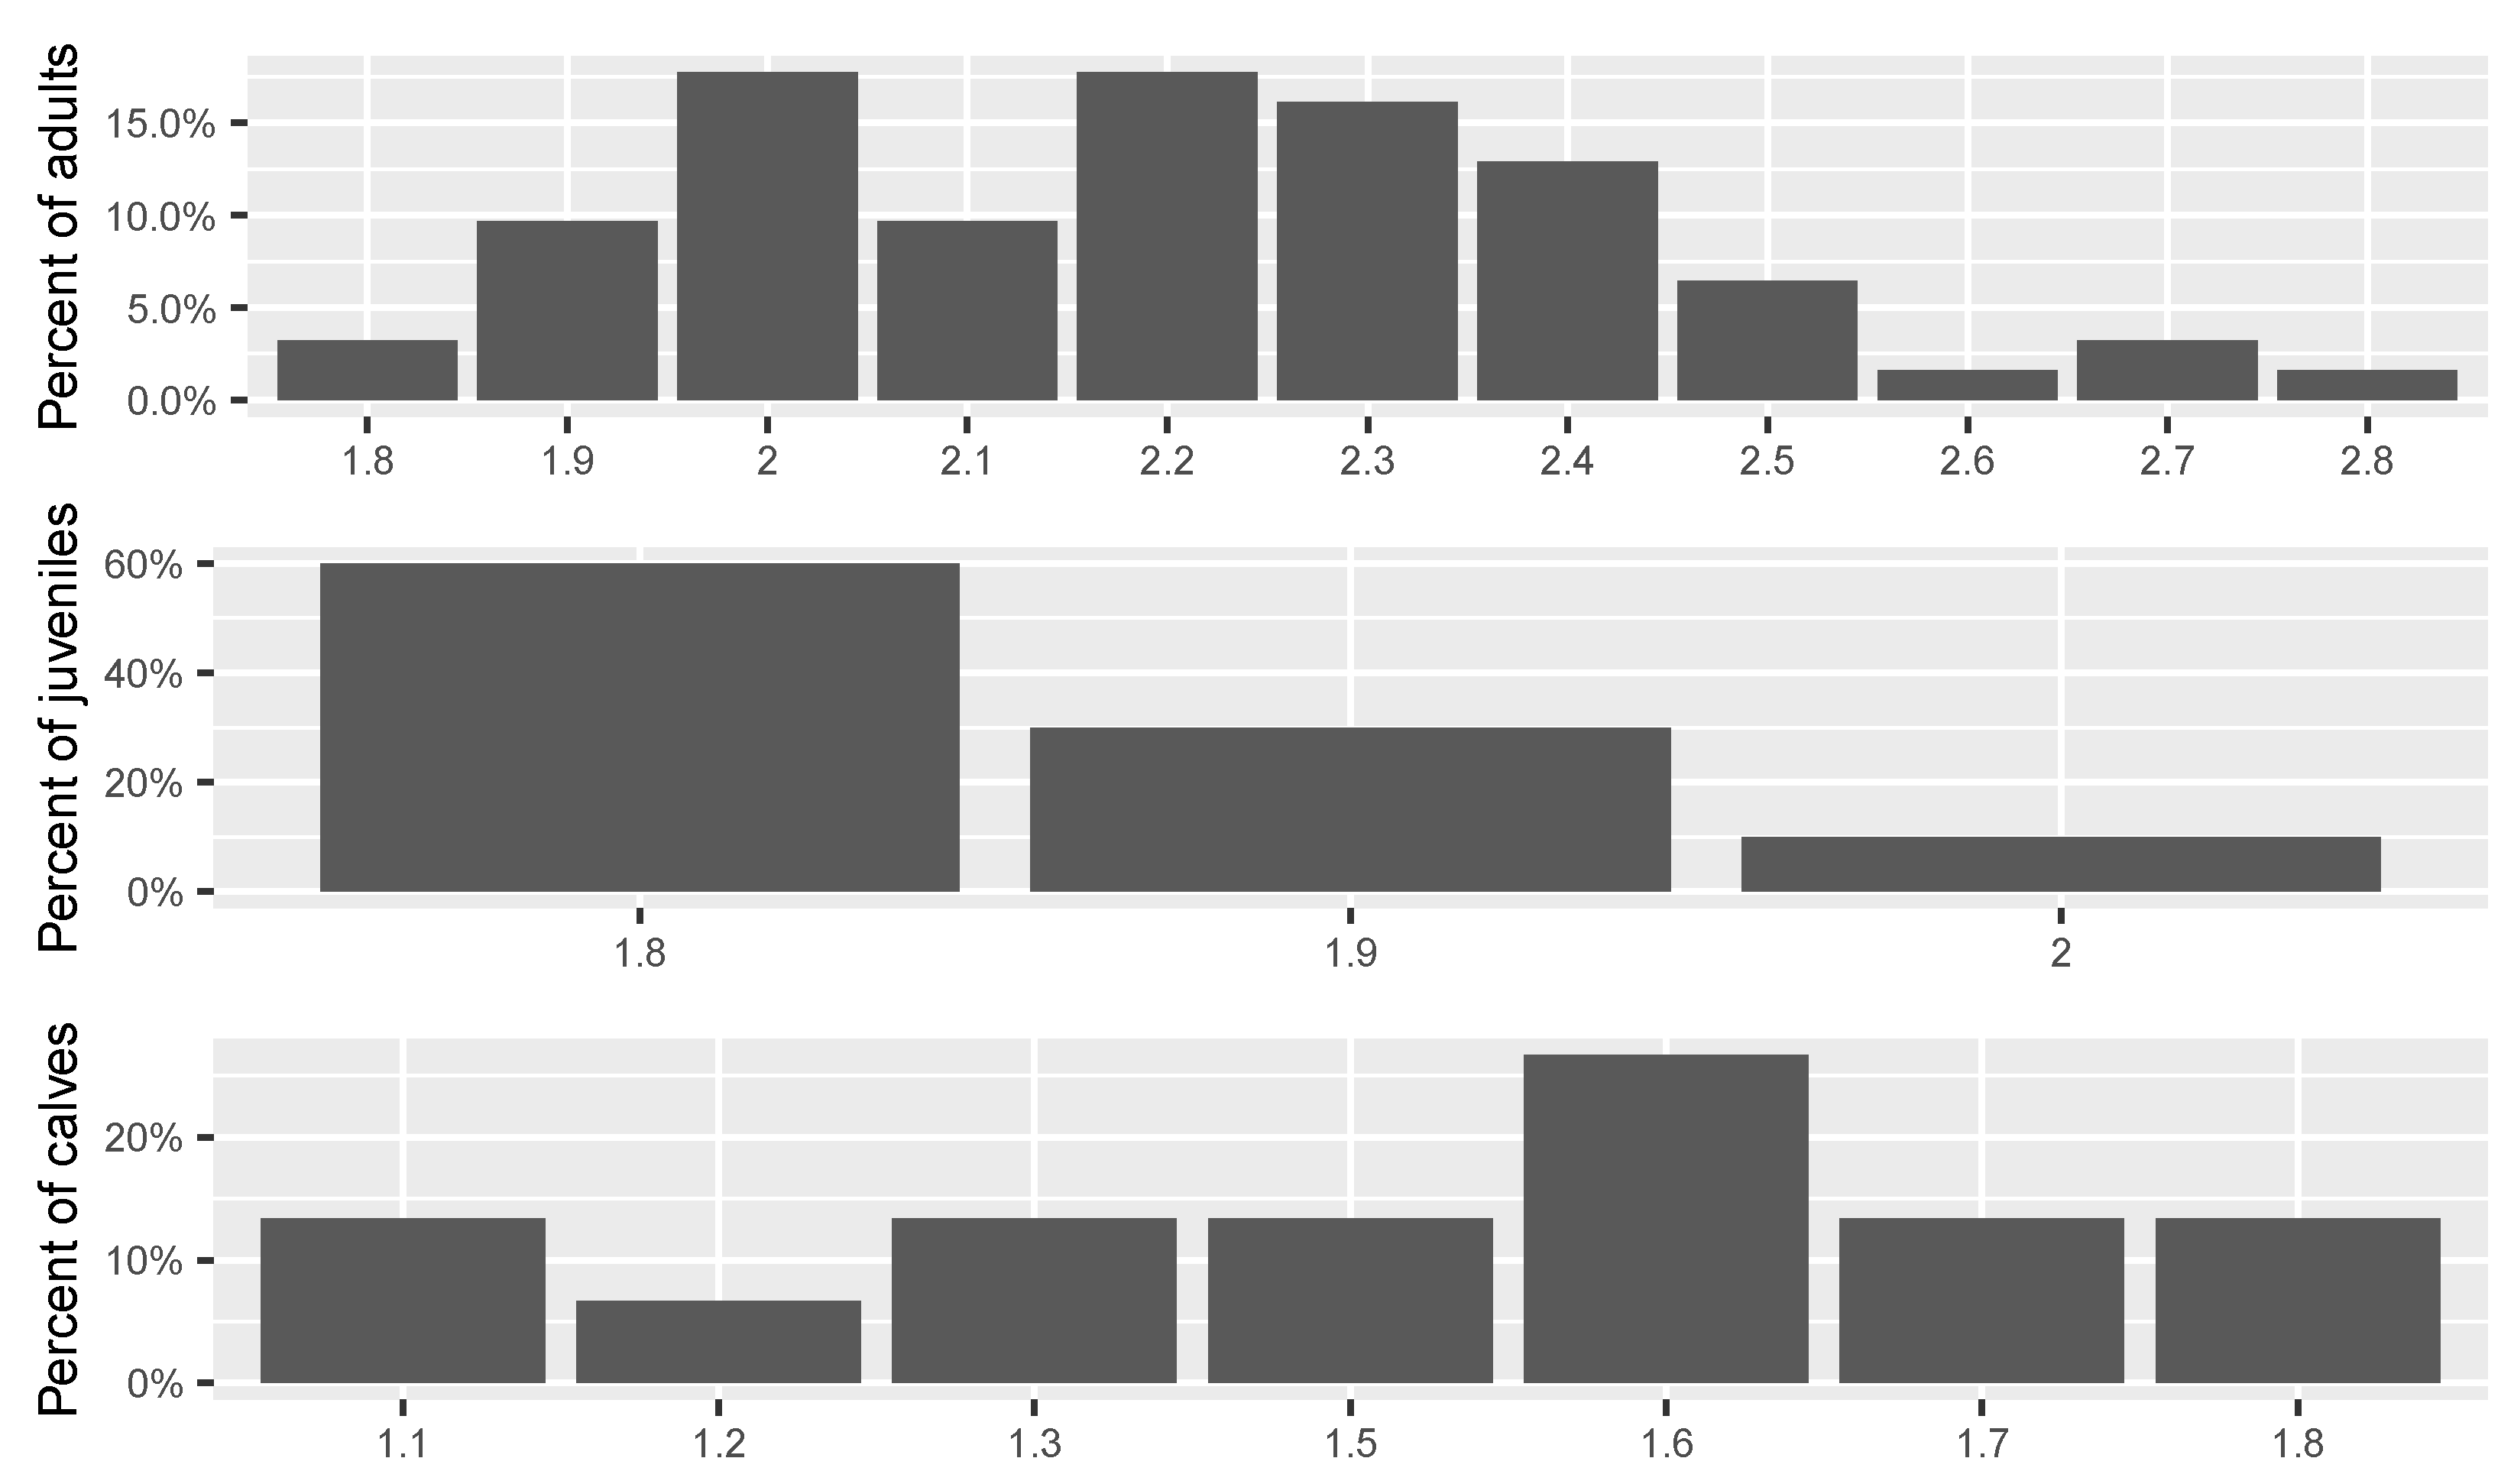
When assessing the size distributions for both species, using the mean TBL estimate of repeated samples of identified individuals, we excluded measurements with a score of three for degree of arch for snubfin dolphins and a score of three for edge certainty for humpback dolphins, following the results from the precision analysis. The TBL of snubfin and humpback dolphins sampled range from 1.54–2.67 m, (2.07 m ± 0.23 SD) and 1.14–2.78 m (2.04 m ± 0.35 SD), respectively. After grouping individuals by age classes, adult snubfin dolphins measured an average of 2.11 m (±0.18 SD, 1.74–2.67 m) and juveniles measured an average of 1.64 m (±0.08 SD, 1.54–1.79 m), no snubfin calf was sampled (Figure 7). Adult humpback dolphins measured an average of 2.22 m (±0.21 SD, 1.84–2.78 m), with juveniles 1.84 m (±0.07 SD, 1.75–1.96 m), and calves 1.49 m (±0.20 SD, 1.14–1.77 m: Figure 8).

4. Discussion

4.1. The Effect of the Covariates on the Reliability of Total Body Length Estimates

This study showed that photogrammetry based on images recorded from UAVs could be used to derive reliable morphometric measurements of free-ranging small delphinids. Overall, we obtained TBL estimates of humpback and snubfin dolphins within the known species values reported in the scientific literature with an error margin < 3%.
On the replica, the results demonstrated that estimating length from lower altitudes (15–30 m) to favour higher resolution was likely to be less reliable or incur a greater margin of error than at higher altitudes (45–60 m) with lower pixel resolution. The relative error margin of the UAV’s calculated altitude (specified to be ±1 m) would be expected to decrease with increasing altitude [66], which seemed to have more of an effect on estimating the length on the replica than the loss in effective pixel resolution and clarity of the target. However, the altitude effect did not transfer to a measurable loss in precision error on snubfin or humpback dolphins. This is potentially due to the reduction in resolution and clarity at higher altitudes bearing a larger impact on measuring partially submerged dolphins at higher altitudes compared to the replica. The replica was a highly contrasting object with its measurement points sitting just above the water surface, whereas the measurement points on the dolphins were often just below the surface and subject to elements of sea-surface distortion and depleting contrast or edge clarity. Additionally, dolphins were sampled from a boat, which may have had a bearing on the precision of the reported altitude, due to the vertical motion of the boat with passing sea. The lack of evidence of altitude having a significant effect on the precision of length estimates highlights that there would often be no compromise in data quality from sampling marine animals from higher altitudes with standard UAVs. While many UAV-based morphometric studies aim to sample from relatively low altitudes, the results of this study suggest that sampling from higher altitudes can render equally effective size estimates while minimising potential disturbance caused to the target animals from the UAV [62]. However, one main limitation from sampling at higher altitudes is that it may make identifying individuals in a group more difficult due to the comparatively lower resolution. To test the effect of altitude on the precision of TBL estimates of dolphins, we used data only from multiple measurements. To match dolphins in the same or different videos, natural markings on the visible parts of the body were used, as previously done on Risso’s dolphins [76]. The noticeable biasing towards lower altitudes for repeat measure samples was likely due to the higher pixel resolution at lower altitudes which allowed to distinguish superficial markings more clearly than at higher altitudes.
The position of the target in the frame did not affect the precision of length estimates on both the dolphin replica and wild dolphins, which suggests the distortion effects of the lens were minimal, even at low altitudes. These results are different from studies based on older UAV models such as the Phantom 3, which reported a significant distortion effect from the position in the frame on measurements accuracy [19,38]. Studies based on Phantom 4 Pro or UAVs that have sensors designed for minimising distortion effects yielded results similar to this study, suggesting that the position of the dolphin in the frame may not markedly affect the accuracy of UAV-derived size estimates [1,19,33,35]. The Phantom 4 Pro lens corrects distortion automatically, largely alleviating the deformation of objects in the corner. Additionally, if required, further correction to the images can be applied in post-processing using dedicated imagining manipulation software.
The body position of the dolphin at the surface can also influence the accuracy of morphometric measurements. Previous morphometric studies on baleen whales suggested that to obtain accurate morphometric measurements, images must be captured with the target animal as straight and as flat as possible on the water surface [37,77]. Following the same approach as Christiansen et al. (2018), the pictures used in the analysis were graded for body arch, degree of straightness, edge certainty and body roll (Figure 2). Only images graded as ‘usable’ (i.e., a quality grade of 3 or less) were included in the modelling process. Although all the above covariates are expected to affect the accuracy of measurements of wild dolphins, following the image grading, only straightness and edge certainty for humpback dolphins and body roll and arch for snubfin dolphins were retained in the final models as potentially influential variables. These results suggest a trend of increasing precision error when: (1) dolphin extremities are more clearly distinguishable from the background, (2) dolphins show a higher degree of straightness, with minimal arching and roll. However, within the bounds of ‘usable’ photos, the results suggest that it might be more beneficial for obtaining the greatest reliability in size estimates to increase sample replicates of individuals rather than selecting only the best photos.
Overall, while there is a general assumption that flights should be conducted at the lowest possible altitude with the target centred in the frame to obtain accurate body measurements, the results presented here suggest otherwise. For morphometric analysis on small dolphins, this study suggests that altitude and position of the dolphin in the frame do not significanlty affect morphopmetric measurements derived from images collected between 15 and 50 m. However, at altitudes above 30 m, it became increasingly difficult to distinguish markings along the body, dorsal fin, and fluke, which were used to identify individuals for multiple measurements. There is increasing evidence suggesting that at lower altitudes the presence of UAVs have the potential to cause both visual (the shadow or the UAV itself) or acoustic (noise produced from the propellors) disturbance [62,78]. Short-term behavioural changes of dolphins to the presence of the UAV, includes changing direction, diving and actively avoiding the UAV, [79,80]. During this study, in some instances, both snubfin and humpback dolphins showed short-term behavioural reactions to the presence of the UAV below 20 m which triggered the termination of the flight attempt. Similar reactions with the UAV below 20 m have been reported for bottlenose dolphins in various locations around the world, including Australia [79,80,81,82] and humpback dolphins in Western Australia [81]. Until more dedicated studies are avaiable on the impact of UAV presence on small dolphins, the best approach is to follow the precautionary principle based on available evidence. In summary, to obtain reliable morphometric measurements for snubfin and humpback dolphins, efforts should be focused on flying UAVs at an altitude of around 30 m, equating to ~0.8 cm pixel−1, and allows the use of natural marking for identification while minimising the impact of the dolphins’ behaviour.

4.2. Comparison of Total Body Length Estimates with Previous Studies Available Data

The distribution of TBL estimates of snubfin and humpback dolphins calculated from images with a quality score of two or less for each body position were consistent with existing taxonomic studies. The TBL of snubfin dolphins in the Fitzroy River was estimated to range from 1.54 m to 2.67 m, with an average of 2.11 m for adults and 1.64 m for juveniles. Beasley et al. (2005) reported an average length estimated from carcasses of 2.18 m with a range of 1.86 m–2.70 m. A summary of stranding data extracted from peer-reviewed studies and government reports suggests a length ranging from 0.91–2.7 m, with an average length of 2.17 m (range: 1.86–2.7 m) for adults, 1.15 m (range: 0.91–1.34 m) for juveniles and 1.22 m (range: 1.22–1.22 m) for calves [51,83,84,85,86,87].
The TBL for humpback dolphins in the Fitzroy River ranged from 1.14–2.78 m, with an average of 2.22 m for adults, 1.84 m for juveniles and 1.49 m for calves. Jefferson and Rosenbaum, 2014 reported a calculated length ranging from 1.00 m to 2.75 m [53]. The lengths reported from stranding data extracted from published studies and government reports varied between 1.00–2.70 m, with an average length of 2.40 m (range: 2.17–2.61 m) for adults, 1.87 m (range: 1.78–1.95 m) for juveniles, and 1.43 m (range: 1.00–1.77 m) for calves [83,84,85,86,87,88].
This study suggests that using UAVs-based photogrammetry is an effective method to obtain reliable morphometric measurements of snubfin and humpback dolphins. Although this study was focused on only two species, we believe that considering the cryptic nature of snubfin and humpback dolphins, UAVs can be successfully applied to estimate morphometric parameters for species of similar size.

5. Conclusions

Morphometrics provides vital information about population health, body condition and structure. However, obtaining morphometric data of free-ranging marine mammals is inherently difficult. Wild dolphins are particularly difficult to sample due to their mobility and random surfacing pattern. Furthermore, shy and cryptic species, such as snubfin and humpback dolphins, tend to avoid boats [50,74,75,81]. Despite their shy nature, obtaining morphometric measurements using UAVs for both species was feasible and effective. Overall, this study demonstrates the high precision of utilising UAVs to collect morphometric measurements of small dolphin species. Thus, photogrammetry provides a powerful noninvasive resource to monitor the health status of cryptic small dolphin species of conservation concern.

Supplementary Materials

The following are available online at https://www.mdpi.com/article/10.3390/rs14010021/s1, Table S1. Australian snubfin dolphin covariable model outputs. Table S2. Australian humpback dolphin covariable model output.

Author Contributions

Conceptualisation, All authors; methodology, All authors; software, A.P.C.; validation, All authors; formal analysis, A.P.C.; investigation, All authors; resources, D.C.; data curation, All authors; writing—original draft preparation, A.I.C.; writing—review and editing, All authors; visualisation, All authors; supervision, D.C. and A.P.C.; project administration, D.C.; funding acquisition, D.C. All authors have read and agreed to the published version of the manuscript.

Funding

This research was funded by Southern Cross University, grant number not applicable and Gladstone Port Corporations grant number 51972.

Institutional Review Board Statement

The study was conducted according to the guidelines of the Declaration of Helsinki, and approved by the Ethics Committee of Southern Cross University Animal Care and Ethics Committee (protocol code 20/011 and approval date 24 February 2020).

Informed Consent Statement

Not applicable.

Data Availability Statement

Data can be requested by contacting D.C. at [email protected].

Acknowledgments

This study was conducted under SCU Animal Research Authority 20/12; Great Barrier Reef Marine Park permit G19/422097.1, and scientific purpose permit of the Queensland Department of Environment and Heritage Protection WISP16457615.

Conflicts of Interest

The authors declare no conflict of interest.

References

  1. Hodgson, J.C.; Holman, D.; Terauds, A.; Koh, L.P.; Goldsworthy, S.D. Rapid condition monitoring of an endangered marine vertebrate using precise, non-invasive morphometrics. Biol. Conserv. 2020, 242, 108402. [Google Scholar] [CrossRef]
  2. Castrillon, J.; Bengtson Nash, S. Evaluating cetacean body condition; a review of traditional approaches and new developments. Ecol. Evol. 2020, 10, 6144–6162. [Google Scholar] [CrossRef]
  3. Berger, J. Estimation of body-size traits by photogrammetry in large mammals to inform conservation. Conserv. Biol. 2012, 26, 769–777. [Google Scholar] [CrossRef] [PubMed]
  4. Vindenes, Y.; Edeline, E.; Ohlberger, J.; Langangen, Ø.; Winfield, I.J.; Stenseth, N.C.; Vøllestad, L.A. Effects of climate change on trait-based dynamics of a top predator in freshwater ecosystems. Am. Nat. 2014, 183, 243–256. [Google Scholar] [CrossRef] [PubMed] [Green Version]
  5. Boulanger, J.; Cattet, M.; Nielsen, S.E.; Stenhouse, G.; Cranston, J. Use of multi-state models to explore relationships between changes in body condition, habitat and survival of grizzly bearsUrsus arctos horribilis. Wildl. Biol. 2013, 19, 274–288. [Google Scholar] [CrossRef] [Green Version]
  6. Christiansen, F.; Dawson, S.M.; Durban, J.W.; Fearnbach, H.; Miller, C.A.; Bejder, L.; Uhart, M.; Sironi, M.; Corkeron, P.; Rayment, W. Population comparison of right whale body condition reveals poor state of the North Atlantic right whale. Mar. Ecol. Prog. Ser. 2020, 640, 1–16. [Google Scholar] [CrossRef]
  7. Pastene, L.A.; Acevedo, J.; Branch, T.A. Morphometric analysis of Chilean blue whales and implications for their taxonomy. Mar. Mammal Sci. 2020, 36, 116–135. [Google Scholar] [CrossRef]
  8. Woodward, B.L.; Winn, J.P.; Fish, F.E. Morphological specializations of baleen whales associated with hydrodynamic performance and ecological niche. J. Morphol. 2006, 267, 1284–1294. [Google Scholar] [CrossRef] [PubMed]
  9. Joblon, M.J.; Pokras, M.A.; Morse, B.; Harry, C.T.; Rose, K.S.; Sharp, S.M.; Niemeyer, M.E.; Patchett, K.M.; Sharp, W.B.; Moore, M.J. Body condition scoring system for delphinids based on short-beaked common dolphins (Delphinus delphis). J. Mar. Anim. Ecol. 2014, 7, 5–13. [Google Scholar]
  10. Cardona-Maldonado, M.A.; Mignucci-Giannoni, A.A. Pygmy and dwarf sperm whales in Puerto Rico and the Virgin Islands, with a review of Kogia in the Caribbean. Caribb. J. Sci. 1999, 35, 29–37. [Google Scholar]
  11. Turner, J.P.; Worthy, G.A. Skull morphometry of bottlenose dolphins (Tursiops truncatus) from the Gulf of Mexico. J. Mammal. 2003, 84, 665–672. [Google Scholar] [CrossRef] [Green Version]
  12. Bell, C.H.; Kemper, C.M.; Conran, J.G. Common dolphins (Delphinus delphis) in Southern Australia: A morphometric study. Aust. Mammal. 2002, 24, 1–10. [Google Scholar] [CrossRef] [Green Version]
  13. Robeck, T.R.; Monfort, S.L.; Calle, P.P.; Dunn, J.L.; Jensen, E.; Boehm, J.R.; Young, S.; Clark, S.T. Reproduction, growth and development in captive beluga (Delphinapterus leucas). Zoo Biol. 2005, 24, 29–49. [Google Scholar] [CrossRef]
  14. Clark, S.T.; Odell, D.K. Allometric relationships and sexual dimorphism in captive killer whales (Orcinus orca). J. Mammal. 1999, 80, 777–785. [Google Scholar] [CrossRef] [Green Version]
  15. Tolley, K.; Read, A.; Wells, R.; Urian, K.; Scott, M.; Irvine, A.; Hohn, A. Sexual dimorphism in wild bottlenose dolphins (Tursiops truncatus) from Sarasota, Florida. J. Mammal. 1995, 76, 1190–1198. [Google Scholar] [CrossRef]
  16. Đuras, M.; Brnić, D.D.; Gomerčić, T.; Galov, A. Craniometry of bottlenose dolphins (Tursiops truncatus) from the Adriatic Sea. Vet. Arh. 2014, 84, 649–666. [Google Scholar]
  17. Booth, C.G.; Sinclair, R.R.; Harwood, J. Methods for monitoring for the population consequences of disturbance in marine mammals: A review. Front. Mar. Sci. 2020, 7, 115. [Google Scholar] [CrossRef] [Green Version]
  18. Beltran, R.S.; Ruscher-Hill, B.; Kirkham, A.L.; Burns, J.M. An evaluation of three-dimensional photogrammetric and morphometric techniques for estimating volume and mass in Weddell seals Leptonychotes weddellii. PLoS ONE 2018, 13, e0189865. [Google Scholar] [CrossRef] [PubMed] [Green Version]
  19. Burnett, J.D.; Lemos, L.; Barlow, D.; Wing, M.G.; Chandler, T.; Torres, L.G. Estimating morphometric attributes of baleen whales with photogrammetry from small UASs: A case study with blue and gray whales. Mar. Mammal Sci. 2019, 35, 108–139. [Google Scholar] [CrossRef] [Green Version]
  20. Webster, T.; Dawson, S.; Slooten, E. A simple laser photogrammetry technique for measuring Hector’s dolphins (Cephalorhynchus hectori) in the field. Mar. Mammal Sci. 2010, 26, 296–308. [Google Scholar] [CrossRef]
  21. Wong, J.B.; Auger-Méthé, M. Using laser photogrammetry to measure long-finned pilot whales (Globicephala melas). Proc. Nova Scotian Inst. Sci. 2018, 49, 269. [Google Scholar] [CrossRef]
  22. Durban, J.; Parsons, K. Laser-metrics of free-ranging killer whales. Mar. Mammal Sci. 2006, 22, 735–743. [Google Scholar] [CrossRef]
  23. Van Aswegen, M.; Christiansen, F.; Symons, J.; Mann, J.; Nicholson, K.; Sprogis, K.; Bejder, L. Morphological differences between coastal bottlenose dolphin (Tursiops aduncus) populations identified using non-invasive stereo-laser photogrammetry. Sci. Rep. 2019, 9, 1–14. [Google Scholar] [CrossRef] [PubMed] [Green Version]
  24. Fearnbach, H.; Durban, J.W.; Ellifrit, D.K.; Balcomb, K.C. Using aerial photogrammetry to detect changes in body condition of endangered southern resident killer whales. Endanger. Species Res. 2018, 35, 175–180. [Google Scholar] [CrossRef]
  25. Perryman, W.L.; Lynn, M.S. Evaluation of nutritive condition and reproductive status of migrating gray whales (Eschrichtius robustus) based on analysis of photogrammetric data. J. Cetacean Res. Manag. 2002, 4, 155–164. [Google Scholar]
  26. Miller, C.A.; Best, P.B.; Perryman, W.L.; Baumgartner, M.F.; Moore, M.J. Body shape changes associated with reproductive status, nutritive condition and growth in right whales Eubalaena glacialis and E. australis. Mar. Ecol. Prog. Ser. 2012, 459, 135–156. [Google Scholar] [CrossRef] [Green Version]
  27. Ratnaswamy, M.J.; Winn, H.E. Photogrammetric estimates of allometry and calf production in fin whales, Balaenoptera physalus. J. Mammal. 1993, 74, 323–330. [Google Scholar] [CrossRef]
  28. Durban, J.; Fearnbach, H.; Ellifrit, D.; Balcomb, K. Size and body condition of southern resident killer whales. In Contract Report to National Marine Fisheries Service; Northwest Regional Office: Seattle, WA, USA, 2009. [Google Scholar]
  29. Suydam, R.S. Age, Growth, Reproduction, and Movements of Beluga Whales (Delphinapterus leucas) from the Eastern Chukchi Sea. Ph.D. Thesis, University of Washington, Seattle, WA, USA, 2009. [Google Scholar]
  30. Christie, K.S.; Gilbert, S.L.; Brown, C.L.; Hatfield, M.; Hanson, L. Unmanned aircraft systems in wildlife research: Current and future applications of a transformative technology. Front. Ecol. Environ. 2016, 14, 241–251. [Google Scholar] [CrossRef]
  31. Watts, A.C.; Perry, J.H.; Smith, S.E.; Burgess, M.A.; Wilkinson, B.E.; Szantoi, Z.; Ifju, P.G.; Percival, H.F. Small unmanned aircraft systems for low-altitude aerial surveys. J. Wildl. Manag. 2010, 74, 1614–1619. [Google Scholar] [CrossRef]
  32. Linchant, J.; Lisein, J.; Semeki, J.; Lejeune, P.; Vermeulen, C. Are unmanned aircraft systems (UAS s) the future of wildlife monitoring? A review of accomplishments and challenges. Mammal. Rev. 2015, 45, 239–252. [Google Scholar] [CrossRef]
  33. Gray, P.C.; Bierlich, K.C.; Mantell, S.A.; Friedlaender, A.S.; Goldbogen, J.A.; Johnston, D.W. Drones and convolutional neural networks facilitate automated and accurate cetacean species identification and photogrammetry. Methods Ecol. Evol. 2019, 10, 1490–1500. [Google Scholar] [CrossRef]
  34. Durban, J.W.; Moore, M.J.; Chiang, G.; Hickmott, L.S.; Bocconcelli, A.; Howes, G.; Bahamonde, P.A.; Perryman, W.L.; LeRoi, D.J. Photogrammetry of blue whales with an unmanned hexacopter. Mar. Mammal Sci. 2016, 32, 1510–1515. [Google Scholar] [CrossRef]
  35. Christiansen, F.; Dujon, A.M.; Sprogis, K.R.; Arnould, J.P.; Bejder, L. Noninvasive unmanned aerial vehicle provides estimates of the energetic cost of reproduction in humpback whales. Ecosphere 2016, 7, e01468. [Google Scholar] [CrossRef]
  36. Dawson, S.M.; Bowman, M.H.; Leunissen, E.; Sirguey, P. Inexpensive aerial photogrammetry for studies of whales and large marine animals. Front. Mar. Sci. 2017, 4, 366. [Google Scholar] [CrossRef] [Green Version]
  37. Christiansen, F.; Vivier, F.; Charlton, C.; Ward, R.; Amerson, A.; Burnell, S.; Bejder, L. Maternal body size and condition determine calf growth rates in southern right whales. Mar. Ecol. Prog. Ser. 2018, 592, 267–281. [Google Scholar] [CrossRef] [Green Version]
  38. Hughes, S.; Diggins, D.; Cerchio, S.; Bennett, A. Morphometric measurements of Omura’s whales using consumer grade sUASs: A methodological study. In Proceedings of the OCEANS 2019-Marseille, Marseille, France, 17–20 June 2019; pp. 1–8. [Google Scholar] [CrossRef]
  39. Durban, J.W.; Fearnbach, H.; Barrett-Lennard, L.; Perryman, W.; Leroi, D. Photogrammetry of killer whales using a small hexacopter launched at sea. J. Unmanned Veh. Syst. 2015, 3, 131–135. [Google Scholar] [CrossRef]
  40. Noren, S.; Schwarz, L.; Chase, K.; Aldrich, K.; McMahon-Van Oss, K.; Leger, J.S. Validation of the photogrammetric method to assess body condition of an odontocete, the shortfinned pilot whale Globicephala macrorhynchus. Mar. Ecol. Prog. Ser. 2019, 620, 185–200. [Google Scholar] [CrossRef]
  41. Adamczak, S.K.; Pabst, A.; McLellan, W.; Thorne, L. Using 3D models to improve estimates of marine mammal size and external morphology. Front. Mar. Sci. 2019, 6, 334. [Google Scholar] [CrossRef]
  42. Claridge, D.; Dunn, C.; Durban, J.; Fearnbach, H.; Perryman, W. Photogrammetry with an Unmanned Aerial System to Assess. Body Condition and Growth of Blainville’s Beaked Whales; National Oceanic and Atmospheric Administration: La Jolla, CA, USA, 2015.
  43. Krause, D.J.; Hinke, J.T.; Perryman, W.L.; Goebel, M.E.; LeRoi, D.J. An accurate and adaptable photogrammetric approach for estimating the mass and body condition of pinnipeds using an unmanned aerial system. PLoS ONE 2017, 12, e0187465. [Google Scholar] [CrossRef] [Green Version]
  44. Mustafa, O.; Braun, C.; Esefeld, J.; Knetsch, S.; Maercker, J.; Pfeifer, C.; Rümmler, M.-C. Detecting antarctic seals and flying seabirds by uav. ISPRS Ann. Photogramm. Remote Sens. Spat. Inf. Sci. 2019, 4, 141–148. [Google Scholar] [CrossRef] [Green Version]
  45. Goebel, M.E.; Perryman, W.L.; Hinke, J.T.; Krause, D.J.; Hann, N.A.; Gardner, S.; LeRoi, D.J. A small unmanned aerial system for estimating abundance and size of Antarctic predators. Polar Biol. 2015, 38, 619–630. [Google Scholar] [CrossRef] [Green Version]
  46. Allan, B.M.; Ierodiaconou, D.; Hoskins, A.J.; Arnould, J.P. A rapid UAV method for assessing body condition in fur seals. Drones 2019, 3, 24. [Google Scholar] [CrossRef] [Green Version]
  47. Fudala, K.; Bialik, R.J. Breeding colony dynamics of southern elephant seals at patelnia point, King George Island, Antarctica. Remote Sens. 2020, 12, 2964. [Google Scholar]
  48. Alvarado, D.C.; Robinson, P.W.; Frasson, N.C.; Costa, D.P.; Beltran, R.S. Calibration of aerial photogrammetry to estimate elephant seal mass. Mar. Mammal Sci. 2020, 36, 1347–1355. [Google Scholar]
  49. Stepien, E.N. Using UAVs for morphometric measurements of harbour porpoises (Phocoena phocoena). In Proceedings of the Nordic Remote Sensing, Aarhus, Denmark, 17–19 September 2019. [Google Scholar]
  50. Cagnazzi, D. Conservation Status of Australian Snubfin Dolphin, Orcaella heinsohni, and Indo-Pacific Humpback Dolphin, Sousa Chinensis, in the Capricorn Coast, Central Queensland Australia. Ph.D. Thesis, Southern Cross University, Lismore, Australia, 2010. [Google Scholar]
  51. Beasley, I.; Robertson, K.M.; Arnold, P. Description of a new dolphin, the Australian snubfin dolphin Orcaella heinsohni sp. n. (Cetacea, Delphinidae). Mar. Mammal Sci. 2005, 21, 365–400. [Google Scholar] [CrossRef]
  52. Arnold, P.; Heinsohn, G. Phylogenetic status of the Irrawaddy dolphin Orcaella brevirostris (Owen in Gray): A cladistic analysis. Mem. Qld. Mus. 1996, 39, 141–204. [Google Scholar]
  53. Jefferson, T.A.; Rosenbaum, H.C. Taxonomic revision of the humpback dolphins (Sousa spp.), and description of a new species from Australia. Mar. Mammal Sci. 2014, 30, 1494–1541. [Google Scholar] [CrossRef]
  54. Ross, G.J.; Heinsohn, G.; Cockcroft, V. Humpback dolphins Sousa chinensis (Osbeck, 1765), Sousa plumbea (G. Cuvier, 1829) and Sousa teuszii (Kukenthal, 1892). Handb. Mar. Mamm. 1994, 5, 23–42. [Google Scholar]
  55. Parra, G.J.; Cagnazzi, D. Conservation status of the Australian humpback dolphin (Sousa sahulensis) using the IUCN Red List Criteria. In Advances in Marine Biology; Elsevier: Amsterdam, The Netherlands, 2016; Volume 73, pp. 157–192. [Google Scholar] [CrossRef]
  56. Parra, G.; Cagnazzi, D.; Beasley, I. Orcaella Heinsohni. The IUCN Red List of Threatened Species. 2017. Available online: https://www.iucnredlist.org/species/136315/123793740 (accessed on 16 December 2021).
  57. Hodgson, A.; Kelly, N.; Peel, D. Unmanned aerial vehicles (UAVs) for surveying marine fauna: A dugong case study. PLoS ONE 2013, 8, e79556. [Google Scholar] [CrossRef] [Green Version]
  58. Schroeder, N.M.; Panebianco, A.; Gonzalez Musso, R.; Carmanchahi, P. An experimental approach to evaluate the potential of drones in terrestrial mammal research: A gregarious ungulate as a study model. R. Soc. Open Sci. 2020, 7, 191482. [Google Scholar] [CrossRef] [Green Version]
  59. Cagnazzi, D.; Parra, G.J.; Harrison, P.L.; Brooks, L.; Rankin, R. Vulnerability of threatened Australian humpback dolphins to flooding and port development within the southern Great Barrier Reef coastal region. Glob. Ecol. Conserv. 2020, 24, e01203. [Google Scholar] [CrossRef]
  60. Cagnazzi, D.; Parra, G.J.; Westley, S.; Harrison, P.L. At the heart of the industrial boom: Australian snubfin dolphins in the Capricorn Coast, Queensland, need urgent conservation action. PLoS ONE 2013, 8, e56729. [Google Scholar] [CrossRef] [Green Version]
  61. Colefax, A.P.; Butcher, P.A.; Pagendam, D.E.; Kelaher, B.P. Reliability of marine faunal detections in drone-based monitoring. Ocean Coast. Manag. 2019, 174, 108–115. [Google Scholar] [CrossRef]
  62. Raoult, V.; Colefax, A.P.; Allan, B.M.; Cagnazzi, D.; Castelblanco-Martínez, N.; Ierodiaconou, D.; Johnston, D.W.; Landeo-Yauri, S.; Lyons, M.; Pirotta, V. Operational protocols for the use of drones in marine animal research. Drones 2020, 4, 64. [Google Scholar] [CrossRef]
  63. Aleixo, F.; O’Callaghan, S.A.; Ducla Soares, L.; Nunes, P.; Prieto, R. AragoJ: A free, open-source software to aid single camera photogrammetry studies. Methods Ecol. Evol. 2020, 11, 670–677. [Google Scholar] [CrossRef] [Green Version]
  64. Colefax, A.P.; Kelaher, B.P.; Pagendam, D.E.; Butcher, P.A. Assessing white shark (Carcharodon carcharias) behavior along coastal beaches for conservation-focused shark mitigation. Front. Mar. Sci. 2020, 7, 268. [Google Scholar] [CrossRef]
  65. Tucker, J.P.; Colefax, A.P.; Santos, I.R.; Kelaher, B.P.; Pagendam, D.E.; Butcher, P.A. White shark behaviour altered by stranded whale carcasses: Insights from drones and implications for beach management. Ocean Coast. Manag. 2021, 200, 105477. [Google Scholar] [CrossRef]
  66. Geraeds, M.; van Emmerik, T.; de Vries, R.; bin Ab Razak, M.S. Riverine plastic litter monitoring using unmanned aerial vehicles (UAVs). Remote Sens. 2019, 11, 2045. [Google Scholar] [CrossRef] [Green Version]
  67. Team, R.C. R: A Language and Environment for Statistical Computing; R Foundation for Statistical Computing: Vienna, Austria, 2013. [Google Scholar]
  68. Bates, D.; Mächler, M.; Bolker, B.; Walker, S. Fitting linear mixed-effects models using lme4. arXiv 2014, arXiv:1406.5823. [Google Scholar]
  69. Aho, K.; Derryberry, D.; Peterson, T. Model selection for ecologists: The worldviews of AIC and BIC. Ecology 2014, 95, 631–636. [Google Scholar] [CrossRef]
  70. Ripley, B.D. Modern Applied Statistics with S; Springer: Berlin/Heidelberg, Germany, 2002. [Google Scholar]
  71. Nieuwenhuis, R.; Te Grotenhuis, H.; Pelzer, B. Influence. ME: Tools for Detecting Influential Data in Mixed Effects Models; Radboud University: Nijmegen, The Netherlands, 2012. [Google Scholar]
  72. Fox, J.; Weisberg, S. An R Companion to Applied Regression; Sage Publications: Thousand Oaks, CA, USA, 2018. [Google Scholar]
  73. Hothorn, T.; Bretz, F.; Westfall, P. Simultaneous inference in general parametric models. Biom. J. J. Math. Methods Biosci. 2008, 50, 346–363. [Google Scholar] [CrossRef] [Green Version]
  74. Parra, G.J.; Corkeron, P.J.; Marsh, H. Population sizes, site fidelity and residence patterns of Australian snubfin and Indo-Pacific humpback dolphins: Implications for conservation. Biol. Conserv. 2006, 129, 167–180. [Google Scholar] [CrossRef]
  75. Parra, G.J.; Corkeron, P.J.; Arnold, P. Grouping and fission–fusion dynamics in Australian snubfin and Indo-Pacific humpback dolphins. Anim. Behav. 2011, 82, 1423–1433. [Google Scholar] [CrossRef]
  76. Mariani, M.; Miragliuolo, A.; Mussi, B.; Russo, G.F.; Ardizzone, G.; Pace, D.S. Analysis of the natural markings of Risso’s dolphins (Grampus griseus) in the central Mediterranean Sea. J. Mammal. 2016, 97, 1512–1524. [Google Scholar] [CrossRef] [Green Version]
  77. Christiansen, F.; Sprogis, K.R.; Gross, J.; Castrillon, J.; Warick, H.A.; Leunissen, E.; Nash, S.B. Variation in outer blubber lipid concentration does not reflect morphological body condition in humpback whales. J. Exp. Biol. 2020, 223. [Google Scholar] [CrossRef]
  78. Smith, C.E.; Sykora-Bodie, S.T.; Bloodworth, B.; Pack, S.M.; Spradlin, T.R.; LeBoeuf, N.R. Assessment of known impacts of unmanned aerial systems (UAS) on marine mammals: Data gaps and recommendations for researchers in the United States. J. Unmanned Veh. Syst. 2016, 4, 31–44. [Google Scholar] [CrossRef] [Green Version]
  79. Ramos, E.A.; Maloney, B.; Magnasco, M.O.; Reiss, D. Bottlenose dolphins and Antillean manatees respond to small multi-rotor unmanned aerial systems. Front. Mar. Sci. 2018, 5, 316. [Google Scholar] [CrossRef]
  80. Fettermann de Oliveira, T. Unmanned Aerial Vehicle (UAV) Remote Sensing of Behaviour and Habitat Use of the Nationally Endangered Bottlenose Dolphin (Tursiops truncatus) off Great Barrier Island. Ph.D. Thesis, Auckland University of Technology, Auckland, New Zealand, 2018. [Google Scholar]
  81. Raudino, H.C.; Tyne, J.A.; Smith, A.; Ottewell, K.; McArthur, S.; Kopps, A.M.; Chabanne, D.; Harcourt, R.G.; Pirotta, V.; Waples, K. Challenges of collecting blow from small cetaceans. Ecosphere 2019, 10, e02901. [Google Scholar] [CrossRef] [Green Version]
  82. Centelleghe, C.; Carraro, L.; Gonzalvo, J.; Rosso, M.; Esposti, E.; Gili, C.; Bonato, M.; Pedrotti, D.; Cardazzo, B.; Povinelli, M. The use of Unmanned Aerial Vehicles (UAVs) to sample the blow microbiome of small cetaceans. PLoS ONE 2020, 15, e0235537. [Google Scholar] [CrossRef]
  83. Meager, J. Marine wildlife stranding and mortality database annual report 2013–2015. Cetacean and Pinniped. Conserv. Tech. Data Rep. 2016, 1, 1–33. [Google Scholar]
  84. Meager, J. Marine wildlife stranding and mortality database annual report 2012. II. Cetacean Pinniped. Conserv. Tech. Data Rep. 2013, 2, 1–38. [Google Scholar]
  85. Meager, J.J.; Sumpton, W.D. Bycatch and strandings programs as ecological indicators for data-limited cetaceans. Ecol. Indic. 2016, 60, 987–995. [Google Scholar] [CrossRef] [Green Version]
  86. Parra, G.J. Behavioural Ecology of Irrawaddy, Orcaella brevirostris (Owen in Gray, 1866), and Indo-Pacific Humpback Dolphins, Sousa chinensis (Osbeck, 1765), in Northeast Queensland, Australia: A Comparative Study. Ph.D. Thesis, James Cook University, Townsville, Australia, 2005. [Google Scholar]
  87. Parra, G.J.; Jedensjö, M. Stomach contents of Australian snubfin (Orcaella heinsohni) and Indo-Pacific humpback dolphins (Sousa chinensis). Mar. Mammal Sci. 2014, 30, 1184–1198. [Google Scholar] [CrossRef]
  88. Weijs, L.; Vijayasarathy, S.; Villa, C.A.; Neugebauer, F.; Meager, J.J.; Gaus, C. Screening of organic and metal contaminants in Australian humpback dolphins (Sousa sahulensis) inhabiting an urbanised embayment. Chemosphere 2016, 151, 253–262. [Google Scholar] [CrossRef]
Figure 1. Map showing the sampling locations of snubfin dolphin groups (red dots), humpback dolphin groups (yellow dots) and mix species groups (blue dots) in the Fitzroy River Catchment along the central Queensland coast.
Remotesensing 14 00021 g001
Figure 2. Example of model covariates: (A) degree of arch, (B) degree of straightness, (C) degree of body roll and (D) edge certainty of the rostrum, blowhole, dorsal fin and fluke, scored from 1—Good, 2—Medium or 3—Poor (see Table 1 for definitions).
Remotesensing 14 00021 g002
Figure 3. Lateral view diagram of Australian snubfin dolphin (a) and Australian humpback dolphin (b) showing the morphological features used to define the start and endpoint of each morphometric measurement. Dorsal view diagram of morphometric measurements 1—Total body length from the rostrum to the notch in the fluke and 2—Length from the centre of the blowhole to the front of the dorsal fin for Australian snubfin dolphin (c) and Australian humpback dolphin (d).
Remotesensing 14 00021 g003
Figure 4. The predicted error in estimating the size of the replica associated with (left) the altitude treatments of the UAV and (right) the position of the replica in the image frame (center—quadrat 5, edges—quadrats 2, 4, 6, 8 and corners—quadrats 1, 3, 7,9). The letters above the figures represent statistical groupings of the data, with letter differentiation outlining a significant difference. i.e., ‘a’ is significantly different from ‘b’. The left plot shows that the predicted errors were significantly lower at 15 and 30 m compared to 45 and 60 m. The right plot shows that at the same altitude the position of the dolphin in the frame does not affect the predicted error.
Remotesensing 14 00021 g004
Figure 5. The predicted error in the precision of measuring total body length of snubfin dolphins associated with the degree of arch of the dolphin in the captured image. The (left) plot shows that measuring dolphins with a score of 1 for degree of arch returns higher precision in length estimates than if they have a degree of arch score of 3. However, model confidence was reduced after the removal of a statistical outlier, as shown in the (right) plot. The letters above the figures represent statistical groupings of the data, with letter differentiation outlining a significant difference. i.e., ‘a’ is significantly different from ‘b’, ‘a and b’ indicate no significant difference with group ‘a’ or group ‘b’.
Remotesensing 14 00021 g005
Figure 6. The predicted precision error of measuring total body length of humpback dolphins associated with edge certainty in the captured image. The (left) plot shows that measuring dolphins with a score of 1 or 2 for edge certainty is predicted to return a higher precision associated with length estimates than if they have a score of 3. However, model confidence was reduced after the removal of three statistical outliers, as shown in the (right) plot. The letters above the figures represent statistical groupings of the data, with letter differentiation outlining a significant difference. i.e., ‘a’ is significantly different from ‘b’.
Remotesensing 14 00021 g006
Figure 7. Total body length distribution of Australian snubfin dolphins from 201 individual adults and 28 individual juveniles sampled. Adult snubfin dolphins represnet 87.8% of the sampled population and juveniles represented the remaining 12.2%.
Remotesensing 14 00021 g007
Figure 8. Total body length distribution of Australian humpback dolphins from 62 indiviudal X adults, 10 individual juveniles, and 15 individual calves sampled. Adult humpback dolphins represented 71.3% of the sampled population, juveniles represented 11.5% of the sampled population and calves represented the remeaning 17.2%.
Remotesensing 14 00021 g008
Table 1. Description for body position and quality score used to grade the images extrapolated from UAV videos of dolphin groups. Definitions are loosely based on [37].
CovariableGood (1)Medium (2)Poor (3)Unmeasurable (4)
Degree of archNo visible bending or arching of the body. Animal is lying vertically at the surface.The head and/or tail of the animal is slightly bent downwards.The head and/or tail of the animal is significantly bent downward.The head and/or tail of the animals is bent downward to the point where it is not visible.
Degree of straightnessThe straight line from the rostrum to the fluke notch runs down the midline of the body axis along the dorsal fin and middle of the peduncle.The straight line from the rostrum to the fluke notch runs closer to the edge of the animal, not along the dorsal fin and middle of the peduncle.The straight line from the rostrum to the fluke notch runs outside of the edge of the animal, not along the dorsal fin and middle of the peduncle.The straight line from the rostrum to the fluke notch run completely off the animals, not along the dorsal fin and middle of the peduncle.
Degree of body rollDorsal fin aligned within the midline of the body axis, with equal amount of the body visible on both sides.Dorsal fin deviates slightly from midline, with larger amount of the body visible on one side.Dorsal fin deviates significantly from the midline, with only one side of the body visible.Dorsal fin is not visible, with only a section of one side and stomach visible.
Edge certainty Points being measured are both clearly visible.One of the points being measured is unclear.Both of the points being measured is not visible.One of the points being measured is not visible.
Table 2. The number of photographs extracted and analysed for Australian snubfin and humpback dolphins at each altitude treatment; 15 m, 20 m, 30 m, 40 m, and 50 m.
Altitude (m)Number of Photos
Snubfin DolphinsHumpback Dolphins
1528585
209727
307050
402846
503120
Table 3. Analysis of deviance table for the statistical models for accuracy of the total body length of snubfin and humpback dolphins, before and after the removal of outliers.
Fixed Effectχ2Dfp
Snubfin dolphinsArch7.83020.020
Roll5.01020.082
Snubfin dolphins: after removal of outliersArch7.83020.020
Roll5.01020.082
Humpback dolphinsEdge cert.11.43520.003
Straightness2.94910.086
Position5.12020.078
Humpback dolphins: after removal of outliersEdge cert.4.12520.127
Straightness3.83510.050
Position4.72820.094
Publisher’s Note: MDPI stays neutral with regard to jurisdictional claims in published maps and institutional affiliations.