Article

Remote Sensing Detection of Algal Blooms in a Lake Impacted by Petroleum Hydrocarbons

1
Scuola di Ingegneria Aerospaziale, “Sapienza” University of Rome, 00138 Rome, Italy
2
Core Facilities, Istituto Superiore di Sanità, 00161 Rome, Italy
3
Department of Food Biosciences, Teagasc, Moorepark, P61 C996 Cork, Ireland
4
Department of Infectious Diseases, Istituto Superiore di Sanità, 00161 Rome, Italy
5
Department of Foggia, Experimental Zooprophylactic Institute of Puglia and Basilicata Regions, 71121 Foggia, Italy
*
Author to whom correspondence should be addressed.
Remote Sens. 2022, 14(1), 121; https://doi.org/10.3390/rs14010121
Submission received: 16 November 2021 / Revised: 23 December 2021 / Accepted: 23 December 2021 / Published: 28 December 2021
(This article belongs to the Section Ocean Remote Sensing)

Abstract

:
The purpose of this study was to combine all available information on the state of Lake Pertusillo (Basilicata, Italy), both in the field and published, which included Sentinel-2A satellite data, to understand algal blooms in a lacustrine environment impacted by petroleum hydrocarbons. Sentinel-2A data was retrospectively used to monitor the state of the lake, which is located near the largest land-based oil extraction plant in Europe, with particular attention to chlorophyll a during algal blooms and petroleum hydrocarbons. In winter 2017, a massive dinoflagellate bloom (10.4 × 10⁶ cell/L) of Peridinium umbonatum and a simultaneous presence of hydrocarbons were observed at the lake surface. Furthermore, a recent study using metagenomic analyses carried out three months later identified a hydrocarbonoclastic microbial community specialized in the degradation aromatic and nitroaromatic hydrocarbons. In this study, Sentinel-2A imagery was able to detect the presence of chlorophyll a in the waters, while successfully distinguishing the signal from that of hydrocarbons. Remotely sensed results confirmed surface reference measurements of lacustrine phytoplankton, chlorophyll a, and the presence of hydrocarbons during algal blooms, thereby explaining the presence of the hydrocarbonoclastic microbial community found in the lake three months after the oil spill event. The combination of emerging methodologies such as satellite systems and metagenomics represent an important support methodology for describing complex contaminations in diverse ecosystems.

1. Introduction

Mixed contamination of inland waters is a new risk increasingly found in field investigation and monitoring [1,2], where detection of mixed contaminants complicates comprehensive human risk assessment and timely implementation of countermeasures. While most traditional risk assessment methods assume that components of a toxic mixture adhere to the concentration addition model to predict the degree of toxicity by the sum of the individual component toxicities [3,4,5,6], studies showed that interactions can occur altering the total toxicity, making it lower or higher than expected [7,8]. Synergistic mechanisms, not completely elucidated, may be of concern due to an improved affinity for target sites, increased persistence of toxic effects, but also production of variable toxic effects where single substances have no toxicity at all [9,10]. Effects of mixtures in the aquatic environment may even facilitate the overcoming of toxic organisms and stimulate their growth [11]. Petroleum consists of a complex mixture of macromolecules including polycyclic aromatic hydrocarbons (PAHs), toxic compounds whose input into the environment has increased extensively in the 20th century [10]. Due to their lipophilicity, they have the potential to accumulate in organisms [12,13] with potent mutagenic, teratogenic, and carcinogenic properties, as well as endocrine disrupting activity [14,15]. PAHs in fish are quickly metabolized to intermediates, which either bind to liver DNA or form conjugates for transfer to bile [16,17].
Fast sampling operations and specific analyses for each type of contaminant are needed to detect the presence of toxicants in complex mixtures. Due to their potent adverse effects on humans and the environment, compounds like heavy metals, petroleum hydrocarbons, organochlorine pesticides, and phytoplanktonic toxins may represent a serious problem in routine monitoring. Pollution events for such compounds, if not prepared for, may be beyond preventive control, causing severe damage before being detected. Extensive and in-depth routine controls are often cost-intensive and therefore inopportune in water with incidental presence of particular toxicants, like biotoxins from algal blooms or total petroleum hydrocarbons (TPH). A fast mixed complex detection may allow appropriate investigations on the status of aquatic communities affected by contamination, enabling detection of potential adversely affected environments and the planning of rapid and appropriate restoration measures.
Satellite Earth observation is a cost-effective means to assess ambient water quality in the euphotic layer at high spatio-temporal resolution, but for a limited number of parameters [18]. Importantly, practical usage constraints [19] were removed since the latest European Copernicus program started. The Sentinel-2 satellite is part of the European Copernicus program, providing optical remote sensing data at an unprecedented spatio-temporal resolution. With its 13 spectral channels, the mission’s imager can capture water quality parameters, such as surface concentration of chlorophyll and measure of turbidity (or water clarity), which are valuable proxies to indicate health and pollution levels, particularly harmful algal blooms. Algal bloom detection and population dynamic studies through remote sensing techniques have been carried out since 1991 [20,21], moving on from investigations on ocean seawaters [22] to analyses on freshwaters, with increasingly refined remote sensing techniques in the latter case to capture the presence of the major risk factors, represented by Cyanobacteria and their toxins [23,24]. Satellite systems are demonstrating their full potential in the field of algal toxicology, with collaborations in large epidemiological studies in extensive territories allowing advances in pathological hypotheses [25], which are subsequently confirmed by laboratory studies [26].
For smaller inland water bodies, data acquired by satellites Sentinel-2A and 2B [27] since 2015 have opened new control/monitoring prospects. Several investigators have already demonstrated their capabilities for water quality monitoring [28,29,30,31,32,33], particularly in using band 5 at 705 nm, which resolves the secondary reflectance peak related to pigment concentrations [34]. Sentinel-2 was also used to identify oil spills in the sea [35], and several comparable studies are available for other optical sensors [36,37,38]. The visible and infrared reflectance shape features of pure water and oil are relatively similar, and, often, magnitude differences depend heavily on illumination conditions. Therefore, the use of active microwave sensors is more frequent for marine oil spill identification [39]. However, a recent study on inherent optical properties of dispersed oil in water suggests that small droplets with a size distribution around 0.5–1 μm diameter can significantly affect visible and infrared reflectance [40].
Oil extraction techniques may release several substances in groundwater, including heavy metals and nitrogenous compounds, which may reach water bodies [41]. According to analytical controls of the regional ARPAB (Regional Agency for Environment Protection of Basilicata), Lake Pertusillo mean levels of total N are generally not high [42], showing a mesotrophic state that is predominant in many Italian artificial reservoirs. However, periodic fluid releases in lake groundwaters from wastewater injection operations could explain the intermittent high N/P ratios in the lake waters, due to the use of nitrogenous compounds which improve the performance of the drilling fluids. The short renewal time of Lake Pertusillo is unfavorable for creating a stable eutrophic environment allowing phytoplanktonic cyanobacterial blooms. On the contrary, fast-moving species capable of encysting in cases of adverse environmental conditions, like freshwater dinoflagellates, are more capable of taking advantage of nutrient concentration fluctuations [43] in absence of grazers more sensitive to oil contact, as is in the case of marine communities [5].
In 2012, a research project by the Italian Ministry of Health on the ichthyic fauna in Lake Pertusillo detected cyanotoxins, heavy metals, polychlorobiphenyles, and hydrocarbon contaminations in several fish species sampled in the lake (http://docplayer.it/1712392-Gli-animali-quali-indicatori-biologici-dell-inquinamento-ambientale-strategie-di-monitoraggio.html- [44]) (accessed on 15 November 2021). In the same years, several extensive dinoflagellate blooms occurred in the lake: one in 2010 covering the entire surface; and an extended algal bloom occurring in Lake Pertusillo again in February 2017. Local newspapers reported the event after video imagery was acquired with drone operated by a private citizen.
In May 2017, ENI publicly admitted a crude oil spill of more than 400 tons from the ENI Val d’Agri oil hub of Viggiano between August and November 2016. During 2017, civic associations and the Regional Agency for Environment Protection of Basilicata (ARPAB) performed analyses of lake waters for the determination of hydrocarbons and phytoplankton [45,46], following which metagenomic study of Lake Pertusillo identified a lake microbial community shaped by the presence of hydrocarbons [47]. The occurrence of several known hydrocarbon pollution events in combination with periodic algal blooms in Lake Pertusillo provided an opportunity to test new methods for high-frequency monitoring in untoward environmental incidents, which may further improve warning and remediation strategies. For this purpose, we chose a combination of Sentinel-2 data, which are available at 10 m to 20 m spatial and 5 days temporal resolution, and ancillary water quality analyses to characterize and quantify the presence of different pollutants in water samples.

2. Materials and Methods
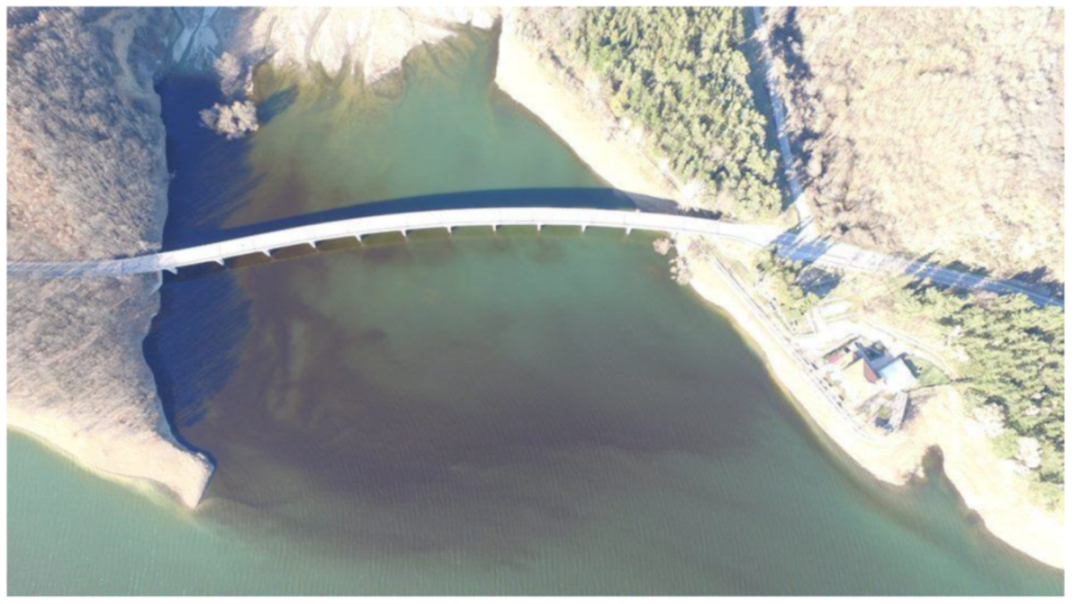
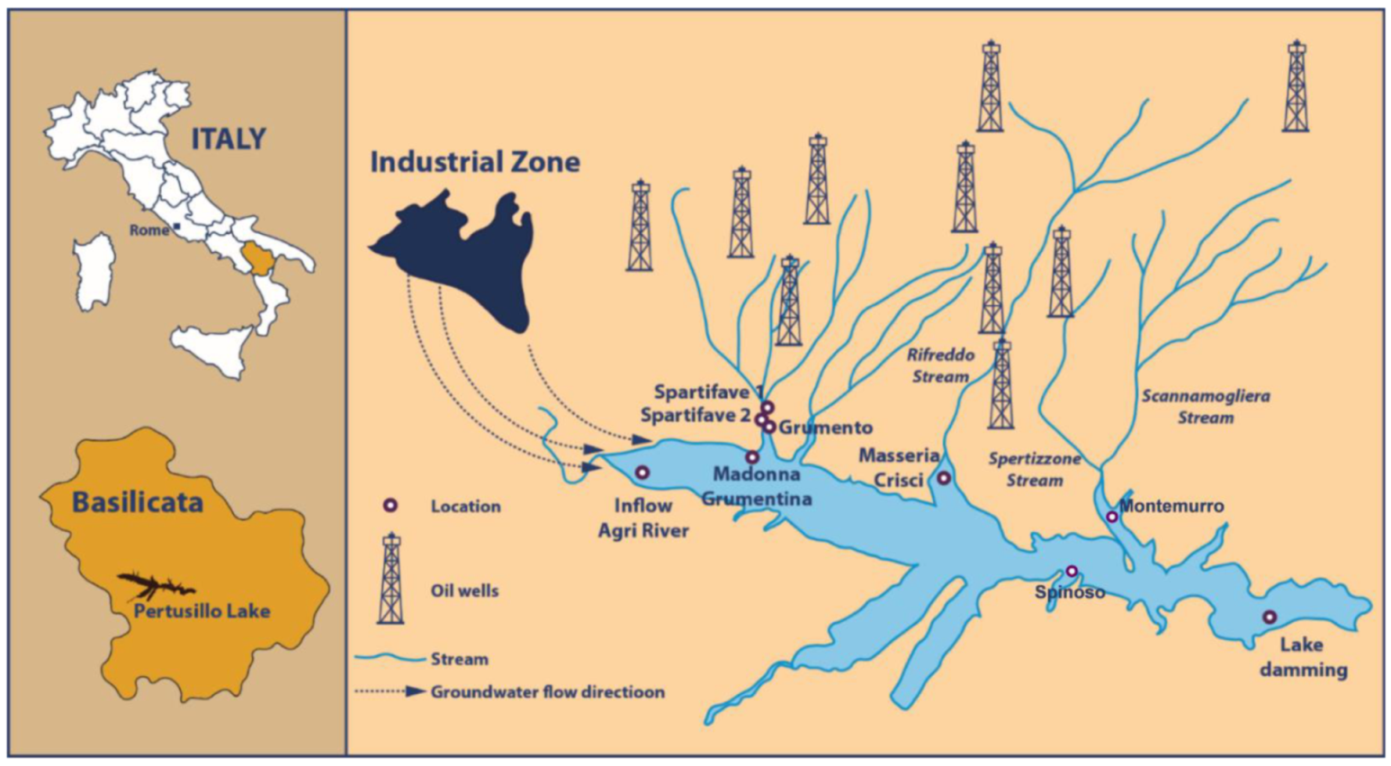
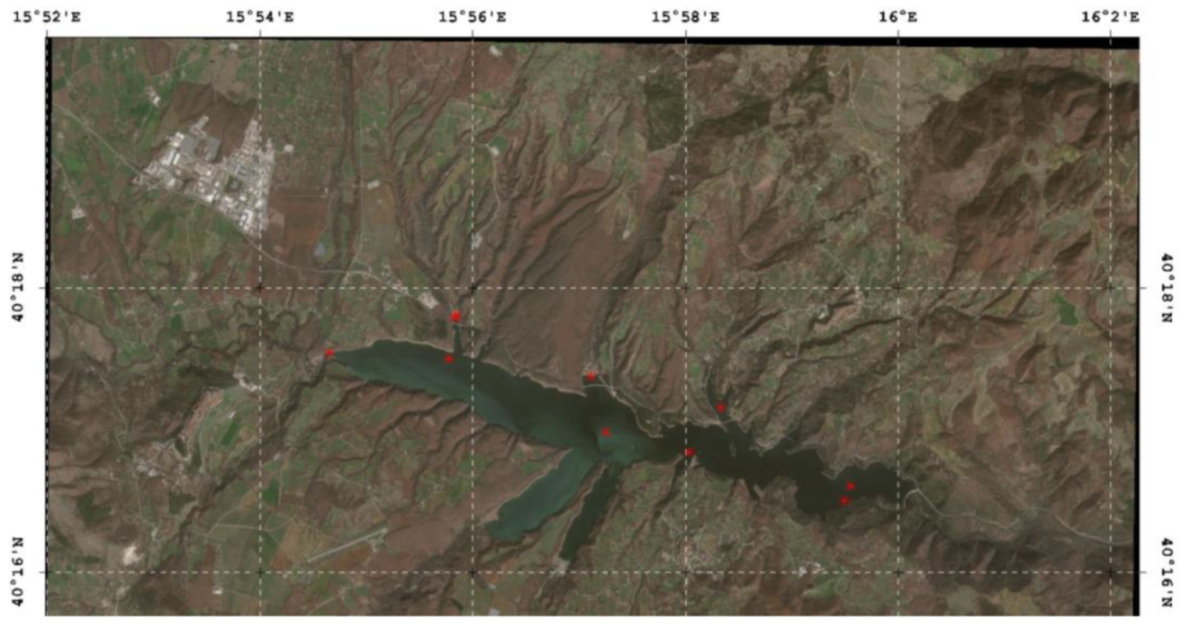
2.1. Study Site

The lake “Pertusillo Rock”, popularly named “Pertusillo”, is an artificial reservoir situated in the territories of Grumento Nova, Montemurro, and Spinoso towns, Basilicata region (Southern Italy) (Figure 1). The lake was created between 1957 and 1962 as a drinking water reservoir by damming the Agri River. It is serviced by the Apulian Aqueduct that provides water to 3.5 million people. Its surface area is 7.5 km2, its maximum depth is 90 m, and the maximum volume is 155 × 106 m3. The renewal time is assumed to be six months on average [48]. The lake is a site of community interest (SCI) inside the Appennino Lucano-Val d’Agri-Lagonegrese National Park, and is used for sport fishing, national rowing competitions, hydroelectric power, and irrigation of more than 35,000 hectares between Basilicata and Apulia regions. Since the nineties, the water basin and groundwaters of the lake have been impacted by the oil extraction activities of the Italian company ENI, which drilled more than 27 oil wells in the Val d’Agri area (https://www.eniday.com/en/education_en/largest-oil-field-europe/) (accessed on 15 November 2021).
The characteristics of the oil extraction plant near Lake Pertusillo led the Italian Ministry of the Environment to label it as a sensitive one, capable of causing major accidents (http://www.minambiente.it/sites/default/files/archivio/allegati/stabilimenti_rischio_industriale/2018/basilicata_0.pdf) (accessed on 15 November 2021). Since 2010, several studies and field analyses have detected anomalous heavy metal and hydrocarbon presence in lake sediments and water [49,50], with induced seismicity due to wastewater injection [51,52]. Furthermore, large scale and repeated seasonal fish deaths were observed in the lake during the last decade.

2.2. Satellite Monitoring

The Sentinel-2 satellites are part of the European Copernicus program and provide high-resolution optical data in unprecedented quality and quantity. Sentinel-2A (S-2A) was launched on 23 June 2015; Sentinel-2B (S-2B) followed on 7 March 2017. Both platforms carry a multi-spectral instrument (MSI) that acquires reflected solar radiance in 13 bands between 440 and 2200 nm spectral wavelength. The spatial resolution is 10 m for a red, green, blue, and near-infrared bands, 20 m for six more bands in the NIR (705–865 nm) and short-wave infrared (SWIR, 1600–2200), and 60 m for three other bands (443, 940, and 1375 nm). The satellite orbits schedule a 10-day revisit time in single and a 5-day revisit time in paired operations, with image acquisitions around 10:00 UTC, i.e., 11:00 and 12:00 local winter and summer time, respectively. For Lake Pertusillo, the S-2A/S-2B acquisition frequency was even doubled (≈2.5 days in average), because it was located in two adjacent orbits’ overlapping sensor swath (granules: T33TWE and T33TXE).
Sentinel-2 has a very large potential for inland water remote sensing, because it combines the high spatial resolution of traditional satellite sensors (e.g., Landsat and SPOT) with the increased temporal and spectral resolutions required for aquatic remote sensing. We use an automated processing chain to derive corresponding parameters for large time intervals. The atmospheric correction on the images acquired before the systematic release (March 2018) of the Sentinel images at level 2A (atmospherically corrected) was performed by using the Sen2Cor tool. This tool is available in SNAP (Sentinel Application Platform) software, made available by ESA, or can run in a stand-alone version.
In order to identify hydrocarbon patches in S-2A imagery, we investigated atmospherically corrected reflectance spectra images acquired at different times from 2016 to 2021 (21 images were analyzed), in particular, during the extreme hydrocarbon pollution event in February 2017.
As an indicator for biological productivity, we applied the Maximum Chlorophyll Index (MCI) algorithm (Equation (1)) developed for MERIS sensor adapted to the Sentinel-2 spectral bands [53]. This peak height algorithm can be used with chloropyll-α (chl_a) values over 10 mg/m3 [54,55] by using reflectances instead of radiances [54]:
M C I = r 705 r 665 705 665   740 665 · ( r 740 r 665 )
where rxxx represents the spectral reflectance at the xxx wavelength. Taking into account the information on the inherent optical properties of dispersed oil in natural waters and the series of reflectance spectrum collected in 2011 by a group of the University of Rome and IMAA CNR on the lake Maracaibo (Venezuela) (Figure 2), where small oil spill events are frequent due to the high exploitation of the lake for oil extraction, we defined a VIS-NIR reflectance ratio Index (VNRI) that relates the reflectance in the green band (560 nm, MSI channel 3) with those in the red (665 nm, MSI channel 4) and red edge band at 740 nm (MSI channel 6), Equation (2):
V N R I = 2 × r 560 r 665 r 740 r 560 + r 665 + r 740
Band 5 at 705 nm was not included because it was affected by the secondary chlorophyll reflectance maximum (Figure 2). The index has been designed in a way that higher positive values correspond to denser oil polluted waters. It should be noted that the VNRI tends to produce false positive evidence in shaded areas, which could occur due to topography effects or Sen2cor limitations in cloud shadow identification. It is also sensitive to atmospheric correction artifacts for less favourable observation conditions, namely where visible reflectance is strongly underestimated. For the present study, we computed VNRI indices on Level 2, atmospherically corrected, S-2A and 2B images acquired between June 2016 and May 2021.

2.3. Phytoplankton Detection
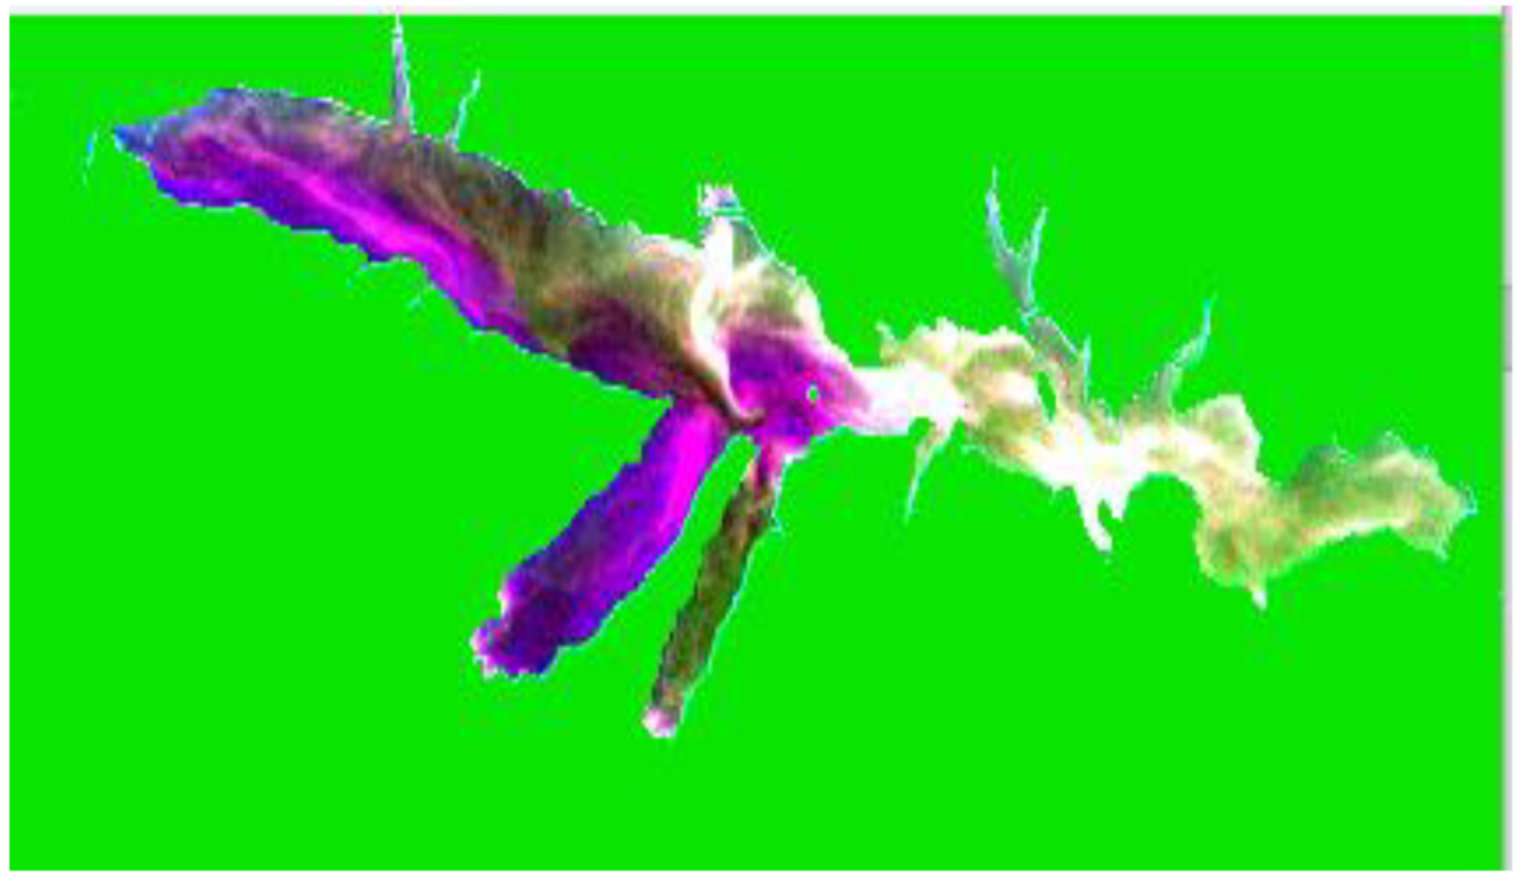
On 27 February 2017. water samples for biological analysis were collected from several surface stations situated close to the lake shore near Masseria Crisci using 1 liter Pyrex glass bottles (Figure 1, and Table 1). Subsequently, the samples were stored in ice boxes and transported to the laboratory. For microscopic observations, subsamples were analyzed by an inverted microscope (Leitz Labovert FS) according methods described previously by Lund et al. [56] and Utermőhl [57], using 25 mL sedimentation chambers for phytoplankton identification and cell density estimation.

3. Results

3.1. Data Collection

Table 1 includes data collected from sampling carried out and published by the Environmental Protection Agency of the Basilicata Region (ARPAB) and by civic associations of the territory from 24 February 2017 to 3 August 2017 [45,46]. The ARPA data refer to characterization of the dinoflagellate (phylum Dinoflagellata) community of algal bloom found in the lake. Included data refers to dinoflagellate cells and chlorophyll a detected at the surface. The values are expressed in cells/L and µg/L, respectively. In the sampling of 27 February 2017, characterization of dinoflagellates at the genus level identified Peridinium sp. as the most abundant component present in the algal blooms with values between 4 × 10⁵ cells/L for Masseria Crisci, up to 6 × 10⁶ cells/L for Spinoso 27 February 2017. Microscopic observation allowed characterization of the dinoflagellate at the species level, highlighting Peridinium umbunatum in the algal bloom of 27 February 2021. This species was present in very high quantities, up to 10·× 106 in the Masseria Crisci site (see Table 1, ISS sample). From the data collected in the Table, a proportional association was observed between dinoflagellate cells and the quantity of chlorophyll a determined.
Table 1 also shows data collected by civic associations for the presence of Total Petroleum Hydrocarbons (TPH). The sampling sites analyzed, although in some cases they show the same denominations (i.e., Masseria Crisci and lake damming), have different geographic coordinates from the sites sampled by ARPAB. The results in the table show, albeit in small numbers, the presence of hydrocarbons in the lake on 27 February 2017 and in other samples analyzed during the same year. All of these results make the suitability of these data for Sentinel-2 plausible which, through its multispectral channel, is able to identify chlorophyll a from the algal bloom, and potentially detect hydrocarbons in the lake.

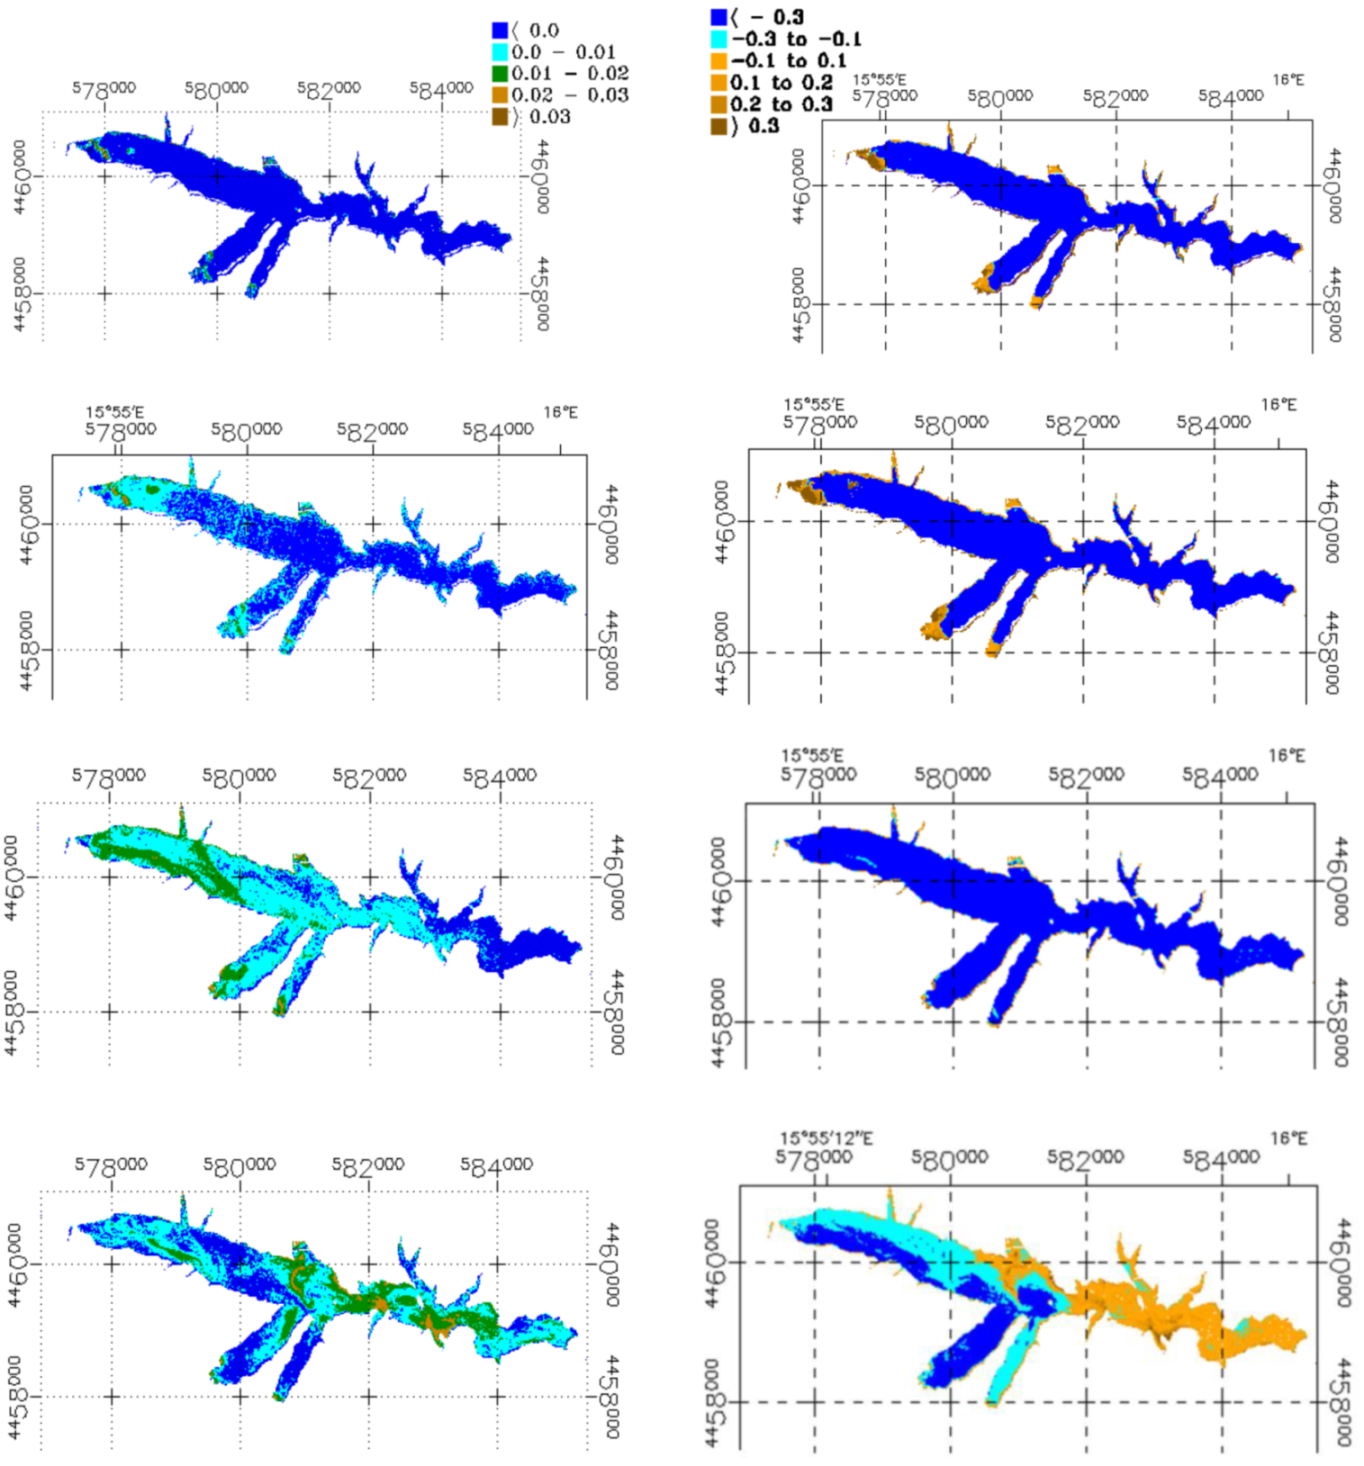
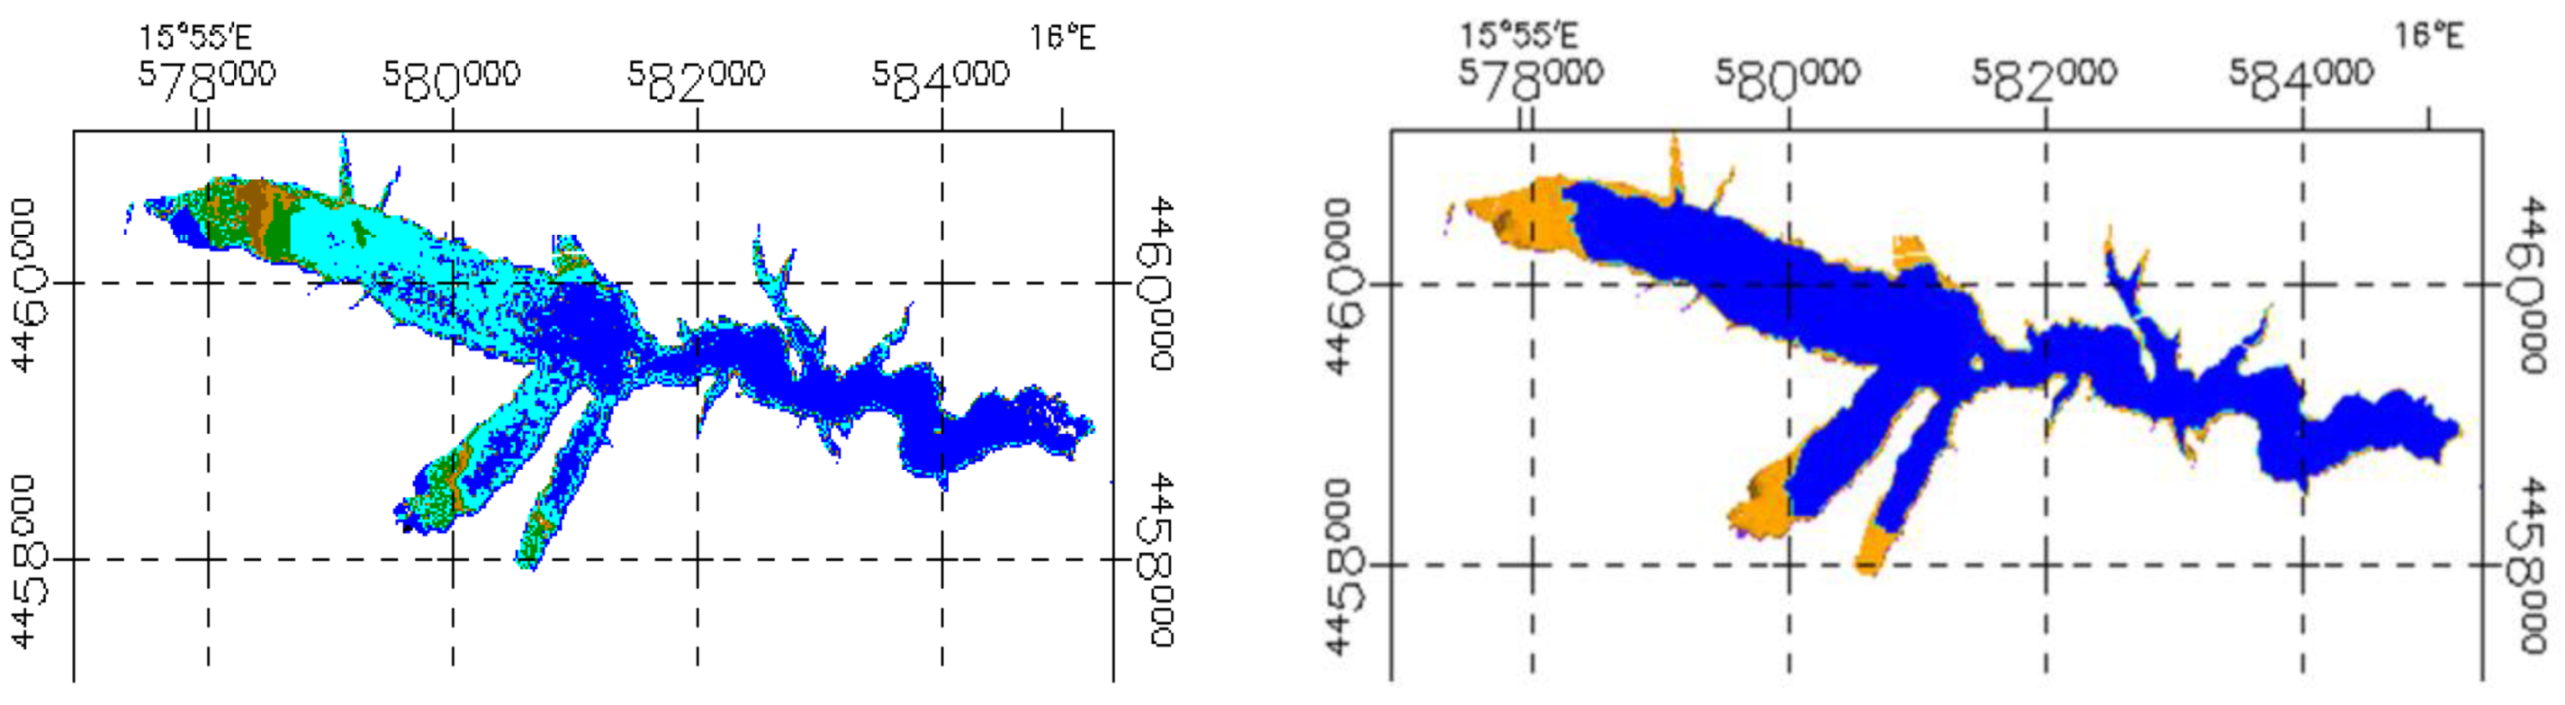
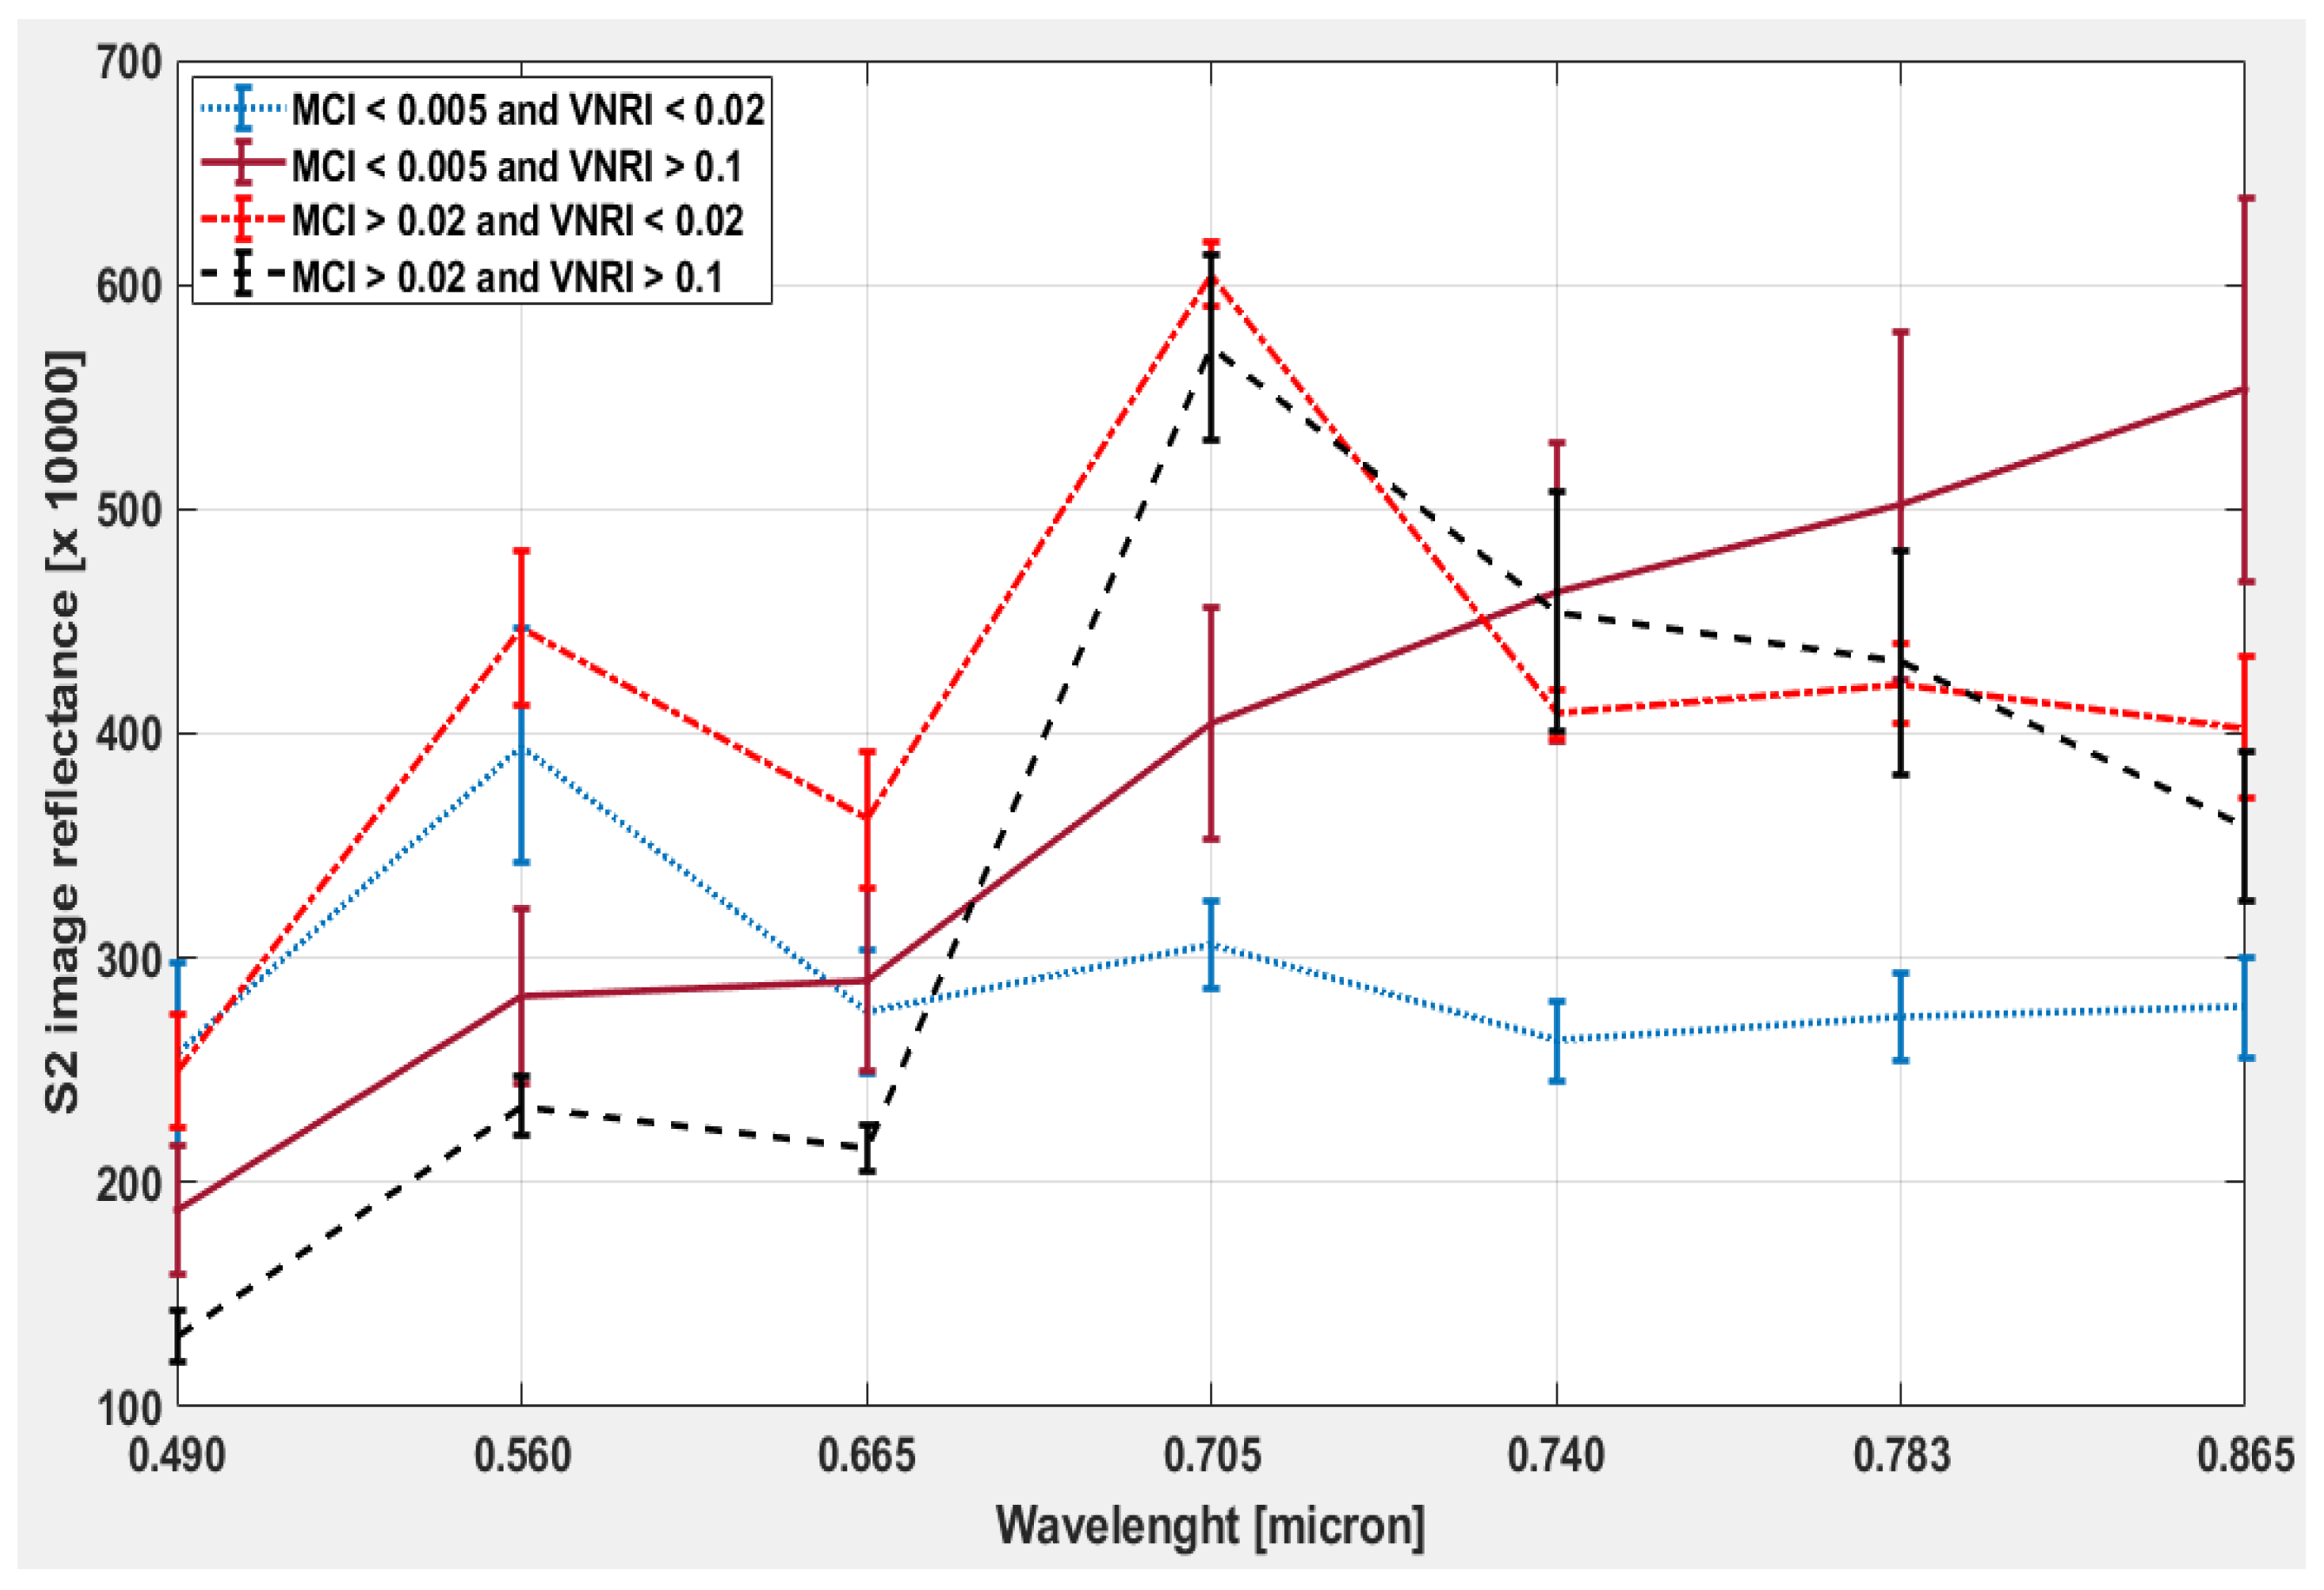
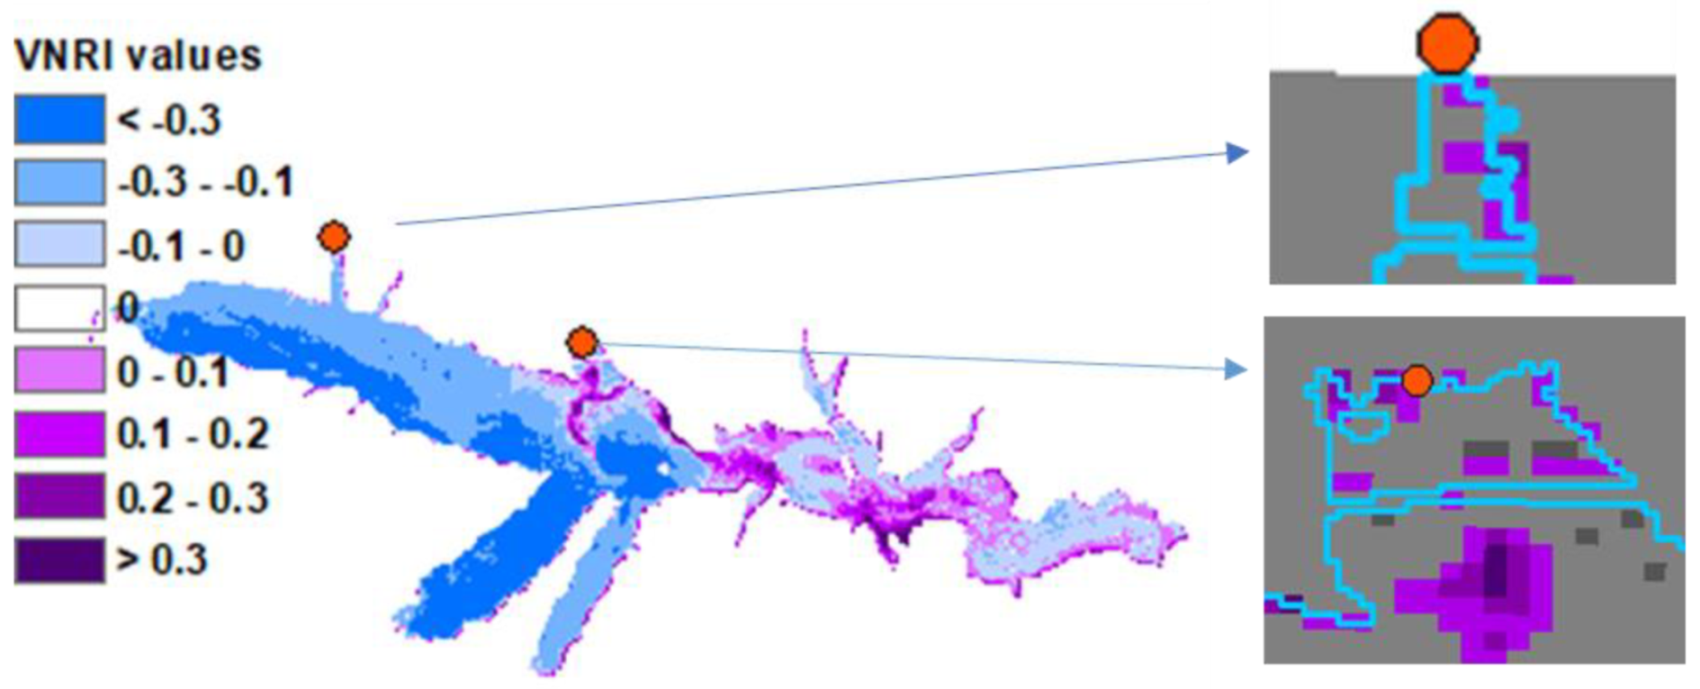
3.2. Sentinel-2 Imagery

In the image acquired on 27 February 2017, the most prominent feature in apparently polluted areas is that reflectance is relatively low in the visible (Figure 3 shows the 27 February 2017 S2 true color image of the lake), but extraordinarily high in NIR wavelengths (Figure 4). According to Haule et al. [40], small hydrocarbon droplets in the order of 0.5–1 µm have decreased absorption with increased wavelength, while scattering increased with wavelength. The corresponding simulated reflectance was significantly increased at 700 nm. Although their data only covers the 400–700 nm interval, it suggested that water–hydrocarbon mixtures can compensate for the strong absorption by pure water at NIR wavelengths, and thus create the extraordinary spectral reflectance shapes observed on 27 February 2017. Alternative explanations for these reflectance shapes are either errors in the atmospheric correction, or the presence of sub-pixel scale floating material. The former can be ruled out due to the spatial pattern in the lake and the low atmospheric turbidity; the latter, due to the drone observations (Figure 4). Spectral reflectance with NIR maxima can also be found in water with extremely high colored dissolved organic matter (CDOM) absorption [58], but they have a much lower magnitude.
Before proceeding with the analysis of results, we had to confirm that the oil sensitive index (VNRI) was not correlated with the Maximum Clorophyll Index (MCI), which allows estimation of the presence of chlorophyll in the water. This is required to confirm that the same phenomenon (presence of high chlorophyll concentration) was not being measured in two different ways. This was done by assessing the correlation level between these two indices. Figure 5 shows correlation between VNRI and MCI for the image corresponding to the day of the alleged high oil concentration presence (27 February 2017) and another day of relatively clear water (1 July 2021). It was observed in both cases that there was no correlation at all between the two indices values (R2 < 1).
Concerning the data of 27 February 2017, the VNRI in the west of Lake Pertusillo (Figure 6) remains just below zero in the Agri River inflow, but there is a striking vortex in the lake’s center, just south of the bay shown in Figure 4 (image taken by a drone). The same applies to the eastern half of the lake, where VNRI shows spatial patterns characterized by high values of the index around 0.3.
When comparing the VNRI products’ spatial patterns with those of the MCI product (Figure 6 and Figure 7), there were several areas where suspected hydrocarbon pollution and the primary productivity indicators converged. These are the areas with the highest VNRI levels, in the lake center and to its east. However, productivity remains low in areas with moderate VNRI levels in the very east, the northern bays and the eastern bay on the south side, where reflectance increases strongly and often continuously with wavelength between 665 and 865 nm (Figure 7). On the contrary, there were locally increased pigment levels in the western bay on the south side and in the west, where NIR reflectance decreased sharply above the secondary chlorophyll-a reflectance peak (Figure 7, lower).
When extending the analysis to all other S-2A images since June 2015, the first evidence of hydrocarbon pollution occurs in the image of 9 December 2016 (Figure 6). On that day, locally increased VNRI occurred in a 100 m small hotspot with elevated VNRI and MCI near the Agri river estuary. On the next cloud-free image of 26 December 2016, the same hotspot had roughly doubled in size. A spot with high VNRI values appeared in area of the Agri river inflow, whereas MCI showed an increase of the Chl-a content (Figure 6). After a longer cloudy period, a large-scale algae bloom in the lake was observed on 17 February 2017. MCI increased widely, while the VNRI increased only very locally in northern and southern tributary values, and along a suspect dark flow mark across the western basin.
On 3 August 2017, Sentinel-2A satellite image showed the contemporary presence of TPH and a moderate phytoplankton bloom in the proximity of the Agri River inflow (Figure 6).
Figure 8 and Figure 9 show corroborations between the values reported in Table 1 and the satellite detections between MCI and chlorophyll a, and VNRI and TPH respectively. The MCI values obtained by Sentinel-A show linearity with ground chlorophyll a values in four out of four stations except in Station 5 “Grumento”, where the reported chlorophyll a value was 8 µg/L.
The corroboration between TPH values (see Table 1) and VNRI values shown in Figure 9 indicate the presence of hydrocarbons at the “Spartifave 2” and “Masseria Crisci” stations, where the TPH values were 213 and 286 µg/L, respectively. Note that these were the only two samples that were taken during the satellite investigation on 27 February 2017; however, similar results can be observed for the sampling of 3 August 2017 when the TPH content at “Lake damming” (Table 1) was 87 µg/L (Figure 6). Although the VNRI data for hydrocarbons do not allow quantization as for MCI and chlorophyll a, the correspondence between the high values of VNRI and TPH, even for a few samples, provide strong indications about the suitability of the VNRI used for TPH detection.

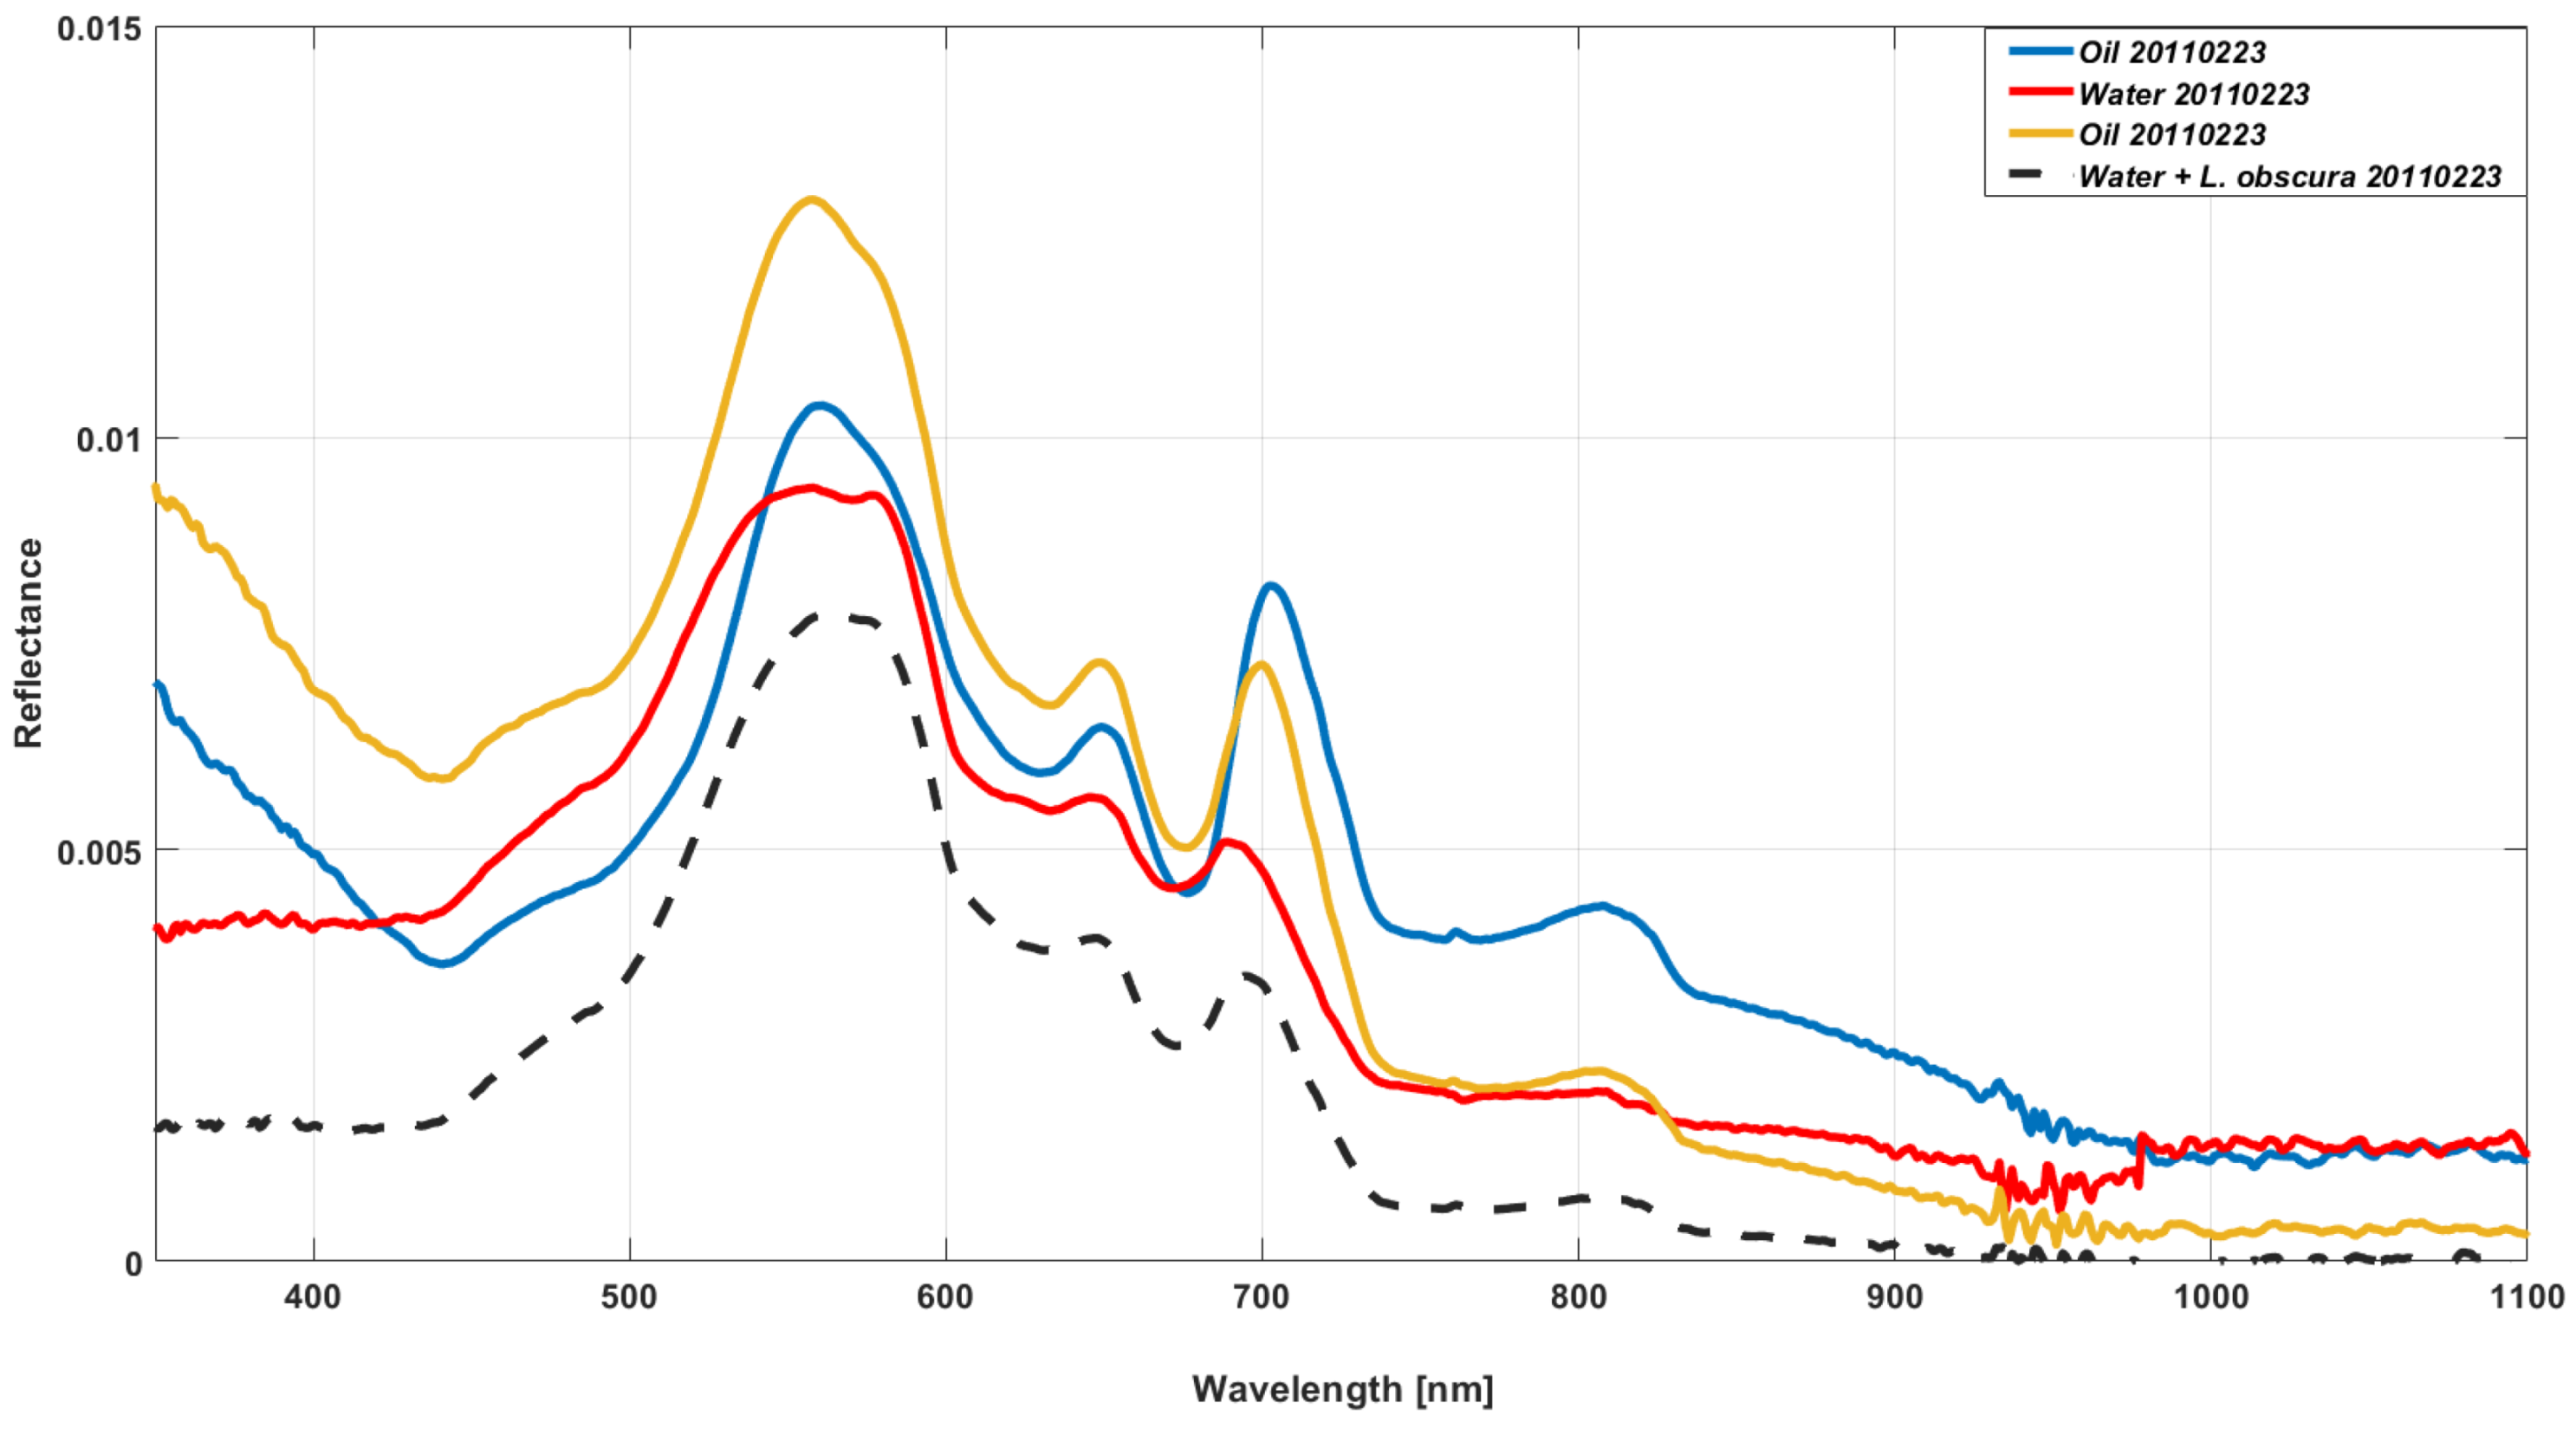
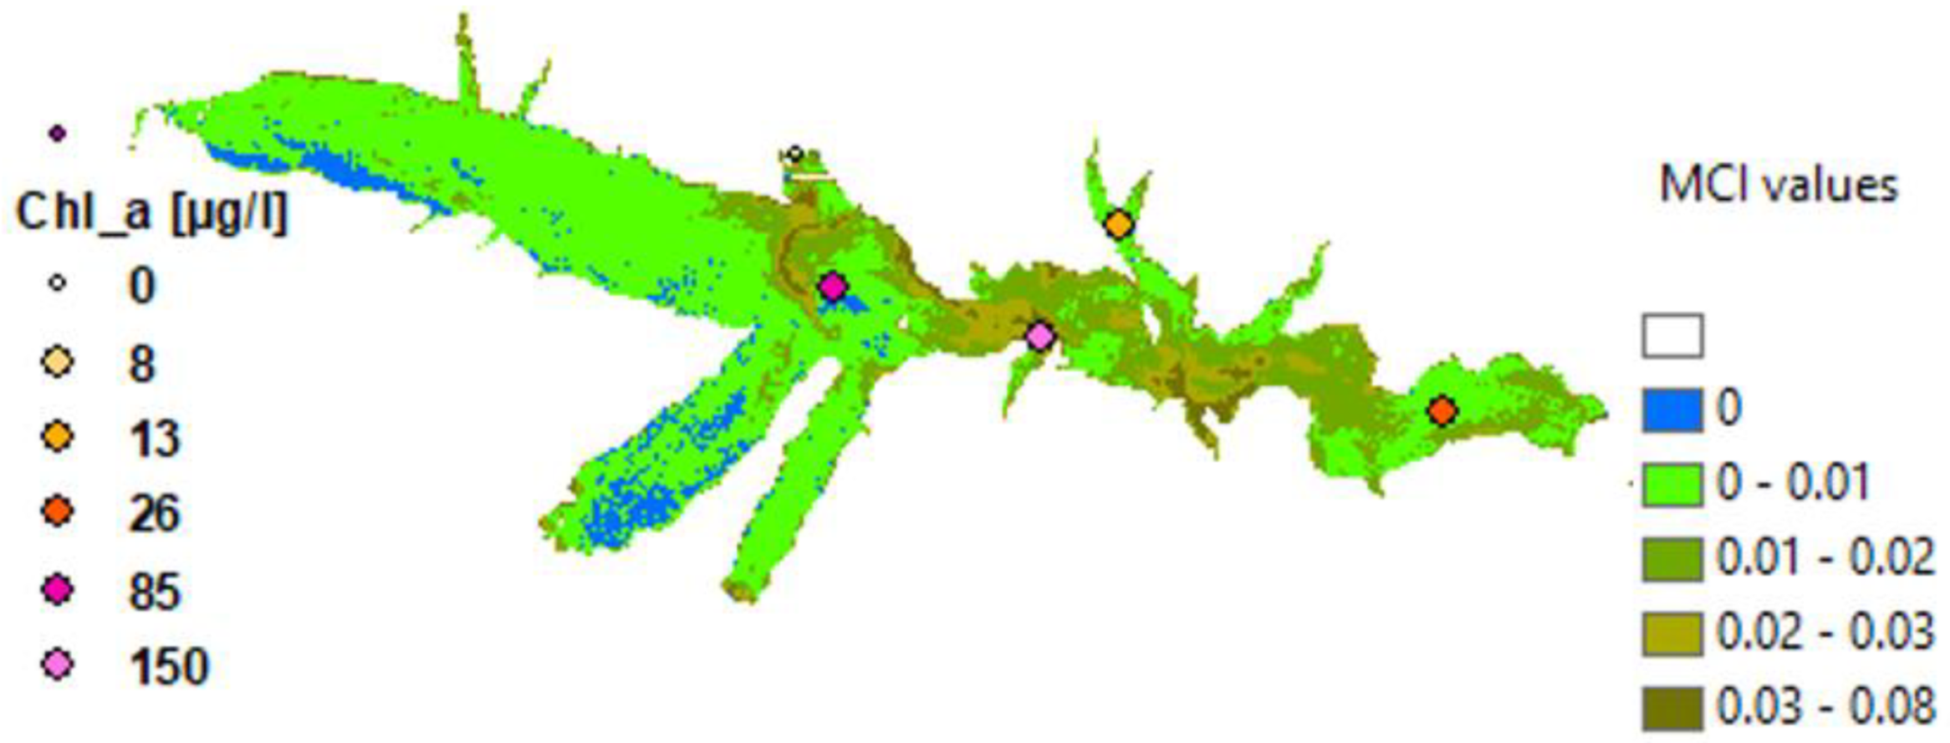
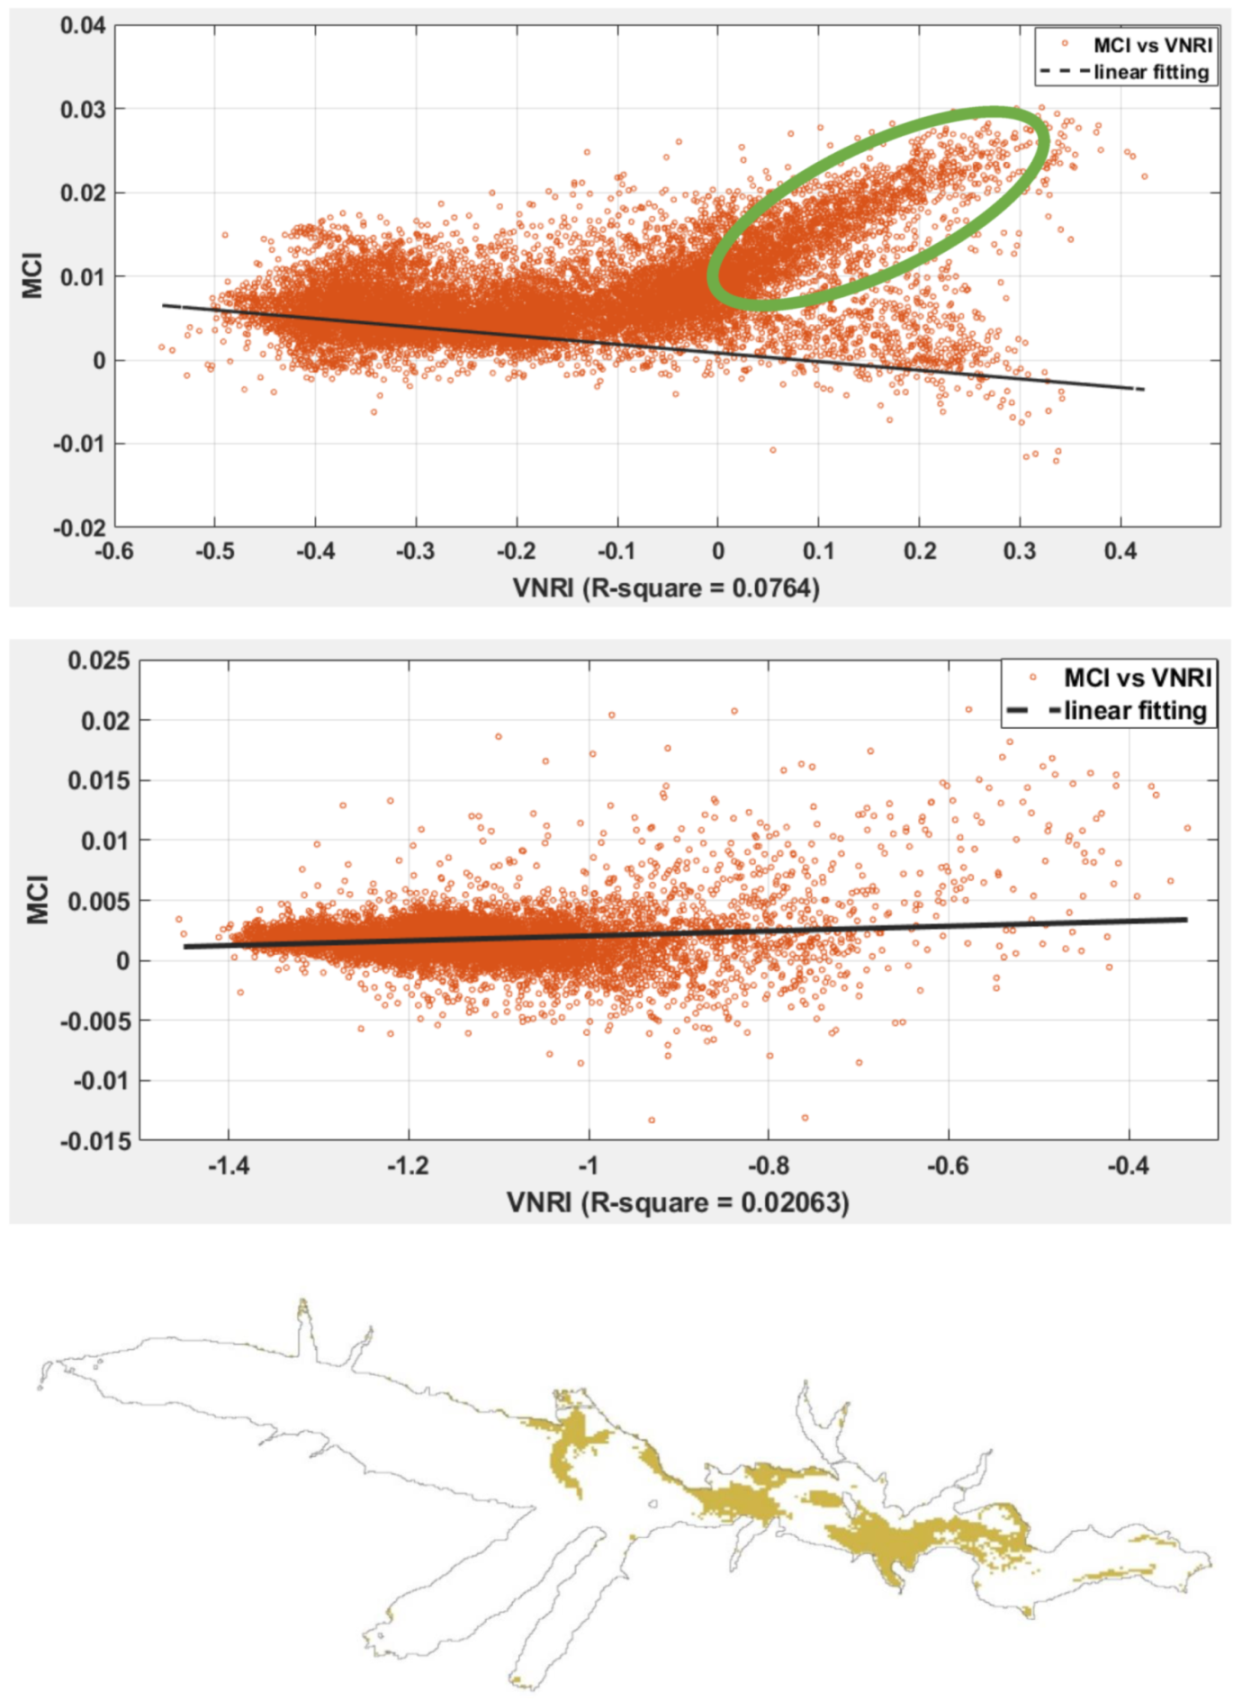
3.3. Phytoplankton Detection

Previously, ARPAB reported an algal bloom of the genus Peridinium sp. (Table 1). Microscopic observation of 27 February samples showed the presence of a massive and monospecific bloom (10.4 × 10⁶ cell/L) of the dinoflagellate Peridinium umbonatum Stein 1883. Another species of this class, Ceratium hirundinella (O.F. Müller) Dujardin 1841, showed intense blooming in May 2010 and 2011 in the same lake. In 2012, a bloom of the dinoflagellate Peridinium bipes var. globosum Lindemann 1918 was also detected. All these dinoflagellate species are known components of the Pertusillo phytoplankton community [59].
Freshwater dinoflagellates may originate blooms in eutrophized waters with high N/P ratios, where the N requirement of these species may be satisfied without need to commence feeding [60,61].
Lake chemical analyses performed by local civic associations in the same sampling station in February 2017 confirmed this aspect, showing a total N value of 6.65 mg/L, and a P-PO4 value of 52 µg/L, while similar analyses in May 2011 showed nitrate values up to 2.27 mg/L and total P values under detection limits of 50 µg/L [3].
Another role in bloom development may be played by the reduction in grazing pressure when zooplankters were affected by the oil [4]; recent in vitro studies related to marine dinoflagellate species confirmed this hypothesis [5], proposing a new cause of environmental degradation linked to periodic oil spills in the sea.

4. Discussion

In the Lake Pertusillo case study, satellite Earth observation was applied for the first time to identify pollutants related to hydrocarbon emissions in freshwater, in a manner that allowed for near-real time monitoring. Sentinel-2A observations assessed ecosystem conditions, indicating a eutrophic status due to the effects of oil spills on algal populations. Furthermore, we previously carried out metagenomic studies on polluted samples from Lake Pertusillo which detected the presence of a hydrocarbonoclastic microbial community, thereby confirming the polluted state of the lake and indicating a model of a microbial community impacted by hydrocarbon pollution [47]. Collectively, these data demonstrate that satellite systems have the potential to detect natural contamination phenomena, such as algal blooms and anthropogenic pollution, as oil spills.
The presence of huge algal biomasses, even if not toxic, during blooms in a lake used for drinking water, raises the need to activate adequate purification/filtration measures in order to avoid potential passage of trihalomethanes in water supply networks. In this case, fast and frequent monitoring of developing blooms may allow prevention of risks.
The water of Lake Pertusillo provides drinking water for more than three million people, with the presence of this basin in the vicinity of an oil extraction plant posing serious challenges in public health and environmental monitoring. Establishing new programs for the protection of delicate ecosystems remains a current and future challenge. Fine-scale satellite monitoring and metagenomics characterization are sophisticated tools for environmental preservation, as well as for studying changes in ecosystems during and after pollution events. In this study, the availability of Sentinel-2 satellite data made it possible to carry out retrospective studies. The images of hydrocarbon contamination highlighted with our satellite cold case analysis on 27 February, may represent the original event that gave rise to the formation of the hydrocarbonoclastic microbial community highlighted in our previous study [47]. Using metagenomics and metabolic reconstruction of the lake community, we showed that after 3 months (May 2017) from the oil spill event (27 February), the lake had high levels of Hydrogenophaga, Acidovorax, Reyranella, and Variovorax. These microorganisms are well known degraders of recalcitrant hydrocarbons and frequently possess genetic determinants involved in mineralization of aromatic compounds like PAHs (polycyclic aromatic hydrocarbons), chloroaromatics, nitroaromatics, and sulfonated aromatic compounds. Only few metabolic pathways for degradation of aliphatic petroleum hydrocarbons were detected. These microbial communities specialized in the degradation of aromatic substances are generally found months after a hydrocarbon spill, while the initial stages are dominated by microbes specialized in degradation of aliphatic substances [62,63]. Satellite data confirm the presence of hydrocarbons and algal bloom of dinoflagellates (Peridinium umbonatum, Table 1) in lake waters on 27 February 2017. The occurrence of marine phytoplankton blooms after massive oil spills were already detected by remote sensing in recent years, using MODIS normalized fluorescence line height (nFLH) data [64]. The link between these detections and the ability of some dinoflagellate marine species to grow faster in the presence of oil mixtures was established in previous studies [5]. Our study evidenced behaviors of dinoflagellate freshwater species similar to those detected by Hu et al. in marine species [12].
Although we did not directly combine metagenomics with Sentinel-2 images in this study, the presence of temporal microbial biosensors of pollutants provided a rationale for temporal satellite search of the oil spill in the lake. Combined satellite and metagenomic monitoring in environmental changes have been used in other studies. Hisakawa et al. showed that Franz Josef Land’s Arctic red snow is the result of a microbial succession dominated by Chlamydomonas nivalis, a unicellular, red-colored photosynthetic green algae [65]. Comparisons with white snow communities at other sites suggest that white snow and ice were first colonized by fungal and virus dominated communities, and subsequently followed by C. nivalis present in red snow. Satellite images with spectral reflectance data were used to approximate snow and ice cover and red algae abundance, and showed that red snow covers up to 80% of the surface of the snow and ice fields in Franz Josef Land. C. nivalis supports a local food web that expands with rising temperatures, with widespread potential impacts on alpine and polar environments around the world. The study integrated satellite and metagenomic data and represents a valid tool for monitoring the effects of climate change in the Alpine and polar regions [65].
Francini-Filho et al. monitored iron tailings plume impacts in the marine metagenome through satellites after the Fundão dam rupture, releasing 50 million m3 of tailings into the Doce River, in the state of Minas Gerais, Brazil [66]. The huge volume of mud spread along the river and reached the Abrolhos Bank reef, 17 days after the disaster. Although the authors do not highlight substantial changes in the microbiome in the coral reef, these technologies could represent a valid support for these ecosystems, and be useful for preparing plans for the restoration of anthropogenic perturbations in the environment.

5. Conclusions

Oil spills in groundwater and algal blooms in lakes are generally occasional and accidental occurrences and do not allow sufficient preparation to ensure safe periodic controls. On the other hand, the choice of continuous surveillance plans translates into increased costs that might not be indefinitely sustainable. The need to detect the presence of specific contaminants in a timely and cost-effective manner for inland waters is a pertinent problem, resolution of which would allow better protection of ecologically vulnerable zones and facilitate reduced recurrence of anthropogenic hazards. The use of civil satellite monitoring and the setting of new sensors capable of providing fine scale resolutions as well as precise quantifications of biological and chemical compounds has been shown to be one possible solution. In our study, oil pollution and algal blooms were detected using Sentinel-2 satellites, verifying image consistency with land data. Sentinel-2A was able to detect chlorophyll presence, and qualitatively confirm TPH presence. Satellite data presented in this study confirmed that the hydrocarbon spill may have occurred in a period characterized by the high VNRI values, as detected by Sentinel-2A on 27 February 2017.
The images of hydrocarbon contamination highlighted with satellite on 27 February may represent the original event that led to the formation of a hydrocarbonoclastic microbial community highlighted in a previous study. Satellite observation of 27 February in our study could image the initiation of a succession of lake microbiomes that initially degraded aliphatic substances and which, after three months, evolved towards communities that degraded substances more resistant to microbial degradation (24 May 2017).
The utility of metagenomic-based approaches in monitoring the microbiome in polluted environments as well as facilitating their restoration have been demonstrated in several studies. Knowledge of the microbiome in monitored sites can provide important supporting information in satellite studies, as variations in the microbiome occur as a function of the presence and nature of contaminants. The ability to observe changes in the lacustrine hydrocarbon and microbiological content due to the pollution event allows the possibility for important inferences to be drawn regarding the causes and succession of these events. Our study therefore provides important validation for remote sensing satellite data as an important tool in environmental pollution monitoring. Combined with emerging high-throughput microbiological techniques, such approaches may contribute to important advances in environmental monitoring and remediation methodologies.

Author Contributions

Conceptualization: M.B., G.L., E.D., and F.M. Methodology: M.B., G.L., E.D., and A.M. Formal analysis: M.B., G.L., and V.M. Investigation and data curation: G.L., M.B., R.D.P., A.M., and R.G. Writing-original draft preparation: V.M., A.M., and E.D. All authors have read and agreed to the published version of the manuscript.

Funding

This research received no external funding.

Acknowledgments

Cova Contro onlus, via Longarone 24, Policoro (MT), [email protected]. Movimento Liberiamo la Basilicata, Piazza Crispi 1, Potenza, [email protected].

Conflicts of Interest

The authors declare no conflict of interest.

References

  1. Wang, D.Q.; Yu, Y.-X.; Zhang, X.Y.; Zhang, S.H.; Pang, Y.P.; Zhang, X.L.; Yu, Z.Q.; Wu, M.H.; Fu, J.M. Polycyclic aromatic hydrocarbons and organochlorine pesticides in fish from Taihu Lake: Their levels, sources, and biomagnification. Ecotoxicol. Environ. Saf. 2012, 82, 63–70. [Google Scholar] [CrossRef] [PubMed]
  2. Akporido, S.O.; Onianwa, P.C. Heavy metals and total petroleum hydrocarbon concentrations in surface water of Esi River, western Niger Delta. Res. J. Environ. Sci. 2015, 9, 88–100. [Google Scholar] [CrossRef]
  3. Cova Contro. 2017. Available online: http://analizebasilicata.altervista.org/blog/idrocarburi-nel-pertusillo-presenti-in-tre-campioni-su-tre-oltrea-fosfati-e-manganese/?doing_wp_cronm1517936436.7830340862274169921875 (accessed on 15 November 2021).
  4. Ostgaard, K. The oil, the water and the phytoplankton. In Algae and Water Pollution; Advances in Limnology; Rai, L.C., Gaur, J.P., Soeder, C.J., Eds.; Springer: Berlin, Germany, 1994; Volume 42, pp. 167–193. [Google Scholar]
  5. Almeda, R.; Cosgrove, S.; Buskey, E.J. Oil spills and dispersants can cause the initiation of potentially harmful dinoflagellate blooms (“red tides”). Environ. Sci. Technol. 2018, 52, 5718–5724. [Google Scholar] [CrossRef] [PubMed]
  6. Feron, V.J.; Groten, J.P.; van Bladeren, P.J. Exposure of Humans to Complex Chemical Mixtures: Hazard Identification and Risk Assessment. In Diversification in Toxicology—Man and Environment; Archives of Toxicology; Seiler, J.P., Autrup, J.L., Autrup, H., Eds.; Springer: Berlin/Heidelberg, Germany, 1998; Volume 20, pp. 363–373. [Google Scholar]
  7. Krewski, D.; Thorslund, T.; Withey, J. Carcinogenic Risk Assessment of Complex Mixtures. Toxicol. Ind. Health 1989, 5, 851–867. [Google Scholar] [CrossRef] [PubMed]
  8. Heys, K.A.; Shore, R.F.; Pereira, M.G.; Jones, K.C.; Martin, F.L. Risk assessment of environmental mixture effects. RSC Adv. 2016, 6, 47844–47857. [Google Scholar] [CrossRef] [Green Version]
  9. Palikova, M.; Papezikova, I.; Kopp, R.; Mares, J.; Markova, Z.; Navratil, S.; Adamovsky, O.; Kohoutek, J.; Navratil, L.; Blaha, L. Effect of arsenic and cyanobacterial co-exposure on pathological, haematological and immunological parameters of rainbow trout (Oncorhynchus mykiss). Neuroendocrinol. Lett. 2014, 35, 101–107. [Google Scholar]
  10. Kopp, R.; Mares, J.; Soukupova, Z.; Navratil, S.; Palikova, M. Influence of arsenic and cyanobacteria coexposure on plasmatic parameters of rainbow trout (Oncorhynchus mykiss W.). Neuroendocrinol. Lett. 2014, 35, 57–63. [Google Scholar]
  11. Harris, T.D.; Smith, V.H. Do persistent organic pollutants stimulate cyanobacterial blooms? Inland Waters 2016, 6, 124–130. [Google Scholar] [CrossRef] [Green Version]
  12. Hu, G.C.; Dai, J.Y.; Ma, B.X.; Luo, X.J.; Cao, H.; Wang, J.S.; Li, F.C.; Xu, M.Q. Concentrations and accumulation features of organochlorine pesticides on the Baiyangdian Lake freshwater food web of North China. Arch. Environ. Contam. Toxicol. 2010, 58, 700–710. [Google Scholar] [CrossRef]
  13. Takeuchi, I.; Miyoshi, N.; Mizukawa, K.; Takada, H.; Ikemoto, T.; Omori, K.; Tsuchiya, K. Biomagnification profiles of polycyclic aromatic hydrocarbons, alkylphenols and polychlorinated biphenyls in Tokyo Bay elucidated by 13C and 15N isotope ratios as guides to trophic web structure. Mar. Pollut. Bull. 2009, 58, 663–671. [Google Scholar] [CrossRef]
  14. Santodonato, J. Review of the estrogenic and antiestrogenic activity of polycyclic aromatic hydrocarbons: Relationship to carcinogenicity. Chemosphere 1997, 34, 835–848. [Google Scholar] [CrossRef]
  15. Mnif, W.; Hassine, A.I.H.; Bouaziz, A.; Bartegi, A.; Thomas, O.; Roig, B. Effect of endocrine disruptor pesticides: A review. Int. J. Environ. Res. Public Health 2011, 8, 2265–2303. [Google Scholar] [CrossRef] [PubMed] [Green Version]
  16. Collier, T.; Varanasi, U. Hepatic activities of xenobiotic metabolizing enzymes and biliary levels of xenobiotics in English sole (Parophrys vetulus) exposed to environmental contaminants. Arch. Environ. 1991, 20, 462–473. [Google Scholar] [CrossRef]
  17. Livingstone, D.R. The fate of organic xenobiotics in aquatic ecosystems: Quantitative and qualitative differences in bio-transformation by invertebrates and fish. Comp. Biochem. Physiol. 1998, 120, 43–49. [Google Scholar] [CrossRef]
  18. Odermatt, D.; Stelzer, K.; Koponen, S.; Philipson, P.; Brockmann, C.; Saile, P.; Koetz, B. Water Quality Remote Sensing in Support of the UN Sustainable Development Goals. In Proc. ESA Living Planet Symposium; ESA/ESRIN: Prague, Czech Republic, 2016; p. 5. [Google Scholar]
  19. Schaeffer, B.A.; Schaeffer, K.G.; Keith, D.; Lunetta, R.S.; Conmy, R.; Gould, R.W. Barriers to adopting satellite remote sensing for water quality management. Int. J. Remote Sens. 2013, 34, 7534–7544. [Google Scholar] [CrossRef]
  20. Richardson, L.L.; Bachoon, D.; lngram-Willey, V.; Chee Chow, C.; Weinstock, K. Remote Sensing of the biological dynamics of large-scale salt evaporation ponds. In Proceedings of the International Symposium on Remote Sensing of Environment, Rio de Janeiro, Brazil, 27–31 May 1991; pp. 511–623. [Google Scholar]
  21. Richardson, L.L.; Buisson, D.; Ambrosia, V. Use of Remote Sensing coupled with algal accessory pigment data to study phytoplankton bloom dynamics in Florida Bay. In Proceedings of the Third Thematic Conference on Remote Sensing for Marine and Coastal Environments, Seattle, WA, USA, 18–20 September 1995; Volume 1, pp. 183–192. [Google Scholar]
  22. Blondeau-Patissier, D.; Gower, J.F.R.; Dekker, A.G.; Phinn, S.R.; Brando, V.E. A review of ocean color remote sensing methods and statistical techniques for the detection, mapping and analysis of phytoplankton blooms in coastal and open oceans. Prog. Oceanogr. 2014, 123, 123–144. [Google Scholar] [CrossRef] [Green Version]
  23. Mishra, S.; Mishra, D.R. A novel remote sensing algorithm to quantify phycocyanin in cyanobacterial algal blooms. Environ. Res. Lett. 2014, 9, 114003. [Google Scholar] [CrossRef]
  24. Gorham, T.; Jia, Y.; Shumb, C.K.; Lee, J. Ten-year survey of cyanobacterial blooms in Ohio’s waterbodies using satellite remote sensing. Harmful Algae 2017, 66, 13–19. [Google Scholar] [CrossRef] [PubMed]
  25. Zhang, F.; Lee, J.; Liang, S.; Shum, C.K. Cyanobacteria blooms and non-alcoholic liver disease: Evidence from a county level ecological study in the United States. Environ. Health 2015, 14, 41. [Google Scholar] [CrossRef] [PubMed] [Green Version]
  26. He, J.; Li, G.; Chen, J.; Lin, J.; Zeng, C.; Chen, J.; Deng, J.; Xie, P. Prolonged exposure to low-dose microcystin induces nonalcoholic steatohepatitis in mice: A system toxicology study. Arch. Toxicol. 2017, 91, 465–480. [Google Scholar] [CrossRef] [PubMed]
  27. Drusch, M.; Del Bello, U.; Carlier, S.; Colin, O.; Fernandez, V.; Gascon, F.; Hoersch, B.; Isola, C.; Laberinti, P.; Martimort, P.; et al. Sentinel-2: ESA’s Optical High-Resolution Mission for GMES Operational Services. Remote Sens. Environ. 2012, 120, 25–36. [Google Scholar] [CrossRef]
  28. Liu, H.; Li, Q.; Shi, T.; Hu, S.; Wu, G.; Zhou, Q. Application of Sentinel 2 MSI images to retrieve suspended particulate matter concentrations in Poyang Lake. Remote Sens. 2017, 9, 761. [Google Scholar] [CrossRef] [Green Version]
  29. Caballero, I.; Fernández, R.; Escalante, O.M. New capabilities of Sentinel-2A/B satellites combined with in situ data for monitoring small harmful algal blooms in complex coastal waters. Sci. Rep. 2020, 10, 8743. [Google Scholar] [CrossRef]
  30. Rodríguez-Benito, C.V.; Navarro, G.; Caballero, I. Using Copernicus Sentinel-2 and Sentinel-3 data to monitor harmful algal blooms in Southern Chile during the COVID-19 lockdown. Marine Poll. Bull. 2020, 161, 111722. [Google Scholar] [CrossRef]
  31. Bramich, J.; Bolch, C.J.S.; Fischer, A. Improved red-edge chlorophyll a detection for Sentinel 2. Ecol. Ind. 2021, 120, 106876. [Google Scholar] [CrossRef]
  32. Pahlevan, N.; Sarkar, S.; Franz, B.A.; Balasubramanian, S.V.; He, J. Sentinel-2 MultiSpectral Instrument (MSI) data processing for aquatic science applications: Demonstrations and validations. Remote Sens. Environ. 2017, 201, 47–56. [Google Scholar] [CrossRef]
  33. Toming, K.; Kutser, T.; Laas, A.; Sepp, M.; Paavel, B.; Nõges, T. First experiences in mapping lake water quality parameters with Sentinel-2 MSI Imagery. Remote Sens. 2016, 8, 640. [Google Scholar] [CrossRef] [Green Version]
  34. Gitelson, A. The peak near 700 nm on radiance spectra of algae and water: Relationships of its magnitude and position with chlorophyll concentration. Int. J. Remote Sens. 1992, 13, 3367–3373. [Google Scholar] [CrossRef]
  35. Kolokoussis, P.; Karathanassi, V. Oil spill detection and mapping using Sentinel 2 Imagery. J. Mar. Sci. Eng. 2018, 6, 4. [Google Scholar] [CrossRef] [Green Version]
  36. Bulgarelli, B.; Djavidnia, S. On MODIS retrieval of oil spill spectral properties in the marine environment. IEEE Geosci. Remote Sens. Lett. 2012, 9, 398–402. [Google Scholar] [CrossRef]
  37. Zhao, J.; Temimi, M.; Ghedira, H.; Hu, C. Exploring the potential of optical remote sensing for oil spill detection in shallow coastal waters-a case study in the Arabian Gulf. Opt. Express 2014, 22, 13755–13772. [Google Scholar] [CrossRef]
  38. Luciani, R.; Laneve, G. Oil Spill detection using optical sensors: A multi-temporal approach. In Satellite Oceanography and Meteorology; Whioce Publishing Pte. Ltd.: Singapore, 2018. [Google Scholar] [CrossRef] [Green Version]
  39. Fingas, M.; Brown, C.E. A review of oil spill remote sensing. Sensors 2018, 18, 91. [Google Scholar] [CrossRef] [Green Version]
  40. Haule, K.; Freda, W.; Darecki, M.; Toczek, H. Possibilities of optical remote sensing of dispersed oil in coastal waters. Estuar. Coast. Shelf Sci. 2017, 195, 76–87. [Google Scholar] [CrossRef]
  41. USEPA. 2011. Available online: https://www.epa.gov/sites/production/files/documents/comparisonofhffluidscompositionwithproducedformationwater.pdf (accessed on 15 November 2021).
  42. ARPAB. 2017. Available online: http://www.arpab.it/risorse_idriche/rapporti2017.asp (accessed on 15 November 2021).
  43. Zohary, T.; Sukenik, A.; Berman, T.; Nishri, A. Lake Kinneret: Ecology and Management; Springer: Dordrecht, The Netherlands, 2014; p. 683. [Google Scholar]
  44. De Pace, R.; Storelli, M.M.; Barone, G.; Messineo, V.; Bruno, M. Co-occurrence of polychlorinated biphenyls, cyanotoxins and trace elements in commercial fish species from a freshwater protected area (Pertusillo Lake, Southern Italy). J. Geogr. Environ. Earth Sci. Int. 2019, 22, 1–14. [Google Scholar] [CrossRef] [Green Version]
  45. Cova Contro. 2017. Available online: http://analizebasilicata.altervista.org/blog/ancora-idrocarburi-ed-azoto-nel-pertusillo-anche-il-quartocampione-e-contaminato (accessed on 15 November 2021).
  46. ARPAB. 2017. Available online: http://www.arpab.it/risorse_idriche/public/RELAZIONE%20PERTUSILLO_19102017_pubblicato_rev_031117.pdf (accessed on 15 November 2021).
  47. D’Ugo, E.; Bruno, M.; Mukherjee, A.; Chattopadhyay, D.; Giuseppetti, R.; De Pace, R.; Magurano, F. Characterization of microbial response to petroleum hydrocarbon contamination in a lacustrine ecosystem. Environ. Sci. Poll. Res. 2021, 28, 26187–26196. [Google Scholar] [CrossRef] [PubMed]
  48. Calderoni, A.; Mosello, R. Caratteristiche termiche e chimiche. In Il Lago Di Pietra Del Pertusillo: Definizione Delle Sue Caratteristiche Limnoecologiche, Ed. Ist. Ital. Idrobiol; Istituto Italiano di Idrobiologia: Pallanza, Italy, 1978; pp. 3–66. [Google Scholar]
  49. Colella, A. Hydrocarbons and metals in waters and sediments of the Pertusillo Lake, Italy. Fresenius Environ. Bull. 2012, 21, 3003–3011. [Google Scholar]
  50. Colella, A.; D’ Orsogna, M.R. Hydrocarbon contamination in waters and sediments of the Pertusillo freshwater reservoir, Val D’agri, Southern Italy. Fresenius Environ. Bull. 2014, 23, 3286–3295. [Google Scholar]
  51. Improta, L.; Valoroso, L.; Piccinini, D.; Chiarabba, C. A detailed analysis of wastewater-induced seismicity in the Val d’Agri oil field (Italy). Geophys. Res. Lett. 2015, 42, 2682–2690. [Google Scholar] [CrossRef]
  52. Buttinelli, M.; Improta, L.; Bagh, S.; Chiarabba, C. Inversion of inherited thrusts by wastewater injection induced seismicity at the Val d’Agri oilfield (Italy). Scient. Rep. 2016, 6, 37165. [Google Scholar] [CrossRef] [PubMed] [Green Version]
  53. Soriano-González, J.; Angelats, E.; Fernández-Tejedor, M.; Diogene, J.; Alcaraz, C. First results of phytoplankton spatial dynamics in two NW-Mediterranean bays from chlorophyll a estimates using Sentinel 2: Potential implications for aquaculture. Remote Sens. 2019, 11, 1756. [Google Scholar] [CrossRef] [Green Version]
  54. Gower, J.; King, S.; Borstad, G.; Brown, L. Detection of intense plankton blooms using the 709 nm band of the MERIS imaging spectrometer. Int. J. Remote Sens. 2005, 26, 2005–2012. [Google Scholar] [CrossRef]
  55. Salem, S.I.; Strand, M.H.; Higa, H.; Kim, H.; Kazuhiro, K.; Oki, K.; Oki, T. Evaluation of MERIS chlorophyll a retrieval processors in a complex turbid Lake Kasumigaura over a 10-year mission. Remote Sens. 2017, 9, 1022. [Google Scholar] [CrossRef] [Green Version]
  56. Lund, J.W.G.; Kipling, C.; Le Cren, E. The inverted microscope method of estimating algal numbers and the statistical basis of estimations by counting. Hydrobiologia 1958, 11, 143–170. [Google Scholar] [CrossRef]
  57. Utermőhl, H. Neue Wege in der quantitativen Earfassung des Planktons (mit besonderer Berücksichtigung des Ultraplanktons). Verh. Int. Ver. Theor. Angew. Limnol. 1931, 5, 567–596. [Google Scholar]
  58. Kutser, T.; Paavel, B.; Verpoorter, C.; Ligi, M.; Soomets, T.; Toming, K.; Casal, G. Remote Sensing of Black Lakes and using 810 nm reflectance peak for retrieving water quality parameters of optically complex waters. Remote Sens. 2016, 8, 497. [Google Scholar] [CrossRef]
  59. Ruggiu, D.; Saraceni, C. Struttura dei popolamenti algali e produzione primaria. In II Lago Di Pietra Del Pertusillo: Definizione Delle Sue Caratteristiche Limnoecologiche, Ed. Ist. Ital. Idrobiol; Istituto Italiano di Idrobiologia: Pallanza, Italiy, 1978; pp. 67–98. [Google Scholar]
  60. Dagenais-Bellefeuille, S.; Morse, D. Putting the N in dinoflagellates. Front. Microbiol. 2013, 4, 369. [Google Scholar] [CrossRef] [PubMed] [Green Version]
  61. Smalley, G.W.; Coats, D.W.; Stoecker, D.K. Feeding in the mixotrophic dinoflagellate Ceratium furca is influenced by intracellular nutrient concentrations. Mar. Ecol. Prog. Ser. 2013, 262, 137–151. [Google Scholar] [CrossRef]
  62. Das, N.; Chandran, P. Microbial Degradation of Petroleum Hydrocarbon Contaminants: An Overview. Biotech. Res. Int. 2011, 2011, 941810. [Google Scholar] [CrossRef] [PubMed] [Green Version]
  63. Rodriguez-R, L.M.; Overholt, W.A.; Hagan, C.; Huettel, M.; Kostka, J.E.; Konstantinidis, K.T. Microbial community successional patterns in beach sands impacted by the Deepwater Horizon oil spill. ISME J. 2015, 9, 1928–1940. [Google Scholar] [CrossRef] [PubMed]
  64. Hu, C.; Weisberg, R.H.; Liu, Y.; Zheng, L.; Daly, K.L.; English, D.C.; Zhao, J.; Vargo, G.A. Did the northeastern Gulf of Mexico become greener after the Deepwater Horizon oil spill? Geophys. Res. Lett. 2011, 38, 1–5. [Google Scholar] [CrossRef] [Green Version]
  65. Hisakawa, N.; Quistad, S.D.; Hester, E.R. Metagenomic and satellite analyses of red snow in the Russian Arctic. PeerJ 2015, 3, e1491. [Google Scholar] [CrossRef] [PubMed] [Green Version]
  66. Francini-Filho, R.B.; Cordeiro, M.C.; Omachi, C.Y.; Rocha, A.M.; Bahiense, L.; Garcia, G.D.; Tschoeke, D.; de Almeida, M.G.; Rangel, T.P.; De Oliveira, B.C.V.; et al. Remote sensing, isotopic composition and metagenomics analyses revealed Doce River ore plume reached the southern Abrolhos Bank Reefs. Sci. Total Environ. 2019, 697, 134038. [Google Scholar] [CrossRef] [PubMed]
Figure 1. Lake Pertusillo location and sampling stations.
Remotesensing 14 00121 g001
Figure 2. Examples of oil spectra compared with water spectra. Note the characteristic peak of reflectance at 0.705 micron, due to Lemna obscura, a floating vegetation typical of Lake Maracaibo.
Remotesensing 14 00121 g002
Figure 3. Atmospherically corrected S-2A true-color image of Lake Pertusillo, 27 February 2017, showing prominent black and blue-greenish patterns, as reported from terrestrial and drone observations (Figure 4). Red asterisks show the ground data collection sites listed in Table 1.
Remotesensing 14 00121 g003
Figure 4. Pollution reported by local newspapers, state road 598 bridge in the center north of Lake Pertusillo and Masseria Crisci sampling site N 40.28977 E 15.95180, on 27 February 2017 (drone image by Michele Tropiano).
Remotesensing 14 00121 g004
Figure 5. Comparison between VNRI and MCI values to check the correlation between indices. Plots are based on the analysis of the S2 images of 27 February 2017 (top) and 01 July 2021 (middle). (Bottom) image shows the area of the lake corresponding to the pixel values of the ascending branch (pixel values enclosed in the green ellipse) of the top plot.
Remotesensing 14 00121 g005
Figure 6. Series of MCI and VNRI maps based on Sentinel-2A images of the Lake Pertusillo acquired, from top to bottom, on 9 December 2016, 26 December 2016, 17 February 2017, 27 February 2017 and 3 August 2017. MCI maps show the evolution of the Chl-a in the lake whereas VNRI maps show the increase and decrease (3rd of August) in the presence of pollution related to oil.
Remotesensing 14 00121 g006aRemotesensing 14 00121 g006b
Figure 7. (Upper): RGB image of the 27 February 2017 obtained by combining MCI map (R), VNRI (G), and S2 band 4 (B). (Lower): Spectral profiles corresponding to different conditions of the water in the lake.
Remotesensing 14 00121 g007aRemotesensing 14 00121 g007b
Figure 8. MCI map for day 27 February 2017. Circles correspond to the sites where ground samples were collected.
Remotesensing 14 00121 g008
Figure 9. VNRI map of 27 February 2017. Orange circles correspond to the sites where ground samples were collected.
Remotesensing 14 00121 g009
Table 1. Description of water sampling sites at Lake Pertusillo.
Collection SiteCoordinatesTotal Petroleum Hydrocarbons µg/L (at Time of Collection)Sampling DatePeridinium sp. Cells/LChlorophyll a µg/L
Sampling and certified analyses by local civic associationsSpartifave 1N 40.29687
E 15.93075
3827 February 2017N.A.N.A.
Spartifave 2N 40.29687
E 15.93075
21327 February 2017N.A.N.A.
Masseria CrisciN 40.28977
E 15.95180
19227 February 2017N.A *1N.A.
GrumentoN 40.29665
E 15.93056
2861 March 2017N.A.N.A.
Madonna GrumentinaN 40.29172
E 15.92957
90022 May 2017N.A.N.A.
Lake dammingN 40.27522
E 15.99157
873 August 2017N.A.N.A.
Sampling and analyses by the Regional Agency for Environment Protection of Basilicata (ARPAB) and ISSStation 1 Lake damming SurfaceN 40.276913
E 15.992453
N.D. *224 February 20177800.000120
Station 1 Lake damming SurfaceN 40.276913
E 15.992453
N.D.27 February 20171822.31125–28
Station 2 Montemurro SurfaceN 40.286077
E 15.972118
N.D.27 February 2017439.54412–15
Station 3 Spinoso SuperficialeN 40.280857
E 15.967185
N.D.27 February 20176684.275≥150
Station 4 Masseria Crisci SurfaceN 40.283217
E 15.954102
N.D.27 February 2017402.73385
Masseria CrisciN 40.28977
E 15.95180
N.A.27 February 201710,000.000 *3N.A.
Station 5 Grumento
Surface
N 40.29665
E 15.93056
N.D.27 February 2017255.1258
*1 Not Analysed, *2 Not Determined, *3 Phytoplankton analysis by ISS.
Publisher’s Note: MDPI stays neutral with regard to jurisdictional claims in published maps and institutional affiliations.

