Technical Note

A Comparison of Wintertime Atmospheric Boundary Layer Heights Determined by Tethered Balloon Soundings and Lidar at the Site of SACOL

1
Key Laboratory for Semi-Arid Climate Change of the Ministry of Education, College of Atmospheric Sciences, Lanzhou University, Lanzhou 730000, China
2
Collaborative Innovation Center for Western Ecological Safety, Lanzhou University, Lanzhou 730000, China
*
Author to whom correspondence should be addressed.
Remote Sens. 2021, 13(9), 1781; https://doi.org/10.3390/rs13091781
Submission received: 13 April 2021 / Revised: 29 April 2021 / Accepted: 29 April 2021 / Published: 3 May 2021
(This article belongs to the Special Issue Active and Passive Remote Sensing of Aerosols and Clouds)

Abstract

:
High-precision and -resolution atmospheric boundary layer height (BLH) has received increasing attention in air pollution research in recent years. The low time resolution of sounding data is the main challenge to validate BLH retrieval from lidar observations. To resolve this issue, we conducted simultaneous tethered balloon sounding and lidar observations at the Semi-Arid Climate and Environment Observatory of Lanzhou University (SACOL) during winter 2019–2020. The BLHs derived from the tethered balloon sounding data were 170, 210, 393, 676, 423, and 190 m at 02:00, 08:00, 11:00, 14:00, 17:00, and 20:00 (Beijing time), respectively. The diurnal evolution of BLH was reasonably captured by lidar observation-based wavelet covariance transform and ideal profile fitting methods, which exhibited correlation coefficients of 0.91 and 0.89, respectively, with the BLHs determined from tethered balloon sounding data. The lidar results slightly overestimated the BLHs, though all results were acceptable when considering both the absolute and relative errors with respect to BLHs from the tethered balloon data. Our results revealed high-precision and -resolution diurnal variations in BLH at SACOL in Northwest China and suggest the importance of validating lidar-based BLHs using simultaneous sounding data.

Graphical Abstract

1. Introduction

The atmospheric boundary layer is the lowest layer in the atmosphere, directly forced by the ground, with obvious turbulence characteristics [1]. Energy and material exchange between the earth and atmosphere occurs in this layer. Thermal and dynamic forcing from the ground causes characteristic diurnal variations of the atmospheric boundary layer structures, which directly affects the diffusion and transportation of air pollutants [2,3,4] and indirectly impacts human health and productivity [5]. The atmospheric boundary layer height (BLH), generally defined as the height where turbulence almost disappears, determines the atmospheric environmental capacity [6]. The concentration of particulate matter <2.5 µm in diameter (PM2.5) is reversely correlated with BLH [7,8,9,10], and BLH contributes 25% of total PM2.5 in Eastern China [11].
The BLH is a vital parameter in atmospheric air pollution studies that has received increasing attention in recent years [12,13,14]. Recent advances have been made by using both field observations and numerical simulations: analyzing BLH climatology as derived from ground meteorological observations, radiosondes, reanalysis, and tethered balloon-based data [15,16,17,18,19,20]; retrieving BLH from remote sensing data such as ground-based lidars, satellite lidar (Cloud-Aerosol Lidar Infrared Pathfinder Satellite Observations, CALIPSO), ceilometers, radar wind profilers, and microwave radiometers [21,22,23,24,25,26,27]; and modeling BLH by using large eddy simulation, mesoscale, multiscale air pollution, and global climate models [28,29,30,31]. Lidar is particularly sensitive to changes in atmospheric aerosol concentration in the vertical direction, and the sharpest changing height of signal gradient is always defined as the BLH [32]. Aerosol lidars provide a unique opportunity for studying BLH due to their continuous monitoring ability, long lifetime, and high temporal and vertical resolutions. In addition to the widely used wavelet covariance transform (WCT; [32,33,34]) and ideal profile fitting (FIT; [35]) methods, other recently developed algorithms for deriving BLH from lidar observations include those based on gravity waves theory [36], extended Kalman filtering technique [37], and the different thermodynamic stability algorithm [38]. Attempts have also been made to derive BLH automatically from lidar observations [26,30,38,39,40,41,42,43].
In addition to improving the retrieval algorithm, deriving BLH from simultaneous multiple measurements seems to be a promising approach. BLH derived from sounding data is considered a reference standard that can be calculated from various algorithms [44,45]. Meanwhile, BLH derived from lidar data is being increasingly used due to its high temporal and vertical resolution and long-term continuous observations in recent years across the world [21,46]. Thus, combining sounding data and lidar observations is an optimal approach to studying BLH. Microwave radiometer observations with high time resolution have also been used to validate BLH derived from aerosol lidars [22,47], but the accuracy of temperature profiles from this source needs validation via comparisons with radiosonde profiles [48].
However, the low time resolution of sounding data is the main challenge to validate BLH retrievals from lidar observations, as this can lead to conflicting of bias between lidar and sounding results. For example, Dang et al. (2019) [42] showed that the WCT and FIT algorithms overestimated the BLH with a mean difference of 0.28 and 0.22 km, respectively, for 41 observations at 00:00 and 12:00 UTC in Yuzhong, Gansu, China, but results in Lewis et al. (2013) [29] exhibited an underestimation of 0.119 km for 23 observations between 13:57 and 21:34 UTC in Maryland, USA. This contradiction may be due to differences between lidar and radiosonde algorithms or diurnal variations in bias. Over- or underestimation of BLHs using lidar observations were also revealed by other studies. For example, the WCT-BLH was 220 m higher than the radiosonde-BLH on 20 October 2014 at 14:00 local time in Houston, USA [49]; the WCT-BLH was 160 m lower than the radiosonde-BLH on 11 July 2011 at 19:27 UTC in Maryland, USA [50]; a slight underestimation of a newly introduced lidar-based method (PathfinderTURB) was found at 13:00 local time by Poltera et al. (2017) [41] in Kleine Scheidegg, Switzerland; and daytime (12:15 and 18:15 local time) underestimation of ~130 m and nighttime (00:15 and 06:15 local time) overestimation of ~160 m were found by Haeffelin et al. (2011) [51] in Le Traînou, France. Although some studies have used multiple sounding profiles per day to validate lidar-derived BLH [38,40,52,53,54,55], high temporal resolution radiosonde data are relatively scarce. Operational radiosonde sounding data taken at 00:00 and 12:00 UTC are commonly used to validate BLHs from lidar observations in many sites across China [26,37,42,55,56,57]. However, such profiles are not appropriate for studying the diurnal evolution of atmospheric boundary layers in China because they are only available during the local early morning and late afternoon transition times; this problem affects many locations worldwide. In addition, the value of retrieving nocturnal BLH from lidar observations remains an open question due to the blind zone in lidar data and a lack of sounding observations during nighttime [40,58].
To resolve these issues, we conducted simultaneous high-precision and -resolution tethered balloon sounding and lidar observations with a low-blind zone during winter 2019–2020. Section 2 details the study site, data, and methodology, Section 3 assesses the diurnal evolution of atmospheric boundary layer structure and height using tethered balloon sounding data, BLH retrieved from lidar data, and comparison between BLHs derived from lidar observations and TBS data, and summary and conclusions are finally presented in Section 4.

2. Materials and Methods

2.1. Data Collection

Data were collected at the Semi-Arid Climate Observatory and Laboratory of Lanzhou University (SACOL; 35.95°N, 104.12°E, 1961 m a.s.l.; Figure 1a), Northwest China from 9 December 2019 to 3 January 2020. A tethered balloon (Figure 1b) and lidar were used to observe the vertical distribution of the basic atmospheric parameters and aerosols, respectively. The tethered balloon was equipped with a sounding system (KZXLT-II; Figure 1c,d) and a global positioning system (GPS; Garmin GPSMAP 621sc). The KZXLT-II sounding system, developed by the Institute of Atmospheric Physics, Chinese Academy of Sciences, was able to accurately measure the atmospheric temperature, pressure, relative humidity, and wind speed and directions in the atmospheric boundary layer every second. Measurement accuracy and other details are presented in the Supplementary Materials (Table S1).
The GPS-measured heights were matched with the sounding systems’ observations to obtain vertical profiles of the atmospheric parameters. The tethered balloon was launched 6 times (02:00, 08:00, 11:00, 14:00, 17:00, and 20:00, Beijing time (UTC+8)) every day during the observation period. The ascent speed of the tethered balloon was maintained at ~30 m·min−1. Only observations during the ascent stage of the tethered balloon sounding (TBS) were used. A total of 96 atmospheric sounding profiles were obtained with maximum heights ranging from 500–1300 m (average of 900 m). Every selected atmospheric sounding profile was able to retrieve BLH. According to the average sunrise and sunset time (08:05 and 17:50, Beijing time) during this period, the 11:00, 14:00, and 17:00 were identified as daytime and the 02:00, 08:00, and 20:00, Beijing time, were nighttime.
A mobile depolarization lidar (MiniMPL; Sigma Space, USA; Figure 1e) was installed ~50 m away from the tethered balloon to observe atmospheric aerosols at 532 nm with a blind zone of 100 m, a vertical distribution of 30 m, and a time resolution of 1 min (Table S2). The calculation of normalized range-corrected backscattering signal (NRB) was as follows:
N R B ( z ) = [ R a w ( z ) × D ( z ) A P ( z ) B ] × z 2 O ( z ) × E
where Raw(z) is the raw lidar data (counts μs−1), D(z) is the dead time correction, AP(z) is the afterpulse correction (Hz), B is the background signal correction (counts km2 μs−1), O(z) is overlap correction, and E is the laser energy (μJ). A total of 18 days of lidar observations without clouds and precipitation were used to retrieve BLH.

2.2. Determining BLH from TBS Data

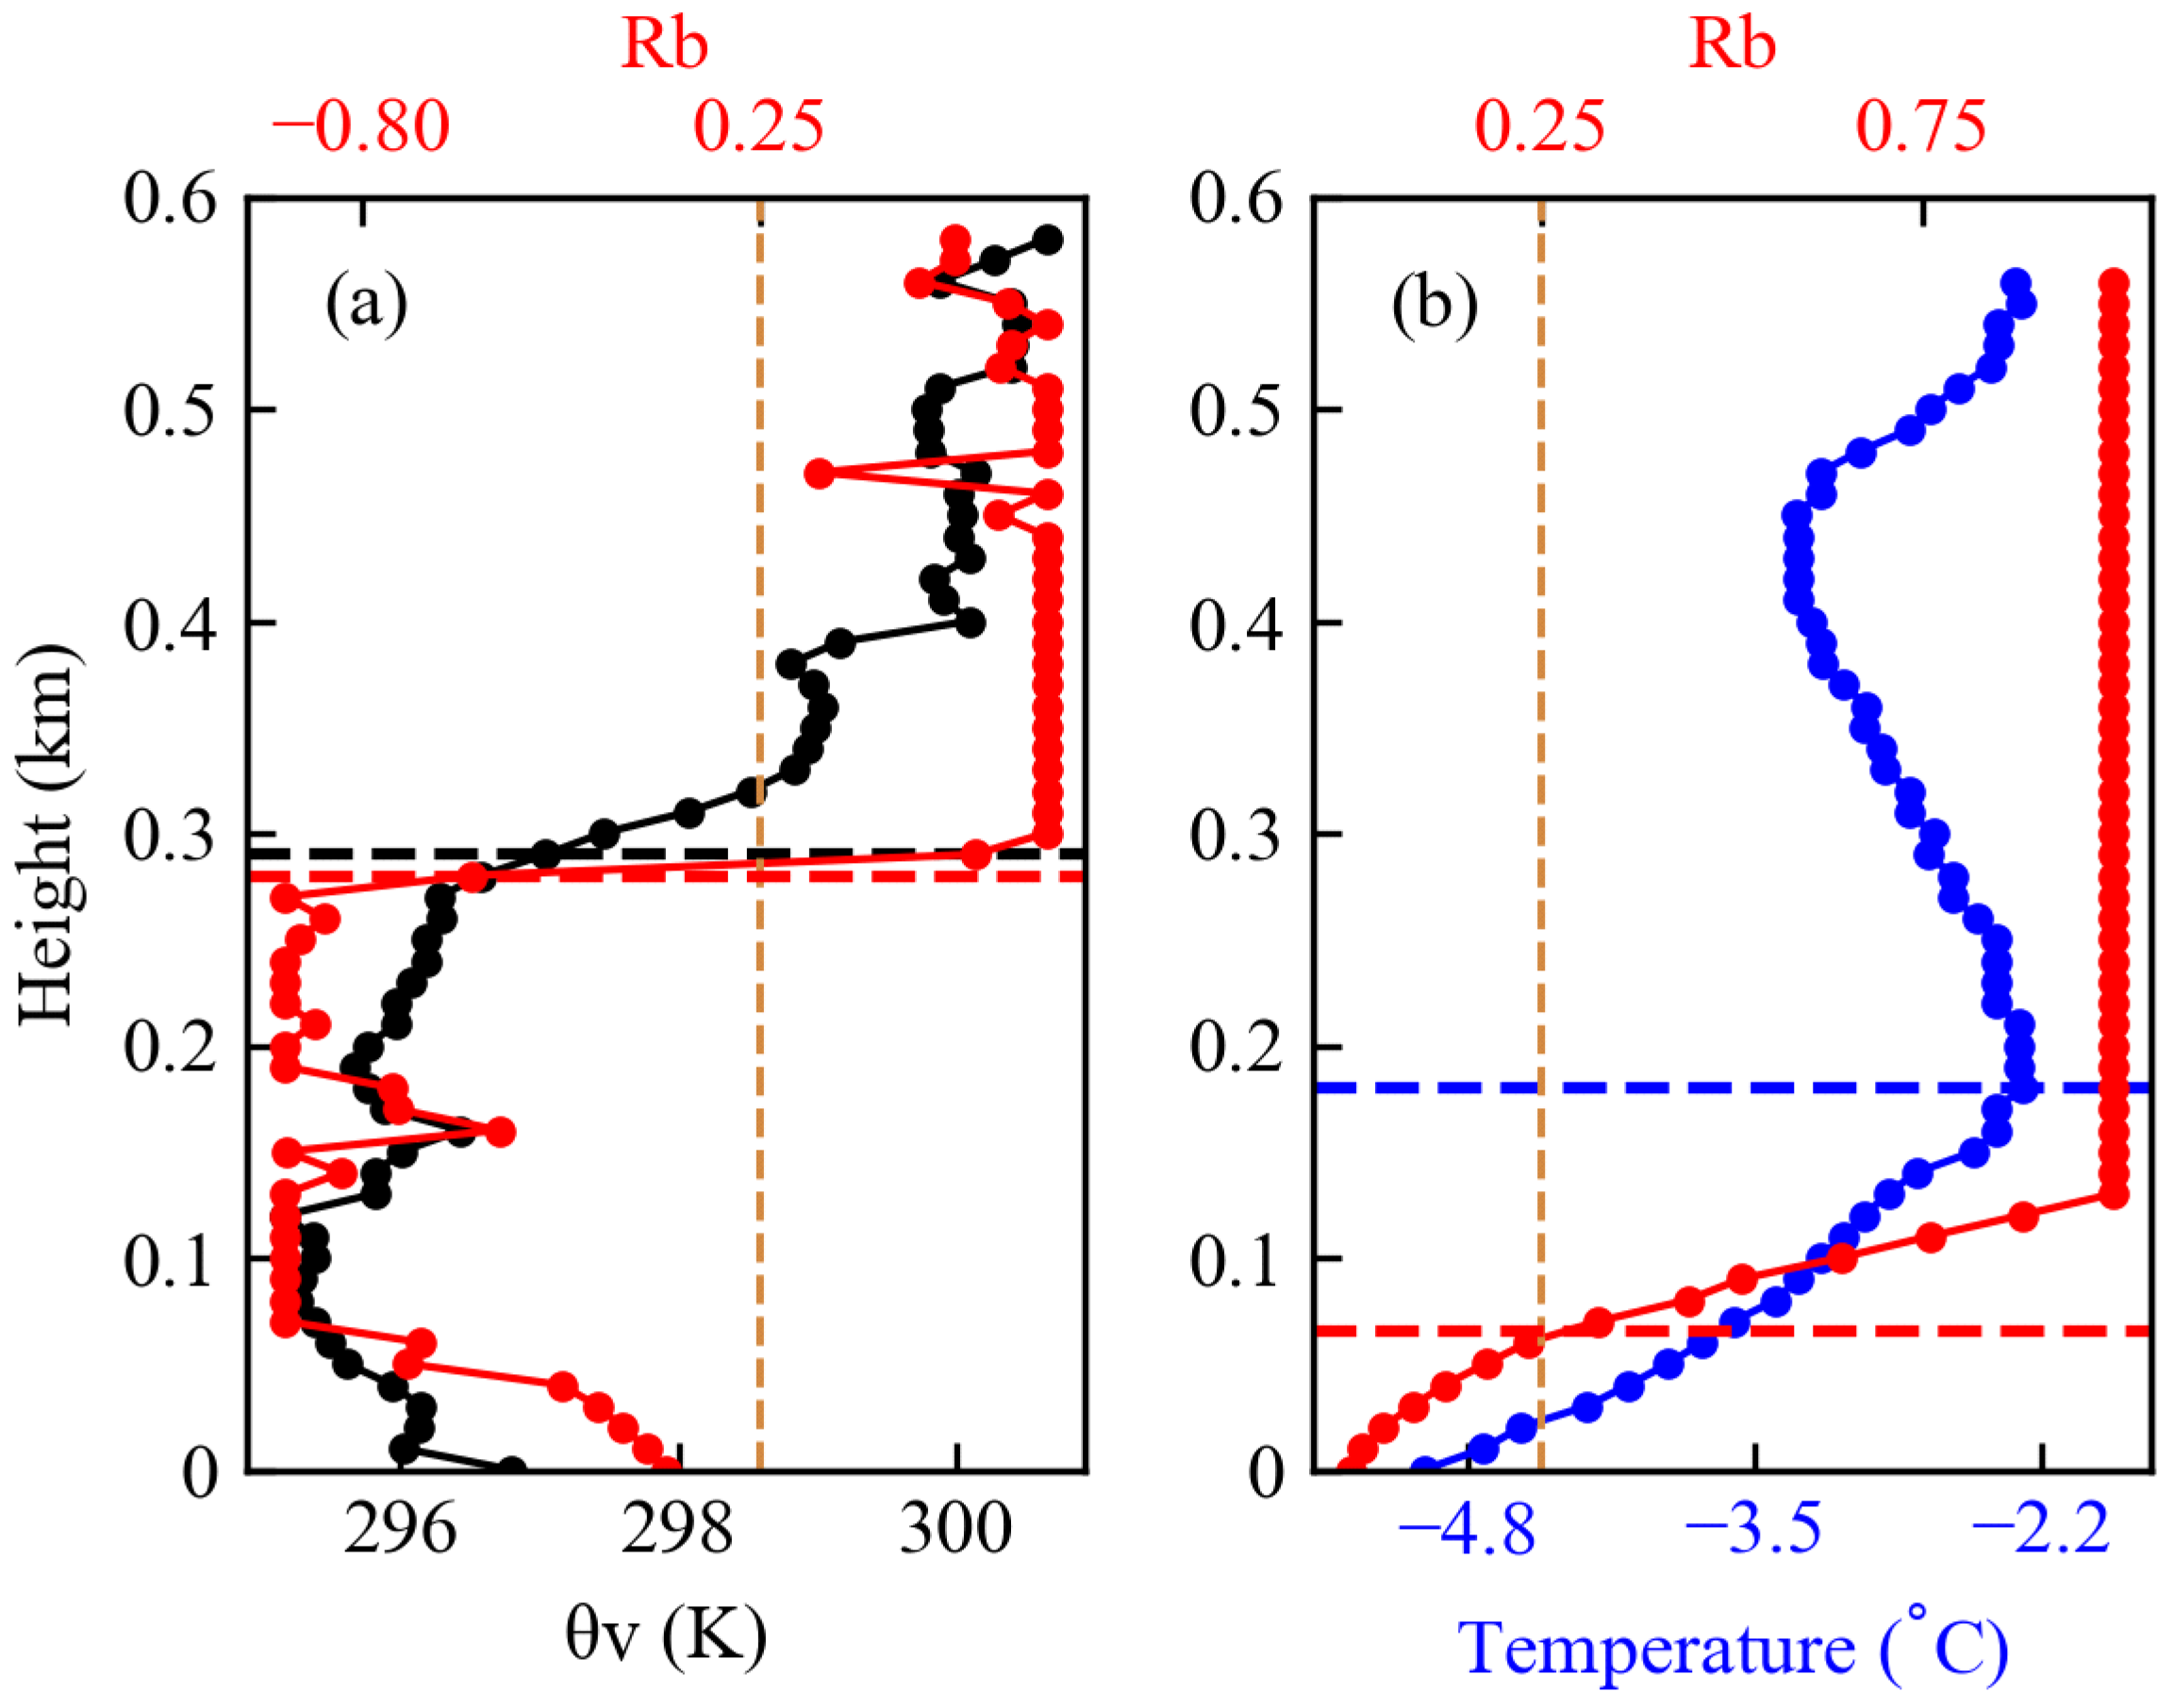
The structure of atmospheric boundary layer has diurnal variation, in which convective boundary layers predominate during daytime and stable boundary layers at night, and it is also complex during the transition between daytime and nighttime. The convective boundary layer height was determined from TBS data in the daytime as: (1) the height at which virtual potential temperature (θv) is the same as the surface value (Holzworth method or parcel method) [43,59] and (2) the height at which the bulk Richardson number (Rb) is the same as 0.25 (named Rb number method) [44,60]. The bulk Richardson number was calculated as:
R b ( z ) = ( g θ v s ) ( θ v z θ v s ) ( z z s ) ( u z u s ) 2 + ( v z v s ) 2 + ( b u * 2 )
where θv is the virtual potential temperature, g is the gravitational acceleration, u and v are wind speed components, b is a constant, and u * is the surface friction velocity, which are so much smaller than the bulk shear terms in the denominator that they can be ignored [16,17]. The z is the height, and s represents the surface (2 m). Here, us and vs were set to u and v at height of 2 m. This setting is further investigated in the Supplementary Materials (Figure S1). The correlation coefficients between BLHs derived from Holzworth and Rb number method were 0.99 for the matched 26 daytime profiles (Figure S2a). The Holzworth method can be understood as a simplification of the Rb number method where the shear contribution is neglected. Thus, they are only applicable for unstable conditions [44].
It is difficult to derive nocturnal stable boundary layer height because of the influence of gravity waves, intermittent turbulence, and other complex motions [44]. The stable boundary layers can be derived from temperature and wind profiles [61,62,63]. However, more than half of the wind shear method-derived BLHs were lower than 100 m while most of the temperature inversion-derived BLHs varied from 100 m to 300 m (Figure S3). Seidel et al. (2010) indicated that a surface-based temperature inversion is a clear indicator of the stable boundary layer [45]. Therefore, stable boundary layer height was determined from TBS data in the nighttime as the height at the top of a surface-based temperature inversion. For comparison, the Rb number method was also used to derive stable boundary layer height [64,65]. Here, us and vs were set to zero to avoid extremely low BLHs (Figure S4). The correlation coefficients between BLHs derived from temperature inversion and Rb number method were 0.60 for the matched 30 nighttime profiles (Figure S2b).
After comparison, the Holzworth method and temperature inversion method were selected to derive the BLHs based on TBS (TBS-BLHs) in daytime and nighttime, respectively (Figure 2). Moreover, the finer structures of the atmospheric boundary layer were analyzed by manual distinction with some principles (in Section 3.1): (1) the residual capping inversion layers are the thin layers beneath the free atmosphere with a temperature inversion; (2) the residual mixed layers are above the nocturnal stable boundary layers and below the residual capping inversion layers; (3) the daytime capping inversion layers (also referred to as entrainment zones) are the thin layers above the convective boundary layers with a temperature inversion.

2.3. Determining BLH from Lidar Observations

We applied the WCT [34,66] and FIT [35,67] methods to determine BLHs from lidar observations as these methods have been widely used in previous studies [42,55]. Since atmospheric aerosols are generally retained in the atmospheric boundary layer, the backscatter signal always decreases rapidly in the transition zone from the atmospheric boundary layer to the free troposphere and the WCT can amplify the gradient in the transition zone [68], making it easier to determine the BLH. Specifically, the wavelet basis function was defined as:
h ( z b a ) = { 1 ,   b a 2 z b 1 ,   b < z b + a 2 0 ,   e l s e w h e r e
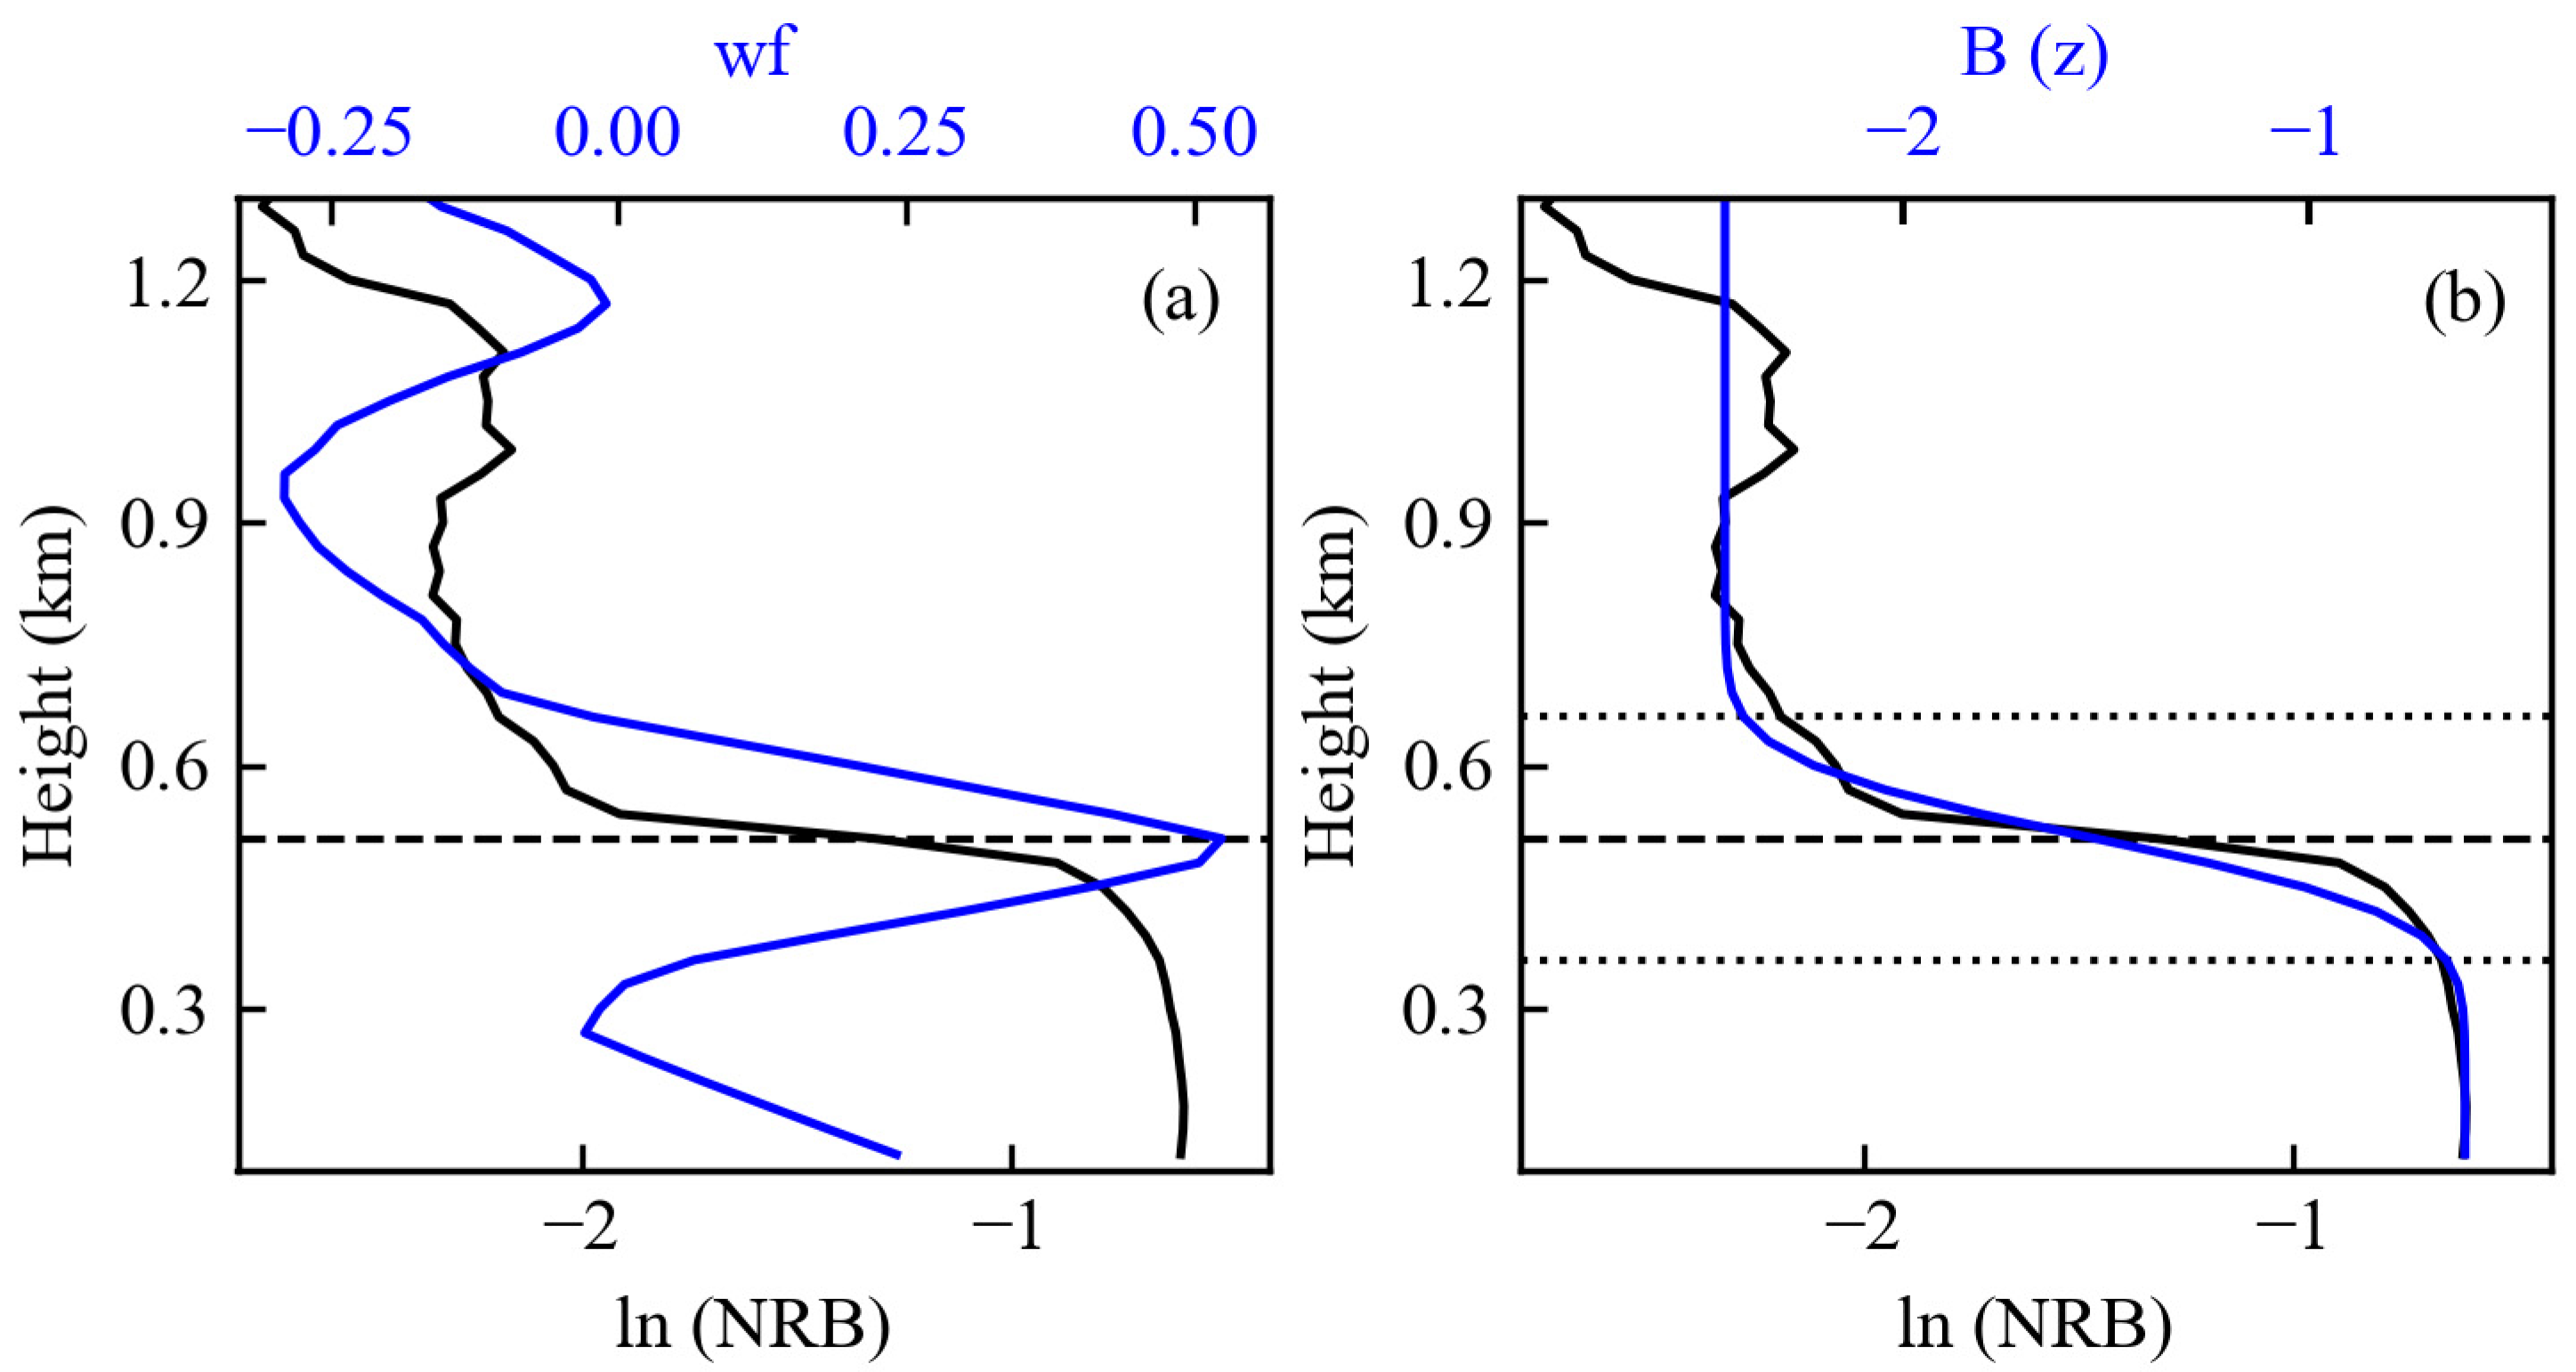
where b is the wavelet translation, a is the wavelet spatial dilation, and z is the backscatter signal profile height. The wavelet covariance transform function wf(a, b) was defined as:
w f ( a , b ) = 1 a z b z t b ( z ) h ( z b a ) d z
where b(z) is the backscatter signal at height z and zb and zt are the lower and upper height limit. At a given value of a, the BLH is defined as the value of b corresponding to maximum wavelet covariance when b steps from zb to zt (Figure 3a).
The value of a impacts the BLHs of the WCT method to some extent [41]. The value of zb should be above the height of a/2 (Equation (2)), which requires a small a value for shallow atmospheric boundary layer under conditions such as nocturnal stable atmospheric boundary layer in winter. On the other hand, a relatively large a value should be applied for deep atmospheric boundary layer to minimize noise interference. Hence, in consideration of the diurnal variations of atmospheric boundary layer, the value of a was set to 60 m for samples at 02:00, 180 m at 08:00 and 20:00, and 300 m at 11:00, 14:00, and 17:00, and Compton et al. (2013) also had similar settings [50].
FIT defines an ideal profile B(z) as:
B ( z ) = B m + B u 2 B m B u 2 e r f ( z z m s )
e r f ( A ) = 2 π 0 A exp ( y 2 ) d y
where Bm is the mean backscatter of the mixed layer, Bu is the mean backscatter in the air immediately above the entrainment zone, zm is a trial value for BLH, and s is related to the depth of the entrainment zone. Based on a simulated annealing algorithm [69], B(z) was fitted to the observed profile b(z) by minimizing root-mean-square deviation between them to determine the four idealized backscatter profile parameters Bm, Bu, zm, and s. Thus, B(z) represents the overall information content of the b(z) and FIT, if free from local extremes within the profile (Figure 3b).
The logarithm of the NRB (ln (NRB)) instead of the NRB was used to derive BLH from lidar observations in the present study, which can reduce the underestimation under convective conditions (Figure S5) [34] and may increase the overestimation in the nighttime. Therefore, we used the ln (NRB) signal in the daytime and NRB signal in the nighttime based on 5 min temporal averages and Perona–Malik anisotropic diffusion filters to improve the signal-to-noise ratio [70]. Finally, the continuity of the BLHs was checked to avoid the influence of transported aerosol layers.

3. Results

3.1. Diurnal Variations in Atmospheric Boundary Layer from TBS Data

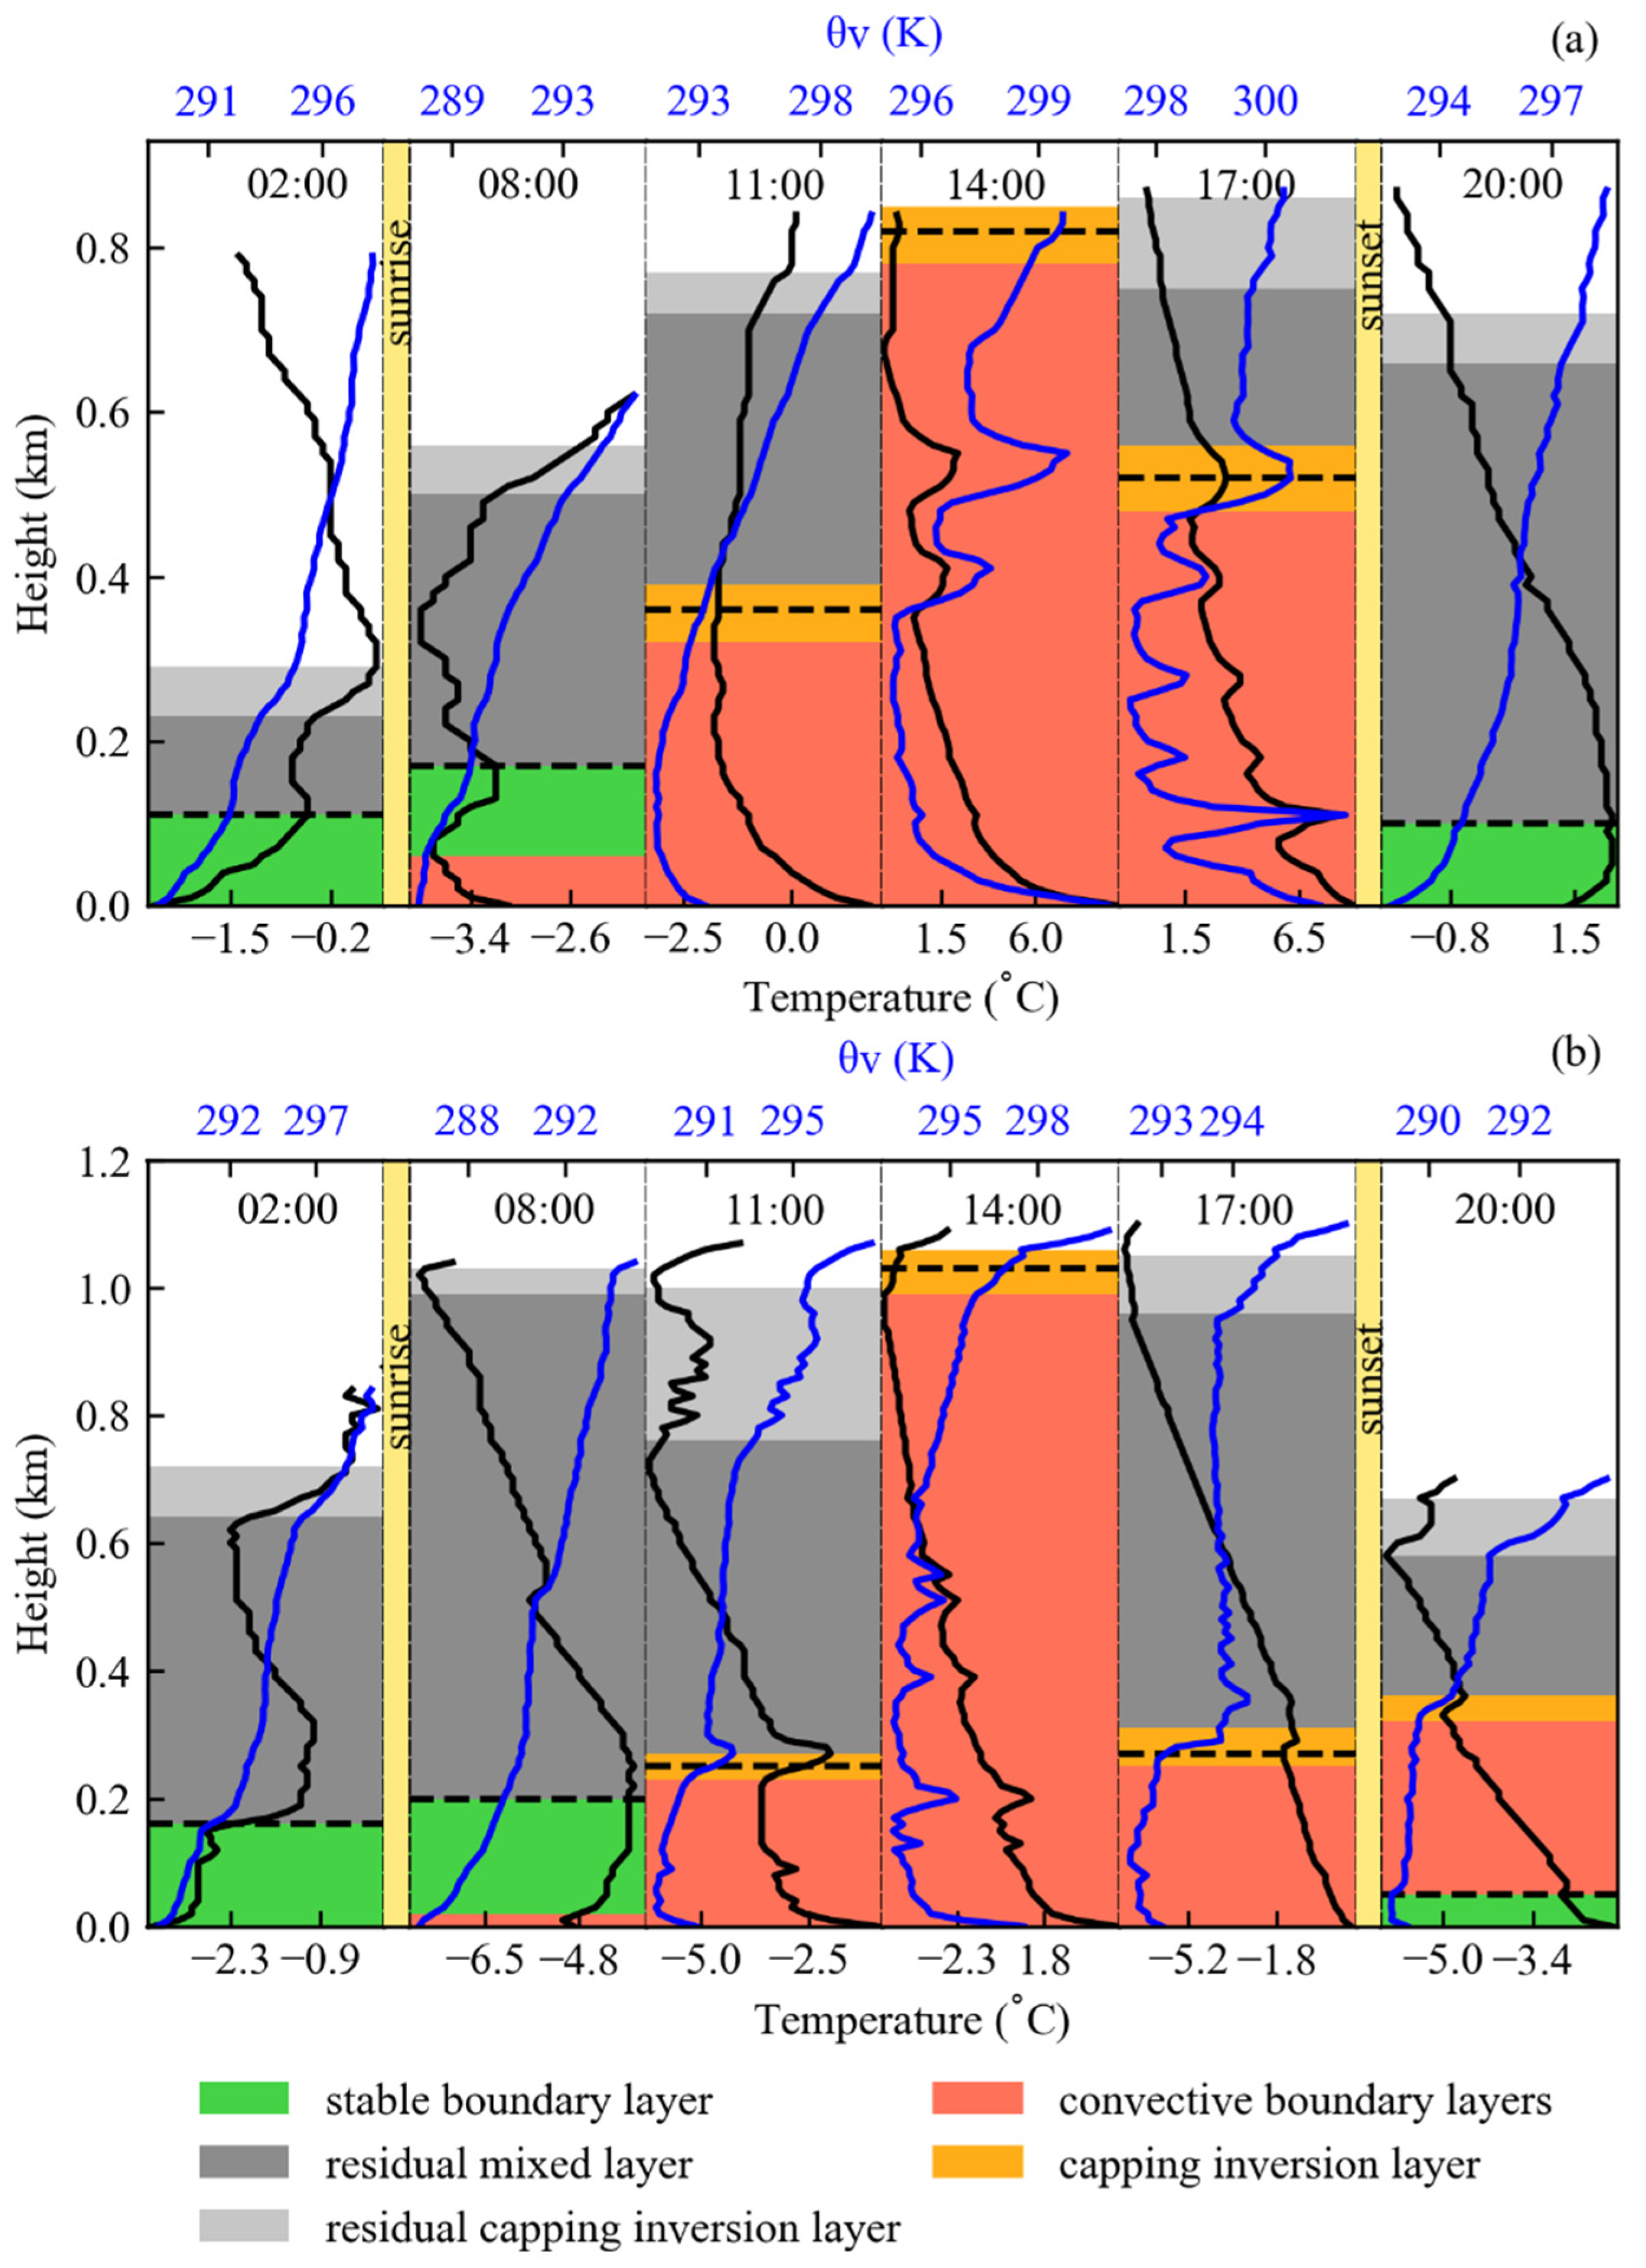
Firstly, diurnal variations in atmospheric boundary layer were analyzed based on the TBS data (Figure 4). The TBS data on 12 December and 24 December 2019 were selected as the typical examples because (1) all the six-time tethered balloon soundings were successfully launched on these two days; and (2) clear sky weather on these two days made it representative for typical atmospheric boundary layer characteristics in winter at SACOL. The surface-based temperature inversion layer was evident in the temperature and virtual potential temperature profiles at 02:00, which was defined as the nocturnal stable boundary layer. The stable boundary layers occurred at 110 m on December 12 and 160 m on December 24, respectively, at 02:00. The residual mixed layers were defined by tops at 220 and 620 m, respectively. Shallow residual capping inversion layers occurred above the residual mixed layers at 02:00.
The stable boundary layer gradually developed upwards with nighttime radiative cooling until sunrise, with tops reaching 170 m on 12 December and 190 m on 24 December, respectively, at 08:00. Residual mixed layers developed more rapidly than stable boundary layers from 02:00 to 08:00. After sunrise, surface-based stable boundary layers were destroyed by solar radiative heating and convective boundary layers began to develop, leading to shallow convective boundary layers at 08:00. As solar radiation continued to intensify, convective boundary layers and capping inversion layers continued to develop, with the latter’s tops reaching 365 m and 242 m, respectively, at 11:00.
Convective boundary layers reached maximal heights of 910 m on 12 December and 1050 m on 24 December, respectively, at 14:00 when turbulent mixing was strong. Then, they weakened, with tops decreasing to 528 and 266 m, respectively, at 17:00. Generally, convective boundary layers disappear gradually after sunset and stable boundary layers begin to develop. On 12 December at 20:00, the convective boundary layer disappeared, and a stable boundary layer developed at 20:00, but on 24 December at 20:00 the convective boundary layer was maintained (though very weak). Atmospheric boundary layer evolution was properly characterized by the TBS data. The TBS-BLHs on 12 December (24 December) were 110, 170, 365, 910, 528, and 110 m (160, 190, 242, 1050, 266, and 50 m) at 02:00, 08:00, 11:00, 14:00, 17:00, and 20:00, respectively.
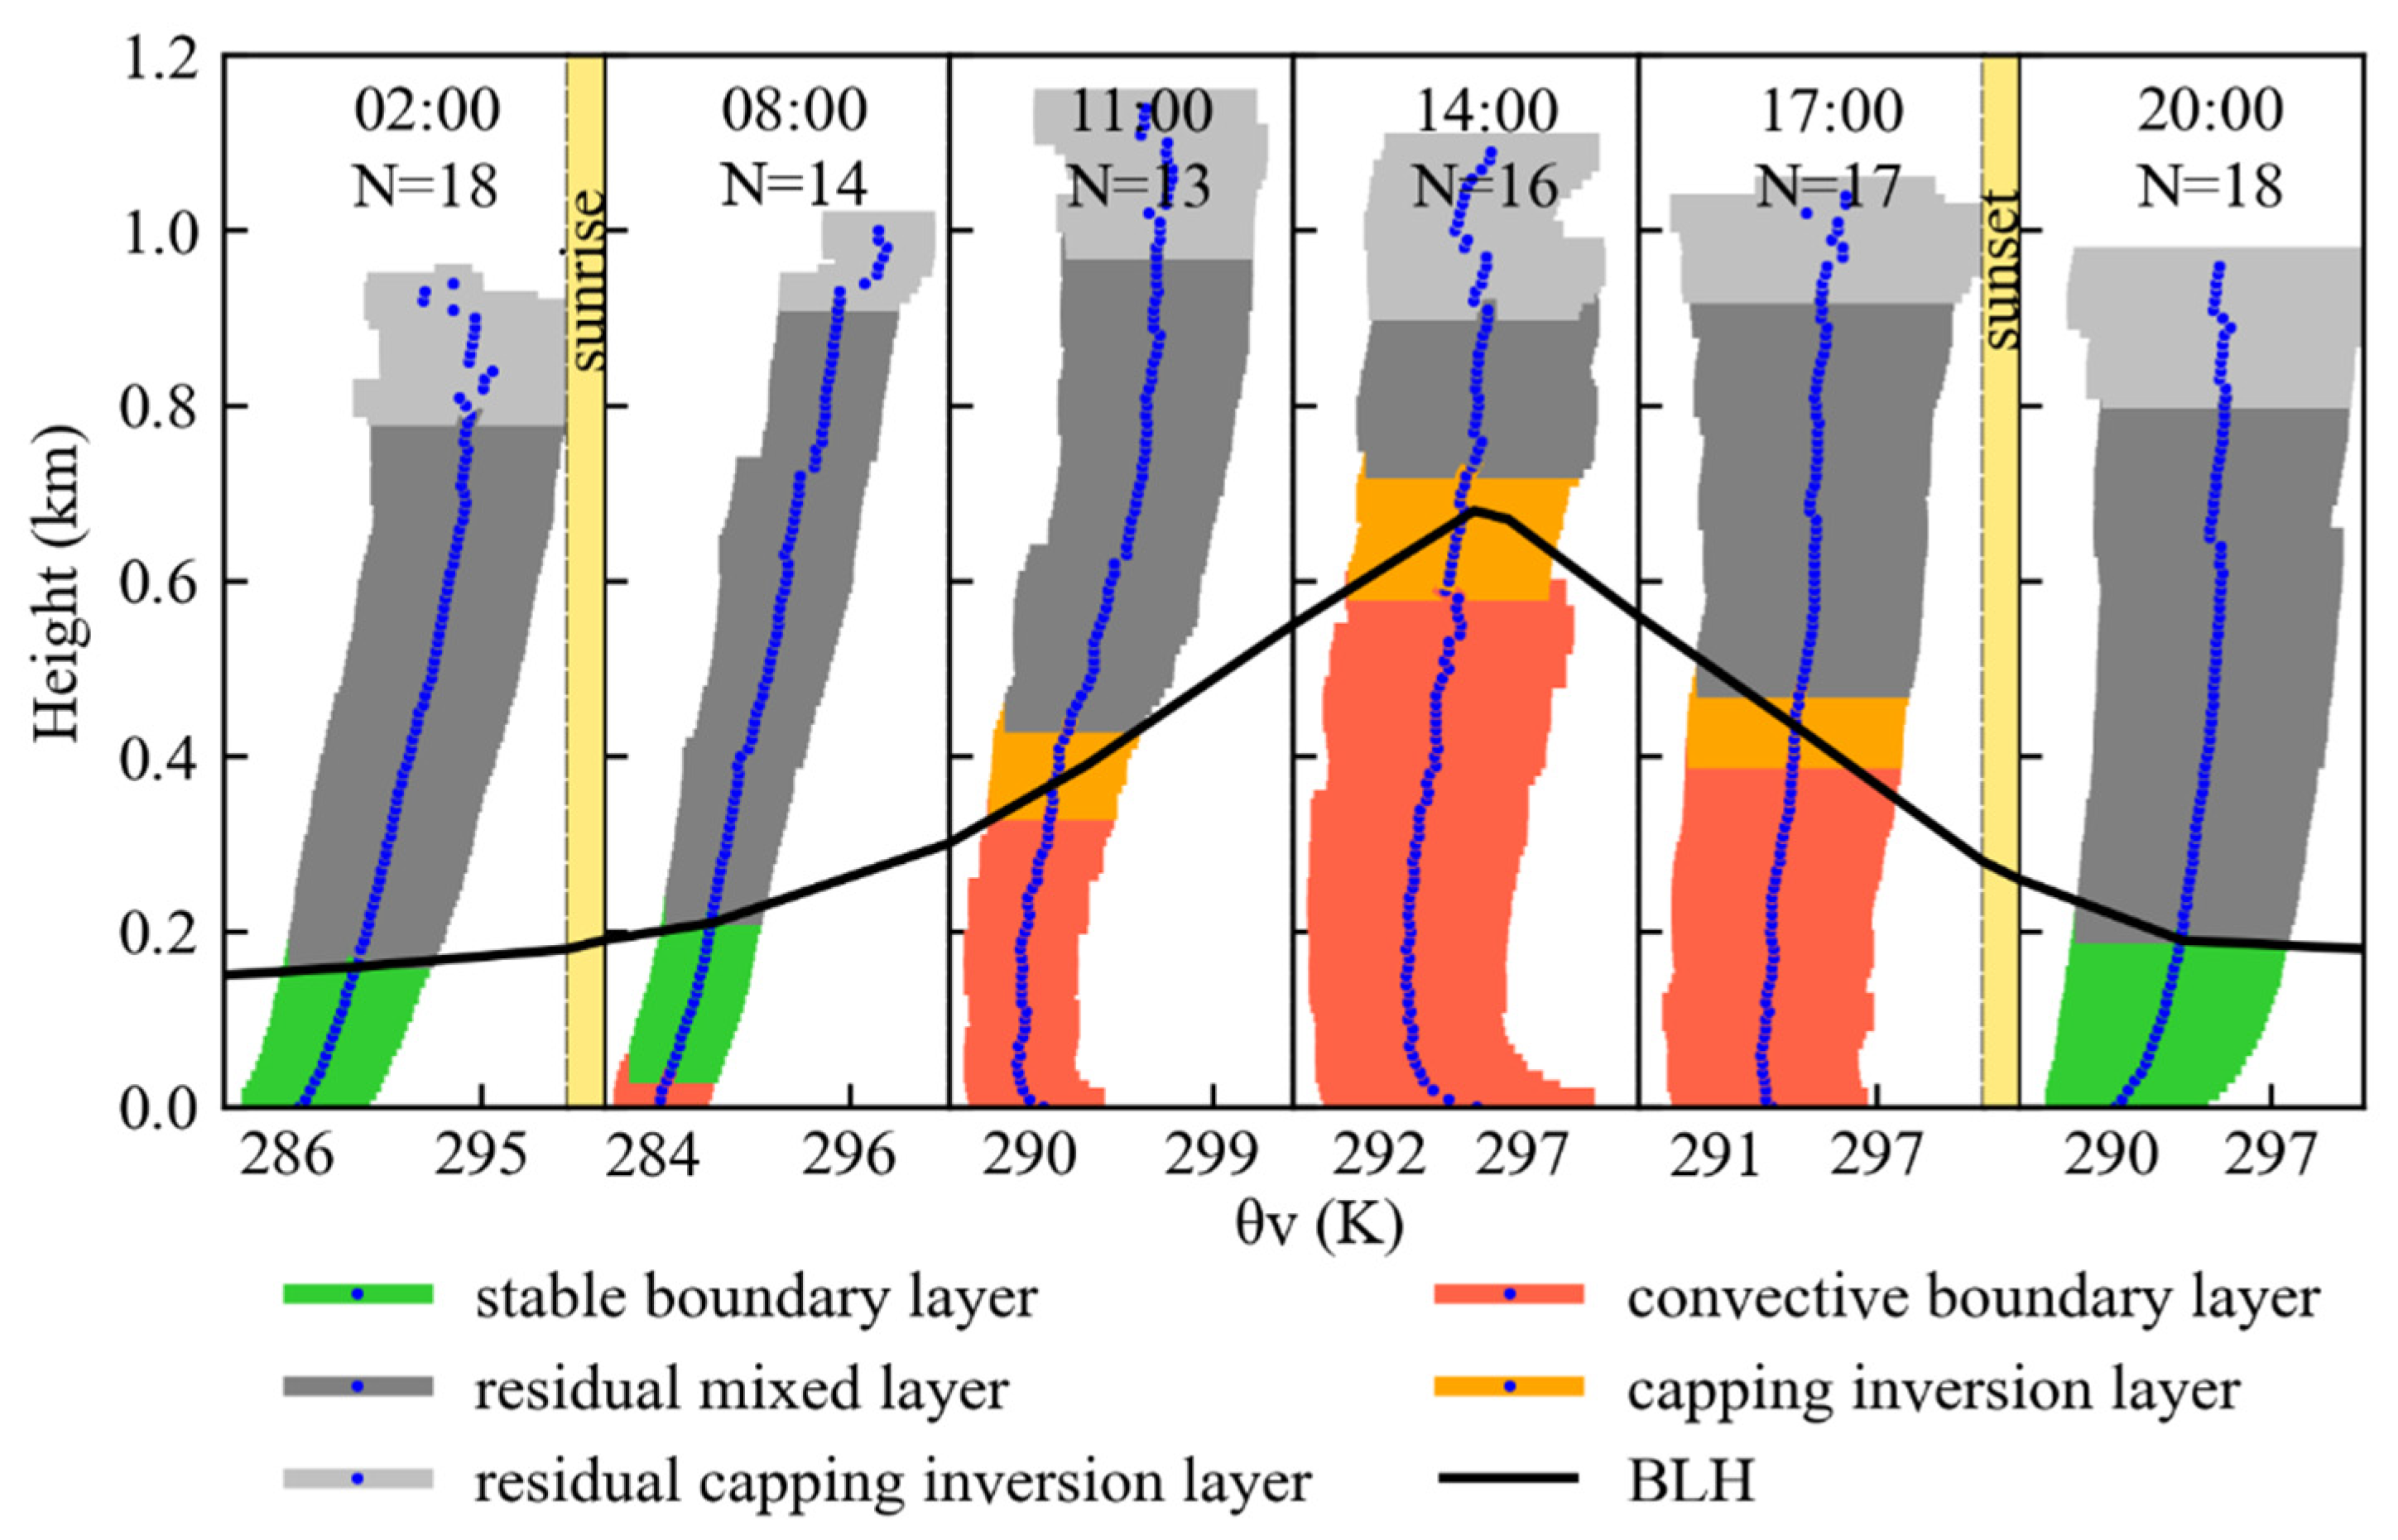
The virtual potential temperature profiles at 02:00, 08:00, 11:00, 14:00, 17:00, and 20:00 were averaged to represent wintertime diurnal variations in the atmospheric boundary layer at SACOL (Figure 5), which clearly showed the development of the convective boundary layer and nocturnal stable boundary layer. The average BLHs derived from these profiles were 170, 210, 393, 676, 423, and 190 m at 02:00, 08:00, 11:00, 14:00, 17:00, and 20:00, respectively. The stable boundary layers at 20:00 might be inaccurate because convective boundary layers also contributed to BLHs at this time.
More detailed diurnal variations in atmospheric boundary layers can be obtained by using sounding data with high time resolution. Our atmospheric boundary layer diurnal variation results had the highest time resolution published for Northwest China, other than those in Zhang and Wang (2008) [71] based on the eight profiles taken per day. The observation in Zhang and Wang (2008) [71] was conducted twenty years ago during May to June 2000 and the site of the observation was in an arid region of Dunhuang. The influence of atmospheric boundary layer on the surface air pollution concentration in Northwest China was studied using the operational radiosonde sounding data at 08:00 and 20:00 in recent years [72]. The operational radiosonde sounding data were only available during the local early morning (08:00) and late afternoon (20:00) transition times, making it impossible to study the issue under typical convective boundary layer and stable boundary layer conditions in the region. The high-precision and -resolution BLH results in the present study provide valuable information for urban air pollution studies and predications in the study region.

3.2. Diurnal Variations in Atmospheric Boundary Layer from Lidar Data

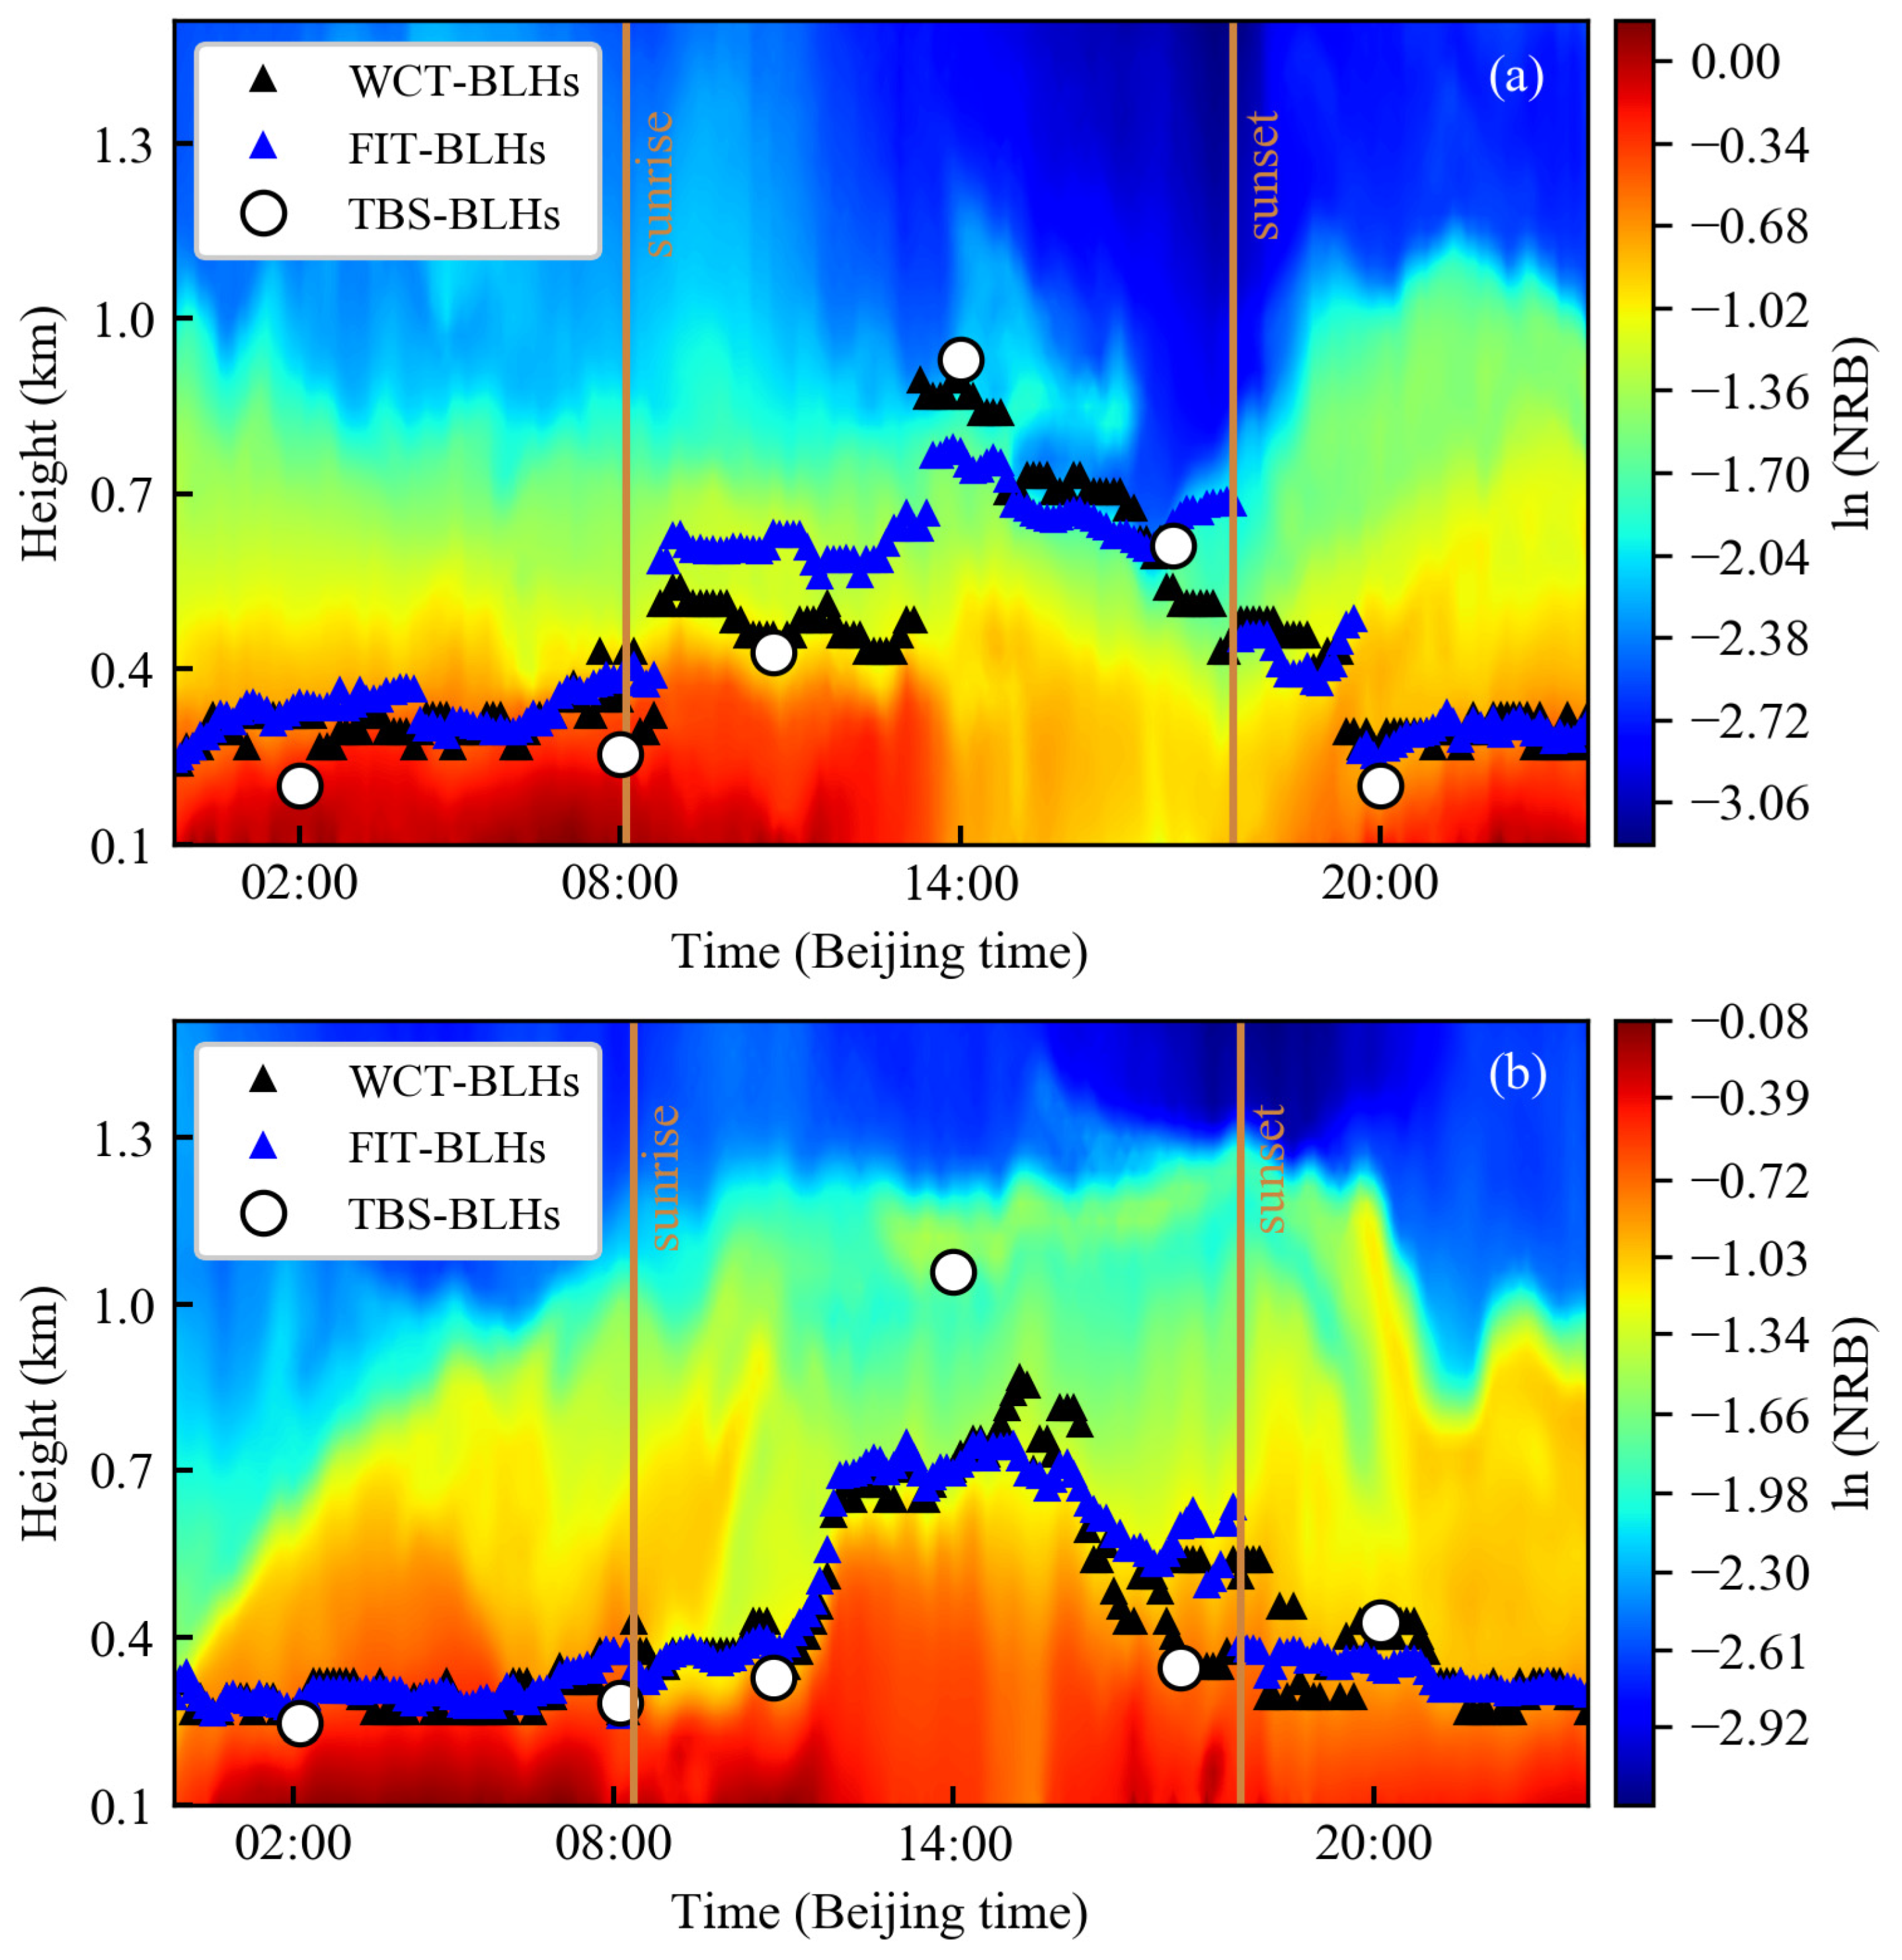
The lidar observations on 12 December and 24 December 2019 were used to assess the diurnal variations of BLH using WCT and FIT methods (Figure 6). Near the ground, there were relatively high ln (NRB) signal values during nighttime and low values during daytime, indicating the influence of BLH on the vertical distribution of aerosols. The contribution of aerosol humidification on the lidar signal during the observation period was small due to low relative humidity (42% during nighttime and 51% during daytime) [73,74]. Overall, the vertical distribution of atmospheric aerosols in the atmospheric boundary layer was controlled by the BLH to a large extent and the lidar profiles could determine BLH reasonably. Both WCT and FIT determined BLH locations at transitional places within the lidar profiles and properly captured the diurnal evolution of BLHs. The WCT-BLHs and FIT-BLHs generally matched the TBS-BLHs, though they seemed to be slightly overestimated at 02:00, 08:00, and 20:00 for the selected two days, which may have been caused by aerosols in the elevated residual mixed layers. Thus, nighttime lidar observations should be carefully treated to obtain reasonable BLHs. The WCT and FIT methods generally obtained consistent diurnal variations in BLH, though the latter exhibited smaller fluctuations than the former.
The WCT-BLH and FIT-BLH were comparable (~750 m) but both were lower than the TBS-BLH (1020 m) at 14:00 on 24 December (Figure 6b). As seen from the TBS temperature profile at 14:00 on 24 December (Figure 4b), a few shallow inversion layers were present in the atmospheric boundary layer, which inhibited the vertical mixing of aerosols. The inversion layers in temperature profile from 500 m to 600 m led to the highest gradient in ln (NRB) signal at ~750 m, which was defined as the top of the atmospheric boundary layer by both WCT and FIT methods. Moreover, there was a cold front from the north and the wind speed was high on 24 December (Figures S6 and S7) which makes it more complicated to retrieve BLH from both TBS and lidar data. The example on 24 December suggested that a large difference may be exhibited in BLHs from lidar and TBS data; improving the retrieval method of lidar-BLH does not help to yield accurate BLH from lidar observations under such complicated conditions.
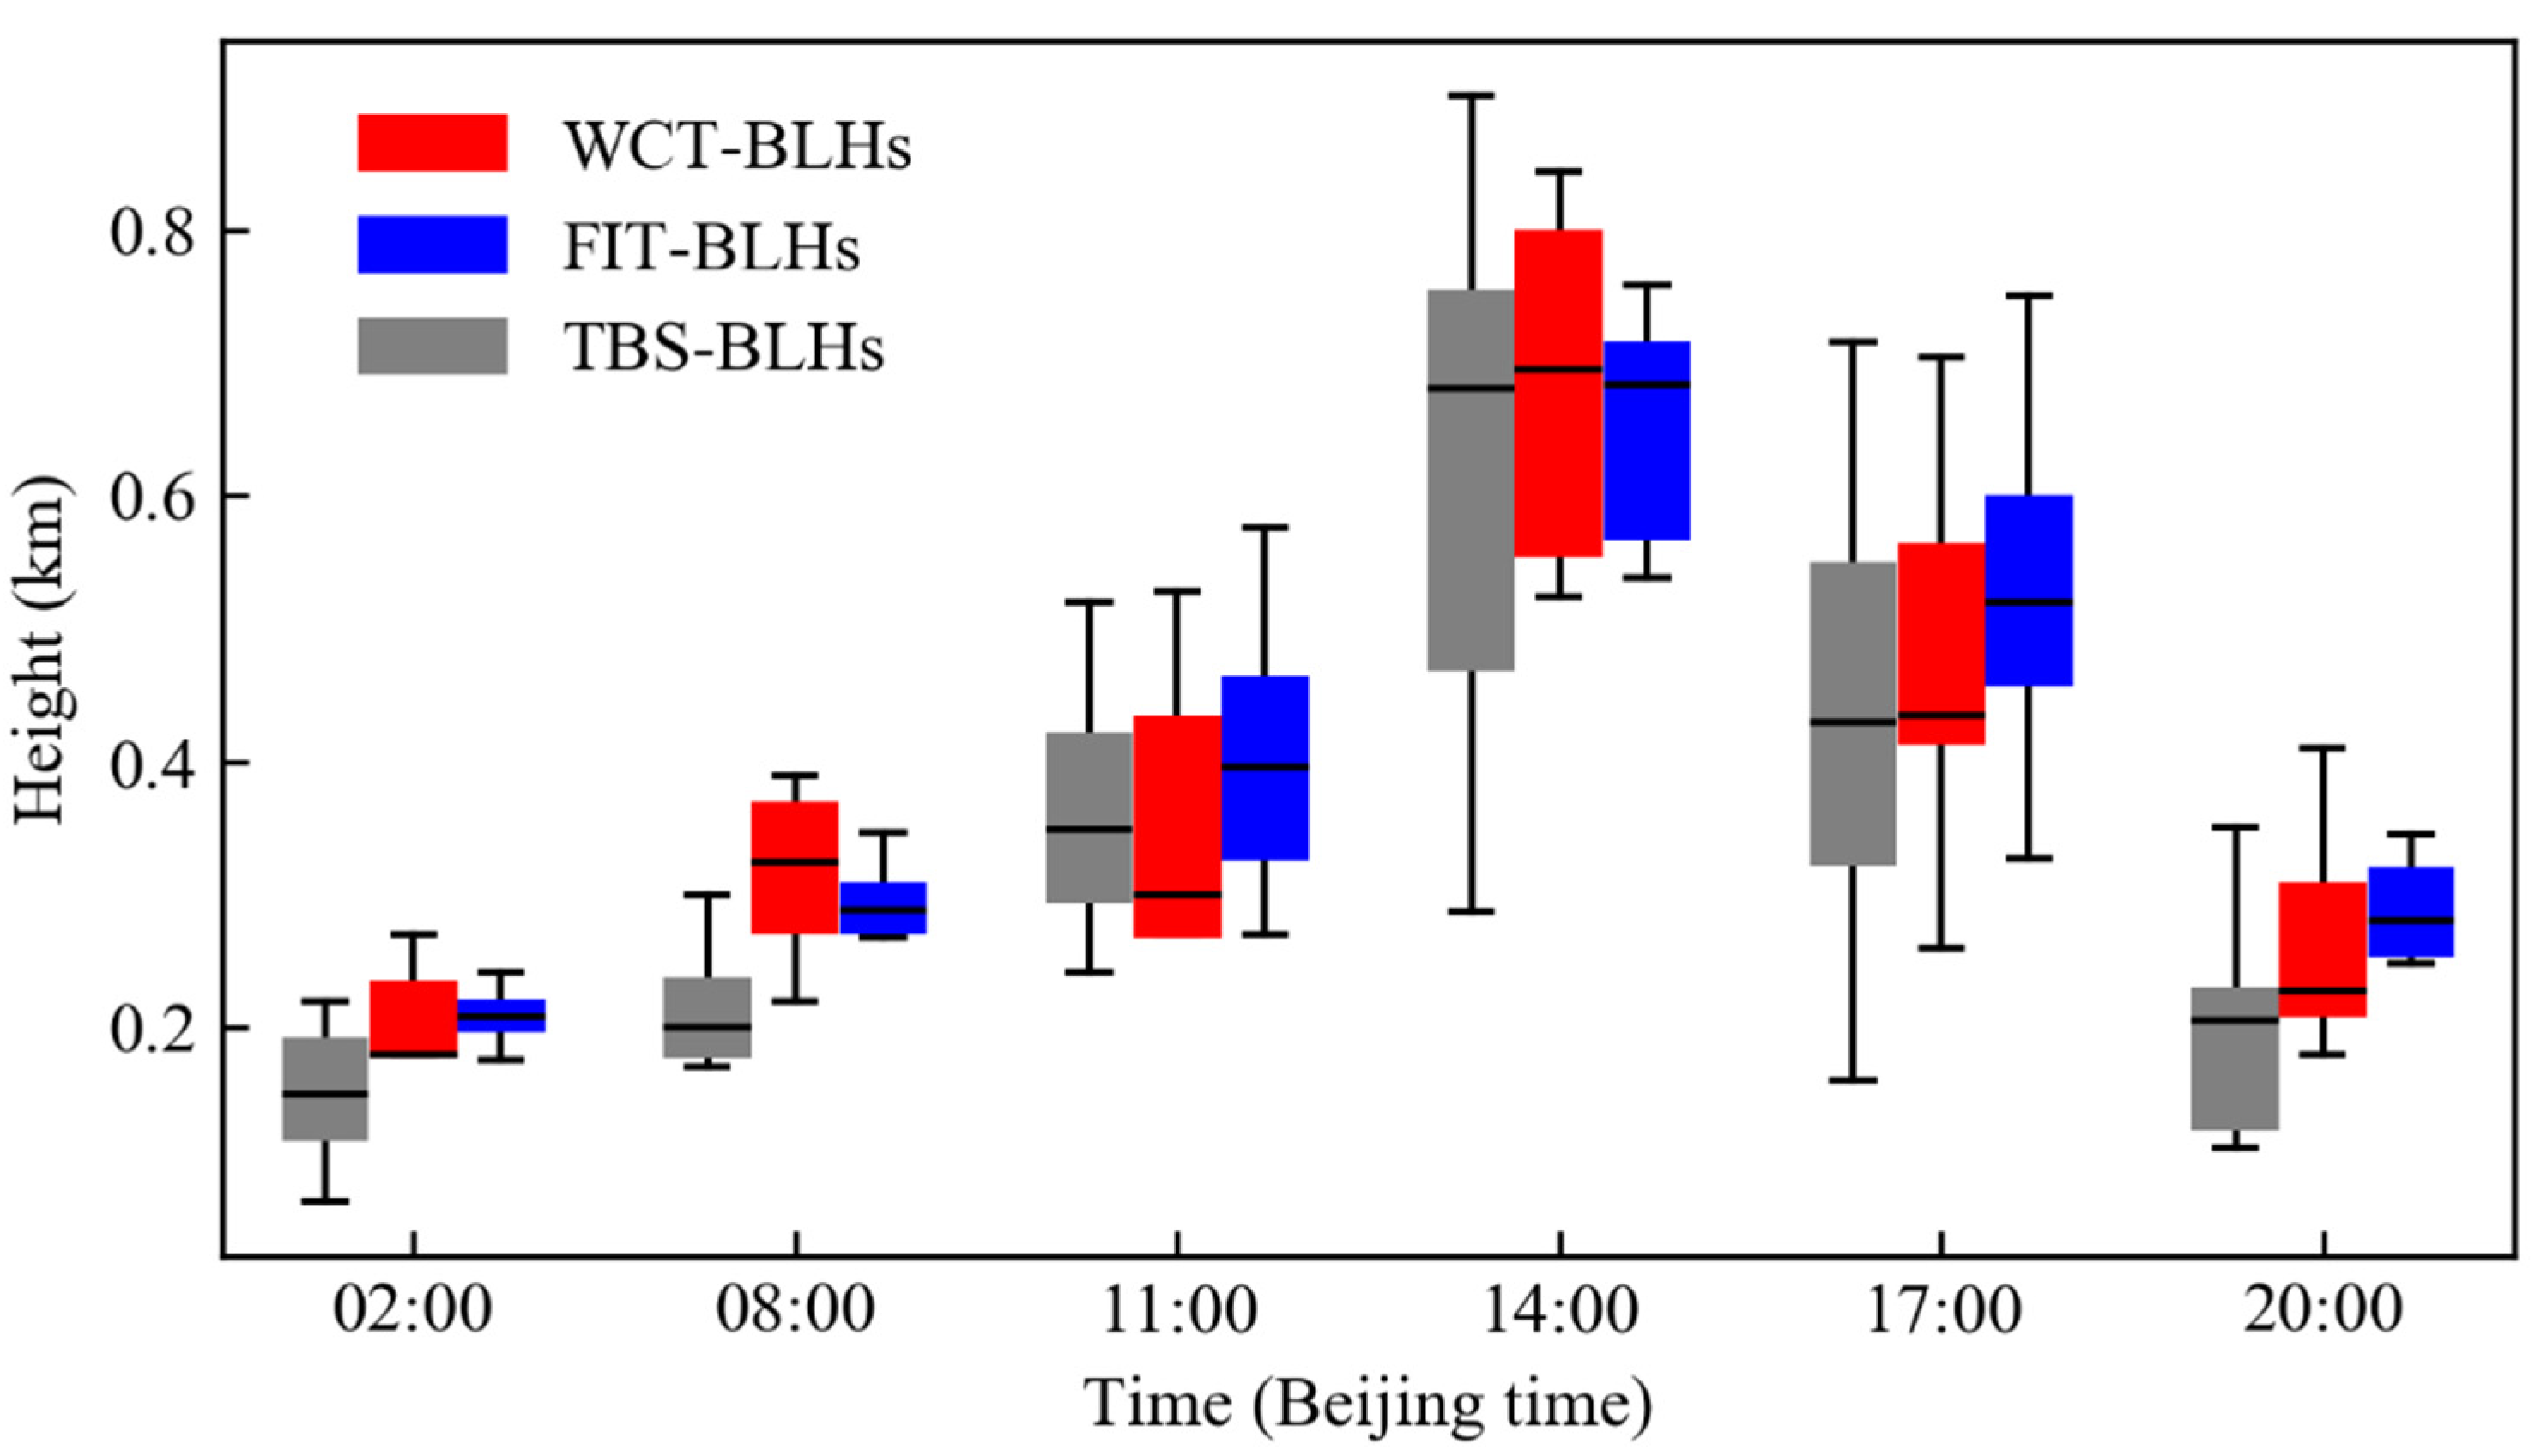
Both WCT and FIT methods reasonably captured the diurnal evolution of BLH during the observation period at SACOL (Figure 7). The FIT-BLHs exhibited good consistency with the WCT-BLHs but seemed to be slightly higher than WCT-BLHs, especially during the daytime. This overestimation might be attributed to the influence of elevated aerosols in the residual mixed layers. The standard errors of the WCT-BLHs were generally higher than those of the FIT-BLHs, indicating better stability of the FIT method in determining BLH from lidar observations.

3.3. Comparison between BLHs Derived from Lidar Observations and TBS Data

The BLHs derived from lidar observations were compared with those derived from TBS data (Figure 8 and Figure 9). Here, the lidar-BLHs were matched with 58 of the 96 tethered balloon launches. The Pearson correlation coefficients between WCT-BLHs and TBS-BLHs and FIT-BLHs and TBS-BLHs were 0.91 and 0.89, respectively, indicating good consistency between BLHs derived from lidar observations and TBS data. Generally, the Pearson coefficient of correlation and coefficient of determination are used to determine the magnitude of the relation between lidar-BLHs and sounding BLHs. The coefficient of determination, square of the correlation coefficient, is interpreted as the percentage of variance in one variable that is predicted or explained by the other [75]. Some studies have reported coefficient of determination between WCT-BLHs and radiosonde-BLHs of 0.89 for 48 clear sky daytime cases in Houston, USA [49], 0.88 for 23 cases between 13:57 and 21:34 UTC in Maryland, USA [29], and 0.68 for a number of cases in Southern Great Plains site in Oklahoma, USA (36°36′N, 97°29′W) [40]. Moreover, reported correlation coefficients between WCT-BLHs (FIT-BLHs) and radiosonde BLHs include 0.96 (0.94) for 41 cases in early morning and late afternoon transition times (08:00 and 20:00 (Beijing time)) in Lanzhou, China [42], 0.86 (0.88) for 18 cases at 08:00 and 20:00 (Beijing time) in Lanzhou, China [55], and 0.84 for ~65 cases between 06:30 and 18:30 (local time) at Southern Great Plains in Oklahoma, USA [38].
High resolution data (i.e., multiple soundings per day) were able to reveal the diurnal variations in deviations between Lidar-BLHs and TBS-BLHs (Figure 9). The bias and standard deviation were used to evaluate and quantify the deviations [76,77]. Here, the bias is the difference between the means of lidar-BLHs and TBS-BLHs (Equation (S1)), the standard deviation (Equation (S2)) is the root-mean-square value of the departures of the individual pair sample differences from the bias [49], and the t test is used to define the statistical significance of the bias (Equation (S3)). The overall biases between the TBS-BLHs and the WCT-BLHs (37 ± 79 m) and FIT-BLHs (52 ± 89 m) (not statistically significant; p > 0.05) indicated a very good overall performance by the lidar-based methods. The diurnal variation of the deviations is valuable in validating lidar-BLHs because deviation at a certain time of the day might not be applicable to other times (Figure S8). The average heights of WCT-BLHs and FIT-BLHs were closest to TBS-BLHs with the bias for 65 ± 106 m (p < 0.05) and 32 ± 148 m (not statistically significant; p > 0.05), respectively, when convection boundary layer heights were at peak, at 14:00. There were small biases between WCT-BLHs and TBS-BLHs for −5 ± 50 m (p < 0.05) and 33 ± 100 m (p < 0.05), respectively, and FIT-BLHs were always more overestimated than TBS-BLHs with the biases of 40 ± 89 m (p < 0.05) and 76 ± 91 m (not statistically significant; p > 0.05) at 11:00 and 17:00, respectively. Moreover, lidar-BLHs were overestimated more obviously with the biases between 41 ± 72 m (p < 0.05) and 66 ± 96 m (not statistically significant; p > 0.05), during the transition period and nighttime (at 02:00, 08:00, and 20:00). Overall, the lidar-based methods slightly overestimated the BLHs most of the time of the day, and the nighttime. In addition, the root-mean-square error (Equation (S4)) between the TBS-BLHs and WCT-BLHs (FIT-BLHs) also showed diurnal variations of 82, 132, 47, 118, 101, and 119 m (82, 97, 92, 142, 116, and 129 m) at 02:00, 08:00, 11:00, 14:00, 17:00, and 20:00, respectively. The overall root-mean-square error of the WCT-BLHs and FIT-BLHs were 105 m and 110 m, respectively. The lidar-BLHs during daytime (i.e., 11:00, 14:00, and 17:00 Beijing time) exhibited very good consistency with the TBS-BLHs, while those during transition times (08:00 and 20:00 Beijing time) and nighttime (02:00 Beijing time) showed more uncertainties when considering both bias and relative errors between lidar-BLHs and TBS-BLHs. Thus, validating lidar-BLHs using observations at transition times may introduce extra errors.
Other studies have reported mean biases between WCT-BLHs and radiosonde-BLHs of 51.1 m for 48 clear sky daytime cases in Houston, USA [49], 280 m for early morning and late afternoon transition times (08:00 and 20:00, Beijing time) in Lanzhou, China [42], and 288 m for 67 daytime cases and 561 m for 64 nighttime cases in Seoul, South Korea [78]. Reported mean biases between FIT-BLHs and radiosonde BLHs include 220 m for early morning and late afternoon transition times (08:00 and 20:00, Beijing time) in Lanzhou, China [42]. The mean overall root-mean-square error of WCT in our study was much lower than that of 105 m in Liu and Liang (2010) [79], 377 m in Li et al. (2020) [80], and 310 m in Su et al. (2020) [38]. Besides the Wang et al. (2016) [53] (used four sounding profiles per day to validate lidar-BLHs in Anhui, China), Sawyer and Li (2013) [40] (used eight sounding profiles per day to validate lidar-BLHs in Southern Great Plains site, USA), and Lee et al. (2019) [54] (used eighteen sounding profiles on a single day to validate BLH derived from a ceilometer, the signal of which is like that of a lidar), few studies have used more than six soundings per day to validate the diurnal variation of lidar-BLHs. Overall, our results not only reveal generally consistent results but also showed evident diurnal variations in bias and root-mean-square error for lidar-BLHs and TBS-BLHs. To our best knowledge, our study presents the first comprehensive high-resolution results (3 h time resolution during daytime) on the comparison between lidar-BLHs and TBS-BLHs in China.

4. Summary and Conclusions

As a vital parameter in atmospheric air pollution studies and predications, high-resolution BLHs are usually retrieved from lidar observations. To obtain high-precision and -resolution BLHs and validate their retrieval from lidar observations, simultaneous tethered balloon sounding and lidar observations were conducted at SACOL in Northwest China during 2019–2020 winter with the following main findings.
The Holzworth method and temperature inversion method were selected to derive BLHs (TBS-BLHs) in daytime and nighttime, respectively. The development of the atmospheric boundary was clearly revealed by the high-resolution tethered balloon sounding data. Based on 96 sounding profiles, BLHs were determined as 170, 210, 393, 676, 423, and 190 m at 02:00, 08:00, 11:00, 14:00, 17:00, and 20:00, Beijing time, respectively. These high-resolution TBS-BLHs are valuable for quantifying the dispersion of air pollution in the study region.
The diurnal evolution of BLHs was reasonably captured by both the lidar observation-based WCT and FIT methods, which exhibited correlation coefficients of 0.91 and 0.89, respectively, with TBS-BLHs. Overall, the lidar-based methods slightly overestimated BLHs, which was generally acceptable when considering both the absolute and relative errors compared with the TBS-BLHs. The FIT method exhibited better stability than the WCT method. The lidar-BLHs during daytime exhibited very good consistency with the TBS-BLHs, while those during transition times and nighttime showed more uncertainties when considering both bias and relative errors between lidar-BLHs and TBS-BLHs. Thus, validating lidar-BLHs using observations at transition times may introduce extra errors.
Our results revealed high-resolution and -accuracy diurnal variations of BLHs based on tethered balloon sounding observations at the site of SACOL in Northwest China. The diurnal variation in retrieval errors in lidar-BLHs suggests the importance of validating lidar-based BLHs using simultaneous sounding data. To our best knowledge, our study presents the first comprehensive high-resolution results (3 h time resolution during daytime) on the comparison between lidar-BLHs and TBS-BLHs in China.

Supplementary Materials

The following are available online at https://www.mdpi.com/article/10.3390/rs13091781/s1, Figure S1: Comparisons between BLHs derived from bulk Richardson number (Rb) method with us=0 and us≠0 in daytime, Figure S2: Comparisons between BLHs derived from bulk Richardson number (Rb) method and tethered balloon sounding (TBS) method (a) Holzworth method in daytime and (b) Temperature inversion method in nighttime, Figure S3: Comparisons between BLHs derived from Temperature inversion method and wind shear method in nighttime, Figure S4: Profiles of (a) 02:00 (Beijing time) and (b) 08:00 (Beijing time), 24 December 2019 explain the low stable boundary layer height when the us and vs were not set to zero in the bulk Richardson number (Rb) method in nighttime, Figure S5: Difference of atmospheric aerosols and BLHs by Wavelet Covariance Transform (WCT) and Ideal Profile Fitting (FIT) method on 12 December 2019 (a) based on logarithm of the normalized range-corrected backscattering signal (ln (NRB)) and (b) normalized range corrected backscattering signal (NRB), Figure S6: Weather maps at 700hPa on (a) 24 December and (b) 25 December 2019 (The Weather maps are available from http://www.nmc.cn/), Figure S7: Weather maps at surface on (a) 24 December and (b) 25 December 2019 (The Weather maps are available from http://www.nmc.cn/), Figure S8. (a) bias and (b) relative errors between lidar-BLHs and TBS-BLHs. The WCT-BLHs and FIT-BLHs were BLHs derived by WCT and FIT methods based on lidar data, respectively, Table S1: Detailed information of the tethered sounding system KZXLT-II, Table S2: Detailed information of the Sigma MiniMPL lidar.

Author Contributions

Conceptualization, P.T. and L.Z.; methodology, M.Z. and P.T.; software, M.Z.; validation, M.Z., P.T., J.L., and L.Z.; formal analysis, M.Z. and P.T.; investigation, P.T., M.Z., and H.Z.; resources, P.T. and L.Z.; data curation, P.T. and M.Z.; writing—original draft preparation, P.T., M.Z., and L.W.; writing—review and editing, P.T., M.Z., H.Z., J.L., and L.Z.; visualization, M.Z. and P.T.; supervision, L.Z., J.L., and X.C.; project administration, P.T.; funding acquisition, P.T. and L.Z. All authors have read and agreed to the published version of the manuscript.

Funding

This research was funded by the National Natural Science Foundation of China, grant numbers 91744311 and 41905017, and the Fundamental Research Funds for the Central Universities, grant number lzujbky-2020-36.

Informed Consent Statement

Not applicable.

Data Availability Statement

The data presented in this study are available in the Supplementary Materials.

Acknowledgments

The authors acknowledge the staffs from SACOL and those who participated in the field campaign, including Tao Du, Xu Guan, Chenguang Tang, Zhida Zhang, Min Wang, Yunshu Zhang, Lianglin Zhang, Li’ang Pei, Kailong Zhou, Chaofeng Pan, Baiyu Chen, Xinshi Shen, Rongqiang Zhao, Hai Xiong, Ruixiang Zhang, Ang Gao, Junpeng Zhang, and Kun Zhe. Thanks to Zhiting Wang for constructive comments during personal discussions.

Conflicts of Interest

The authors declare no conflict of interest.

References

  1. Stull, R.B. An Introduction to Boundary Layer Meteorology. Atmos. Sci. Libr. 1988, 8, 89. [Google Scholar]
  2. Barbaro, E.; de Arellano, J.V.-G.; Ouwersloot, H.G.; Schröter, J.S.; Donovan, D.P.; Krol, M.C. Aerosols in the convective boundary layer: Shortwave radiation effects on the coupled land-atmosphere system. J. Geophys. Res. Atmos. 2014, 119, 5845–5863. [Google Scholar] [CrossRef]
  3. Zhu, X.; Tang, G.; Guo, J.; Hu, B.; Song, T.; Wang, L.; Xin, J.; Gao, W.; Münkel, C.; Schäfer, K.; et al. Mixing layer height on the North China Plain and meteorological evidence of serious air pollution in southern Hebei. Atmos. Chem. Phys. 2018, 18, 4897–4910. [Google Scholar] [CrossRef] [Green Version]
  4. Han, W.; Li, Z.; Guo, J.; Su, T.; Chen, T.; Wei, J.; Cribb, M. The Urban–Rural Heterogeneity of Air Pollution in 35 Metropolitan Regions across China. Remote Sens. 2020, 12, 2320. [Google Scholar] [CrossRef]
  5. Tang, G.; Zhao, P.; Wang, Y.; Gao, W.; Cheng, M.; Xin, J.; Li, X.; Wang, Y. Mortality and air pollution in Beijing: The long-term relationship. Atmos. Environ. 2017, 150, 238–243. [Google Scholar] [CrossRef]
  6. Dandou, A.; Tombrou, M.; Schäfer, K.; Emeis, S.; Protonotariou, A.P.; Bossioli, E.; Soulakellis, N.; Suppan, P. A Comparison Between Modelled and Measured Mixing-Layer Height Over Munich. Bound. Layer Meteorol. 2009, 131, 425–440. [Google Scholar] [CrossRef]
  7. Su, T.; Li, Z.; Kahn, R. Relationships between the planetary boundary layer height and surface pollutants derived from lidar observations over China: Regional pattern and influencing factors. Atmos. Chem. Phys. 2018, 18, 15921–15935. [Google Scholar] [CrossRef] [Green Version]
  8. Miao, Y.; Li, J.; Miao, S.; Che, H.; Wang, Y.; Zhang, X.; Zhu, R.; Liu, S. Interaction Between Planetary Boundary Layer and PM2.5 Pollution in Megacities in China: A Review. Curr. Pollut. Rep. 2019, 5, 261–271. [Google Scholar] [CrossRef] [Green Version]
  9. Xiang, Y.; Zhang, T.; Liu, J.; Lv, L.; Dong, Y.; Chen, Z. Atmosphere boundary layer height and its effect on air pollutants in Beijing during winter heavy pollution. Atmos. Res. 2019, 215, 305–316. [Google Scholar] [CrossRef]
  10. Yang, Y.; Fan, S.; Wang, L.; Gao, Z.; Zhang, Y.; Zou, H.; Miao, S.; Li, Y.; Huang, M.; Yim, S.H.L.; et al. Diurnal Evolution of the Wintertime Boundary Layer in Urban Beijing, China: Insights from Doppler Lidar and a 325-m Meteorological Tower. Remote Sens. 2020, 12, 3935. [Google Scholar] [CrossRef]
  11. Chen, Z.; Chen, D.; Zhao, C.; Kwan, M.P.; Cai, J.; Zhuang, Y.; Zhao, B.; Wang, X.; Chen, B.; Yang, J.; et al. Influence of meteorological conditions on PM2.5 concentrations across China: A review of methodology and mechanism. Environ. Int. 2020, 139, 105558. [Google Scholar] [CrossRef]
  12. Li, Z.; Guo, J.; Ding, A.; Liao, H.; Liu, J.; Sun, Y.; Wang, T.; Xue, H.; Zhang, H.; Zhu, B. Aerosol and boundary-layer interactions and impact on air quality. Natl. Sci. Rev. 2017, 4, 810–833. [Google Scholar] [CrossRef]
  13. Yin, J.; Gao, C.Y.; Hong, J.; Gao, Z.; Li, Y.; Li, X.; Fan, S.; Zhu, B. Surface Meteorological Conditions and Boundary Layer Height Variations During an Air Pollution Episode in Nanjing, China. J. Geophys. Res. Atmos. 2019, 124, 3350–3364. [Google Scholar] [CrossRef]
  14. Zhang, H.; Zhang, X.; Li, Q.; Cai, X.; Fan, S.; Song, Y.; Hu, F.; Che, H.; Quan, J.; Kang, L.; et al. Research Progress on Estimation of the Atmospheric Boundary Layer Height. J. Meteorol. Res. 2020, 34, 482–498. [Google Scholar] [CrossRef]
  15. Ferrero, L.; Riccio, A.; Perrone, M.G.; Sangiorgi, G.; Ferrini, B.S.; Bolzacchini, E. Mixing height determination by tethered balloon-based particle soundings and modeling simulations. Atmos. Res. 2011, 102, 145–156. [Google Scholar] [CrossRef]
  16. Seidel, D.J.; Zhang, Y.; Beljaars, A.; Golaz, J.-C.; Jacobson, A.R.; Medeiros, B. Climatology of the planetary boundary layer over the continental United States and Europe. J. Geophys. Res. Atmos. 2012, 117, 117. [Google Scholar] [CrossRef]
  17. Guo, J.; Miao, Y.; Zhang, Y.; Liu, H.; Li, Z.; Zhang, W.; He, J.; Lou, M.; Yan, Y.; Bian, L.; et al. The climatology of planetary boundary layer height in China derived from radiosonde and reanalysis data. Atmos. Chem. Phys. 2016, 16, 13309–13319. [Google Scholar] [CrossRef] [Green Version]
  18. Zhang, W.; Guo, J.; Miao, Y.; Liu, H.; Song, Y.; Fang, Z.; He, J.; Lou, M.; Yan, Y.; Li, Y.; et al. On the Summertime Planetary Boundary Layer with Different Thermodynamic Stability in China: A Radiosonde Perspective. J. Clim. 2018, 31, 1451–1465. [Google Scholar] [CrossRef]
  19. Zhao, H.; Che, H.; Xia, X.; Wang, Y.; Wang, H.; Wang, P.; Ma, Y.; Yang, H.; Liu, Y.; Wang, Y.; et al. Climatology of mixing layer height in China based on multi-year meteorological data from 2000 to 2013. Atmos. Environ. 2019, 213, 90–103. [Google Scholar] [CrossRef]
  20. Allabakash, S.; Lim, S. Climatology of Planetary Boundary Layer Height-Controlling Meteorological Parameters Over the Korean Peninsula. Remote Sens. 2020, 12, 2571. [Google Scholar] [CrossRef]
  21. Su, T.; Li, J.; Li, C.; Xiang, P.; Lau, A.K.-H.; Guo, J.; Yang, D.; Miao, Y. An intercomparison of long-term planetary boundary layer heights retrieved from CALIPSO, ground-based lidar, and radiosonde measurements over Hong Kong. J. Geophys. Res. Atmos. 2017, 122, 3929–3943. [Google Scholar] [CrossRef]
  22. De Arruda Moreira, G.; Guerrero-Rascado, J.L.; Bravo-Aranda, J.A.; Benavent-Oltra, J.A.; Ortiz-Amezcua, P.; Róman, R.; Bedoya-Velásquez, A.E.; Landulfo, E.; Alados-Arboledas, L. Study of the planetary boundary layer by microwave radiometer, elastic lidar and Doppler lidar estimations in Southern Iberian Peninsula. Atmos. Res. 2018, 213, 185–195. [Google Scholar] [CrossRef] [Green Version]
  23. Zhu, X.; Tang, G.; Lv, F.; Hu, B.; Cheng, M.; Münkel, C.; Schäfer, K.; Xin, J.; An, X.; Wang, G.; et al. The spatial representativeness of mixing layer height observations in the North China Plain. Atmos. Res. 2018, 209, 204–211. [Google Scholar] [CrossRef]
  24. Du, L.; Pan, Y.N.; Wang, W. Random Sample Fitting Method to Determine the Planetary Boundary Layer Height Using Satellite-Based Lidar Backscatter Profiles. Remote Sens. 2020, 12, 4006. [Google Scholar] [CrossRef]
  25. Fan, S.; Gao, Z.; Kalogiros, J.; Li, Y.; Yin, J.; Li, X. Estimate of boundary-layer depth in Nanjing city using aerosol lidar data during 2016–2017 winter. Atmos. Environ. 2019, 205, 67–77. [Google Scholar] [CrossRef]
  26. Kotthaus, S.; Haeffelin, M.; Drouin, M.-A.; Dupont, J.-C.; Grimmond, S.; Haefele, A.; Hervo, M.; Poltera, Y.; Wiegner, M. Tailored Algorithms for the Detection of the Atmospheric Boundary Layer Height from Common Automatic Lidars and Ceilometers (ALC). Remote Sens. 2020, 12, 3259. [Google Scholar] [CrossRef]
  27. Liu, B.; Guo, J.; Gong, W.; Shi, Y.; Jin, S. Boundary Layer Height as Estimated from Radar Wind Profilers in Four Cities in China: Relative Contributions from Aerosols and Surface Features. Remote Sens. 2020, 12, 1657. [Google Scholar] [CrossRef]
  28. Amiridis, V.; Melas, D.; Balis, D.S.; Papayannis, A.; Founda, D.; Katragkou, E.; Giannakaki, E.; Mamouri, R.E.; Gerasopoulos, E.; Zerefos, C. Aerosol Lidar observations and model calculations of the Planetary Boundary Layer evolution over Greece, during the March 2006 Total Solar Eclipse. Atmos. Chem. Phys. 2007, 7, 6181–6189. [Google Scholar] [CrossRef] [Green Version]
  29. Lewis, J.R.; Welton, E.J.; Molod, A.M.; Joseph, E. Improved boundary layer depth retrievals from MPLNET. J. Geophys. Res. Atmos. 2013, 118, 9870–9879. [Google Scholar] [CrossRef]
  30. Korhonen, K.; Giannakaki, E.; Mielonen, T.; Pfüller, A.; Laakso, L.; Vakkari, V.; Baars, H.; Engelmann, R.; Beukes, J.P.; Van Zyl, P.G.; et al. Atmospheric Boundary Layer Top Height in South Africa: Measurements with Lidar and Radiosonde Compared to Three Atmospheric Models. Atmos. Chem. Phys. 2014, 14, 4263–4278. [Google Scholar] [CrossRef] [Green Version]
  31. Ma, Y.; Ye, J.; Xin, J.; Zhang, W.; Vilà-Guerau de Arellano, J.; Wang, S.; Zhao, D.; Dai, L.; Ma, Y.; Wu, X.; et al. The Stove, Dome, and Umbrella Effects of Atmospheric Aerosol on the Development of the Planetary Boundary Layer in Hazy Regions. Geophys. Res. Lett. 2020, 47. [Google Scholar] [CrossRef]
  32. Davis, K.J.; Gamage, N.; Hagelberg, C.R.; Kiemle, C.; Lenschow, D.H.; Sullivan, P.P. An Objective Method for Deriving Atmospheric Structure from Airborne Lidar Observations: American Meteorological Society. J. Atmos. Ocean. Technol. 2000, 17, 1455–1468. [Google Scholar] [CrossRef] [Green Version]
  33. Nisperuza, D.J.; Bedoya, A.E.; Alegría, D.L.; Múnera, M.; Jiménez, J.F.; Zapata, C.E.; Bastidas, Á. Lidar measurements and wavelet covariance transform method to estimate the atmospheric boundary layer heights in Medellín, Colombia. Óptica Pura Aplicada 2014, 47, 123–130. [Google Scholar] [CrossRef]
  34. Angelini, F.; Gobbi, G.P. Some remarks about lidar data preprocessing and different implementations of the gradient method for determining the aerosol layers. Ann. Geophys. 2014, 57, 1–25. [Google Scholar]
  35. Steven, D.G.; Baldi, M.; Hoff, R.M. The Detection of Mixed Layer Depth and Entrainment Zone Thickness from Lidar Backscatter Profiles: American Meteorological Society. J. Atmos. Ocean. Technol. 1999, 16, 953–959. [Google Scholar]
  36. Yang, T.; Wang, Z.; Zhang, W.; Gbaguidi, A.; Sugimoto, N.; Wang, X.; Matsui, I.; Sun, Y. Technical note: Boundary layer height determination from lidar for improving air pollution episode modeling: Development of new algorithm and evaluation. Atmos. Chem. Phys. 2017, 17, 6215–6225. [Google Scholar] [CrossRef] [Green Version]
  37. Kokkalis, P.; Alexiou, D.; Papayannis, A.; Rocadenbosch, F.; Soupiona, O.; Raptis, P.-I.; Mylonaki, M.; Tzanis, C.G.; Christodoulakis, J. Application and Testing of the Extended-Kalman-Filtering Technique for Determining the Planetary Boundary-Layer Height over Athens, Greece. Bound. Layer Meteorol. 2020, 176, 125–147. [Google Scholar] [CrossRef]
  38. Su, T.; Li, Z.; Kahn, R. A new method to retrieve the diurnal variability of planetary boundary layer height from lidar under different thermodynamic stability conditions. Remote Sens. Environ. 2020, 237, 111519. [Google Scholar] [CrossRef]
  39. Mao, F.; Gong, W.; Logan, T. Linear segmentation algorithm for detecting layer boundary with lidar. Opt Express 2013, 21, 26876–26887. [Google Scholar] [CrossRef]
  40. Sawyer, V.; Li, Z. Detection, variations and intercomparison of the planetary boundary layer depth from radiosonde, lidar and infrared spectrometer. Atmos. Environ. 2013, 79, 518–528. [Google Scholar] [CrossRef]
  41. Poltera, Y.; Martucci, G.; Collaud Coen, M.; Hervo, M.; Emmenegger, L.; Henne, S.; Brunner, D.; Haefele, A. PathfinderTURB: An automatic boundary layer algorithm. Development, validation and application to study the impact on in situ measurements at the Jungfraujoch. Atmos. Chem. Phys. 2017, 17, 10051–10070. [Google Scholar] [CrossRef] [Green Version]
  42. Dang, R.; Yang, Y.; Li, H.; Hu, X.-M.; Wang, Z.; Huang, Z.; Zhou, T.; Zhang, T. Atmosphere Boundary Layer Height (ABLH) Determination under Multiple-Layer Conditions Using Micro-Pulse Lidar. Remote Sens. 2019, 11, 263. [Google Scholar] [CrossRef] [Green Version]
  43. Zhong, T.; Wang, N.; Shen, X.; Xiao, D.; Xiang, Z.; Liu, D. Determination of Planetary Boundary Layer height with Lidar Signals Using Maximum Limited Height Initialization and Range Restriction (MLHI-RR). Remote Sens. 2020, 12, 2272. [Google Scholar] [CrossRef]
  44. Seibert, P.; Beyrich, F.; Gryning, S.-E.; Joffre, S.; Rasmussen, A.; Tercier, P. Review and intercomparison of operational methods for the determination of the mixing height. Atmos. Environ. 2000, 1, 569–613. [Google Scholar] [CrossRef]
  45. Seidel, D.J.; Ao, C.O.; Li, K. Estimating climatological planetary boundary layer heights from radiosonde observations: Comparison of methods and uncertainty analysis. J. Geophys. Res. 2010, 115. [Google Scholar] [CrossRef] [Green Version]
  46. Wang, H.; Li, Z.; Lv, Y.; Zhang, Y.; Xu, H.; Guo, J.; Goloub, P. Determination and climatology of the diurnal cycle of the atmospheric mixing layer height over Beijing 2013–2018: Lidar measurements and implications for air pollution. Atmos. Chem. Phys. 2020, 20, 8839–8854. [Google Scholar] [CrossRef]
  47. Wang, Z.; Cao, X.; Zhang, L.; Notholt, J.; Zhou, B.; Liu, R.; Zhang, B. Lidar measurement of planetary boundary layer height and comparison with microwave profiling radiometer observation. Atmos. Meas. Tech. 2012, 5, 1965–1972. [Google Scholar] [CrossRef] [Green Version]
  48. Lambrigtsen, B.H. Calibration of the AIRS microwave instruments. IEEE Trans. Geosci. Remote Sens. 2003, 41, 369–378. [Google Scholar] [CrossRef] [Green Version]
  49. Caicedo, V.; Rappenglück, B.; Lefer, B.; Morris, G.; Toledo, D.; Delgado, R. Comparison of aerosol lidar retrieval methods for boundary layer height detection using ceilometer aerosol backscatter data. Atmos. Meas. Tech. 2017, 10, 1609–1622. [Google Scholar] [CrossRef] [Green Version]
  50. Compton, J.C.; Delgado, R.; Berkoff, T.A.; Hoff, R.M. Determination of Planetary Boundary Layer Height on Short Spatial and Temporal Scales: A Demonstration of the Covariance Wavelet Transform in Ground-Based Wind Profiler and Lidar Measurements. J. Atmos. Ocean. Technol. 2013, 30, 1566–1575. [Google Scholar] [CrossRef]
  51. Haeffelin, M.; Angelini, F.; Morille, Y.; Martucci, G.; Frey, S.; Gobbi, G.P.; Lolli, S.; O’Dowd, C.D.; Sauvage, L.; Xueref-Rémy, I.; et al. Evaluation of Mixing-Height Retrievals from Automatic Profiling Lidars and Ceilometers in View of Future Integrated Networks in Europe. Bound. Layer Meteorol. 2011, 143, 49–75. [Google Scholar] [CrossRef]
  52. Dang, R.; Yang, Y.; Hu, X.-M.; Wang, Z.; Zhang, S. A Review of Techniques for Diagnosing the Atmospheric Boundary Layer Height (ABLH) Using Aerosol Lidar Data. Remote Sens. 2019, 11, 1590. [Google Scholar] [CrossRef] [Green Version]
  53. Wang, C.; Shi, H.; Jin, L.; Chen, H.; Wen, H. Measuring boundary-layer height under clear and cloudy conditions using three instruments. Particuology 2016, 28, 15–21. [Google Scholar] [CrossRef]
  54. Lee, J.; Hong, J.-W.; Lee, K.; Hong, J.; Velasco, E.; Lim, Y.J.; Lee, J.B.; Nam, K.; Park, J. Ceilometer Monitoring of Boundary-Layer Height and Its Application in Evaluating the Dilution Effect on Air Pollution. Bound. Layer Meteorol. 2019, 172, 435–455. [Google Scholar] [CrossRef] [Green Version]
  55. Li, H.; Yang, Y.; Hu, X.-M.; Huang, Z.; Wang, G.; Zhang, B.; Zhang, T. Evaluation of retrieval methods of daytime convective boundary layer height based on lidar data. J. Geophys. Res. Atmos. 2017, 122, 4578–4593. [Google Scholar] [CrossRef]
  56. Liu, B.; Ma, Y.; Gong, W.; Zhang, M.; Yang, J. Determination of boundary layer top on the basis of the characteristics of atmospheric particles. Atmos. Environ. 2018, 178, 140–147. [Google Scholar] [CrossRef]
  57. Shi, Y.; Hu, F.; Fan, G.; Zhang, Z. Multiple technical observations of the atmospheric boundary layer structure of a red-alert haze episode in Beijing. Atmos. Meas. Tech. 2019, 12, 4887–4901. [Google Scholar] [CrossRef] [Green Version]
  58. Sicard, M.; Pérez, C.; Rocadenbosch, F.; Baldasano, J.M.; García-Vizcaino, D. Mixed-Layer Depth Determination in the Barcelona Coastal Area from Regular Lidar Measurements: Methods, Results and Limitations. Bound. Layer Meteorol. 2005, 119, 135–157. [Google Scholar] [CrossRef] [Green Version]
  59. Holzworth, G.C. Estimates of mean maximum mixing depths in the contiguous United States. Mon. Weather Rev. 1964, 92, 235–242. [Google Scholar] [CrossRef] [Green Version]
  60. Vogelezang, D.H.P.; Holtslag, A.A.M. Evaluation and Model Impacts of Alternative Boundary-Layer Height Formulations. Bound. Layer Meteorol. 1996, 81, 245–269. [Google Scholar] [CrossRef]
  61. Bradley, R.S.; Keimig, F.T.; Diaz, H.F. Recent changes in the North American Arctic boundary layer in winter. J. Geophys. Res. 1993, 98, 8851–8858. [Google Scholar] [CrossRef]
  62. Coen, M.C.; Praz, C.; Haefele, A.; Ruffieux, D.; Kaufmann, P.; Calpini, B. Determination and climatology of the planetary boundary layer height above the Swiss plateau by in situ and remote sensing measurements as well as by the COSMO-2 model. Atmos. Chem. Phys. 2014, 14, 13205–13221. [Google Scholar] [CrossRef] [Green Version]
  63. Pichugina, Y.L.; Banta, R.M. Stable Boundary Layer Depth from High-Resolution Measurements of the Mean Wind Profile. J. Appl. Meteorol. Climatol. 2010, 49, 20–35. [Google Scholar] [CrossRef]
  64. Barbu, T. Robust Anisotropic Diffusion Scheme for Image Noise Removal. Procedia Comput. Sci. 2014, 35, 522–530. [Google Scholar] [CrossRef] [Green Version]
  65. Zilitinkevich, S.; Baklanov, A. Calculation of The Height of the Stable Boundary Layer in Practical Applications. Bound. Layer Meteorol. 2002, 105, 389–409. [Google Scholar] [CrossRef]
  66. Brooks, I.M. Finding Boundary Layer Top: Application of a Wavelet Covariance Transform to Lidar Backscatter Profiles. J. Atmos. Ocean. Technol. 2003, 20, 1092–1105. [Google Scholar] [CrossRef] [Green Version]
  67. Eresmaa, N.; Karppinen, A.; Joffre, S.M.; Rasanen, J.; Talvitie, H. Mixing height determination by ceilometer. Atmos. Chem. Phys. 2006, 6, 1485–1493. [Google Scholar] [CrossRef] [Green Version]
  68. Gamage, N.; Hagelberg, C. Detection and Analysis of Microfronts and Associated Coherent Evebts Using Localized Transforms. J. Atmos. Sci. 1993, 50, 750–756. [Google Scholar] [CrossRef] [Green Version]
  69. Press, W.H.; Teukolsky, S.A.; Vettering, W.T.; Flannery, B.R. Numerical Recipes in Fortran: The Art of Scientific Computing. Mathematics of Computation; Cambridge University Press: New York, NY, USA, 1993. [Google Scholar]
  70. Perona, P.; Malik, J. Scale-space and edge detection using anisotropic diffusion. In Proceedings of the IEEE Computer Society Workshop on Computer Vision, Osaka, Japan, 4–7 December 1990; pp. 629–639. [Google Scholar]
  71. Zhang, Q.; Wang, S. A study on atmospheric boundary layer structure during a clear day in the arid region in northwest China. Acta Meteorol. Sin. 2008, 66, 599–608. [Google Scholar]
  72. Zhang, W.; Zhang, X.; Zhong, J.; Wang, Y.; Wang, J.; Zhao, Y.; Bu, S. The effects of the “two-way feedbackmechanism” on themaintenance of persistent heavy aerosol pollution over areas with relatively light aerosol pollution in northwest China. Sci. Total Environ. 2019, 688C, 642–652. [Google Scholar] [CrossRef]
  73. Cheng, Y.F.; Wiedensohler, A.; Eichler, H.; Heintzenberg, J.; Tesche, M.; Ansmann, A.; Wendisch, M.; Su, H.; Althausen, D.; Herrmann, H.; et al. Relative humidity dependence of aerosol optical properties and direct radiative forcing in the surface boundary layer at Xinken in Pearl River Delta of China: An observation based numerical study. Atmos. Environ. 2008, 42, 6373–6397. [Google Scholar] [CrossRef]
  74. Zhang, L.; Sun, J.Y.; Shen, X.J.; Zhang, Y.M.; Che, H.; Ma, Q.L.; Zhang, Y.W.; Zhang, X.Y.; Ogren, J.A. Observations of relative humidity effects on aerosol light scattering in the Yangtze River Delta of China. Atmos. Chem. Phys. 2015, 15, 8439–8454. [Google Scholar] [CrossRef] [Green Version]
  75. Nielsen-Gammon, J.W.; Powell, C.L.; Mahoney, M.J.; Angevine, W.M.; Senff, C.; White, A.; Berkowitz, C.; Doran, C.; Knupp, K. Multisensor Estimation of Mixing Heights over a Coastal City. J. Appl. Meteorol. Climatol. 2008, 47, 27–43. [Google Scholar] [CrossRef]
  76. Haman, C.L.; Lefer, B.; Morris, G.A. Seasonal Variability in the Diurnal Evolution of the Boundary Layer in a Near-Coastal Urban Environment. J. Atmos. Ocean. Technol. 2012, 29, 697–710. [Google Scholar] [CrossRef]
  77. García-Franco, J.L.; Stremme, W.; Bezanilla, A.; Ruiz-Angulo, A.; Grutter, M. Variability of the Mixed-Layer Height Over Mexico City. Bound. Layer Meteorol. 2018, 167, 493–507. [Google Scholar] [CrossRef]
  78. Min, J.-S.; Park, M.-S.; Chae, J.-H.; Kang, M. Integrated System for Atmospheric Boundary Layer Height Estimation (ISABLE) using a Ceilometer and Microwave Radiometer. Atmos. Meas. Tech. 2020. [Google Scholar] [CrossRef]
  79. Liu, S.; Liang, X.Z. Observed Diurnal Cycle Climatology of Planetary Boundary Layer Height. J. Clim. 2010, 23, 5790–5809. [Google Scholar] [CrossRef]
  80. Li, H.; Chang, J.; Liu, Z.; Zhang, L.; Dai, T.; Chen, S. An improved method for automatic determination of the planetary boundary layer height based on lidar data. J. Quant. Spectrosc. Radiat. Transf. 2020, 257, 107382. [Google Scholar] [CrossRef]
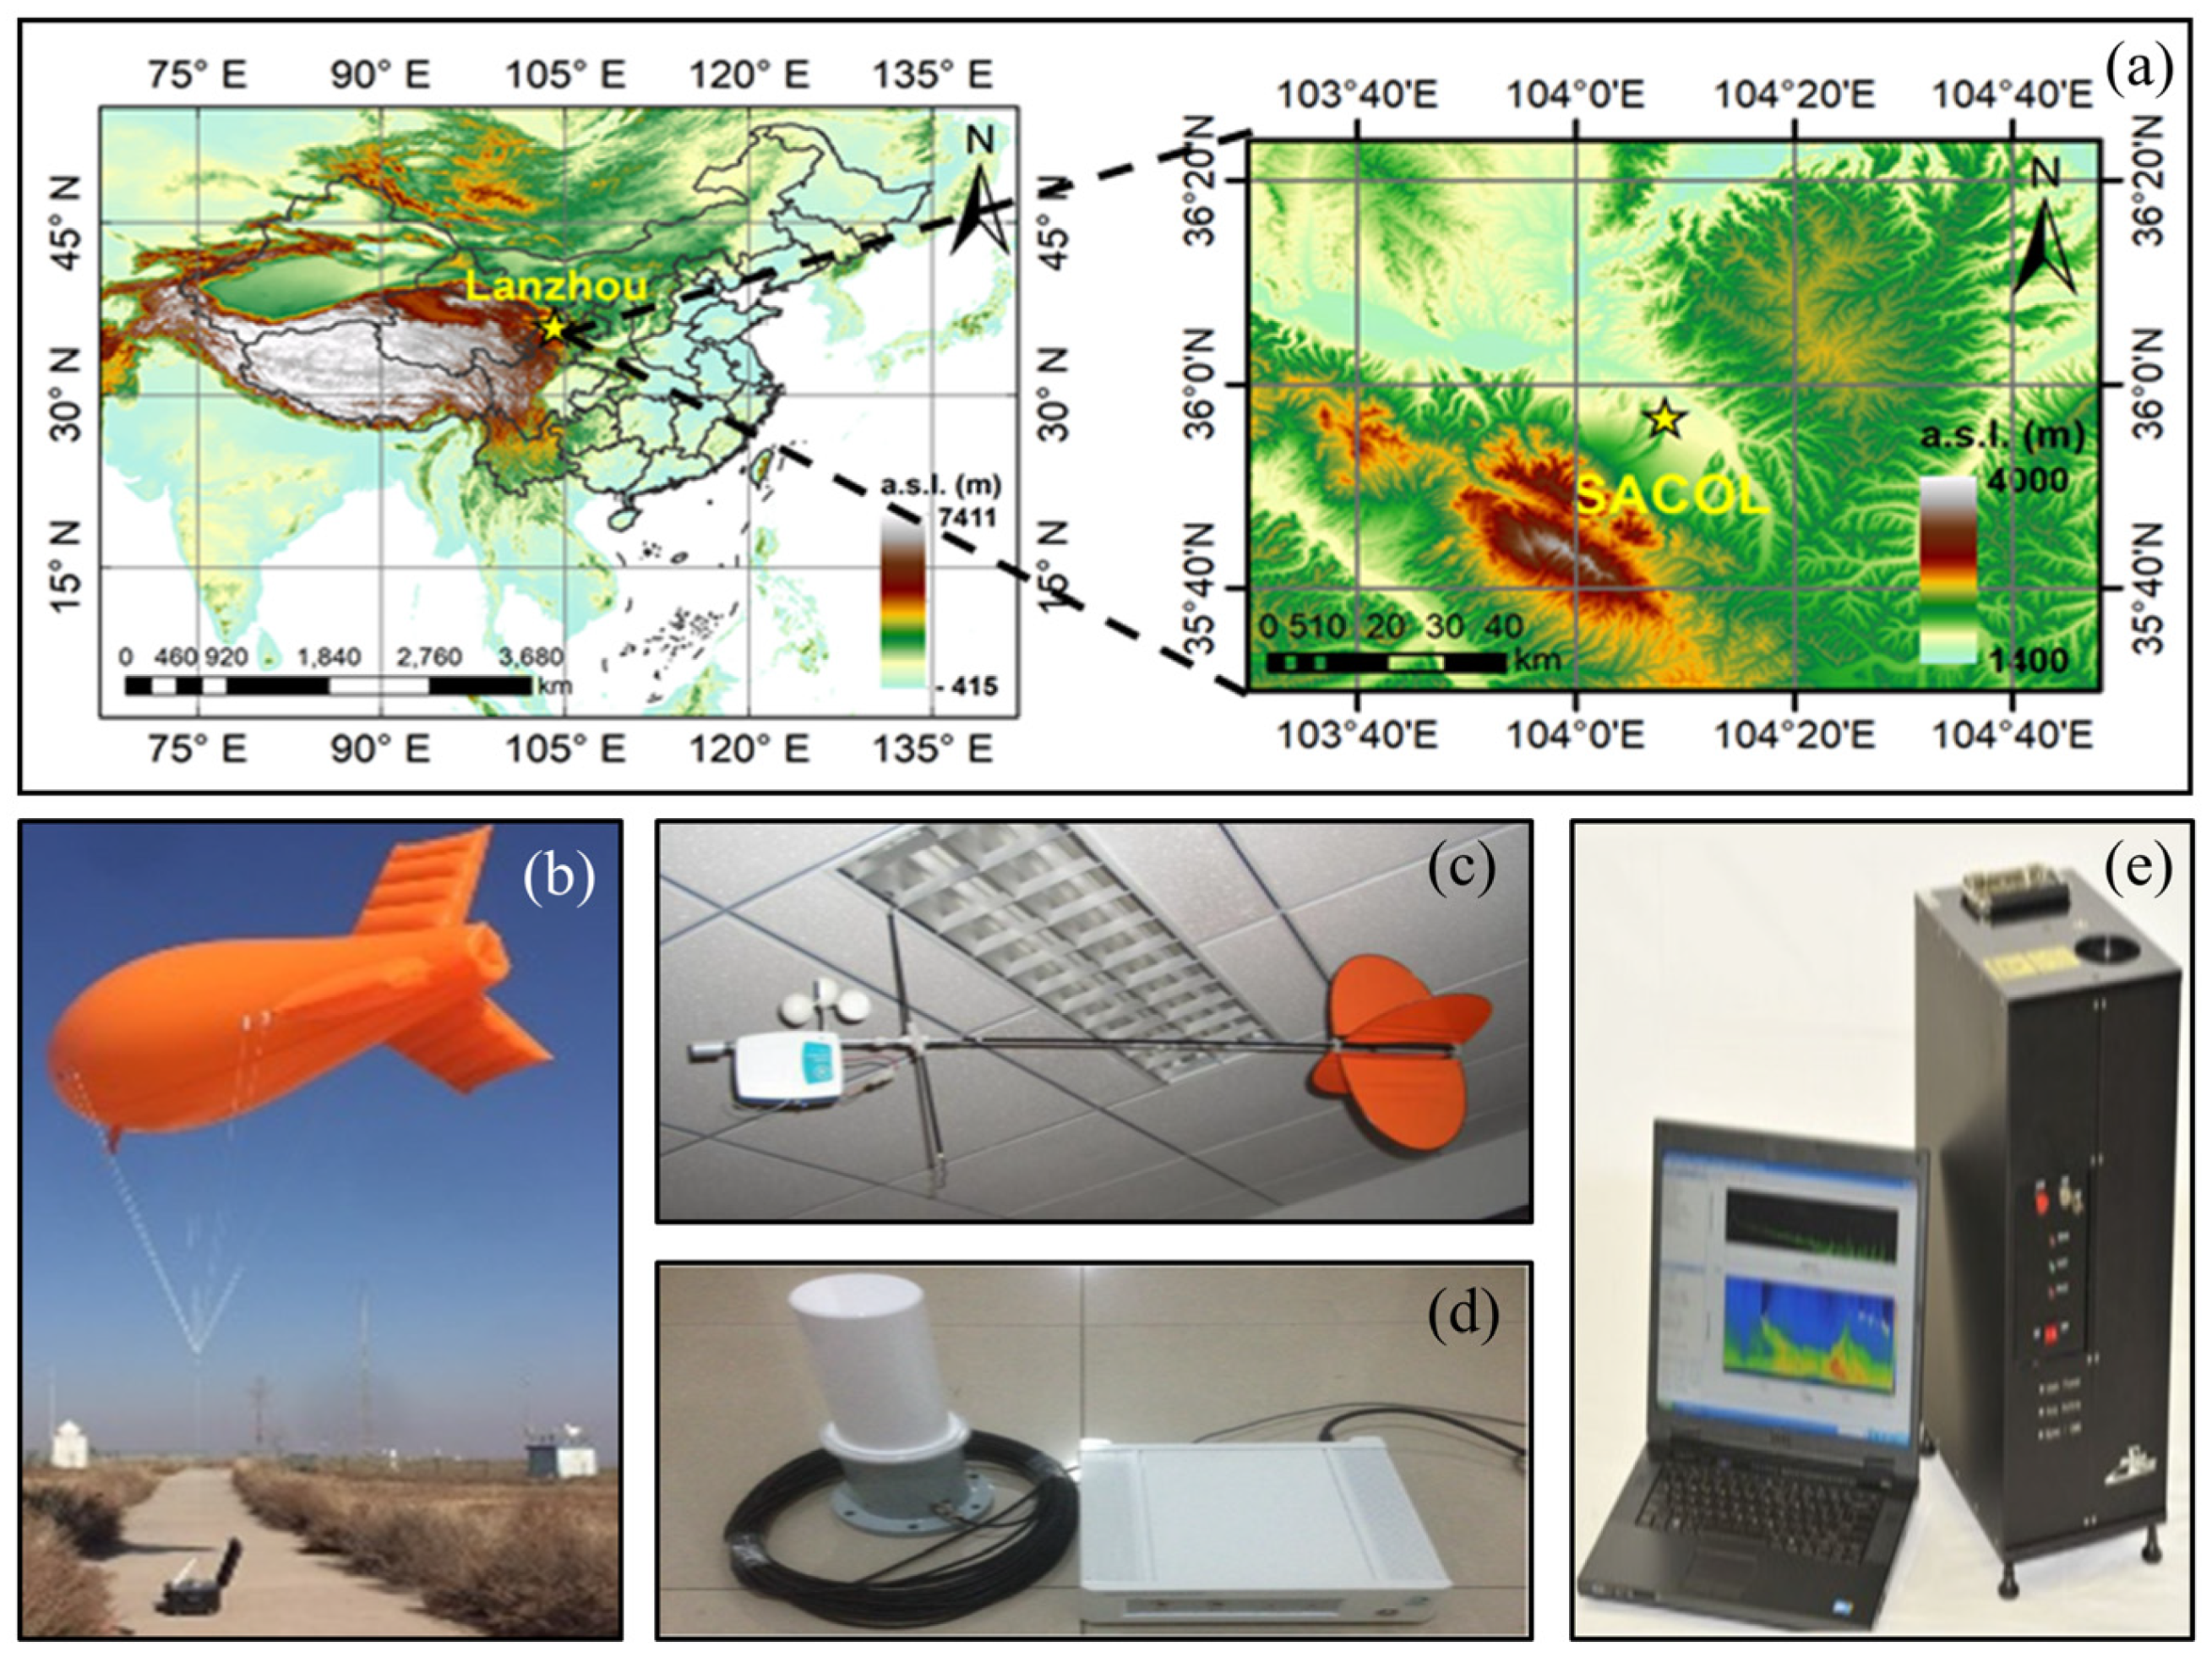
Figure 1. Observation site and instruments used: (a) local topography (The topographic data was the shuttle radar topography mission 3 (SRTM3) data from the National Aeronautics and Space Administration (NASA)), (b) tethered balloon, (c) radiosondes, (d) ground antenna of the sounding system, and (e) MiniMPL lidar.
Remotesensing 13 01781 g001
Figure 2. BLHs determined (horizontal lines) from (a) bulk Richardson number (Rb) and Holzworth method at 14:00 (Beijing time) and (b) bulk Richardson number (Rb) and temperature inversion method at 02:00 (Beijing time) on 23 December 2019. The values of Rb > 1.0 were set to 1.0 in Figure 2 for better presentation.
Remotesensing 13 01781 g002
Figure 3. BLH estimated using (a) WCT and (b) FIT with lidar ln (NRB) profile for 14:00 (Beijing time) on 12 December 2019.
Remotesensing 13 01781 g003
Figure 4. Evolution of the ABL on December (a) 12 and (b) 24, 2019, determined from TBS data.
Remotesensing 13 01781 g004
Figure 5. Diurnal variation of the ABL during the study period (9 December 2019 to 3 January 2020 Beijing time) from TBS data. BLH is the atmospheric boundary layer height derived from Holzworth and temperature inversion methods.
Remotesensing 13 01781 g005
Figure 6. Evolution of atmospheric aerosols and BLHs from lidar observations on (a) 12 December and (b) 24 December 2019. The WCT-BLHs and FIT-BLHs were BLHs derived by WCT and FIT methods based on lidar data, respectively. TBS-BLHs were BLHs derived from tethered balloon soundings.
Remotesensing 13 01781 g006
Figure 7. Diurnal variations in lidar-BLHs (average and standard errors) during the observation period.
Remotesensing 13 01781 g007
Figure 8. Scatter plot of TBS-BLHs and WCT-BLHs (a) and TBS-BLHs and FIT-BLHs (b).
Remotesensing 13 01781 g008
Figure 9. Diurnal variations in matched BLHs from lidar observations and TBS data.
Remotesensing 13 01781 g009
Publisher’s Note: MDPI stays neutral with regard to jurisdictional claims in published maps and institutional affiliations.