Article

Improved SinGAN Integrated with an Attentional Mechanism for Remote Sensing Image Classification

1
Chongqing Jinfo Mountain Karst Ecosystem National Observation and Research Station, School of Geographical Sciences, Southwest University, Chongqing 400715, China
2
Chongqing Engineering Research Center for Remote Sensing Big Data Application, School of Geographical Sciences, Southwest University, Chongqing 400715, China
3
Land Satellite Remote Sensing Application Center, Ministry of Natural Resources, Beijing 100048, China
*
Author to whom correspondence should be addressed.
Remote Sens. 2021, 13(9), 1713; https://doi.org/10.3390/rs13091713
Submission received: 16 March 2021 / Revised: 18 April 2021 / Accepted: 24 April 2021 / Published: 28 April 2021

Abstract

:
Deep learning is an important research method in the remote sensing field. However, samples of remote sensing images are relatively few in real life, and those with markers are scarce. Many neural networks represented by Generative Adversarial Networks (GANs) can learn from real samples to generate pseudosamples, rather than traditional methods that often require more time and man-power to obtain samples. However, the generated pseudosamples often have poor realism and cannot be reliably used as the basis for various analyses and applications in the field of remote sensing. To address the abovementioned problems, a pseudolabeled sample generation method is proposed in this work and applied to scene classification of remote sensing images. The improved unconditional generative model that can be learned from a single natural image (Improved SinGAN) with an attention mechanism can effectively generate enough pseudolabeled samples from a single remote sensing scene image sample. Pseudosamples generated by the improved SinGAN model have stronger realism and relatively less training time, and the extracted features are easily recognized in the classification network. The improved SinGAN can better identify sub-jects from images with complex ground scenes compared with the original network. This mechanism solves the problem of geographic errors of generated pseudosamples. This study incorporated the generated pseudosamples into training data for the classification experiment. The result showed that the SinGAN model with the integration of the attention mechanism can better guarantee feature extraction of the training data. Thus, the quality of the generated samples is improved and the classification accuracy and stability of the classification network are also enhanced.

Graphical Abstract

1. Introduction

Remote sensing image scene classification is a major topic in the remote sensing field [1,2,3]. The convolutional neural network (CNN) is a useful method in scene classification due to its strong feature extraction ability [4,5]. With the development of computer technology to date, the depth of CNN is from several layers to hundreds of layers [6,7,8]. Meanwhile, the deeper network has been proven to be able to extract additional important features of the image, which can improve the accuracy of classification of remote sensing images [9]. However, enough remote sensing datasets for network learning are impossible to obtain due to the lack of professional knowledge to process remote sensing images [10]. Therefore, the manner by which to obtain better scene classification results in the case of few datasets is a significant research direction [11,12].
Since the advent of CNNs, many modules and training methods have been proposed to improve the adaptability of neural networks in remote sensing [13,14]. Many models provide us with ideas on how to solve the problem of remote sensing image scene classification under the small sample conditions [15,16]. In 2014, Googfellow proposed Generative Adversarial Networks (GANs) for the first time [17]. GAN is different from the original methods of expanding sample diversity through simple rotation, scaling, shearing, and other operations [18,19]. In GAN, the random input noise is converted into an image with a similar distribution to the original image. Abundant pseudosamples can make up for the lack of diversity in small samples [20]. Meanwhile, a sufficient sample size facilitates the learning ability of the network. However, the training of GAN is inconsistent, and the result of generated samples is poor. Many studies have been focused on GAN to improve its sample learning and generation ability, in which conditional GAN (CGAN) [21] adds constraints on the basis of the original GAN and controls the problem that the generator G is free; accordingly, the network can generate samples in the expected direction. Deep Convolutional GAN (DCGAN) [22] combines the CNN and GAN, which improves the quality and diversity of the generated samples and promotes the development of GAN. Wasserstein GAN (WGAN) [23] completely solves the instability of training in GAN. This mechanism deletes the Sigmoid activation function in the last layer of the network. When calculating backwards, logarithmic computation is not used. Accordingly, the update parameters are fixed in a range. In summary, a stochastic gradient descent algorithm is used as a substitute for the original momentum algorithm. In view of the particularity of a remote sensing image compared with a general natural image, many scholars also proposed their own opinions. Pan et al. [24] proposed a diversity-GAN on the basis of a coarse scale to a fine scale framework, which can automatically generate scene image samples with great diversity. Then, the generated samples can be used to improve the classification ability of the CNN model. Zhan et al. [25] proposed a semi-supervised framework for hyperspectral image (HSI) data based on a 1-D GAN, which can effectively classify HSI data. Lin et al. [26] proposed multiple-layer feature-matching generative adversarial networks (MARTA GAN) for unsupervised representation learning. The GAN models were combined with remote sensing image scene classification for the first time in this literature. This mechanism achieved good results on the UC Merced dataset with expanded samples. However, these methods fail to consider the problem that remote sensing datasets are too small for the GAN network in practical applications. In addition, the identification information of remote sensing images greatly differs at diverse resolution scales [27], which makes pseudosamples generated by numerous GAN models differ from the actual surface conditions.
In 2019, Shaham proposed an unconditional generative model that can be learned from a single natural image named “SinGAN” [28]. This unconditional model is used to learn the internal distribution of a single natural image from a coarse scale to a fine scale, thereby ensuring local details while maintaining global distribution. The proposal of this model indeed solves the problem that the GAN model cannot generate effective samples in the case of few samples [29]. The pyramid-type multiscale progressive learning method is also raised to extract the deep features of remote sensing images. Xiong et al. [30] proposed an end-to-end deep multifeature fusion network to capture different semantic objects. This network is suitable for retrieval and classification tasks after the test. Ma et al. [31] designed a multilayer fusion model based on CNN to extract additional features from hidden layers. The fusion of features is beneficial for classification. Xue et al. [32] proposed a classification algorithm with multiple deep structural features. Three common CNNs are used for different characteristics of the remote sensing image. Sun et al. [33] combined SinGAN with a pixel attention mechanism for image super resolution. This enhanced SinGAN has been improved to obtain more critical information and generate a higher resolution output. However, this model only focuses on texture distribution within the image at different scales. It does not consider the feature-to-feature connections during the reconstruction process. The generated pseudosamples of the remote sensing images with more complex features are greatly different from the real surface conditions; thus, they are not added into the training set as reliable samples.
To solve the abovementioned problems, an unsupervised generation adversarial network based on SinGAN integrated with attention mechanism [34] is proposed in this work. The attention module is introduced to improve SinGAN’s ability to learn and generate remote sensing samples. Our proposed method aims to generate pseudolabeled samples of remote sensing scenes and apply them for the classification. The adjusted criteria are more rigorous and accurate than the original SinGAN and the corresponding features of the generated samples are more real with fewer training layers. The influence of attention module is examined in this paper in terms of the generation performance and the application with other classification networks. This work intends to make improvements from the following aspects:
(1)
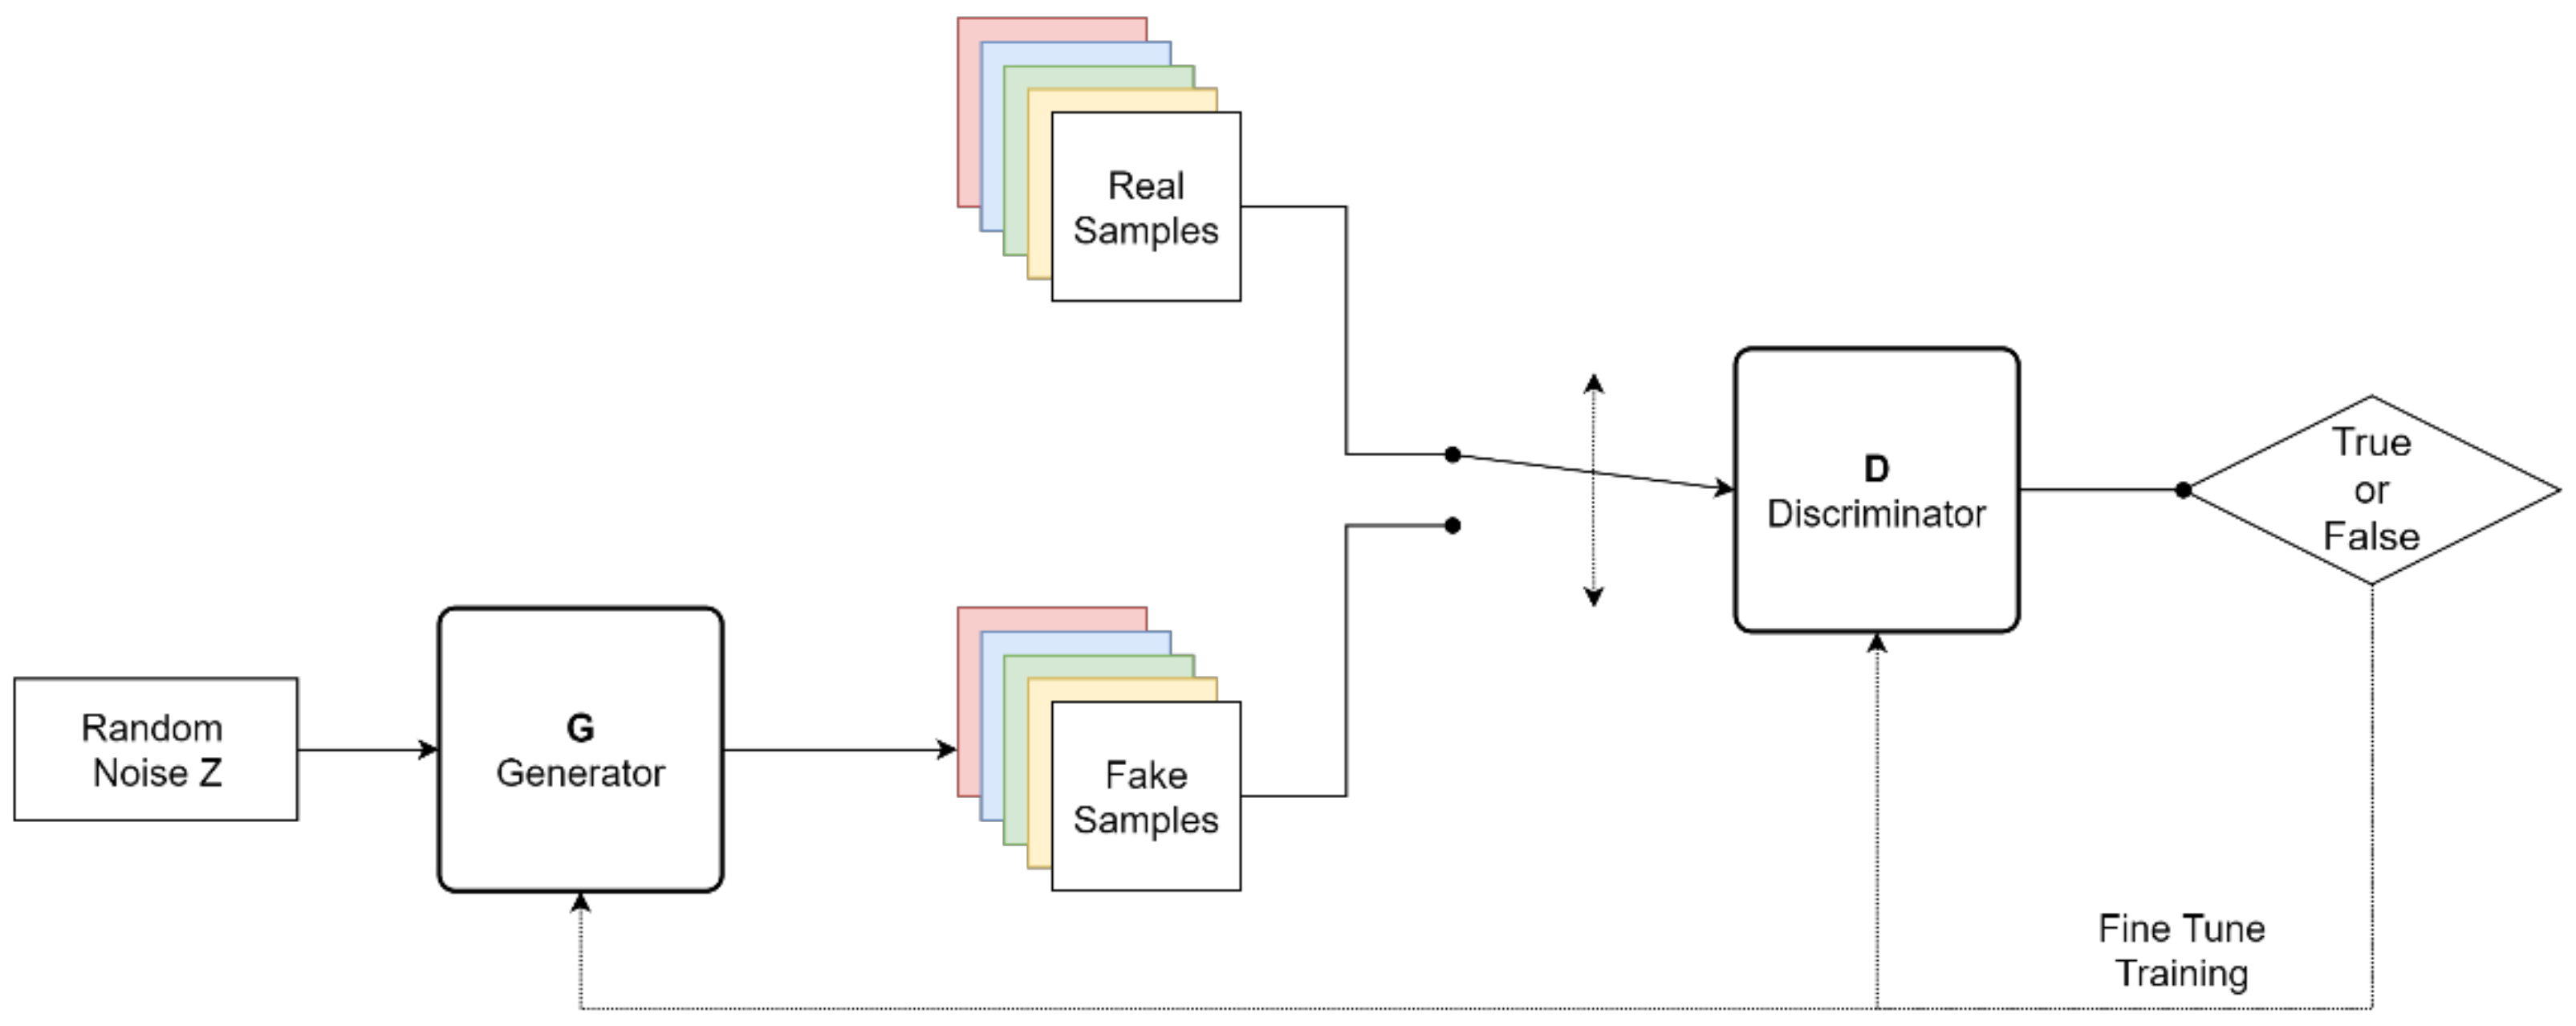
In this work, a GAN to generate samples by using competitive and collaborative learning is proposed. SinGAN is a bottom-up GAN, while the attention mechanism is mostly used for forward-propagating network structures. Whether the combination of the two networks can effectively deliver the learned features to the end remains to be proven.
(2)
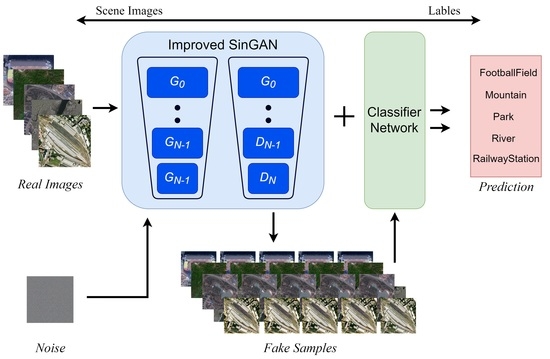
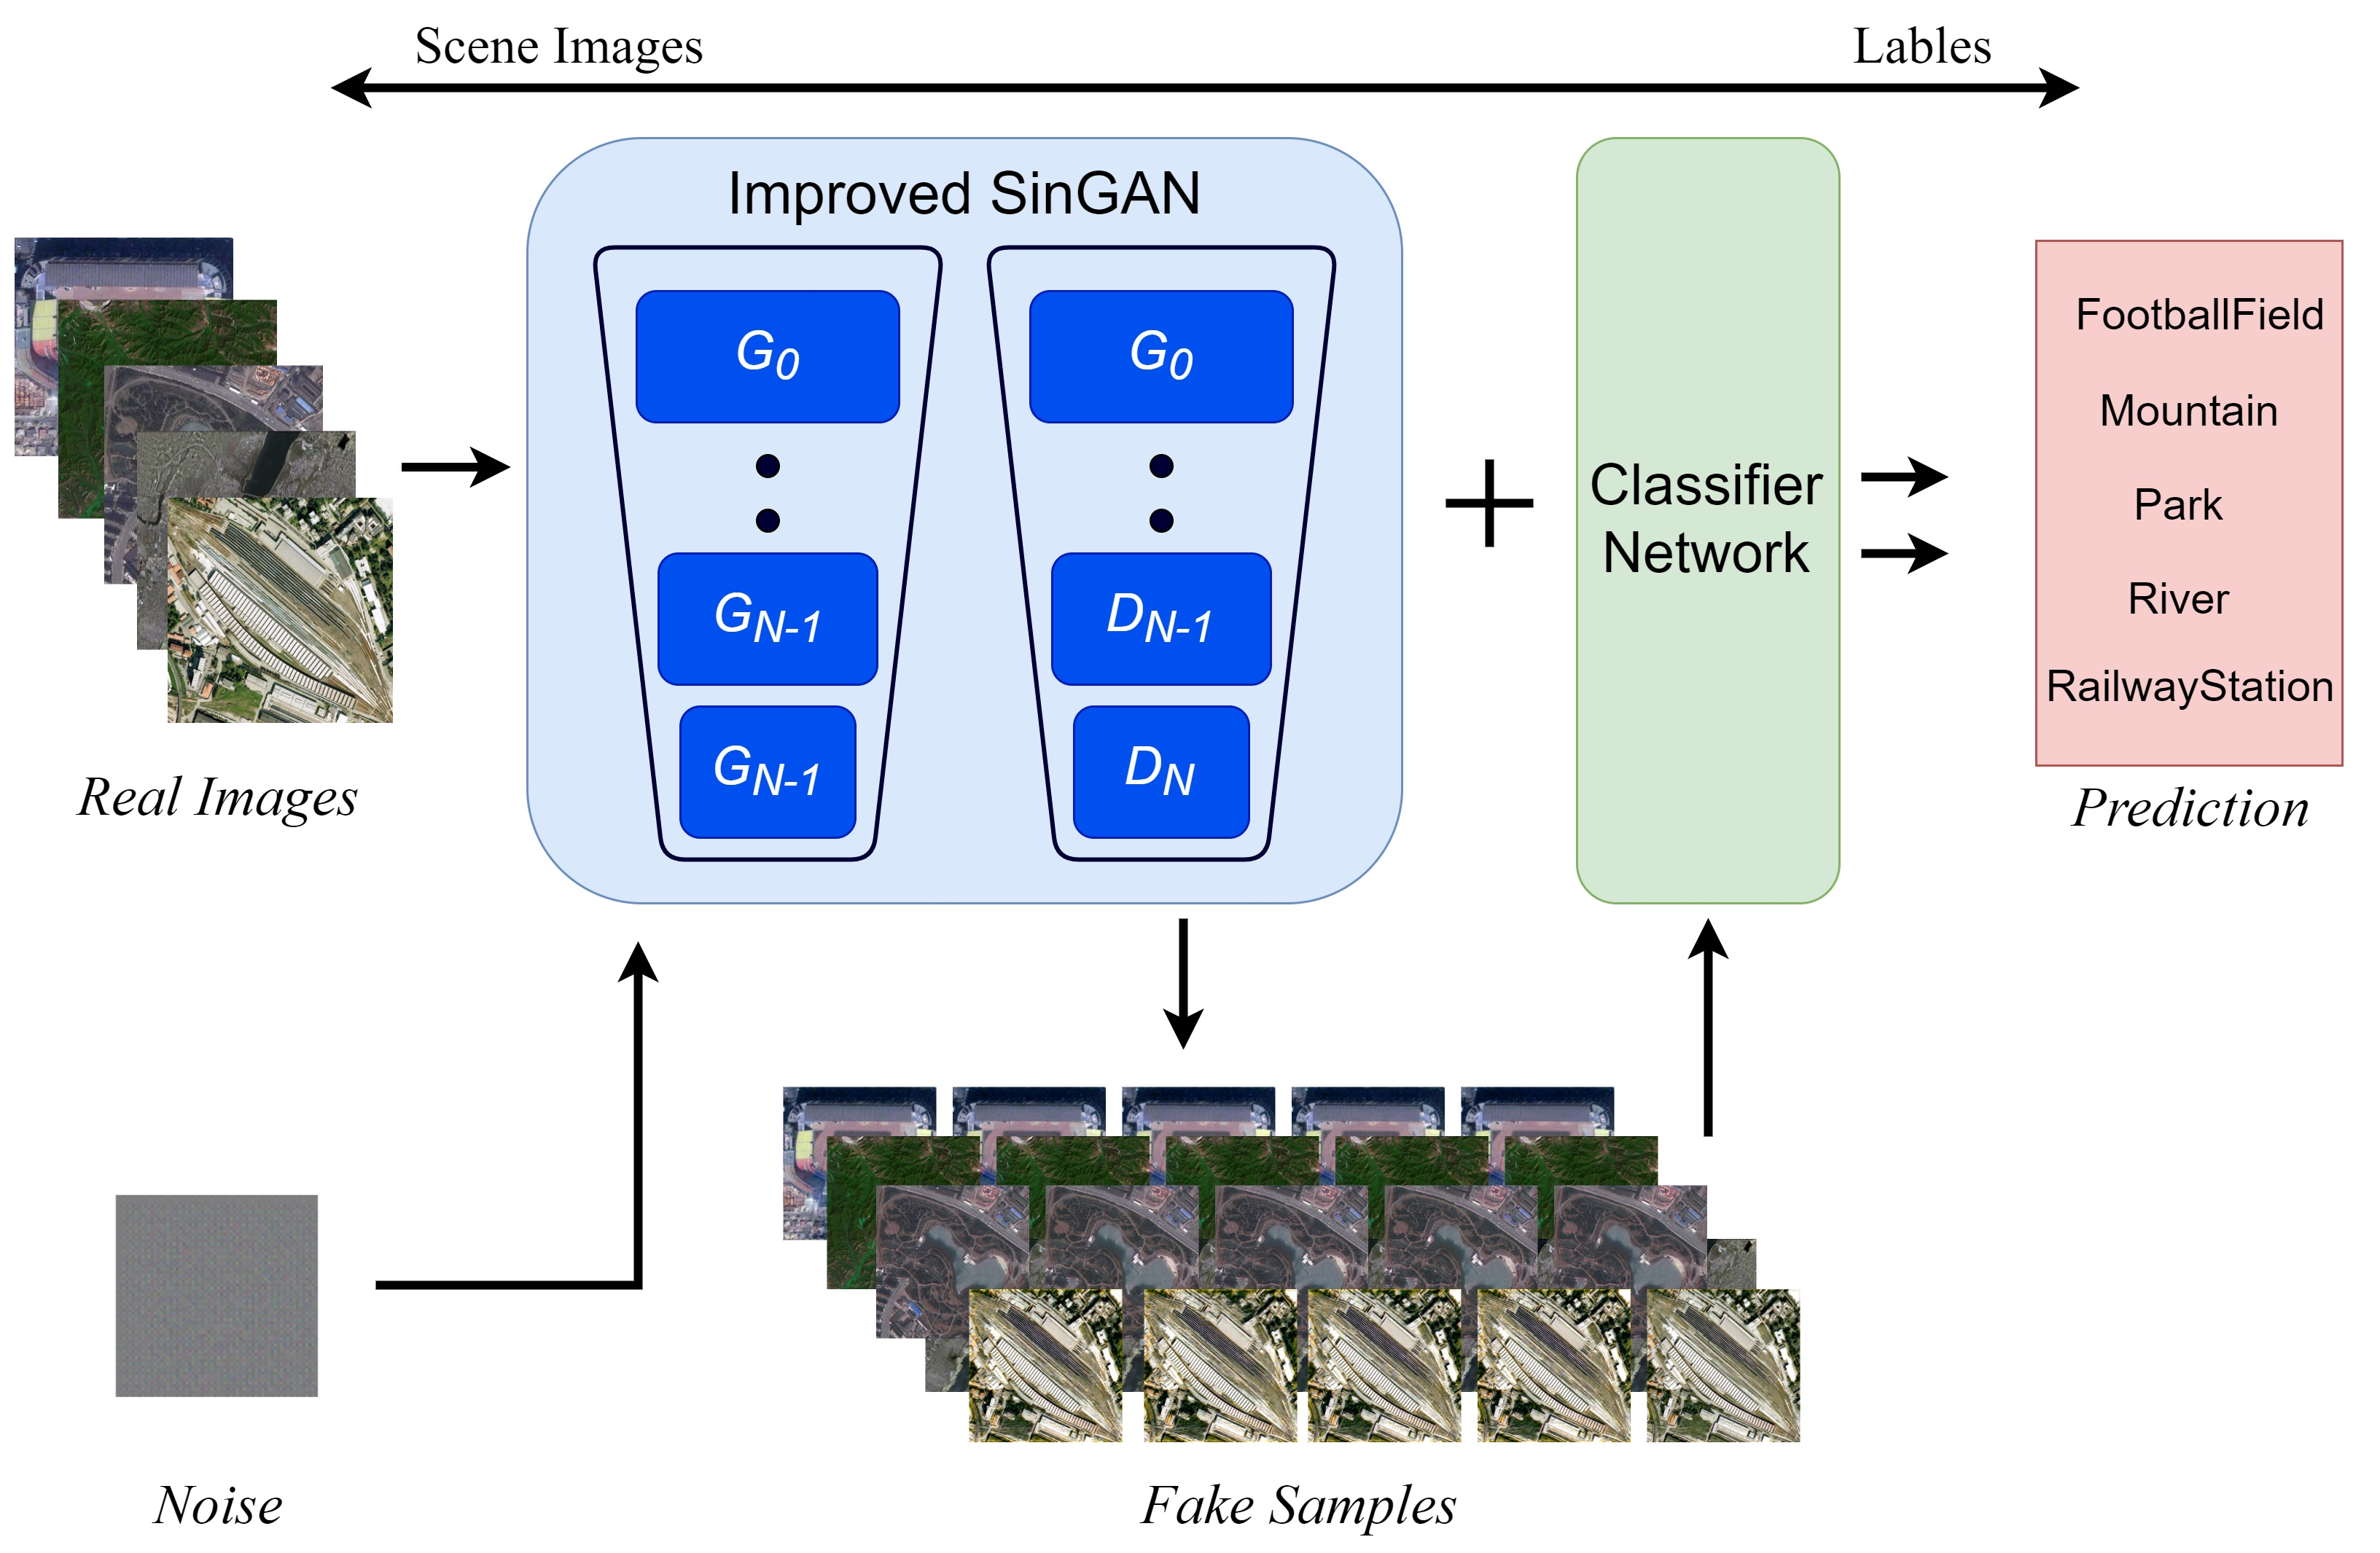
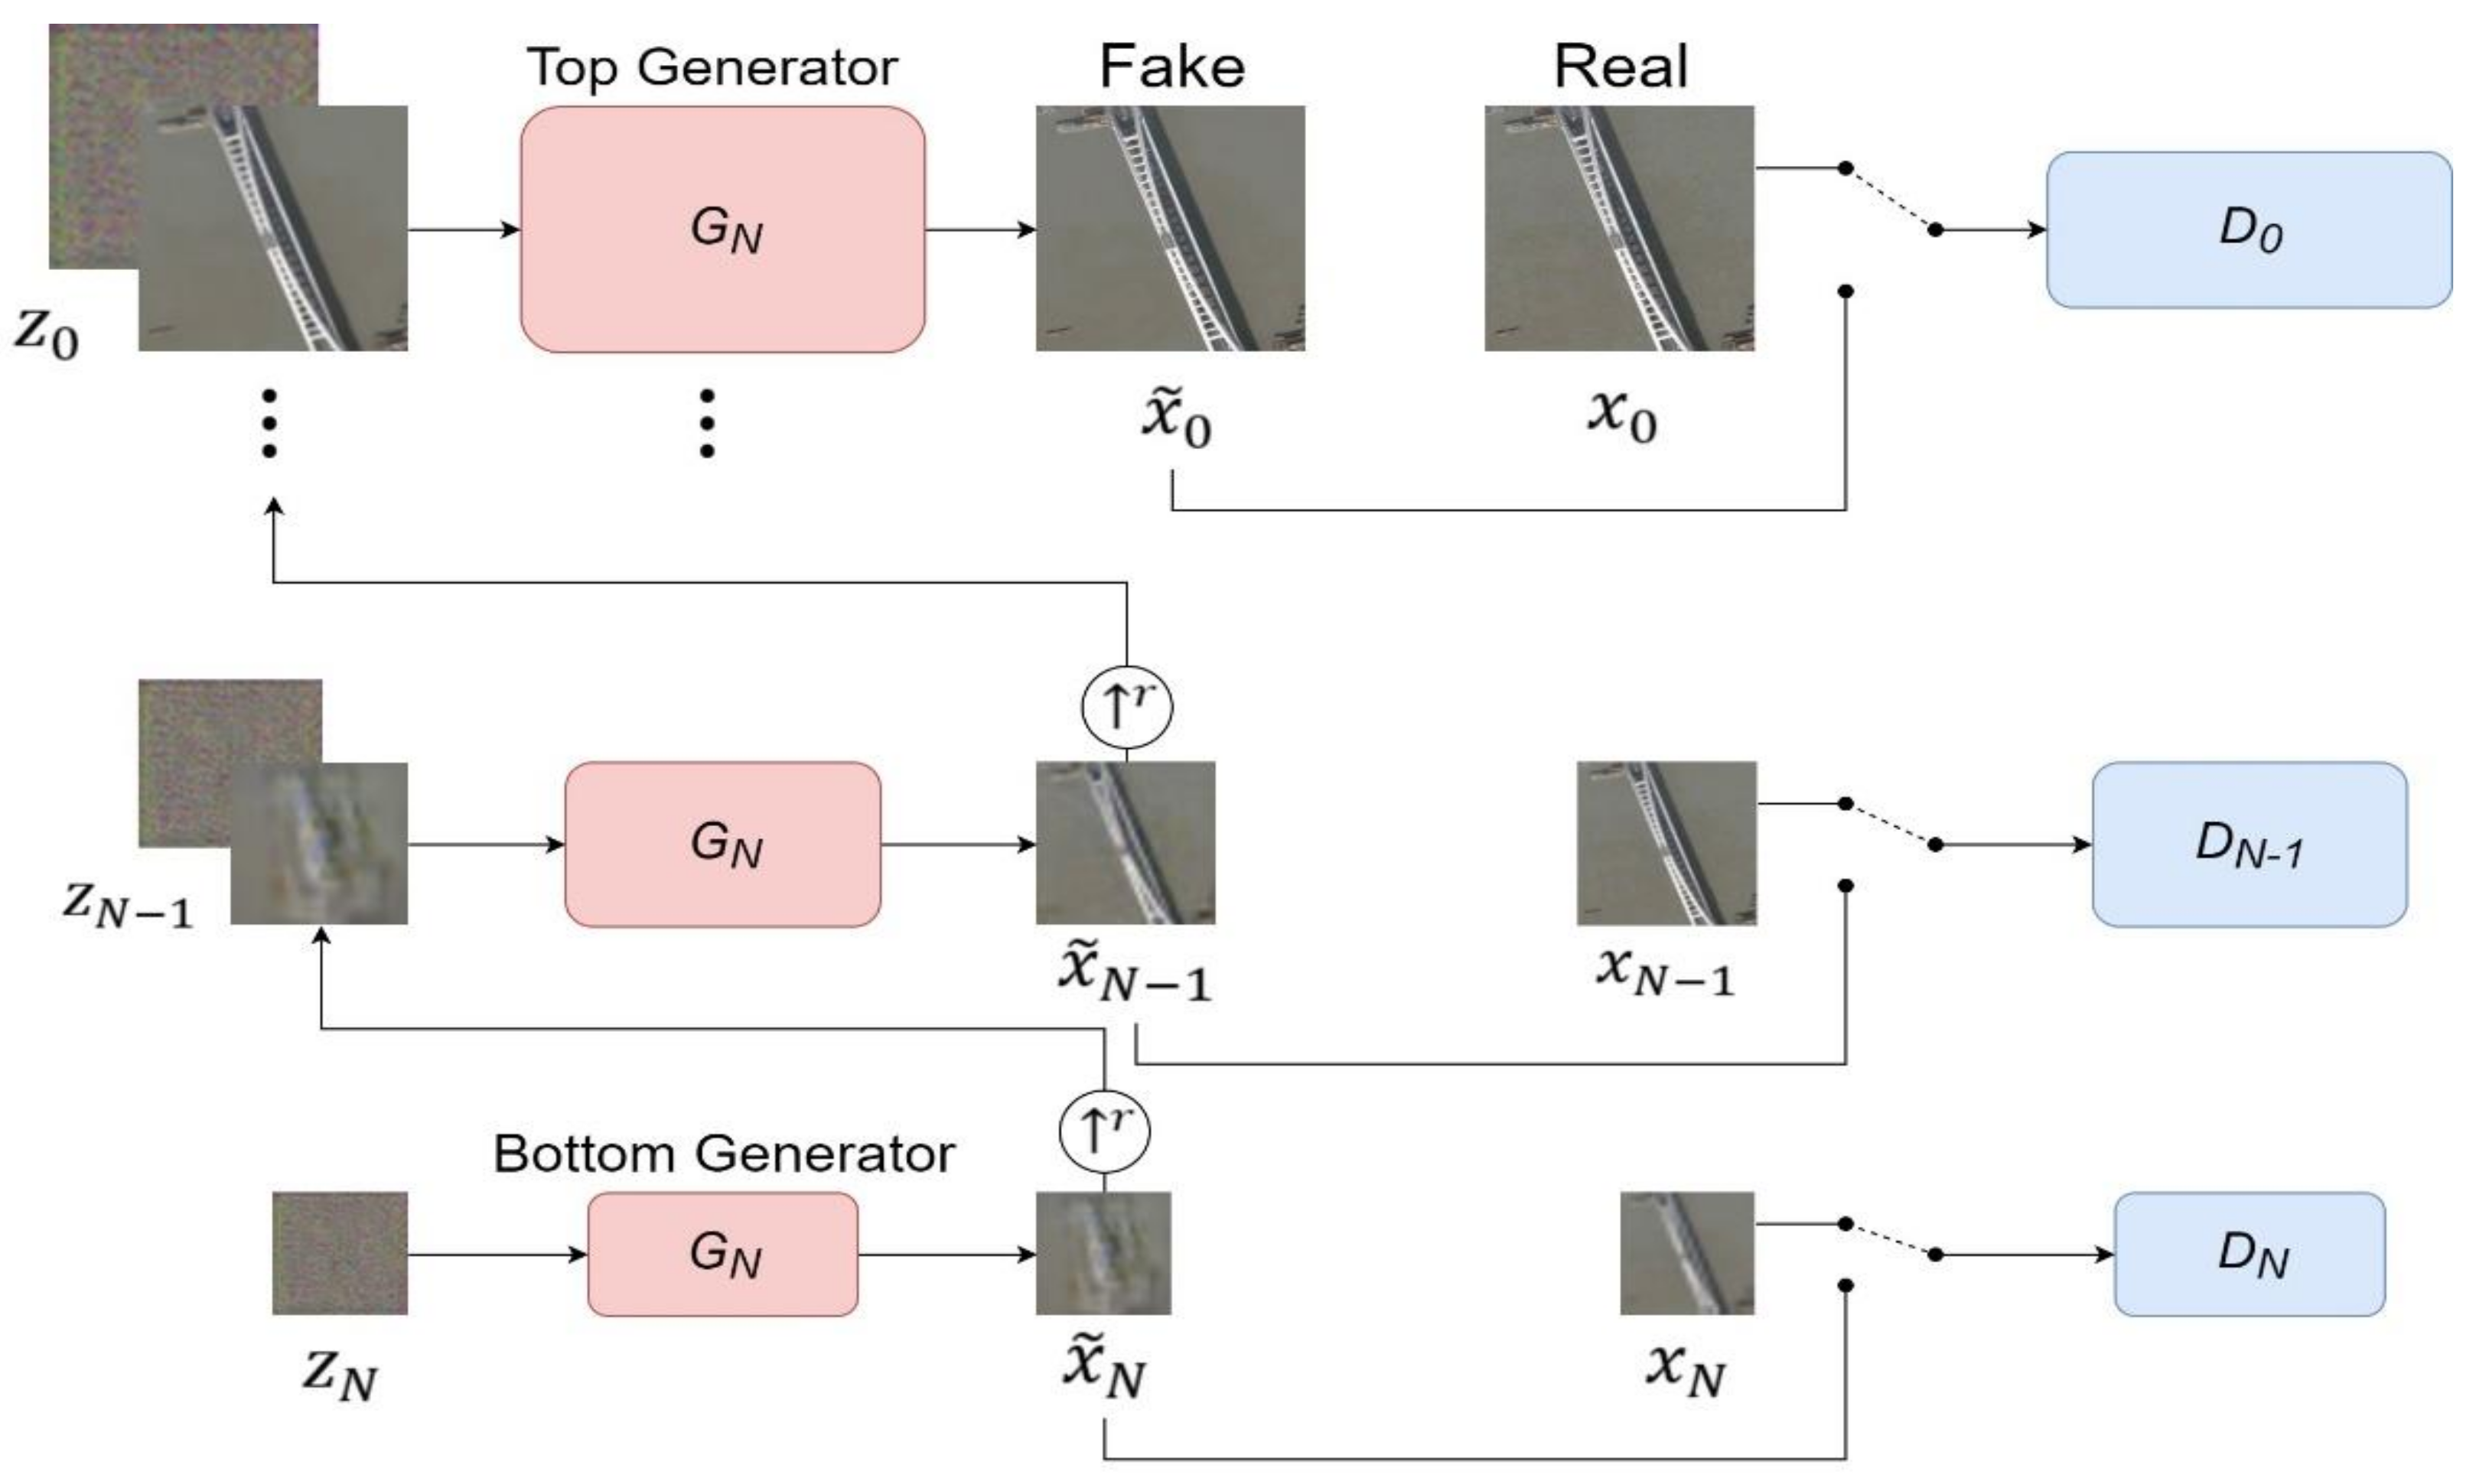
The structure of the SinGAN pyramid multiscale generation adversarial network and the attention mechanism are adapted to solve the problem of generated samples with a certain diversity and fidelity under the rare training sets. The SinGAN is optimized in an unsupervised model to generate fake samples from a single natural image. The attention mechanism is aimed at observing the key features in a natural image. The combined framework of SinGAN and the attention mechanism is proposed to determine whether significant features can be availably extracted from a single remote sensing image to generate high-simulated samples.
(3)
Rich training samples and sufficient feature information are required for the performance of the classifier network. In the improved SinGAN, features are extracted and compressed into generated samples. These fake generated samples are incorporated into the classifier network as training datasets to test if the classification accuracy improves.

2. Methods

A GAN is most easily applied when the models involved are all multilayer perceptrons. The pyramidal multiscale structure of SinGAN is used as an expander, to enable incremental remote sensing data. The attention mechanism is added to the generator, which enables the random noise z to effectively go to fake samples with high realism. Section 2.1 introduces the structure and principle of SinGAN. Section 2.2 describes the composition of Convolutional Block Attention Module (CBAM), including the channel and spatial attention modules. Section 2.3 provides details of the improved SinGAN.

2.1. SinGAN

GAN is mainly constituted by the Generator (G) and Discriminator (D) in two parts. As shown in Figure 1, the G’s goal is to make fake images G(z) that are undistinguishable from real images. Real and generated images are simultaneously passed through the D. The performance of real images D(G(x)) and generated images D(G(z)) is as close as possible. This process makes D inaccurately discriminate between real and generated images. Thus, D is promoted to improve the judgment of true from false. The specific process can be summarized as follows:
V G , D = E X P d a t a l o g D x + E X P G l o g ( 1 D x )
where x represents the real image, z represents the input noise of the Generator, and G z represents the image generated by the Generator.
SinGAN was developed on the basis of GANs. SinGAN, an unconditional generated model, can extract enough features from a single natural image. In the absence of a large number of supported trainable samples, SinGAN also effectively captures and accesses the internal relationship of an input training image. The structure of SinGAN is shown in Figure 2. SinGAN not only catches colors and textures but also seizes the overall structure of a single complex image at different scales. This notion means that SinGAN needs to obtain the local details and global attributes of the target, including the structure, shape, color, texture, and other detailed information. SinGAN, either for the Generator or Discriminator, is based on the idea of coarse-to-fine, which means that SinGAN captures the segment information of patches in the training image from a coarse scale to a fine scale. In coarse scales, SinGAN focuses on global attributes such as the shape and alignment of targets in an image. With the finer scales, it accounts for local attributes such as texture, edge information, and so on. SinGAN is a pyramid structure composed of N similar GAN networks. This structure allows the generation of new samples of any size and ensures that the new samples generated have a high degree of spatial visual similarity with the original training images to make up for the lack of diversity.
However, the SinGAN model is only limited to the training of a single image at a time; thus, it does not generate fake samples based on the statistical distribution information of a mass of samples, only by learning the complex texture structure inside a single image at different scales. A problem is raised because the distribution of objects within an image is inconsistent at different scales. When scene images are complex, the information of large objects is rich and texture information is easy to grasp. Meanwhile, the information of small objects is relatively few and may be ignored or even covered by large objects. Second, messages at a coarse scale are discontinuous up to a fine scale for nonhomogeneous remote sensing images due to the discrepant position and form of objects at different scales. This situation results in the final pseudosample with high similarity to the real image in texture and edges. However, the position and form of the fake sample is often a problem. Finally, the color of ground objects is often not the same as that of ordinary natural images because of the interference of clouds and shadows in remote sensing images. Only RGB can reflect the real situation, and the manner by which to distinguish some ground objects with weak texture information through color information also needs to be paid attention.

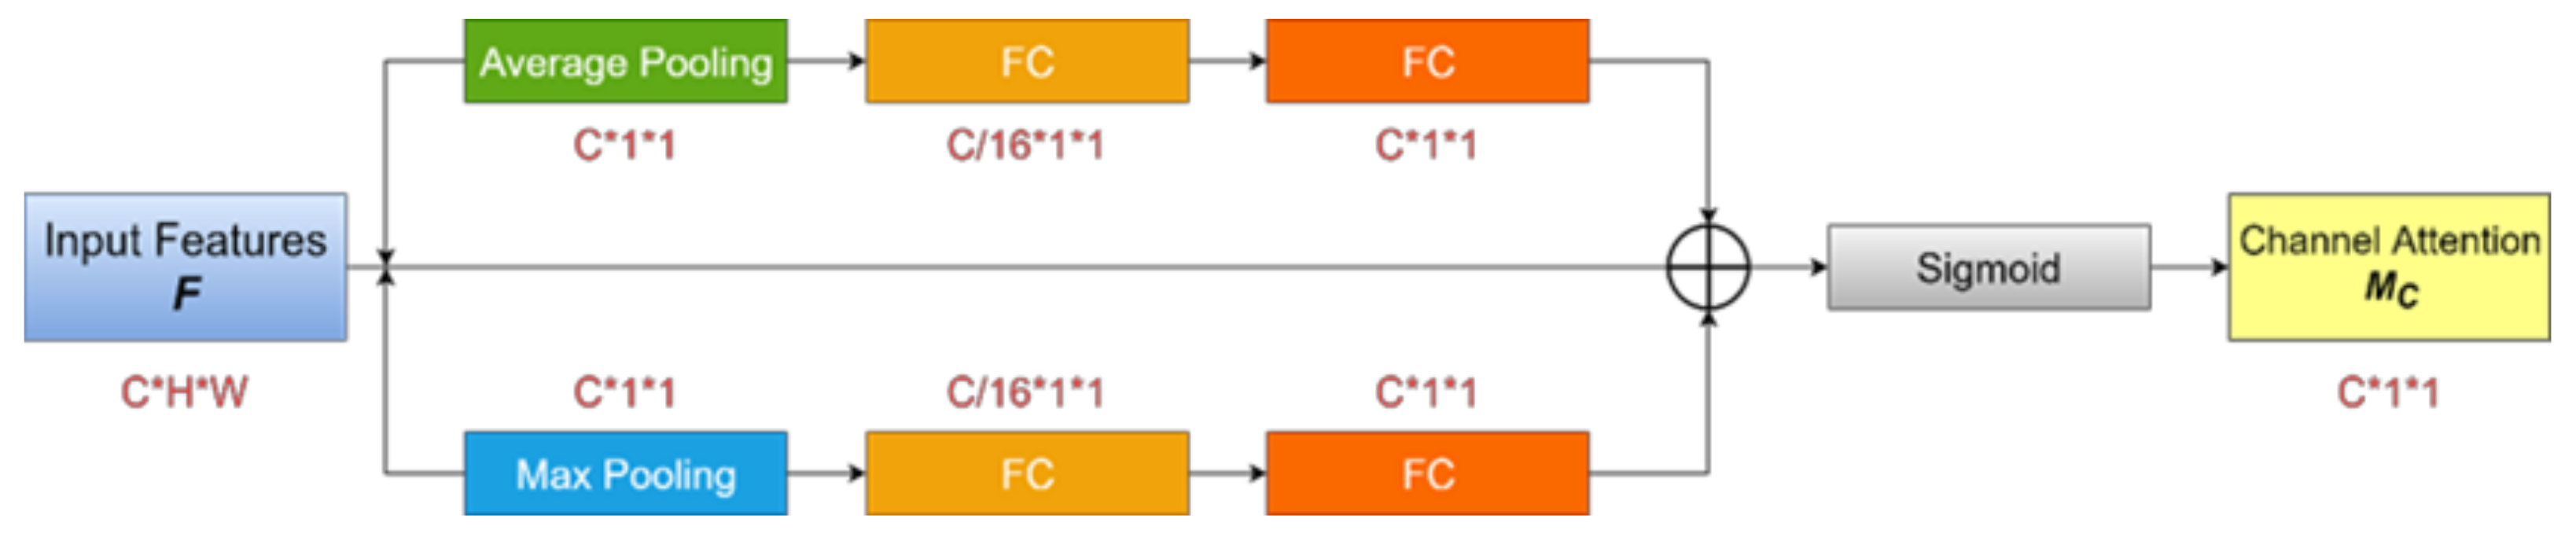
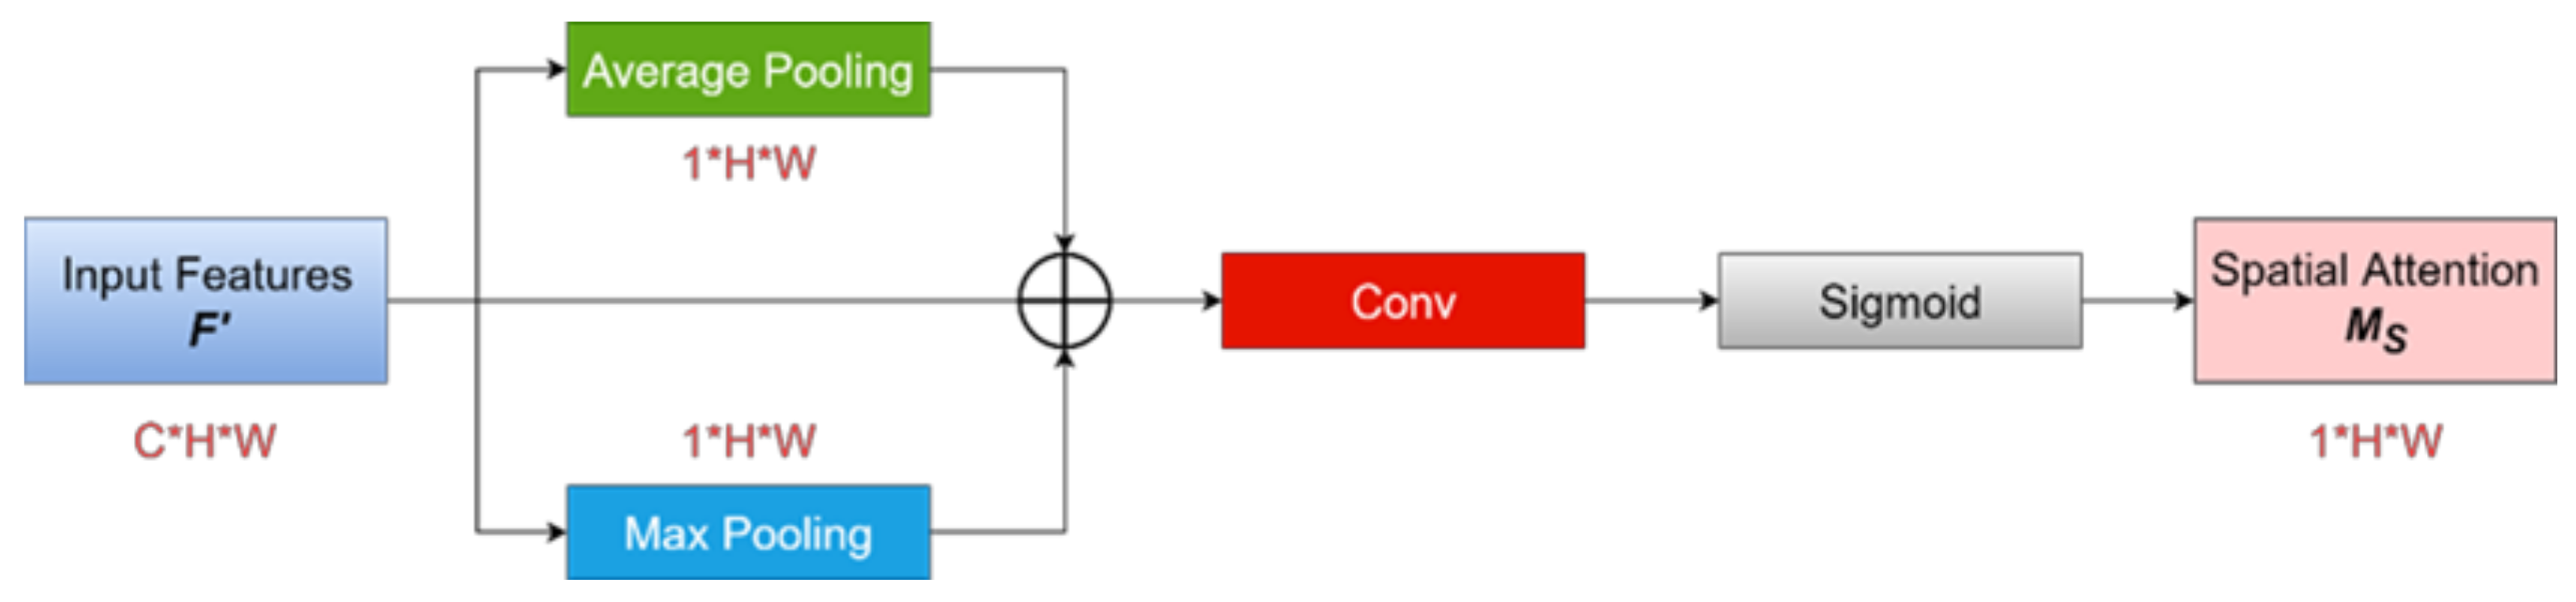
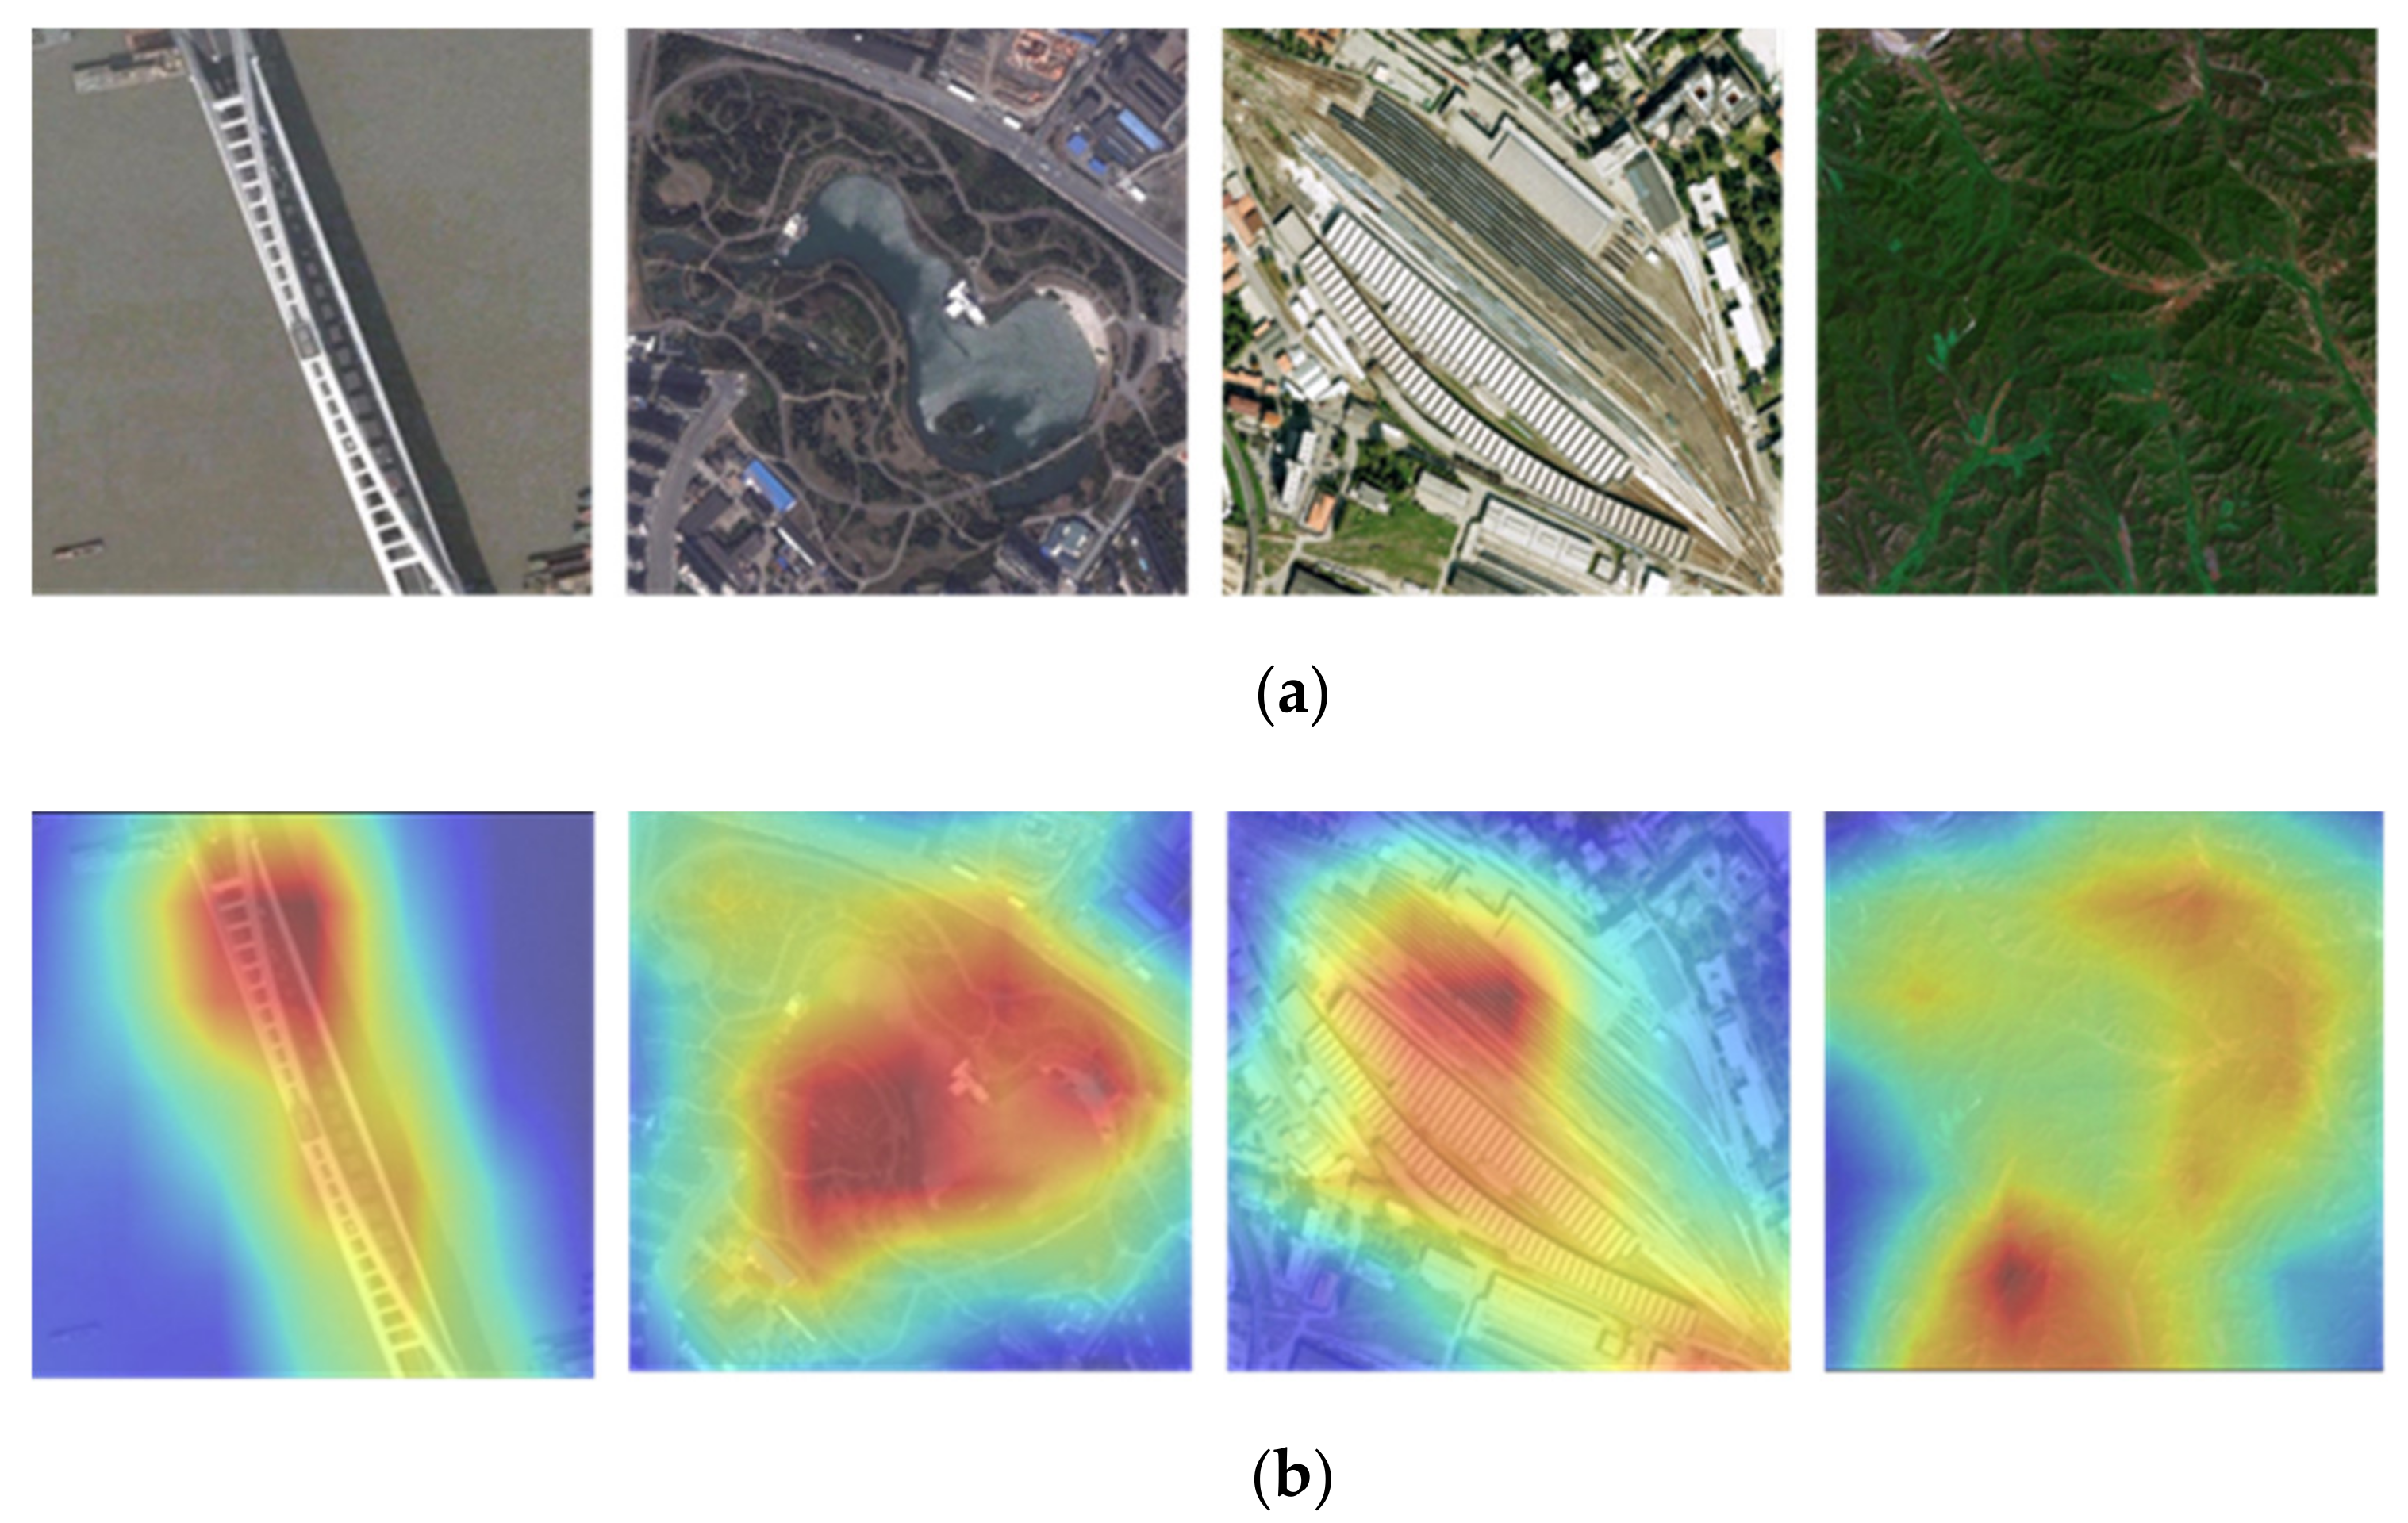
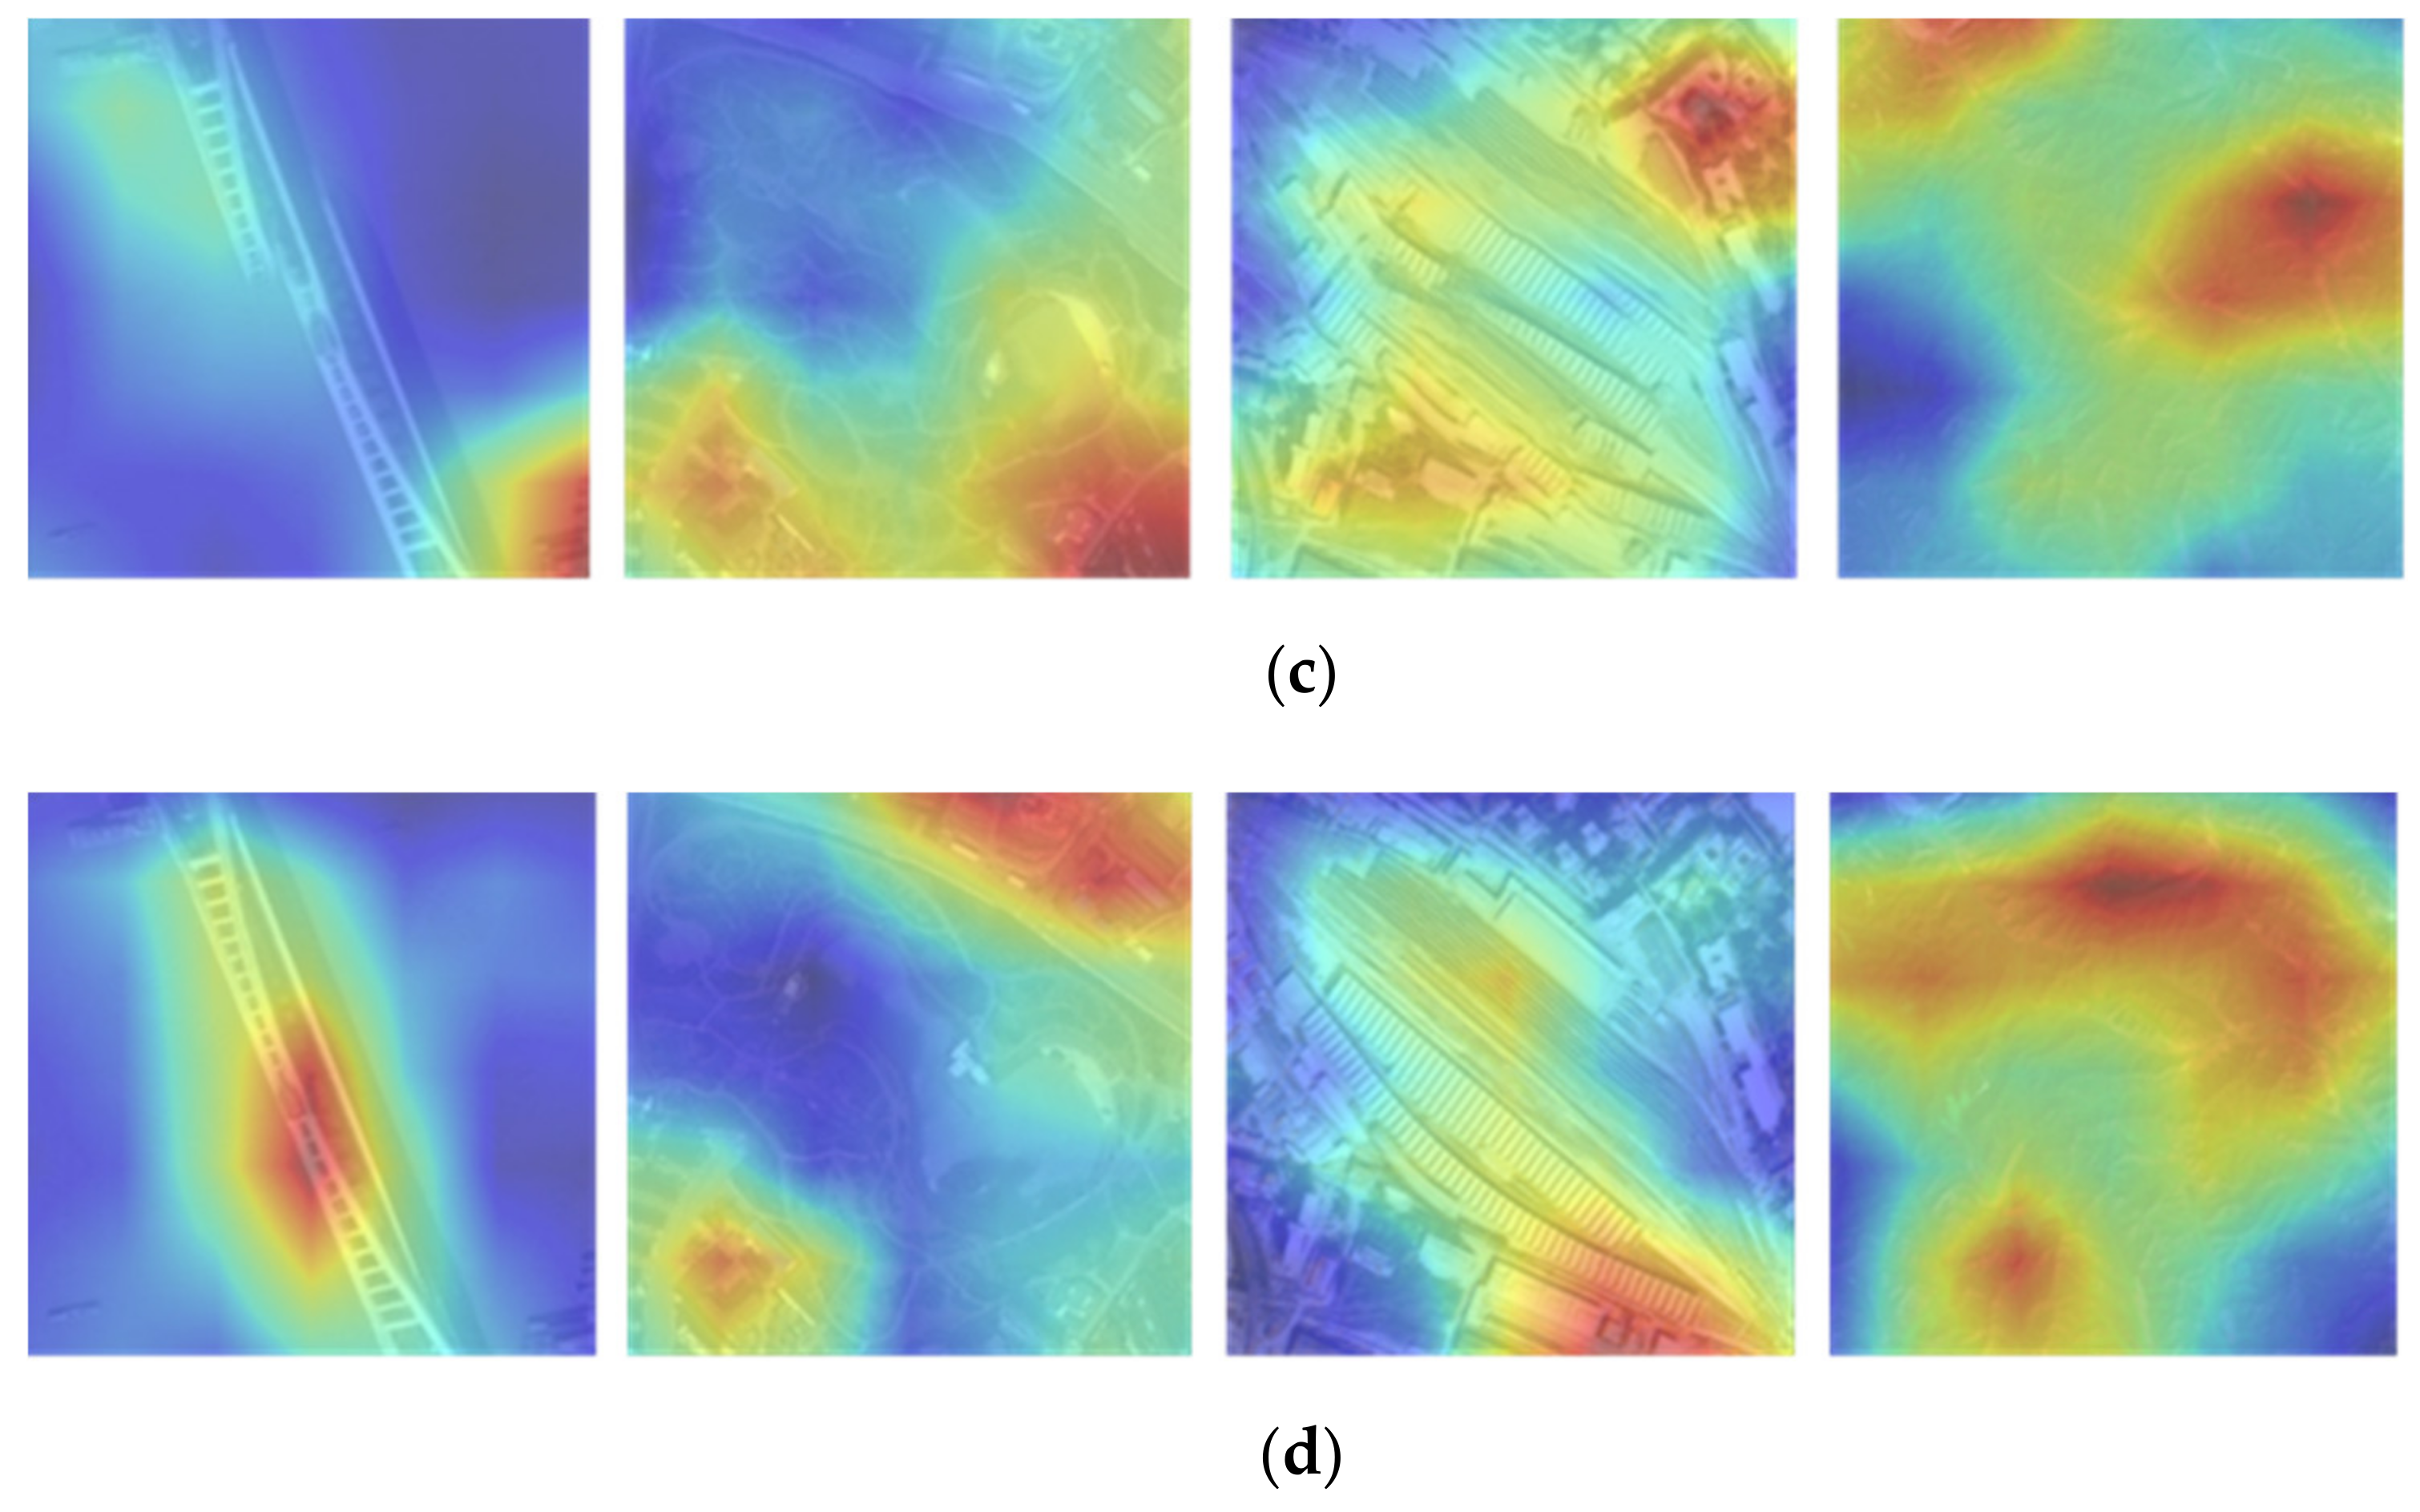
2.2. Attentional Mechanism

In computer vision, the main idea of the attention mechanism is that a system learns to focus on the places it is interested in. On the one hand, the neural network with the attention mechanism learns how to autonomously use the attention mechanism. On the other hand, the attention mechanism helps us to understand the world that the neural network sees. In 2018, Sanghyun Woo [35] proposed the Convolutional Block Attention Module (CBAM), a simple yet effective attention module for feed-forward CNNs. This module provides the attention network for channels and spatial dimension order, respectively shown in Figure 3 and Figure 4, which is used to weight input features. CBAM is a lightweight and versatile module that can be integrated into any CNN architecture. CBAM performs well when applied to image classification and object detection. The CBAM module architecture shown in the figure is divided into channels and spatial attention submodules. Each submodule learns “what” and “where” to focus on. Therefore, this module effectively helps the flow of information through the network by learning what is strengthened or what is suppressed. This module is simple, effective, and mainly used in feed-forward CNNs.
CBAM has rarely been used in combination with GAN. The following problems need to be proven by experiments: When facing Generator and Discriminator, does the attention mechanism, especially CBAM, play a role in Generators and Discriminators with different functions [36]? Does the form need to be changed? What type of changes are required? In addition, whether CBAM will pay attention to the same part when facing the same image with different scales remains to be proven. Moreover, whether the attention mechanism pays attention to the key area in the face of complex ground object images is uncertain because no additional tag information can constrain the unconditional generated adversarial network.

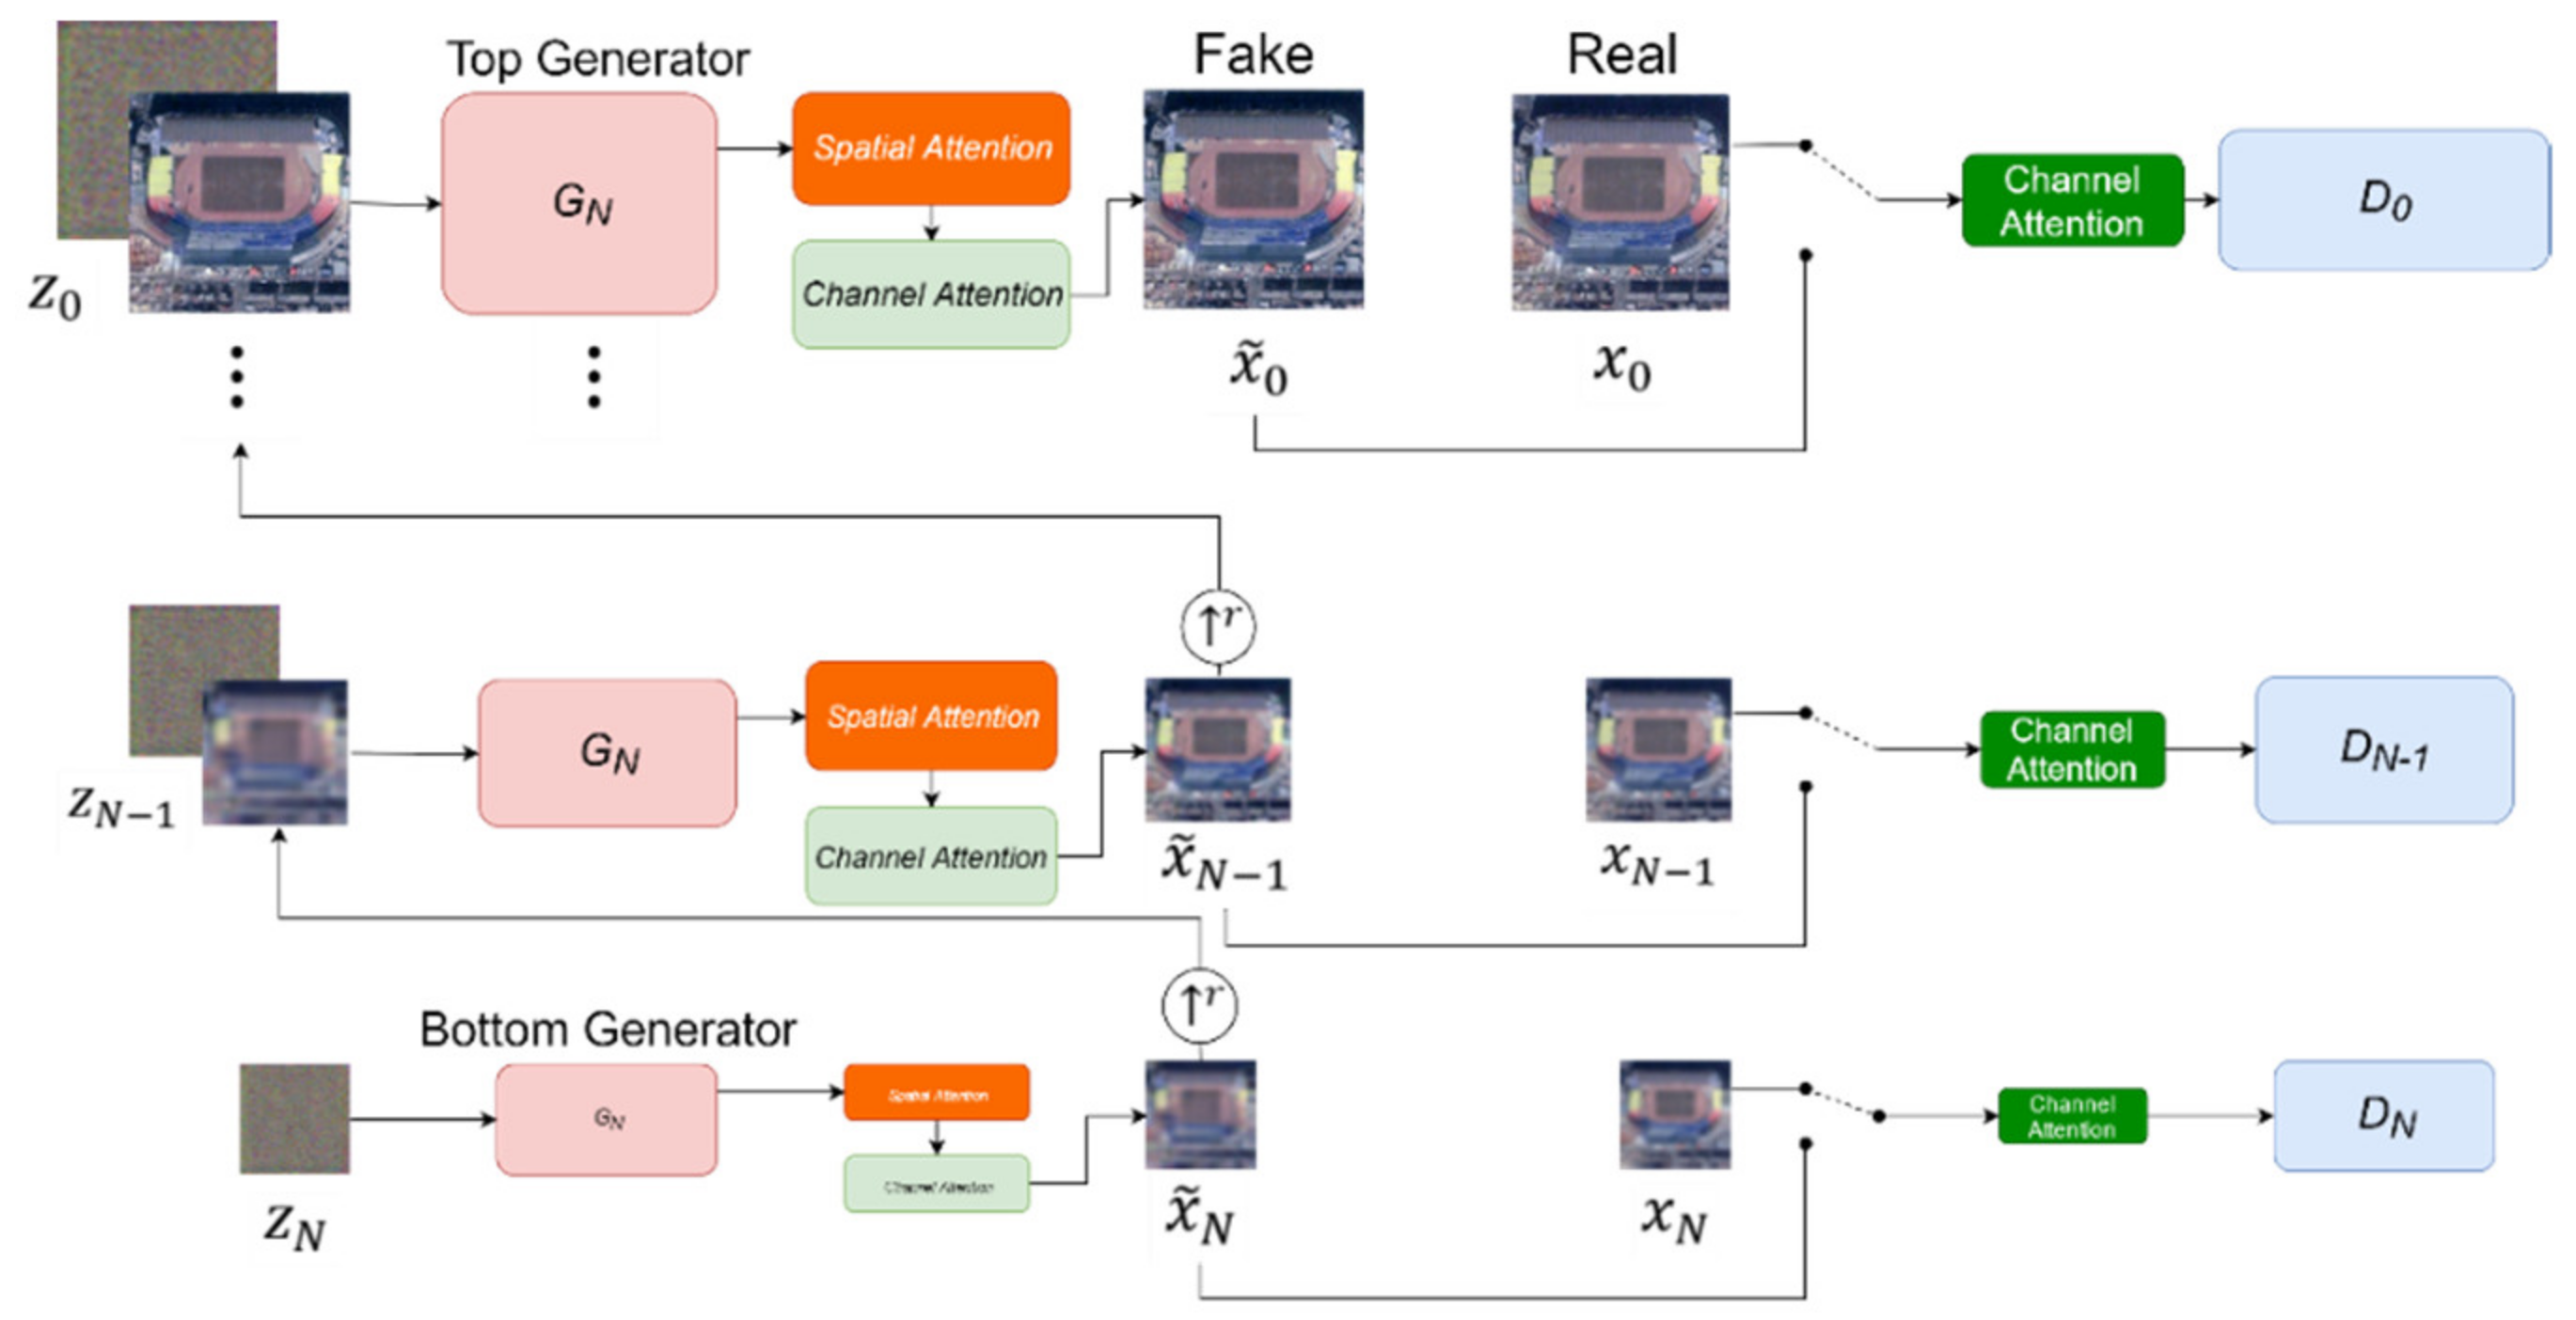
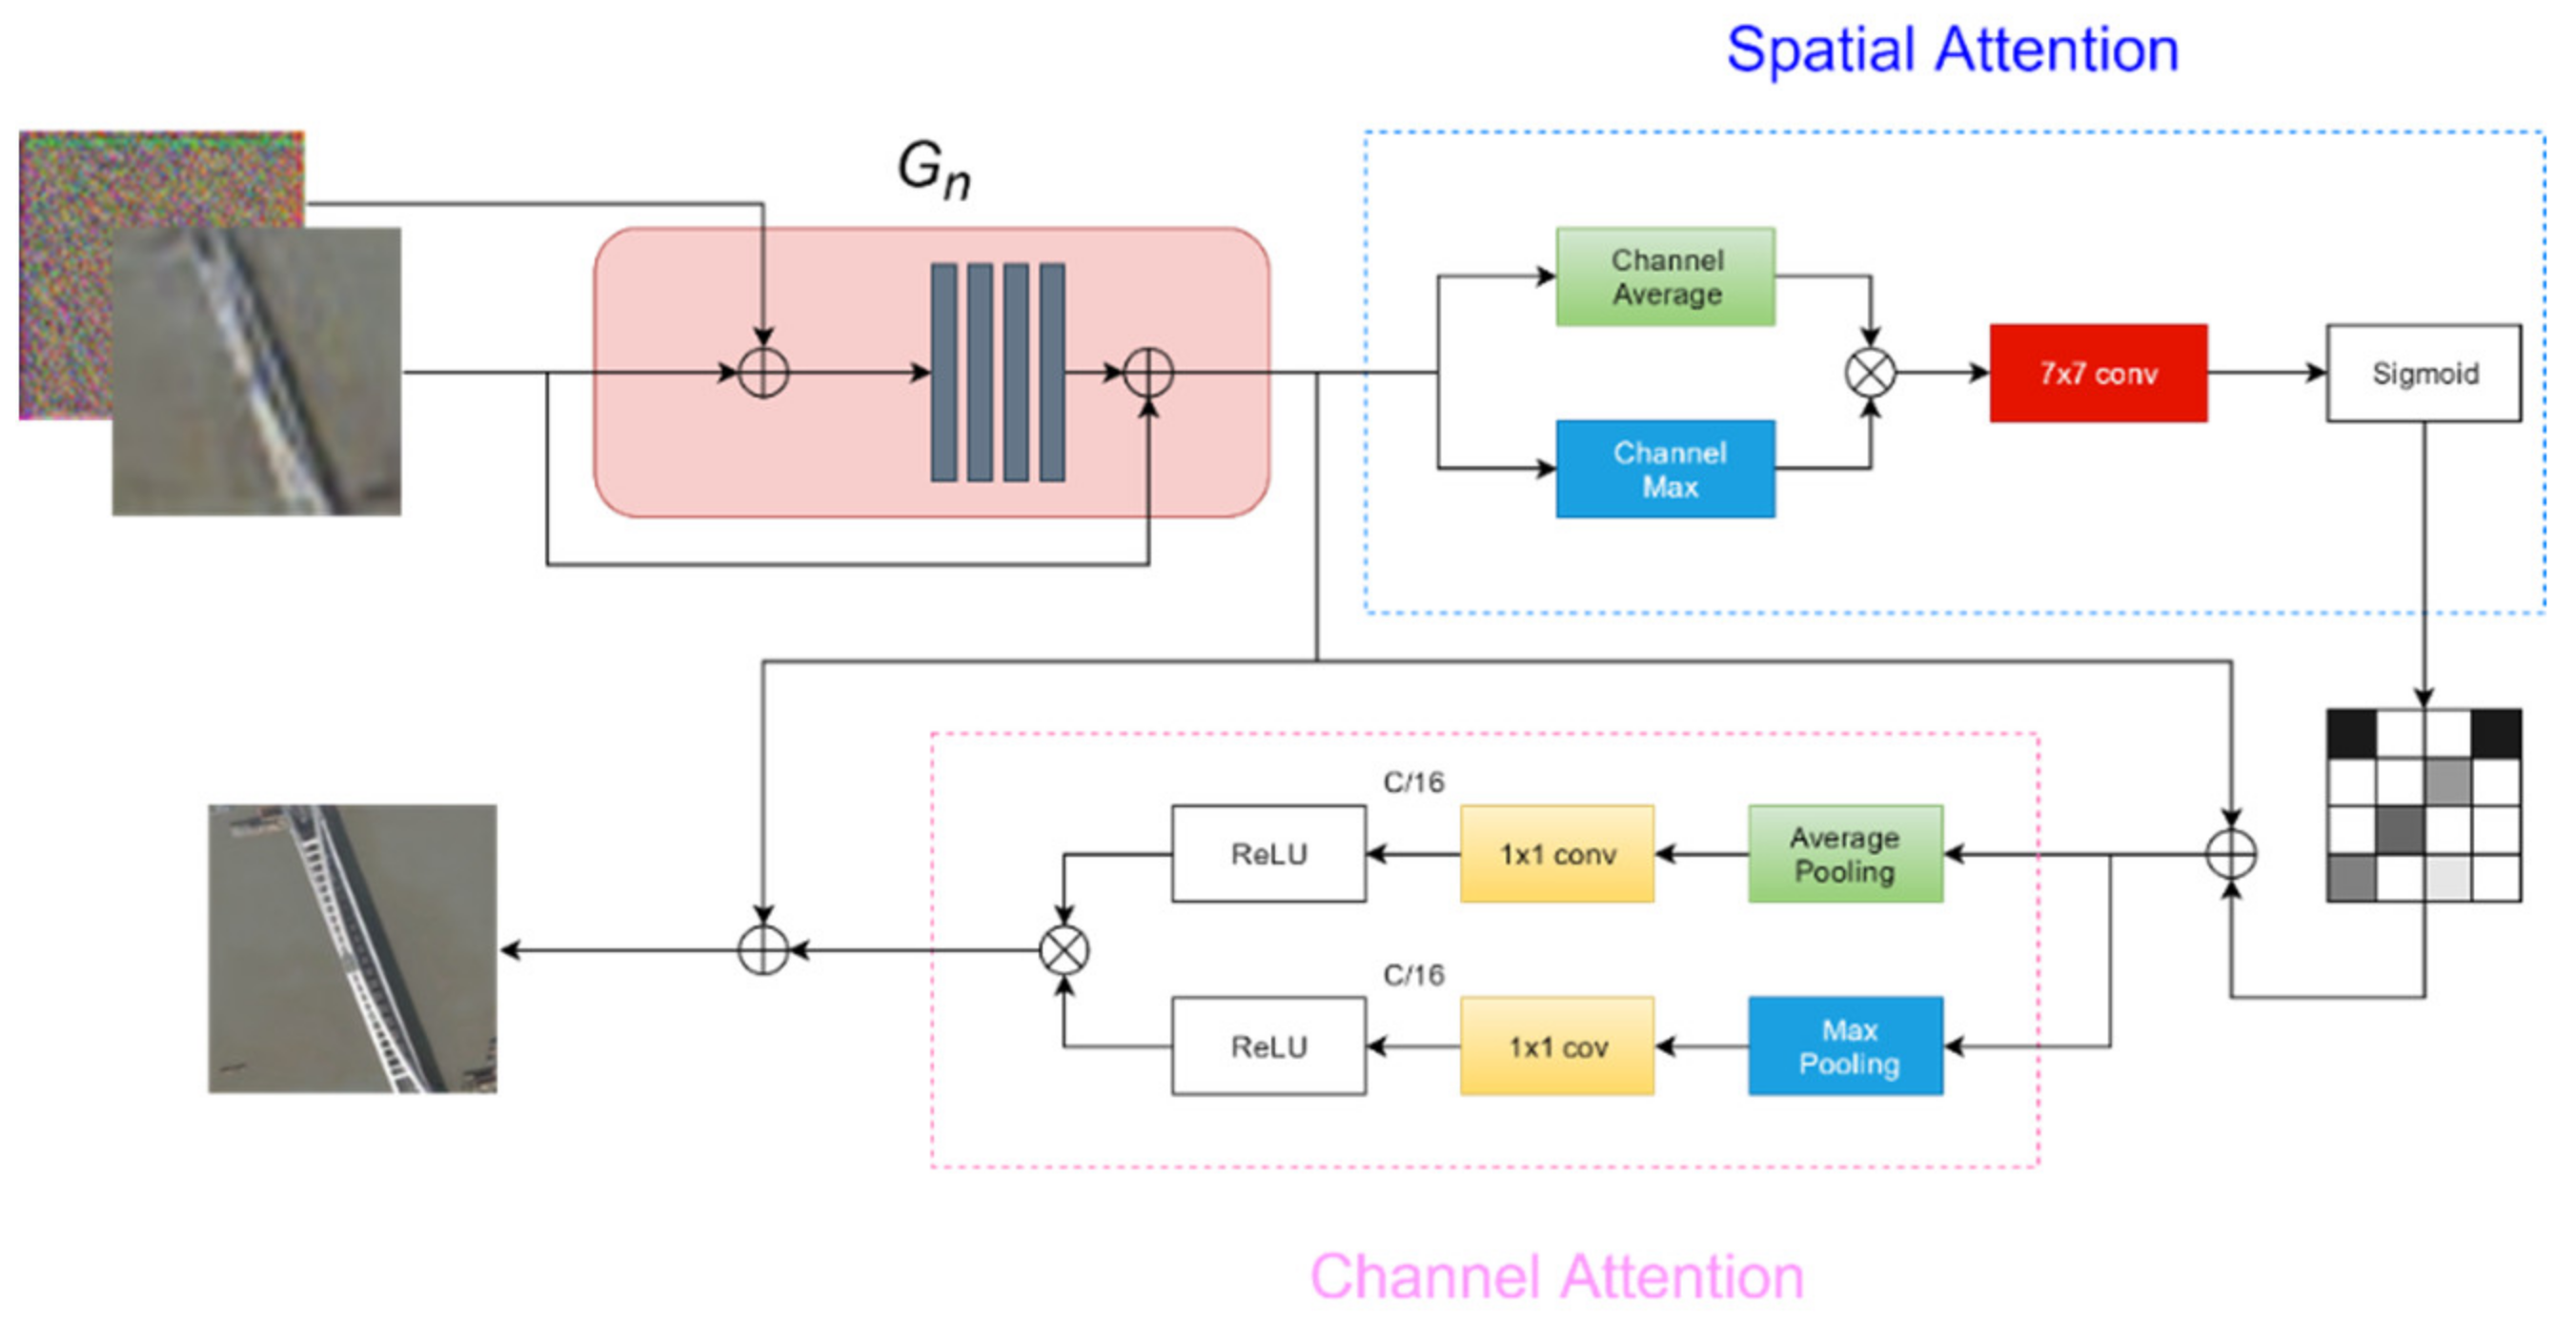
2.3. Improved SinGAN

SinGAN integrated with the attention mechanism is proposed in this work. In Figure 5 and Figure 6, the basic network is still an unconditional generated adversarial model. The internals are composed of a Generator–Discriminator cascading pair structure in a coarse-to-fine fashion. The multiscale structure from coarse to fine scales solves the problem of different ground object recognition in various resolutions of remote sensing image and better guides the training at each level through pyramid-type transmission. SinGAN’s pyramid multiscale structure is more in line with the process of manual interpretation of remote sensing image features compared with the parallel multiscale framework. The key features of the remote sensing image are rapidly and effectively extracted through the combination of multiscale structure and attention mechanism. These features are easily stored in fake samples by the Generator.
At each scale n, the input noise and the generated sample by the previous scale are incorporated into a four-layer convolution. The result is then fed into the spatial and channel attention modules to obtain the weight of every area of the image.
The generation of fake image samples starts from the coarsest scale and ends at the finest scale. The final pseudosamples are generated after passing through these scales in order. In Figure 5, only Gaussian white noise Z N is inputted at the coarsest scale N . Then, a pseudosample x N is outputted. The specific process is as follows:
x ˜ N = G N Z N .
In other scales, random noise with the addition of the pseudo-sample x ˜ N generated by the previous layer is incorporated into the input layer. The specific process is shown in Equation (3):
x ˜ n = G n Z n , x ˜ n + 1 r , n < N
The Generator’s structure is shown in Figure 6. The input noise and pseudosamples are sent into five full convolutional network layers, each of which is composed of a convolution of 3 × 3 plus Batch Normalization and LeakyReLU. The output result of the convolutional network is passed through the spatial and channel attention modules. The information extracted by the convolutional network is given a weight order instead of only texture reconstruction. The operation of G n is as follows:
x ˜ n G = M C M S x ˜ n x ˜ n x ˜ n
where M C represents the channel attention module, M S represents the spatial attention module, and operator denotes the element-wise multiplication.
A channel attention module is added in the Discriminator before the input image enters into the full convolutional network. The operation of D n is shown in Equation (5):
x ˜ n D = M C x ˜ n x ˜ n
Compared with the original SinGAN network, the Generator integrates the focus region through the attention module after features of the input remote sensing image are learned through the full convolutional network. The original SinGAN just reorganizes the texture features and edge information of the image through the full convolutional network again. By contrast, the improved SinGAN focused on information of features at the corresponding location to produce the correct geographical correlation. With the help of CBAM, the improved SinGAN assigned weights to objects in the spatial domain as well as in the channel domain. The main reason why only the channel attention module is added to the Discriminator is interpreted as follows. First, the pyramidal multiscale framework observes the global distribution and detailed texture of the image, which is enough to distinguish the image from the real one. Second, if the Discriminator greatly focuses on a certain feature of the image, then it will give the Generator an illusion that the rest of the features are not important; thus, it needs to be moderate. Third, the framework focuses on the key area of the image to grasp the global distribution, which will cause extra memory to the network and requires high hardware configuration, which is not in line with the original intention of the SinGAN designers.

3. Experiment and Results

3.1. Experimental Configuration

All networks were conducted using 8 GB of RAM and a 64 bit Windows 10 OS system with a RTX2060 GPU. A restriction in the SinGAN pyramid multiscale network structure is that the input image can only be a single image. Accordingly, training of the sample feature extraction and the classification of remote sensing images are performed under two different network paths. The randomness in the selection of the training set may also lead to a certain magnitude of up and down fluctuations in the results. Therefore, all comparison experiments were conducted under identical conditions to avoid unnecessary factors other than this from interfering with the results of the experiments.

3.2. Evaluation Index and Dataset Description

  • Datasets
Two remote sensing image datasets, namely, the RSSCN7 Dataset [37] and the UC Merced Land-Use Dataset [38], were selected to test the above-proposed improved SinGAN.
The RSSCN7 Dataset contains 2800 remote sensing images divided into seven categories. The size of each remote sensing image is 400 × 400 pixels, and each category contains 400 remote sensing images. The remote sensing images were identified at four scales of 1:700, 1:1300, 1:2600, and 1:5200 and their contents were extracted from Google Earth (Google, CA, USA) in different seasons and weather conditions. The manner by which to effectively carry out deep feature mining for such complex and variable remote sensing images will have an important influence on classification accuracy.
The UC Merced Land-Use Dataset contains 2100 remote sensing images divided into 21 categories. Each remote sensing image is 600 × 600 pixels in size, and each category contains 100 remote sensing images. The remote sensing images have a resolution size of 1 foot (approximately 0.3 m) and were extracted from the USGS National Map Urban Area Imagery collection for various urban areas around the country. This classical remote sensing dataset covers many features with considerable resolution. However, the number of remote sensing images for each category is small, which is a challenge to many classification models.
2.
Accuracy validation methods
Confusion matrix and overall classification accuracy are often used in the quality assessment of remote sensing image sensing classification. These two methods were also used in this work.
Confusion matrix is mainly used to compare the differences between the classification results and the real objects of the ground surface. The accuracy of the classification results is displayed inside a confusion matrix. The confusion matrix is calculated by comparing the true classification of each surface scene with categories predicted by the classification network. Each row of the matrix represents the instances in a predicted class, while every column indicates the instances in an actual class.
The overall accuracy is equal to the sum of the number of scenes correctly classified divided by the total number of scenes. The correctly classified surface scenes are distributed along the diagonal of the confusion matrix, which shows the number of scenes classified into the correct surface class. The total number of scenes is equal to the sum of the number of true positives and false positives.
3.
Parameter setting
The key parameters for the operation of the whole network are presented in detail here to help in understanding some settings in the next experiments. The basic components of the network, mainly the structures of the Generator and Discriminator, have been described in detail above and will not be repeated here. First, we performed some preprocessing for images entering the network, the main one was to resize them, with the maximum size not exceeding 250 pixels and the minimum size specified as not less than 25 pixels.
Each scale was iterated 2000 times with an initial learning rate of η = 0.0005 and decayed at a rate of 1/10 after each 1600 iterations. In the optimizer, Adaptive Moment Estimation [39] was used to compute the gradient and adjust the model. The parameter “beta_1” was set as 0.5 with the others as the defaults, including beta_2 as 0.999, epsilon as 1e-8 and so on. Batch Normalization (BN) [40] was employed to reduce overfitting during training in the Generator and Discriminator. The learning rate is the same for the Generator and Discriminator as 0.0005. As a precaution, the LeakyReLU [22] (LReLU) activation function was also set to prevent the overfitting problem by setting and adjusting the negative slope of LReLU when BN fails. In any scale, we set LReLUα = 0.2.

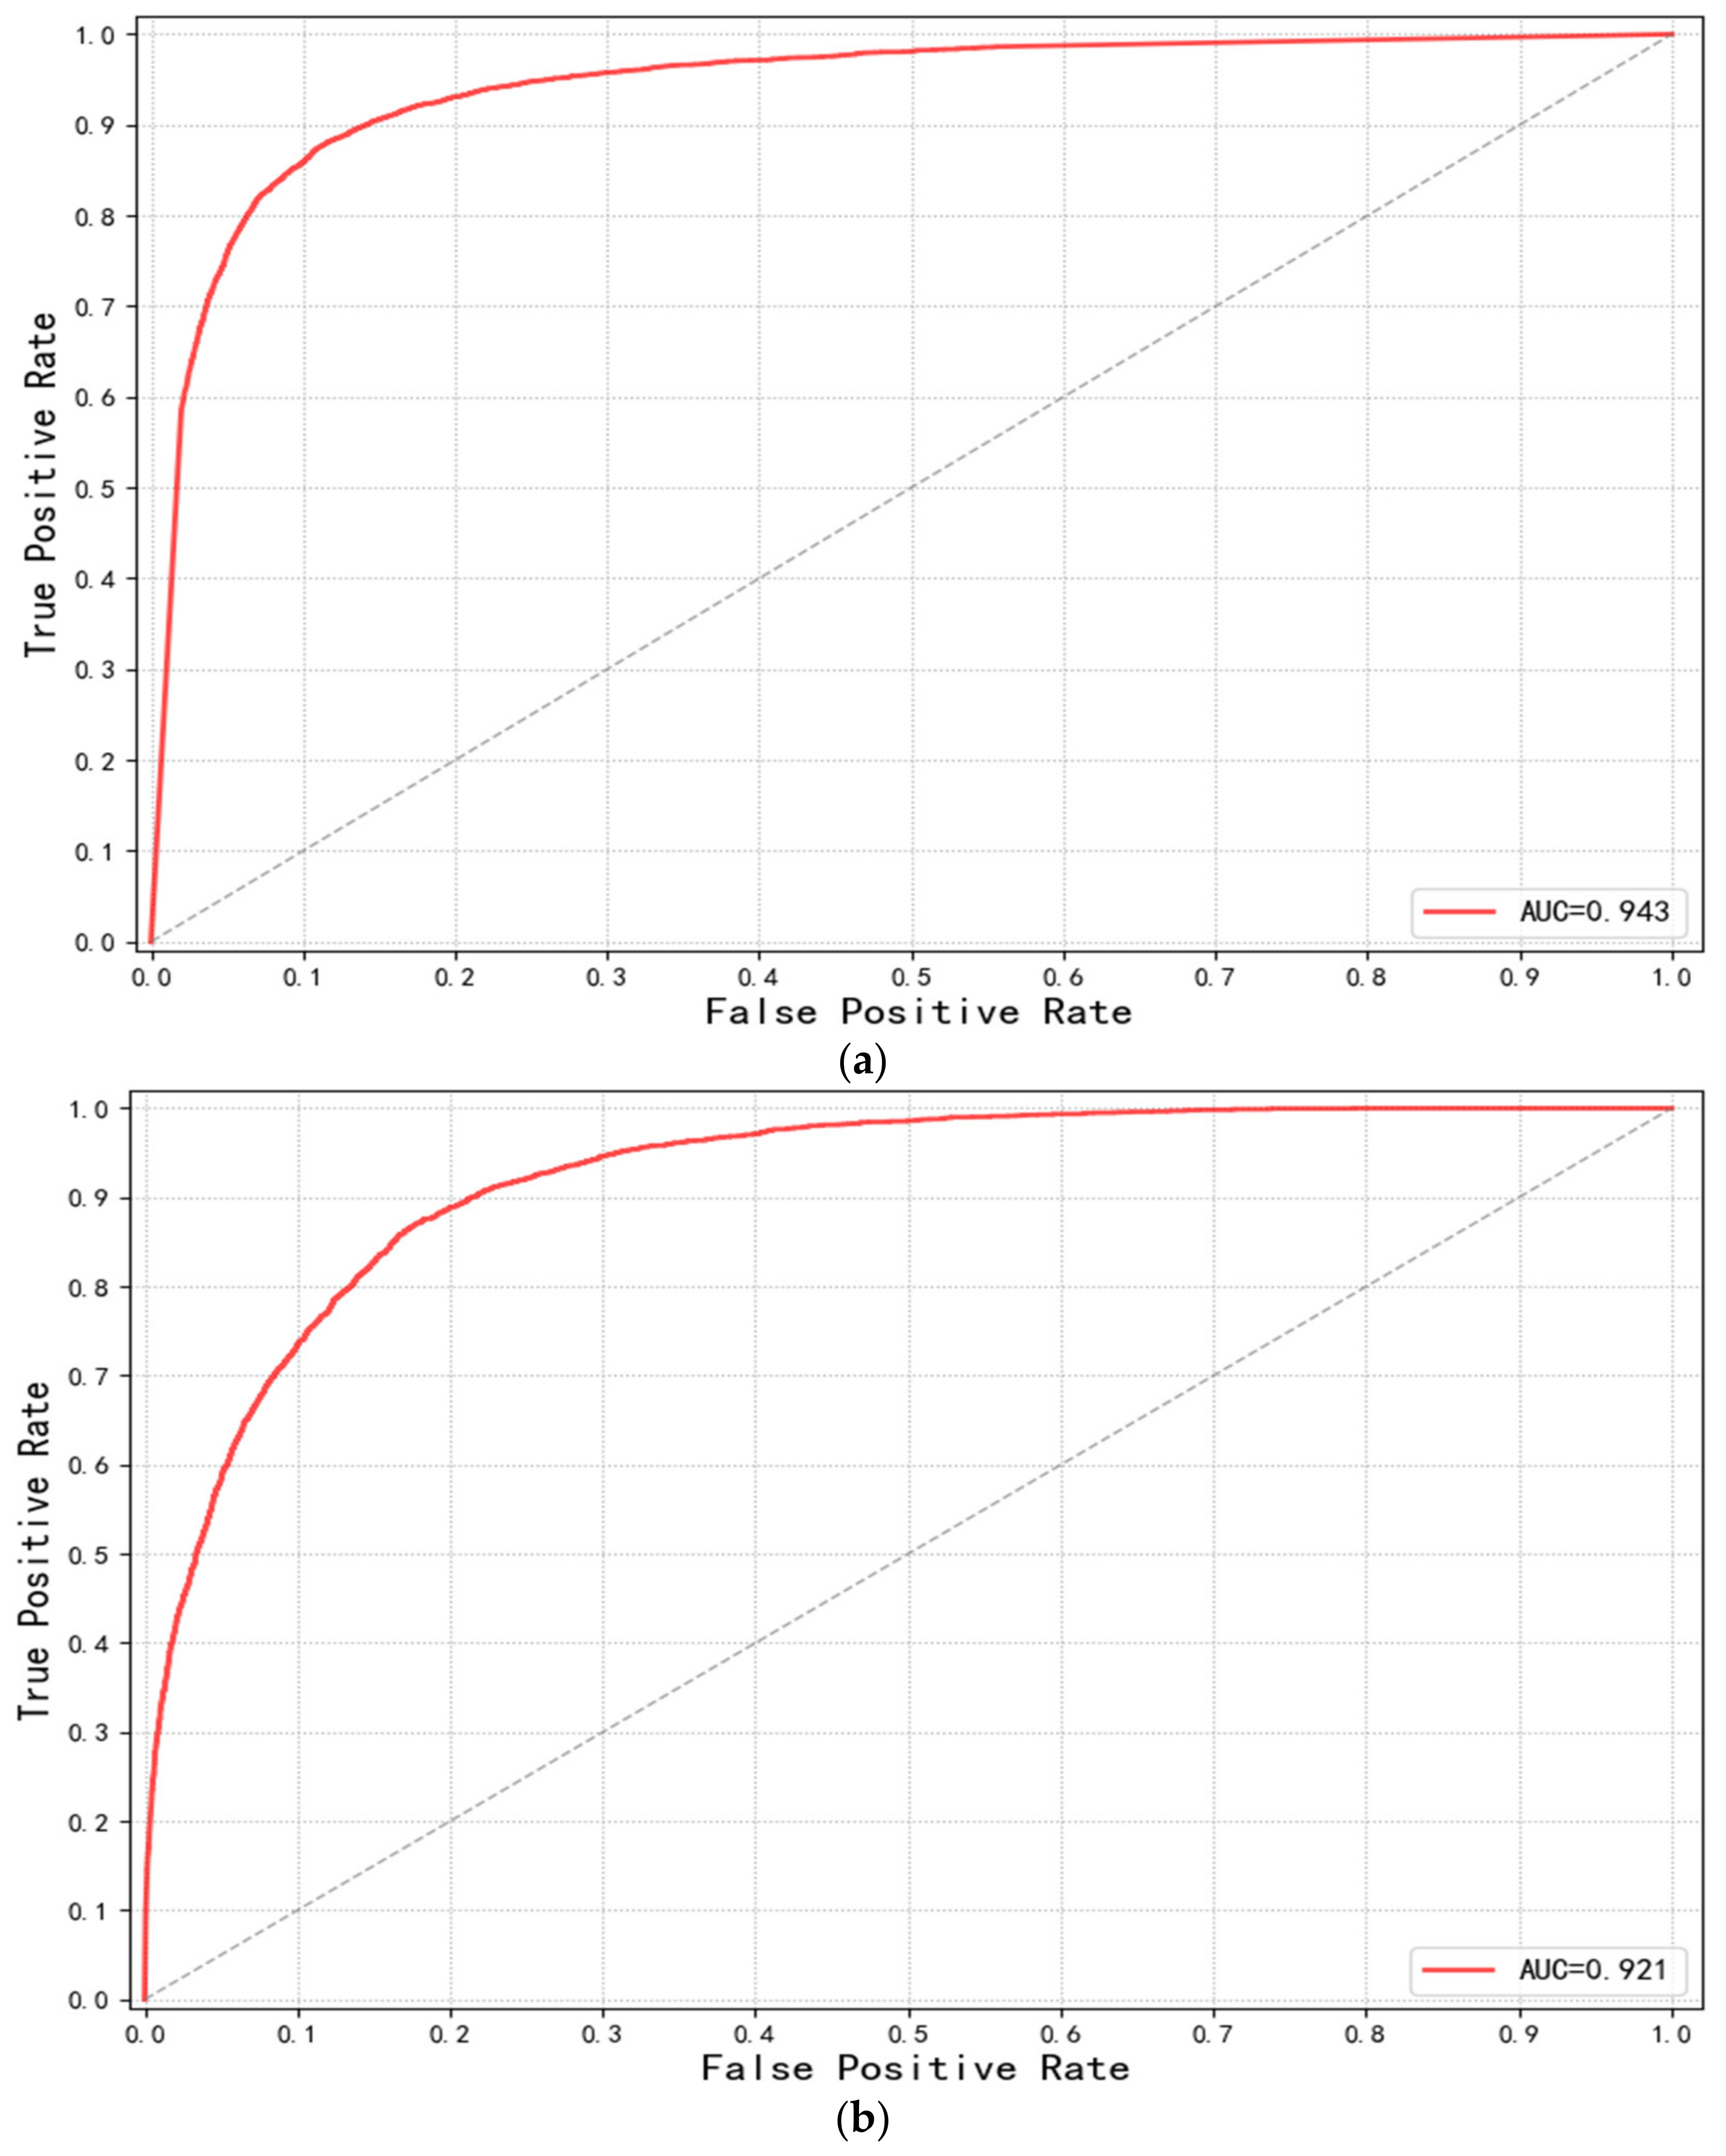
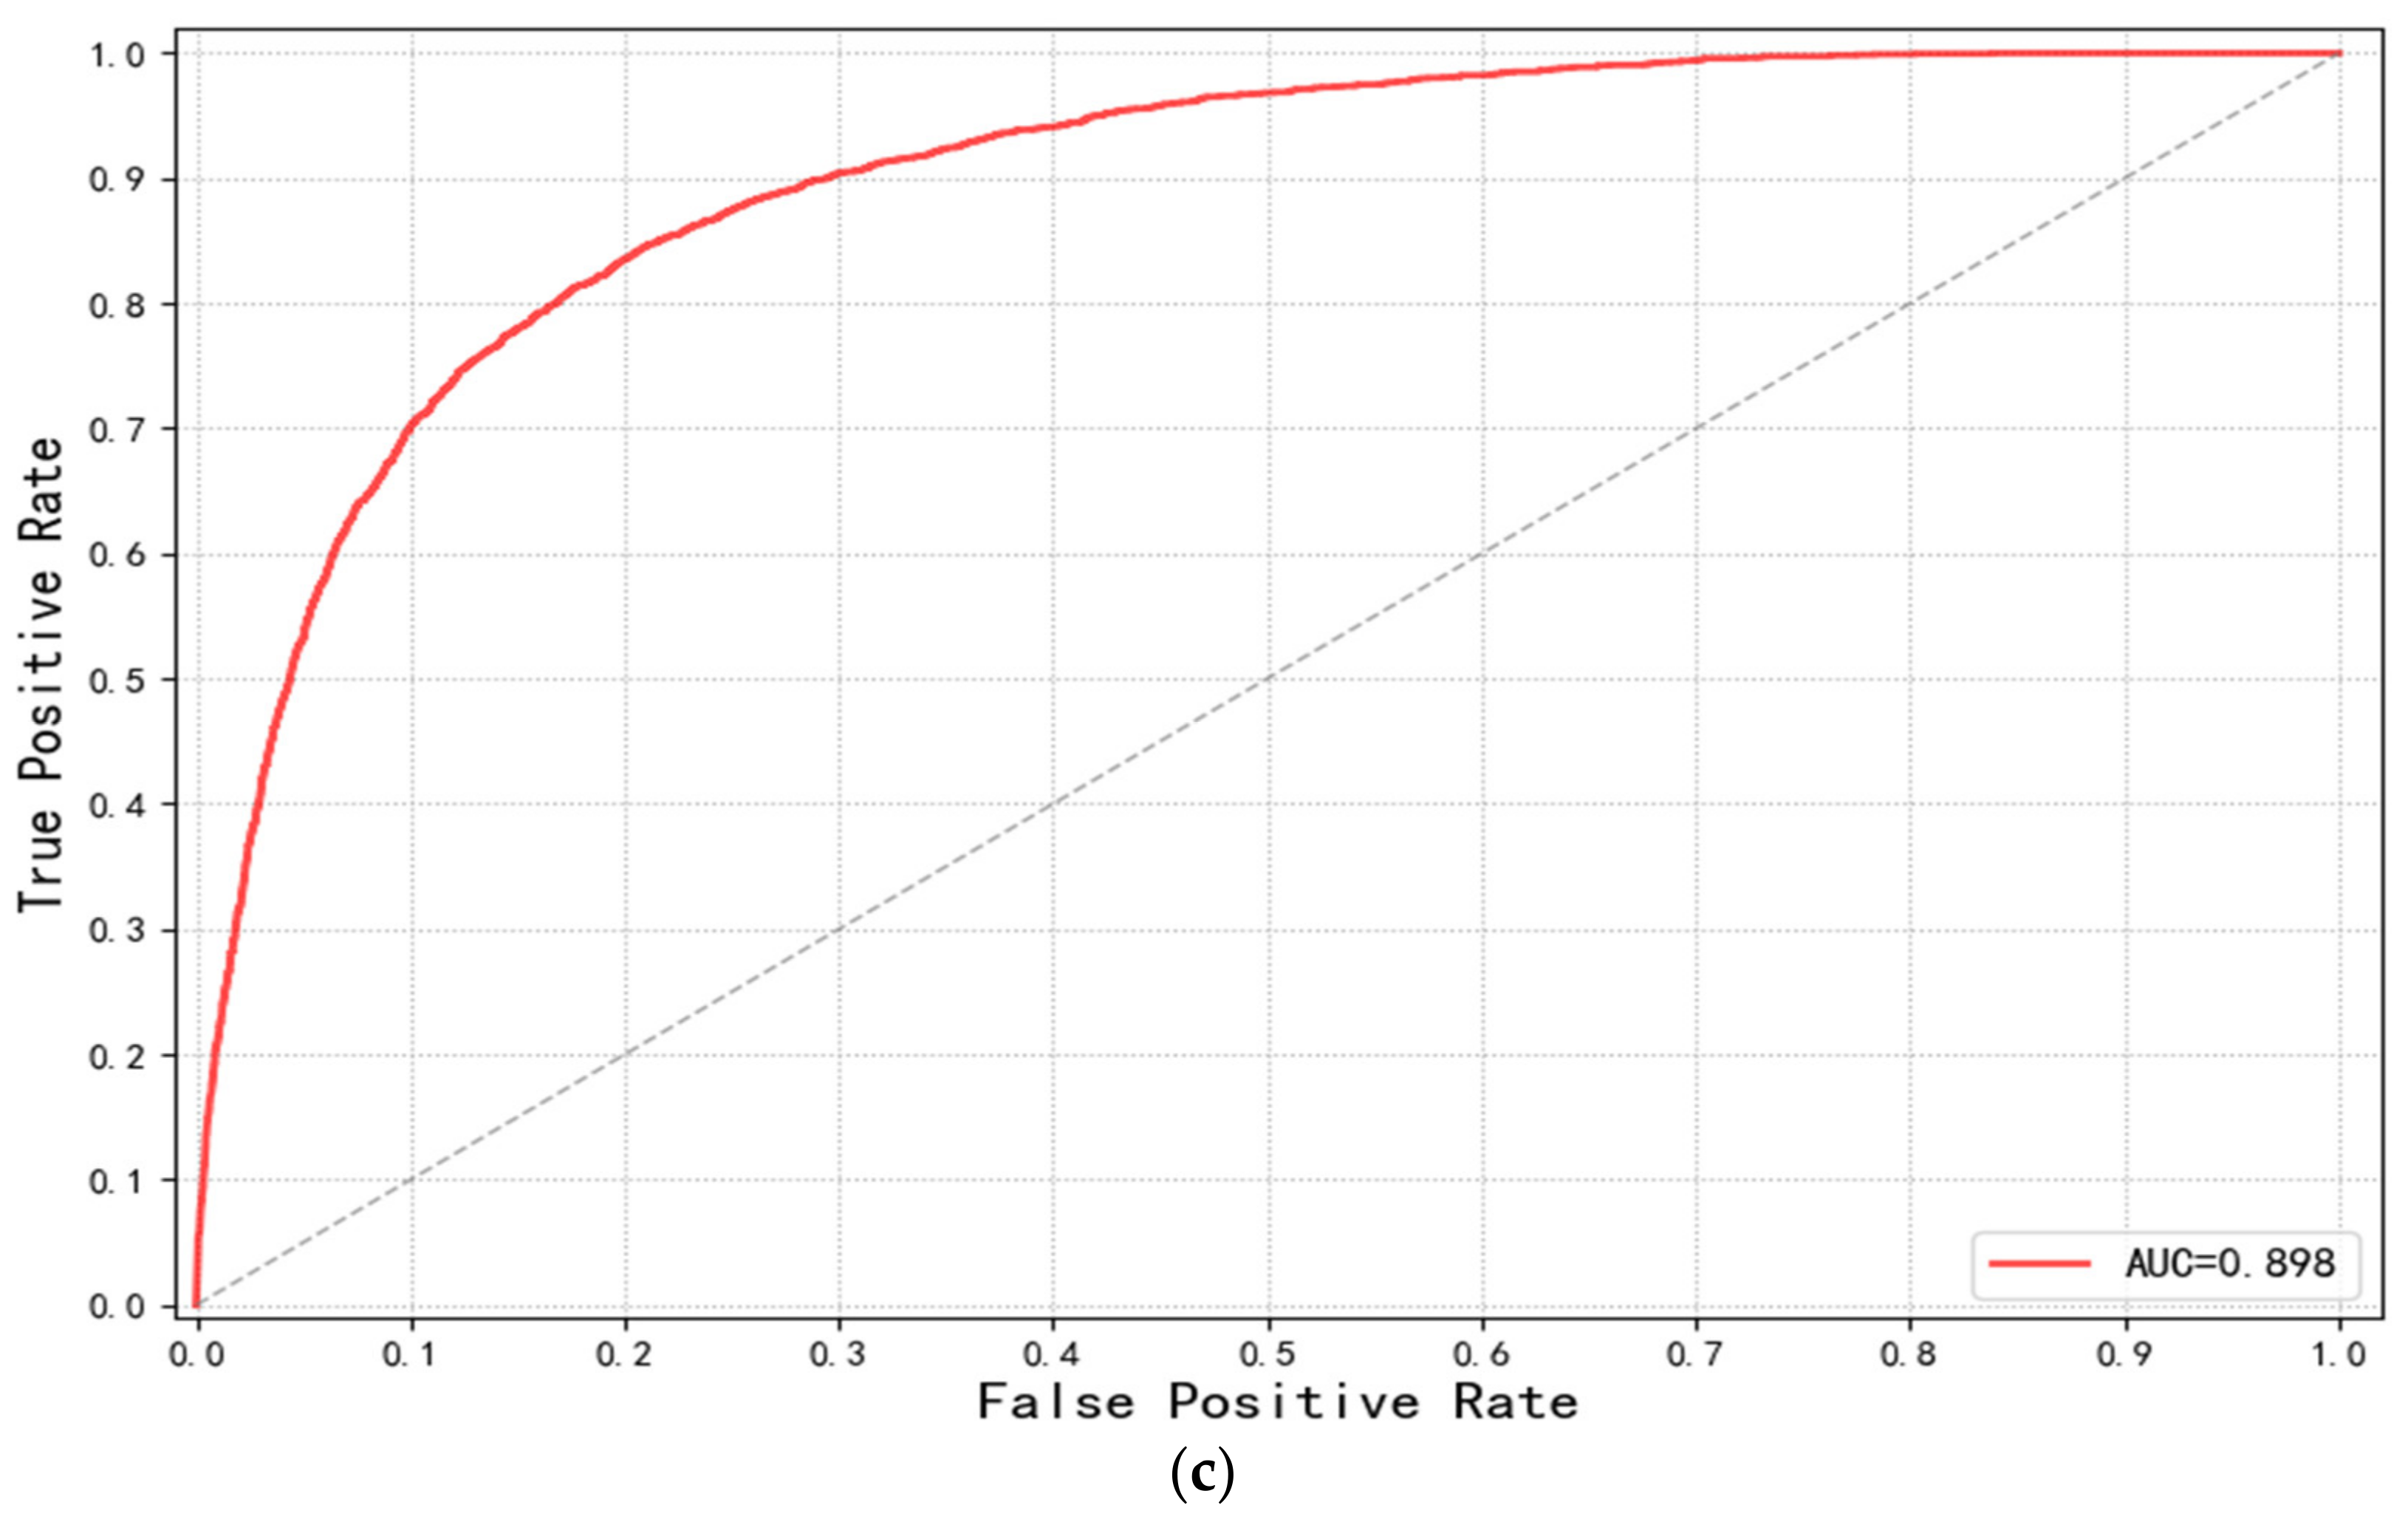
3.3. Evolution of the Model Performance

In this work, the remote sensing images in each category of the RSSCN7 Dataset and UC Merced Land-Use Dataset were selected, and pseudosamples were generated and compared in the unmodified SinGAN and SinGAN under the improvement of this work. The results obtained in different training stages are shown in Figure 7 and Figure 8.
The selected figure is a remote sensing image of the bridge subordinate classification in the UC Merced Land-Use Dataset. In the original SinGAN network, a bridge scene takes a long learning phase to build up by a set of random noise. The pseudosamples obtained at the end are unrealistic and cannot effectively serve as training datasets for the classifier network. This situation is mainly due to the low resolution of remote sensing images and the complexity of ground scenes. Accordingly, a good explanation is difficult to obtain by simply learning each part of the image by a multiscale structure. However, the improved SinGAN effectively pays attention to important features in the image through the spatial attention mechanism. In Figure 7, a fake image distribution similar to the original image is obtained at five stages, thus ensuring the effectiveness of the generated pseudosamples as the training set. The improved SinGAN gradually works with the increase in stages, and the contrast between the color brightness of the bridge subject and the brightness of other features in the background is obvious in the pseudosample shown at eight stages, which gives a clear perception of highlighting the bridge as the subject of the scene.
The fake samples separately generated by the original and improved SinGAN are shown in Figure 9 and Figure 10. This study uses the remote sensing scene images from the FootballField, Mountain, Park, River, and RailwayStation classes in the UC Merced Land-Use Dataset as training sample for the model with the same training parameter settings (Num Layer = 6, Max Size = 250, Epochs = 2000, learning rate = 0.0005). The original SinGAN and the improved SinGAN are good at restoring the texture details in each place and can find the specific origin from the training samples. However, the pseudosamples generated by the original SinGAN with the main body of the remote sensing scene image restored are not very good. For example, in the FootballField class sample, the grass in the center of the playground cannot be represented as a complete rectangle, and a piece is missing. In the Park sample, the original gourd shaped pond has been seriously distorted to the extent that it is unrecognizable. The relatively regular paths in the park have been deformed to the extent of being a maze. In the RailwayStation sample, the positions of the stations and tracks have been exchanged or are missing, while the shapes of houses on the surface have been scaled, rotated, or blurred. These objects cannot be counted as real surface samples. With regard to the natural features, the main problem is that the location of the objects is wrong. Although the basic shapes of the major features can be effectively learned, problems such as location discontinuities, location errors, and orientation errors occur during the reconstruction of the samples. For example, in the sample of Mountain, the positions of the peaks have been changed, and multiple peaks have been generated at the same location. However, such a fake sample is still learnable considering the sample diversity. In the sample of River, rivers that should be a whole have been broken into multiple sections and distributed in different locations of the image, which is a geographical correlation error. However, the five types of features do not produce dissimilarity around the image, especially in the four corners, but restore the distribution of the sample intact. In Figure 10, the abovementioned problems are well solved by the improved SinGAN.
To evaluate the performance of the improved SinGAN, five models—DCGAN [22], WGAN [23], MARTA GAN [26], Attention SinGAN [41], and the original SinGAN [28]—were selected as comparative experiments. Figure 11 shows the results of generation samples by different methods.
Figure 11 shows the generation performance of different methods in four remote sensing scenes: Forest, Farmland, Grass, and Industry. It can be seen that the improved SinGAN has a better generation result in the pseudosamples of four different scenes. Meanwhile, the computation time of each method is recorded in Table 1. Improved SinGAN is faster than the original SinGAN.

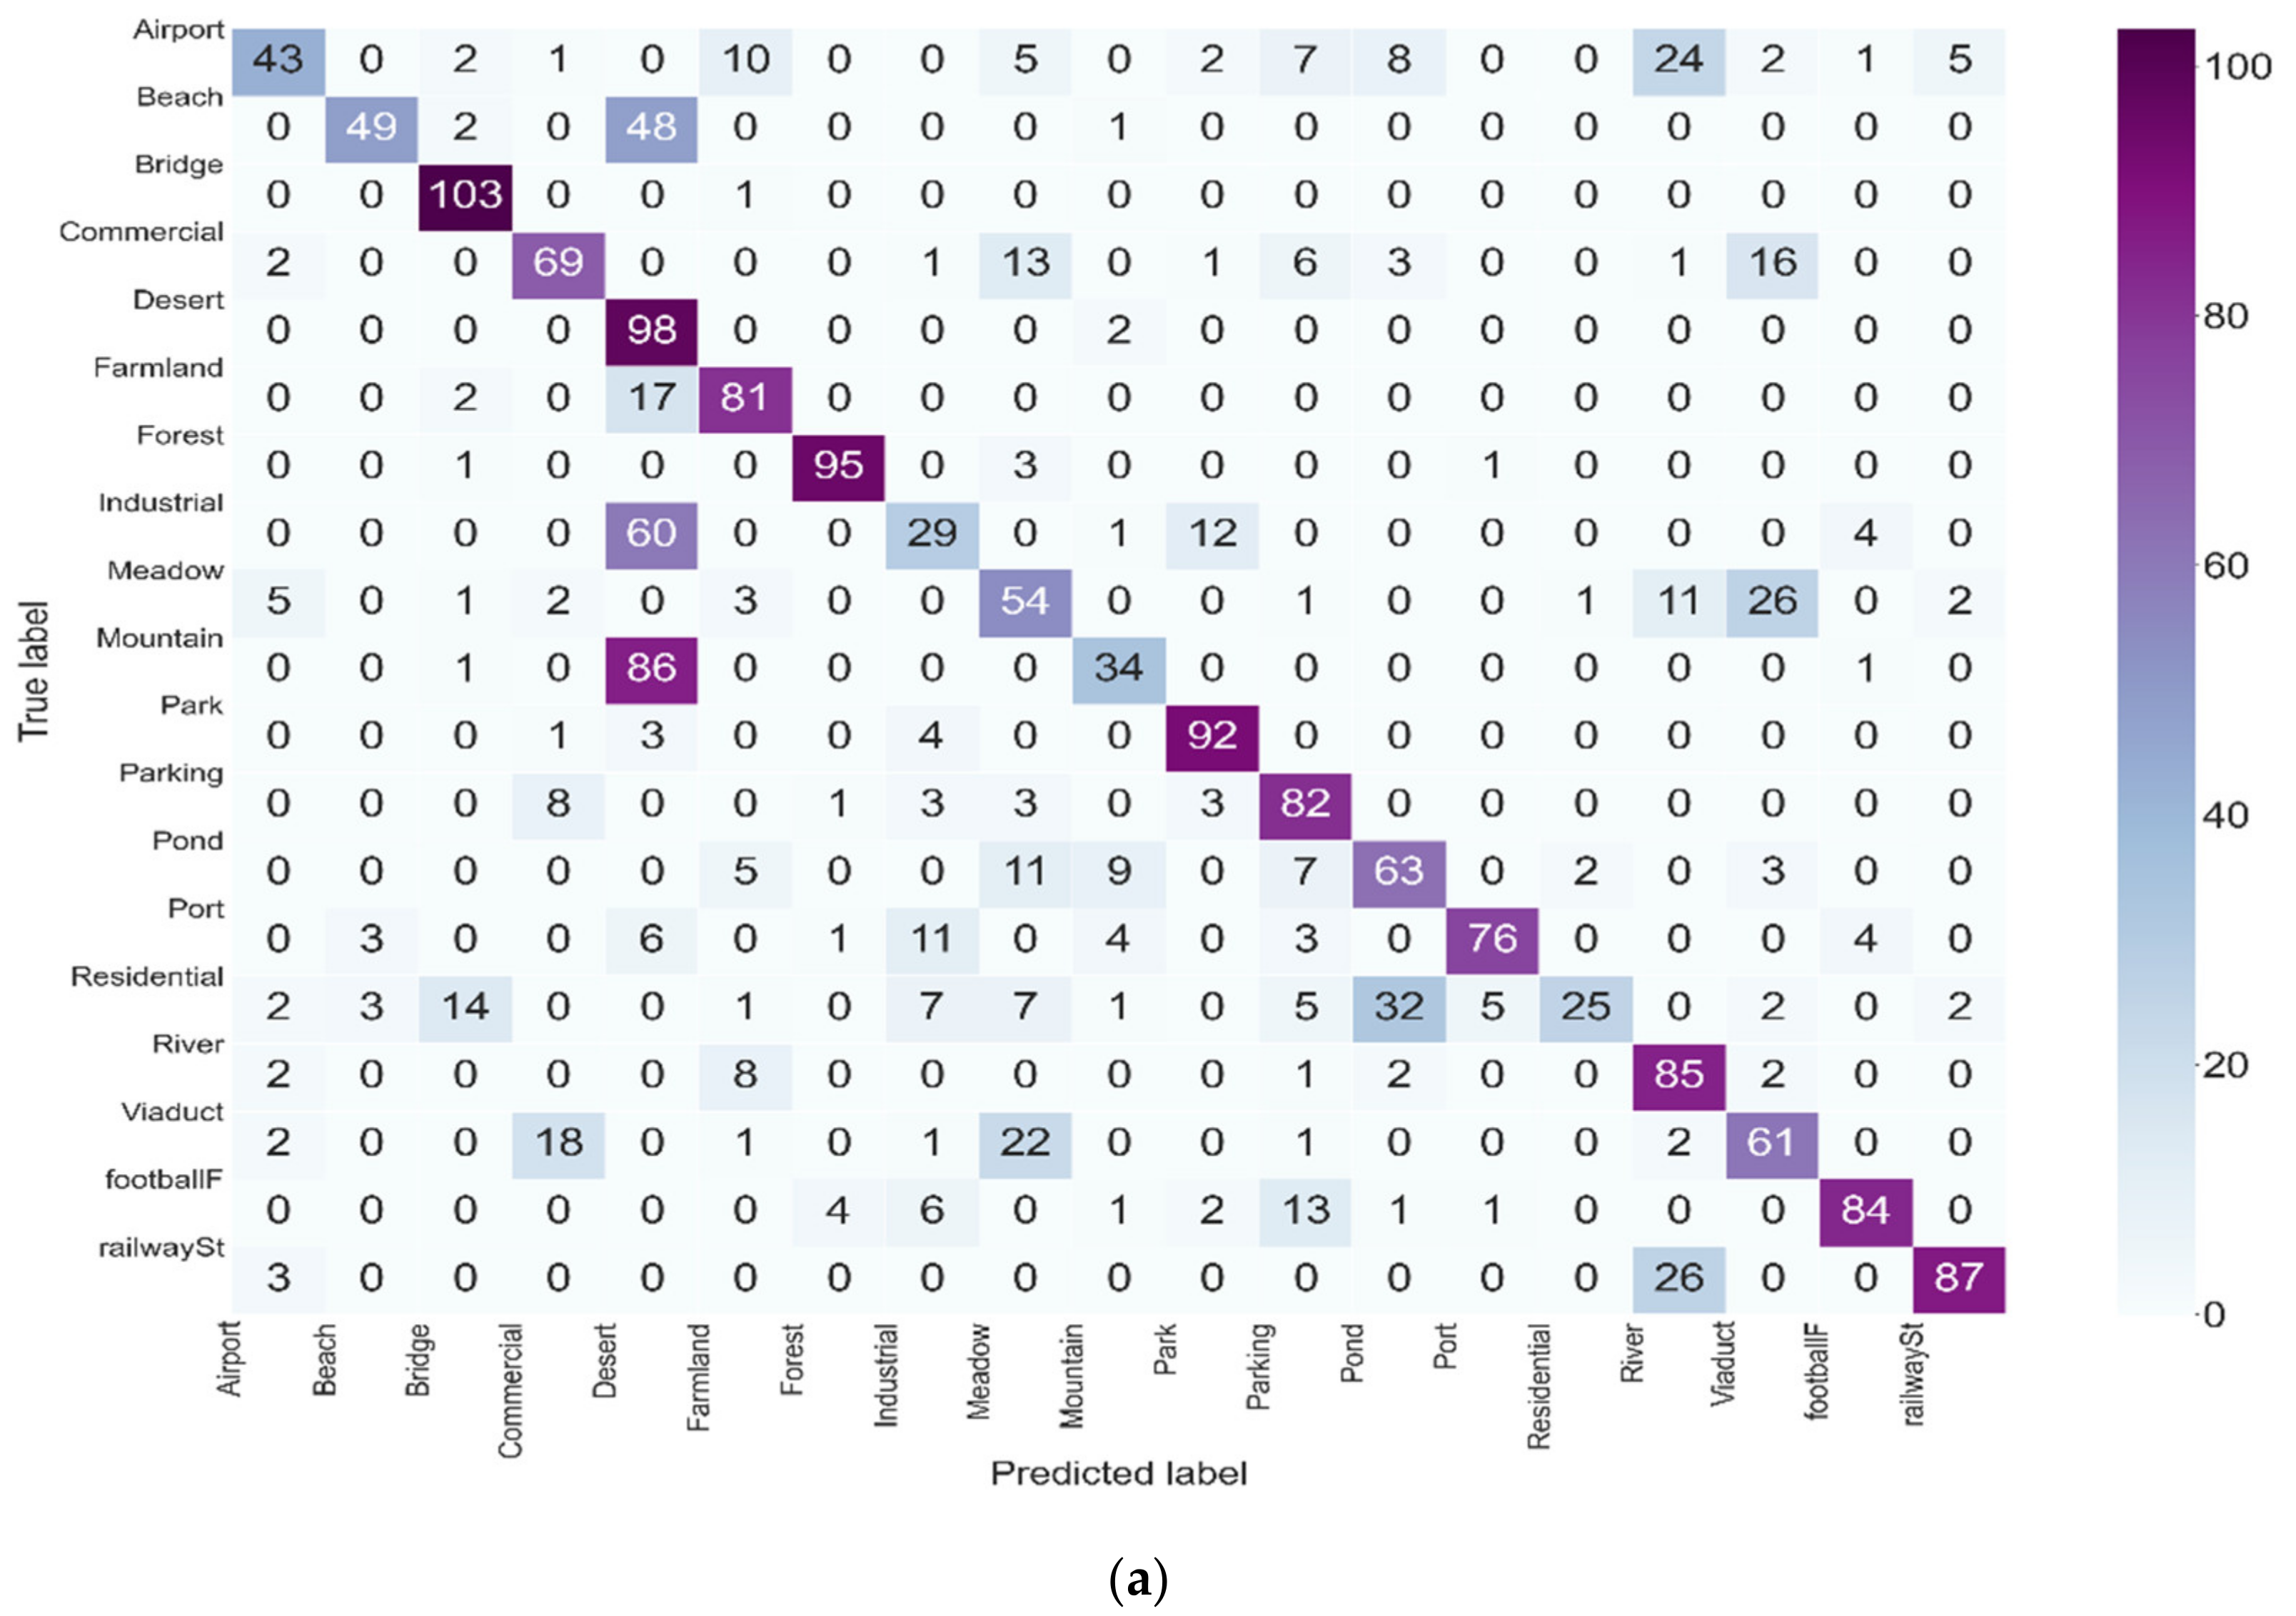
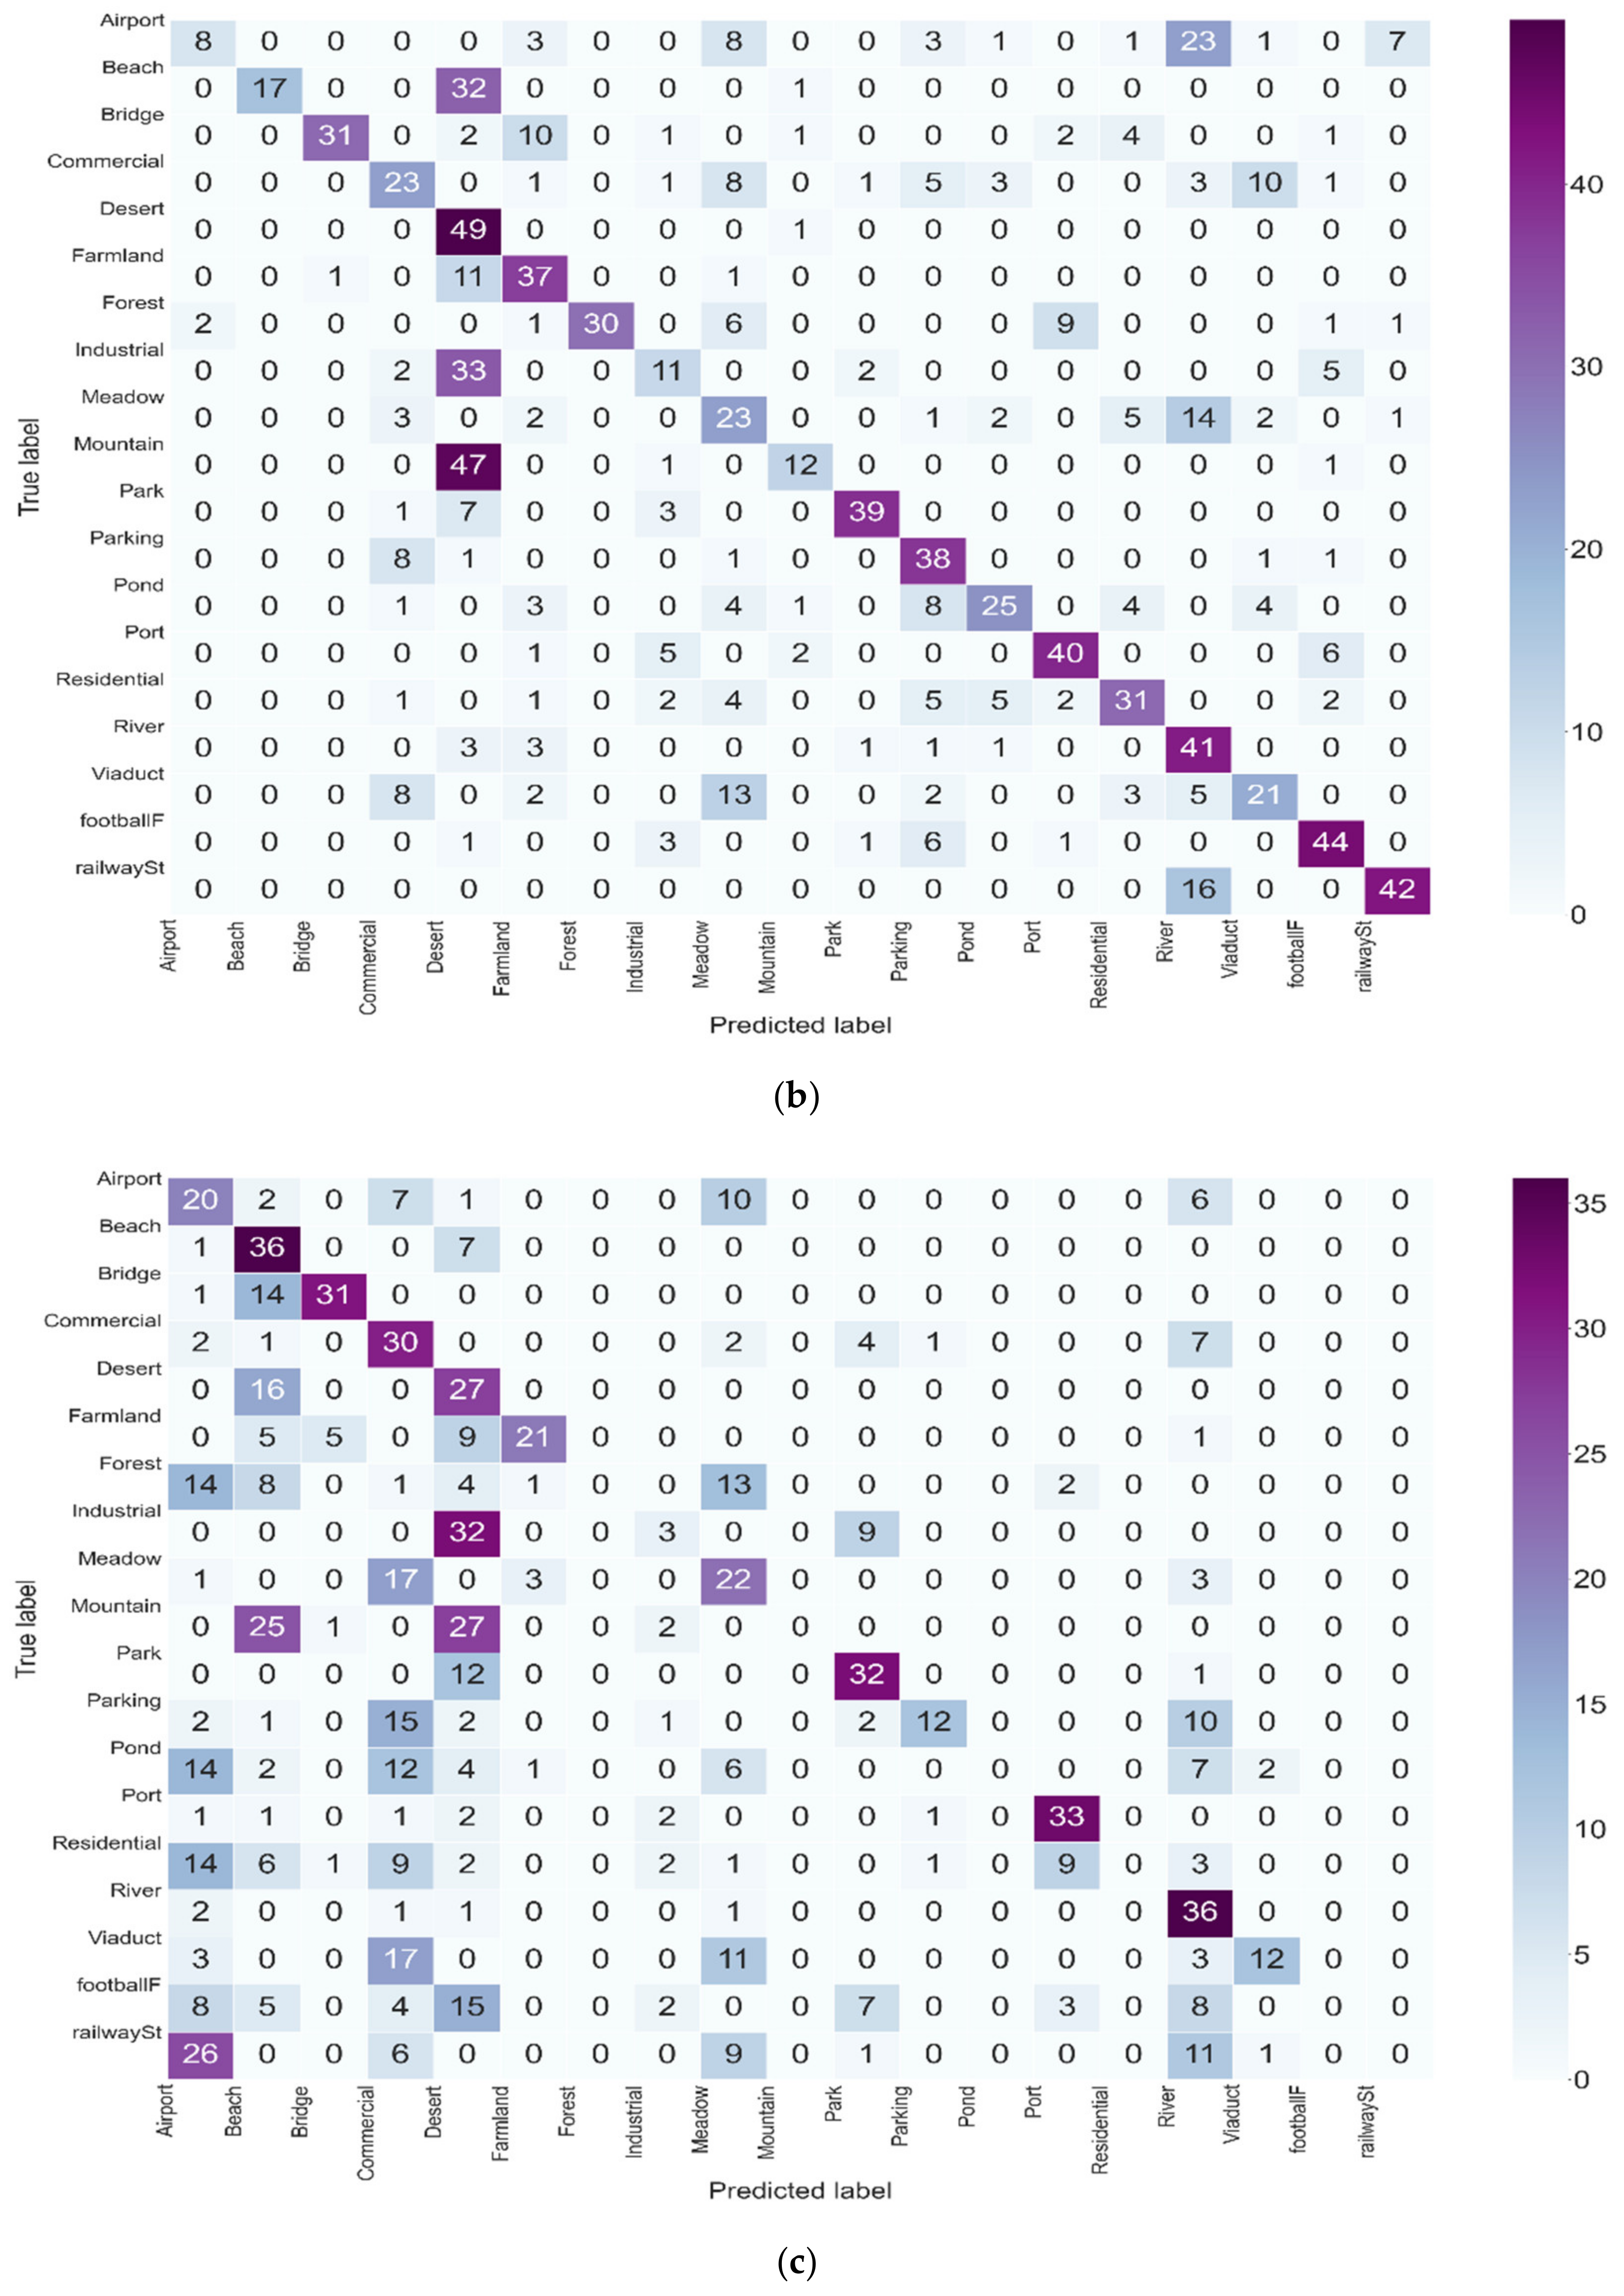
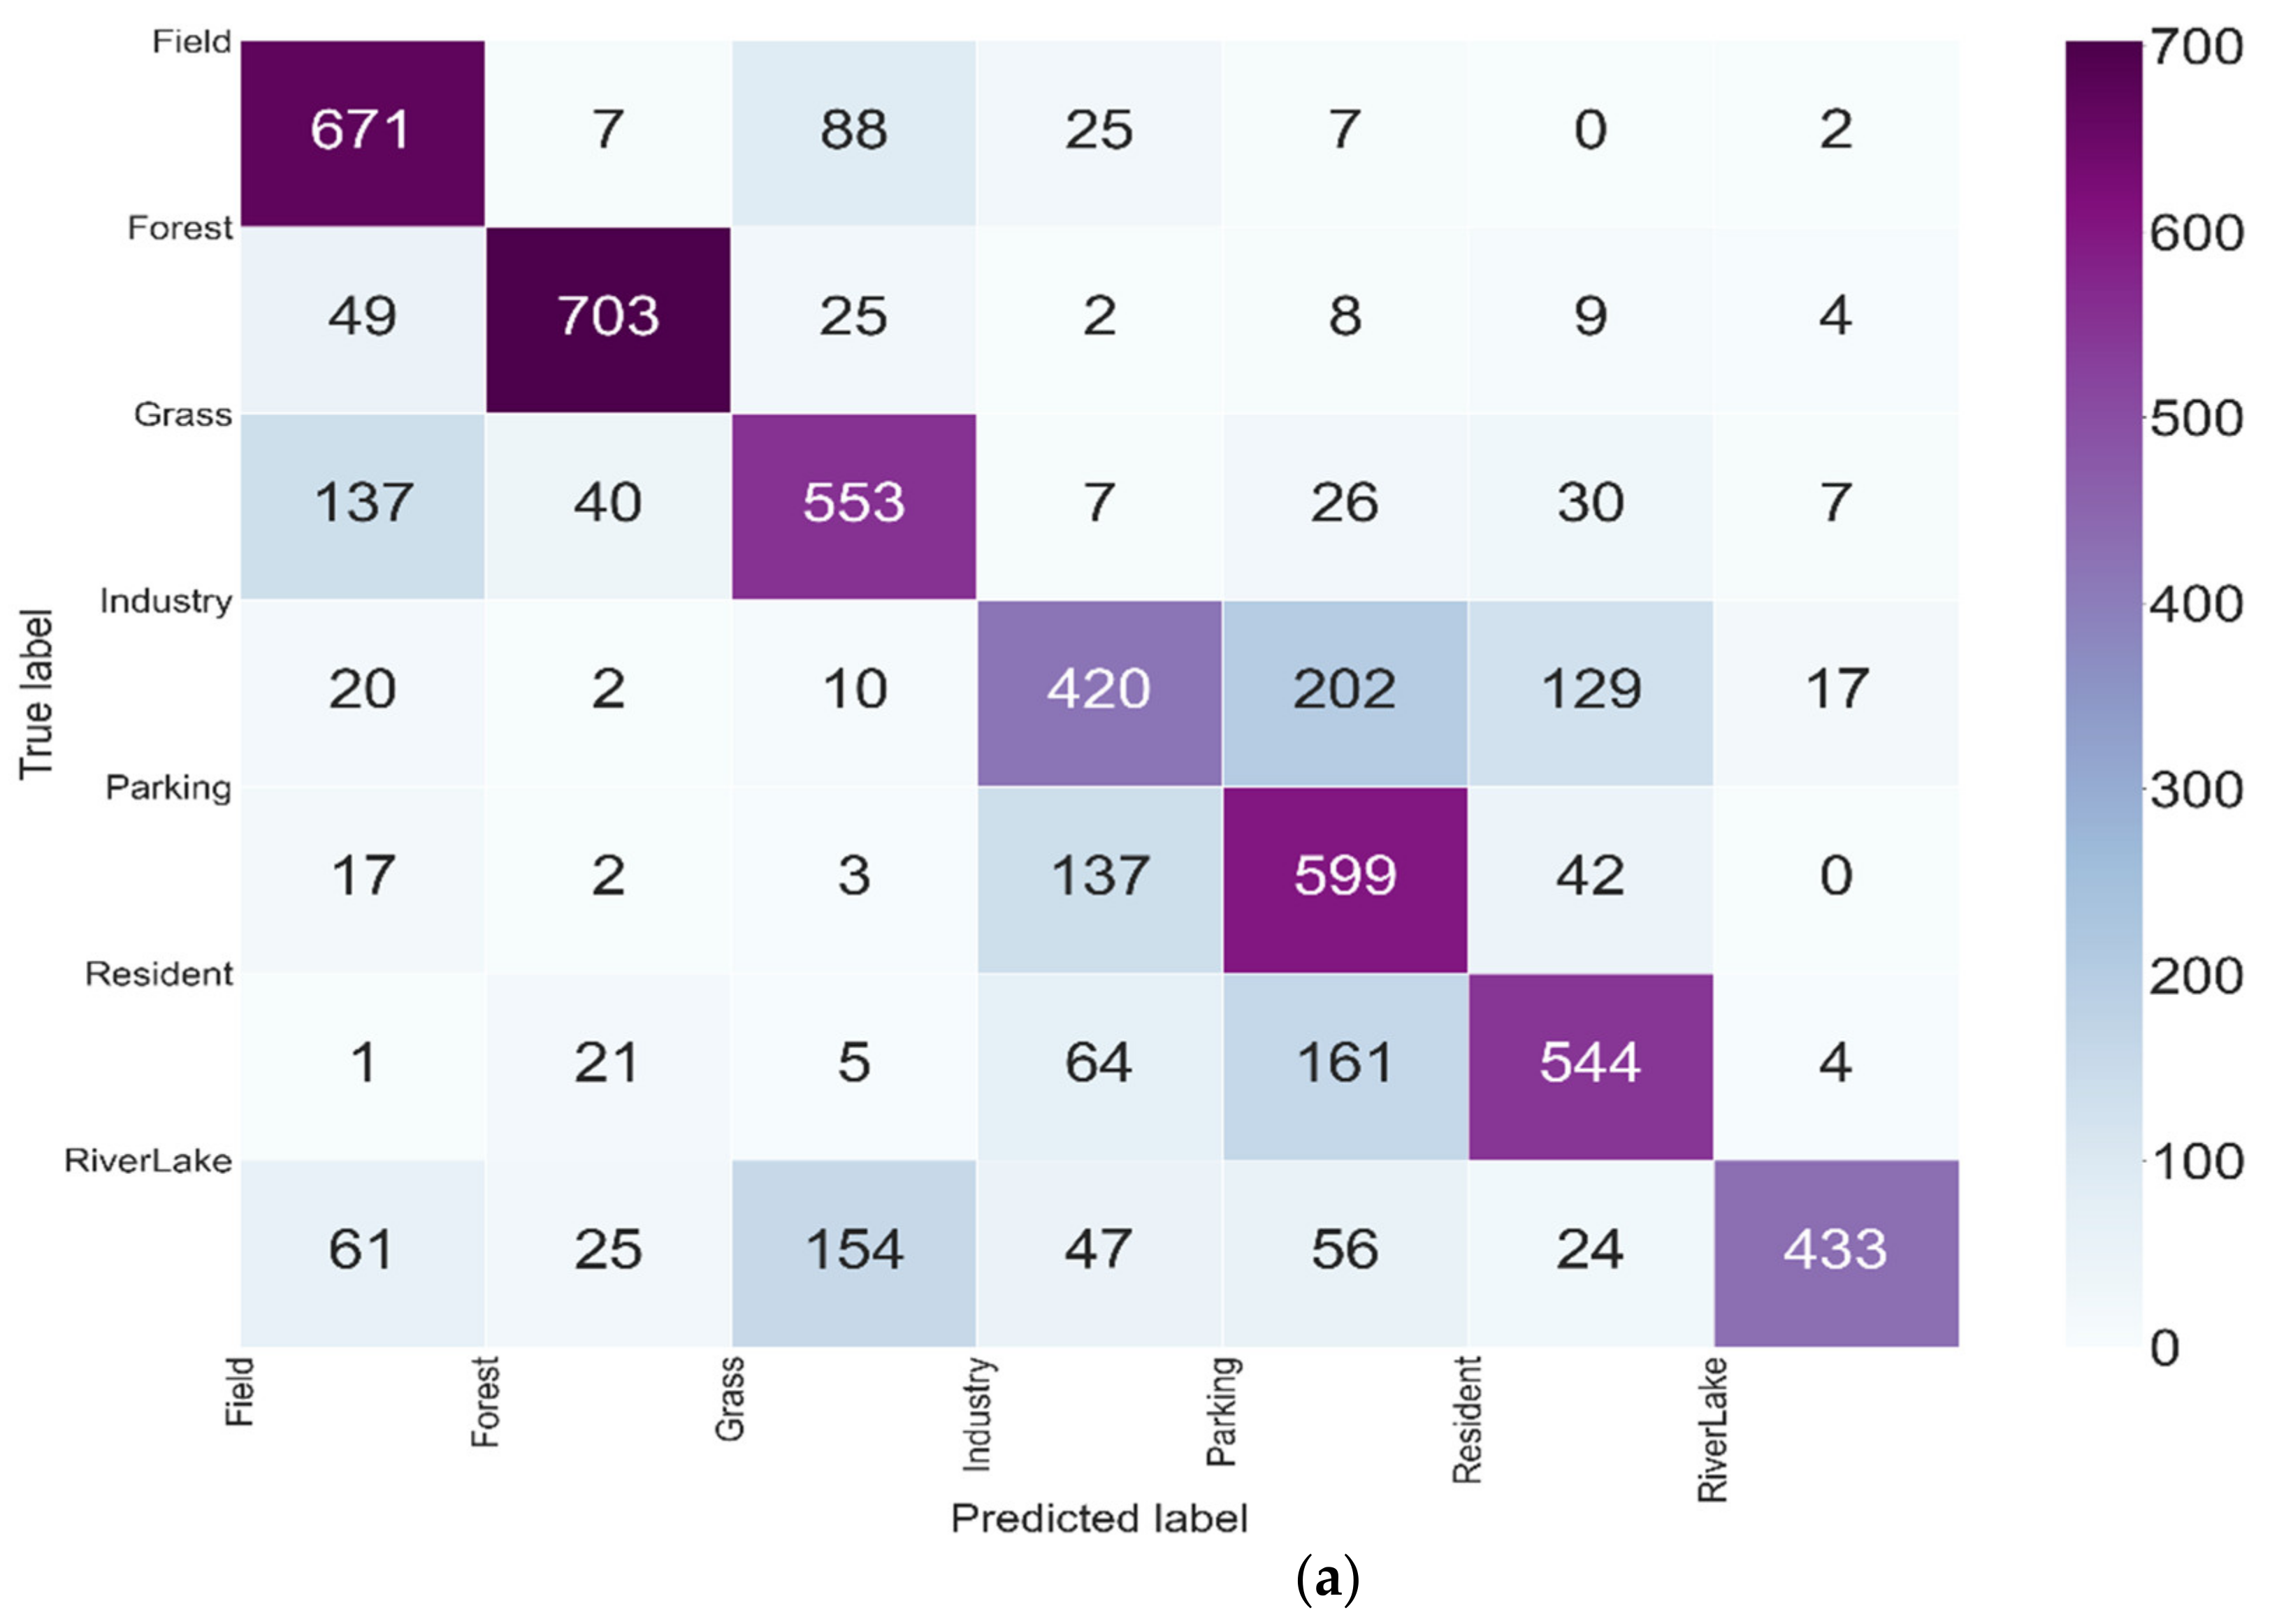
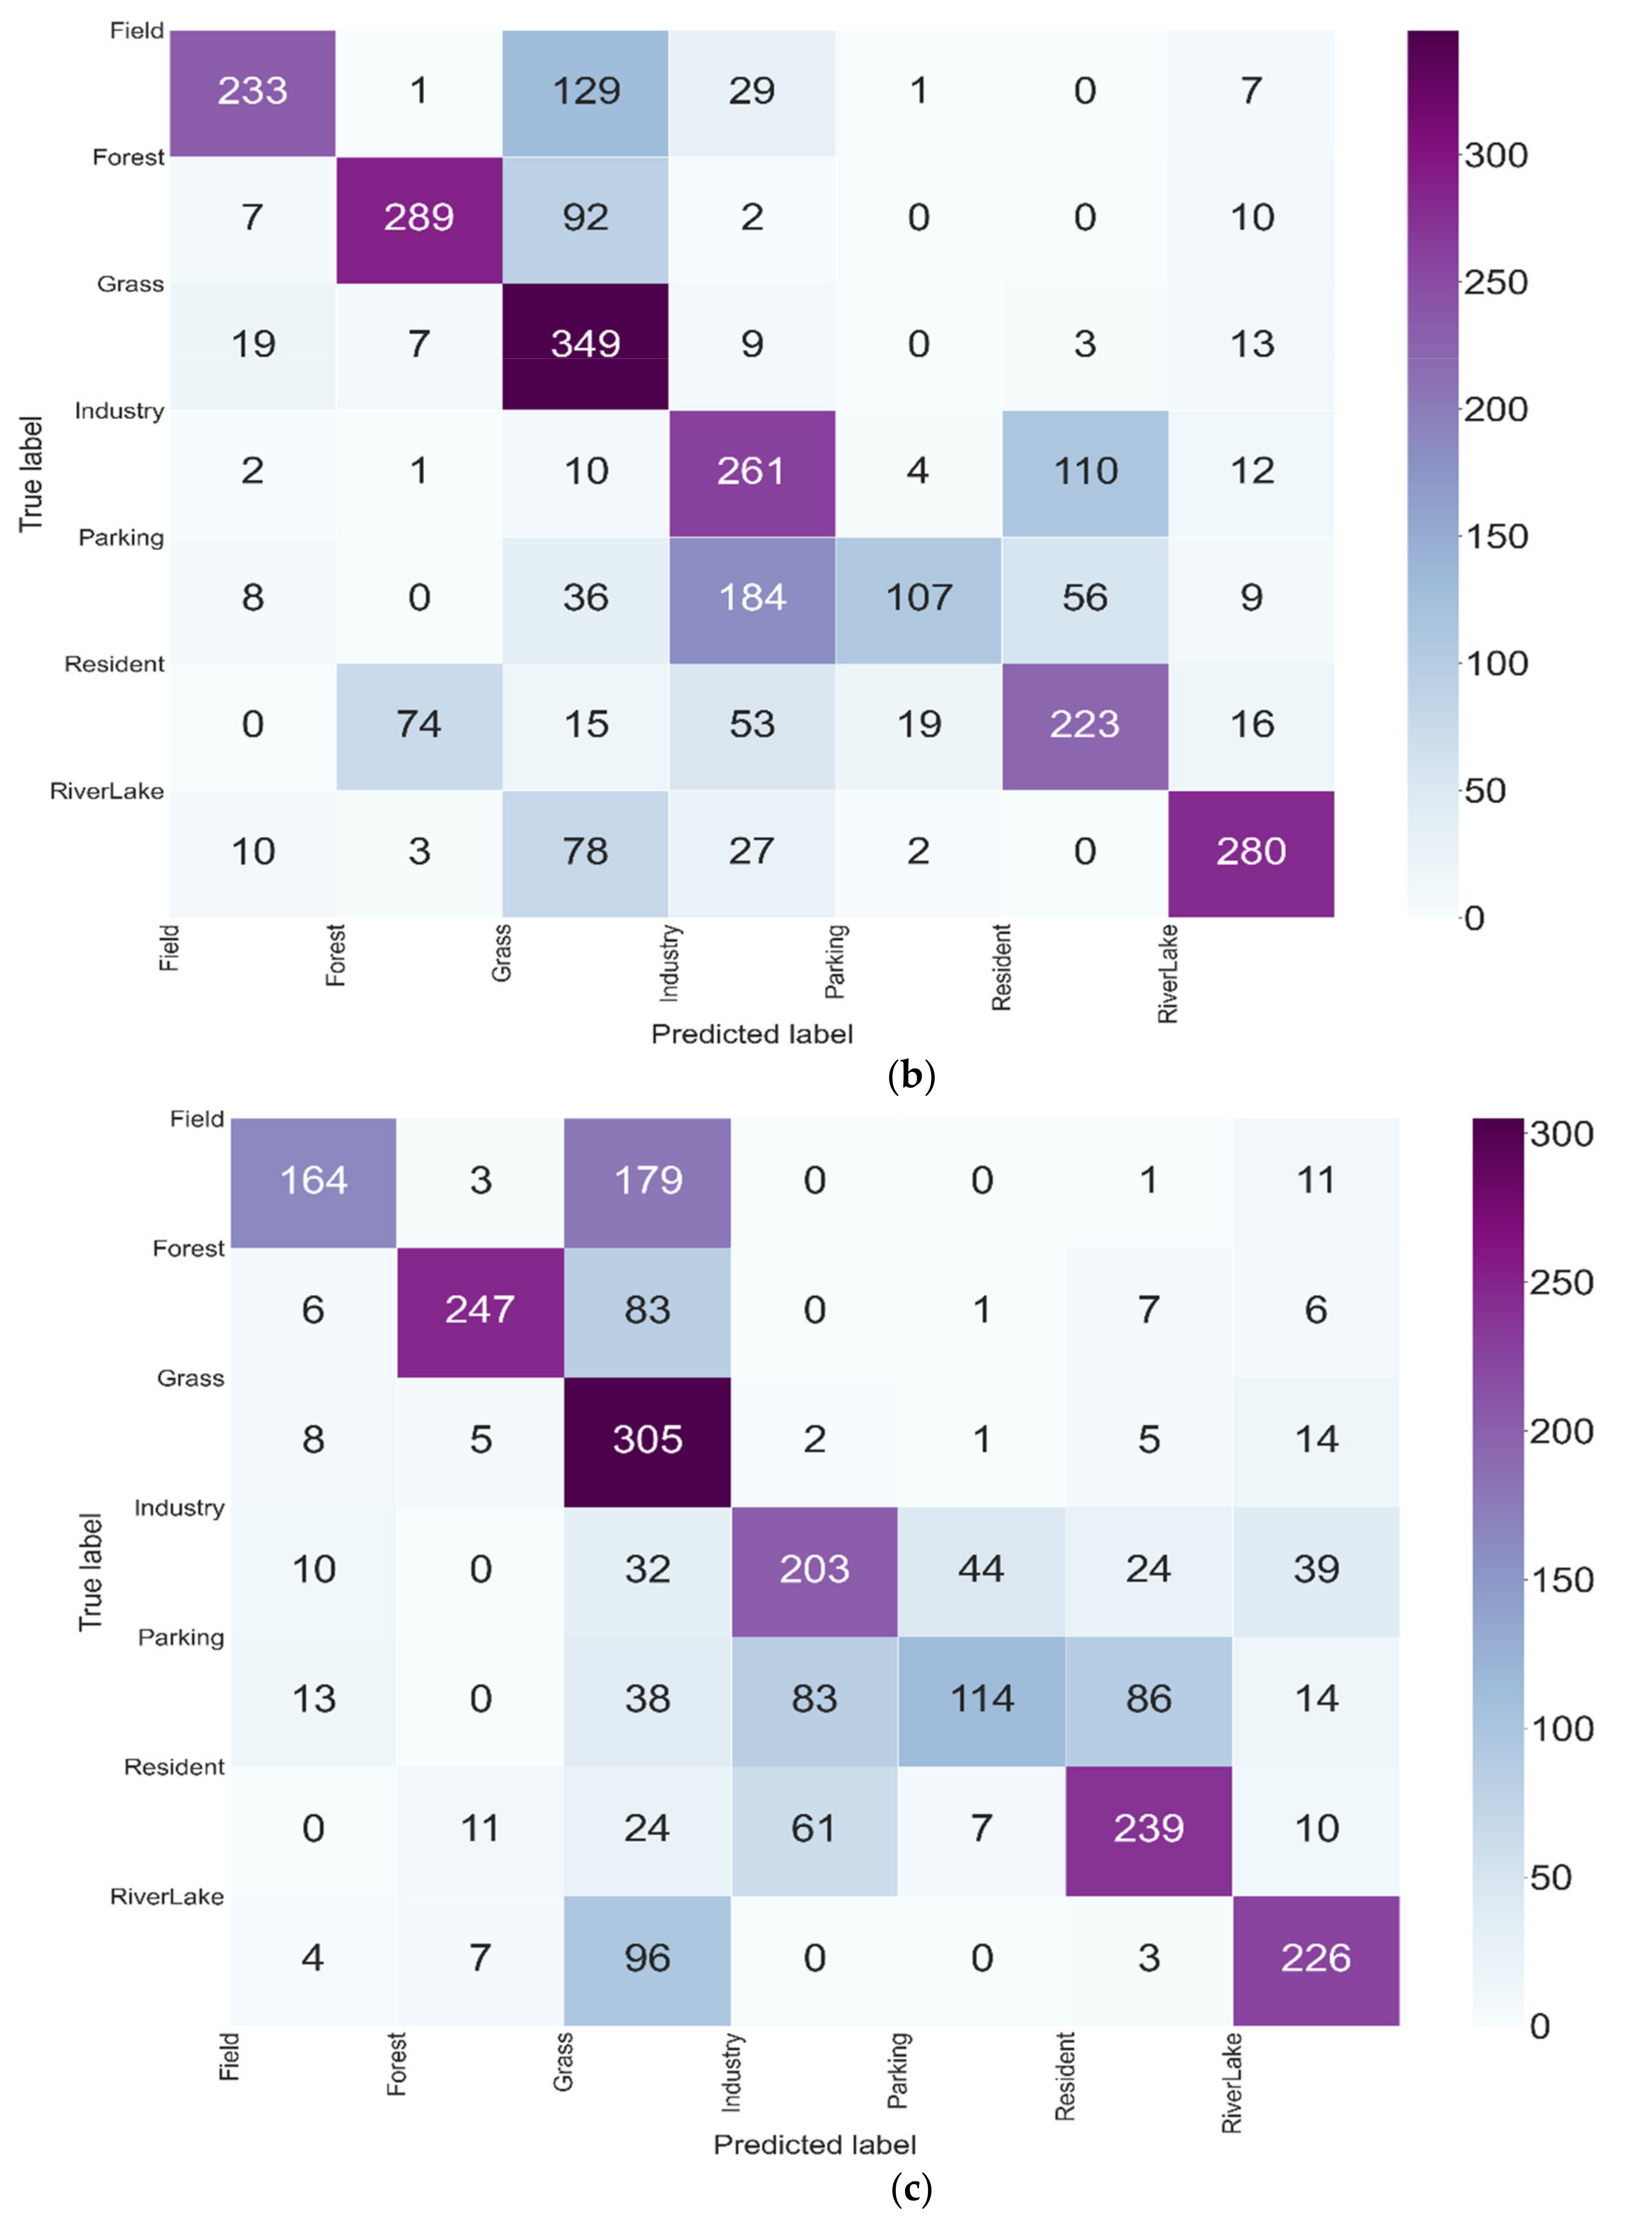
3.4. Evolution of the Classification

In this task, 5% of the images in the RSSCN7 Dataset (the number of total training samples is 140 and each class is 20) and the UC Merced Land-Use Dataset (the number of total training samples is 57 and each class is 3) were randomly selected as training datasets for the improved SinGAN to generate a sufficient number of pseudosamples. The ratio of training samples to test samples was fixed at 1:19 for all experiments, and training data was not used for test. These pseudosamples were used to form a new training dataset for the classifier network for learning. Three datasets were used for training: Fake samples, Fixed samples, and Random Samples. Fixed samples were randomly selected from the RSSCN7 Dataset or UC Merced Land-Use Dataset based on the training–testing ratio. Fake samples were generated by the improved SinGAN using these Fixed samples. Random samples were dynamically composed by the preprocessing part of the classification network, without the participation of the improved SinGAN. They were used to demonstrate that generating pseudosamples via the improved SinGAN is beneficial for the classification accuracy. Here, VGG16 [42], VGG19 [42], DenseNet121 [43], and MobileNet [44] were chosen as classifier networks. A pretraining approach was adopted to obtain a better initial parameter and reduce the training time. Then, the pseudosample training dataset generated by the improved SinGAN, the dataset used for the improved SinGAN, and the training set randomly selected by the classifier network were loaded. All images were resampled to a size of 128 × 128 and normalized. The specific classification accuracy is shown in Table 2 and Table 3.
In the UC Merced Land-Use Dataset, the pseudosample training dataset generated by the improved SinGAN on VGG16 and VGG19 increases the overall accuracy of the network by 5% and 10% to 20% compared with the other two training sets. With the advancement of the kappa coefficient, a 5% increase was observed on VGG16 and VGG19. The overall accuracy improvement is 9% on the DenseNet121 network and 13% on the MobileNet network. The kappa coefficient boost is 10% on the DenseNet121 network and 14% on the MobileNet network. The receiver operating characteristic curves (ROC) and area under the curve (AUC) for each dataset based on VGG16 are shown in Figure 12. The AUC values are 95.1%, 92.4%, and 79.0% for each dataset. Moreover, quantitative comparisons in terms of the confusion matrix are also provided in Figure 13.
In the RSSCN7 Dataset, the same test was done. The pseudosample training dataset generated by the improved SinGAN on VGG16 and VGG19 increases the overall accuracy of the network by 6% to 7% and 7% to 9% compared with the other two training sets. With the advancement of the kappa coefficient, a 9% increase was observed on VGG16 and VGG19. The overall accuracy improvement is 4% on the DenseNet121 network and 8% on the MobileNet network. The kappa coefficient boost is 4% on the DenseNet121 network and 9% on the MobileNet network. The ROC and AUC and the confusion matrix are shown in Figure 14 and Figure 15, respectively. The AUC values are 94.3%, 92.1%, and 89.8% for each dataset. Our work is mainly to expand samples of the training dataset to increase the diversity of samples, to increase the noise into samples to reduce “overfitting” during the learning process, and to improve SinGAN to better extract the important features of remote sensing images and present them through pseudosamples. However, the accuracy of the network varies due to the difference of learning ability of the five classification networks, the resistance to noise interference, and the strength of its feature extraction ability. The improved SinGAN can effectively extract features from a single remote sensing image and generate valid pseudosamples for classification in a few sample cases.
Given that the merit of a neural network is inextricably related to the setting of parameters, the following three experiments (all using the VGG16 classification network and UC Merced Land-Use Dataset as the standard) were set up in this work to further verify the reasons affecting classification accuracy. In the first experiment, the size of the input image is considered the key factor. The output size set inside the improved SinGAN is 250 × 250, and the original remote sensing image size is 600 × 600; accordingly, it is bound to lose some information and certain generalization when executing preprocessing resampling to fixed values. Therefore, we compressed the image sizes to 32 × 32, 64 × 64, and 224 × 224. The specific classification accuracy is shown in Table 4. The features of the pseudosamples generated by the improved SinGAN are more easily extracted than those of the original SinGAN network. The feature loss is less compared with the direct compression of the original remote sensing image. Therefore, the features can be effectually concentrated by the improved SinGAN and expediently understood by the classifier network.
Whether the improved SinGAN can be adapted for different classification categories is discussed in the second experiment. The fewer categories there are, the easier the features can be distinguished and the higher the classification accuracy is. Table 5 illustrates that the classification accuracy of the pseudosample data generated by the improved SinGAN improves by 4–6% compared with the other two methods of training data. The overall operation is higher than the other two, which indicates that the pseudosamples extracted by the improved SinGAN are more stable when passing through the classification network. Although the network cannot characterize the diversity, it can preferably characterize the important features of each sample in their entirety.
In the third experiment, the multiple of sample expansion was adjusted to see if it affects the final classification results. The classification accuracies are shown in Table 6. The accuracy is only improved by approximately 1.5% compared with the original remote sensing image when only a single sample is generated. The main reason is that the information of the original remote sensing image is first extracted by using the improved SinGAN, which helps the classification network to understand the image better. The difference in classification accuracy remains within 0.5% when the sample size is expanded by 3, 5, 10, and 30 times, which is mainly due to the addition of noise to prevent overfitting the classification network and to simplify the process of feature extraction for classification network learning. When the sample size is expanded to 50 times, it significantly decreases, which is mainly due to the excessive noise that interferes with the learning of the classification network.

4. Discussion

A comparison experiment was set up to visually demonstrate the sample generation capability of the improved SinGAN. The remote sensing scene images of the Bridge, the Park, the RailwayStation, and the Mountain were selected. The features of these images were extracted using the VGG16 network with the same depth and parameters. The fake samples generated by the improved SinGAN and by the original SinGAN through the learning of these remote sensing images were incorporated into the identical network for feature extraction. All results are visually presented. Figure 16 shows the attention maps generated by the extraction of the original images and their fake samples. The brighter regions indicate the greater attention weights in the classification network. Figure 12 shows that the feature regions extracted from the pseudosamples generated by the improved SinGAN are close to those directly using the original remote sensing scene images. Although the focus regions (red) will be a little different, the effect is significantly improved compared with the results of the original SinGAN. In the scenes of the Bridge and RailwayStation, the improved SinGAN can focus well on the main objects. The inclusion of the attention mechanism in the SinGAN network effectively restores the key information compared with the attention maps obtained from the original SinGAN. In the Park scene, the area of attention on the original image is the pool in the middle, while the improved SinGAN pays attention to the two sides of the pool. In the Mountain scene, the network noticed many key attention areas. This notion indicates that the random noise during the pseudosample generation has a nonnegligible influence on the final feature extraction, which is to be explored in subsequent research.
The traditional methods of sample augmentation include rotation and mirroring. The augmentation of the GAN method is also a continuation of adding noise. An experiment is set up for comparison to clearly represent the similarities and differences between the improved SinGAN samples and the traditional augmentation methods. The same VGG16 network is used to extract features from the samples of the bridge under rotation, mirroring, etc. The results are compared with those of the pseudosamples generated by the improved SinGAN. In Figure 17, the features that can be read from the samples by the improved SinGAN cover the whole bridge subject. The added samples by rotation and mirroring can also increase the network’s ability to extract and recognize the scene subject to a certain extent. A classification experiment is also added to compare whether the accuracy of classification would be increased after adding the sample augmentation method in the preprocessing. The results are shown in Table 7. The sample augmentation can effectively improve the accuracy by 3% and the kappa coefficient by 4% with 3% of the training samples. The classification accuracy can be further improved by improving the combination of SinGAN’s pseudosample and sample augmentation methods. The improved SinGAN can cognitively generate more realistic pseudosamples well in the field of remote sensing, which is essential for many applications in the field of remote sensing. However, this mechanism is still only equal to or lower than the traditional sample augmentation methods, which is needed for research and breakthrough in the future.

5. Conclusions

Existing neural networks cannot effectively perform large sample expansion with few samples. Generated pseudosamples are largely nonrealistic and infeasibly used as training sets for other applications, such as classification. To address the abovementioned problems, the improved SinGAN model incorporating an attention mechanism is proposed. The goal of this model is mainly to utilize the pyramidal multiscale structure of SinGAN, which targets the fact that remote sensing scene images have a small sample size in real life. Features can be well extracted, and the pseudosamples generated can be performed only in a single remote sensing scene image. The fused attention mechanism is for pseudosamples generated by SinGAN with improved geographic realism instead of mere texture regeneration.
The improved model can generate better pseudosamples of remote sensing scenes with fewer layers compared with the original SinGAN structure. As shown in Figure 7, Figure 8, Figure 9, Figure 10 and Figure 11, we compared the pseudolabeled samples generated by the original SinGAN and the improved SinGAN under the same operation parameter settings. We found that the pseudolabeled samples generated by the original SinGAN have certain geographic discorrelation, such as bridge disruption, lake deformation, and station and railway track misalignment, in human-eye recognition. In addition, we applied the attention map to the pseudolabeled samples generated by the original SinGAN, and the improved SinGAN under the same feature extraction network. According to Figure 16 and Figure 17, it can be seen that the improved SinGAN made the features extracted by the network much closer to those obtained from the original image. All the experiment results denote that the extracted pseudosamples can be gathered as the training set for the classification network to learn and stably produce accurate classification results under different input sizes, numbers of categories, or sample times. This reverse indicates that the pseudosamples generated by the improved SinGAN are highly realistic and can be applied to numerous applications.
However, the improved SinGAN proposed in this work still has much room for improvement. Although the pseudosample can be generated better, great emphasis is placed on the diversity of texture details. Thus, great consideration will be given to color and other features in this structure. SinGAN itself has the possibility of extracting features directly for classification, which will be a focus of our attention in the future.

Author Contributions

Conceptualization, S.G.; methodology, S.G.; software, M.L. and H.F.; validation, H.L.; formal analysis, R.Z.; investigation, S.G.; writing—original draft preparation, S.G.; writing—review and editing, H.L., R.Z., and X.T.; supervision, H.L.; funding acquisition, X.T. All authors have read and agreed to the published version of the manuscript.

Funding

This research was funded by National Major Projects on High-Resolution Earth Observation System, grant number 21-Y20B01-9001-19/22.

Institutional Review Board Statement

Not applicable.

Informed Consent Statement

Not applicable.

Data Availability Statement

Data used in this study is available at request.

Acknowledgments

The authors are grateful to the anonymous reviewers for their constructive and crucial comments that helped improve the manuscript. The authors also thank supervisors and classmates for their help and support during the research.

Conflicts of Interest

The authors declare no conflict of interest.

References

  1. Hu, F.; Xia, G.-S.; Hu, J.; Zhang, L. Transferring Deep Convolutional Neural Networks for the Scene Classification of High-Resolution Remote Sensing Imagery. Remote Sens. 2015, 7, 14680–14707. [Google Scholar] [CrossRef] [Green Version]
  2. Cheng, G.; Li, Z.; Han, J.; Yao, X.; Guo, L. Exploring Hierarchical Convolutional Features for Hyperspectral Image Classification. IEEE Trans. Geosci. Remote Sens. 2018, 56, 6712–6722. [Google Scholar] [CrossRef]
  3. Zhao, Y.; Yuan, Y.; Wang, Q. Fast Spectral Clustering for Unsupervised Hyperspectral Image Classification. Remote Sens. 2019, 11, 399. [Google Scholar] [CrossRef] [Green Version]
  4. Yuan, Q.; Shen, H.; Li, T.; Li, Z.; Li, S.; Jiang, Y.; Xu, H.; Tan, W.; Yang, Q.; Wang, J.; et al. Deep learning in environmental remote sensing: Achievements and challenges. Remote Sens. Environ. 2020, 241, 111716. [Google Scholar] [CrossRef]
  5. Ma, L.; Liu, Y.; Zhang, X.; Ye, Y.; Yin, G.; Johnson, B.A. Deep learning in remote sensing applications: A meta-analysis and review. ISPRS J. Photogramm. Remote Sens. 2019, 152, 166–177. [Google Scholar] [CrossRef]
  6. Liu, T.; Fang, S.; Zhao, Y.; Wang, P.; Zhang, J. Implementation of training convolutional neural networks. arXiv 2015, arXiv:1506.01195. [Google Scholar]
  7. Wu, P.; Cui, Z.; Gan, Z.; Liu, F. Residual group channel and space attention network for hyperspectral image classification. Remote Sens. 2020, 12, 2035. [Google Scholar] [CrossRef]
  8. Haq, Q.S.U.; Tao, L.; Sun, F.; Yang, S. A Fast and Robust Sparse Approach for Hyperspectral Data Classification Using a Few Labeled Samples. IEEE Trans. Geosci. Remote Sens. 2011, 50, 2287–2302. [Google Scholar] [CrossRef]
  9. Hong, D.; Gao, L.; Yokoya, N.; Yao, J.; Chanussot, J.; Du, Q.; Zhang, B. More Diverse Means Better: Multimodal Deep Learning Meets Remote-Sensing Imagery Classification. IEEE Trans. Geosci. Remote Sens. 2020, 59, 1–15. [Google Scholar] [CrossRef]
  10. Sung, F.; Yang, Y.; Zhang, L.; Xiang, T.; Torr, P.H.; Hospedales, T.M. Learning to compare: Relation network for few-shot learning. In Proceedings of the 2018 IEEE/CVF Conference on Computer Vision and Pattern Recognition, Salt Lake City, UT, USA, 18–23 June 2018; pp. 1199–1208. [Google Scholar]
  11. Li, X.; Sun, Q.; Liu, Y.; Zhou, Q.; Zheng, S.; Chua, T.-S.; Schiele, B. Learning to self-train for semi-supervised few-shot classification. Adv. Neural Inf. Proc. Syst. 2019, 32, 10276–10286. [Google Scholar]
  12. De Lima, R.P.; Marfurt, K. Convolutional Neural Network for Remote-Sensing Scene Classification: Transfer Learning Analysis. Remote Sens. 2019, 12, 86. [Google Scholar] [CrossRef] [Green Version]
  13. Xu, B. Improved convolutional neural network in remote sensing image classification. Neural Comput. Appl. 2020, 1–12. [Google Scholar] [CrossRef]
  14. Duan, Y.; Tao, X.; Xu, M.; Han, C.; Lu, J. GAN-NL: Unsupervised representation learning for remote sensing image classification. In Proceedings of the 2018 IEEE Global Conference on Signal and Information Processing (GlobalSIP), Anaheim, CA, USA, 26–29 November 2018; pp. 375–379. [Google Scholar]
  15. Li, E.; Xia, J.; Du, P.; Lin, C.; Samat, A. Integrating Multilayer Features of Convolutional Neural Networks for Remote Sensing Scene Classification. IEEE Trans. Geosci. Remote Sens. 2017, 55, 5653–5665. [Google Scholar] [CrossRef]
  16. Cheng, G.; Yang, C.; Yao, X.; Guo, L.; Han, J. When Deep Learning Meets Metric Learning: Remote Sensing Image Scene Classification via Learning Discriminative CNNs. IEEE Trans. Geosci. Remote Sens. 2018, 56, 2811–2821. [Google Scholar] [CrossRef]
  17. Goodfellow, I.; Pouget-Abadie, J.; Mirza, M.; Xu, B.; Warde-Farley, D.; Ozair, S.; Courville, A.; Bengio, Y. Generative adversarial nets. Adv. Neural Inform. Proc. Syst. 2014, 27, 2672–2680. [Google Scholar]
  18. Xu, S.; Mu, X.; Chai, D.; Zhang, X. Remote sensing image scene classification based on generative adversarial networks. Remote Sens. Lett. 2018, 9, 617–626. [Google Scholar] [CrossRef]
  19. Zhang, S.; Wu, G.; Gu, J.; Han, J. Pruning Convolutional Neural Networks with an Attention Mechanism for Remote Sensing Image Classification. Electronics 2020, 9, 1209. [Google Scholar] [CrossRef]
  20. Xiao, C.; Li, B.; Zhu, J.-Y.; He, W.; Liu, M.; Song, D. Generating Adversarial Examples with Adversarial Networks. arXiv 2018, arXiv:1801.02610. [Google Scholar]
  21. Mirza, M.; Osindero, S. Conditional generative adversarial nets. arXiv 2014, arXiv:1411.1784. [Google Scholar]
  22. Radford, A.; Metz, L.; Chintala, S. Unsupervised representation learning with deep convolutional generative adversarial networks. arXiv 2015, arXiv:1511.06434. [Google Scholar]
  23. Arjovsky, M.; Chintala, S.; Bottou, L. Banach wasserstein gan. arXiv 2018, arXiv:1806.06621. [Google Scholar]
  24. Pan, X.; Zhao, J.; Xu, J. A Scene Images Diversity Improvement Generative Adversarial Network for Remote Sensing Image Scene Classification. IEEE Geosci. Remote Sens. Lett. 2020, 17, 1692–1696. [Google Scholar] [CrossRef]
  25. Zhan, Y.; Hu, D.; Wang, Y.; Yu, X. Semisupervised Hyperspectral Image Classification Based on Generative Adversarial Networks. IEEE Geosci. Remote Sens. Lett. 2017, 15, 212–216. [Google Scholar] [CrossRef]
  26. Lin, D.; Fu, K.; Wang, Y.; Xu, G.; Sun, X. MARTA GANs: Unsupervised Representation Learning for Remote Sensing Image Classification. IEEE Geosci. Remote Sens. Lett. 2017, 14, 2092–2096. [Google Scholar] [CrossRef] [Green Version]
  27. Deng, Z.; Sun, H.; Zhou, S.; Zhao, J.; Lei, L.; Zou, H. Multi-scale object detection in remote sensing imagery with convolutional neural networks. ISPRS J. Photogramm. Remote Sens. 2018, 145, 3–22. [Google Scholar] [CrossRef]
  28. Shaham, T.R.; Dekel, T.; Michaeli, T. SinGAN: Learning a generative model from a single natural image. In Proceedings of the 2019 IEEE/CVF International Conference on Computer Vision (ICCV), Seoul, Korea, 27 October–2 November 2019; pp. 4569–4579. [Google Scholar]
  29. Hinz, T.; Fisher, M.; Wang, O.; Wermter, S. Improved techniques for training single-image gans. arXiv 2020, arXiv:2003.11512. [Google Scholar]
  30. Xiong, W.; Xiong, Z.; Cui, Y.; Lv, Y. Deep multi-feature fusion network for remote sensing images. Remote Sens. Lett. 2020, 11, 563–571. [Google Scholar] [CrossRef]
  31. Ma, C.; Mu, X.; Sha, D. Multi-Layers Feature Fusion of Convolutional Neural Network for Scene Classification of Remote Sensing. IEEE Access 2019, 7, 121685–121694. [Google Scholar] [CrossRef]
  32. Xue, W.; Dai, X.; Liu, L. Remote Sensing Scene Classification Based on Multi-Structure Deep Features Fusion. IEEE Access 2020, 8, 28746–28755. [Google Scholar] [CrossRef]
  33. Sun, W.; Liu, B.-D. ESinGAN: Enhanced single-image GAN using pixel attention mechanism for image super-resolution. In Proceedings of the 2020 15th IEEE International Conference on Signal Processing (ICSP), Beijing, China, 6–9 December 2020; Volume 1, pp. 181–186. [Google Scholar]
  34. Ma, W.; Zhao, J.; Zhu, H.; Shen, J.; Jiao, L.; Wu, Y.; Hou, B. A Spatial-Channel Collaborative Attention Network for Enhancement of Multiresolution Classification. Remote Sens. 2020, 13, 106. [Google Scholar] [CrossRef]
  35. Woo, S.; Park, J.; Lee, J.-Y.; So Kweon, I. Cbam: Convolutional block attention module. In Proceedings of the European Conference on Computer Vision (ECCV), Munich, Germany, 8–14 September 2018; pp. 3–19. [Google Scholar]
  36. Ma, B.; Wang, X.; Zhang, H.; Li, F.; Dan, J. CBAM-GAN: Generative adversarial networks based on convolutional block attention module. In Proceedings of the Lecture Notes in Computer Science; Metzler, J.B., Ed.; Springer: Cham, Switzerland, 2019; pp. 227–236. [Google Scholar]
  37. Zou, Q.; Ni, L.; Zhang, T.; Wang, Q. Deep Learning Based Feature Selection for Remote Sensing Scene Classification. IEEE Geosci. Remote Sens. Lett. 2015, 12, 2321–2325. [Google Scholar] [CrossRef]
  38. Yang, Y.; Newsam, S. Bag-of-visual-words and spatial extensions for land-use classification. In Proceedings of the ACM SIGSPATIAL International Conference on Advances in Geographic Information Systems (ACM GIS), San Jose, CA, USA, 2–5 November 2010; pp. 270–279. [Google Scholar]
  39. Kingma, D.P.; Ba, J. Adam: A method for stochastic optimization. arXiv 2014, arXiv:1412.6980. [Google Scholar]
  40. Ioffe, S.; Szegedy, C. Batch normalization: Accelerating deep network training by reducing internal covariate shift. arXiv 2015, arXiv:1502.03167. [Google Scholar]
  41. Yu, Y.; Li, X.; Liu, F. Attention GANs: Unsupervised Deep Feature Learning for Aerial Scene Classification. IEEE Trans. Geosci. Remote Sens. 2020, 58, 519–531. [Google Scholar] [CrossRef]
  42. Simonyan, K.; Zisserman, A. Very deep convolutional networks for large-scale image recognition. arXiv 2014, arXiv:1409.1556. [Google Scholar]
  43. Huang, G.; Liu, Z.; Van Der Maaten, L.; Weinberger, K.Q. Densely connected convolutional networks. In Proceedings of the 2017 IEEE Conference on Computer Vision and Pattern Recognition (CVPR), Honolulu, HI, USA, 21–26 July 2017; pp. 4700–4708. [Google Scholar]
  44. Howard, A.G.; Zhu, M.; Chen, B.; Kalenichenko, D.; Wang, W.; Weyand, T.; Andreetto, M.; Adam, H. Mobilenets: Efficient convolutional neural networks for mobile vision applications. arXiv 2017, arXiv:1704.04861. [Google Scholar]
Figure 1. Framework structural diagram of Generative Adversarial Networks (GANs).
Remotesensing 13 01713 g001
Figure 2. Framework structural diagram of single natural image Generative Adversarial Networks (SinGAN).
Remotesensing 13 01713 g002
Figure 3. Basic framework structure of the channel attention module.
Remotesensing 13 01713 g003
Figure 4. Basic framework structure of the spatial attention module.
Remotesensing 13 01713 g004
Figure 5. Framework structural diagram of the improved SinGAN.
Remotesensing 13 01713 g005
Figure 6. Framework structure of the Generator of the proposed improved SinGAN.
Remotesensing 13 01713 g006
Figure 7. Effect of training with different stages by the original SinGAN.
Remotesensing 13 01713 g007
Figure 8. Effect of training with different stages by the improved SinGAN.
Remotesensing 13 01713 g008
Figure 9. Random remote sensing image fake samples by the original SinGAN.
Remotesensing 13 01713 g009
Figure 10. Random remote sensing image fake samples by the improved SinGAN.
Remotesensing 13 01713 g010
Figure 11. Comparisons of pseudosamples generated by different methods. (a) Deep Convolutional GAN (DCGAN), (b) Wasserstein GAN (WGAN), (c) Multiple-layer Feature-matching GAN (MARTA GAN), (d) Attention GAN, (f) SinGAN, (e) Improved SinGAN.
Remotesensing 13 01713 g011aRemotesensing 13 01713 g011b
Figure 12. The receiver operating characteristic curves (ROC) and area under the curve (AUC) of the three different datasets in UC Merced Land-Use Dataset. (a) Datasets with fake samples generated by the improved SinGAN, (b) Datasets with true samples used for the training of the improved SinGAN, (c) Datasets with random samples randomly selected by the classifier network.
Remotesensing 13 01713 g012aRemotesensing 13 01713 g012b
Figure 13. Comparisons of confusion matrices on the three different datasets in UC Merced Land-Use Dataset. (a) Datasets with fake samples generated by the improved SinGAN, (b) Datasets with true samples used for the training of the improved SinGAN, (c) Datasets with random samples selected randomly by the classifier network.
Remotesensing 13 01713 g013aRemotesensing 13 01713 g013b
Figure 14. ROC and AUC of the three different datasets in RSSCN7 Dataset. (a) Datasets with fake samples generated by the improved SinGAN, (b) Datasets with true samples used for the training of the improved SinGAN, (c) Datasets with random samples selected randomly by the classifier network.
Remotesensing 13 01713 g014aRemotesensing 13 01713 g014b
Figure 15. Comparisons of confusion matrices on the three different datasets in RSSCN7 Dataset. (a) Datasets with fake samples generated by the improved SinGAN, (b) Datasets with true samples used for the training of the improved SinGAN, (c) Datasets with random samples selected randomly by the classifier network.
Remotesensing 13 01713 g015aRemotesensing 13 01713 g015b
Figure 16. Original remote sensing images and the attention maps derived from the VGG16 network. (a) Original remote sensing images. (b) Visualization results of the original images. (c) Visualization results of the fake samples by the original SinGAN. (d) Visualization results of the fake samples by the improved SinGAN.
Remotesensing 13 01713 g016aRemotesensing 13 01713 g016b
Figure 17. Attention maps derived from the VGG16 network by different methods. (a) Original remote sensing images. (b) Visualization results of the original images. (c) Visualization results of the fake samples by rotation. (d) Visualization results of the fake samples by flip. (e) Visualization results of the fake samples by the improved SinGAN.
Remotesensing 13 01713 g017aRemotesensing 13 01713 g017b
Table 1. Computaion time of different methods.
MethodTime (ms)
DCGAN1,925,730
WGAN2,463,846
MARTA GAN16,245,770
Attention GAN15,123,386
SinGAN14,966,700
Improved SinGAN13,686,128
Deep Convolutional GAN (DCGAN), Wasserstein GAN (WGAN), Multiple-layer Feature-matching GAN (MARTA GAN).
Table 2. Classification results of the different methods by three training datasets in UC Merced Land-Use Dataset.
DatasetVGG16VGG19DenseNet121MobileNet
Fake SamplesOA (%)60.7057.0862.3166.21
Kappa (%)58.5554.7160.2164.33
True SamplesOA (%)55.7252.5853.0353.31
Kappa (%)53.3049.9350.3950.73
Random SamplesOA (%)41.7537.3638.2240.44
Kappa (%)38.6133.9734.7737.12
Fake samples (generated by the improved SinGAN), True samples (used for the training of the improved SinGAN),Random samples(selected randomly by the classifier network).
Table 3. Classification results of the different method by three training datasets in RSSCN7 Dataset.
DatasetVGG16VGG19DenseNet121MobileNet
Fake SamplesOA (%)64.1759.3166.2172.12
Kappa (%)58.1952.5360.5767.47
True SamplesOA (%)58.9354.3762.4464.64
Kappa (%)52.0851.8056.1958.74
Random
Samples
OA (%)57.4050.3759.7060.19
Kappa (%)55.0246.8153.0053.57
Fake samples (generated by the improved SinGAN), True samples (used for the training of the improved SinGAN), Random samples(selected randomly by the classifier network).
Table 4. Classification results of the different input sizes.
Input Size32 × 3264 × 64128 × 128224 × 224
OA (%)44.6855.6060.7062.19
Kappa (%)41.5653.1458.5560.12
Table 5. Classification results under different numbers of categories.
DatasetCategories5 Classes10 Classes19 Classes
Fake SamplesOA (%)81.8363.3260.70
Kappa (%)77.2859.3458.55
True SamplesOA (%)77.6457.3955.72
Kappa (%)72.0852.7853.30
Random SamplesOA (%)63.1251.0441.75
Kappa (%)54.0745.5938.61
Table 6. Classification results of the different sample multiple.
Sample MultipleOrigin×1×3×5×10×30×50
OA (%)55.7257.2561.2761.4161.5361.7560.70
Kappa (%)53.3054.9259.2059.3159.0159.6658.55
Table 7. Classification results of different augmentation methods.
MethodFake SamplesTAMFake Samples + TAM
OA (%)60.7063.5765.77
Kappa (%)58.5562.7463.89
Fake samples (generated by the improved SinGAN) and TAM (traditional augmentation methods).
Publisher’s Note: MDPI stays neutral with regard to jurisdictional claims in published maps and institutional affiliations.

