Abstract
Optical remote sensing indices play an important role in vegetation information extraction and have been widely serving ecology, agriculture and forestry, urban monitoring, and other communities. Remote sensing indices are constructed from individual bands depending on special characteristics to enhance the typical spectral features for the identification or distinction of surface land covers. With the development of quantitative remote sensing, there is a rapid increasing requirement for accurate data processing and modeling. It is well known that the geometry-induced variation observed in surface reflectance is not ignorable, but the situation of uncertainty thereby introduced into these indices still needs further detailed understanding. We adopted the ground multi-angle hyperspectrum, spectral response function (SRF) of Thematic Mapper (TM), Enhanced Thematic Mapper (ETM+), Operational Land Imager (OLI), Moderate-Resolution Imaging Spectroradiometer (MODIS), and Multi-Spectral Instrument (MSI) optical sensors and simulated their sensor-like spectral reflectance; then, we investigated the potential angle effect uncertainty on optical indices that have been frequently involved in vegetation monitoring and examined the forward/backward effect over both the ground-based level and the actual Landsat TM/ETM+ overlapped region. Our results on the discussed indices and sensors show as following: (1) Identifiable angle effects exist with a more elevated influence than that introduced by band difference among sensors; (2) The absolute difference between forward and backward direction can reach up to −0.03 to 0.1 within bands of the TM/ETM+ overlapped region; (3) The investigation at ground level indicates that there are different variations of angle effect transmitted to each remote sensing index. Regarding cases of crop canopy at various growth phases, most of the discussed indices have more than a 20% relative difference to nadir value except Normalized Difference Vegetation Index (NDVI) and Normalized Difference Water Index (NDWI) with the magnitude lower than 10%, and less than 16% of Normalized Burn Ratio (NBR). For the case of wax maturity stage, the relative difference to nadir value of Enhanced Vegetation Index (EVI), Soil-Adjusted Vegetation Index (SAVI), Ratio Vegetation Index (RVI), Char Soil Index (CSI), NBR, Normalized Difference Moisture Index (NDMI), and SWIR2/NIR exceeded 50%, while the values for NBR and NDMI can reach up to 115.8% and 206.7%, respectively; (4) Various schemes of index construction imply different propagation of angle effect uncertainty. The “difference” indices can partially suppress the directional influence, while the “ratio” indices show high potential to amplify the angle effect. This study reveals that the angle-induced uncertainty of these indices is greater than that induced by the spectrum mismatch among sensors, especially under the case of senescence. In addition, based on this work, indices with a suppressed potential of angle effect are recommended for vegetation monitoring or information retrieval to avoid unexpected effects.
1. Introduction
Optical remote sensing indices play an important role in the information extraction and dynamic monitoring processes of land surface vegetation and have been widely utilized by ecology, agriculture and forestry, urban monitoring, and other communities. The visible and near-infrared (NIR) bands contained in optical remote sensing are frequently used for distinguishing the vegetation features of land covers. Hyperspectrum with nanometer spectral resolution has the potential to capture the distinct absorption and reflection characteristics over rocks [1], minerals, and impervious surfaces [2], and as well the weak fluorescence effect of vegetation [3], and the eutrophication components existing in water bodies [4].It contributes significantly to improving our understanding of ground spectral features, albeit with a high cost of money and labor, while satellite-based remote sensing has an innate advantage serving for regional surface monitoring due to its high performance/price ratio, objectivity, timeliness, regular revisits, and spatial extended observation. With the maturation of technology, the increasing of on-orbit sensors, and the accumulation of data, optical multi-band satellite remote sensing using the sun as the light source has been widely used in the geoscience community. Since the variation of spectra usually reduces the separability of spectral characteristics among surface clusters, some indices denoting special features of land covers have been constructed to enhance the unique characteristics by amplifying the difference among classes and restricting the variance within classes. During 1960s and 1970s, hyperspectral studies on the components of healthy vegetation greatly improved people’s understanding of the reflectance characteristics of pigments and mesophyll tissue and the structure of green vegetation at visible and near-infrared regimes. The pioneer studies have contributed efforts to construct indices via ratios or spectral band differences, such as the Ratio Vegetation Index (RVI) [5], Difference Vegetation Index (DVI) [6], and Normalized Difference Vegetation Index (NDVI) [7] to highlight green vegetation signals. With the improved understanding of land covers’ spectra, factors related with soil, atmosphere, vegetation status, and other background or environmental conditions were gradually involved in the later construction of indices, to reinforce the identification ability and, thus, promoted a series of advanced indices such as the Soil-Adjusted Vegetation Index (SAVI) [8], Perpendicular Vegetation Index (PVI) [9], Greenness Vegetation Index (GVI), Enhanced Vegetation Index (EVI) [10], Normalized Difference Moisture Index (NDMI) [11], and Normalized Difference Water Index (NDWI) [12] for vegetation retrieval. In addition, the Char Soil Index (CSI) [13], Mid-IR Bispectral Index (MIRBI) [14], Normalized Burn Ratio (NBR) [15], SWIR1/NIR [16], SWIR2/NIR [17] and SWIR2/SWIR1 [18] were constructed to capture special events like surface fire traces and vegetation burning rate that are occasionally encountered in the monitoring of forest, farmland, and ecological environments.
A remote sensing index is a model that combines individual bands with different constructed schemes to enhance typical signatures and achieve the purpose to distinguish different land covers. Pigments existing in the leaf epidermis, mesophyll tissue, mesophyll cells, leaf water content, and also the structure of endmembers fallen in the view of footprints can determine the spectral signal of individual leaves or a vegetation canopy [19]. For instance, the content of chlorophyll, lutein, and anthocyanin is highly related with the absorption valley in the blue and red bands, the reflection peak in the green band, and the strong reflection platform in the near-infrared band, while the absorption valley in the shortwave infrared band provides a chance to capture the variation of water content in vegetation. Special schemes are built up from a priori knowledge by subtraction, division, or combined operations among individual spectral bands. Difference indices include direct difference, weighted difference, or normalized difference of two or more bands depending on peaks and valleys in the spectral reflectance to strengthen the absorption or reflection features for certain land cover types. DVI, defined by the difference between the near-infrared and red bands, shows its sensitivities in distinguishing vegetation and soil under scenarios with various vegetation cover fractions, while MIRBI uses the absorption characteristics of water at the shortwave infrared band to get the weighted difference. Furthermore, in order to perform a quantitative cross-comparison and let the value of a constructed factor fall in an expected interval, a common approach is to normalize the difference, such as the normalization of two bands in NDVI, NBR, NDMI, and NDWI. Ratio indices involve simple direct ratio, weighted ratio, etc. For example, RVI and CSI adopt a direct ratio between the near-infrared band and the red and shortwave infrared (SWIR1: 1550–1750 nm) bands, respectively, to enhance information on vegetation or burned carbon soil. In addition, some other ways have been adopted to construct a complex index, such as PVI, which uses the square root of the perpendicular distance between vegetation and the soil line in the red–NIR spectral space to eliminate the influence of soil background.
Studies have pointed out that the effects of “illumination-target-reflection” observation geometry on surface reflectance cannot be ignored. Anisotropic characteristics of land covers have been concluded from numerous observations collected from laboratories, at ground or from satellites since the 1960s [20,21]. Signals reflected by identical ground objects but observed at different “incidence reflection” geometries show apparent variation at each band [22]. Generally, backward reflectance (light source behind observer) over rough surface objects, such as forest, shrub, grassland, crop, and other vegetation canopy or bare soil, is higher than reflectance collected from the forward direction (light source opposite observer) with the distinct “hot spot” phenomenon; Instead, the forward reflectance is usually greater than the backward one over flat ice or fresh snow surfaces. Under the same illumination conditions, the magnitude of spectral reflectance over green vegetation canopies increases overall around the “hot spots”, and there are more elevated values and enhanced variation at the near-infrared regime than that at visible bands. Though only showing a weakened effect compared with vegetation, the “hot spot” phenomenon of bare soil or xerophytes with less than 2% coverage is still detectable. Snow and ice with “mirror” reflection also have the dimed “hot spot” and an unobvious angle effect in both visible and near-infrared bands [23]. Kimes and Sellers (1985) [24] pointed out that the relative error caused by the angle effect can reach up to 45%. Similarly, Epiphanio and Huete (1995) [25] claimed that a 60% relative error to nadir of surface reflectance can be induced by the variation of view geometry. The orbit design, overhead time, revisit period, band position and wavelength, and sampling mode of various satellite-based sensors determine different observation geometries during data collection, which introduce instinctive angle effects into spectral reflectances that frequently serve for the quantitative extraction of surface information. Thus, the first objective is to clarify the uncertainty directly induced by direction or that propagated into remote sensing indices, before data organization for various quantitative applications.
The increased demand for data accuracy in quantitative remote sensing applications promotes many efforts on the investigation of data uncertainty, including angle effect. With the improved understanding of land surface geobiophysical and geobiochemical processes, regional information extraction or estimation models are calling for high-accuracy input datasets. One study pointed out that the NDVI value of vegetation-related land covers can vary by up to 0.6 from one season to another; Thus, the overlapped region between individual indices retrieved from single time phase images may limit the extraction of land cover information [26]. Chen et al. [27] claimed that the difference in NDWI values extracted from GaoFen-1 (GF-1) and Landsat-8 Operational Land Imager (OLI) images can reach up to about 0.3 due to differences in their radiometric calibration parameters and, hence, induced the potential illness regression results. By now, the angle effect has been recognized from ground-, satellite-, and UAV (Unmanned Aerial Vehicle)-based directional observations or simulated by radiation transfer model. Studies claim that the relative variation in NDVI and SAVI regarding nadir retrieval over various semi-desert steppes [28] and alfalfa canopies [25] can fluctuate as high as 50% when the Solar Zenith Angle (SZA) changes within (−40°, +40°). Sims et al. (2011) [29] pointed out the requirement of EVI directional correction in terms of their finding on the distinctive angle effect sensitivity of EVI from the data series of intra- and inter-annual MODIS directional observations. In addition, the flexible multi-angle data acquisition mode of UAVs can potentially provide more surface types and abundant angle samplings for such studies [30,31]. Galvão et al. (2013) [32] concluded that EVI and PRI have a strong anisotropy feature compared with NDVI, Structure Insensitive Pigment Index (SIPI), and Vogelmann Red Edge Index (VOG) from Hyperion data over a semi-deciduous forest canopy in 2015. Research using multi-angle observation simulated by a radiation transfer model showed that effects introduced by the azimuth angle are far fewer than those introduced by the view zenith angle (VZA) on NDVI, SAVI, DVI and PVI [33], with a positive correlation found between NDVI and SZA varying at (0°, 60°) [34]. Zhang et al. (2010) [35] further improved our understanding on the features of directional NDVI by using multi-angle observation in a narrow band of winter wheat canopy and claimed that the magnitude of NDVI increased with the increase of SZA, accompanied by an overall enhanced forward magnitude compared to the backward one. These studies contribute, more or less, to improving our understanding of angle effect on individual spectral bands or several vegetation indices, but most discussions are based on observations with limited angle sampling [36]. Furthermore, there is a lack of angle effect investigation on other indices that have been frequently applied in vegetation-related monitoring. Therefore, we more efforts are needed to further understand the angle effect of certain indices for data organization in vegetation monitoring.
Spectral observations, no matter whether collected from a ground instrument or UAV- or satellite- based sensors, are affected by observation geometry due to land surface instinct anisotropy characteristics. The effect is further propagated into the constructed indices, although above studies on several indices have aided us to understand the influence of multi-angle observations. In recent years, there has been sporadic exploration on some additional vegetation indices using satellite-based directional observations to evaluate the angle effect. However, the distortion of ground footprints within the Field of View (FOV) at a large VZA can introduce significant uncertainty, especially over highly heterogeneous surfaces, and it is hard to ensure the consistency of investigated objects with the wide-range changing of VZA. For example, the nominal 500 m MODIS footprint can extend to 2 × 4 km at ±55° VZA. Therefore, this paper will focus on multi-angle measurements over cases of homogenous crop fields at different growth phases as well as the forward/backward acquisition from the overlapped region of adjacent Landsat Thematic Mapper (TM)/Enhanced Thematic Mapper (ETM+) images to explore the angle effect characteristics on 12 typical optical remote sensing indices. The flow chart is shown in Figure 1.
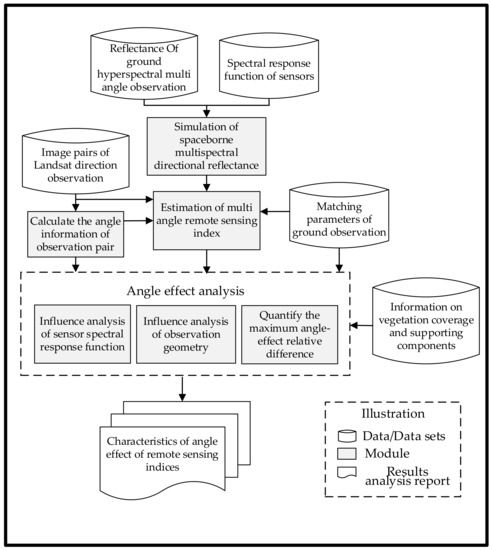
Figure 1.
Flow chart of angle effect evaluation on typical optical remote sensing indices in vegetation monitoring.
2. Typical Indices Serving for Vegetation Monitoring
The growth phase, including green-up, maturity, senescence, and dormancy periods, presents the periodic cycle of energy, water, geobiophysical, and geobiochemical factors between vegetation and its surroundings. It determines the importance of vegetation as the input variable in the carbon cycle, soil erosion, ecosystem monitoring, and the processes of oxygen release and nitrogen fixation. Therefore, the spatial distribution and growth status of vegetation, including land cover transitions induced by nature or anthropological activities (such as forest harvest and wildfires), are important parameters to aid the accurate description of land surface ecological or climatic processes. We assessed 12 typical vegetation-related indices that are constructed by optical spectra and frequently used in representing various vegetation status (as shown in Table 1) to investigate the angle effect.

Table 1.
Optical remote sensing indices.
3. Data
The purpose of this work is to improve our understanding of the angle effect on vegetation-related indices that are generally constructed from satellite optical spectral bands. Thus, we organized ground directional measurements with abundant angle samplings in the view plane, adjacent Landsat TM/ETM+ image pairs, and spectral response function (SRF) of high- or medium-resolution satellite-borne sensors that have been frequently used in land surface vegetation monitoring.
3.1. Landsat Image Pairs
The Landsat program has been used by the global remote sensing community since the 1980s via the continuous Multispectral Scanner System (MSS), TM, ETM+, and OLI observations collected at a local time of 10:30 a.m. from polar orbits every 16 days. Their spatial resolution and band parameters have been gradually improved during the past ~40 years and became more eligible for modern land surface monitoring. Among these sensors, TM and ETM+ have the most consistent parameters of spatial and spectral resolution as well as the longest contemporary service period. Thus, Landsat TM/ETM+ data series provide a potential chance to grasp directional observations collected by the partially overlapped swath of adjacent orbits within two days. According to related investigations from Landsat science teams (Wulder et al., 2008 [37]; Chander et al., 2005 [38]; and the official document issued by United States Geological Survey (USGS) in July 2003 [39]), there is no apparent deterioration of TM and ETM+ during the period we investigated. Even for the Scan Lines Corrector-off (SLC-off) ETM+ data, these publications also claimed that the data maintain the expected radiometric and geometric fidelity without quality degradation. We selected two pairs of Landsat TM/ETM+ images from 2001 and 2004 (see Table 2) and downloaded the geographical, radiometric, and atmospheric calibrated surface reflectance data from the open data center of the USGS official website (https://earthexplorer.usgs.gov/; accessed on 9 June 2020). Both overlapped regions achieved from L2 TM/ETM+ images have a view zenith angle varying around 5.5° and about 5563 × 3417 pixels. Table 3 lists the range of VZA values within the overlapped region, confined by the red line L and the blue line R in Figure 2a. In addition, we selected a 600 × 500-meter wheat field as a satellite case, labeled by the red box in Figure 2c,d, and picked out three sites based on the ground investigation, high-resolution images, and the temporal spectral features captured by multiple time phase TM/ETM+ images. Due to the SLC being off in ETM+ images, only effective points were adopted in the point scale comparison.

Table 2.
Parameters of Thematic Mapper (TM)/Enhanced Thematic Mapper (ETM+) images.

Table 3.
Variation range of view zenith angle (VZA) in overlapped regions of TM/ETM+ images.
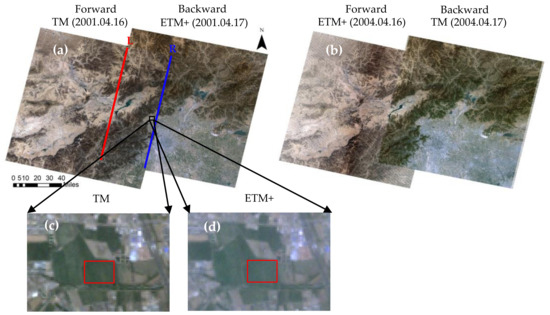
Figure 2.
True color (red, green, and blue) combination of forward and backward observations collected by Landsat-5 TM and Landsat-7 ETM+ sensors with the sample area highlighted in the red squares (c,d); the acquisition dates of the left image pair (a) were 16 April 2001 (TM) and 17 April 2001 (ETM+), and 16 April 2004 (ETM+) and 17 April 2004 (TM) for the right side (b).
3.2. Multi-Angle Observation and Anciliary Parameters
Multi-angle observations over a crop canopy were collected by the China Agricultural University at the Xiaotangshan National Precision Agriculture Experimental Station in Changping of Beijing [40,41] on 17 April 2004, 3 May 2004, 20 May 2004, and 9 June 2004 (See Table 4). The measurements were collected on clear days without winds. The temperature and insolation duration of the study area in 2004 were close to the annual average, and without reported crop disasters (such as pest impact and disease), during the wheat growth period [41]. The adopted ASD (Analytical Spectral Devices) portable field spectrometer has the spectral regime spanning 350–700 and 700–2500 nm respectively with 3 and 10nm spectral resolution. The field data were collected from a height of 1.6m above the winter wheat canopy within 15 min around local solar noon at VZA varying with 5° interval in [−65°, +65°] in the principal plane (PP), and 10° interval in [−60°, +60°] of in the cross-principal plane (CPP), along-row- (AR) and cross-row- (CR) planes, shown in Figure 3. The growth phase and observation time recorded on each of the above days are listed in Table 4. The canopy reflectance in the principal plane with the simultaneous background soil spectrum was measured for these four cases (see Figure 4a–d). The spectra of 1350–1400, 1810–1950, and 2400–2500 nm were dropped due to the influence of water vapor absorption [41]. The variation in indices’ values over four sampled phases of winter wheat canopy potentially implies the major phenological features of most green vegetation from one growth period to the next, within one repeat of their growth cycle. Thus, it is an alternative way to investigate similar green vegetation with less effective directional observations.

Table 4.
Crop growth phases at different dates and observation time based on ground hyperspectral data, where PP, CPP, AR, CR represent principal plane, cross-principal plane, along-row and cross-row, respectively.
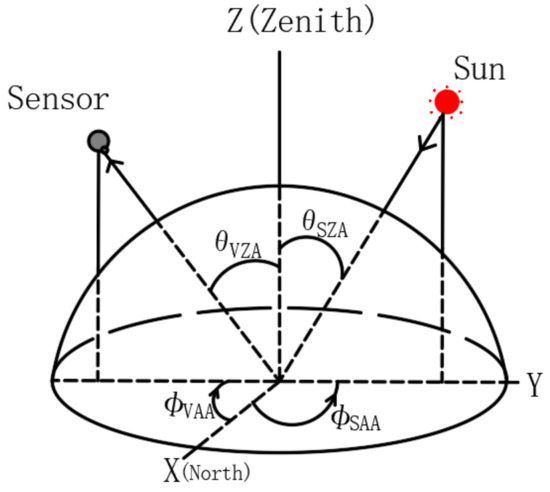
Figure 3.
The schematic diagram of “illumination-viewing” geometry by θVZA (view zenith angle), θSZA (solar zenith angle), ΦVAA (view azimuth angle), and ΦSAA (solar azimuth angle), and the principal plane (ΦVAA = 0° or −180°), cross-principal plane (ΦVAA = 90° or −90°), along-row plane (ΦVAA = 30° or −120°), and cross-row plane (ΦVAA = 120° or −60°) for collecting field observations. (Note: Positive VZA represents forward, and negative represents backward; azimuth angle of 0° is defined as the north.)
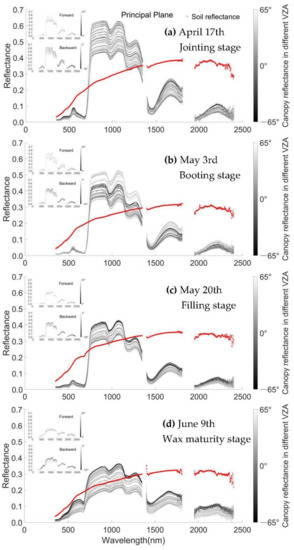
Figure 4.
Ground-based hyperspectral reflectance of winter wheat canopy at VZA varying at [−65°, 65°] with a step of 5° in the principal plane on (a) April 17 (jointing stage), (b) May 3 (booting stage), (c) May 20 (filling stage), and (d) June 9 (wax maturity stage), with the background soil reflectance in scattered red points.
3.3. Spectral Response Function
The position, number, width, central wavelength, and observation sensitivity of each sensor are usually defined using the “spectral response function (SRF)”. The SRF describes the ability of a photosensitive sensor to detect the radiation energy of a specific wavelength in the visible and near-infrared spectral range under the condition of a single or composite light source. SRF, as a function of wavelength, reflects the response of each detector to the received energy [42]. The SRF of a spaceborne sensor is usually represented by the band-pass response spectrum of the signal at each band. Due to hardware limitations, the response spectrum, ideally shown as a square wave, is generally a unimodal function with the approximate normal distribution. Figure 5 shows the SRFs of five frequently used Earth observation sensors (Landsat TM, ETM+, OLI, Aqua/Terra MODIS, and Sentinel-2 Multi-Spectral Instrument (MSI)) published on the official websites of USGS (https://Landsat.usgs.gov/spectral-characteristics-viewer; accessed on 12 September 2018) and the European Space Agency (ESA) (https://sentinels.copernicus.eu/web/sentinel/user-guides/sentinel-2-msi/document-library; accessed on 14 October 2018). The position and width of TM/ETM+ bands are very similar, while OLI has more differences compared with the previous sensors of Landsat series with a smaller band width. The SRF of MSI is similar to that of OLI, except that its band width widens up to 115 nm at NIR, but it has an 80% signal response only within [785 nm, 817 nm]. In addition, MODIS has the narrowest band width among the above five sensors with quite special SRF features.
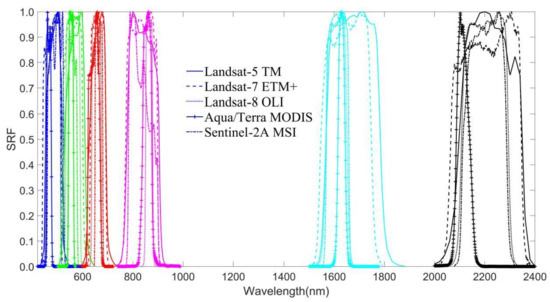
Figure 5.
The spectral response functions (SRF) of TM, ETM+, Operational Land Imager (OLI), Moderate-Resolution Imaging Spectroradiometer (MODIS), and Multi-Spectral Instrument (MSI) sensors.
4. Methods
We studied angle-effect issue using measurements simulated from ground hyperspectrum or formed by the overlapped region of adjacent Landsat scenes to discuss the potential uncertainty transferred into 12 typical optical remote sensing indices. The following methods of data processing and analysis were adopted for simulation of spaceborne multispectral observations and extraction of Landsat TM/ETM+ pixel-based VZA values and metrics for the difference assessment.
4.1. Simulation of Spaceborne Multispectral Observation
Though satellite images at medium and high spatial scales have been taken as the main data source for regional vegetation monitoring, there is less of a chance to acquire rich angle samples evenly distributed in the hemisphere space, and it is, furthermore, difficult to remove effects from atmospheric contamination. The sensor-like data simulated from ground hyperspectrum can effectively avoid atmosphere effects and acquire sufficient directional samples over the target. In addition, due to the attenuation of radiation energy in the path of transmission, the channels of Earth observation satellite sensors are designed into discrete bands covering various spectral regimes to detect enough signals reflected from the land surface, which always include blue, green, red, NIR, and SWIR bands for optical sensors. The equivalent reflection of ground objects collected by satellite sensors can be simulated in terms of the radiative transfer scheme combined with the spectral response mechanism of each satellite sensor, as shown in Formula (1) [43].
where is the simulated value of band B, ρ(λ) is the observed target reflectivity at a specific wavelength λ, ω(λ) is the spectral response of a specific wavelength λ, and a and b are the lower and upper bounds of the spectral regime of band B, respectively.
4.2. Estimation of Multi-Angle Remote Sensing Indices
The selected 12 vegetation-related indices were estimated depending on the models shown in Table 1 using the simulated satellite spectral reflectance data and “image pairs” of Landsat TM/ETM+. In total, 280 groups of view geometry from TM, ETM+, OLI, MODIS, and MSI sensors were acquired. The repetitions at identical view directions were averaged to represent the observation at a given VZA within each group. We first registered the overlapped region of the TM/ETM+ “image pairs” into the identical geolocation system and received the forward/backward observations with VZA varying between 2.25° and 7.50°; then, we selected three sample sites together with the whole overlapped region to calculate the investigated indices under the forward and backward view directions.
4.3. Pixel-Based VZA Extraction of Landsat TM/ETM+
The metadata of Landsat images records instrument parameters and space-vehicle attitude. The pixel-based observation geometry can be estimated according to the recorded metadata before the standard product of angles is developed and issued. TM and ETM+ are carried, respectively, by Landsat-5 and Landsat-7 on solar synchronous polar orbiting satellites with an orbital inclination of 98.2°. They are whiskbroom instruments covering a 185-kilometer wide across-track ground swath, sweeping across the swath back and forth up to a VZA of 7.5° and forming a nadir view line in the middle of the swath. First, the equation of the zenith (θVZA = 0°) observation line EF (see Figure 6) of a scene was determined by the coordinates of four corners and the whiskbroom technology mechanism of TM/ETM+.
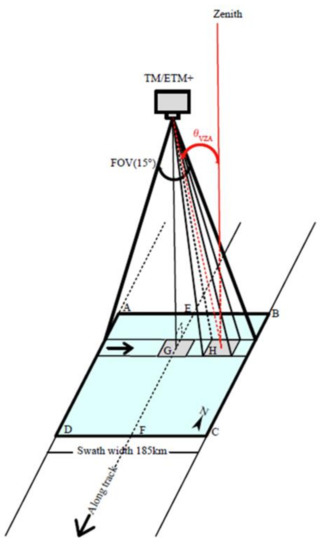
Figure 6.
Schematic diagram of calculation method for the VZA of an image pixel. ABCD represents a scene, EF is the nadir view line, G is the projection pixel of the sensor on the ground, and E is the midpoint of AB on the upper boundary of the swath. The field of view (FOV) of TM/ETM+ is 15°. The angle between the two red lines in the figure is θVZA, corresponding to the VZA of arbitrary pixel H of the TM/ETM+ sensors.
Then, the azimuth and zenith angles of each pixel were estimated from theories on the precession of the rotating scan mirror in TM/ETM+, orbit parameters, and the space projection geometry (see Formula (2)). The relative view azimuth angle, defined as the angle of view and sun incident direction projected on the horizontal plane, was estimated according to the geometric relationship of the projections to the position of the view direction together with VZA and SZA. Next, pixel-based angles of the entire overlapped region were determined for both forward and backward images according to the spatial geometric positioning.
where θVZA is the VZA corresponding to the observation of TM/ETM+ sensors for arbitrary pixel H. dEB is the length of line EB, and dGH is the perpendicular distance of pixel H to the nadir view line with the intersection at G.
4.4. Metrics for Difference Assessment
The metrics used to evaluate the variation of the discussed optical remote sensing indices are the absolute (see Formula (3)) and the relative bias (see Formula (4)) between the baseline and our directional estimation, the magnitude range, and the frequency of directional indices. The baseline and the estimation correspond to different cases serving for the evaluation of angle effect using multi-angle observation data. Among them, TM and ETM+ were taken as the baseline and the estimation for the forward and backward comparisons of the overlapped TM/ETM+ region respectively. On the other hand, when estimating the difference in ground hyperspectral data, the baseline was the zenith observation, and the estimation was the angle samplings in the view plane. The magnitude range can quantitatively describe the indices’ difference caused by the variation in the VZA. First, the relative differences between various VZA and zenith angle values in four growth cases and the same sensor in the same observation plane were calculated; that is, . Then, the maximum value of the relative difference in the same plane calculated by the previous step was taken. After that, the maximum relative difference of the four observation planes in each case was taken for the same sensor. Finally, the minimum and maximum relative differences between the five different sensors in the same growth period were taken as the final maximum relative difference interval.
where Abias and Rbias are the absolute bias and the relative bias between the baseline vbaseline and our directional estimation vestimation, respectively.
5. Results
5.1. Angle Effect on Pixel-Level Reflectance
5.1.1. Comparison of Sample Sites
Figure 7 shows the multi-band reflectance of TM/ETM+ image pairs on 16 and 17 April of 2001 and 2004 over three selected sites. The spectra of both groups exhibit apparent green vegetation signatures with low reflectance at visible bands and strong reflectance at the near-infrared band, followed by a reduced magnitude at shortwave infrared bands. The variation in band reflectance among the three sites of the same image on each individual day is neglectable at visible bands, and a slight difference is captured at the infrared band (Figure 7a), while the backward reflectance is noticeably greater than the forward one at the visible spectral regime based on comparison of the mean values in Figure 7b.
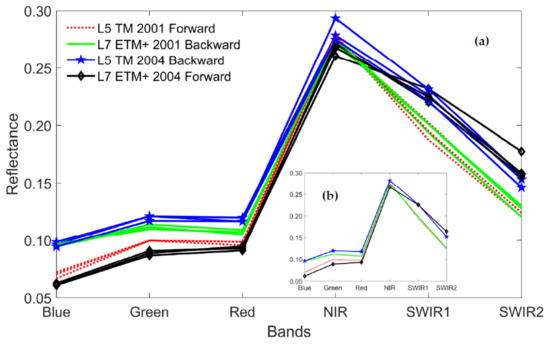
Figure 7.
Multi-band reflectance over three sites extracted from two pairs of adjacent TM/ETM+ images in 2001 and 2004 at six spectral bands from individual sites shown in the major plot (a) and the mean of each compared day in the lower embedded plot (b).
Twelve remote sensing indices were calculated from the mean value of sample sites as well the relative differences in TM and ETM+ indices in 2001 and 2004. Table 5 shows the differences in forward and backward observation reflectance caused by view angle. In 2001, the relative difference of NDWI at 2001 reaches 12.57% compared with other indices, which had less than 10% difference, and EVI, RVI, and CSI had no more than 1%. For samples from 2004, the overall relative differences in 2004 were elevated, with more than 10% relative difference of nine indices and up to 43.86% of NDMI.

Table 5.
Results of index and relative difference (%) based on mean reflectance of sample points from the overlapped TM/ETM+ images from 2001 and 2004.
5.1.2. Comparison of the Overlapped Area within TM/ETM+ Image Pairs
Figure 8 reveals the change of 12 indices within the overlapped area. Visually, a vague line can be captured at the joint edge of the backward and forward MIRBI (F) images, seen as dimmed lines for images of NDWI (I) and SWIR1/NIR (J), and there is no obvious difference for images of NDVI (A), EVI (B), SAVI (C), RVI (D), CSI (E), NBR (G), NDMI (H), SWIR2/NIR (K), and SWIR2/SWIR1 (L). The quantitative difference between backward and forward measurements was calculated for each pixel followed in the overlap region of 2001 TM/ETM+ at six band reflectances and 12 indices, as shown, respectively, in the histograms of Figure 9a,b. The reflectance difference plots show positive peaks around 0.1 at blue, red, NIR, and SWIR2, while the peak of the histogram moves forward to 0.015 at SWIR1 and back to 0+ at the green band. Each difference histogram of the 12 indices normalized into [−1, 1] basically followed a normal distribution, with the peak varying within (−0.03, 0.01). MIRBI had the maximum deviation between forward and backward measurements, with the peak of the histogram shifting to −0.03 compared with peaks approaching −0.015 or lower for CSI, NDMI, NDWI, SWIR2/NIR, and SWIR2/SWIR1 and peaks with a positive difference within 0.01 for the right indices.
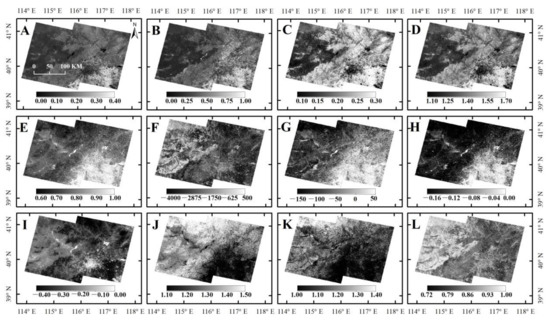
Figure 8.
The spatial distribution of Normalized Difference Vegetation Index (NDVI) (A), Enhanced Vegetation Index (EVI) (B), Soil-Adjusted Vegetation Index (SAVI) (C), Ratio Vegetation Index (RVI) (D), Char Soil Index (CSI) (E), Mid-IR Bispectral Index (MIRBI) (F), Normalized Burn Ratio (NBR) (G), Normalized Difference Moisture Index (NDMI) (H), Normalized Differenced Water Index (NDWI) (I), SWIR1/NIR (J), SWIR2/NIR (K), and SWIR2/SWIR1 (L) over the overlapped TM/ETM+ images of 2001.
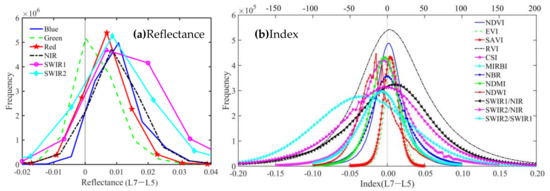
Figure 9.
Difference histograms between forward and backward spectral reflectance (a) and indices (b) of the overlapped TM/ETM+ images from 2001. The MIRBI value is denoted at the upper X-axis, and the lower X-axis for other indices.
5.2. Angle Effect on Simulated Indices
The 12 indices shown in Figure 10 were estimated from multiple sensor-like reflectances simulated from ground multi-angle hyperspectral measurements and the spectral response function of MODIS, TM, ETM+, OLI, and MSI. The variation in each discussed index involves signals collected mainly through the observation geometry and sensor SRF under various fractions of vegetation coverage.
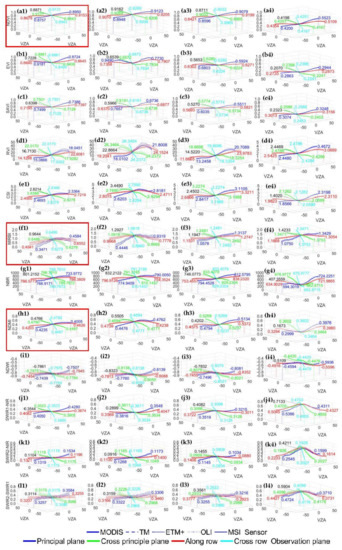
Figure 10.
Variation in 12 indices calculated from simulated sensor-like spectra and noted by vertical axis annotation of sub-figures through (a–l) with cases respectively on 17 April (jointing stage), 3 May (booting stage), 20 May (filling stage), and 9 June (wax maturity stage) at columns from left to right (1–4) in the principal (blue), cross-principal (green), along-row (red), and cross-row (cyan) planes under view zenith angles varying within [−70°, +70°] in the XOY plane for MODIS (bold solid line), TM (dash line), ETM+ (dotted line), OLI (dash dotted line), and MSI(light solid line). The magnitude of indices is labeled at ±65° (±60°) VZA by vertical lines with the related color in each plane and accompanied by a black vertical line at the nadir view geometry.
5.2.1. Observation Geometry Effect
Visually, the variation of directional indices (Figure 10) shows a bell or bowl shape in the whole angle-sampling hemisphere accompanied by various fluctuations of magnitude with the change of view geometry. The “bell” shape implies the decrease at the large view zenith angle, whereas the shape with the inverse change is called a “bowl” shape. With the given growth phase of the four investigated cases (17 April (jointing stage), 3 May (booting stage), 20 May (filling stage), and 9 June (wax maturity stage)), the index value surrounding the principal plane usually exhibits remarkable anisotropic features compared with the lowest variation around the cross-principal plane. The index magnitude within the principle and along-row planes frequently shows elevated variations in each column with the given growth phase. As with most of the bowl shapes, Figure 10(b1) indicates a deeper bowl shape in the principle and along-row planes than that of two other planes. As a special case, Figure 10(e2) presents a significant bell shape of RVI with a strong forward magnitude in the principal plane. EVI and SAVI keep the bowl shape with apparent variation at the case of booting stage and less variation at the case of wax maturity stage. The normalized indices NDVI, NBR, NDWI, and NDMI generally have limited variation at the case of jointing stage, booting stage, compared with the raised changes at the case of wax maturity stage. The ratio indices exhibit relatively high variation with direction changes among four discussed cases. RVI shows the transitions exists from the typical bell shape with a strong backward “hot spot” at the booting stage to the bowl shape with an elevated backward bowl edge at the wax maturity stage in principal plane and along-row plane, and the similar transition of CSI, but with a dimmed “hot spot”. The left three ratio indices, SWIR1/NIR, SWIR2/NIR, and SWIR2/SWIR1, have similar trends in each growth phase scenario, except for the obvious discrepancy induced by the sensor in SWIR2/SWIR1 ratio. In addition, the linear constructed index MIRBI kept changing within the bell shape over the whole hemisphere at four growth phases, except for the shallow bowl shape at the case of filling stage.
Quantitatively, these indices are graded into three categories, which include high and low variation in the whole hemisphere as well as flat variation with fluctuation at certain scenarios in terms of the range of angle-induced influence. First, the value of MIRBI and RVI generally varies within a wide range with the change of zenith angle. Compared with the smooth variation at the case of filling stage, the relative differences of MIRBI between its maximum value and that at nadir view reach 64.0%, 65.6%, and 24.5% at the cases of jointing stage, booting stage, and wax maturity stage, respectively. As for RVI, the maximum relative differences are 55.7%, 73.3%, 91.4%, and 51.1% at the jointing stage, booting stage, filling stage, and wax maturity stage, while NDVI and NDWI show limited variation with the change of view zenith angle (VZA) at the three growth phases of jointing stage, booting stage, and filling stage, in which the induced maximum relative differences are 4.2%, 3.9%, and 7.2% for NDVI and 5.7%, 6.8%, and 8.7% for NDWI, respectively. In addition, other indices showing a general flat variation are affected by view geometry at certain scenarios, such as EVI (48.5%), SAVI (29.4%), CSI (30.2%), SWIR1/NIR (43.2%), and SWIR2/NIR (66.4%) at the booting stage and NBR (115.8%), NDMI (206.7%), SWIR1/NIR (44.1%), SWIR2/NIR (65.6%), and SWIR2/SWIR1(40.3%) at the wax maturity stage.
5.2.2. Influence of Sensor SRF
It is inevitable to introduce difference during the simulation of multi-band reflectance from ground directional hyperspectra in terms of MODIS, TM, ETM+, OLI, and MSI sensors’ SRF, which potentially affects the analysis of the angle effect on the above-discussed indices. Therefore, we attempted to assess the SRF influence investigated sensors on the indices to examine if it is equivalent to the directional effect. The indices calculated for different sensors at one of the given cases had similar values as with identical observation geometry and also had similar trends to the change of view direction, except for d1 and d2 of RVI, NDWI, and some SWIR2-involved cases in Figure 10. The difference between MODIS and other sensors is large when comparing the closest value between TM and ETM+. Although the index differences among sensors are different, they are basically in the same order of magnitude at each growth phase and view plane scenario.
Table 6 presents an example of the uncertainty comparison between SRF and view geometry based on the estimation of indices in the principal plane on 17 April. The minimum and maximum angle effect relative errors of each discussed index are listed in the middle column of Table 6, which imply the low percentage of [4.0%, 4.2%] for NDVI and the highest percentage of [40.7%, 64%] for NDWI, and that for SRF-induced relative error is shown in the third column of Table 6. The “angle effect relative error” was defined as the ratio of the largest directional value away from that of the nadir view to the nadir calculation in the principal plane, and the minimum and maximum relative error interval of the five sensors was adopted to measure the angle effect variation among five investigated sensors. The relative error of SRF denotes the percentage of highest magnitude relative to the lowest magnitude of index at nadir view among the five sensors for individual indices. It can be seen that under the same conditions, the relative error caused by view geometry is generally greater than that caused by spectral response function, except for NDWI and SWIR2/SWIR1 (shaded rows in Table 6). Most of the other indices have around a twofold higher fluctuation from the angle effect than that from the SRF effect, such as CSI, MIRBI, NBR, NDMI, and SWIR2/NIR; more than threefold higher for NDVI, RVI, and SWIR1/NIR; or up to more than tenfold for EVI and SAVI.

Table 6.
Comparison of angle effect and spectral response function (SRF) effect relative error on each discussed index calculated from the simulated value in the principal plane (PP) on 17 April.
For detailed comparison among individual sensors’ SRF, the representative cases can be leveled into the following three categories (Take MIRBI, NDMI, and NDVI on April 17th from the three intervals as examples, as shown in the three-dimensional diagram circled by the red box in Figure 10, denoting the index and sensor names and minimum and maximum values): (1) large relative error greater than 15%, for (MIRBI[MODIS, OLI], SWIR2/NIR[MODIS, MSI], SWIR2/SWIR1[MODIS, OLI]); (2) medium difference within the range of (5%, 15%), as with (RVI[TM, MSI], CSI[MODIS, OLI], NDMI[MODIS, OLI], SWIR1/NIR[OLI, MODIS]); (3) small difference of less than 5%, for (NDVI[TM, MSI], EVI[TM, MSI], SAVI[TM, OLI], NBR[MSI, MODIS], NDWI[MODIS, TM]).
5.2.3. Dynamic of the Maximum Angle Effect Relative Difference
Table 7 shows the maximum percentage of angle effect relative difference for each index with the change of view direction and growth phase among five sensors. The maximum percentage interval for individual index and given growth phase was determined from the angle effect relative difference to nadir view in each observation plane within the discussed sensors under given conditions. The upper and lower boundaries of the closed intervals describe the dynamic range of the maximum angle effect relative difference for each scenario listed in Table 7. Figure 11 illustrates the estimation of the “maximum angle effect relative difference” interval through the case of EVI on 3 May. Sensor-like multiband spectra simulated from the ground multi-angle hyperspectrum and SRF of MODIS and MSI have been adopted to calculate the directional indices, followed by estimation of their relative difference to the nadir value. We calculated the maximum relative difference of each sensor as well as the lower and upper boundaries to assemble the dynamic interval [45.5%, 48.5%] for EVI on 3 May, as shown in Figure 11.

Table 7.
Maximum relative difference intervals of indices (%) calculated based on the simulated value.
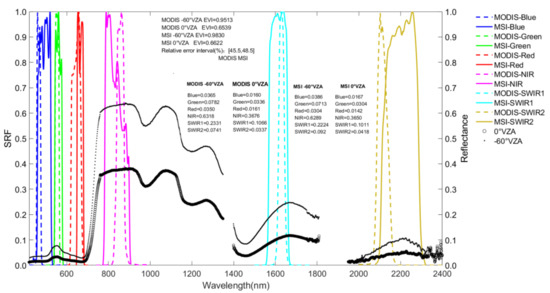
Figure 11.
Illustration of the angle effect relative difference through a case of EVI calculated using from the simulated multiple sensor-like spectrum that have been simulated from ground hyperspectral reflectance collected on 3 May at nadir (empty circle) and −60°(small solid point) VZA in the principle plane, and SRF of MODIS (dotted line) and MSI (solid line).
Our results show that the maximum percentage of angle effect relative difference vary from low [3.6%, 3.9%] up to [161.6%, 206.7%]. In general, four cases of various growth phase show that angle effect has a different performance on the remote sensing indices. For cases of jointing stage (column 3 of Table 7), booting stage (column 4), and filling stage (column 5), most of the discussed indices involved more than 20% relative difference, except NDVI and NDWI with values lower than 10%, and NBR less than 16%. For the case of wax maturity stage (column 6), the relative differences from the nadir value are large. Among them, the maximum relative difference is above 50% for EVI, SAVI, RVI, CSI, NBR, NDMI, and SWIR2-NIR, while it reaches up to [161.6%, 206.7%] for NDMI.
6. Discussion
From two levels of satellite-based images and ground directional measurements, we discussed the captured angle effect on spectral reflectance and remote sensing optical indices frequently used in vegetation monitoring. Our results show that the angle effect magnitude and characteristics vary largely for each discussed index under given scenarios. We investigated the angle effect on indices from various view geometries and anisotropic features in typical view planes.
Both satellite and ground measurements imply the anisotropy feature of directional reflectance collected over the actual land surface. The previous results exhibit apparent differences between forward and backward observations of the overlapped area within the example “image pairs” of Landsat reflectance. Furthermore, ground measurements with rich angle samplings in the whole hemisphere reveal more details of angle effect in the “hot spot” direction and view planes. The results show that the backward reflectance over winter wheat plots is greater than the forward reflectance, especially in the visible band. The sensitivity of bidirectional reflectance in the visible band is greater than that in the infrared band. This is due to the high transmission and multiple scattering characteristics of vegetation in the infrared band, making the shadow effect in the visible band stronger than that in the infrared band. Our investigation also shows that the variation in reflectance is dominated by angle effect compared with that induced by SRF of the discussed five sensors, even if the difference changing with the increasing of VZA. We examined the identical points selected from cases of TM/ETM+ image pairs and found that the reflectance difference between NIR and SWIR bands is significant but with less apparent trend of special features . The overall SWIR reflectance in 2001 was lower. The strong absorption of water vapor in the infrared band may be potential factor induced the decrease of soil and vegetation reflectance [44]. In addition, the soil background captured by the directional observation potentially can modulate the reflectance signal over three investigated sample sites. For instance, when the proportion of soil in a pixel is elevated, the reflectance curve of vegetation will increase in the visible band and decrease in NIR. Roy and Zhang et al. (2016) [45] claimed the existence of reflectance difference between backward and forward observations using 567 ETM+/TM image pairs from January and July 2010 over the continental United States. The case we adopted in 2001 and 2004 drew a consistent conclusion on the difference between forward and backward reflectances. To meet the primary objective of this study, we pushed this case study forward by discussing the related variation of vegetation indices. The case demonstrates the existence of angle effect variation in the satellite-based images and is able to transfer caution on the combination of multi-sensor indices in their application. The present case is a preliminary assessment, and we will put effort into providing more detail for a large number of real satellite images in the future. The results based on the ground level show that under four independent cases of different wheat growth phases, the angle effect transmitted into each remote sensing index exhibits different changes. However, cross-comparison of differences between different growth phases is difficult to quantify without sufficient information of ancillary parameters. For example, the meteorological conditions, pests and diseases, the measurement errors of the ancillary data (e.g., fractional vegetation cover, leaf moisture content, and soil moisture content), and underlying soil will cause changes in canopy reflectance.
When the angle effect is propagated from the reflectance to the remote sensing index, the uncertainty can be amplified or suppressed by various schemes used for index construction. The difference construction form has the potential to suppress part of the angle effect, while the ratio and linear weighting schemes are more sensitive to the directional influence and sometimes may amplify the angle effect, such as EVI composed by blue, red, and NIR bands, as shown in Figure 11, which shows the value of 0.9513 and 0.9830 for MODIS and MSI when the VZA changes from 0° to −60° due to the non-synchronous changes with three involved bands. For the identical sensor and under same wheat reflectance conditions, the NDVI values of MODIS and MSI sensors were 0.8949 and 0.9077 at −60° and 0.9162 and 0.9252 at 0° view, respectively. The relative differences of MODIS and MSI sensors between −60° and 0° are −2.32% and −1.89%, respectively. RVI is constructed by the ratio of NIR and red bands, and its values at −60° VZA of MODIS and MSI sensors are 18.0335 and 20.6708, respectively, and at 0° VZA, they are 22.8683 and 25.7456, respectively. The relative differences are −21.14% and −19.71%, respectively. By analyzing differences of 12 indices showing in Figure 10 and Table 7, we found that different index construction schemes can reduce or enlarge the angle effect. The MIRBI index is a linear weighting scheme, and the relative differences between its maximum value and that at the nadir view direction of four growth phases are larger than 12.6%, especially for the case of jointing stage and booting stage, which could reach 64.0% and 65.6%, respectively. Therefore, in the construction of an optical remote sensing index, the form of difference should be considered more, and the form of ratio or linear weighting should be avoided as much as possible to weaken the influence of angle effect.
7. Conclusions
This work investigated the potential uncertainty of angle effects on optical indices using directional sensor-like multi-band reflectance simulated from ground hyperspectrum data and top-of-atmosphere (TOA) measurements collected by adjacent Landsat TM/ETM+ image pairs. Sensor-like directional data were simulated from ground multi-angle hyperspectral observations for TM, ETM+, OLI, MODIS, and MSI optical sensors, and then used to calculate 12 typical indices that have been frequently serving for vegetation monitoring. Furthermore, the influence of forward and backward observations on these indices was examined by combining them with the surface reflectance of TM/ETM+ “image pairs” collected on clear days. Our results show: (1) The angle effect can transfer about 3.6% to 206.7% relative difference into the discussed optical remote sensing indices, and the difference is significantly higher than the uncertainty of 1.1% to 26.1% caused by SRF of difference sensors. (2) The forward and backward view direction of Landsat adjacent TM/ETM+ image pairs can transfer an absolute difference of −0.03 to 0.1 into these indices. When VZA varies between 2.25° to 7.50°, there is an induced higher relative difference of 9.51% to 12.94% in NDVI, SAVI, and NDWI, a small value of 1.34% to 6.31% in EVI, RVI, MIRBI, NBR, NDMI, SWIR2/NIR, and SWIR2/SWIR1, and as well as a weak one of 0.06% to 0.25% in CSI and SWIR1/NIR. (3) The simulated sensor-like reflectance demonstrates that the angle effect transferred into each optical remote sensing index has a different performance in terms of magnitude and characteristics. The maximum percentage of angle effect relative difference varied from low values of [3.6%, 3.9%] up to [161.6%, 206.7%]. For the cases of jointing stage, booting stage, and filling stage, most of the discussed indices involved more than 20% relative difference except NBR (less than 16%), NDVI and NDWI(less than 10%). For the wax maturity case, the maximum relative differences of EVI, SAVI, RVI, CSI, NBR, NDMI, and SWIR2/NIR were generally more than 50%, while the range for NBR and NDMI reached up to [99.5%, 115.8%] and [161.6%, 206.7%], respectively. (4) Different remote sensing indices constructed by various models have distinctive sensitivities. The difference-form of an index can partially suppress the angle effect somehow, whereas an index in the ratio-form linearly weighted potentially implies more sensitiveness can magnify the propagation of angle effect. This research indicates that variation induced by angel-effect cannot be ignored when we estimate the vegetation related indices using Landsat TM, ETM+, OLI, MODIS, and Sentinel-2A MSI sensors, compared with the potential reflection differences contained in different sensors. . In addition, to avoid unexpected variation, we recommend the indices with potential suppression of angle-effect for vegetation monitoring or information retrieval.
Author Contributions
Conceptualization, Y.S.; program and process, L.G. and C.S.; data organization, L.G., J.Y., D.X., Q.Z., and Y.L.; writing—original draft preparation, L.G. and Y.S.; writing—review and editing, D.X., Q.Z., and Y.L.; supervision, Y.S.; funding acquisition, Y.S. and Q.Z. All authors have read and agreed to the published version of the manuscript.
Funding
This work was supported by the National Natural Science Foundation of China (No. 42071351), the National Key Research and Development Program of China (No. 2020YFA0608501, No. 2017YFB0504204), the Liaoning Revitalization Talents Program (No. XLYC1802027), the One Hundred Talents Program of the Chinese Academy of Science (No. Y938091, No. Y674141001), Project supported discipline innovation team of Liaoning Technical University (No. LNTU20TD-23), and the Liaoning Key Program Serving for the Social Economy Development of Towns at North-West Liaoning (NO. 10147-0816-1).
Acknowledgments
The authors would like to give thanks to the researchers at the Agricultural University of China and Beijing Normal University for collecting and sorting the data of bidirectional reflectance of the ground canopy and to Jialei Wang for his help in this research.
Conflicts of Interest
The authors declare no conflict of interest.
References
- Zaini, N.; Freek, V.; Harald, V. Determination of carbonate rock chemistry using laboratory-based hyperspectral imagery. Remote Sens. 2014, 6, 4149–4172. [Google Scholar] [CrossRef]
- Weng, Q.; Hu, X.; Lu, D. Extracting impervious surfaces from medium spatial resolution multispectral and hyperspectral imagery: A comparison. Int. J. Remote. Sens. 2008, 29, 3209–3232. [Google Scholar] [CrossRef]
- Noh, H.K.; Lu, R. Hyperspectral laser-induced fluorescence imaging for assessing apple fruit quality. Postharvest Biol. Technol. 2007, 43, 193–201. [Google Scholar] [CrossRef]
- Brando, V.; Dekker, A. Satellite hyperspectral remote sensing for estimating estuarine and coastal water quality. IEEE Trans. Geosci. Remote. Sens. 2003, 41, 1378–1387. [Google Scholar] [CrossRef]
- Jordan, C.F. Derivation of Leaf-Area Index from Quality of Light on the Forest Floor. Ecology 1969, 50, 663–666. [Google Scholar] [CrossRef]
- Richardson, A.J.; Wiegand, C.L. Distinguishing vegetation from soil background information. Photogramm. Eng. Remote Sens. 1978, 43, 257–259. [Google Scholar] [CrossRef]
- Rouse, J.W.; Haas, R.W.; Schell, J.A.; Deering, D.W.; Harlan, J.C. Monitoring the vernal advancement and retrogradation (green wave effect) of natural vegetation. NASA/GSFC Type III Final Rep. Greenbelt Md 1974, 371, 1–112. [Google Scholar]
- Huete, A. A soil-adjusted vegetation index (SAVI). Remote. Sens. Environ. 1988, 25, 295–309. [Google Scholar] [CrossRef]
- Perry, C.R.; Lautenschlager, L.F. Functional equivalence of spectral vegetation indices. Remote. Sens. Environ. 1984, 14, 169–182. [Google Scholar] [CrossRef]
- Huete, A.; Didan, K.; Miura, T.; Rodriguez, E.P.; Gao, X.; Ferreira, L.G. Overview of the radiometric and biophysical performance of the MODIS vegetation indices. Remote Sens. Environ. 2002, 83, 195–213. [Google Scholar] [CrossRef]
- Gao, B.C. NDWI—A normalized difference water index for remote sensing of vegetation liquid water from space. Remote Sens. Environ. 1995, 58, 257–266. [Google Scholar] [CrossRef]
- McFeeters, S.K. The use of the Normalized Difference Water Index (NDWI) in the delineation of open water features. Int. J. Remote. Sens. 1996, 17, 1425–1432. [Google Scholar] [CrossRef]
- Smith, A.M.; Wooster, M.J.; Drake, N.A.; Dipotso, F.M.; Falkowski, M.J.; Hudak, A.T. Testing the potential of multi-spectral remote sensing for retrospectively estimating fire severity in African Savannahs. Remote. Sens. Environ. 2005, 97, 92–115. [Google Scholar] [CrossRef]
- Trigg, S.; Flasse, S. An evaluation of different bi-spectral spaces for discriminating burned shrub-savannah. Int. J. Remote Sens. 2001, 22, 2641–2647. [Google Scholar] [CrossRef]
- Key, C.H.; Benson, N.C. Landscape assessment (LA). In FIREMON: Fire Effects Monitoring and Inventory System; Lutes, D.C., Keane, R.E., Caratti, J.F., Key, C.H., Benson, N.C., Sutherland, S., Gangi, L.J., Eds.; Gen. Tech. Rep. RMRS-GTR-164-CD; US Department of Agriculture, Forest Service, Rocky Mountain Research Station: Fort Collins, CO, USA, 2006; Volume 164, p. LA-1-55. [Google Scholar]
- Vogelmann, T.C. Plant tissue optics. Annu. Rev. Plant Biol. 1993, 44, 231–251. [Google Scholar] [CrossRef]
- Kushla, J.D.; Ripple, W.J. Assessing wildfire effects with Landsat thematic mapper data. Int. J. Remote. Sens. 1998, 19, 2493–2507. [Google Scholar] [CrossRef]
- Epting, J.; Verbyla, D.; Sorbel, B. Evaluation of remotely sensed indices for assessing burn severity in interior Alaska using Landsat TM and ETM+. Remote. Sens. Environ. 2005, 96, 328–339. [Google Scholar] [CrossRef]
- Yang, H.F.; Li, J.L.; Mu, S.J.; Yang, Q.; Hu, X.X.; Jin, G.P.; Zhao, W.Y. Analysis of hyperspectral reflectance characteristics of three main grassland types in Xinjiang. Acta Prataculturae Sin. 2012, 21, 258–266. [Google Scholar]
- Kimes, D.S.; Newcomb, W.W.; Nelson, R.F.; Schutt, J.B. Directional Reflectance Distributions of a Hardwood and Pine Forest Canopy. IEEE Trans. Geosci. Remote. Sens. 1986, GE-24, 281–293. [Google Scholar] [CrossRef]
- Zhang, Y.H.; Zhong, B.; Yang, F.J.; Liu, Q. Extraction of BRDF characteristics using TM/ETM+ and DEM data. J. Remote Sens. 2021, 16, 361–377. [Google Scholar]
- Xu., M.; Yi, S.H.; Ye, B.S.; Ren, S.L.; Zhou, Z.Y. Influence of PVC and sun/view geometry on NDVI and SAVI in the upstream regions of Shule river basin. J. Arid Land Resour. Environ. 2012, 26, 101–107. [Google Scholar]
- Liang, S.L.; Li, X.W.; Wang, J.D. Quantitative Remote Sensing: Concepts and Algorithms, 2nd ed.; Science Press: Beijing, China, 2019. [Google Scholar]
- Kimes, D.; Sellers, P. Inferring hemispherical reflectance of the earth’s surface for global energy budgets from remotely sensed nadir or directional radiance values. Remote. Sens. Environ. 1985, 18, 205–223. [Google Scholar] [CrossRef]
- Epiphanio, J.; Huete, A.R. Dependence of NDVI and SAVI on sun/sensor geometry and its effect on fAPAR relationships in Alfalfa. Remote. Sens. Environ. 1995, 51, 351–360. [Google Scholar] [CrossRef]
- Shuai, Y.M.; Ma, X.W.; Qu, G.; Shao, C.Y.; Liu, T.; Liu, S.M.; Huang, H.B.; Gu, L.X.; La, T.; Liang, J.; et al. Cascade extraction of impervious surface information based on the signature of temporal spectrum. J. Geo-Inf. Sci. 2021, 23, 171–186. [Google Scholar] [CrossRef]
- Chen, S.Y.; Lu, D.D.; Wu, S.T. Quantitative comparison of normalized difference water index og GF-1 and Landsat8 images in Karst region. J. Atmos. Environ. Opt. 2020, 15, 125–133. [Google Scholar]
- Huete, A.; Hua, G.; Qi, J.; Chehbouni, A.; van Leeuwen, W. Normalization of multidirectional red and NIR reflectances with the SAVI. Remote. Sens. Environ. 1992, 41, 143–154. [Google Scholar] [CrossRef]
- Sims, D.A.; Rahman, A.F.; Vermote, E.F.; Jiang, Z. Seasonal and inter-annual variation in view angle effects on MODIS vegetation indices at three forest sites. Remote. Sens. Environ. 2011, 115, 3112–3120. [Google Scholar] [CrossRef]
- Shuai, Y.M.; Yang, J.; Wu, H.; Shao, C.Y.; Xu, X.C.; Liu, M.Y.; Liu, T.; Liang, J. Variation of multi-angle reflectance collected by UAV over quadrats of paddy-field canopy. Remote Sens. Technol. Appl. 2021, 36, 1–11. [Google Scholar]
- Brede, B.; Suomalainen, J.; Bartholomeus, H.; Herold, M. Influence of solar zenith angle on the enhanced vegetation index of a Guyanese rainforest. Remote. Sens. Lett. 2015, 6, 972–981. [Google Scholar] [CrossRef]
- Galvão, L.S.; Breunig, F.M.; Dos Santos, J.R.; De Moura, Y.M. View-illumination effects on hyperspectral vegetation indices in the Amazonian tropical forest. Int. J. Appl. Earth Obs. Geoinf. 2013, 21, 291–300. [Google Scholar] [CrossRef]
- Tsuchiya, S.; Taniguchi, K.; Obata, K.; Matsuoka, M.; Yoshiokay, H. View-angle dependencies of vegetation isolines for higher-order standardization of spectral vegetation indices. In Proceedings of the 2013 IEEE International Geoscience and Remote Sensing Symposium—IGARSS, Melbourne, Australia, 21–26 July 2013; pp. 2114–2117. [Google Scholar]
- Bégué, A. Leaf area index, intercepted photosynthetically active radiation, and spectral vegetation indices: A sensitivity analysis for regular-clumped canopies. Remote. Sens. Environ. 1993, 46, 45–59. [Google Scholar] [CrossRef]
- Zhang, X.-H.; Tian, Q.-J.; Shen, R.-P. Analysis of Directional Characteristics of Winter Wheat Canopy Spectra. Spectrosc. Spectr. Anal. 2010, 30, 1600–1605. [Google Scholar]
- Goodin, D.; Gao, J.; Henebry, G. The Effect of Solar Illumination Angle and Sensor View Angle on Observed Patterns of Spatial Structure in Tallgrass Prairie. IEEE Trans. Geosci. Remote. Sens. 2004, 42, 154–165. [Google Scholar] [CrossRef]
- Wulder, M.A.; Ortlepp, S.M.; White, J.C.; Maxwell, S. Evaluation of Landsat-7 SLC-off image products for forest change detection. Can. J. Remote. Sens. 2008, 34, 93–99. [Google Scholar] [CrossRef]
- Chander, G.; Helder, D.; Markham, B.; Dewald, J.; Kaita, E.; Thome, K.; Micijevic, E.; Ruggles, T. Landsat-5 TM reflective-band absolute radiometric calibration. IEEE Trans. Geosci. Remote. Sens. 2004, 42, 2747–2760. [Google Scholar] [CrossRef]
- USGS, NASA and LANDSAT 7 SCIENCE TEAM 2003, Preliminary Assessment of the Value of Landsat 7 ETM + Data Following Scan Line Corrector Malfunction. Available online: https://www.usgs.gov/media/files/preliminary-assessment-value-landsat-7-etm-slc-data (accessed on 11 April 2021).
- Huang, W.J.; Wang, J.H.; Liu, L.Y.; Wang, J.; Tan, C.; Li, C.; Wang, Z.; Song, X. Remote sensing identification of plant structural types based on multi-temporal and bidirectional canopy spectrum. Trans. CSAE 2005, 21, 82–86. [Google Scholar]
- Wang, J.D.; Zhang, L.X.; Liu, Q.H.; Zhang, B.; Yin, Q.; Li, P.; Zhao, G.X.; Gao, M.X.; Chang, C.Y.; Wang, Z.R.; et al. Spectral Database System of Typical Objects in China; Science Press: Beijing, China, 2009. [Google Scholar]
- Chen, S.P. The Dictionary of Remote Sensing; Science Press: Beijing, China, 1990. [Google Scholar]
- Franke, J.; Heinzel, V.; Menz, G. Assessment of NDVI- Differences Caused by Sensor Specific Relative Spectral Response Functions. In Proceedings of the IEEE International Conference on Geoscience and Remote Sensing Symposium, Denver, CO, USA, 31 July–4 August 2006; pp. 1138–1141. [Google Scholar]
- Li, P.; Zhao, G.X.; Gao, M.X.; Chang, C.Y.; Wang, Z.R.; Zhang, T.R.; An, D.Y.; Jia, J.C. Hyperspectral estimation and remote sensing retrieval of soil water regime in the yellow river delta. Acta Pedol. Sin. 2015, 52, 1262–1272. [Google Scholar]
- Roy, D.; Zhang, H.; Ju, J.; Gomez-Dans, J.; Lewis, P.; Schaaf, C.; Sun, Q.; Li, J.; Huang, H.; Kovalskyy, V. A general method to normalize Landsat reflectance data to nadir BRDF adjusted reflectance. Remote. Sens. Environ. 2016, 176, 255–271. [Google Scholar] [CrossRef]
Publisher’s Note: MDPI stays neutral with regard to jurisdictional claims in published maps and institutional affiliations. |
© 2021 by the authors. Licensee MDPI, Basel, Switzerland. This article is an open access article distributed under the terms and conditions of the Creative Commons Attribution (CC BY) license (https://creativecommons.org/licenses/by/4.0/).