Abstract
The largest area of tropical rainforests in China is on Hainan Island, and it is an important part of the world’s tropical rainforests. The structure of the tropical rainforests in Hainan is complex, the biomass density is high, and conducting ground surveys is difficult, costly, and time-consuming. Remote sensing is a good monitoring method for biomass estimation. However, the saturation phenomenon of such data from different satellite sensors results in low forest biomass estimation accuracy in tropical rainforests with high biomass density. Based on environmental information, the biomass of permanent sample plots, and forest age, this study established a tropical rainforest database for Hainan. Forest age and 14 types of environmental information, combined with an enhanced vegetation index (EVI), were introduced to establish a tropical rainforest biomass estimation model for remote sensing that can overcome the saturation phenomenon present when using remote sensing data. The fitting determination coefficient of the model was 0.694. The remote sensing estimate of relative bias was 2.29%, and the relative root mean square error was 35.41%. The tropical rainforest biomass in Hainan Island is mainly distributed in the central mountainous and southern areas. The tropical rainforests in the northern and coastal areas have been severely damaged by tourism and real estate development. Particularly in low-altitude areas, large areas of tropical rainforest have been replaced by economic forests. Furthermore, the tropical rainforest areas in some cities and counties have decreased, affecting the increase in tropical rainforest biomass. On Hainan Island, there were few tropical rainforests in areas with high rainfall. Therefore, afforestation in these areas could maximize the ecological benefits of tropical rainforests. To further strengthen the protection, there is an urgent need to establish a feasible, reliable, and effective tropical rainforest loss assessment system using quantitative scientific methodologies.
1. Introduction
The rapidly increasing global population, land-use change, and large-area forest fires have resulted in a downward trend in global biomass in recent years [1,2,3,4,5]. With global warming, forest biomass could effectively delay the increase in carbon dioxide, which has attracted much attention [6,7]. Tropical rainforests in low latitudes account for 59% of the global forest biomass carbon sequestration [8,9]. The study of carbon sequestration by tropical rainforest biomass is of great significance for accurately assessing the global carbon cycle. Due to the complex canopy structure of tropical rainforests, it is difficult to estimate the biomass using traditional methods [6,10,11,12]. Additionally, owing to a lack of large-scale traditional sample plot investigations, few studies have monitored tropical rainforest biomass in large-scale spaces. Remote sensing technology can effectively monitor tropical rainforests in large-scale spaces. In addition, the use of remote sensing images to determine the distribution, type, growth, and other information of vegetation is a common measure to monitor dynamic changes in forest biomass [13].
At present, the normalized vegetation index (NDVI) and enhanced vegetation index (EVI) are generally used to estimate forest biomass by remote sensing [14,15]. However, NDVI is greatly affected by vegetation density and non-vegetation areas [16,17,18]. Experimental results have shown that NDVI performs poorly in estimating tropical rainforest biomass. The EVI algorithm is like the NDVI. However, EVI uses the new MODIS measurement method and has a better measurement capability. Moreover, EVI can avoid the errors caused by atmospheric disturbances and soil conditions, making it more sensitive to canopy changes in tropical rainforests [16].
In addition, scholars have improved the saturation phenomenon of forest biomass estimation with remote sensing over the years but have been limited to vegetation index extraction [19,20]. However, the heterogeneity of forest structures was the main factor in the saturation phenomenon in forest biomass estimation with remote sensing. In particular, environmental factors indirectly affect vegetation distribution, forest composition and structure, forest growth, and forest vegetation spectral characteristics [21,22]. At present, several remote sensing forest biomass estimation models are based on forest-related measurable factors. By introducing other information, such as environmental factors, to further improve the model structure, the accuracy of tropical rainforest biomass estimation with remote sensing can be improved.
This study is based on data from the continual investigation of forest resources from 2003 to 2018 in Hainan (a total of 133 typical tropical rainforest permanent sample plots in four periods) and field survey data of tropical rainforest biomass, combined with meteorological data, terrain data, soil data, and population density data over the past 15 years. It is worth noting that in large spaces, forest age is the most important factor in forest biomass estimation [23]. Through correlation analysis, this study screened 14 main environmental factors to establish a tropical rainforest database (environmental information database, permanent sample plots biomass database, and forest age database) in Hainan. A tropical rainforest biomass estimation model using remote sensing with environmental information was established according to the change process of tropical rainforest biomass with forest age. We aimed to study the spatial distribution pattern of biomass in Hainan from 2003 to 2018 to overcome the saturation phenomenon and improve the accuracy of tropical rainforest biomass estimation with remote sensing (Figure 1). This study can help improve the level of scientific and technological decision-making and management of tropical rainforest resources by quantitative means and lay a foundation for the scientific operation and management of tropical rainforest ecosystems.
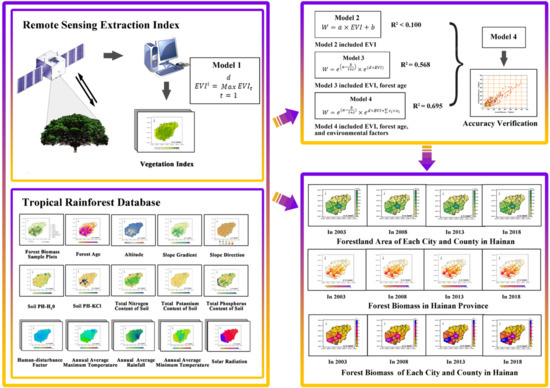
Figure 1.
Tropical rainforest biomass estimation with remote sensing.
2. Method
2.1. Establishment of Hainan Tropical Rainforest Database
Hainan Island in China is a special economic and pilot free-trade zone located on the northern edge of the Indo Malay Rainforest (18°09′–20°11′ N, 108°36′–111°04′ E). Hainan Island is composed of 18 cities and counties (Figure 2). The Hainan Island covers an area of 34,000 and has a forest coverage of 57.36%. It is the largest contiguous tropical rainforest in China.
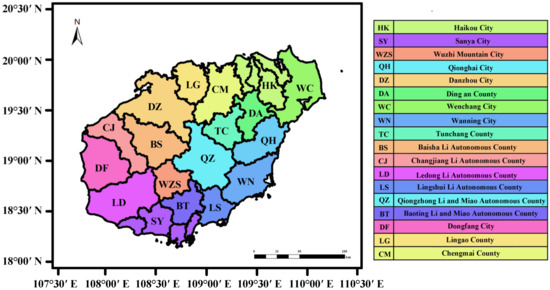
Figure 2.
Distribution of cities and counties on Hainan Island.
China’s National Forest Continuous Inventory takes provinces as a unit. In principle, a review is conducted every five years. The provinces where China’s National Forest Continuous Inventory is carried out every year are uniformly arranged by the competent forestry authorities under the State Council. Data of 133 permanent forest sample plots in Hainan Island were obtained from China’s National Forest Continuous Inventory in 2003, 2008, 2013, and 2018 (Figure 3). Reexamination should be carried out in the same year, and the results should be reported to the competent forestry authorities under the State Council two years later.
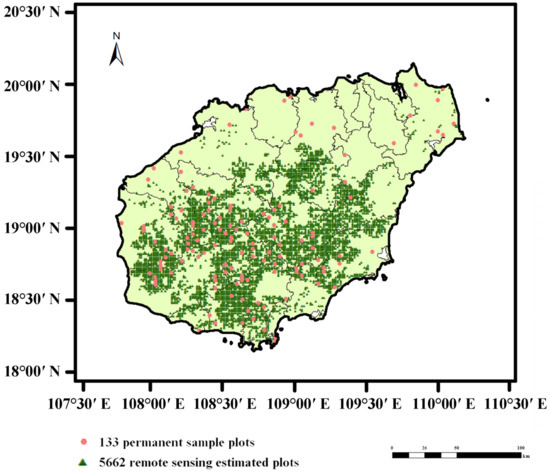
Figure 3.
Permanent sample plots and distribution of sample points estimated by remote sensing in Hainan Island.
Using ArcGIS 10.8 software, the database was established as follows: (1) Based on the daily observation data of 553 meteorological stations in Hainan Island from 2003 to 2018, a climate database (1 km resolution) consisting of annual average maximum temperature, annual average minimum temperature, and annual average rainfall was constructed by spatial interpolation. By providing a prototype of the dynamic climate data, a website is able to maintain local climate data in the local system, while another centralized website continuously updates the data through a public database and provides access to all website data [24]. (2) The Chinese soil science database was utilized (the reference before 1 January 2021) [25]. In this study, spatial interpolation was used to generate the soil types: , total nitrogen, potassium, and phosphorus contents, and other soil databases (2 km resolution). (3) Based on SRTM data and Hainan administrative boundary, a DEM terrain database (90 m resolution) [26] was generated. (4) Combining the population statistics data of Hainan Island for 2003, 2008, 2013, and 2018 with land-use types, night light brightness, and residential density, the population data were distributed to 3.06 million grids according to the multiple-factor weight distribution method, and a human-disturbance database (1 km resolution) of population dynamic evolution was generated by spatial interpolation [27]. In this way, the population of a specific area could be estimated by adding the population involved in each grid area. (5) Based on China’s National Forest Continuous Inventory data of Hainan for 2003, 2008, 2013, and 2018 [28] and Landsat 7 and Landsat 8 remote sensing image interpretation data in Hainan Island, a woodland range database (1 km resolution) consisting of woodland, shrubbery, economic forest, bamboo forest, and other woodlands was generated. (6) Based on China’s National Forest Continuous Inventory data of Hainan for 2003, 2008, 2013, and 2018 [28], 133 permanent sample plots were screened out, and the 133 permanent sample plots contained 16,280 sample trees. The forest biomass data of 70 main tropical rainforest tree species (280 trees) were collected using the standard tree full digging method [29]. A tropical rainforest biomass database of permanent sample plots was generated using the model; where denotes tropical rainforest biomass, is DBH, is tree height, and are parameters [29]. According to this model, we measured the forest biomass of 133 permanent plots in 2003, 2008, 2013 and 2018. Therefore, a forest biomass sample plot database for Hainan Island was established. (7) Based on the forest age from China’s National Forest Continuous Inventory data in Hainan (in 2018), the scope of the natural forest resource protection project in Hainan, manual visual interpretation data of Landsat historical remote sensing images, and a forest age database (1 km resolution) [30] were generated by spatial interpolation.
There were 14 pieces of environmental information involved in this study, all from the tropical rainforest database mentioned above (Figure 4). Among them, the annual average maximum temperature (°C), annual average minimum temperature (°C), and annual average rainfall (mm) were from the climate database. The information on soil , soil , total nitrogen content of the soil (%), total potassium content of the soil (%), and total phosphorus content of the soil (%) were all obtained from the soil database. The slope gradient (°), slope direction (°), and altitude (m) were obtained from the DEM terrain database. The human-disturbance factor (person/ha) was obtained from the human-disturbance database. Latitude (′ ′′) and longitude (′ ′′) were used for geographical registration between different data. In addition, tropical rainforest biomass was derived from the tropical rainforest biomass database. Forest age was taken from forest age database.
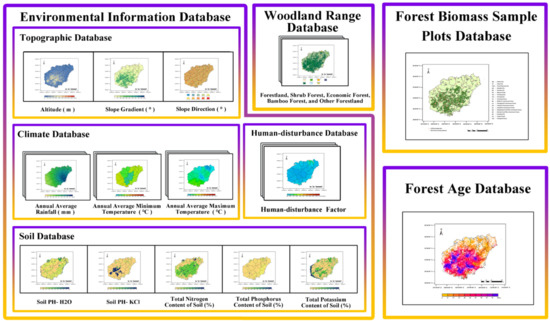
Figure 4.
Hainan tropical rainforest database.
2.2. Enhanced Vegetation Index Extraction Method Based on MODIS Product Data
In this study, the EVI index was calculated using MODIS product data provided by NASA [31]. The time and spatial resolutions were 16 days and 250 m [32], respectively, and the time series were 2003, 2008, 2013, and 2018. The product data of the study area covered by the image in each period includes two tile data points (h28v06 and h28v07). In addition, the vector image of Hainan was used to calculate a mask of the original image data. Using the batch processing function of the MODIS Reprojection Tool (MRT) software, the concatenation and projection of MODIS datasets (UTM zone 49n, WGS-84) was completed [33]. IDL programming technology [34] was used for vector clipping and other batch processing of the study area. Of the different image denoising methods in TIMESET, such as S-G filtering, asymmetric Gaussian fitting, and double logistic fitting, we used the S-G filter to preserve the image details. Furthermore, the algorithm was not limited by the data of the image itself, which improved the applicability of smoothing filtering.
At present, the strategy of using remote sensing estimation methods to calculate vegetation coverage mainly involves regression models, unit data value decomposition models, and the most used vegetation index methods. As there is a significant correlation between vegetation coverage and vegetation index, the unit data value dichotomy model (including 1%, 99%, and 5%, 95%) and maximum value composite (MVC) could be used to estimate the vegetation coverage. In this study, a MVC method was adopted to superimpose image layers with different cycles for each year, and the unit data value of each raster was taken as the maximum value among multiple cycle image layers, thus forming a method of synthesizing image data [33]. The calculation formula is as follows:
where is the maximum composite value of EVI in the year, which was also the highest value of vegetation coverage. is the value of vegetation coverage of each unit data value in each cycle, and each cycle is 16 days. As a result, there are 23 images per year (.
2.3. Establishment of the Tropical Rainforest Biomass Estimation Model for Remote Sensing in Hainan
Previous experiments, based on the commonly used tropical rainforest biomass remote sensing estimation linear model (Model 2), considered only EVI to estimate the tropical rainforest biomass:
where is the model fitting parameter, and is the constant. is the tropical rainforest biomass. Considering that EVI may be saturated in tropical rainforest biomass estimation with remote sensing, a tropical rainforest biomass estimation model for remote sensing (Model 3) with forest age was established:
where are the model fitting parameters of forest biomass change with forest age, and is forest age. is the model fitting parameter of the impact of EVI on forest biomass. Finally, the environmental factors indirectly affecting vegetation distribution, forest structure, forest growth, and forest vegetation spectral characteristics were introduced to establish a tropical rainforest biomass estimation model for remote sensing:
where is the model fitting parameter of the impact of environmental information on forest biomass, and is the environmental information, including latitude, longitude, average annual maximum temperature, average annual minimum temperature, annual average rainfall, slope gradient, slope direction, altitude, human-disturbance factor, soil , soil , and the total nitrogen, phosphorus, and potassium contents of the soil.
The three tropical rainforest biomass estimation models established in this study were all realized using IBM SPSS Statistics 25 software.
2.4. Data Preprocessing before Tropical Rainforest Biomass Estimation Model Fitting
In this study, Model 2, Model 3, and Model 4 were tested for multicollinearity. Among them, Model 2 was a linear model. The tolerance value and VIF value were 1.000 and 1.000, respectively. Model 3 and Model 4 were nonlinear models. The VIF value and tolerance value of EVI of Model 3 were 1.024 and 0.977, respectively. The VIF value and tolerance value of forest age were also 1.024 and 0.977, respectively. In Model 4, a multicollinearity analysis was performed using EVI, forest age, and 14 environmental factors. The VIF values of these 16 factors were between 1.215 and 7.248, and the tolerance values were between 0.138 and 0.823. The VIF values of the three models were all less than 10, and the tolerance values were between 0 and 1. The results showed that there was no multicollinearity in the three models. When different feature vectors come together, as a result of their own expression, the absolute value of the small data is negligible compared to that of the big data. This study needed to normalize the extracted features vector, ensuring that each feature vector was treated equally by the classifier (Table 1). The normalization of a feature vector was as follows: 1. Latitude (′ ′′): From north to south, Hainan Island stretches from Mulan Bay (northern latitude: ) to Jinmu Corner (northern latitude: ); 2. Longitude (′ ′′): From west to east, it stretches from Beibu Gulf (eastern latitude: ) to Tonggu Corner (eastern latitude: ); 3. Altitude (m): Wuzhishan is the highest mountain on Hainan Island, with a peak altitude of 1867.1 m, while the lowest altitude of Hainan Island is 0 m; 4. Annual average rainfall (mm): Over nearly 15 years, the annual average rainfall on Hainan Island from 2003 to 2018 was between 834 mm and 3404 mm; 5. Annual average minimum temperature (°C): The lowest annual average minimum temperature on Hainan Island from 2003 to 2018 was between 14.73 °C and 25 °C; 6. Annual average maximum temperature (°C); The annual average maximum temperature on Hainan Island from 2003 to 2018 was between 27.35 °C and 35.47 °C; 7. Slope gradient (°): The slope gradient was between 0° and 64.5°; 8. Slope direction (°): The slope direction was between 0° and 459°; 9. Human-disturbance factor (person/ha): The human-disturbance factor on Hainan Island from 2003 to 2018 was between 0.43 person/ha and 127.01 person/ha; 10. Soil : The soil on Hainan Island was between 0 and 14; 11. Soil : The soil on Hainan Island was between 0 and 14; 12. Total nitrogen content of the soil (%): The total nitrogen content of the soil on Hainan Island was between 0% and 0.67%; 13. Total phosphorus content of the soil (%): The total phosphorus content of the soil on Hainan Island was between 0% and 0.76%; 14. Total potassium content of the soil (%): The total potassium content of the soil in Hainan Island was between 0% and 4.40%.

Table 1.
Normalization formulas of the 14 environmental information variables.
3. Results
3.1. Fitting Results and Accuracy Evaluation of the Remote Sensing Estimation Model for Tropical Rainforest Biomass in Hainan
We used 399 fitting sample data points and 133 verification sample data points from 133 forest sample plots from phase 4 (in 2003, 2008, 2013, and 2018). Model 3 and Model 4 were developed and built based on 399 fitting sample data units. IBM SPSS Statistics 25 software was used to fit the tropical rainforest biomass estimation model for remote sensing. Combined with the forest age, environmental information, and remote sensing factor EVI, the goodness of fit significantly improved from Model 2 (< 0.100) to Model 3 ( = 0.568), and finally to Model 4 ( = 0.694). The estimated values, standard errors, and 95% confidence intervals of the parameters fitted by Model 3 are listed in Table 2. The estimated values, standard errors, and 95% confidence intervals of the parameters fitted by Model 4 are listed in Table 3. The results show that the human-disturbance factor had the strongest correlation with the tropical rainforest biomass estimation model in remote sensing. It was much higher than other environmental information. In addition to human interference with environmental information, the annual average rainfall, total phosphorus content of soil, longitude and tropical rainforest biomass estimation model for remote sensing were also strongly correlated. Annual average minimum temperature, soil and the tropical rainforest biomass estimation remote sensing model had a weak correlation.
Table 2.
Fitting results of the tropical rainforest biomass estimation remote sensing model (Model 3).
Table 3.
Fitting results of tropical rainforest biomass estimation remote sensing model (Model 4).
We used 133 verification sample data points to analyze the accuracy of Model 3 and Model 4. For verifying the accuracy of Model 4 estimation, the actual and remote sensing tropical rainforest biomass estimation values were compared and analyzed. We obtained Figure 5 through precision analysis. It can be seen from the figure that the estimated values are evenly distributed on both sides of the actual values. The of the verification accuracy of Model 3 was 0.631. The of the verification accuracy of Model 4 was 0.788, indicating good accuracy. Model 3’s Bias, relative Bias, root mean square error (RMSE), and relative root mean square error (RRMSE) were 6.376 Mg/ha, 3.619%, 88.565 Mg/ha, and 50.339%, respectively. Model 4’s Bias, relative Bias, RMSE, and RRMSE [35,36] were calculated as 4.920 Mg/ha, 2.796%, 67.459 Mg/ha, and 38.339%, respectively.
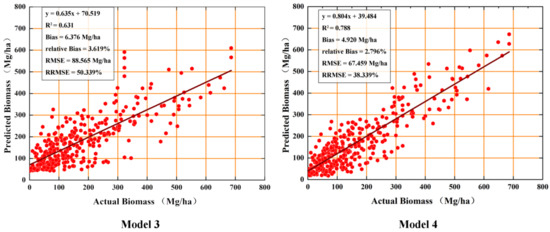
Figure 5.
Accuracy evaluation of the tropical rainforest biomass estimation model (Model 3 and Model 4) for remote sensing.
3.2. Spatial Pattern of Tropical Rainforest Biomass in Hainan
Based on the longitude and latitude of 5662 remote sensing estimation plots (Figure 3), EVI, forest age, and 14 main pieces of environmental information were extracted from the tropical rainforest database. The values of the 14 major environmental information variables collected from the databases of climate, topography, soil, and human-disturbance factors, and tropical rainforest biomass in 2003, 2008, 2013, and 2018, were estimated using the fitted tropical rainforest biomass estimation remote sensing model. A spatial pattern distribution of tropical rainforest biomass in Hainan was then generated using ordinary kriging spatial interpolation (Figure 6), with a spatial resolution of 2.0 km.
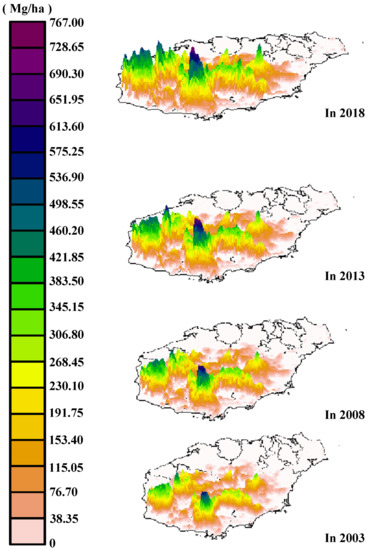
Figure 6.
Spatial pattern and distribution of tropical rainforest biomass in Hainan Island from 2003 to 2018.
The kriging method was used to interpolate the tropical rainforest biomass and forestland area (Mg/ha) of each city and county in Hainan Island, and the total tropical rainforest biomass and forestland area of 18 cities and counties were calculated (shown in Figure 7 and Figure 8). The administrative division of Hainan Island from 2003 to 2018 is shown in Figure 2, and the biomass distribution of the tropical rainforest on Hainan Island is shown in Figure 7. The tropical rainforest biomass distribution in Hainan’s cities and counties was inconsistent. In this study, the biomass distribution of the tropical rainforest in Hainan Island was ranked. The tropical rainforest biomass above 10 Tg was divided into the first gradient, which included Ledong Li Autonomous County, Qiongzhong Li and Miao Autonomous County, Wuzhishan City, Sanya City, Baoting Li and Miao Autonomous County, Baisha Li Autonomous County, and Dongfang City. Cities and counties with tropical rain forest biomass above 5 Tg were divided into the second gradient, namely, Changjiang Li Autonomous County, Qionghai City, Wanning City, and Lingshui Li Autonomous County. Cities and counties with biomass below 5 Tg were divided into the third gradient, and they are Tunchang County, Wenchang City, Danzhou City, Chengmai County, Ding’an County, Haikou City, and Lingao County. The tropical rainforest biomass in all cities and counties increased annually, and Ledong Li Autonomous County had the fastest growth rate.
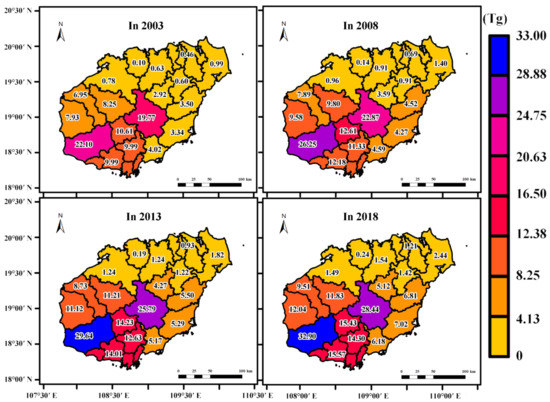
Figure 7.
Distribution of tropical rainforest biomass in different cities and counties in Hainan Island from 2003 to 2018.
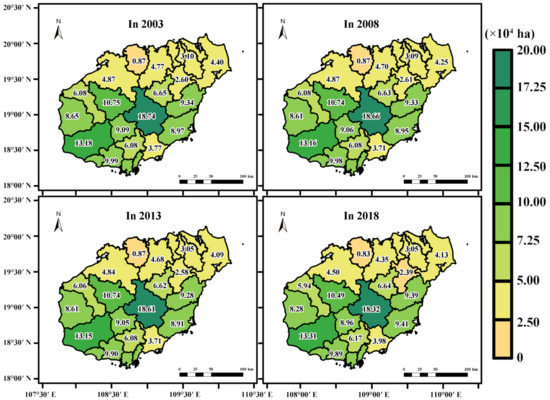
Figure 8.
Distribution of Forestland area in different cities and counties in Hainan Island from 2003 to 2018.
The administrative division of Hainan Island is shown in Figure 2, from 2003 to 2018, and the forested area of Hainan Island is shown in Figure 8. The forestland area is concentrated in the central part of Hainan. We classified the forestland area in different cities and counties of Hainan Island. The forestland area of the first gradient was more than ha, which included Qiongzhong Li and Miao Autonomous County, Ledong Li Autonomous County, and Baisha Li Autonomous County. The cities and counties with a forestland area of more than ha were divided into the second gradient, namely Sanya City, Wanning City, Qionghai City, Wuzhishan City, Dongfang City, Tunchang County, Baoting Li and Miao Autonomous County, and Changjiang Li Autonomous County. The cities and counties with a forestland area of less than ha were divided into the third gradient, namely Danzhou City, Chengmai County, Wenchang City, Lingshui Li Autonomous County, Ding’an County, Linggao County, and Haikou City. Except for Lingshui Li Autonomous County, Baoting Li and Miao Autonomous County, Qionghai City, Wanning City, and Ledong Li Autonomous County, the woodland areas of other cities and counties showed a downward trend. Among them, from 2003 to 2018, Qiongzhong Li and Miao Autonomous County was the most seriously damaged forestland area.
From 2013 to 2018, the forestland area in some cities and counties decreased rapidly. The most destructive cities and counties were Danzhou City, Chengmai County, Dongfang City, Qiongzhong Li and Miao Autonomous County, Baisha Li Autonomous County, Ding’an County, Changjiang Li Autonomous County, Wuzhishan City, Lingao County, Sanya City, and Haikou City.
The specific changes of tropical rainforest biomass and forestland area in each city and county of Hainan Island from 2003 to 2018 are shown in Figure A1 of Appendix A.
4. Discussion
4.1. Feasibility Analysis of Introducing Environmental Information to Estimate Forest Biomass
The common forest biomass estimation methods with remote sensing include adjusting features, such as remote sensing color band, parameters, and texture (Table 4). The choice of research methods has a significant effect on forest biomass estimation in the temperate zone. However, in tropical rainforests with complex forest structures, the effect of remote sensing estimation was not significant. Foody used a neural network to estimate tropical rainforest biomass in Borneo, Malaysia. However, the remote sensing data of some plots were affected by clouds or cloud shadows, resulting in a small number of samples [37]. Rödig used a forest model to estimate the change in tropical rainforest biomass in the Amazon, combined with remote sensing and field work to improve the accuracy. However, this method underestimated approximately 15% of biomass [38]. Sambatti used airborne InSAR to estimate Amazon’s tropical rainforest biomass and found that the best results were obtained by using X-band and P-band InSAR [39]. Hansen used airborne laser scanning (ALS) to model tropical rainforest forest biomass in Tanzania, and it was effective under extreme conditions of tropical rainforests [40]. However, the high cost of lidar and airborne InSAR, as well as the lack of data in some periods and tropical regions, were not conducive to tropical rainforest biomass estimation in Hainan from 2003 to 2018.
Table 4.
Comparative analysis of forest biomass estimation with remote sensing.
The most commonly used vegetation information measures for forest biomass estimation with remote sensing have been NDVI and EVI. Motlagh used Spot-6 satellite images and a regression model to analyze the accuracy measurement results of NDVI, RVI, and TVI on the forest biomass of Helka forest in northern Iran and concluded that NDVI had the highest accuracy [41]. However, NDVI is easily affected by the forest canopy, soil, atmospheric molecules, and excessive forest biomass [42,43], especially in tropical rainforests, which is close to saturation due to the complex canopy structure [44,45,46]. Bhardwaj also confirmed that NDVI might not be a reliable method for estimating forest biomass carbon storage in Himalayan subtropical forests [1]. For improving the sensitivity of tropical rainforest biomass estimation, the EVI was selected in this study. EVI could minimize soil brightness by introducing background adjustment parameters and atmospheric correction parameters to increase sensitivity to differences in forest canopy density. Moreover, EVI introduced a blue-light band, which could reduce the influence of the atmosphere using the difference in aerosol scattering between the blue- and red-light bands [47]. EVI was better than NDVI when used to extract vegetation information from remote sensing images, and it could filter out impurities outside the vegetation information.
However, neither NDVI nor EVI could overcome the saturation phenomenon of forest biomass estimation using remote sensing. Shen studied the relationship between forest coverage and forest biomass and found no significant correlation between aboveground biomass and EVI and NDVI when the canopy was covered with high flower density [47], and the RMSE of forest biomass estimation was low. Anaya also proved that there was no significant correlation between EVI and tropical rainforest biomass, even when the parameters were adjusted [48]. Eckert used Pearson’s correlation analysis and stepwise multiple linear regression analysis to determine the correlation between forest biomass and EVI. Based on the spectral and texture information of Worldview-2, the model was established, and the accuracy of the degraded forests was found to be higher than that of non-degraded forests [49]. This further proved that when the forest biomass density is high, the EVI would produce the saturation phenomenon in remote sensing estimation.
Propastin used NDVI to simulate the spatial relationship between vegetation and rainfall in central Sulawesi Island and concluded that the spatial change in the study area was caused by the difference in potential environmental factors (such as the vegetation composition, soil type, hydrology, and land use) caused by terrain diversity [50]. Therefore, this study considered introducing environmental information to estimate tropical rainforest biomass. In addition, Propastin added altitude when estimating forest biomass with the remote sensing multispectral vegetation index (VI), which improved the accuracy of the traditional GWR model [51]. This indirectly showed the feasibility of introducing environmental information into this study to improve tropical rainforest biomass estimation accuracy.
In this study, only 14 main environmental factors, including climate, topography, soil, and human-disturbance factors, were considered for tropical rainforest biomass estimation. With an in-depth investigation of tropical rainforest resources and environment, the Hainan tropical rainforest database could be further improved by considering natural disasters and other environmental information. Therefore, future research should use a multimodal data fusion method to carry out feature fusion of all environmental information, such as meteorological fusion factors, topographic fusion factors, soil fusion factors, natural disaster fusion factors, and human-disturbance factors, before tropical rainforest biomass remote sensing estimation model fitting. This can avoid not only the over-fitting problem but also ensure further improvement in the accuracy of tropical rainforest biomass estimation with remote sensing.
4.2. Evaluation and Analysis of the Spatial Pattern of Tropical Rainforest Biomass in Hainan
In this study, the ordinary kriging interpolation method was used to perform the difference analysis, as shown in Figure 9. From 2003 to 2018, the tropical rainforest biomass in Hainan was mainly distributed in the central mountainous area and southern area of Hainan, including Qiongzhong, Wuzhishan, Baisha, Changjiang, Dongfang, Ledong, and Tunchang. Only a few tropical rainforests are distributed in the northern and coastal areas, and the proportion of non-forest land was large, especially in the coastal areas of Wenchang, Haikou, Ding’an County, Chengmai County, Lingao County, Sanya City, Ledong Li, Miao Autonomous County, and Wanning City, which are close to the coastline. It was found that human-disturbance has a strong correlation with biomass, which is mainly reflected in the destruction of natural forestland areas. Indeed, from 2003 to 2015, land utilization changed in Hainan Island; with the development of tourism, the conversion of cultivated land to construction land took place in coastal plain areas, and the conversion of woodland to farmland mainly took place in the east, northwest, and southeast of Hainan. For income, the local government converted farmland into forests in Hainan, with coconut forests in the northeast, eucalyptus forests in the west, and rubber forests in the northwest [52]. The tropical rainforests in northern Hainan were largely replaced by economic forests. However, owing to the strong carbon sequestration, the tropical rainforest biomass in Hainan showed an increasing trend. The forestland area fluctuated greatly every year, and the forestland area decreased in some cities and counties, which slowed further increases in the tropical rainforest biomass. As the tropical rainforests were challenging to repair, the ecological loss caused by the reduction of tropical rainforest areas needs to be further evaluated.
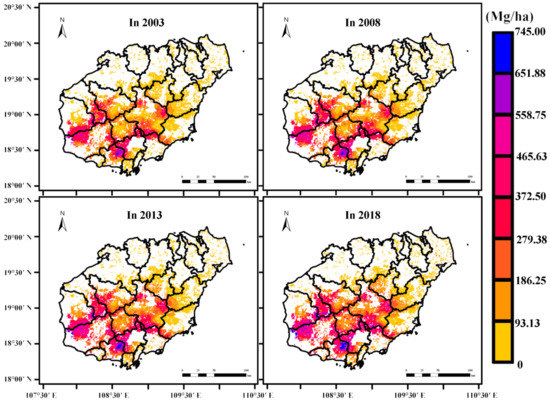
Figure 9.
Distribution of forestland area and tropical rainforest biomass in Hainan Island from 2003 to 2018.
The year 2013 witnessed severe changes in the tropical rainforest areas in Hainan. The main reason was that Hainan concentrated on developing tourism and the real estate industry as its main economy during this period, which seriously damaged the coastal tropical rainforests. In addition, low-altitude natural forests were at risk of being replaced by economic forests, such as fruit trees [53]. However, in Wanning City, Lingshui Li and Miao Autonomous County, Wenchang City, Haikou City, and Lingao County the forestland area gradually recovered. Part of the reason for this was the establishment of nature reserves. From 2000 to 2010, the forest area in nature reserves showed an increasing trend, while the adjacent unprotected areas and wider unprotected areas experienced deforestation [54]. The development of real estate in these areas was another concern. For maintaining the overall ecological balance of Hainan, the local government increased the area of forested land, but the area of restoration was far less than that of destruction. In addition, the ecological loss caused by replacing the destroyed natural rainforest with artificial rainforests needs to be further evaluated.
To meet the ecological civilization model advocated by Hainan, cities and counties with low woodland areas and high damage need to consider afforestation and ecological restoration in non-woodland and parts of unused construction land. From the fitting parameters of the tropical rainforest biomass estimation remote sensing model, the areas with large annual average rainfall had fewer tropical rainforests. However, sufficient rainfall would make the carbon sequestration of tropical rainforest biomass more evident [55]. Local governments could prioritize afforestation and ecological restoration in areas with abundant rainfall. In addition, tropical rainforest biomass is generally proportional to biodiversity [38]. The areas with high tropical rainforest biomass were suitable for adding nature reserves to strengthen the protection of tropical rainforests further, for example, in the north of Sanya City, in the west of Baoting Li and Miao Autonomous County, in the south of Wuzhishan City, in the south of Tunchang County, and in the south of Ding’an County.
5. Conclusions
To overcome the saturation phenomenon of tropical rainforest biomass estimation with remote sensing and improve the accuracy of spatial distribution estimation of tropical rainforests in Hainan Island, this study established the Hainan tropical rainforest database and introduced a tropical rainforest biomass estimation model that uses EVI, forest age, and 14 environmental variables for remote sensing. Based on this model, the temporal and spatial patterns of the tropical rainforest biomass in Hainan Island from 2003 to 2018 were evaluated and analyzed. This was a breakthrough attempt to estimate the spatial distribution of tropical rainforests on a large scale. Considering that Hainan will soon become a global free-trade port, any future development trends should effectively balance economic development and environmental protection. Future work will consider further improving the Hainan tropical rainforest database and increasing environmental information to improve the accuracy of tropical rainforest biomass estimation. This study can lay the foundation for using scientific and technological tools in the decision-making process and management of tropical rainforests. In addition, despite the construction of artificial tropical rainforests, the area of tropical rainforests in Hainan was found to have decreased annually, making it difficult to reach the previous ecological level. Therefore, establishing an ecological loss evaluation system for tropical rainforests will be an important future research direction.
Author Contributions
Conceived the research route, Z.Q.; designed, and performed the experiments, Z.Q., M.L., Q.L., Y.S., C.W., H.P., T.L. and W.G.; analyzed the data and wrote the main manuscript, Z.Q., M.L. and Q.L. All authors have read and agreed to the published version of the manuscript.
Funding
This research was funded by “Hainan Provincial Natural Science Foundation of China, grant number 320QN185”, “Scientific Research Staring Foundation of Hainan University, grant number KYQD(ZR)20056, grant number KYQD(ZR)20058 and grant number KYQD(ZR)1863” and “National College Student Innovation and Entrepreneurship Training Program of China, grant number 202010589055”.
Institutional Review Board Statement
Not applicable.
Informed Consent Statement
Not applicable.
Data Availability Statement
Data available in a publicly accessible repository that does not issue DOIs Publicly available datasets were analyzed in this study. This data can be found here: http://www.zixuanqiu.com/nd.jsp?id=24#_np=105_462 (accessed on 27 April 2021).
Conflicts of Interest
The authors declare no conflict of interest.
Appendix A
Histograms showing the forest biomass of each city and county in Hainan Island, and line charts showing the forest area of each city and county in Hainan Island.


Figure A1.
Trends of biomass and forestland area of tropical rainforest in different cities and counties in Hainan Island from 2003 to 2018.
References
- Bhardwaj, D.; Banday, M.; Pala, N.A.; Rajput, B.S. Variation of biomass and carbon pool with NDVI and altitude in sub-tropical forests of northwestern Himalaya. Environ. Monit. Assess. 2016, 188, 1–13. [Google Scholar] [CrossRef]
- Houghton, R.; Hall, F.; Goetz, S.J. Importance of biomass in the global carbon cycle. J. Geophys. Res. Biogeosci. 2009, 114. [Google Scholar] [CrossRef]
- Lambin, E.F.; Meyfroidt, P. Global land use change, economic globalization, and the looming land scarcity. Proc. Natl. Acad. Sci. USA 2011, 108, 3465–3472. [Google Scholar] [CrossRef]
- Henders, S.; Persson, U.M.; Kastner, T. Trading forests: Land-use change and carbon emissions embodied in production and exports of forest-risk commodities. Environ. Res. Lett. 2015, 10, 125012. [Google Scholar] [CrossRef]
- Shi, Y.; Zang, S.; Matsunaga, T.; Yamaguchi, Y. A multi-year and high-resolution inventory of biomass burning emissions in tropical continents from 2001–2017 based on satellite observations. J. Clean. Prod. 2020, 122511. [Google Scholar] [CrossRef]
- Lu, D. Aboveground biomass estimation using Landsat TM data in the Brazilian Amazon. Int. J. Remote Sens. 2005, 26, 2509–2525. [Google Scholar] [CrossRef]
- Huang, L.; Zhou, M.; Lv, J.; Chen, K. Trends in global research in forest carbon sequestration: A bibliometric analysis. J. Clean. Prod. 2020, 252, 119908. [Google Scholar] [CrossRef]
- Dixon, R.K.; Solomon, A.; Brown, S.; Houghton, R.; Trexier, M.; Wisniewski, J. Carbon pools and flux of global forest ecosystems. Science 1994, 263, 185–190. [Google Scholar] [CrossRef] [PubMed]
- Clark, D.B.; Kellner, J.R. Tropical forest biomass estimation and the fallacy of misplaced concreteness. J. Veg. Sci. 2012, 23, 1191–1196. [Google Scholar] [CrossRef]
- Houghton, R. Aboveground forest biomass and the global carbon balance. Glob. Chang. Biol. 2005, 11, 945–958. [Google Scholar] [CrossRef]
- Foody, G.M.; Boyd, D.S.; Cutler, M.E. Predictive relations of tropical forest biomass from Landsat TM data and their transferability between regions. Remote Sens. Environ. 2003, 85, 463–474. [Google Scholar] [CrossRef]
- Thakur, S.; Mondal, I.; Bar, S.; Nandi, S.; Ghosh, P.; Das, P.; De, T. Shoreline changes and its impact on the mangrove ecosystems of some islands of Indian Sundarbans, North-East coast of India. J. Clean. Prod. 2020, 284, 124764. [Google Scholar] [CrossRef]
- Clevers, J.G.; Kooistra, L.; Schaepman, M.E. Estimating canopy water content using hyperspectral remote sensing data. Int. J. Appl. Earth Obs. Geoinf. 2010, 12, 119–125. [Google Scholar] [CrossRef]
- Ogaya, R.; Barbeta, A.; Başnou, C.; Peñuelas, J. Satellite data as indicators of tree biomass growth and forest dieback in a Mediterranean holm oak forest. Ann. For. Sci. 2015, 72, 135–144. [Google Scholar] [CrossRef]
- Pandey, P.C.; Anand, A.; Srivastava, P.K. Spatial distribution of mangrove forest species and biomass assessment using field inventory and earth observation hyperspectral data. Biodivers. Conserv. 2019, 28, 2143–2162. [Google Scholar] [CrossRef]
- Huete, A.; Didan, K.; Miura, T.; Rodriguez, E.P.; Gao, X.; Ferreira, L.G. Overview of the radiometric and biophysical performance of the MODIS vegetation indices. Remote Sens. Environ. 2002, 83, 195–213. [Google Scholar] [CrossRef]
- Matsushita, B.; Yang, W.; Chen, J.; Onda, Y.; Qiu, G. Sensitivity of the enhanced vegetation index (EVI) and normalized difference vegetation index (NDVI) to topographic effects: A case study in high-density cypress forest. Sensors 2007, 7, 2636–2651. [Google Scholar] [CrossRef] [PubMed]
- Garroutte, E.L.; Hansen, A.J.; Lawrence, R.L. Using NDVI and EVI to map spatiotemporal variation in the biomass and quality of forage for migratory elk in the Greater Yellowstone Ecosystem. Remote Sens. 2016, 8, 404. [Google Scholar] [CrossRef]
- Kelsey, K.C.; Neff, J.C. Estimates of aboveground biomass from texture analysis of Landsat imagery. Remote Sens. 2014, 6, 6407–6422. [Google Scholar] [CrossRef]
- Dube, T.; Mutanga, O. Investigating the robustness of the new Landsat-8 Operational Land Imager derived texture metrics in estimating plantation forest aboveground biomass in resource constrained areas. ISPRS J. Photogramm. Remote Sens. 2015, 108, 12–32. [Google Scholar] [CrossRef]
- Ou, G.; Li, C.; Lv, Y.; Wei, A.; Xiong, H.; Xu, H.; Wang, G. Improving aboveground biomass estimation of Pinus densata forests in Yunnan using Landsat 8 imagery by incorporating age dummy variable and method comparison. Remote Sens. 2019, 11, 738. [Google Scholar] [CrossRef]
- Zhao, P.; Lu, D.; Wang, G.; Wu, C.; Huang, Y.; Yu, S. Examining spectral reflectance saturation in Landsat imagery and corresponding solutions to improve forest aboveground biomass estimation. Remote Sens. 2016, 8, 469. [Google Scholar] [CrossRef]
- Hernández-Stefanoni, J.L.; Dupuy, J.M.; Tun-Dzul, F.; May-Pat, F. Influence of landscape structure and stand age on species density and biomass of a tropical dry forest across spatial scales. Landsc. Ecol. 2011, 26, 355–370. [Google Scholar] [CrossRef]
- Henshaw, D.L.; Stubbs, M.; Benson, B.J.; Blodgett, D. Climate database project: A strategy for improving information access across research sites. Kango Gijutsu: Nursing Technique 1998. Available online: http://www.ecoinformatics.org/pubs/guide/frame.htm (accessed on 25 April 2021).
- Nanjing Institute of Soil Science, Chinese Academy of Sciences. China Soil Science Database. 2021. Available online: http://vdb3.soil.csdb.cn/ (accessed on 1 January 2021). (In Chinese).
- Zhang, T.; Xu, X.; Xu, S. Method of establishing an underwater digital elevation terrain based on kriging interpolation. Measurement 2015, 63, 287–298. [Google Scholar] [CrossRef]
- Dong, C.; Zhao, R.; Liu, J.P.; Wang, G.X.; Wu, X.Z. Application of geographical parameter database to establishment of unit population database. Chin. Geogr. Sci. 2003, 13, 34–38. Available online: https://link.springer.com/article/10.1007/s11769-003-0058-8 (accessed on 25 April 2021). [CrossRef]
- Xie, X.; Wang, Q.; Dai, L.; Su, D.; Ye, Y. Application of China’s national forest continuous inventory database. Environ. Manag. 2011, 48, 1095–1106. Available online: https://link.springer.com/content/pdf/10.1007/s00267-011-9716- (accessed on 25 April 2021).
- Chen, D.; Li, Y.; Liu, H.; Xu, H.; Xiao, W.; Luo, T.; Zhang, Z.; Lin, M. Biomass and carbon dynamics of a tropical mountain rain forest in China. Sci. China Life Sci. 2010, 53, 798–810. [Google Scholar] [CrossRef]
- Besnard, S.; Carvalhais, N.; Arain, M.A.; Black, A.; De Bruin, S.; Buchmann, N.; Cescatti, A.; Chen, J.; Clevers, J.; Desai, A.; et al. Quantifying the effect of forest age in annual net forest carbon balance. Environ. Res. Lett. 2018, 13, 124018. [Google Scholar] [CrossRef]
- Justice, C.O.; Townshend, J.; Vermote, E.F.; Masuoka, E.; Wolfe, R.E.; Saleous, N.; Roy, D.P.; Morisette, J.T. An overview of modis land data processing and product status. Remote Sens. Environ. 2002, 83, 3–15. [Google Scholar] [CrossRef]
- Zhang, J.; Feng, L.; Yao, F. Improved maize cultivated area estimation over a large scale combining MODIS–EVI time series data and crop phenological information. ISPRS J. Photogramm. Remote Sens. 2014, 94, 102–113. [Google Scholar] [CrossRef]
- Wang, L. Analysis of vegetation coverage change in Huaihe River Basin Based on MODIS-NDVI and MODIS–EVI. Chin. Acad. J. 2020, 21, 438–446. (In Chinese) [Google Scholar] [CrossRef]
- Zhou, G.; Xu, D.; Yang, Y.; Liu, Z.; Fu, S. Image Automatic Registration Technology Based on IDL Programming and GCPs Image Database. Remote Sens. Technol. Appl. 2010, 5, 627–631. (In Chinese) [Google Scholar] [CrossRef]
- Qiu, Z.; Feng, Z.; Jiang, J.; Lin, Y.; Xue, S. Application of a continuous terrestrial photogrammetric measurement system for plot monitoring in the Beijing Songshan national nature reserve. Remote Sens. 2018, 10, 1080. [Google Scholar] [CrossRef]
- Qiu, Z.; Feng, Z.-K.; Wang, M.; Li, Z.; Lu, C. Application of UAV photogrammetric system for monitoring ancient tree communities in Beijing. Forests 2018, 9, 735. [Google Scholar] [CrossRef]
- Foody, G.M.; Cutler, M.E.; McMorrow, J.; Pelz, D.; Tangki, H.; Boyd, D.S.; Douglas, I. Mapping the biomass of Bornean tropical rain forest from remotely sensed data. Glob. Ecol. Biogeogr. 2001, 10, 379–387. [Google Scholar] [CrossRef]
- Rödig, E.; Cuntz, M.; Heinke, J.; Rammig, A.; Huth, A. Spatial heterogeneity of biomass and forest structure of the Amazon rain forest: Linking remote sensing, forest modelling and field inventory. Glob. Ecol. Biogeogr. 2017, 26, 1292–1302. [Google Scholar] [CrossRef]
- Sambatti, J.; Leduc, R.; Lubeck, D.; Moreira, J.; Santos, J. Assessing Forest Biomass and Exploration in the Brazilian Amazon with Airborne InSAR: An Alternative for REDD. Open Remote Sens. J. 2012, 5, 21–36. [Google Scholar] [CrossRef]
- Hansen, E.H.; Gobakken, T.; Bollandsås, O.M.; Zahabu, E.; Næsset, E. Modeling aboveground biomass in dense tropical submontane rainforest using airborne laser scanner data. Remote Sens. 2015, 7, 788–807. [Google Scholar] [CrossRef]
- Motlagh, M.G.; Kafaky, S.B.; Mataji, A.; Akhavan, R. Estimating and mapping forest biomass using regression models and Spot-6 images (case study: Hyrcanian forests of north of Iran). Environ. Monit. Assess. 2018, 190, 1–14. [Google Scholar] [CrossRef]
- Wang, D.; Morton, D.; Masek, J.; Wu, A.; Nagol, J.; Xiong, X.; Levy, R.; Vermote, E.; Wolfe, R. Impact of sensor degradation on the MODIS NDVI time series. Remote Sens. Environ. 2012, 119, 55–61. [Google Scholar] [CrossRef]
- Karkauskaite, P.; Tagesson, T.; Fensholt, R. Evaluation of the plant phenology index (PPI), NDVI and EVI for start-of-season trend analysis of the Northern Hemisphere boreal zone. Remote Sens. 2017, 9, 485. [Google Scholar] [CrossRef]
- Viovy, N.; Arino, O.; Belward, A. The Best Index Slope Extraction (BISE): A method for reducing noise in NDVI time-series. Int. J. Remote Sens. 1992, 13, 1585–1590. [Google Scholar] [CrossRef]
- Tian, F.; Brandt, M.; Liu, Y.Y.; Verger, A.; Tagesson, T.; Diouf, A.A.; Rasmussen, K.; Mbow, C.; Wang, Y.; Fensholt, R. Remote sensing of vegetation dynamics in drylands: Evaluating vegetation optical depth (VOD) using AVHRR NDVI and in situ green biomass data over West African Sahel. Remote Sens. Environ. 2016, 177, 265–276. [Google Scholar] [CrossRef]
- Jiang, Z.; Huete, A.R.; Didan, K.; Miura, T. Development of a two-band enhanced vegetation index without a blue band. Remote Sens. Environ. 2008, 112, 3833–3845. [Google Scholar] [CrossRef]
- Shen, M.; Chen, J.; Zhu, X.; Tang, Y.; Chen, X. Do flowers affect biomass estimate accuracy from NDVI and EVI? Int. J. Remote Sens. 2010, 31, 2139–2149. [Google Scholar] [CrossRef]
- Anaya, J.A.; Chuvieco, E.; Palacios-Orueta, A. Aboveground biomass assessment in Colombia: A remote sensing approach. For. Ecol. Manag. 2009, 257, 1237–1246. [Google Scholar] [CrossRef]
- Eckert, S. Improved forest biomass and carbon estimations using texture measures from WorldView-2 satellite data. Remote Sens. 2012, 4, 810–829. [Google Scholar] [CrossRef]
- Propastin, P.; Kappas, M.; Erasmi, S. Application of geographically weighted regression to investigate the impact of scale on prediction uncertainty by modelling relationship between vegetation and climate. Int. J. Spat. Data Infrastruct. Res. 2008, 3, 73–94. [Google Scholar] [CrossRef]
- Propastin, P. Modifying geographically weighted regression for estimating aboveground biomass in tropical rainforests by multispectral remote sensing data. Int. J. Appl. Earth Obs. Geoinf. 2012, 18, 82–90. [Google Scholar] [CrossRef]
- Sun, R.; Wu, Z.; Chen, B.; Yang, C.; Qi, D.; Lan, G.; Fraedrich, K. Effects of land-use change on eco-environmental quality in Hainan Island, China. Ecol. Indic. 2020, 109, 105777. [Google Scholar] [CrossRef]
- Wang, J.; Liu, Y. Tourism-led land-use changes and their environmental effects in the southern coastal region of Hainan Island, China. J. Coast. Res. 2013, 29, 1118–1125. [Google Scholar] [CrossRef]
- Wang, W.; Pechacek, P.; Zhang, M.; Xiao, N.; Zhu, J.; Li, J. Effectiveness of nature reserve system for conserving tropical forests: A statistical evaluation of Hainan Island, China. PLoS ONE 2013, 8, e57561. [Google Scholar] [CrossRef] [PubMed]
- Hilker, T.; Lyapustin, A.I.; Tucker, C.J.; Hall, F.G.; Myneni, R.B.; Wang, Y.; Bi, J.; de Moura, Y.M.; Sellers, P.J. Vegetation dynamics and rainfall sensitivity of the Amazon. Proc. Natl. Acad. Sci. USA 2014, 111, 16041–16046. [Google Scholar] [CrossRef] [PubMed]
Publisher’s Note: MDPI stays neutral with regard to jurisdictional claims in published maps and institutional affiliations. |
© 2021 by the authors. Licensee MDPI, Basel, Switzerland. This article is an open access article distributed under the terms and conditions of the Creative Commons Attribution (CC BY) license (https://creativecommons.org/licenses/by/4.0/).