Article

Detecting Recent Crop Phenology Dynamics in Corn and Soybean Cropping Systems of Kentucky

1
Department of Plant and Soil Sciences, College of Agriculture, Food and Environment, University of Kentucky, Lexington, KY 40546, USA
2
Department of Geography, College of Arts & Sciences, University of Kentucky, Lexington, KY 40506, USA
3
Department of Biosystems and Agricultural Engineering, College of Agriculture, Food and Environment, University of Kentucky, Lexington, KY 40546, USA
4
Department of Earth and Environmental Sciences, Murray State University, Murray, KY 42071, USA
*
Author to whom correspondence should be addressed.
Remote Sens. 2021, 13(9), 1615; https://doi.org/10.3390/rs13091615
Submission received: 15 March 2021 / Revised: 16 April 2021 / Accepted: 17 April 2021 / Published: 21 April 2021

Abstract

:
Accurate phenological information is essential for monitoring crop development, predicting crop yield, and enhancing resilience to cope with climate change. This study employed a curve-change-based dynamic threshold approach on NDVI (Normalized Differential Vegetation Index) time series to detect the planting and harvesting dates for corn and soybean in Kentucky, a typical climatic transition zone, from 2000 to 2018. We compared satellite-based estimates with ground observations and performed trend analyses of crop phenological stages over the study period to analyze their relationships with climate change and crop yields. Our results showed that corn and soybean planting dates were delayed by 0.01 and 0.07 days/year, respectively. Corn harvesting dates were also delayed at a rate of 0.67 days/year, while advanced soybean harvesting occurred at a rate of 0.05 days/year. The growing season length has increased considerably at a rate of 0.66 days/year for corn and was shortened by 0.12 days/year for soybean. Sensitivity analysis showed that planting dates were more sensitive to the early season temperature, while harvesting dates were significantly correlated with temperature over the entire growing season. In terms of the changing climatic factors, only the increased summer precipitation was statistically related to the delayed corn harvesting dates in Kentucky. Further analysis showed that the increased corn yield was significantly correlated with the delayed harvesting dates (1.37 Bu/acre per day) and extended growing season length (1.67 Bu/acre per day). Our results suggested that seasonal climate change (e.g., summer precipitation) was the main factor influencing crop phenological trends, particularly corn harvesting in Kentucky over the study period. We also highlighted the critical role of changing crop phenology in constraining crop production, which needs further efforts for optimizing crop management practices.

Graphical Abstract

1. Introduction

Vegetation phenology is defined as the development, differentiation, and initiation of plant organs [1]. Accurate retrieval of crop phenology information is a prerequisite for evaluating crop adaptation to climate change, modeling agricultural ecosystem carbon exchange, and predicting future agricultural production [2,3,4,5]. The Intergovernmental Panel on Climate Change has reported a change in global mean temperature of 1.5 °C above pre-industrial levels, along with changes in precipitation and an increased frequency of extreme climate events (IPCC, 2018). This shift in climate may bring varying degrees of impacts on agricultural ecosystems at different temporal and spatial scales. Crop phenology is closely related to climate change and is a critical indicator of optimum yield [6,7]. Therefore, it is essential to consider changes in crop phenology when assessing climate impacts on agricultural productivity, carbon cycling, and land-atmosphere feedbacks [8,9].
Many studies have shown that the climate impacts on agricultural ecosystems are reflected by variations in crop phenology, such as the advanced or delayed planting and harvesting dates [10,11,12]. For example, He et al. [13] reported that soybean planting dates were delayed by an average of 1.78 days/decade, and the growing season length was shortened by an average of 1.16 days/decade during 1981–2010 across the major soybean-producing areas in China. Climate warming is a primary factor that drives phenological shifts [14], with temperature responses varying with crop types, locations, and study periods [15,16]. Many studies have investigated the responses of crop phenology to historical climate warming at regional to global scales. For example, Estrella et al. [17] reported that corn and oats sowing dates in Germany advanced in response to increases in March–May temperature at a rate of 0.60 days/°C and 4.15 days/°C, respectively. Based on corn phenology observations collected from agro-meteorological stations in China, Tao et al. [18] reported that the growing season lengthened during 1981–2009 due to combined effects of warming temperature, changing field practices, and shifting varieties. Model simulation results from Tubiello et al. [19] have shown that warmer temperatures accelerated plant phenology and further shortened the crop growing period, which resulted in crop yield reduction and potential food insecurity. Nevertheless, other climatic factors such as precipitation could determine the planting date more directly than the temperature in some regions [20,21]; however, few studies have explored the crop phenological changes and their relations with precipitation.
Remote sensing imagery can be considered an essential tool that complements field-based data collection approaches [22]. Numerous studies have reported the use of satellite-based Normalized Differential Vegetation Index (NDVI) and Enhanced Vegetation Index (EVI) for detecting crop phenology [23,24,25]. Some studies have shown good performance in identifying phenological stages of specific crop types using pre-defined VI thresholds [26]. For example, Sakamoto et al. [27] used a two-step filtering approach to detect the phenological stages of corn and soybean and achieved high accuracies at the site and regional levels. Huang et al. [28] applied dynamic thresholds of VI time series to detect the start and end of the season of different crop types and obtained higher accuracy than the results from fixed thresholds.
Kentucky is a traditional agricultural state, with corn and soybean being leading field crops. As a typical climatic transition zone, agriculture in Kentucky faces mixed climates that blend northern and southern weather patterns. Over the past 100 years, this region has not seen significant seasonal changes in temperature, especially during the crop growing season in this region [29]. Although crop phenological changes such as earlier planting dates have been widely reported under a warming climate [17,18,30], the associated spatial patterns are highly varied [31,32]. Uncertainties remain regarding how crop phenology has changed over areas like Kentucky, where temperature trends were generally flat over the past decades.
This study adopted a curve-change-based dynamic threshold approach along with MODIS NDVI time series and ground observations to detect the planting and harvesting dates for corn and soybean in Kentucky from 2000 to 2018. We also quantified the temporal trends of crop phenology and its responses to climatic factors (i.e., temperature and precipitation) and the correlations with crop yields. The objectives of the study are (1) to identify phenological dates of corn and soybean using MODIS NDVI time series in Kentucky from 2000 to 2018; (2) to evaluate the accuracy of estimated crop phenological stages using ground data at the state and county levels; (3) to characterize the spatial-temporal trends of crop phenological stages for corn and soybean in Kentucky during the study period; (4) to examine the correlations between crop planting/harvesting dates and temperature/precipitation variations; and (5) to analyze the effects of crop phenological change on crop yields.

2. Materials and Methodology
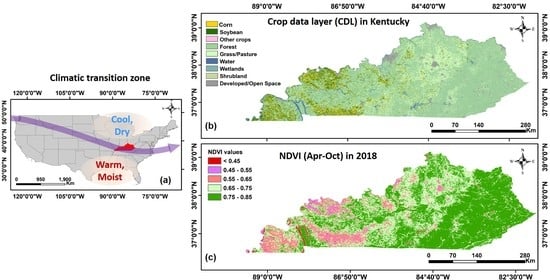
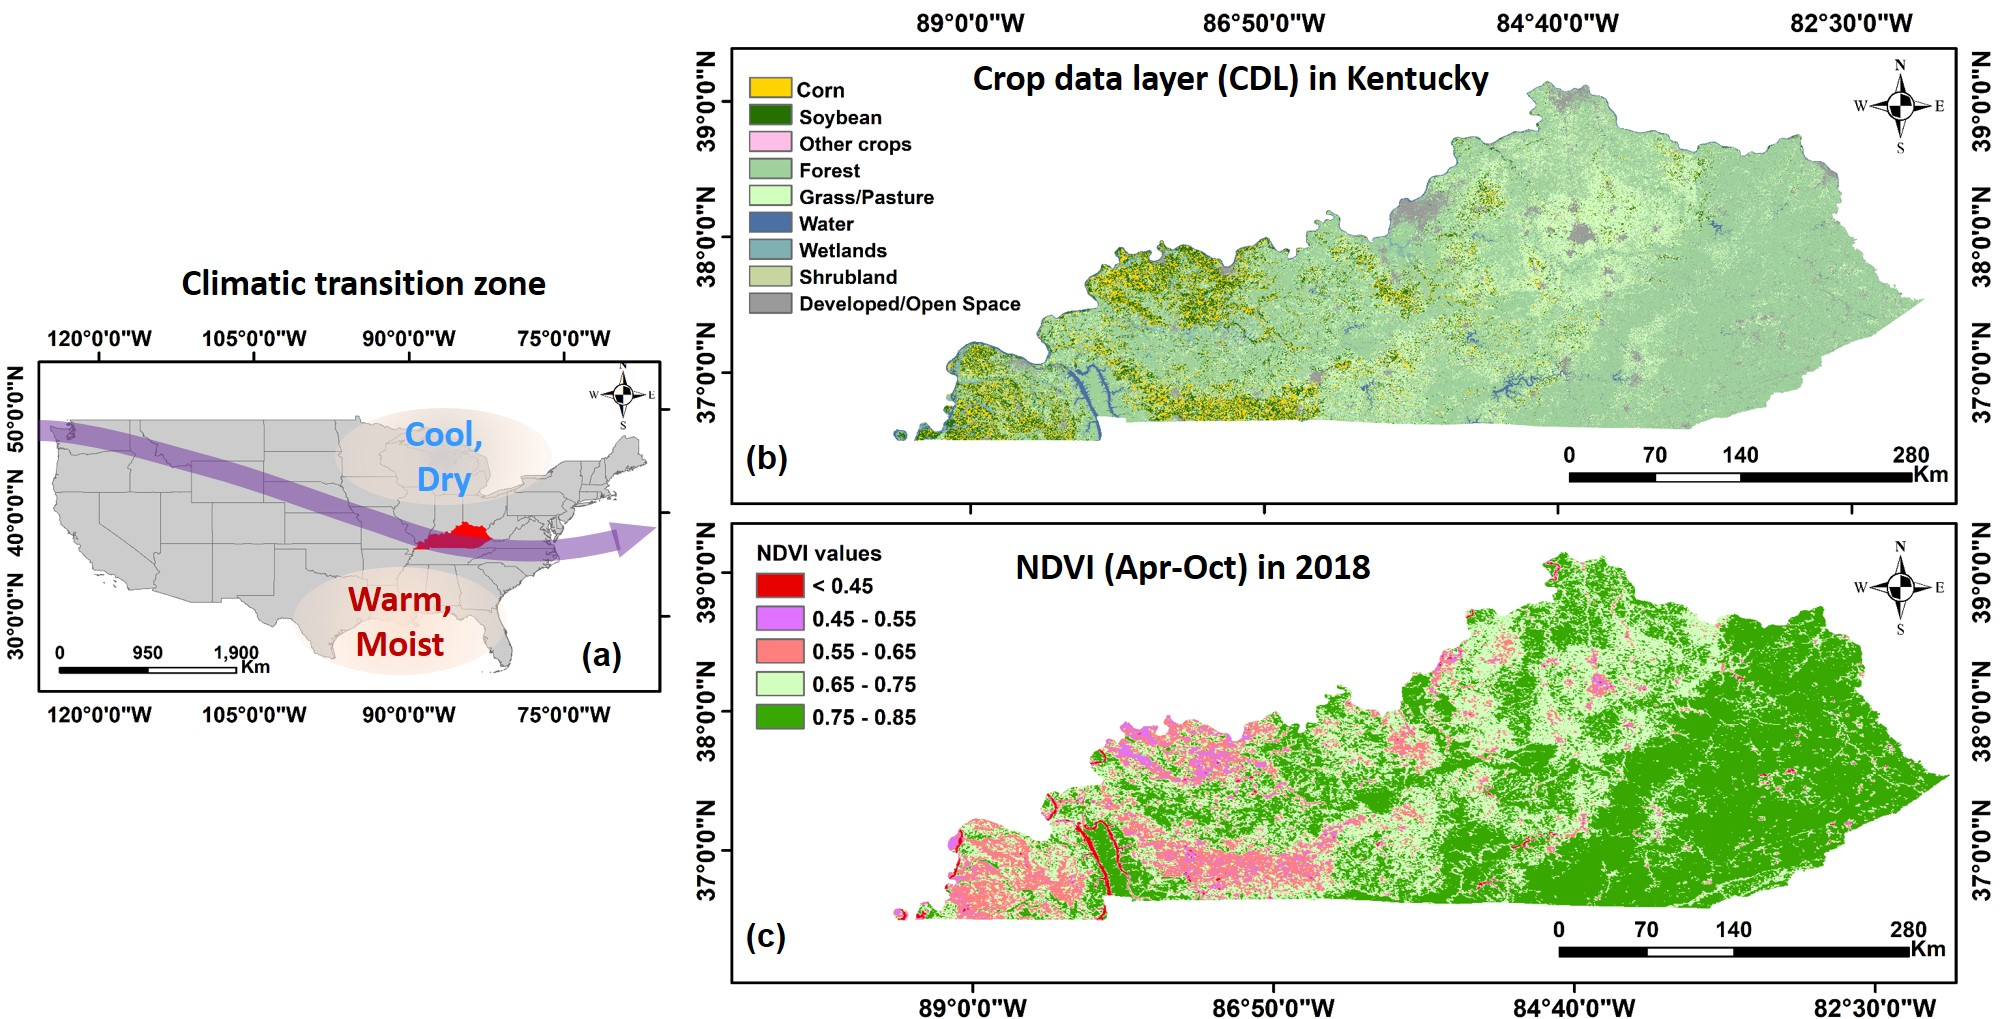
2.1. Study Area

In this study, we focused on the Commonwealth of Kentucky (36°30′N to 39°9′N and 81°58′W to 89°34′W) (Figure 1). In general, Kentucky has a humid subtropical climate characterized by hot summers and cold to mild winters, with an oceanic climate found in the highlands of the southeast. The mean annual temperatures in Kentucky range from 11.67 °C in the northeast to 15 °C in the southwest. The state-wide annual precipitation is 1143 mm, with 965.2 mm for the northern part and 1270 mm for the southern part). Crops in Kentucky are predominantly corn and soybean, which account for more than 90% of total cropland in the state.

2.2. Datasets

2.2.1. Ground Data

We acquired crop planting and harvesting dates of corn and soybean in Kentucky at both the state and county levels. Crop reports released by USDA National Agricultural Statistics Service (NASS) provided the state-level progress of crop phenology information of Kentucky from 2004 to 2018. We extracted the dates of 80% progress of planting and harvesting stages of corn and soybean from the crop reports. We also obtained 5-year averaged crop planting and harvesting dates from the same data source. The state-level crop yields were obtained from the USDA survey. The crop phenology datasets were derived from the Kentucky Hybrid Corn Performance Tests and Kentucky Soybean Variety Performance Tests. These tests offered annual planting and harvesting dates of corn and soybean from 2000 to 2018. The details of the ground data are shown in Table 1.

2.2.2. Satellite and Ancillary Data

In this study, the MODIS NDVI time series calculated from the MCD43A4 product (version 6, https://lpdaac.usgs.gov/products/mcd43a4v006/; accessed on 20 February 2021) was used to detect the planting and harvesting dates of corn and soybean in Kentucky from 2000 to 2018 [33]. MCD43A4 provides 500-m and daily surface reflectance of seven bands in a Sinusoidal projection system, available from February 2000 to the present.
The crop maps from NASS Cropland Data Layers (NASS-CDL) (https://nassgeodata.gmu.edu/CropScape/; accessed on 20 February 2021) were used to identify specific locations of corn and soybean fields. The NASS-CDL classifies specific crop types and provides multi-year crop classification maps at 30 m resolution for the conterminous United States. This classification map is available from 2008 to 2018 for Kentucky.
We used gridded monthly air temperature and precipitation from Daymet to examine the relationships between climate change and crop phenological development [34]. These climate datasets include minimum/maximum temperature and precipitation at a 1km spatial resolution (https://daymet.ornl.gov/; accessed on 20 February 2021). We calculated the monthly average air temperature based on the maximum and minimum temperatures.

2.3. Methodology

2.3.1. Time Series Data Processing

We processed MODIS daily reflectance data on the Google Earth Engine Platform. The NDVI was calculated from the reflectances of the RED and NIR bands as follows [35]:
N D V I = ρ N I R ρ R E D ρ N I R + ρ R E D
where ρ R E D and ρ N I R are band 1 (0.620–0.670 μm) and band 2 (0.841–0.876 μm) reflectances from the MODIS product, respectively.
It was necessary to smooth the time series data using smoothing functions before extracting phenological dates. The smoothing methods consider the noise bias caused by snow or clouds and can handle missing data. Here, we used the Harmonic analysis method to smooth the NDVI time series. This Harmonic algorithm can smooth and reconstruct remotely sensed VI time series while reducing the influence of clouds at the pixel level [36].

2.3.2. Detection of Crop Planting Dates, Harvesting Dates, and Crop Growth Period

In this study, the definitions of crop phenological stages were from USDA NASS (https://www.nass.usda.gov/Publications/National_Crop_Progress/terms_definitions; accessed on 20 February 2021). We considered the silking stage of corn and the blooming stage of soybean as heading dates, respectively. We used a curve-change-based dynamic threshold approach on NDVI time series to identify crop planting and harvesting dates for corn and soybean in Kentucky from 2000 to 2018.
The corn and soybean areas were extracted using the NASS-CDL maps from 2008 to 2018. The original 30 m CDL maps were aggregated into 500 m maps with the percentages of corn or soybean areas being calculated in each 500 m pixel, respectively, to match the size of the MODIS pixel. Pixels with corn or soybean > 50% were retained for crop phenology detection. Previous studies have shown that the NDVI increases with leaf green-up during the spring season and decreases with leaf senescence in the fall [37,38]. As VI values in croplands generally exceed 0.4 at peak growth [39], spurious peaks were discarded if the corresponding NDVI values were less than 0.35. We then set a threshold of 0.35 to limit the cropland, i.e., the pixels with the maximum NDVI values less than 0.35 were excluded as non-cropland cover types [40].
For each crop pixel in a given year, the first and the second derivatives of the NDVI curve were defined by the following equations:
f ( x i ) = f ( x i ) f ( x i 1 ) 1
where f and f are the first- and second-order derivatives of the smoothed NDVI time series (f), i is the time sequence number of values in the smoothed NDVI time series (2, 3 …365), 1 is the time step of NDVI time series, and f is the smoothed NDVI time series.
We then identified crop phenological dates based on the characteristics of the derivatives:
Heading dates:
Previous studies have shown that the maximum NDVI occurs around the heading dates [41]. We, therefore, used the point at the NDVI peak to capture crop heading dates and constrained the valid range according to the five-year averaged planting dates from the crop reports dataset (Table 2).
  { f ( x i ) > 0     f ( x i + 1 ) < 0   f ( x i + 1 )     0.35 a < P e a k ( h e a d i n g   d a t e s ) < b )
where f’ is the first-order derivative of the NDVI curve; f is smoothed NDVI curve; i means the ith of NDVI/NDVI’ values in the time series (1, 2, 3…365), a and b are the upper and lower boundaries of the valid time range for NDVI peak, respectively.
Planting dates:
The NDVI curve shows lower values before crop planting when agricultural lands are plowed or cultivated (Figure 2). After the crop planting, photosynthetic activity starts with plant expanded leaves, and thereby, the NDVI curve begins to increase. It is reasonable to expect the NDVI value of the planting date is located at the low point at the early stage of the NDVI curve. We, therefore, applied the peak of the second-order derivative of the NDVI curve (before the heading date) to detect the crop planting date. The crop planting dates were constrained within 40–120 days before the heading dates based on the Corn and Soybean Production Calendar in Kentucky (https://simpson.ca.uky.edu/files/corn_and_soybean_production_calendar.pdf; accessed on 20 February 2021). Additionally, we also used more accurate ranges to filter out all possible outlier estimates according to the 5-year averaged phenology derived from the crop reports dataset (Table 2).
Harvesting dates:
Plant leaves continue to wither and die during the harvesting season. Crop canopy can be harvested in this stage. Correspondingly, the NDVI value decreases to the lowest point when the crop is harvested from fields. After the heading date, the peak (after the heading date) of the second-order derivative of the NDVI curve can catch the lowest value of NDVI at the last period of the NDVI curve (Figure 2). Here we used this transition point to detect the crop harvesting date. Similarly, the harvesting dates were constrained to occur within the time range of 30–110 days after the heading date, according to the crop calendar in Kentucky. Similarly, we retained estimates that fall into the valid time range as determined by the 5-year averaged harvesting dates (Table 2).
Subsequently, crop growing season length was calculated for each pixel using the time difference between planting and harvesting dates.

2.4. Evaluation and Trend Analysis

At the state level, we calculated the dates when the areas of estimated phenological dates occupied 80% of the total planting areas across the whole state for corn and soybean. For county-level evaluation, the mean values of the estimations were calculated for corn (68 counties) and soybean (74 counties) in top producer counties. The coefficient of determination (R2) and root mean square error (RMSE) were used to evaluate the estimated crop phenology against the ground data at both the state and county levels.
R 2 = i = 1 n ( x i x ¯ ) 2 ( y i y ¯ ) 2 i = 1 n ( x i x ¯ ) 2 i = 1 n ( y i y ¯ ) 2
R M S E = 1 n i = 1 n ( y i x i ) 2
where n represents the number of samples. y i and x i are the ground data and remote sensing estimates, respectively.
Linear regression analysis was applied for generating the changing trends of the phenological estimations at the state level over the study period. We also used the Mann–Kendall test [42,43] and the Sen’s slope estimator [44] to analyze the temporal trends of phenological stages at the pixel scale. During the process, pixels with more than 12 years being identified as an individual crop (corn or soybean) were included in the Mann-Kendall test. The analytical method was implemented using the R computing environment [45].
We used linear regression analysis to examine temporal patterns of climatic factors and crop yields and their relationships with crop phenology. The Pearson correlation coefficient was adopted to describe the sensitivity of crop phenology to climate change. Climatic factors include minimum, maximum, average temperatures, and accumulated precipitation during three seasons (spring: March–May, summer: June–August, fall: September–November) and the whole crop growing period.

3. Results

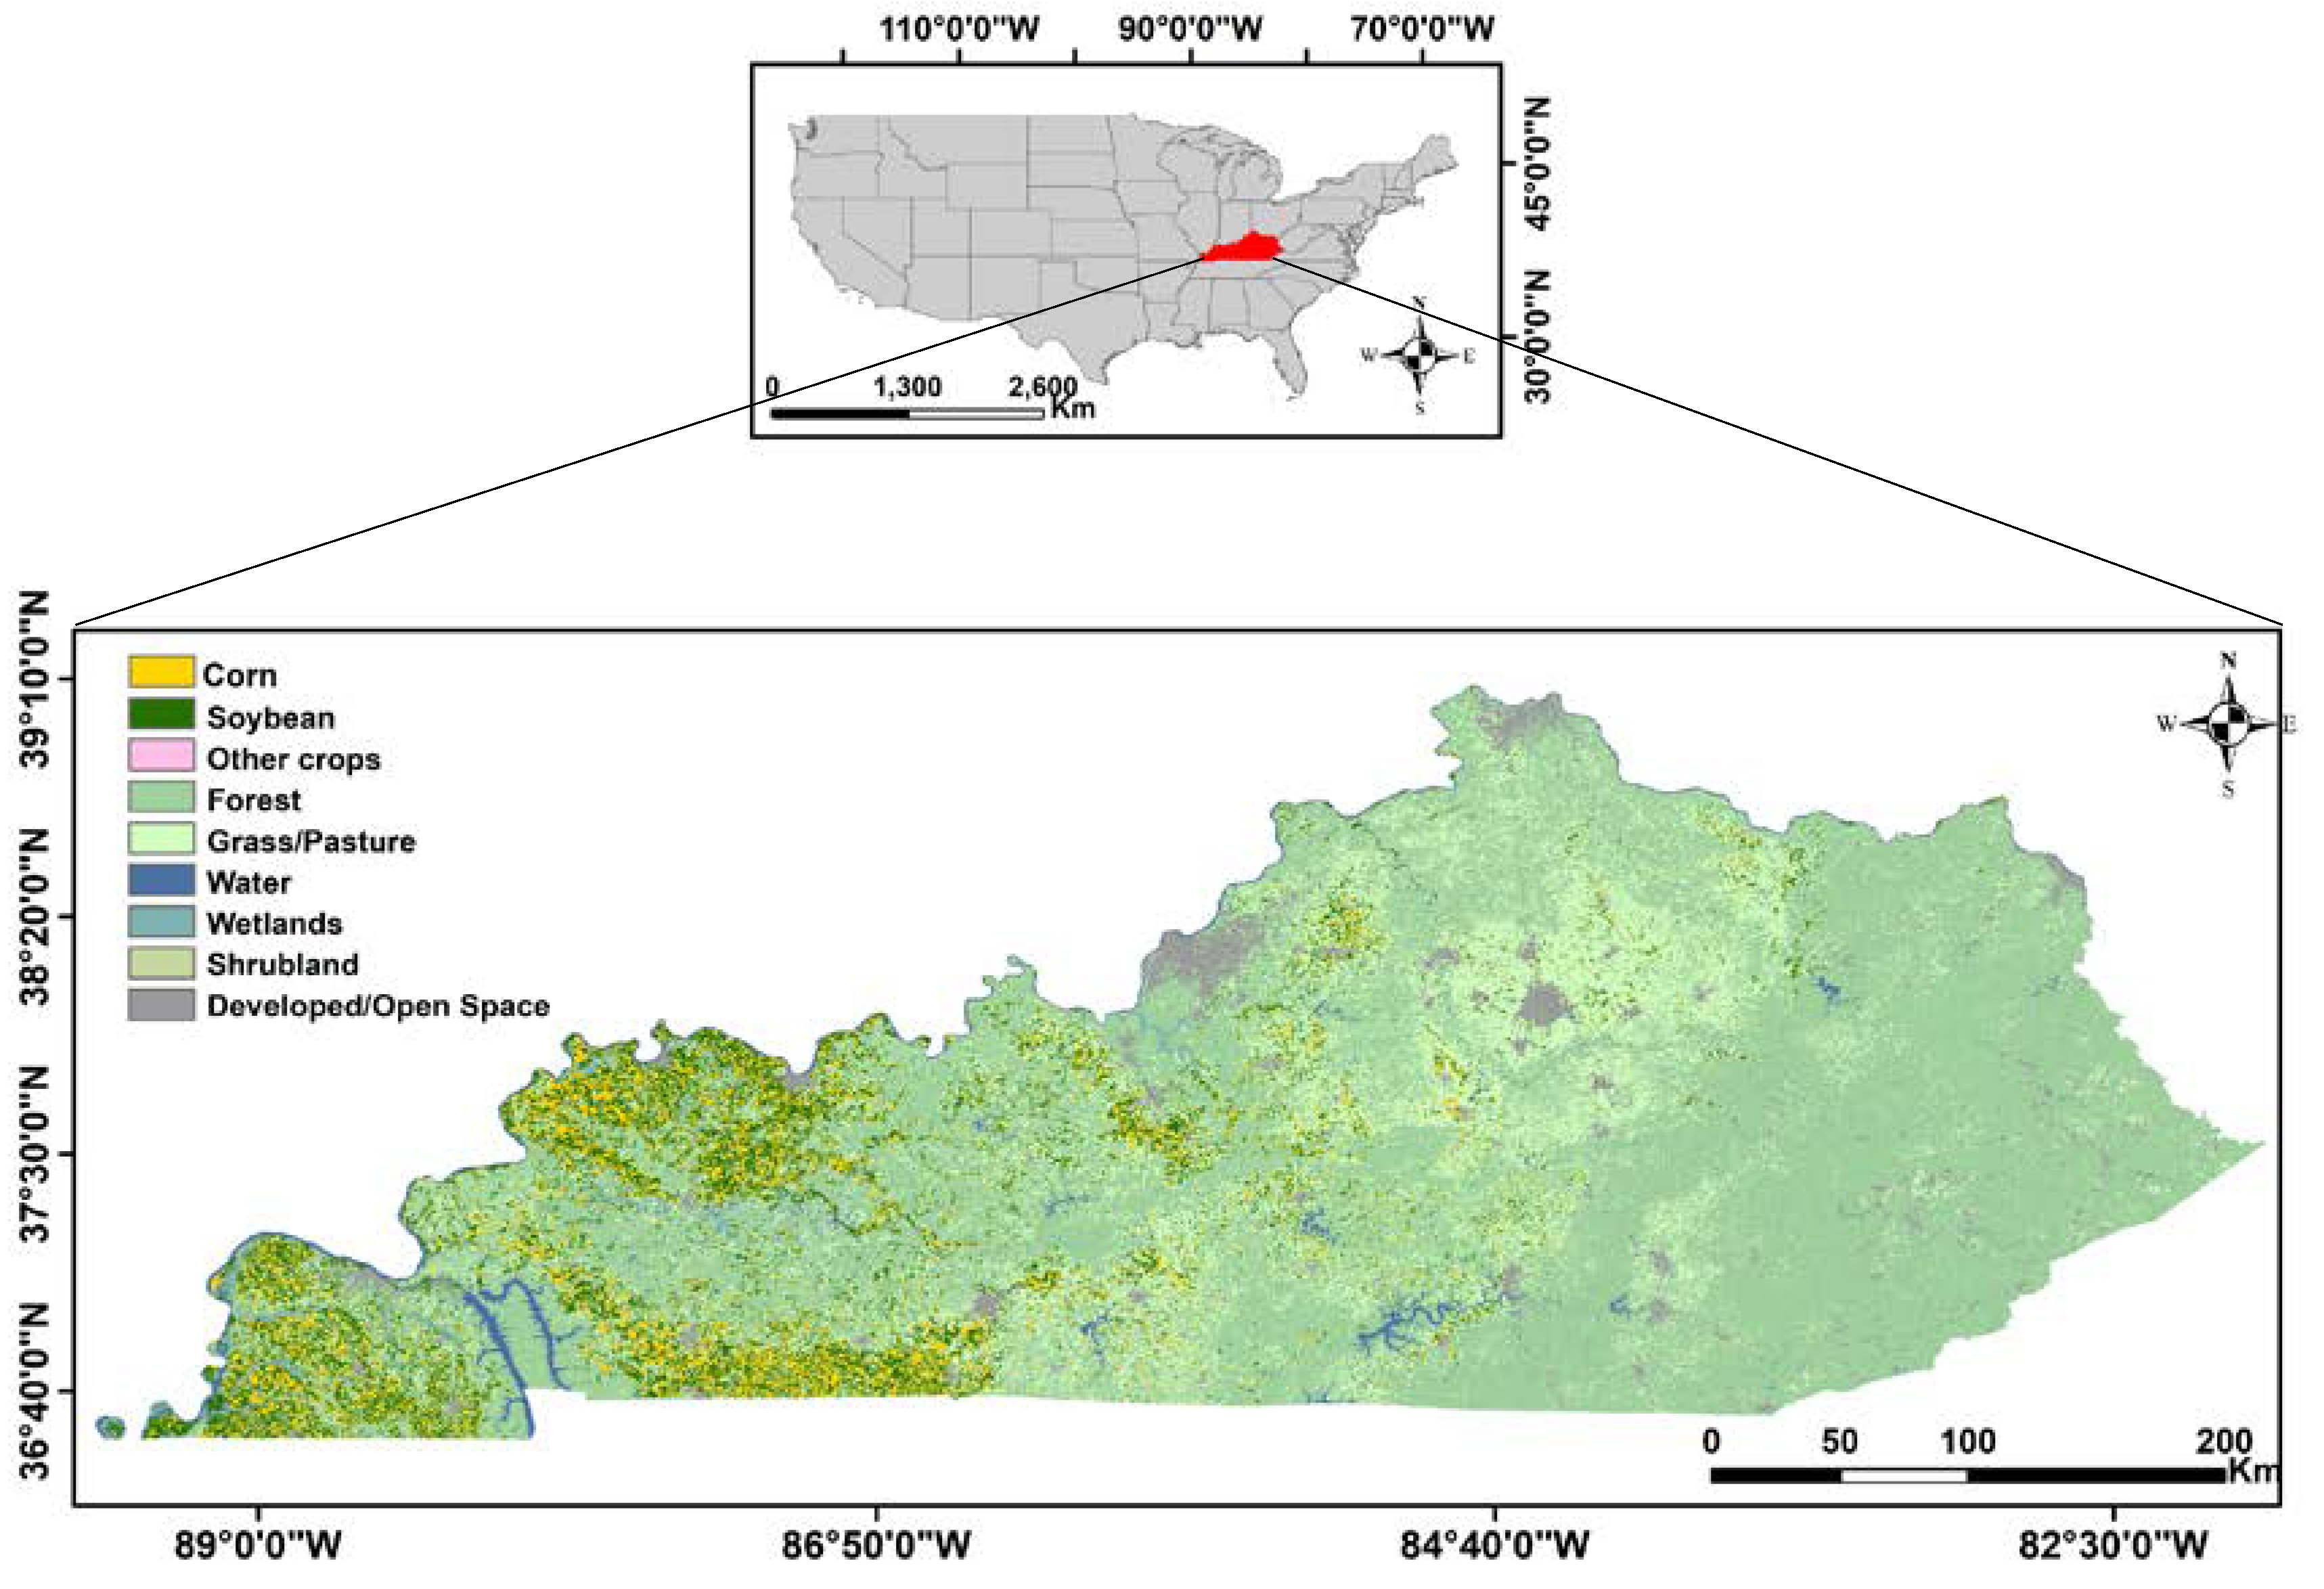
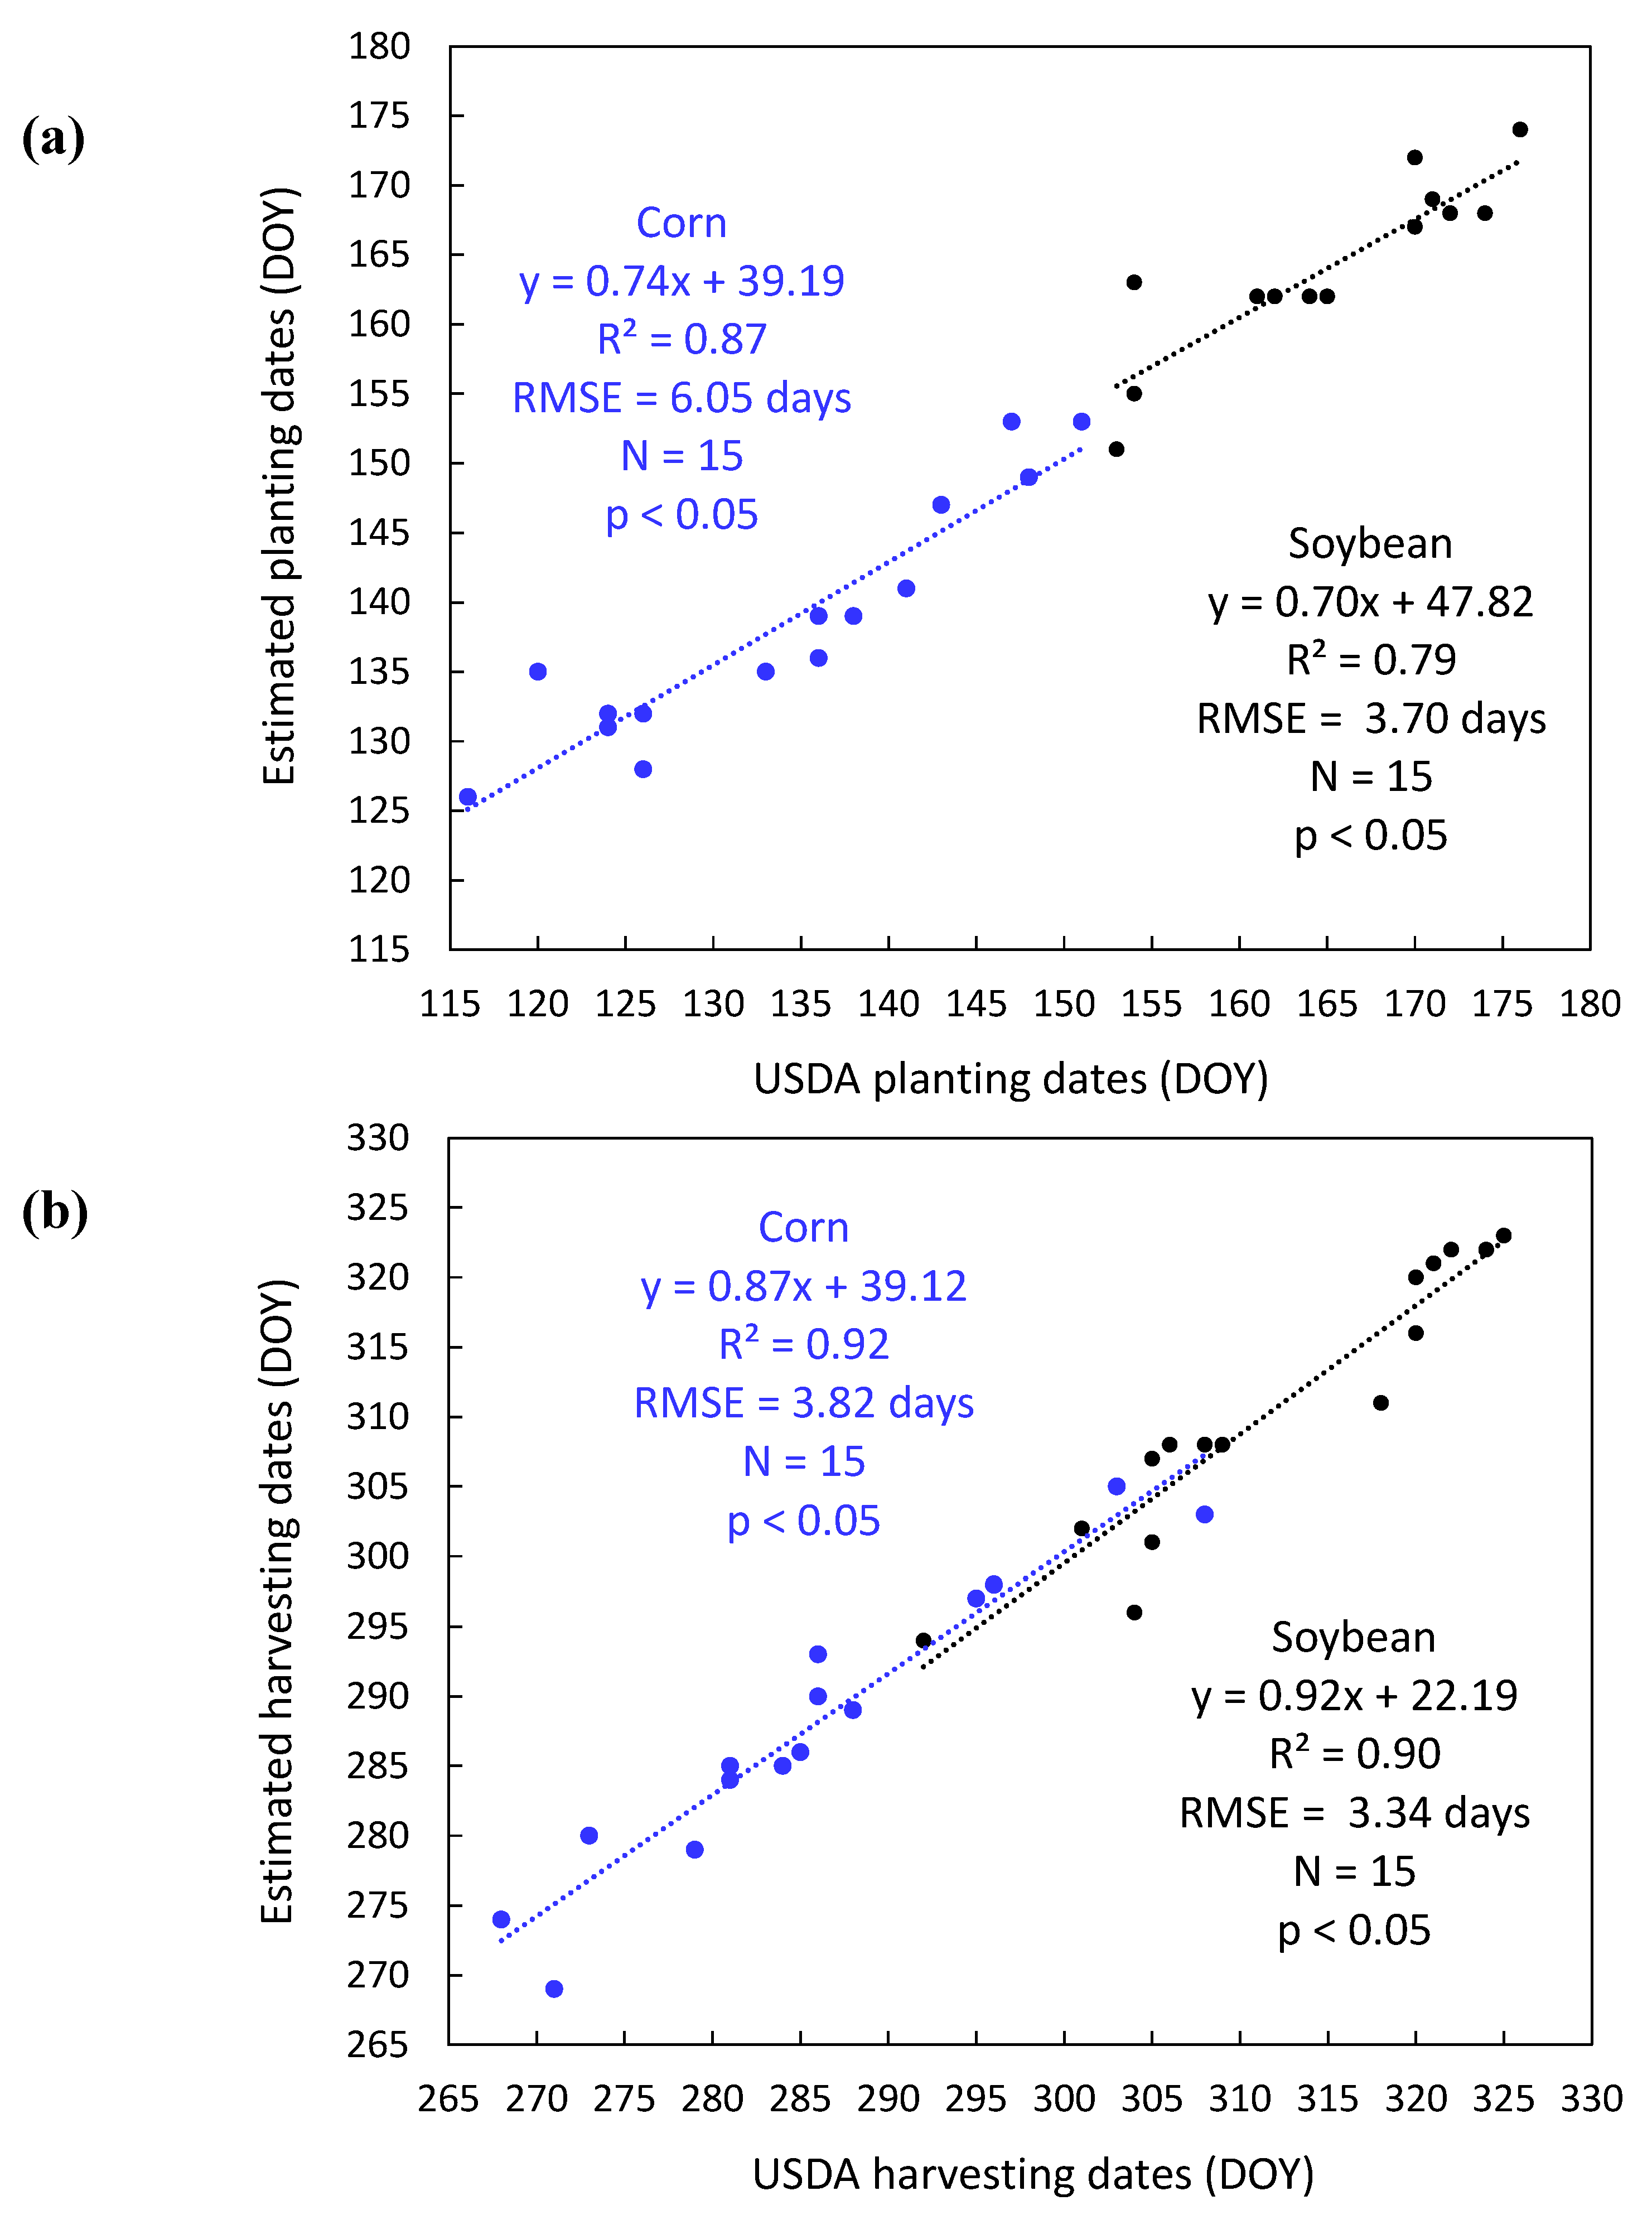
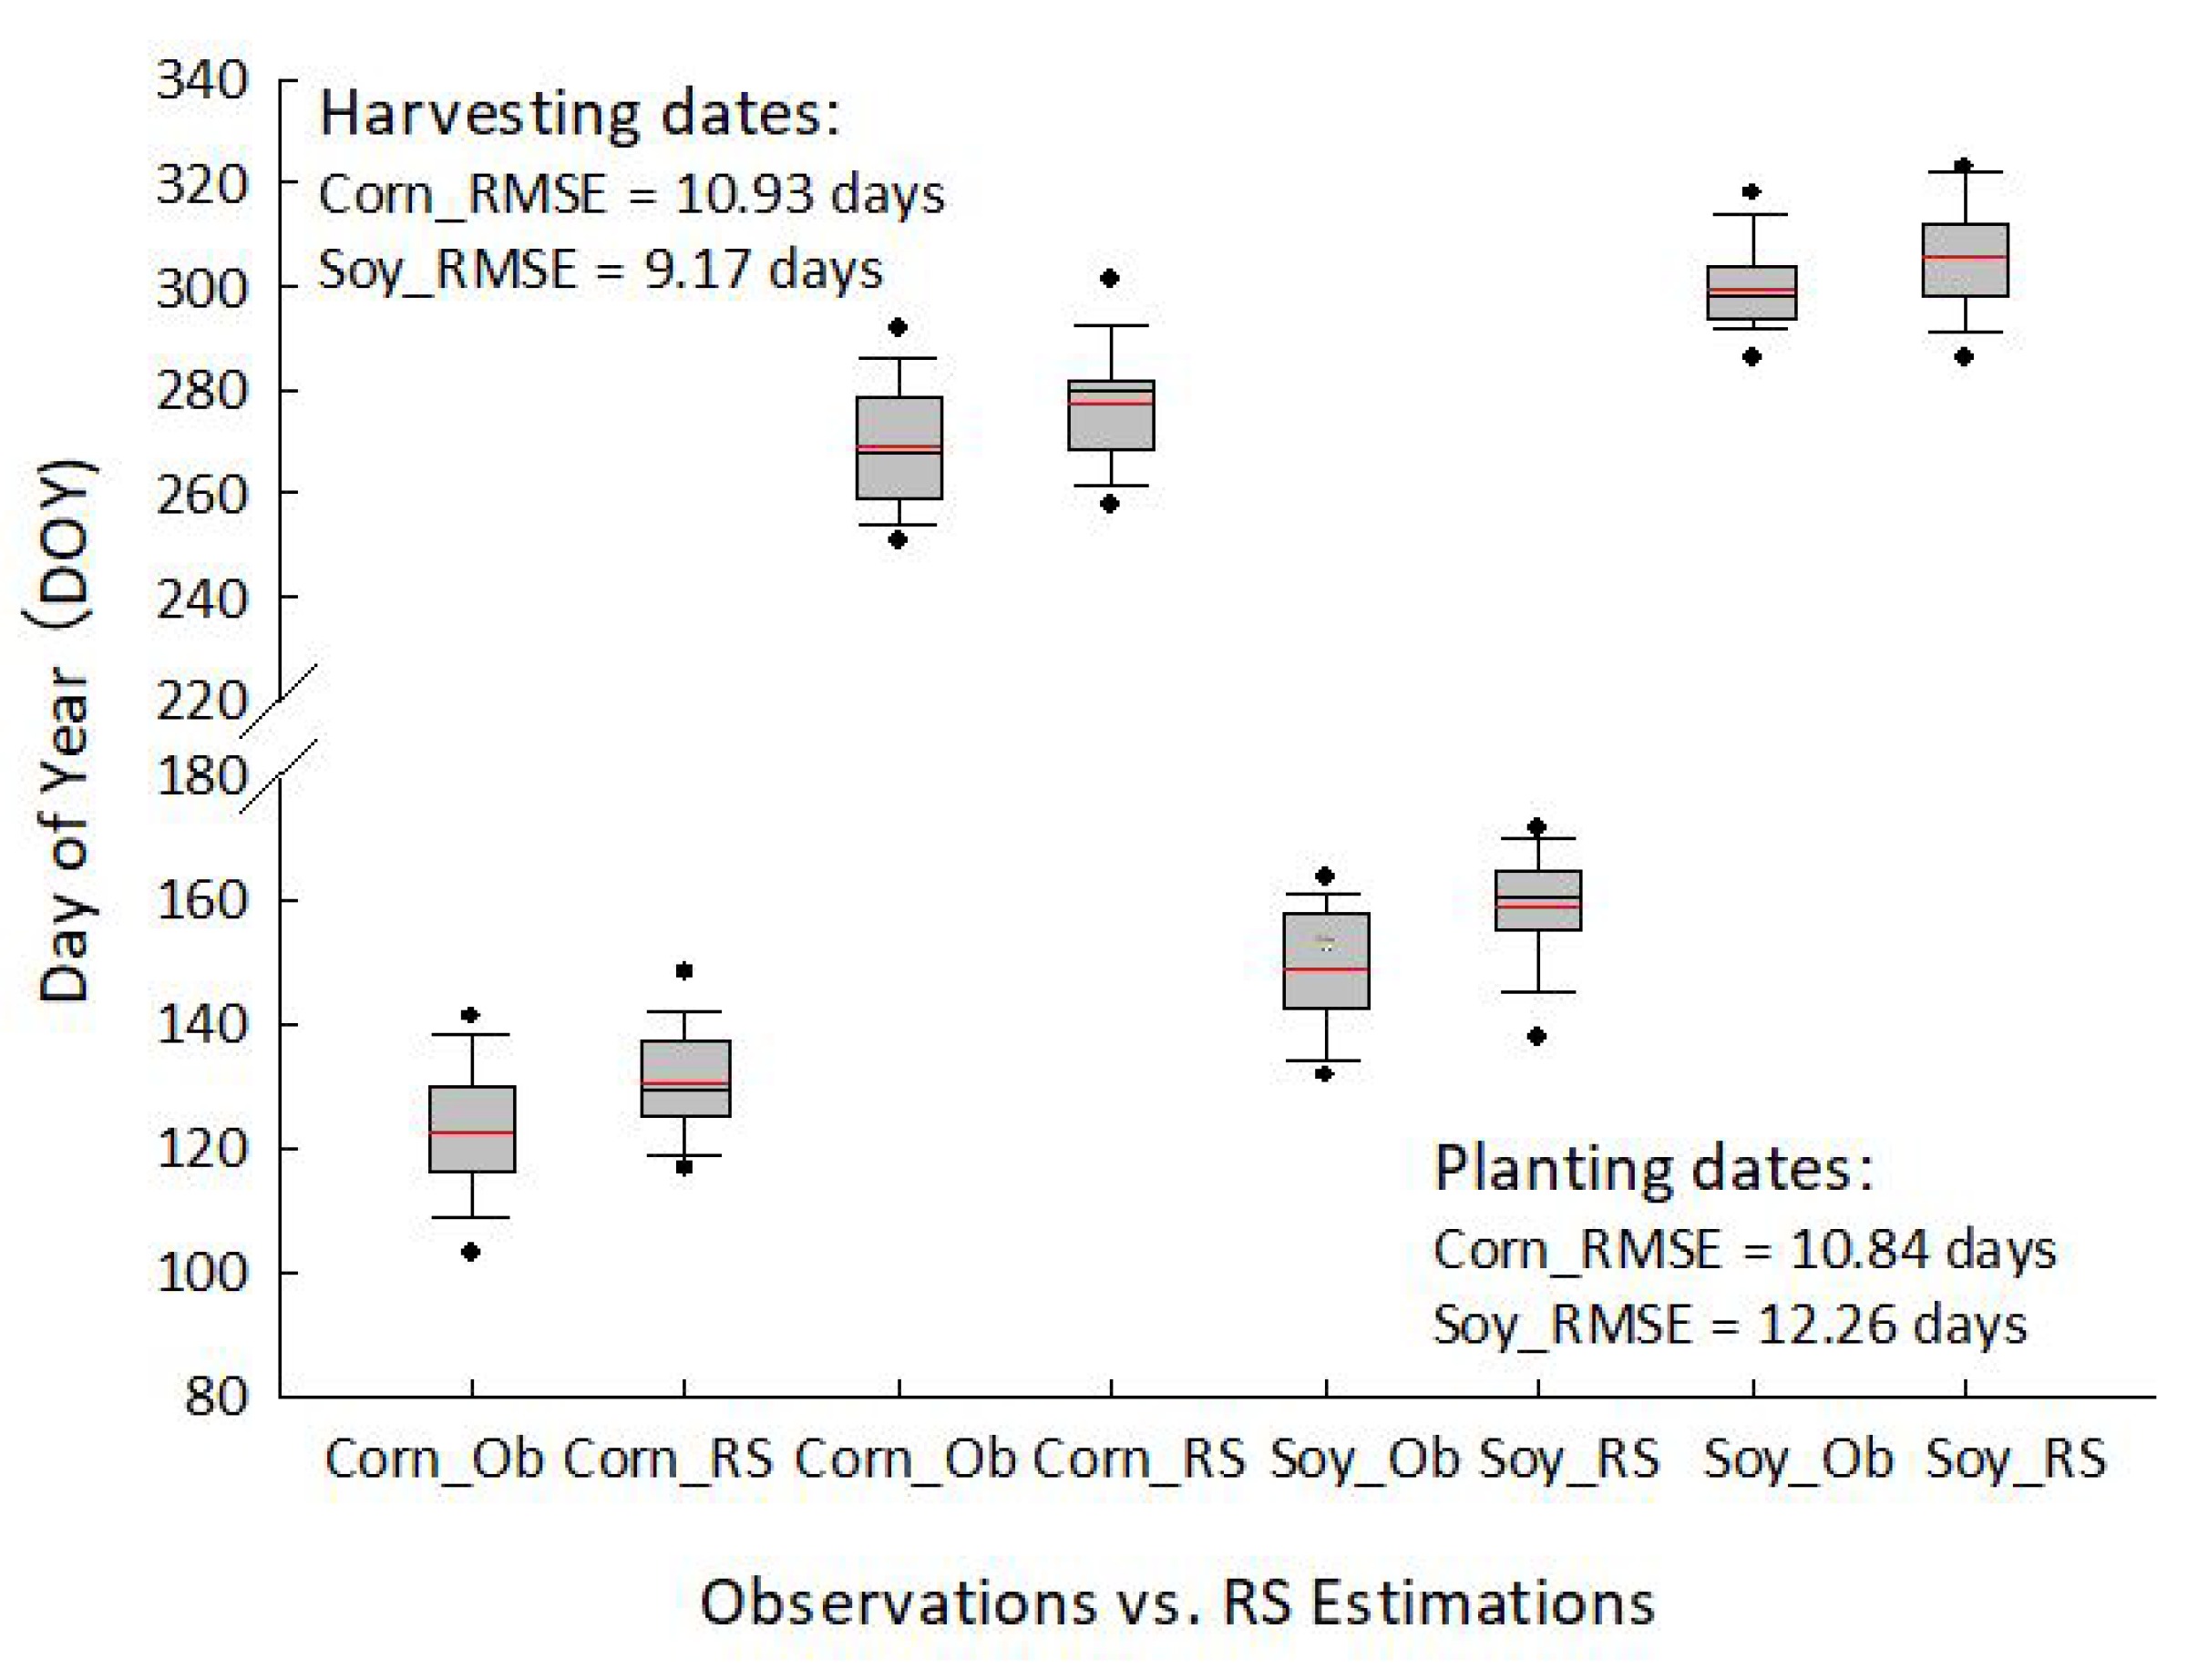
3.1. Evaluation of Simulated Crop Phenology

3.1.1. State-Level Evaluation

The state-level evaluation results showed that crop phenology estimated by remote sensing was at a high level of agreement with the crop reports from the survey data (Figure 3). The estimated harvesting dates closely matched those from the crop reports, with R2 of 0.92 and 0.90 for corn and soybean, respectively (Figure 3b). The R2 of the estimated planting dates of corn and soybean against survey data was 0.87 and 0.79, respectively. The accuracy of the estimated harvesting dates of soybean was the highest, with an RMSE of 3.34 days. The RMSE value of corn harvesting dates was 3.82 days. The accuracies of the estimated planting dates of corn and soybean were 6.05 and 3.70 days, respectively (Figure 3a).

3.1.2. County-Level Evaluation

The county-level assessment appeared to show lower accuracies compared to the state-level assessment (Figure 4). Generally, the estimated crop phenological dates were later than those observed from field tests. Overestimations were larger in estimated planting dates than harvesting dates for both corn and soybean. The RMSE values of corn planting and harvesting dates were 10.84 and 10.93 days, respectively. For soybean, the RMSE of harvesting dates was 9.17 days, and the RMSE value of planting dates was 12.26 days.

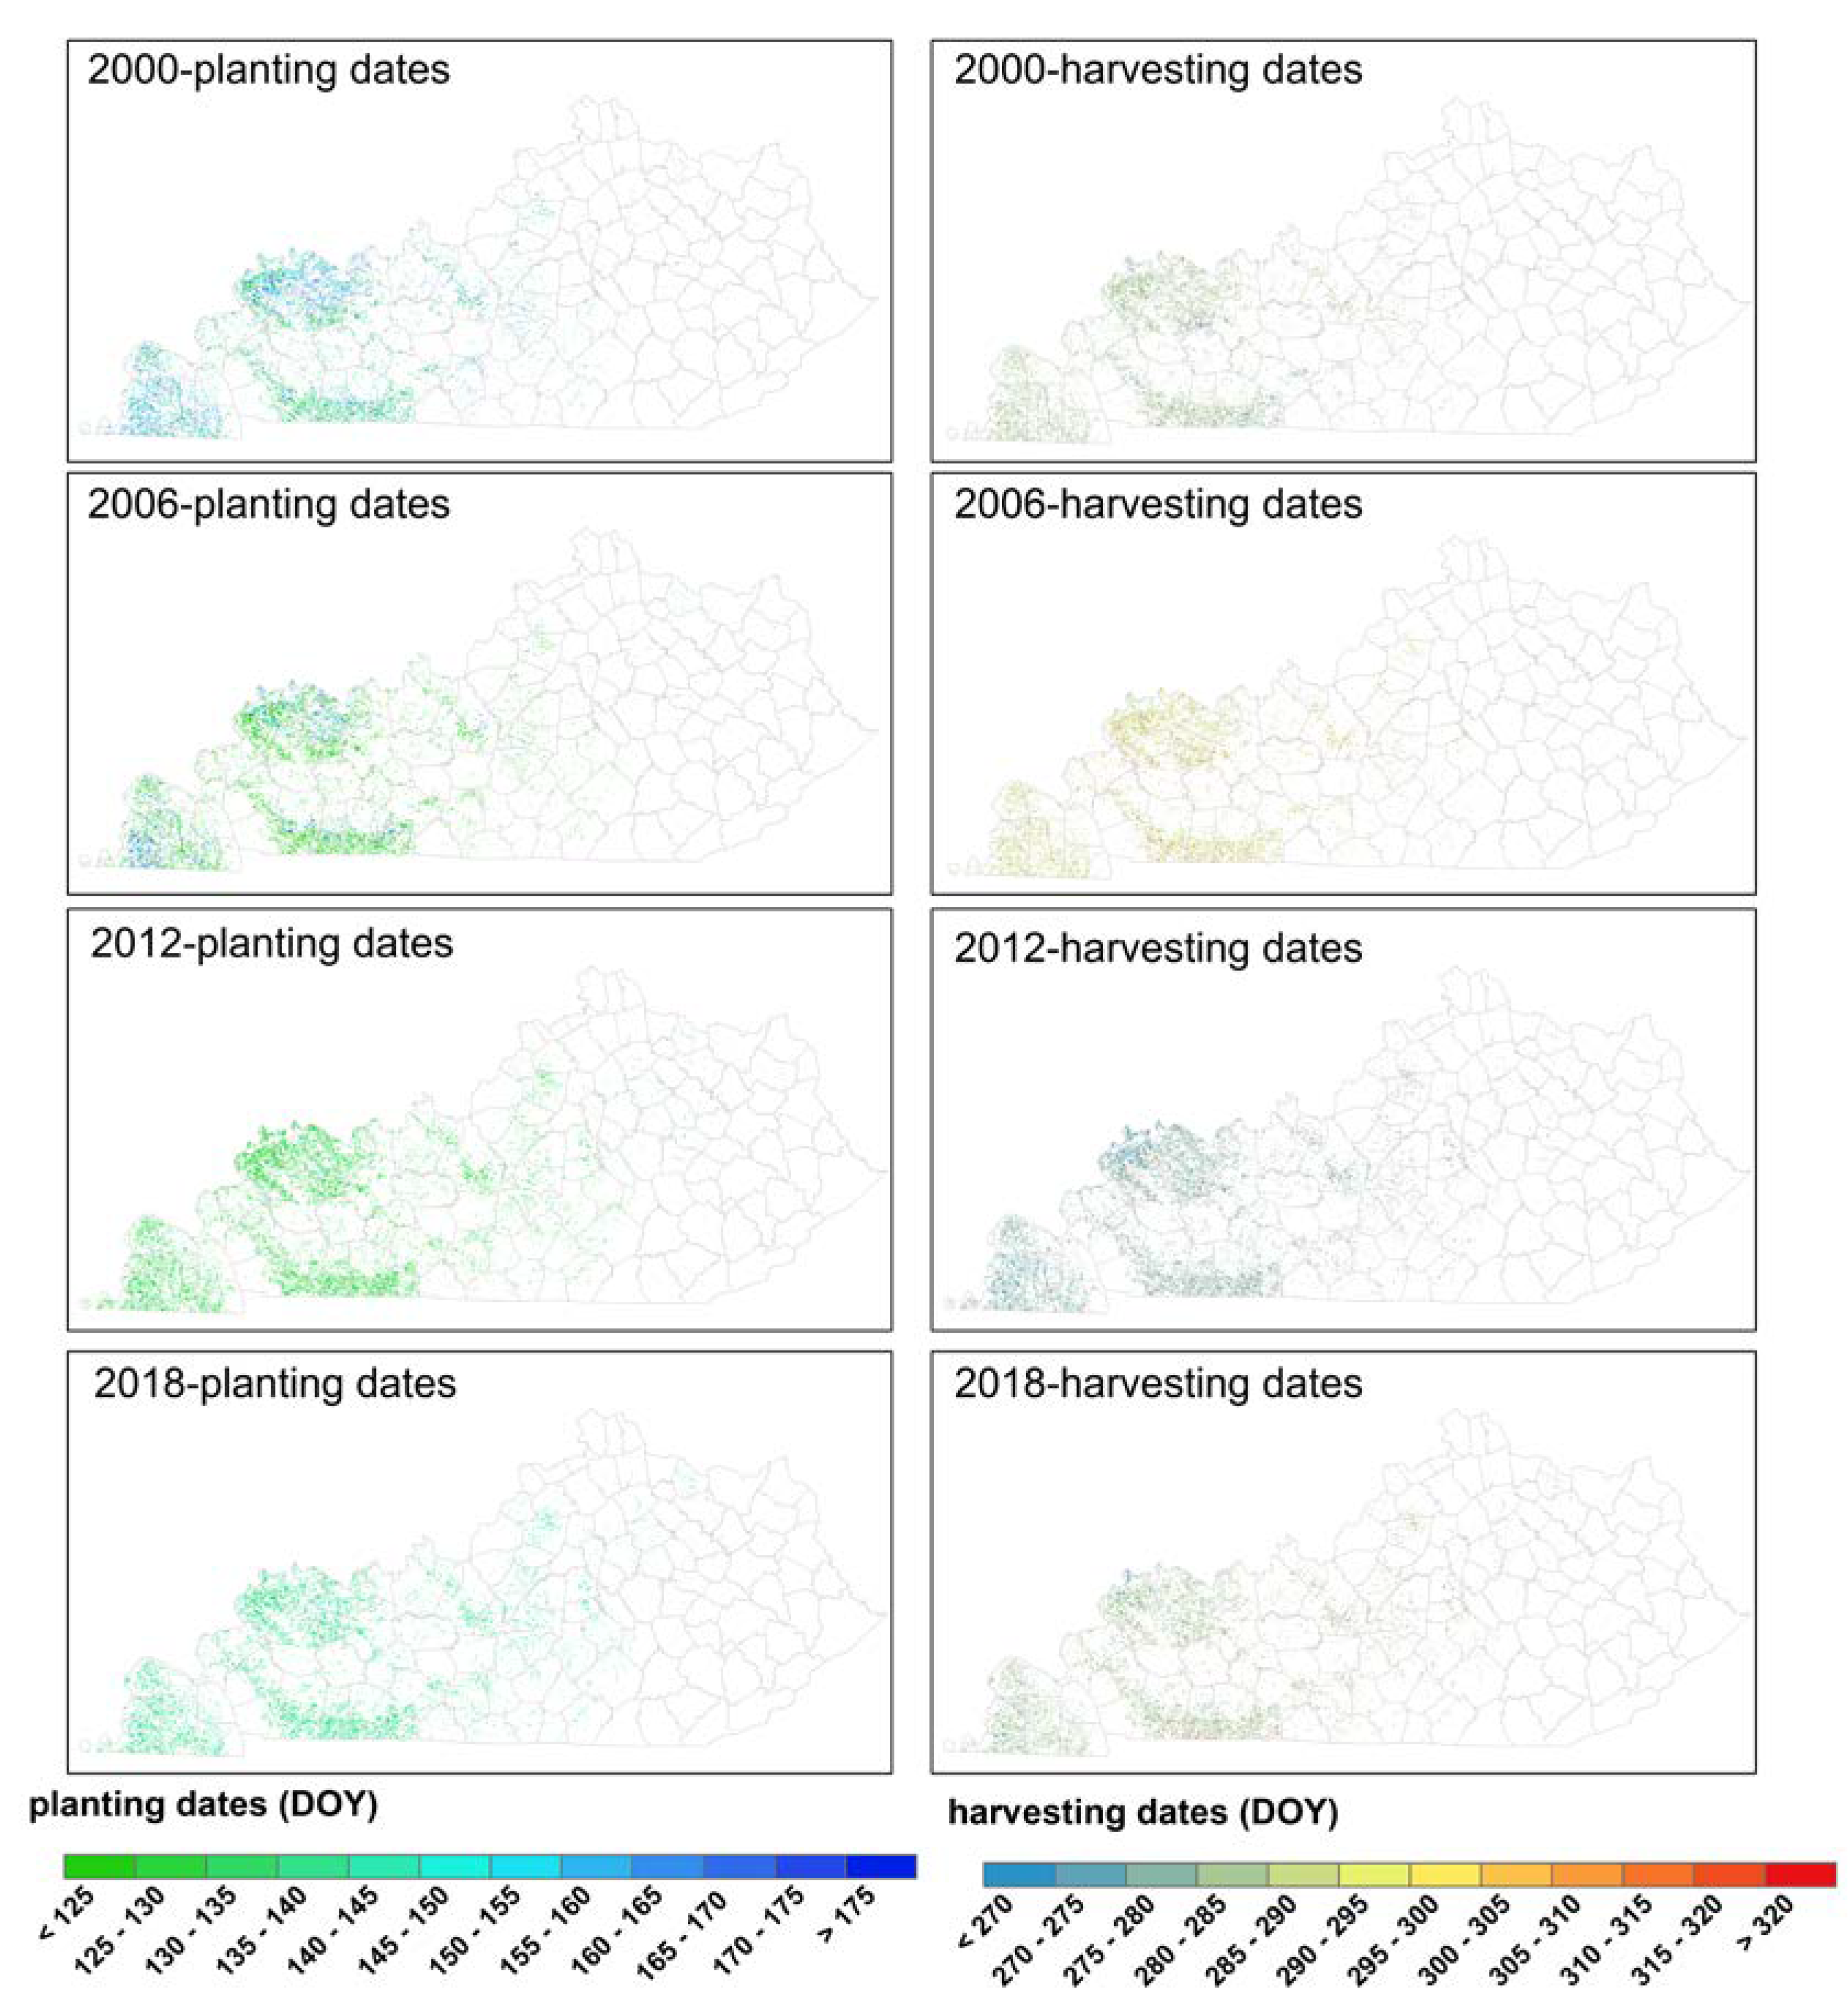
3.2. Spatial Distribution of Crop Phenology

The corn planting and harvesting dates were mapped every six years from 2000 to 2018 in Kentucky (Figure 5). The corn cultivation areas were mainly distributed in western Kentucky. The corn planting dates showed obvious spatial differences in 2000 and 2006, but not during 2012 and 2018. In general, the earliest and latest planting dates were appeared in 2012 and 2000, respectively. Unlike the distribution of planting season, the timing of corn harvesting dates varied widely among different pixels during four years. The earliest and latest corn harvesting dates were detected in 2012 and 2006, respectively. Moreover, the earlier planting dates accordingly led to earlier harvesting dates in 2012.
The crop phenology maps of soybean for the years 2000, 2006, 2012, and 2018 were depicted in Figure 6. Like corn, the soybean planting areas were mainly concentrated in the western part of the study area. Similar spatial patterns in the soybean planting dates were observed in 2006, 2012, and 2018, exhibiting earlier planting dates than the year 2000 at the pixel level. In terms of the harvesting dates, advanced soybean harvesting dates were extensively distributed in 2012 and 2018 compared with 2000 and 2006 across soybean areas.

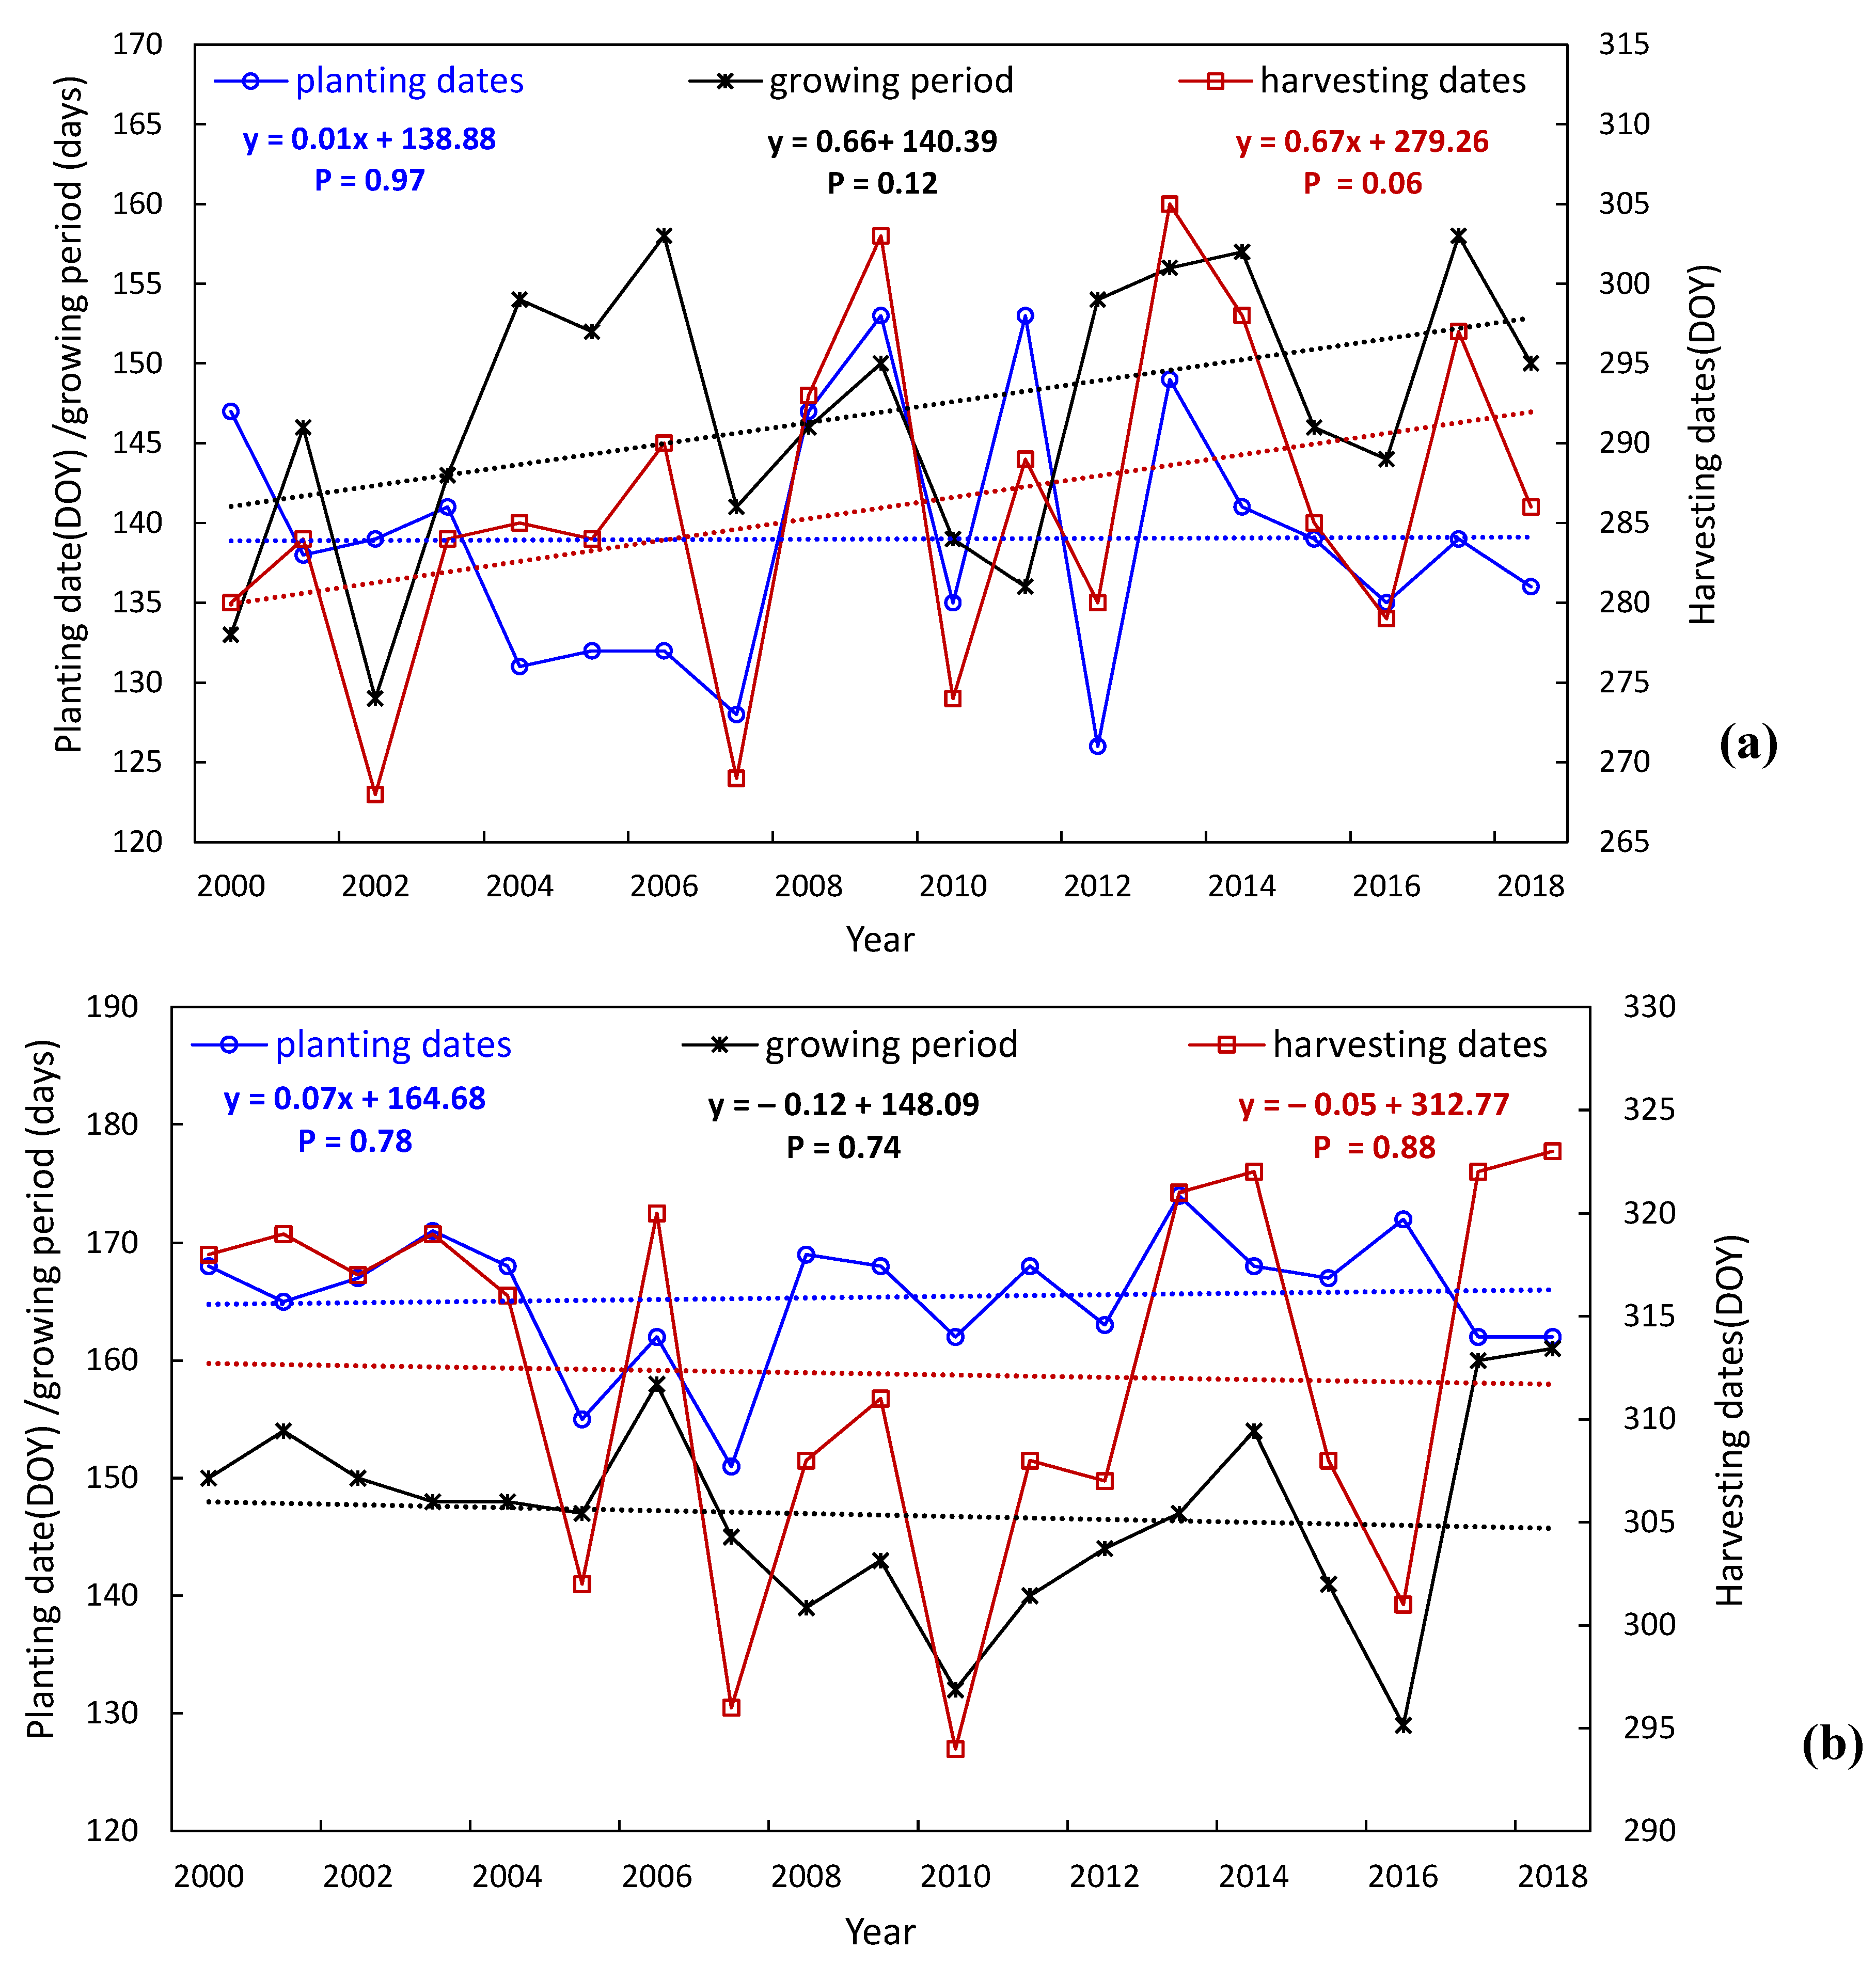
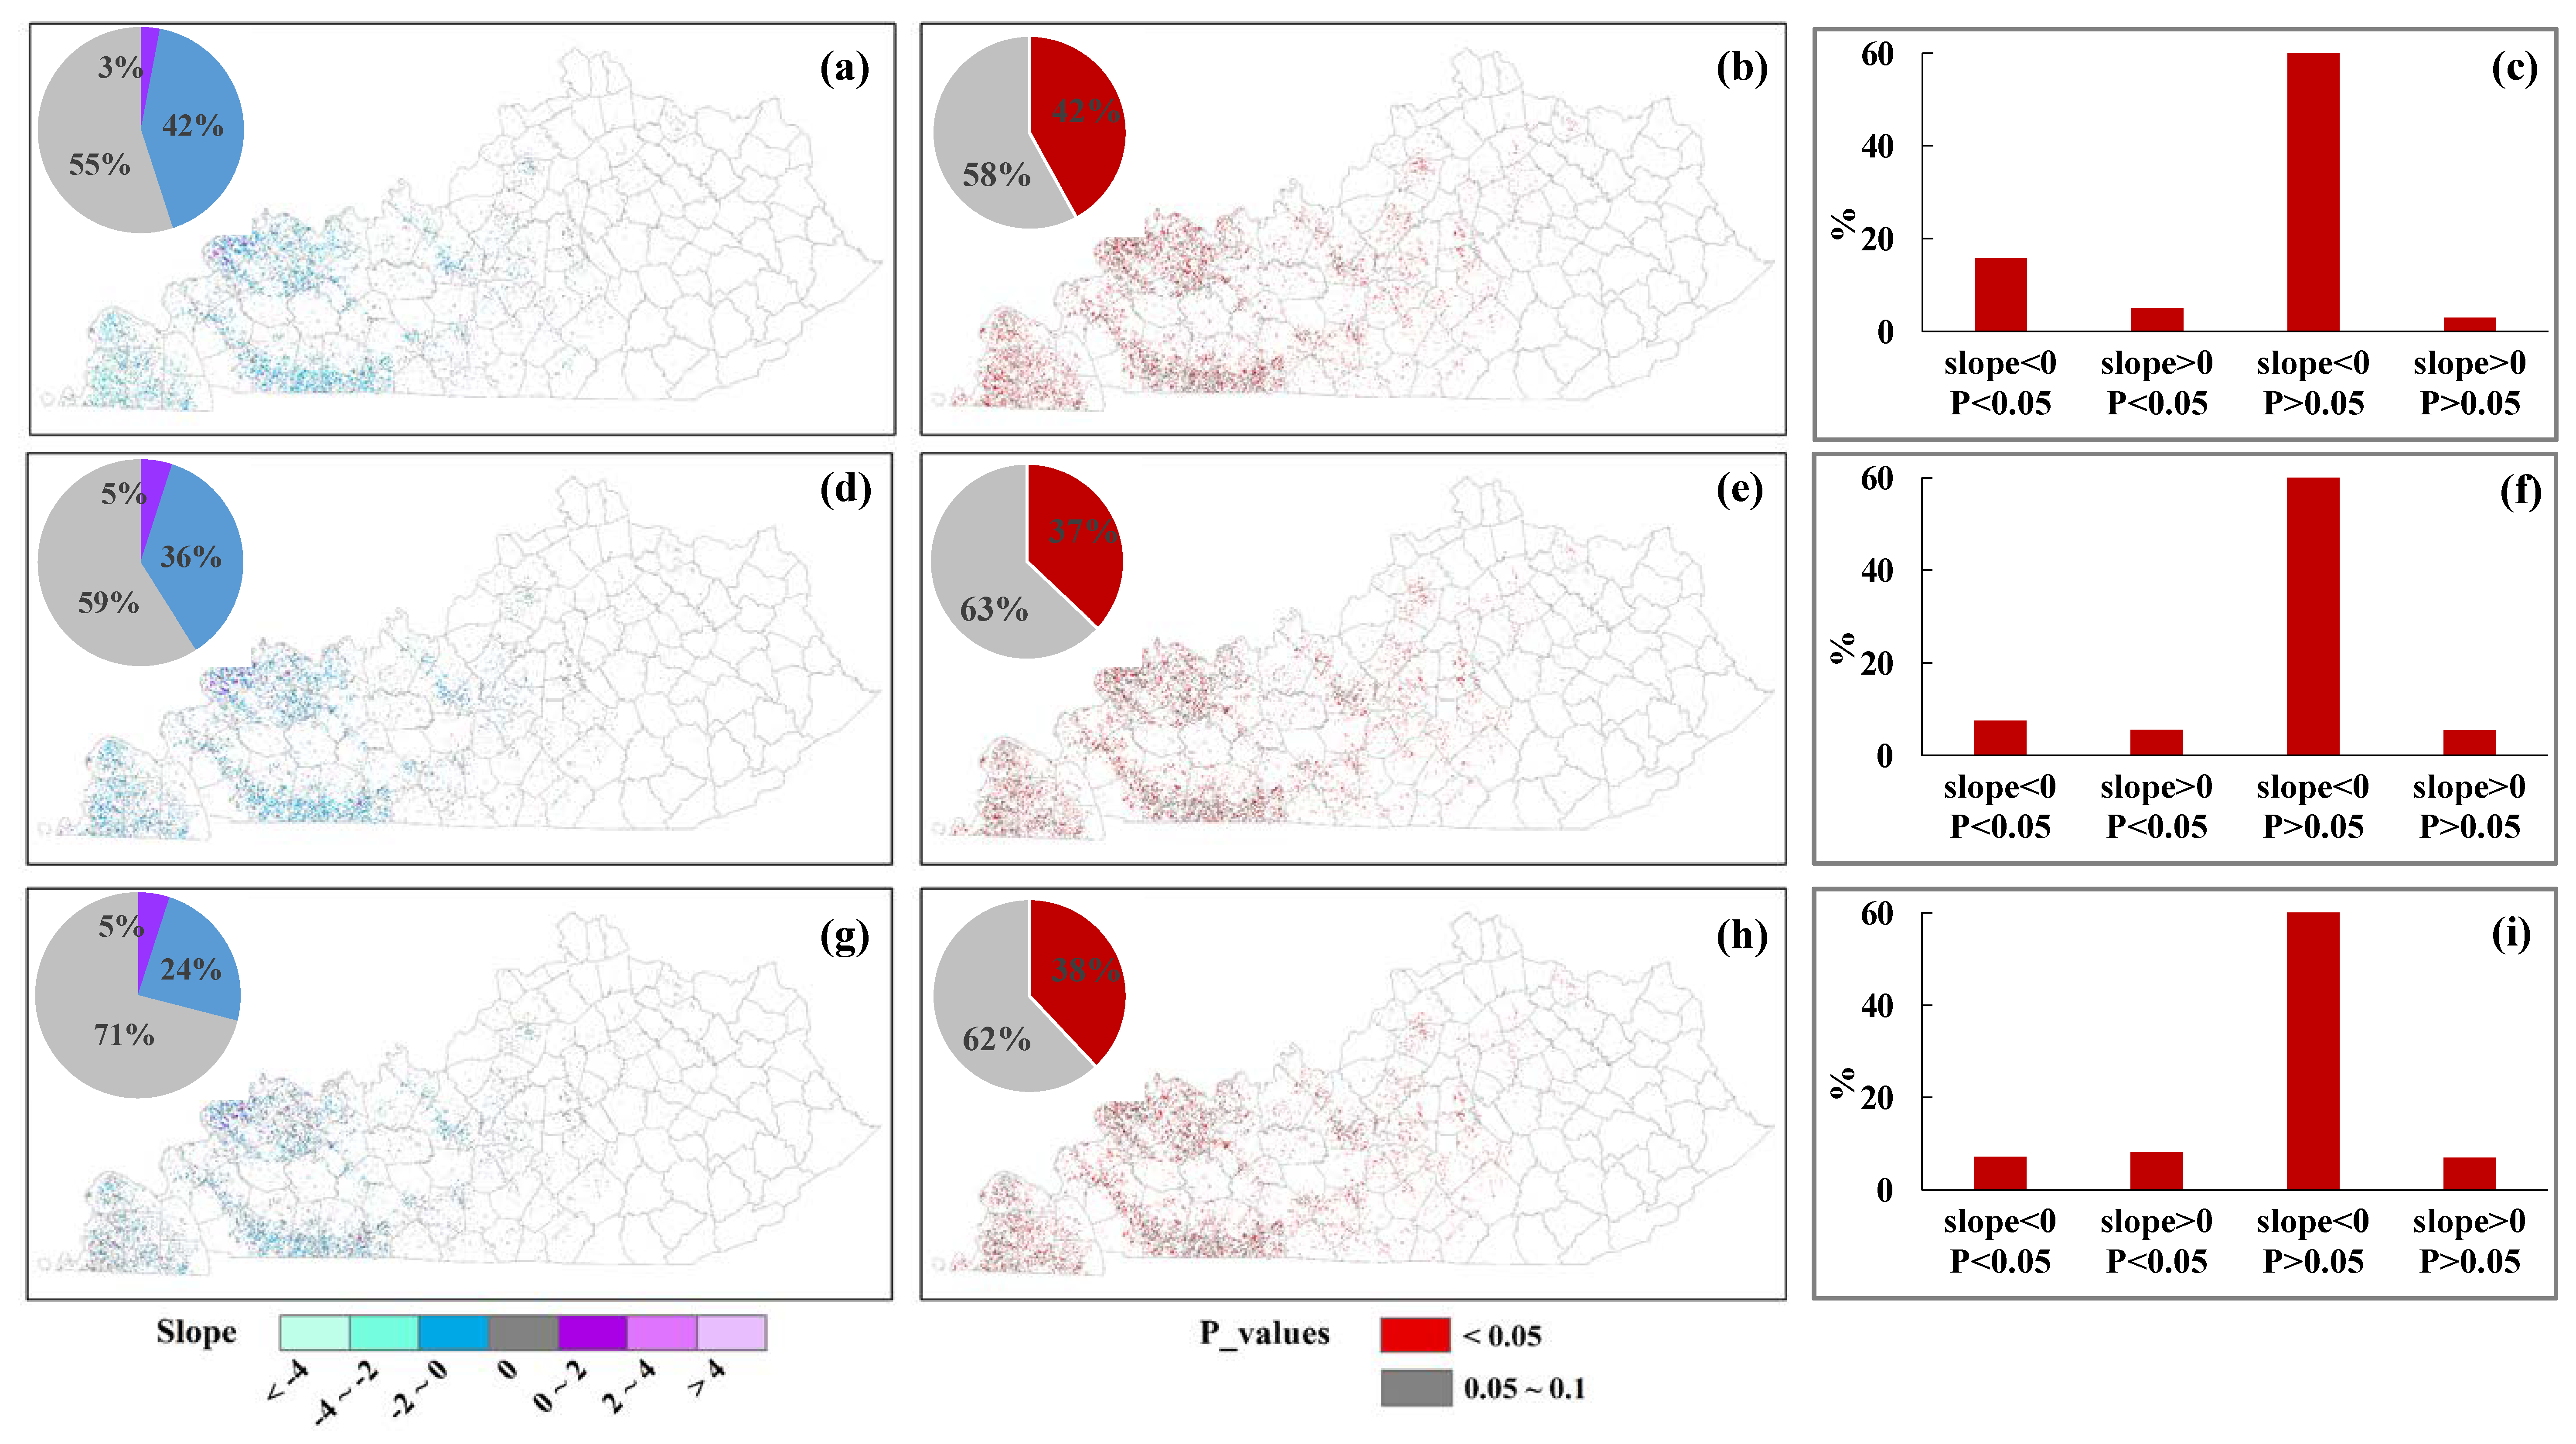
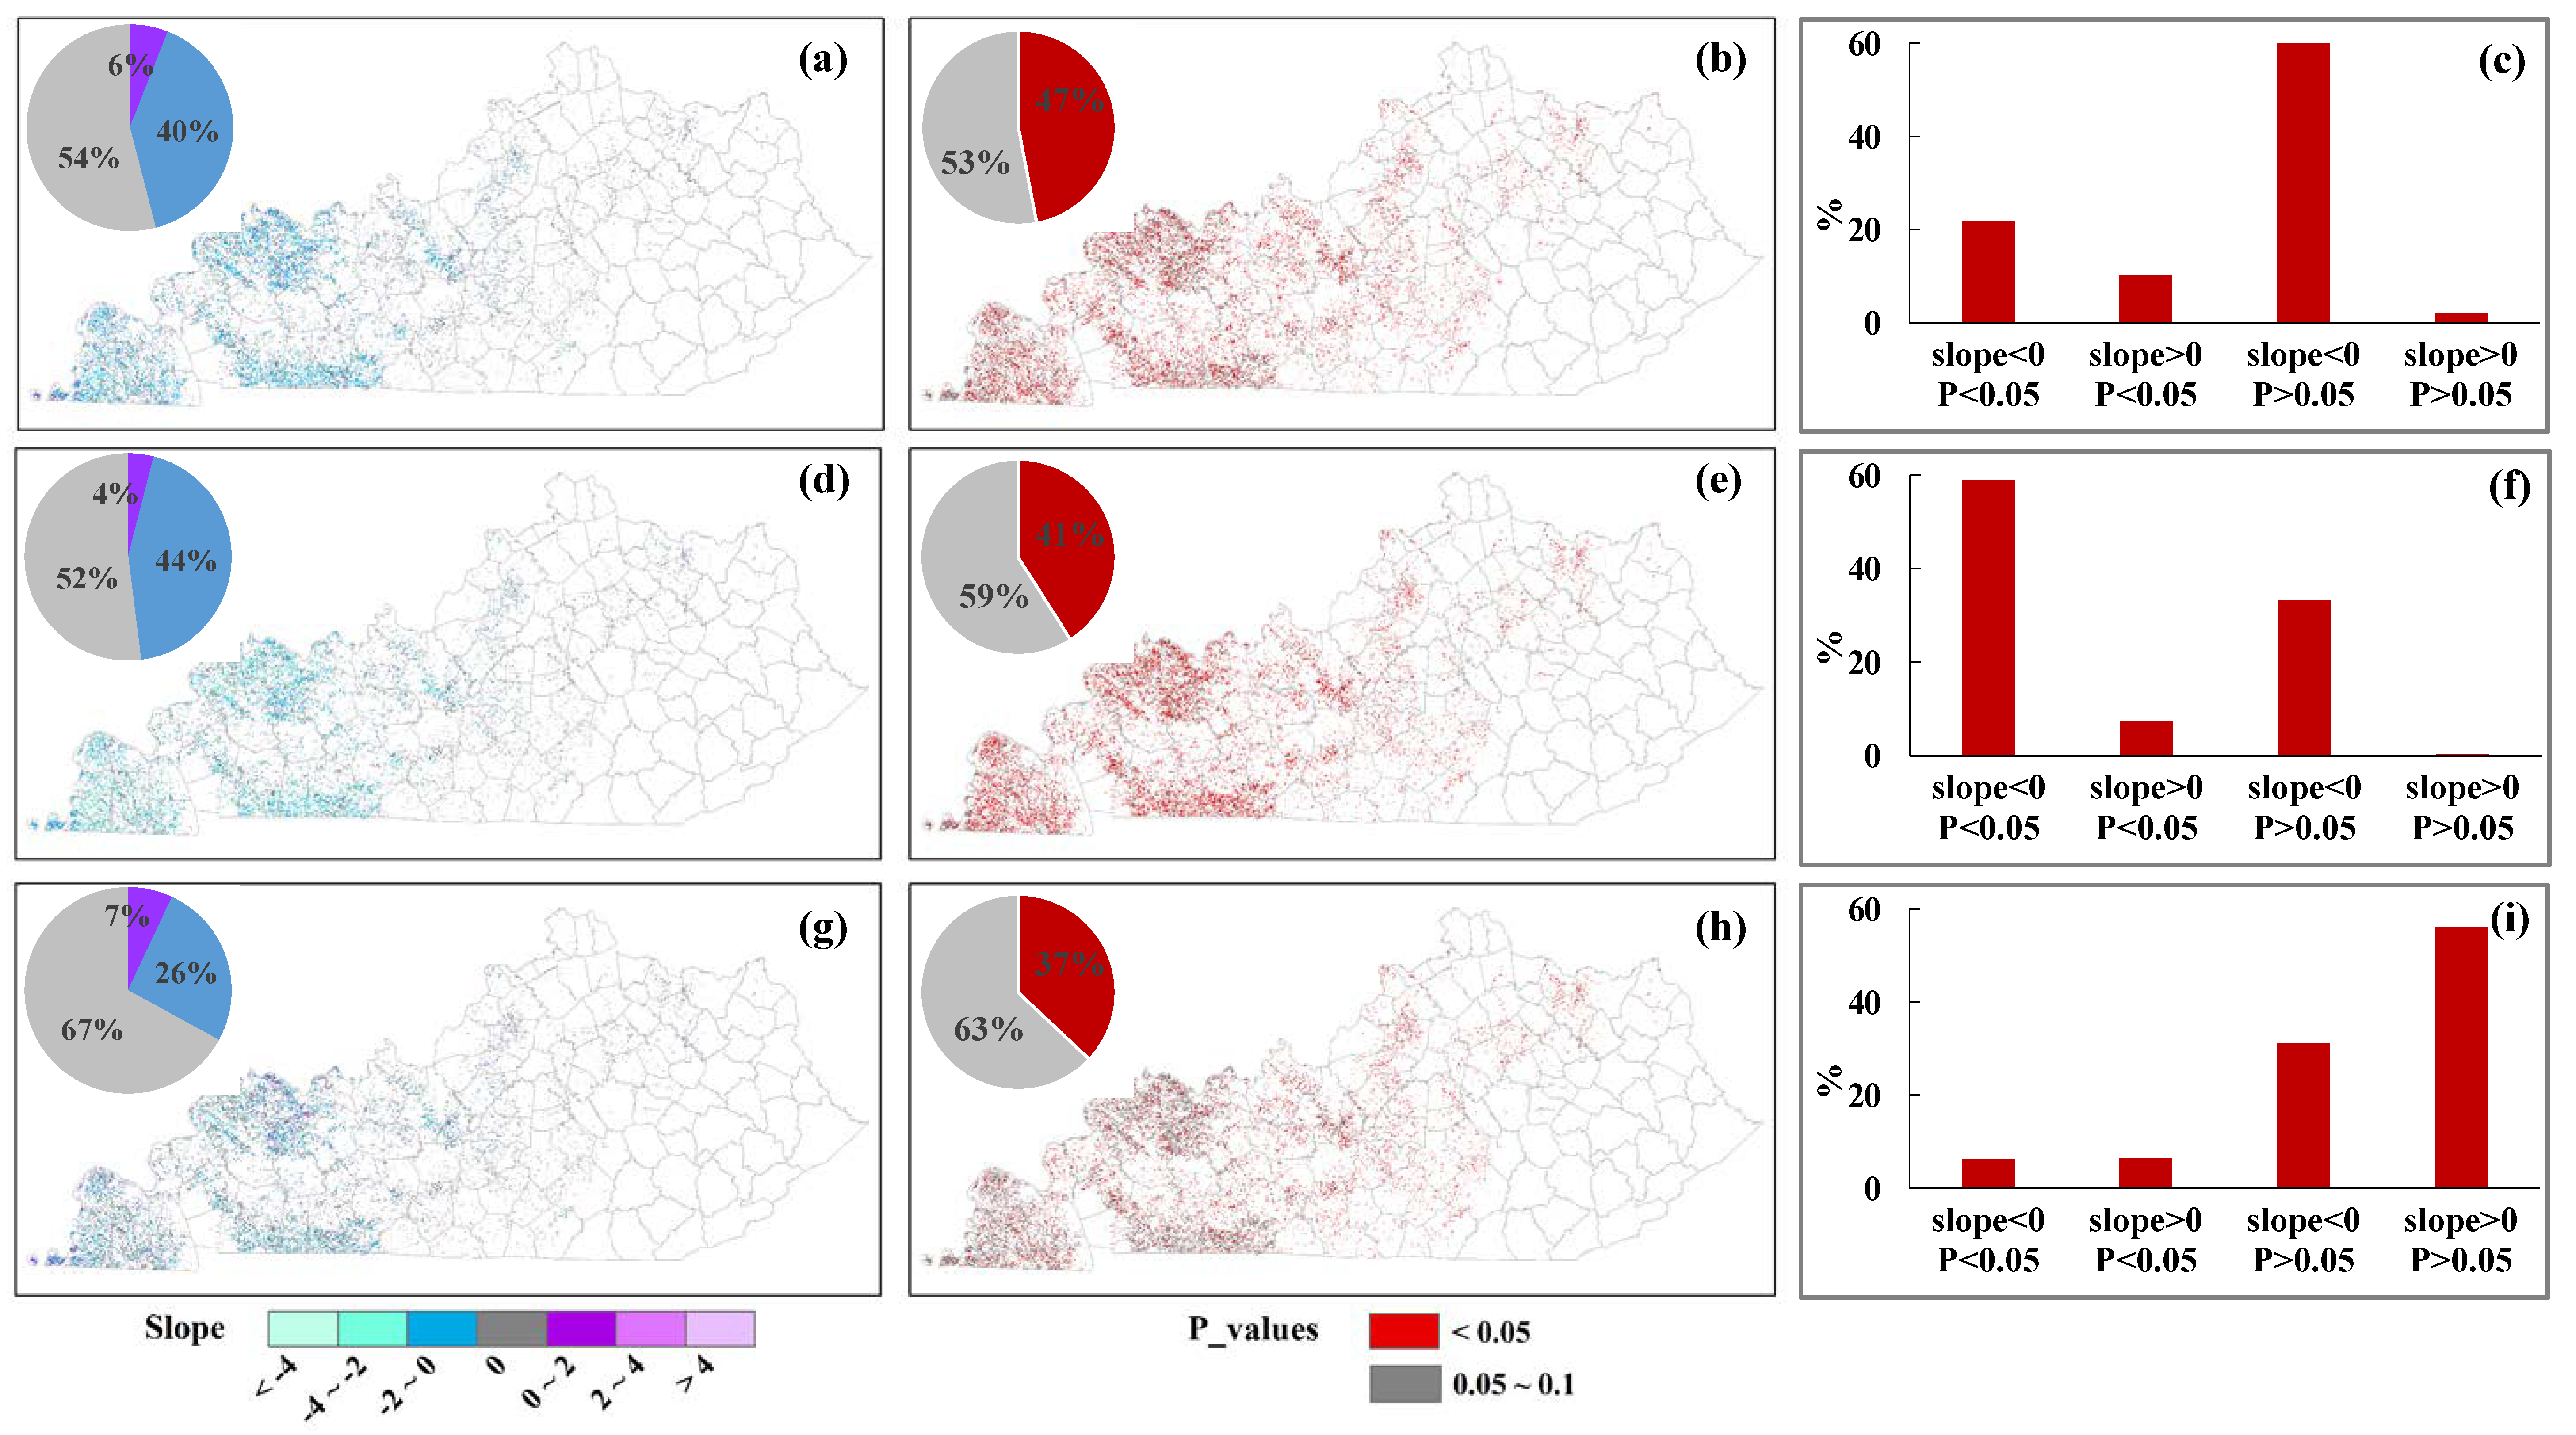
3.3. Changing Trends of Crop Phenology

Phenological trends were analyzed for corn and soybean at the state level over the study period (Figure 7). The crop planting dates were slightly delayed by 0.01 days/year for corn and 0.07 days/year for soybean. Corn harvesting dates were delayed by an average rate of 0.67 days/year, while a slightly advanced pattern (0.05 days/year) in the soybean harvesting dates was detected. The inter-annual variation in the crop growing season length was related to the changing planting and harvesting dates. For soybean, a slightly shortening trend was found at a rate of 0.12 days/year, i.e., 2.28 days over the entire study period. However, the corn growing season experienced an increasing tendency by an average rate of 0.66 days/year, i.e., 12.54 days over the study period.
In addition, widespread negative tendencies were detected for the phenological estimations of corn and soybean from pixel to pixel in Kentucky from 2000 to 2018 (Figure 8 and Figure 9). For corn, the slope values in Figure 8a,d,g showed that more than 40% of corn production areas for planting and harvesting dates, about a third of the area for growing season length, experienced phenological changes. Pixels with unchanged slopes (slope = 0) accounted for more than half of the total pixels for corn planting dates, harvesting dates, as well as growing season length. The pixels with significant changing trends were scattered across the corn production areas (Figure 8b,e,h). The statistical histograms in Figure 8 and Figure 9 displayed all changing slopes that were significant or not in crop planting dates, harvesting dates, and growing season length. According to the statistics (Figure 8c,f,i), the proportions of negative trends (slope < 0) were much larger than those of positive trends (slope > 0), indicating the advanced corn planting dates, harvesting dates, and shortened growing season length over the study area. Figure 8c showed an evident advanced trend over the significant values for corn planting dates. However, for corn harvesting dates (Figure 8f) and the growing season length (Figure 8i), proportions of significant trends with negative and positive slope values were roughly equivalent.
In Figure 9a,d,g, more than a third of pixels with positive or negative trends were observed in soybean planting dates, harvesting dates, and growing season length. Similarly, pixels with unchanged trends (slope = 0) made up to more than half of the total values for three soybean phenological variables. Larger proportions with significant trends occurred in soybean planting and harvesting dates compared with those of corn (Figure 9b,e). Similar significant proportions were found in the growing season length of soybean and corn (Figure 8h and Figure 9h). Advanced in soybean planting and harvesting dates were detected with high proportions of negative values (Figure 9c,f). However, Figure 9i showed that pixels with extended soybean growing season length (slope > 0) accounted for more than 60%, and comparable percentages of positive and negative slopes showed significant trends.

3.4. Trends of Climatic Factors and Its Correlation with Crop Phenology

Maximum temperatures decreased in three seasons and ranged from −0.001 to −0.01 °C/year in Kentucky from 2000 to 2018 (Table 3). Warming trends in minimum and average temperatures were observed, ranging from 0.03 to 0.05 °C/year and from 0.01 to 0.03 °C/year, respectively. Specifically, the minimum temperature during the growing season showed a significant increasing trend with a rate of 0.05 °C/year. Accumulated precipitation increased over time in all seasons in Kentucky. Historical climate records showed that summers from 2014 to 2018 are among the ten wettest summers over the last 30 years in Kentucky (http://kyclimate.org/climtrends.html; accessed on 20 February 2021). Thus, over the years tested, the summer climate trended wetter in Kentucky.
The crop planting/harvesting dates were negatively correlated with three temperature variables but positively correlated with the precipitation for both crops (Table 4 and Table 5). Corn planting dates showed significant correlations with the accumulated precipitation in spring (r = 0.56 for corn, r = 0.49 for soybean). Compared with soybean, corn planting dates were more sensitive to spring temperature, i.e., significant responses were −3.95 days/°C and −3.70 days/°C to Tmax and Tavg, respectively. For harvesting dates, higher correlation coefficients with temperature and precipitation were observed for corn and soybean. In particular, the correlations between crop harvesting dates and Tmax in summer/April–October were higher than 0.7 for corn and 0.65 for soybean. Significant relationships were also found between harvesting and the accumulated precipitation in summer/April–October for corn, and in fall/April–October for soybean, respectively. Corn growing season length exhibited negative sensitivities to temperature variables. Apart from a negative correlation in spring, positive relationships were detected between corn growing season length and the accumulated precipitation. Soybean growing season length was negatively correlated with all climatic factors except with the accumulated precipitation in fall and April–October. Significant correlations between growing season length and precipitation were mainly concentrated in summer/April–October for corn and summer/fall for soybean, respectively (Table 4 and Table 5).

3.5. Trends of Crop Yield and Its Correlation with Crop Phenology

Crop yields showed significant increases in corn (2.19 Bu/acres per year, p < 0.05) and soybean (0.75 Bu/acres per year, p < 0.05), respectively, in Kentucky over the study period. A more noticeable increment was found in corn yield. However, we observed that corn yield consistently increased over time except for the sharp decrease in 2012 (68 Bu/acre), dramatically lower than the average corn yield (143 Bu/acre) of the study period. The reduced crop production was relevant to extreme heatwaves and drought during the summer [46].
We further investigated the relationships between the crop phenological dates and crop yields of corn and soybean using the linear regression analysis (Table 6). Over the 2000–2018 period, a significant positive correlation was found between corn growing season length and corn yield, suggesting that a one-day extension of the growing period increased 1.67 Bu/acres (p < 0.01) in corn yield. Furthermore, significant responses of harvesting dates to crop yields were detected for corn (trend = 1.37 Bu/acre per day, p < 0.01) and soybean (trend = 0.39 Bu/acre per day, p < 0.05), respectively.

4. Discussion

4.1. Comparisons of Remote Sensing-Based Crop Phenology with Other Studies

Various vegetation phenology detecting methods have been developed in previous studies. However, mapping crop phenology is still challenging because the land surface vegetation dynamics or remote sensing phenology is different from crop physiological growth stages [47]. In this study, we detected the crop planting dates, harvesting dates, and growing season length for corn and soybean using an NDVI curve-change-based dynamic threshold approach. This approach linked characteristics of remote sensing vegetation index to crop physiological growth stages. NDVI time series at a daily time step allows for a high degree of coupling between remote sensing and crop growth stages. The threshold setting for each crop phenological stage based on survey data can further improve the reliability of the approach.
Our evaluation results suggested that our estimated crop phenological stages were favorably comparable with the results in previous studies. For example, using a remote sensing approach, Sakamoto et al. [27] reported the RMSEs of estimated phenological dates ranged from 0.7 to 8.6 days for corn and 1.9 to 14.5 days for soybean. In our study, RMSEs of estimated crop phenological dates were between 3.34 and 6.05 days at the state level and between 9.17 and 12.26 days at the county level. The lower accuracy in the county-level estimates was mainly due to limited available site-level field observations for evaluation. However, the state-level evaluation was based on the USDA crop report; its favorable performance illustrates the potential of the NDVI curve-change-based dynamic threshold approach in realistically estimating phenology for corn and soybean.

4.2. Spatial-Temporal Trends of Crop Phenology

We analyzed the state-level linear trends of three estimated crop phenological variables and built their spatial-temporal patterns by the Mann-Kendall test. Many studies have reported that earlier crop planting and extended growing seasons occurred during recent decades, but the changing trends vary depending on the study period [48,49]. Menzel et al. [50] showed that phenological trends were weaker for the most recent 30-year period (1989–2018) compared to the 1976–2005 period for both agricultural and wild plants. Kucharik [30] found that the planting date in approximately 75% across the 12 Corn Belt states was advanced by 0.37 days/year from 1979 to 2005. Notably, Kentucky was among the states with significant changes, with advanced corn planting dates at a rate of 0.8 days/year [30]. Sacks and Kucharik [12] reported that soybean planting dates advanced by 0.49 days/year averaged across the U.S. from 1981 to 2005. However, our study showed a slight delay in crop planting for both corn (0.01 days/year) and soybean (0.07 days/year) at the state level in Kentucky from 2000 to 2018. The changing patterns over different study periods implied that the earlier trend of crop planting season slowed down during the last two decades over the study area. In the Midwest U.S., soybean is usually planted after completing corn planting. Therefore, delayed corn planting dates might cause delayed soybean planting as well [51]. Sacks and Kucharik [12] also showed that the growing season length of corn and soybean was significantly extended by 0.67 and 0.30 days/year, respectively, in the U.S. during 1981–2005. Their findings of the prolonged corn growing season were similar to the results in our study (0.66 days/year).
Meanwhile, we found that soybean experienced a shorter growing season (0.12 days/year) in Kentucky during 2000–2018. According to Sacks and Kucharik [12], both corn (1 day/year) and soybean (0.83 days/year) experienced a trend of earlier harvesting in Kentucky over 1981–2015. However, our study showed largely postponed harvesting for corn (0.67 days/year) and slightly advanced harvesting for soybean (0.05 days/year) during 2000–2018. We also found that the longer corn growing season length could significantly benefit corn yield. The shortened soybean growth period may have undesired consequences for yield but allow more intercropping or earlier sowing of winter cereals [50]. The advanced harvesting dates and shortened growing season of soybean were probably related to the increasing double cropping system in Kentucky [52].

4.3. Effects of Climate Change and Other Factors on Crop Phenology

Temperature is often considered the most critical factor that influences crop phenological change. Many studies suggested advanced trends of crop phenology across the northern hemisphere due to the rising temperatures [53,54]. A long-term study showed that nearly all earlier planting events occurred in warmer years, and more than 80% of them were related to seasonal spring and summer temperatures [17]. In this study, only two climatic variables showed significant changing trends (minimum temperature in April-October and precipitation from June to August) in Kentucky from 2000 to 2018. Sensitivity analysis showed that crop phenology responded negatively to temperature and positively to precipitation, but no significant response was found with the growing season temperature. The overall analysis revealed that the phenology shifts (crop planting and harvesting) were not related to the increasing temperature during April–October.
Climate change raises the concern about how field management could be optimized to adapt to the changes in crop phenological development. The trend analysis showed that temperature did not have distinct warming trends in Kentucky over the study period. However, the crop phenology was observed with significant changes for both corn and soybean. As we discussed, the sensitivity analysis found that only the summer precipitation was significantly related to the delayed corn harvesting dates. The weak linkage between crop phenology and climatic variables implied that changing phenology is relatively dominated by human factors (e.g., management practices and variety improvement). This finding agrees with previous studies showing non-climatic factors (e.g., crop varieties, farmer decisions, cropping systems, and agronomic practices) may lead to changes in crop phenology. For example, Kucharik [30] suggested no strong evidence to support that the warming temperature was the most important factor driving the corn planting trends across the majority of the Corn Belt from 1979 to 2005.
Previous studies have also suggested the use of more advanced equipment and improved field management may be major contributors to planting trends in the spring season [55]. Lithourgidis et al. [56] suggested that farmer decisions were becoming much more efficient at field operations, especially adopting management practices that can facilitate earlier planting. Kucharik [30] presented that a trend toward performing tillage immediately after fall harvests might be one of the most significant changes in agronomic practices. Additionally, crop insurance policy restricts the final planting dates for different crop types in different regions, resulting in shifts in crop phenology [57].

4.4. Effects of Crop Phenological Shift on Crop Yield

Agricultural crop production is closely related to crop phenological change. Previous research presented that the optimum range of crop phenological stages can lead to high crop production [58]. Some studies suggested that warming climate advanced phenological phases and, consequently, shortened crop growth duration, potentially reducing crop yield [2,19]. However, this study found no significant effects of earlier planting on crop yield in Kentucky. Our result is consistent with Sacks and Kucharik [12], which verified that earlier planting did not show significant effects on crop yields across the U.S. Corn Belt. In addition, we found that planting dates did not show significant correlations with crop yield for both corn and soybean in Kentucky. In contrast, corn growing season length and harvesting dates contributed to the increased yield during the last two decades. This result is in agreement with Wu et al. [7], who suggested that a longer growth duration might increase agricultural production. These findings can serve as a benchmark by farmers to access crop phenology and its associated impacts on crop yield in Kentucky.

4.5. Uncertainty and Expectations

This study detected crop phenological stages using the remote sensing-based approach. The state- and county-level evaluations against ground-based datasets illustrated the robustness of this approach. However, this study still involves some uncertainties. First, agriculture in Kentucky is mainly concentrated in the north and west regions, with highly fragmented cropland areas in the rest of the state. In this case, MODIS products at a 500 m spatial resolution may not accurately capture the crop phenological stages in fragmented areas due to the effects of mixed and perimeter pixels. In the next step, data fusion of high-resolution satellite imagery is needed for reducing uncertainties in areas where mixed cropland pixels are dominant. Second, our county-level evaluation was based on very limited field observations; further effort is needed to collect more crop phenology data for robust validation and evaluation. Third, crop phenology is affected by many non-climatic factors. For example, the growing degree days for different crops are species-level characteristics. They may vary among varieties and are highly independent of the circumstances. At present, we cannot identify the impacts of crop variety on phenological shifts due to unavailable associated data not available. This knowledge gap might be filled as high spatial-temporal-spectrum resolution remote sensing images and site-specific variety information are available. Understanding the microclimate impacts on crop phenology will also require more available observations, such as data recorded from flux towers. Fourth, other crop phenological stages, such as the flowering and grain filling stages, also play critical roles in affecting crop development. Future work should endeavor to cover more phenological stages to analyze the effects of climate change and improve the capability of crop yield prediction. Additionally, future studies should explore the application of machine learning techniques on crop phenology detection, which might be a solution to improve the estimation accuracy [2,3].

5. Conclusions

In this study, using MODIS NDVI time series and ground datasets, we detected the planting dates, harvesting dates, and growing season length of corn and soybean in Kentucky from 2000 to 2018. We also investigated their temporal patterns and correlations with climate change and yields. Trend analysis showed that corn experienced delayed planting/harvesting dates and extended growing season length over the study period. However, soybean was found to have delayed planting dates, an advanced harvesting season, and a shortened growing season length. Sensitivity analysis showed that increased seasonal climate temperature could significantly advance the planting and harvesting dates for both corn and soybean. Combining the climate variables and crop phenological patterns revealed that increasing accumulated precipitation in summer was substantially related to the delayed harvesting dates of corn in Kentucky over the study period. This study also suggested that the increasing corn yield had a significant correlation with the delayed harvesting dates and prolonged growing season. No significant correlation was found between climate change and soybean changing phenology. Moreover, changing phenological stages did not contribute to soybean yield. Our findings highlight the future needs to explore the impacts of non-climate-related factors on soybean phenology. The quantitative crop phenology responding to climate change and crop yields may provide farmers and local policy-makers guidelines for optimizing the field operations.

Author Contributions

Conceptualization, B.T., Y.Y. and W.R.; methodology, B.T., W.R. and Y.Y.; software, Y.Y. and Y.H.; validation, B.T., Y.Y. and Y.H.; formal analysis, Y.Y.; investigation, L.L., L.C.D., W.R. and Y.Y.; resources, W.R. and L.C.D.; data curation, Y.Y.; writing—original draft preparation, Y.Y. and B.T.; writing—review and editing, B.T., W.R., L.L., Y.H., C.M., L.C.D., M.S. and B.E.M.; visualization, Y.Y.; supervision, B.T., L.L. and W.R.; project administration, W.R.; funding acquisition, W.R. All authors have read and agreed to the published version of the manuscript.

Funding

This work was supported by NSF grant (no. 1940696) and NASA Kentucky under NASA award No: 80NSSC19M0052.

Institutional Review Board Statement

Not applicable.

Informed Consent Statement

Not applicable.

Data Availability Statement

The data presented in this study are available on request from the corresponding author.

Acknowledgments

We thank four anonymous reviewers and the editor for comments that improved this manuscript. We acknowledge the use of the MODIS data from the Land Processes Distributed Active Archive Center (LPDAAC) (http://lpdaac.usgs.gov/ accessed on 20 February 2021) and the Cropland Data Layer (CDL) maps from CropScape (http://nassgeodata.gmu.edu/CropScape/ accessed on 20 February 2021).

Conflicts of Interest

The authors declare no conflict of interest.

References

  1. Hodges, T. Predicting Crop Phenology; Crc Press: Boca Raton, FL, USA, 1990. [Google Scholar]
  2. Anwar, M.R.; Liu, D.L.; Farquharson, R.; Macadam, I.; Abadi, A.; Finlayson, J.; Wang, B.; Ramilan, T. Climate change impacts on phenology and yields of five broadacre crops at four climatologically distinct locations in Australia. Agric. Syst. 2015, 133-144. [Google Scholar] [CrossRef] [Green Version]
  3. Liu, L.; Zhang, X.; Yu, Y.; Gao, F.; Yang, Z. Real-Time Monitoring of Crop Phenology in the Midwestern United States Using VIIRS Observations. Remote Sens. 2018, 10, 1540. [Google Scholar] [CrossRef] [Green Version]
  4. Wang, H.; Magagi, R.; Goïta, K.; Trudel, M.; McNairn, H.; Powers, J. Crop phenology retrieval via polarimetric SAR decomposition and Random Forest algorithm. Remote Sens. Environ. 2019, 231, 111234. [Google Scholar] [CrossRef]
  5. Yang, L.; He, X.; Shen, F.; Zhou, C.; Zhu, A.X.; Gao, B.; Chen, Z.; Li, M. Improving prediction of soil organic carbon content in croplands using phenological parameters extracted from NDVI time series data. Soil Tillage Res. 2020, 196, 104465. [Google Scholar] [CrossRef]
  6. Lobell, D.B.; Hammer, G.L.; McLean, G.; Messina, C.; Roberts, M.J.; Schlenker, W. The critical role of extreme heat for maize production in the United States. Nat. Clim. Chang. 2013, 3, 497–501. [Google Scholar] [CrossRef]
  7. Wu, D.; Wang, P.; Jiang, C.; Yang, J.; Huo, Z.; Yu, Q. Measured Phenology Response of Unchanged Crop Varieties to Long-Term Historical Climate Change. Int. J. Plant Prod. 2018, 13, 47–58. [Google Scholar] [CrossRef]
  8. Fuhrer, J. Agroecosystem responses to combinations of elevated CO2, ozone, and global climate change. Agric. Ecosyst. Environ. 2003, 97, 1–20. [Google Scholar] [CrossRef]
  9. Xiao, D.; Zhao, Y.; Bai, H.; Hu, Y.; Cao, J. Impacts of climate warming and crop management on maize phenology in northern China. J. Arid Land. 2019, 11, 892–903. [Google Scholar] [CrossRef] [Green Version]
  10. Abbas, G.; Ahmad, S.; Ahmad, A.; Nasim, W.; Fatima, Z.; Hussain, S.; Rehman, M.H.U.; Khan, M.A.; Hasanuzzaman, M.; Fahad, S.; et al. Quantification the impacts of climate change and crop management on phenology of maize-based cropping system in Punjab, Pakistan. Agric. For. Meteorol. 2017, 247, 42–55. [Google Scholar] [CrossRef]
  11. Liu, F.; Chen, Y.; Shi, W.; Zhang, S.; Tao, F.; Ge, Q. Influences of agricultural phenology dynamic on land surface biophysical process and climate feedback. J. Geogr. Sci. 2017, 27, 1085–1099. [Google Scholar] [CrossRef]
  12. Sacks, W.J.; Kucharik, C.J. Crop management and phenology trends in the U.S. Corn Belt: Impacts on yields, evapotranspiration and energy balance. Agric. For. Meteorol. 2011, 151, 882–894. [Google Scholar] [CrossRef]
  13. He, L.; Jin, N.; Yu, Q. Impacts of climate change and crop management practices on soybean phenology changes in China. Sci. Total Environ. 2020, 707, 135638. [Google Scholar] [CrossRef] [PubMed]
  14. Jagadish, S.V.K.; Bahuguna, R.N.; Djanaguiraman, M.; Gamuyao, R.; Prasad, P.V.V.; Craufurd, P.Q. Implications of High Temperature and Elevated CO2 on Flowering Time in Plants. Front. Plant Sci. 2016, 7, 913. [Google Scholar] [CrossRef] [PubMed] [Green Version]
  15. Cho, S.J.; McCarl, B.A. Climate change influences on crop mix shifts in the United States. Sci. Rep. 2017, 7, 40845. [Google Scholar] [CrossRef] [Green Version]
  16. Tian, H.; Ren, W.; Tao, B.; Sun, G.; Chappelka, A.; Wang, X.; Pan, S.; Yang, J.; Liu, J.S.; Felzer, B.M.; et al. Climate extremes and ozone pollution: A growing threat to China’s food security. Ecosyst. Health Sustain. 2016, 2, e01203. [Google Scholar] [CrossRef] [Green Version]
  17. Estrella, N.; Sparks, T.H.; Menzel, A. Trends and temperature response in the phenology of crops in Germany. Glob. Chang. Biol. 2007, 13, 1737–1747. [Google Scholar] [CrossRef]
  18. Tao, F.; Zhang, S.; Zhang, Z.; Rotter, R.P. Maize growing duration was prolonged across China in the past three decades under the combined effects of temperature, agronomic management, and cultivar shift. Glob. Chang. Biol. 2014, 20, 3686–3699. [Google Scholar] [CrossRef]
  19. Tubiello, F.N.; Donatelli, M.; Rosenzweig, C.; Stockle, C.O. Effects of climate change and elevated CO2 on cropping systems: Model predictions at two Italian locations. Eur. J. Agron. 2000, 13, 179–189. [Google Scholar] [CrossRef]
  20. Menzel, A. Phenology: Its importance to the global change community. Clim. Chang. 2002, 54, 379–385. [Google Scholar] [CrossRef]
  21. Sacks, W.J.; Deryng, D.; Foley, J.A.; Ramankutty, N. Crop planting dates: An analysis of global patterns. Glob. Ecol. Biogeogr. 2010, 19, 607–620. [Google Scholar] [CrossRef]
  22. Ortiz-Monasterio, J.I.; Lobell, D.B. Remote sensing assessment of regional yield losses due to sub-optimal planting dates and fallow period weed management. Field Crops Res. 2007, 101, 80–87. [Google Scholar] [CrossRef]
  23. De Castro, A.; Six, J.; Plant, R.; Peña, J. Mapping Crop Calendar Events and Phenology-Related Metrics at the Parcel Level by Object-Based Image Analysis (OBIA) of MODIS-NDVI Time-Series: A Case Study in Central California. Remote Sens. 2018, 10, 1745. [Google Scholar] [CrossRef] [Green Version]
  24. Kotsuki, S.; Tanaka, K. SACRA—a method for the estimation of global high-resolution crop calendars from a satellite-sensed NDVI. Hydrol. Earth Syst. Sci. 2015, 19, 4441–4461. [Google Scholar] [CrossRef] [Green Version]
  25. Pan, Y.; Nie, Y.; Watene, C.; Zhu, J.; Liu, F. Phenological Observations on Classical Prehistoric Sites in the Middle and Lower Reaches of the Yellow River Based on Landsat NDVI Time Series. Remote Sens. 2017, 9, 374. [Google Scholar] [CrossRef] [Green Version]
  26. Boschetti, M.; Stroppiana, D.; Brivio, P.A.; Bocchi, S. Multi-year monitoring of rice crop phenology through time series analysis of MODIS images. Int. J. Remote Sens. 2009, 30, 4643–4662. [Google Scholar] [CrossRef]
  27. Sakamoto, T.; Wardlow, B.D.; Gitelson, A.A.; Verma, S.B.; Suyker, A.E.; Arkebauer, T.J. A two-step filtering approach for detecting maize and soybean phenology with time-series MODIS data. Remote Sens. Environ. 2010, 114, 2146–2159. [Google Scholar] [CrossRef]
  28. Huang, X.; Liu, J.; Zhu, W.; Atzberger, C.; Liu, Q. The Optimal Threshold and Vegetation Index Time Series for Retrieving Crop Phenology Based on a Modified Dynamic Threshold Method. Remote Sens. 2019, 11, 2725. [Google Scholar] [CrossRef] [Green Version]
  29. Gil-Alana, L.A.; Sauci, L. US temperatures: Time trends and persistence. Int. J. Climatol. 2019, 39, 5091–5103. [Google Scholar] [CrossRef]
  30. Kucharik, C.J. A Multidecadal Trend of Earlier Corn Planting in the Central USA. J. Agron. 2006, 98, 1544–1550. [Google Scholar] [CrossRef] [Green Version]
  31. Chen, M.; Griffis, T.J.; Baker, J.; Wood, J.D.; Xiao, K. Simulating crop phenology in the Community Land Model and its impact on energy and carbon fluxes. J. Geophys. Res. Biogeosci. 2015, 120, 310–325. [Google Scholar] [CrossRef]
  32. Piao, S.; Wang, X.; Park, T.; Chen, C.; Lian, X.; He, Y.; Bjerke, J.W.; Chen, A.; Ciais, P.; Tømmervik, H.; et al. Characteristics, drivers and feedbacks of global greening. Nat. Rev. Earth Environ. 2019, 1, 14–27. [Google Scholar] [CrossRef]
  33. Thompson, J.A.; Paull, D.J. Assessing spatial and temporal patterns in land surface phenology for the Australian Alps (2000–2014). Remote Sens. Environ. 2017, 199, 1–13. [Google Scholar] [CrossRef]
  34. Thornton, P.E.; Thornton, M.M.; Mayer, B.W.; Wei, Y.; Devarakonda, R.; Vose, R.S.; Cook, R.B. Daymet: Daily Surface Weather Data on a 1-km Grid for North America, 3rd ed.; ORNL DAAC: Oak Ridge, TN, USA, 2014. [Google Scholar]
  35. Rouse, J.W.; Haas, R.H.; Schell, J.A.; Deering, D.W.; Harlan, J.C. Monitoring the Vernal Advancement and Retrogradation (Green Wave Effect) of Natural Vegetation; NASA Special Publication: Greenbelt, MD, USA, 1974. [Google Scholar]
  36. Zhou, J.; Jia, L.; Menenti, M. Reconstruction of global MODIS NDVI time series: Performance of Harmonic ANalysis of Time Series (HANTS). Remote Sens. Environ. 2015, 163, 217–228. [Google Scholar] [CrossRef]
  37. Ren, J.; Campbell, J.B.; Shao, Y. Estimation of SOS and EOS for Midwestern US Corn and Soybean Crops. Remote Sens. 2017, 9, 722. [Google Scholar] [CrossRef] [Green Version]
  38. Xu, X.; Conrad, C.; Doktor, D. Optimising Phenological Metrics Extraction for Different Crop Types in Germany Using the Moderate Resolution Imaging Spectrometer (MODIS). Remote Sens. 2017, 9, 254. [Google Scholar] [CrossRef] [Green Version]
  39. Galford, G.L.; Mustard, J.F.; Melillo, J.; Gendrin, A.; Cerri, C.C.; Cerri, C.E. Wavelet analysis of MODIS time series to detect expansion and intensification of row-crop agriculture in Brazil. Remote Sens. Environ. 2008, 112, 576–587. [Google Scholar] [CrossRef]
  40. Li, L.; Friedl, M.A.; Xin, Q.; Gray, J.; Pan, Y.; Frolking, S. Mapping Crop Cycles in China Using MODIS-EVI Time Series. Remote Sens. 2014, 6, 2473–2493. [Google Scholar] [CrossRef] [Green Version]
  41. Sakamoto, T.; Yokozawa, M.; Toritani, H.; Shibayama, M.; Ishitsuka, N.; Ohno, H. A crop phenology detection method using time-series MODIS data. Remote Sens. Environ. 2005, 96, 366–374. [Google Scholar] [CrossRef]
  42. Alcaraz-Segura, D.; Chuvieco, E.; Epstein, H.E.; Kasischke, E.S.; Trishchenko, A. Debating the greening vs. browning of the North American boreal forest: Differences between satellite datasets. Glob. Chang. Biol. 2010, 16, 760–770. [Google Scholar] [CrossRef]
  43. Gilbert, R.O. Statistical Methods for Environmental Pollution Monitoring; John Wiley & Sons: Hoboken, NJ, USA, 1987. [Google Scholar]
  44. Sen, P.K. Estimates of the regression coefficient based on Kendall’s tau. J. Am. Stat. Assoc. 1968, 63, 1379–1389. [Google Scholar] [CrossRef]
  45. Breiman, L. Random forests. Mach. Learn. 2001, 45, 5–32. [Google Scholar] [CrossRef] [Green Version]
  46. Boyer, J.S.; Byrne, P.; Cassman, K.G.; Cooper, M.; Delmer, D.; Greene, T.; Gruis, F.; Habben, J.; Hausmann, N.; Kenny, N.; et al. The US drought of 2012 in perspective: A call to action. Glob. Food Sec. 2013, 2, 139–143. [Google Scholar] [CrossRef]
  47. Gao, F.; Zhang, X. Mapping Crop Phenology in Near Real-Time Using Satellite Remote Sensing: Challenges and Opportunities. Int. J. Remote Sens. 2021, 2021, 1–14. [Google Scholar] [CrossRef]
  48. Piao, S.; Liu, Q.; Chen, A.; Janssens, I.A.; Fu, Y.; Dai, J.; Liu, L.; Lian, X.; Shen, M.; Zhu, X. Plant phenology and global climate change: Current progresses and challenges. Glob. Chang. Biol. 2019, 25, 1922–1940. [Google Scholar] [CrossRef]
  49. Shen, Y.; Liu, X. Phenological Changes of Corn and Soybeans over U.S. by Bayesian Change-Point Model. Sustainability 2015, 7, 6781–6803. [Google Scholar] [CrossRef] [Green Version]
  50. Menzel, A.; Yuan, Y.; Matiu, M.; Sparks, T.; Scheifinger, H.; Gehrig, R.; Estrella, N. Climate change fingerprints in recent European plant phenology. Glob. Chang. Biol. 2020, 26, 2599–2612. [Google Scholar] [CrossRef] [PubMed] [Green Version]
  51. De Bruin, J.L.; Pedersen, P. Soybean seed yield response to planting date and seeding rate in the Upper Midwest. J. Agron. 2008, 100, 696–703. [Google Scholar] [CrossRef]
  52. Egli, D.B. Soybean yield trends from 1972 to 2003 in mid-western USA. Field Crops Res. 2008, 106, 53–59. [Google Scholar] [CrossRef]
  53. Nguyen-Sy, T.; Cheng, W.; Tawaraya, K.; Sugawara, K.; Kobayashi, K. Impacts of climatic and varietal changes on phenology and yield components in rice production in Shonai region of Yamagata Prefecture, Northeast Japan for 36 years. Plant Prod. Sci. 2019, 22, 382–394. [Google Scholar] [CrossRef] [Green Version]
  54. Hughes, L. Biological consequences of global warming: Is the signal already apparent? Trends Ecol. Evol. 2000, 15, 56–61. [Google Scholar] [CrossRef]
  55. Popp, M.P.; Oliver, L.R.; Dillon, C.R.; Keisling, T.C.; Manning, P.M. Evaluation of seedbed preparation, planting method, and herbicide alternatives for dryland soybean production. Agron. J. 2000, 92, 1149–1155. [Google Scholar] [CrossRef] [Green Version]
  56. Lithourgidis, A.S.; Tsatsarelis, C.A.; Dhima, K.V. Tillage effects on corn emergence, silage yield, and labor and fuel inputs in double cropping with wheat. Crop Sci. 2005, 45, 2523–2528. [Google Scholar] [CrossRef]
  57. Du, X.; Feng, H.; Hennessy, D.A. Rationality of Choices in Subsidized Crop Insurance Markets. Am. J. Agric. Econ. 2016, 99, 732–756. [Google Scholar] [CrossRef] [Green Version]
  58. Knott, C.; Herbek, J.; James, J. Early Planting Dates Maximize Soybean Yield in Kentucky. Crop Forage Turfgrass Manag. 2019, 5, 1–6. [Google Scholar] [CrossRef]
Figure 1. Maps of the study area (Kentucky, overview, and CDL (Cropland Data Layer is derived from USDA NASS)).
Remotesensing 13 01615 g001
Figure 2. NDVI curves and second derivative of smoothed NDVI for (a) corn and (b) soybean with key points for planting and harvesting dates (● Planting date, Second derivative peak; ▲ Harvesting date, Second derivative peak. Pure pixels were selected in the study area based on the CDL map).
Remotesensing 13 01615 g002
Figure 3. Evaluation of estimated crop phenology at the state level (N is 15 years, blue for corn and black for soybean; (a) planting dates; (b) harvesting dates).
Remotesensing 13 01615 g003
Figure 4. Comparison between the estimated and observed crop phenology at the county level (Red line represents the mean values of each group; Black points represent the values of 5th and 95th of each group; Corn_Ob and Soy_ob represent phenological observations from field tests; Corn_RS and Soy_RS represent phenological estimations from remote sensing).
Remotesensing 13 01615 g004
Figure 5. Spatial variations of corn phenological stages in Kentucky.
Remotesensing 13 01615 g005
Figure 6. Spatial variations of soybean phenological stages in Kentucky.
Remotesensing 13 01615 g006
Figure 7. Linear regression analysis for trends of phenological stages in Kentucky, 2000–2018 ((a) corn, (b) soybean).
Remotesensing 13 01615 g007
Figure 8. Slope, p values, and their percentages of planting dates (ac) harvesting dates (df) and growing season length (gi) of corn in Kentucky, 2000–2018 (Slope: change rate of crop phenological dates; p values: the confidence of trend analysis; we only included pixels that were identified as corn for more than 12 years in the Mann-Kendall statistical test).
Remotesensing 13 01615 g008
Figure 9. Slope, p values, and their percentages of planting dates (ac) harvesting dates (df) and growing season length (gi) of soybean in Kentucky, 2000–2018 (Slope: change rate of crop phenological dates; p values: the confidence of trend analysis; we only included pixels that were identified as soybean for more than 12 years in the Mann-Kendall statistical test).
Remotesensing 13 01615 g009
Table 1. Description of datasets used in this study.
Datasets SourcesCrop TypesScales PeriodsInformation
Crop progress reportCorn/soybeanState 2004–2018Planting/harvesting dates
Kentucky Hybrid Corn Performance TestCornCounty2000–2018Planting/harvesting dates
Kentucky Soybean Variety Performance TrialsSoybeanCounty2000–2018Planting/harvesting dates
Quick Stats (NASS)Corn/soybeanState2000–2018Yields
Table 2. Parameter thresholds derived from the crop reports dataset used for crop phenology detection.
Phenology DescriptionsHeading DatesPlanting DatesHarvesting Dates
The Peak (DOY) of NDVI Time SeriesThe Peak (DOY) of the 2nd DerivativeThe Peak (DOY) of the 2nd Derivative
Corn: 2000–2004[143, 254][106, 143][254, 320]
Corn: 2005–2009[152, 249][101, 152][249, 314]
Corn: 2010–2014[161, 251][100, 161][251, 319]
Corn: 2015–2019[151, 248][98, 151][248, 301]
Time ranges[143, 254][98, 161][248, 320]
Soybean: 2000–2004[172, 262][113, 172][262, 313]
Soybean: 2005–2009[179, 261][121, 179][261, 305]
Soybean: 2010–2014[183, 265][112, 183][265, 332]
Soybean: 2015–2019[179, 261][125, 179][261, 302]
Time ranges[172, 265][112, 183][261, 332]
Table 3. Trends of seasonal climatic factors in Kentucky, 2000–2018.
SeasonsTmaxTminTavgPrec
Trends
(°C/year)
rTrends
(°C/year)
rTrends
(°C/year)
rTrends
(mm/year)
r
Spring −0.01−0.050.030.160.010.053.580.21
Summer −0.001−0.0030.040.280.020.135.400.41
Fall−0.01−0.030.040.220.020.090.640.04
Apr–Oct0.010.080.05 *0.540.030.318.410.32
Note: Trends are significant with * p < 0.05. Tmax, Tmin, Tavg, and Prec represent the maximum temperature, minimum temperature, average temperature, and precipitation, respectively.
Table 4. Correlations between corn phenology and climatic variables in Kentucky, 2000–2018.
Climate Variables in Individual SeasonsPlanting DatesClimate Variables in Individual SeasonsHarvesting DatesClimate Variables in Individual SeasonsGrowing Season Length
r Response (days/°C; days/mm)r Response (days/°C; days/mm)rResponse (days/°C; days/mm)
Tmax in Spring−0.56 *−3.95Tmax in Spring−0.53 *−4.77Tmax in Spring−0.11−0.82
Tmin in Spring−0.33−2.64Tmin in Spring−0.27−2.83Tmin in Spring−0.02−0.19
Tavg in Spring−0.48 *−3.70Tavg in Spring−0.43−4.30Tavg in Spring−0.07−0.60
Prec in Spring0.56 *0.05Prec in Spring0.200.02Prec in Spring−0.28−0.02
Tmax in Summer−0.72 *−7.20Tmax in Summer−0.46 *−3.86
Tmin in Summer−0.47 *−6.18Tmin in Summer−0.38−4.24
Tavg in Summer−0.67 *−8.26Tavg in Summer−0.47 *−4.84
Prec in Summer0.450.06Prec in Summer0.330.04
Tmax in Fall−0.47 *−3.73Tmax in Fall−0.27−1.81
Tmin in Fall−0.20−2.05Tmin in Fall−0.09−0.77
Tavg in Fall−0.41−4.32Tavg in Fall−0.22−1.98
Prec in Fall0.100.01Prec in Fall0.070.01
Tmax in Apr–Oct−0.77 *−9.94Tmax in Apr–Oct−0.39−4.30
Tmin in Apr–Oct−0.36−6.84Tmin in Apr–Oct−0.16−2.47
Tavg in Apr–Oct−0.69 *−12.19Tavg in Apr–Oct−0.34−5.06
Prec in Apr–Oct0.47 *0.03Prec in Apr–Oct0.170.01
Note: Trends are significant with * p < 0.05. Tmin, Tmax, Tavg, and Prec denotes monthly values of maximum, minimum, average temperatures, and cumulative precipitation.
Table 5. Correlations between soybean phenology and climatic variables in Kentucky, 2000–2018.
Climate Variables in Individual SeasonsPlanting Dates Climate Variables in Individual SeasonsHarvesting DatesClimate Variables in Individual SeasonsGrowing Season Length
r Response (days/°C; days/mm)r Response (days/°C; days/mm)rResponse (days/°C; days/mm)
Tmax in Spring −0.34−1.71Tmax in Spring −0.35−2.84Tmax in Spring −0.15−1.13
Tmin in Spring −0.11−0.64Tmin in Spring −0.23−2.10Tmin in Spring −0.17−1.46
Tavg in Spring −0.25−1.37Tavg in Spring −0.30−2.76Tavg in Spring −0.16−1.39
Prec in Spring 0.49*0.03Prec in Spring 0.110.01Prec in Spring −0.20−0.02
Tmax in Summer −0.67 *−5.93Tmax in Summer −0.35−2.93
Tmin in Summer −0.48 *−5.59Tmin in Summer −0.37−4.05
Tavg in Summer −0.64 *−7.03Tavg in Summer −0.39−4.04
Prec in Summer 0.240.03Prec in Summer −0.03−0.003
Tmax in Fall−0.65 *−4.65Tmax in Fall−0.55 *−3.68
Tmin in Fall−0.09−0.82Tmin in Fall−0.08−0.73
Tavg in Fall−0.47 *−4.50Tavg in Fall−0.41−3.60
Prec in Fall0.52 *0.05Prec in Fall0.54 *0.05
Tmax in Apr-Oct−0.69 *−8.00Tmax in Apr-Oct−0.38−4.09
Tmin in Apr-Oct−0.23−3.92Tmin in Apr-Oct−0.14−2.24
Tavg in Apr-Oct−0.58 *−9.11Tavg in Apr-Oct−0.32−4.77
Prec in Apr-Oct0.49 *0.03Prec in Apr-Oct0.210.01
Note: Trends are significant with * p < 0.05. Tmin, Tmax, Tavg, and Prec denotes monthly values of maximum, minimum, average temperatures, and cumulative precipitation.
Table 6. Correlations between crop phenology and crop yields in Kentucky, 2000–2018.
Crop Phenology rTrends (Bu/acre per day)
Corn planting dates0.150.42
Corn harvesting dates0.70 *1.37
Corn growing period0.71 *1.67
Soybean planting dates0.380.48
Soybean harvesting dates0.51 *0.39
Soybean growing period0.300.24
Note: Trends are significant with * p < 0.05.
Publisher’s Note: MDPI stays neutral with regard to jurisdictional claims in published maps and institutional affiliations.

