
Start of the Green Season and Normalized Difference Vegetation Index in Alaska’s Arctic National Parks


Abstract
:1. Introduction
2. Materials and Methods
2.1. Study Area
2.2. Satellite Data Analysis
- Fit a 90th percentile smoothing spline curve to NDVI vs. ordinal date (1 to 365), using all available years of data.
- Locate the two-week interval with the flattest slope of the curve from step 1 in the fall; “fall” is defined as day number greater than 240 (28 Aug) and smoothed NDVI greater than 0.1 (a level indicating snow cover). Compute the mean NDVI value of this two-week period from the fitted curve (90th percentile) values. This is the assumed NDVI of senesced, snow-free vegetation in the pixel.
- Fit 90th percentile smoothing spline curves to NDVI vs. ordinal date for each individual year.
- Find the date on each annual curve from step (3) where NDVI first crosses the level of senesced vegetation from step (2). This is the start of the green season.
2.3. Ground Verification
3. Results
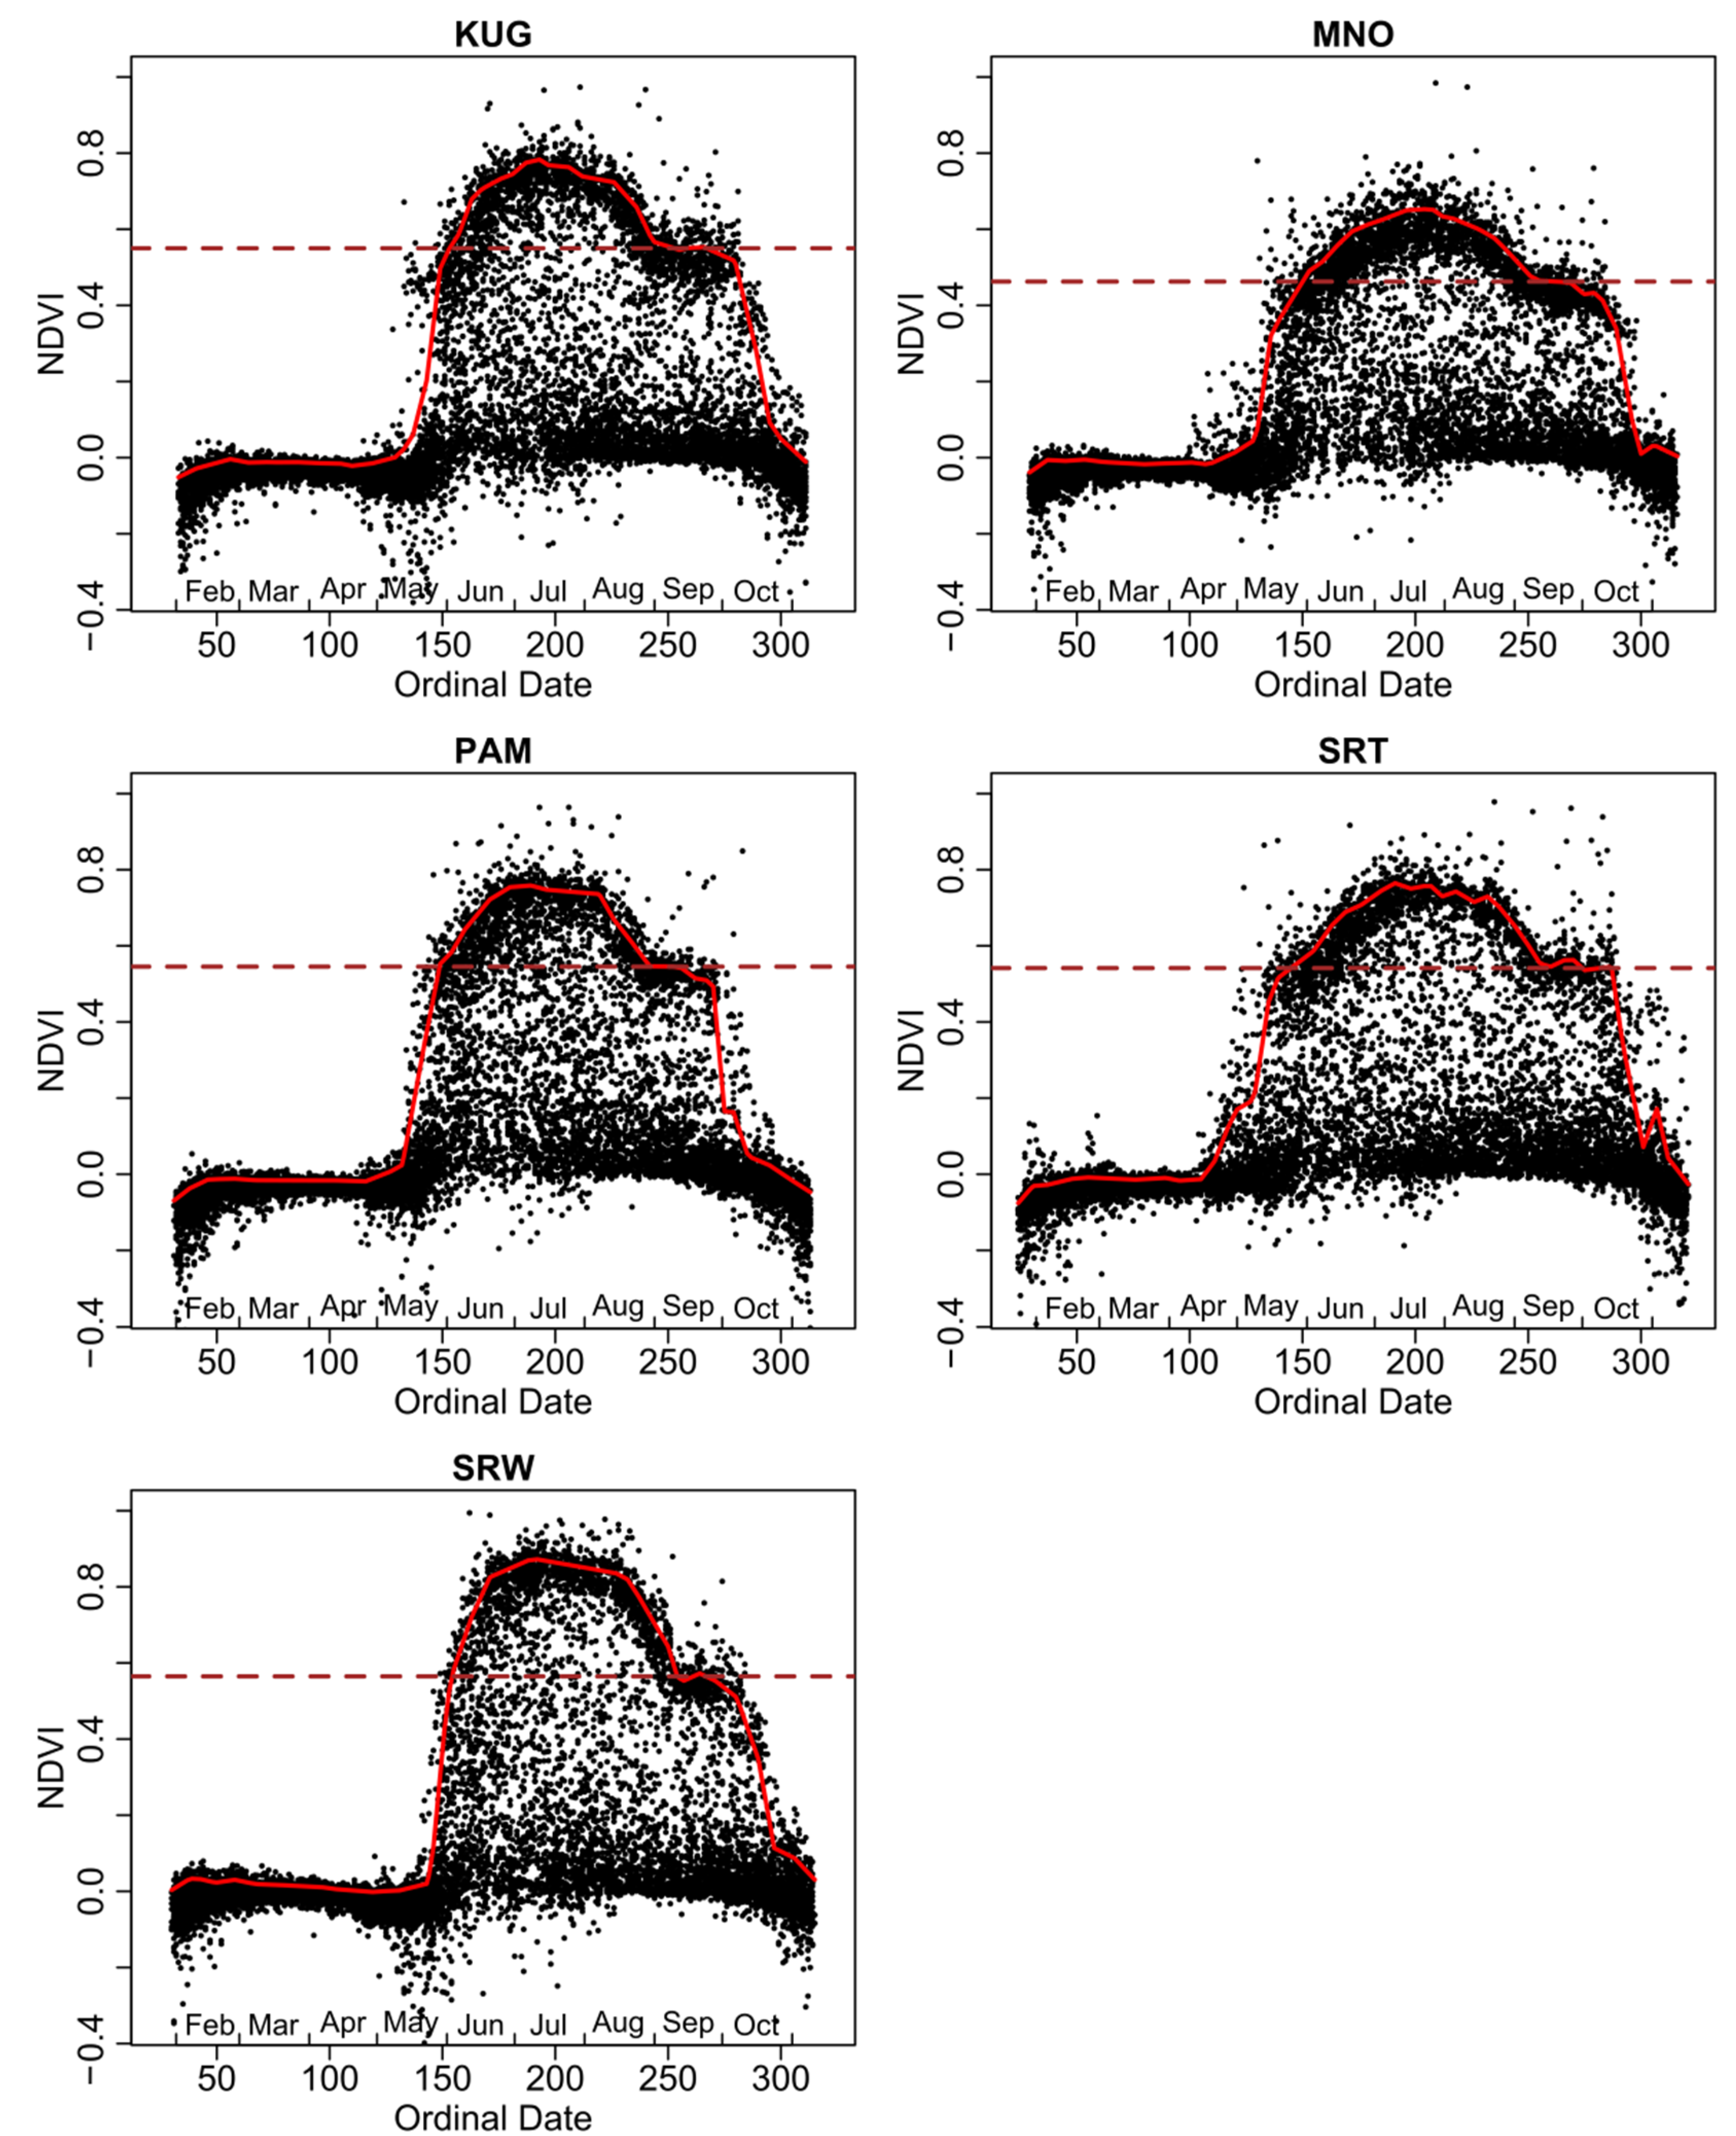
3.1. Annual NDVI Cycle at the Climate Monitoring Stations
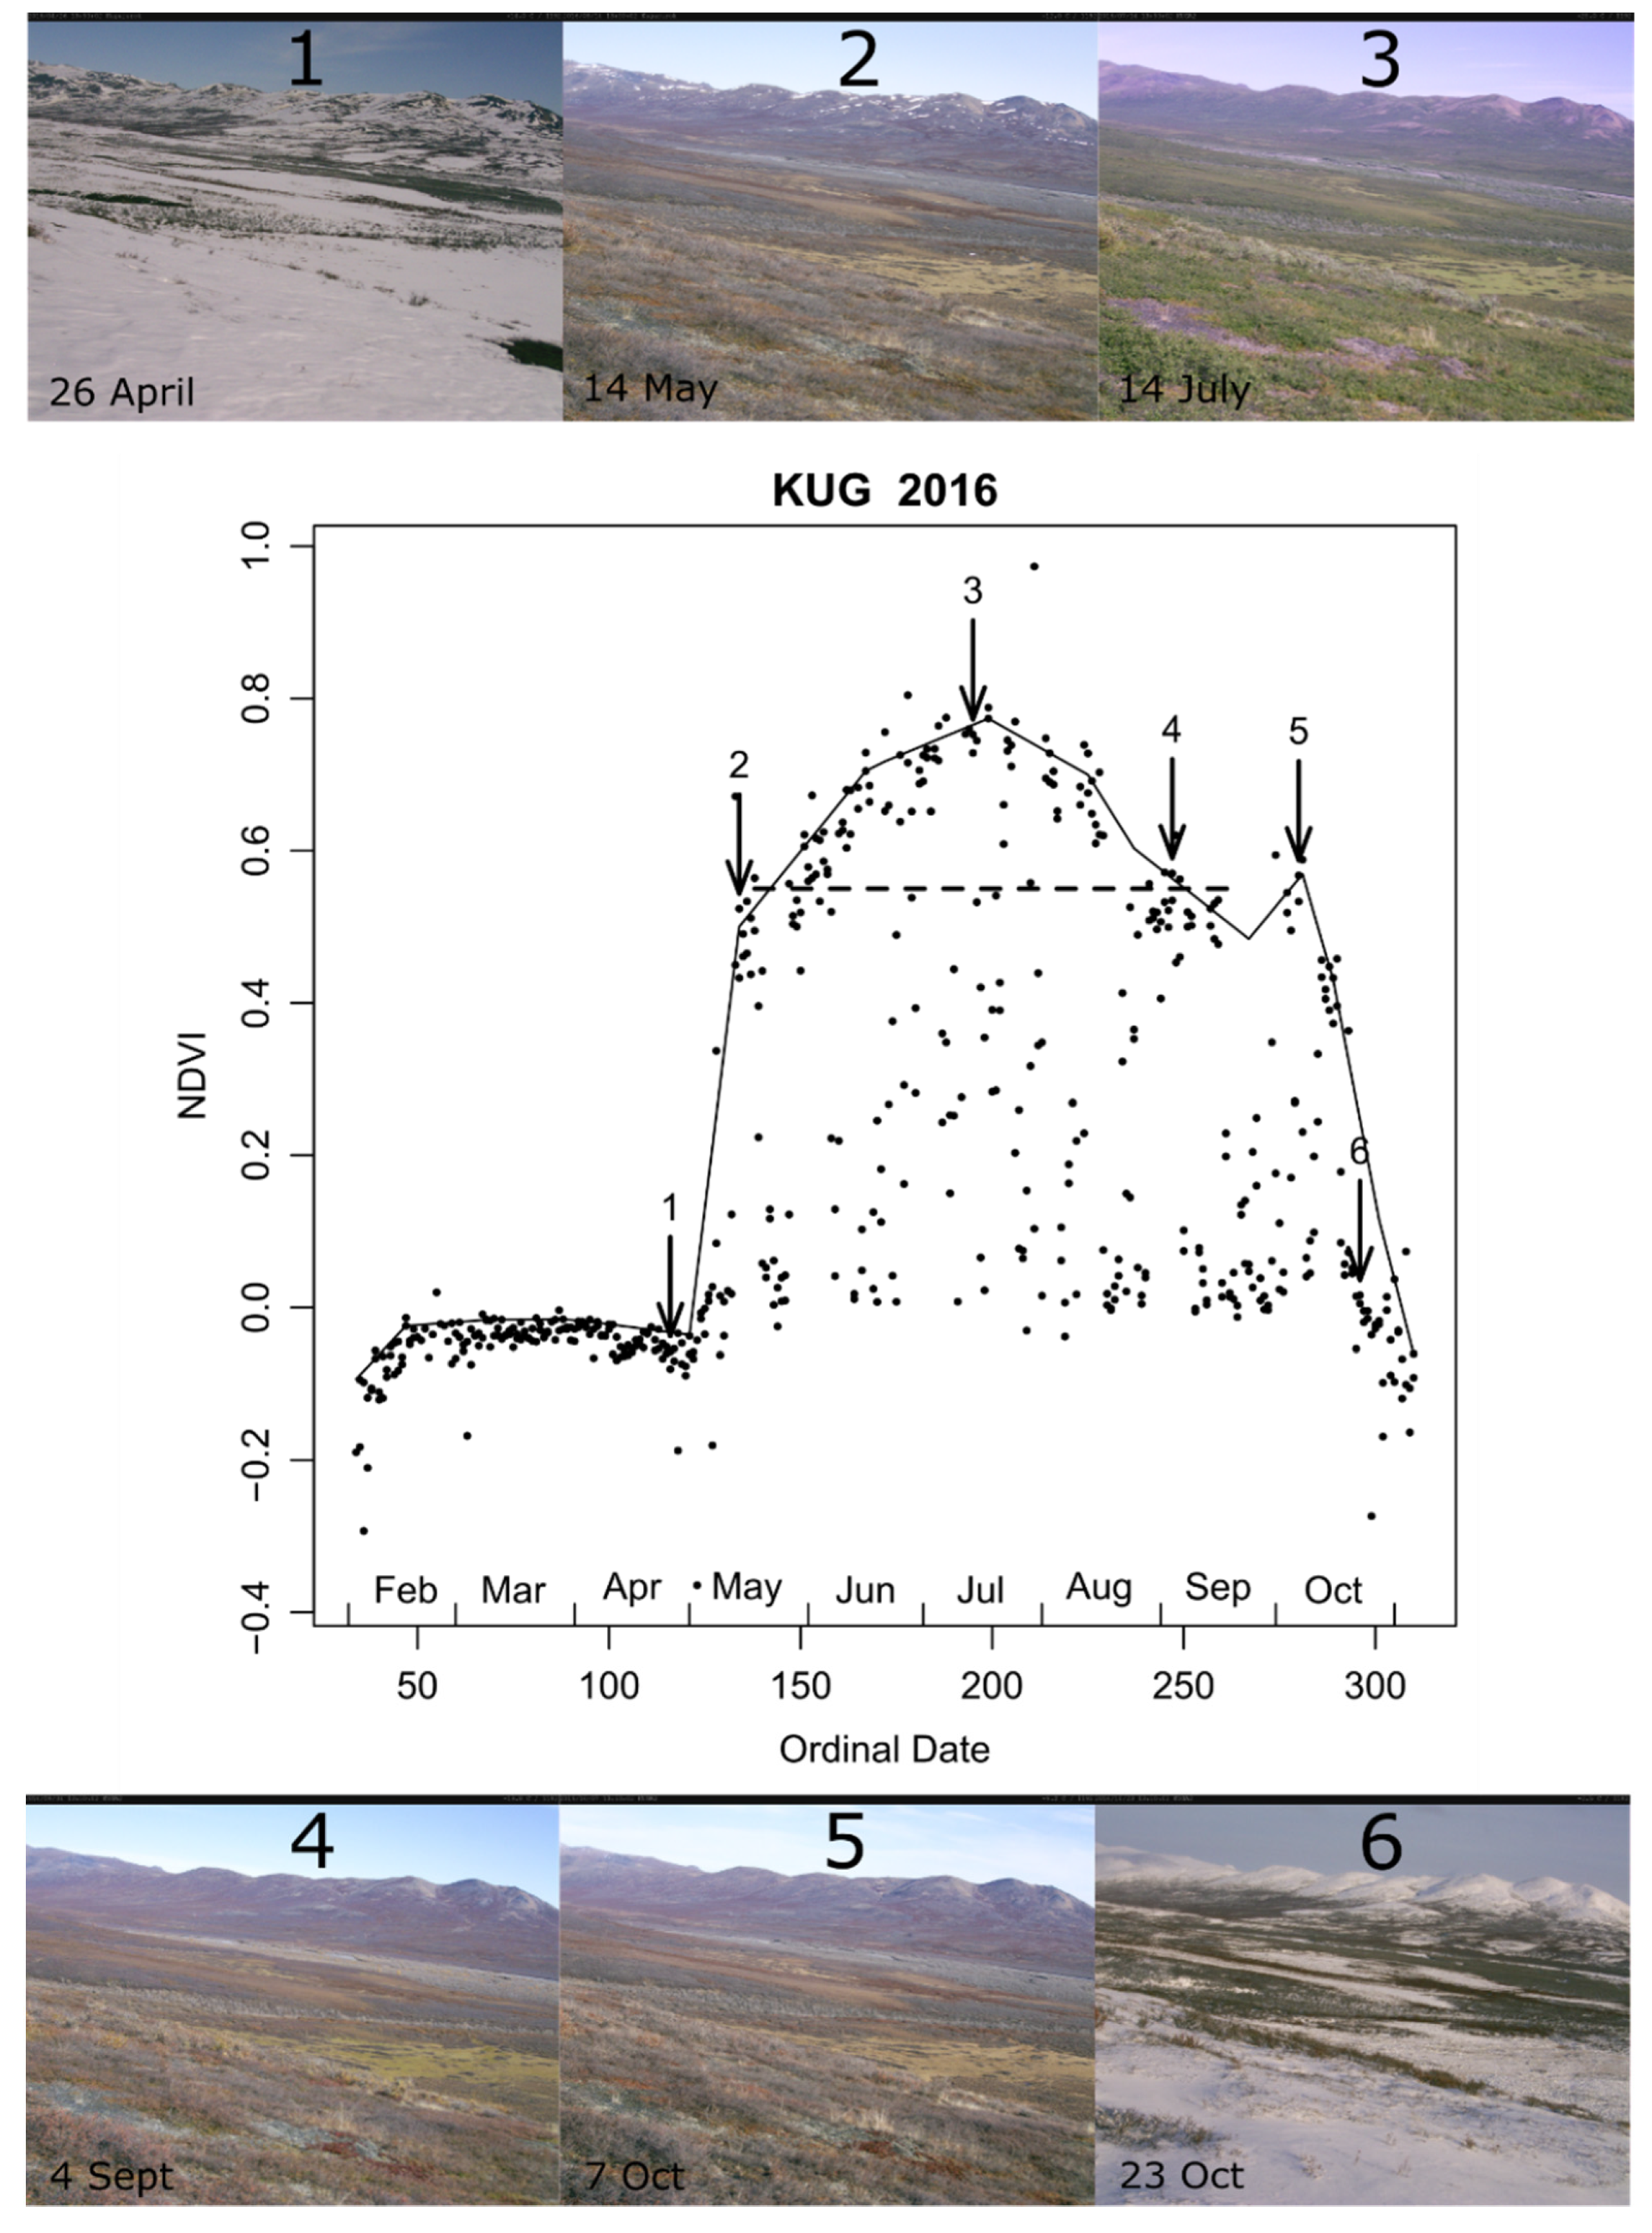
3.2. Comparison with the Camera Observations of Phenology Events
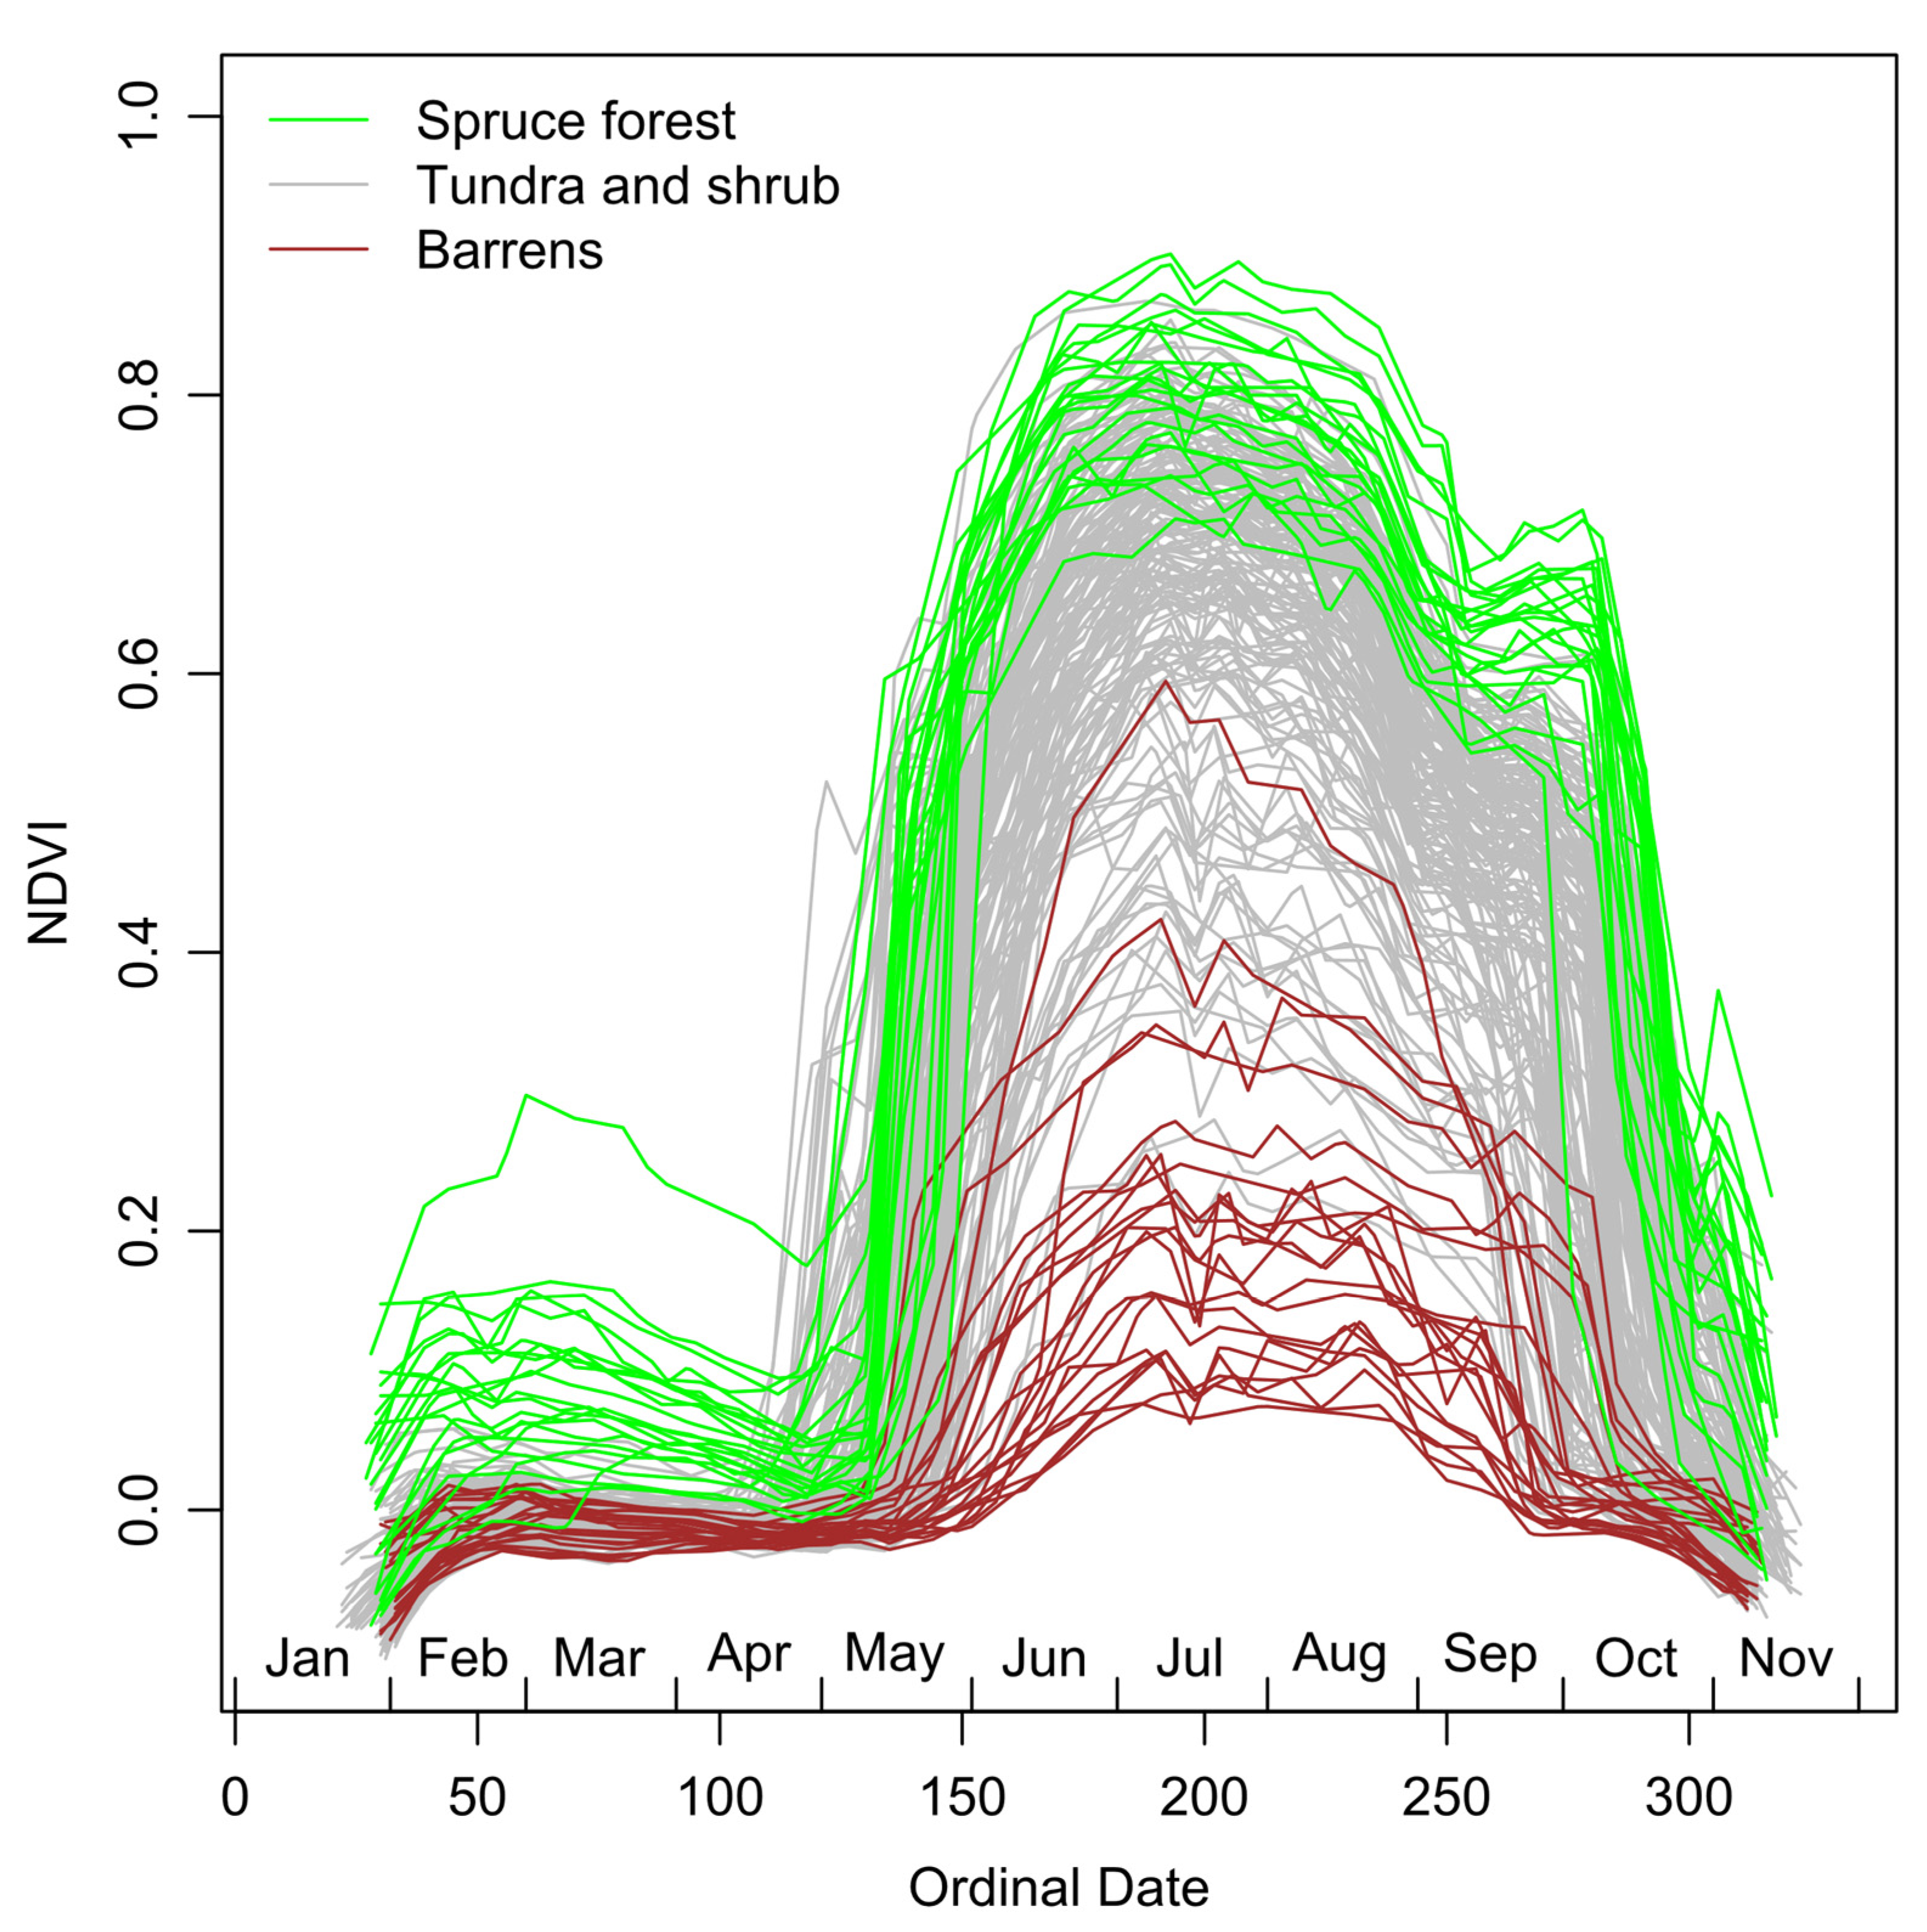
3.3. NDVI Cycle at 210 Systematic Sample Points
4. Discussion and Conclusions
Funding
Data Availability Statement
Acknowledgments
Conflicts of Interest
References
- Justice, C.O.; Townshend, J.; Holben, B.; Tucker, C.J. Analysis of the Phenology of Global Vegetation Using Meteorological Satellite Data. Int. J. Remote Sens. 1985, 6, 1271–1318. [Google Scholar] [CrossRef]
- Goward, S.N.; Tucker, C.J.; Dye, D.G. North American Vegetation Patterns Observed with the NOAA-7 Advanced Very High Resolution Radiometer. Vegetatio 1985, 64, 3–14. [Google Scholar] [CrossRef] [Green Version]
- Tucker, C.J.; Sellers, P.J. Satellite Remote Sensing of Primary Production. Int. J. Remote Sens. 1986, 7, 1395–1416. [Google Scholar] [CrossRef]
- Markon, C.J.; Fleming, M.D.; Binnian, E.F. Characteristics of Vegetation Phenology over the Alaskan Landscape Using AVHRR Time-Series Data. Polar Rec. 1995, 31, 179–190. [Google Scholar] [CrossRef]
- Reed, B.; Budde, M.; Spencer, P.; Miller, A.E. Integration of MODIS-Derived Metrics to Assess Interannual Variability in Snowpack, Lake Ice, and NDVI in Southwest Alaska. Remote Sens. Environ. 2009, 113, 1443–1452. [Google Scholar] [CrossRef]
- Shabanov, N.V.; Zhou, L.; Knyazikhin, Y.; Myneni, R.B.; Tucker, C.J. Analysis of Interannual Changes in Northern Vegetation Activity Observed in AVHRR Data from 1981 to 1994. IEEE Trans. Geosci. Remote Sens. 2002, 40, 115–130. [Google Scholar] [CrossRef] [Green Version]
- Dye, D.G.; Tucker, C.J. Seasonality and Trends of Snow-Cover, Vegetation Index, and Temperature in Northern Eurasia. Geophys. Res. Lett. 2003, 30. [Google Scholar] [CrossRef]
- Karkauskaite, P.; Tagesson, T.; Fensholt, R. Evaluation of the Plant Phenology Index (PPI), NDVI and EVI for Start-of-Season Trend Analysis of the Northern Hemisphere Boreal Zone. Remote Sens. 2017, 9, 485. [Google Scholar] [CrossRef] [Green Version]
- Nagler, P.; Daughtry, C.; Goward, S. Plant Litter and Soil Reflectance. Remote Sens. Environ. 2000, 71, 207–215. [Google Scholar] [CrossRef]
- Boelman, N.T.; Gough, L.; McLaren, J.R.; Greaves, H. Does NDVI Reflect Variation in the Structural Attributes Associated with Increasing Shrub Dominance in Arctic Tundra? Environ. Res. Lett. 2011, 6, 035501. [Google Scholar] [CrossRef]
- Gonsamo, A.; Chen, J.M. Circumpolar Vegetation Dynamics Product for Global Change Study. Remote Sens. Environ. 2016, 182, 13–26. [Google Scholar] [CrossRef] [Green Version]
- Jin, H.; Eklundh, L. A Physically Based Vegetation Index for Improved Monitoring of Plant Phenology. Remote Sens. Environ. 2014, 152, 512–525. [Google Scholar] [CrossRef]
- Beck, P.S.; Atzberger, C.; Høgda, K.A.; Johansen, B.; Skidmore, A.K. Improved Monitoring of Vegetation Dynamics at Very High Latitudes: A New Method Using MODIS NDVI. Remote Sens. Environ. 2006, 100, 321–334. [Google Scholar] [CrossRef]
- Swanson, D.K. Trends in Greenness and Snow Cover in Alaska’s Arctic National Parks, 2000–2016. Remote Sens. 2017, 9, 514. [Google Scholar] [CrossRef] [Green Version]
- Jorgenson, M.T.; Roth, J.E.; Miller, P.F.; Macander, M.J.; Duffy, M.S.; Wells, A.F.; Frost, G.V.; Pullman, E.R. An Ecological Land Survey and Landcover Map of the Arctic Network; Natural Resource Technical Report ARCN/NRTR-2009/270; National Park Service: Fort Collins, CO, USA, 2009. Available online: https://irma.nps.gov/App/Reference/Profile/663934 (accessed on 15 June 2015).
- AppEEARS Team Application for Extracting and Exploring Analysis Ready Samples (AppEEARS). Ver. 2.49. NASA EOSDIS Land Processes Distributed Active Archive Center (LP DAAC), USGS/Earth Resources Observation and Science (EROS) Center, Sioux Falls, South Dakota, USA. Available online: https://lpdaacsvc.cr.usgs.gov/appeears (accessed on 9 February 2021).
- Vermote, E.; Wolfe, R. MOD09GQ MODIS/Terra Surface Reflectance Daily L2G Global 250m SIN Grid V006. NASA EOSDIS Land Processes DAAC. Available online: https://doi.org/10.5067/MODIS/MOD09GQ.006 (accessed on 9 February 2021).
- Vermote, E.; Wolfe, R. MYD09GQ MODIS/Aqua Surface Reflectance Daily L2G Global 250m SIN Grid V006. NASA EOSDIS Land Processes DAAC. Available online: https://doi.org/10.5067/MODIS/MYD09GQ.006 (accessed on 9 February 2021).
- Swanson, D.K. Three Decades of Landscape Change in Alaska’s Arctic National Parks: Analysis of Aerial Photographs, c. 1980–2010; Natural Resource Technical Report NPS/ARCN/NRTR—2013/668; National Park Service: Fort Collins, CO, USA, 2013. Available online: https://irma.nps.gov/App/Reference/Profile/2192701 (accessed on 15 June 2015).
- Pastick, N.J.; Jorgenson, M.T.; Goetz, S.J.; Jones, B.M.; Wylie, B.K.; Minsley, B.J.; Genet, H.; Knight, J.F.; Swanson, D.K.; Jorgenson, J.C. Spatiotemporal Remote Sensing of Ecosystem Change and Causation across Alaska. Global Chang. Biol. 2018. [Google Scholar] [CrossRef] [PubMed]
- Koenker, R.; Ng, P.; Portnoy, S. Quantile Smoothing Splines. Biometrika 1994, 81, 673–680. [Google Scholar] [CrossRef]
- Koenker, R. Package “quantreg” Version 5.86. Available online: https://cran.r-project.org/web/packages/quantreg/index.html (accessed on 28 June 2016).
- Swanson, D.K. Monitoring of Greenness and Snow Phenology by Remote Automated Cameras in the NPS Arctic Inventory and Monitoring Network, 2013-14; Natural Resource Data Series NPS/ARCN/NRDS—2015/798; National Park Service: Fort Collins, CO, USA, 2015; p. 38. Available online: https://irma.nps.gov/DataStore/Reference/Profile/2222147 (accessed on 1 February 2016).
- Swanson, D.K. Landscape Patterns and Dynamics Monitoring Protocol for the Arctic Network: Standard Operating Procedures; Natural Resource Report NPS/ARCN/NRR-2017/1381; National Park Service: Fort Collins, CO, USA, 2017. Available online: https://irma.nps.gov/DataStore/Reference/Profile/2238343 (accessed on 3 February 2017).
- Richardson, A.D.; Hufkens, K.; Milliman, T.; Frolking, S. Intercomparison of Phenological Transition Dates Derived from the PhenoCam Dataset V1. 0 and MODIS Satellite Remote Sensing. Sci. Rep. 2018, 8, 1–12. [Google Scholar] [CrossRef] [PubMed] [Green Version]
- Karlsen, S.R.; Anderson, H.B.; Van der Wal, R.; Hansen, B.B. A New NDVI Measure That Overcomes Data Sparsity in Cloud-Covered Regions Predicts Annual Variation in Ground-Based Estimates of High Arctic Plant Productivity. Environ. Res. Lett. 2018, 13, 025011. [Google Scholar] [CrossRef]


| Station Name | Symbol | National Park Unit | Latitude (deg) | Longitude (deg) | Elevation (m) | Vegetation |
|---|---|---|---|---|---|---|
| Kugururok | KUG | Noatak National Preserve | 68.317 | −161.492 | 335 | Open low shrub tundra (Betula, Salix, Ledum, Vaccinium) |
| Mt. Noak | MNO | Cape Krusenstern National Monument | 67.141 | −162.995 | 257 | Dwarf shrub tundra (Dryas) |
| Pamichtuk Lake | PAM | Gates of the Arctic National Park and Preserve | 67.766 | −152.164 | 1019 | Dwarf shrub tundra (Dryas, Salix) |
| Salmon River | SRW | Kobuk Valley National Park | 67.460 | −159.841 | 381 | Mosaic of open low and tall scrub (Betula, Salix, Alnus) |
| Serpentine | SRT | Bering Land Bridge National Preserve | 65.852 | −164.708 | 143 | Open low shrub tundra (Betula) |
Publisher’s Note: MDPI stays neutral with regard to jurisdictional claims in published maps and institutional affiliations. |
© 2021 by the author. Licensee MDPI, Basel, Switzerland. This article is an open access article distributed under the terms and conditions of the Creative Commons Attribution (CC BY) license (https://creativecommons.org/licenses/by/4.0/).
Share and Cite
Swanson, D.K. Start of the Green Season and Normalized Difference Vegetation Index in Alaska’s Arctic National Parks. Remote Sens. 2021, 13, 2554. https://doi.org/10.3390/rs13132554
Swanson DK. Start of the Green Season and Normalized Difference Vegetation Index in Alaska’s Arctic National Parks. Remote Sensing. 2021; 13(13):2554. https://doi.org/10.3390/rs13132554
Chicago/Turabian StyleSwanson, David K. 2021. "Start of the Green Season and Normalized Difference Vegetation Index in Alaska’s Arctic National Parks" Remote Sensing 13, no. 13: 2554. https://doi.org/10.3390/rs13132554
APA StyleSwanson, D. K. (2021). Start of the Green Season and Normalized Difference Vegetation Index in Alaska’s Arctic National Parks. Remote Sensing, 13(13), 2554. https://doi.org/10.3390/rs13132554