Abstract
The energy monitoring of heritage buildings has, to date, been governed by methodologies and standards that have been defined in terms of sensors that record scalar magnitudes and that are placed in specific positions in the scene, thus recording only some of the values sampled in that space. In this paper, however, we present an alternative to the aforementioned technologies in the form of new sensors based on 3D computer vision that are able to record dense thermal information in a three-dimensional space. These thermal computer vision-based technologies (3D-TCV) entail a revision and updating of the current building energy monitoring methodologies. This paper provides a detailed definition of the most significant aspects of this new extended methodology and presents a case study showing the potential of 3D-TCV techniques and how they may complement current techniques. The results obtained lead us to believe that 3D computer vision can provide the field of building monitoring with a decisive boost, particularly in the case of heritage buildings.
1. Introduction
The natural indoor environment or historic indoor climate are defined as the hygro-thermal conditions (RH-T) prevailing inside a building throughout a representative period of its history [1,2,3,4,5,6]. The indoor environment tends to be more stable than the outdoor climate, and to fluctuate less and more slowly. Under these temperature and humidity conditions, the materials comprising both the indoor elements and the works of art they enclose (sculptures, paintings, frescoes) adapt and become acclimated, and thus endure the passage of time [7].
Thick walls are a typical feature of many historic buildings that help to smooth out the daily cycles of air temperature (TA) and relative humidity (RH), and attenuate the seasonal temperatures, creating a natural microclimate favourable for the preservation of many artworks. In many cases, the comfort requirements have had dramatic consequences on artworks preserved in churches; the implications of heating on the preservation of artworks is unknown [1].
The indoor environment depends primarily on the outdoor climate, building structure and dimensions, construction materials used, and the hydrogeology of the underlying soil [7]. Interferences may generate artificial or induced microclimates with steep temperature (T) and humidity (RH) fluctuations that may destabilise the fragile balance between indoor climate and conservation of the artistic and architectural heritage [1], such as wet–dry cycles [8], thermal shock [7], and surface or under-surface salt dissolution–crystallisation [9]. Moisture condensation may also contribute to dissolving alkaline surfaces when water vapour coming from open doors or generated by human metabolism, use of certain heating systems, or lit candles or incense. Another result of surface condensation and damp (in the presence of high humidity and moderate temperatures) is biological colonisation by fungi, bacteria, or even insects that may cause biodeterioration in certain areas of the building.
Parameters can be established through the use of monitoring, sporadic measurements, and perception surveys. Variables such as relative humidity, dry bulb temperature, indoor and outdoor temperature, and air velocity are, therefore, sought for hygrothermal comfort. The natural and artificial lighting of spaces are, meanwhile, determined for visual comfort, and reverberation and ambient noise are likewise considered for acoustic comfort. Ventilation rates and the emission of polluting gases such as CO2, particulate matter (also denominated as particle pollution, PM), or others are usually identified for indoor air quality (IAQ) [10]. These are chosen to provide a representation of the indoor environment, either because they are associated with health problems or have an internationally recommended safety level [11]. Data acquired using wireless sensor networks provide high-resolution and accurate information with which to describe indoor ambient variations [12,13] caused by changes in occupancy status and the presence of irregular screening [14]. Most typical standards employed for the development of wireless sensor networks (Bluetooth, Wi-Fi, Zigbee, 6LowPan, etc.) use bands that may be problematic in the case of long distances, thick walls, and low power requirements [15].
2. Energy Monitoring in Heritage Buildings
2.1. Current Techniques
Several different types of buildings have been monitored, such as churches [12,13,15,16,17,18,19,20,21,22], commercial offices [14], households [11,23] or museums [20,24,25]. If we focus on the preservation of property [21,25] or diagnosis [12,18,24], thermal occupant comfort [13,16,19,22] and energy consumption are analysed simultaneously [22]. Some studies also show the direct connection between indoor environmental quality (IEQ) and energy performance in buildings [10]. Others evidence the impacts of the investment in energy efficiency on internal conditions [11,23] when household energy is used for the long-term monitoring of internal conditions [23]. Litti and Audenaert study the influence of the building envelope state of conservation, along with building and equipment usage, on indoor microclimate variability [24]. Multiple types of sensors located throughout a commercial office building, including sound, lighting, occupancy, temperature, relative humidity, and CO2, have, moreover, been employed in order to evaluate the impact that the implementation of personalised occupancy profiles has on energy simulation results [14].
Numerous studies have, in recent years, been conducted in the churches of several European countries owing to the growing concern over the possible adverse consequences of the use of traditional heating. Martinez-Garrido et al. [12,18] analysed a church and established that there were differences in the walls as regards water absorption, which can be explained by the various types of construction involved during the seven-plus centuries of its building history, the weather conditions, and the orientation of the walls. Muñoz-González et al. [19] focused on air conditioning and passive environmental techniques in historic churches in a Mediterranean climate, studying conditioning techniques by which to assess damage risk and their energy performance, and analysing several possibilities for heating and cooling systems through the use of simulation modelling of the unheated church [13]. An analogy between the preservation and conservation of historical heritage and thermal comfort, particularly in heritage buildings and museums, is further evidenced in Bella et al. [13]. Terrill and Rasmussen [17] recorded air temperature, relative humidity, lighting, and occupancy of two churches, concluding that certain conditions would be required in order to ensure thermal comfort.
The studies conducted in rural churches in Varas et al. [7] analysed the thermal comfort of the occupants by monitoring the indoor temperature and relative humidity. It was found that the forced hot air system induced great fluctuations in indoor thermohygrometric conditions (T/RH), which were, in turn, translated into the temporal and horizontal stratification of temperature and relative humidity [22]. Mesas-Carrascosa et al. [21] proposed an interesting monitoring system for a mosque that was based on open-source hardware sensor nodes. However, the application of wireless communication technologies was unpractical owing to the thick walls, thus forcing the use of local data storage in each node and the subsequent manual downloading of data.
Infrared thermography (IRT) is a non-destructive, non-invasive technique based on images representing the infrared radiation emitted by objects. Infrared emission in the range of approximately 8–20 μm relates to temperature; therefore, the apparent surface temperature of an object can be calculated from infrared images [18]. This technique is widely used in cultural heritage studies [26,27,28,29] by employing either a passive IRT approach (images are taken at a single time to find spatial variations in apparent surface temperature) or an active IRT approach (a sequence of images is taken while the target is being heated to determine spatial and temporal thermal variations across the target) [30]. Thermal bridge detection can also be conducted using thermal cameras. If an outdoor thermograph of the structural component of a building is taken during winter, thermal bridges appear. Air leakage through windows and doors allows unwanted outdoor air to enter the building (infiltration) or indoor air to escape (exfiltration) [29].
Infrared thermography offers a qualitative measure through the variation of the temperature in the study surface, so that the difference in isolines is interpreted as a change of temperature. Carrying out quantitative measurements requires prior knowledge of the variables that intervene, to a lesser or greater extent, in potential errors introduced in the measurement. These variables are: emissivity of the material, atmospheric attenuation, angle of incidence, presence of other radiating bodies, and external caloric and meteorological factors (temperature, humidity and environmental pressure) [31].
According to several studies, infrared thermography (IRT) can provide reliable results if a series of conditions are fulfilled. In particular, the surface temperature of the wall should be greater than the outdoor environment temperature (by at least 2 °C) and the difference between indoor environment temperature and outdoor environment temperature should be great. The measurement of the spectral emissivity should be accurate and the weather conditions should be stable [32].
2.2. The Irruption of New 3D-T Technologies
In the last ten years, many research groups have worked on the creation of models of inside building using 3D technologies [33,34,35,36,37]. However, very few groups in the world have obtained thermal point cloud models [38]. Moreover, the majority of these groups generate only unstructured and point cloud models of a part/element of the building, including colour (if any) and temperature. In Chen et al. [39], the authors work with thermal point clouds of several parts of a building and use augmented reality models to compare them with simulated thermal maps. Other works use sensors that measure physical properties together with incomplete thermal point clouds, but do not generate structured 3D models [40,41]. Finally, none of the previous cases deal with the temporal analysis of thermal models.
There are also some proposals that use many thermal images provided by a single thermal camera, which are later manually pasted into predefined 3D geometric models. Ham [42] created a 3D thermal point cloud using a structure-from-motion technique (sfM) and a multi-view stereo algorithm (MVS). This technique is apparently effective only for the generation of thermal point clouds in small or limited spaces. Other publications [25] have used thermal images as inputs for commercial software (Photoshop, Rhinoceros, Grasshopper, Navisworks, etc.).
We recently proposed a 3D thermal scanning platform composed of a 3D laser scanner, an RGB camera and a thermal camera that provides 360° thermal data per scan [43,44]. This technology is being successfully applied in order to monitor the temperature of building interiors, and its 3D thermal visualisation of buildings allows construction professionals to carry out a detailed, remote and accurate analysis of how temperatures are spatially distributed in three dimensions and how they change over time.
The contribution of our work lies on proposing a methodology for the management and monitoring of the microclimate of historic buildings (energy efficiency, comfort, and/or conservation) that integrates a novel 3D-TCV technology. The intensive data measurements from the 3D-TCV technology facilitate a more specific evaluation of the conditions of users’ thermal comfort, and the conservation of the building’s elements and assets.
Herein, we present a monitoring methodology for the thermal characterisation of buildings, this being the novelty and the purpose of the paper. The energy monitoring methodology extended to 3D-TCV technologies is presented in Section 3. Section 4 is devoted to representing a case study focused on characterising the conservation conditions of the vaults of a historic building. Section 5 shows the results obtained and Section 6 discusses the advantages and disadvantages of the conventional and 3D-TCV monitoring technologies.
3. Energy Monitoring Methodology Extended to 3D-TCV Technologies
3.1. Introduction: Monitoring Standards
The monitoring methodology of any building passes from the identification of the objectives to the formation of the appropriate human team and the design of the monitoring system required. The installation and verification of the correct functioning of the system and the maintenance is also subsequently necessary during measurement campaigns. Finally, the measurement data obtained should be checked and validated before use, taking into account the data formats necessary. These data are normally the subject of different types of analysis and may be used by the building’s management or control systems, when they exist [45].
Monitoring methodologies can be based on different standards established worldwide. From the point of view of ergonomics and thermal comfort, the ISO 11,079 standard contains both methodological provisions and the characteristics of the instrumentation required to measure these parameters in buildings [46]. From a heritage conservation point of view, procedures and instruments with which to measure air temperatures and the surfaces of objects and materials are indicated in the EN 15758: 2010 standard [47]. It is possible to analyse the behaviour of the ventilation and the infiltrations of a building by testing tracer gases using the method provided by the ISO 12,569 standard [48]. The methodology provided by the EN 13187: 1998 standard can, meanwhile, be employed to monitor thermal bridges and envelopes of buildings using thermal imaging cameras [49].
In order to define a monitoring system, it is necessary to identify the appropriate parameters, measure them, and relate them to both the complexity of the building and the immediate environment that affects its climatic conditions. This requires sufficient documentation with which to carry out preliminary studies on the building itself, the climate of its immediate surroundings, and the equipment available for measurements. Moreover, this information should be checked by visiting the building and taking experimental measurements in situ. Finally, it is advisable to write a report containing the results attained in previous studies in order to facilitate the design of the monitoring system of the building. This report will determine the type, number, and location of measuring points and establish the frequency and duration of the measurements.
A generic diagram of the different phases and processes that are carried out in order to monitor buildings is presented in Figure 1. This scheme introduces the specific methodologies of 3D-TCV techniques, which complement the general procedure. The following sections provide an introduction about monitoring standards and detailed descriptions of each of the five phases (objectives, determining factors, design, monitoring and processing), including specific references to the inclusion of the aforementioned 3D-TCV techniques. Comments regarding standard and 3D-TCV methodologies have clearly been separated into parts (I) and (II), respectively.
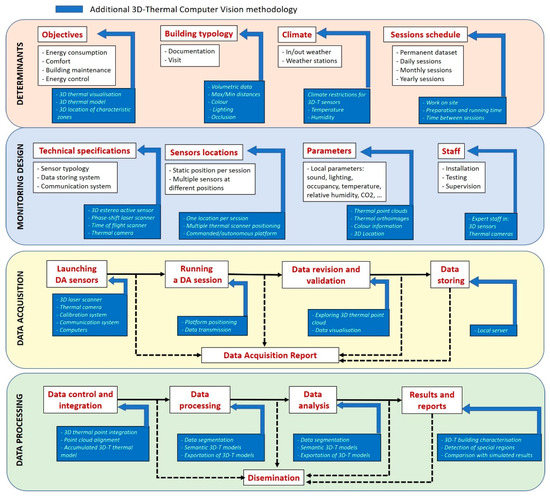
Figure 1.
General building monitoring methodology extended to thermal computer vision-based (3D-TCV) technologies.
3.2. Main Monitoring Determinants
- Objectives
(I) Studies of the demand and energy consumption of buildings are normally required, along with analyses of the building user’s environmental comfort or of the microclimatic conditions of conservation of the existing heritage [50]. In order to carry out sufficiently precise simulation tests, it is necessary to calibrate and validate the models with experimental measurements obtained by monitoring the climatic parameters in the buildings.
(II) In the case of using of 3D-TCV technologies, the objectives can be oriented towards the 3D visualisation of the temperature of an entire building or parts of it. This display can be static, at a specific time, or dynamic, at several times. In the last case, the models of thermal point clouds for different sessions are shown. There may also be objectives concerning the 3D identification of areas with special thermal characteristics, such as thermal leaks or thermal bridges. The dense and superficial dynamic information provided by this technology can be very valuable for studies of environmental comfort, conservation, and deterioration of materials as well as for the calibration of simulated energy models.
Furthermore, the ability to measure surface temperatures remotely and without contact is a special advantage when the object of study includes surfaces that are difficult to access. Additionally, thanks to the 3D-TCV system’s ability to perform dense series of measurements over time periods, it is possible to visualise different structures and physical phenomena (humidity, inertia, diffusivity, etc.) on surfaces. These thermal discontinuities can be generated under a dynamic regime of heating or cooling of the object.
- Building typology
(I) Architectural heritage consists of a wide variety of building types with different locations and varied uses. Of the different architectural types, it is possible to find vernacular architecture, palaces, religious buildings, military and civil institutions, archaeological sites, etc. Moreover, these types of buildings are used for very different purposes, i.e., as homes, museums, churches, schools, cultural centres, institutions, etc. [50]. The uniqueness of each building establishes different conditions of access, circulation, use of infrastructures, etc., thus determining the monitoring system that will be necessary to obtain the climatic parameters required.
(II) When we introduce 3D-TCV technologies, monitoring is subject to the volumetric characteristics of the space to be digitised, the maximum and minimum distances, the type of surface, colour, lighting, and possible occlusions in the scene.
- The climate and micro-climate of a building
(I) In order to understand the microclimate of a building, it is necessary to understand the influence that the climate outside has on it. It is consequently necessary to obtain data regarding outdoor climates together with data on the microclimate that eventually exists indoors [4].
External climate data can be obtained from nearby weather stations, as long as those provided are of a sufficient reliability and quality. They are often obtained from nearby institutional weather stations, which provide validated data. In these cases, the validity of official data should be verified with regard to the particular circumstances of each building and subsequently weighted with appropriate calculations, or even rejected when necessary [51]. In the case of the absence of these sources, it is necessary to install a proprietary system. This can be integrated into the building’s interior monitoring system or remain as an independent device [52].
(II) The sensors of which 3D thermal scanning platforms are composed have certain restrictions in extreme climates. In the particular case of laser scanners, they typically work for temperatures within the range of 0–40 °C, with humidity of less than 80%. With regard to thermal cameras associated with scanners, the best restrictions correspond to temperatures in the range of −15–50 °C and humidity below 95%.
On the other hand, the choice of dates is very important considering the external climatic conditions suitable for the monitoring objectives. Once favourable external conditions are known (by consulting the meteorological forecasts) and if appropriate, the interior conditions can be forced to set ambient or surface temperatures according to principles of active thermographic techniques.
- Data acquisition schedule
(I) The duration of the measurement campaigns can correspond to daily, monthly, seasonal, and even annual periods when it is necessary to know the behaviour of a building during all the seasonal climatic cycles of the year. The monitoring is sometimes permanent, owing to the need to integrate the data obtained into the building’s management or control systems.
(II) In contrast to permanent monitoring techniques in buildings, the use of 3D-TCV techniques requires the operator to go to the workplace and obtain the programmed measurements on-site. This circumstance conditions the times and intervals of the data acquisition campaigns. For example, the intervals of repeated data collection in a day should occur in intervals greater than 30 min owing to the time required to take a thermal scan, its transmission to a server, and the raw storage of the data.
3.3. Monitoring Design
- Sensors
(I) The monitoring systems must have the number and type of sensors required to cover the measurement points established by means of prior studies of the building and the context of the measurements. The sensors must guarantee the parameters and the precision required for the measurement, while the system must guarantee the power source and the data storage space during the monitoring period. The provision of intensive local measurements is limited by the number of sensors that the monitoring system can handle and by the feasibility of the installation of the sensors in the surfaces of the building. In either case, the temperature sensors will typically be platinum resistance, thermistor, thermocouple, or electronic. For the measurement of air temperature, precautions must be taken to reduce as much as possible the effects of inertia of the reading device with the sensor, direct solar radiation, that from incandescent lamps, thermal radiators or other heat sources. They should be protected with screens made of reflective materials and should have natural or forced ventilation. The case of surface sensors must ensure sufficient contact and isolation from air convection [46].
(II) The choice of the 3D-TCV system is determined by the range, accuracy and density of the thermal data required. With regard 3D scanners, an active stereo laser methodology is convenient for short distances (less than four meters), while phase change technologies are appropriate for medium distances of <70 m, and time-of-flight technologies are recommended for long distances. The temperatures of the surfaces of the objects will be calculated from the infrared radiation fluxes measured by the sensors of the 3D-TCV. The results will be proportional to the emissivity of the surface and correspond to the fourth power of the surface temperature, obeying the Plank’s formula.
- Parameters
(I) The evaluation of thermal and hygrometric environmental conditions is fundamental for the study of users’ comfort conditions and those of the conservation of artistic historical heritage. In addition to the environment parameters, it is necessary to analyse those of the surfaces of the objects and the elements that make up the space or area of study. Other parameters may also be necessary, depending on the nature of the monitoring: air flow, speed and quality, lighting, use of equipment, thermal input from installation systems, etc.
The nature of the work will determine the complexity of the necessary sensorization system. Energy building demand studies are based on parameters of indoor and outdoor temperature and humidity, as well as on the flow of air for circulation and exchange. In the case of characterisation of the comfort levels of indoor environments, it is necessary to measure ambient and surface temperatures, ambient humidity, and air speed. In the building/object conservation field, temperature and humidity are the principal parameters, which are obtained by means of environmental, superficial, or internal measurements of architectural envelopes and the objects to be preserved.
(II) The 3D-TCV systems obviously provide only the temperature parameter extended to three-dimensional space. The expected output is, therefore, a data matrix containing three-dimensional coordinates and the associated temperature. This matrix can be extended to a fifth component: the time in which the measurement has been taken.
The number of readings obtained depends on the scanner and camera resolutions. The system provides approximate temperature values that must be corrected by considering the variables mentioned in Gayo et al. [31]; among others, emissivity of the material, atmospheric attenuation, angle of incidence, and presence of other radiating bodies in the scene. Corrections derived from these variables can have different degrees of automation and can provide highly accurate values.
- Staff and operators
(I) The technologies of which the monitoring systems are configured can be very diverse. Commercial integrated systems do not always cover all the needs of each study; therefore, it is often necessary to use devices of a different nature and technology simultaneously. In these cases, it is convenient to have a team of sufficiently qualified technicians [52]. These people must be able to design, install, test, and maintain the equipment system required and ensure that a robust series of data is obtained for all foreseen time periods.
(II) This requirement is extended to the use of 3D-TCV technology, because staff must be qualified in the use of complex sensory systems and data acquisition programming processes.
3.4. Monitoring Process: Data Acquisition
(I) Before the system is in operation, it is necessary to check the calibration of the measurement systems and carry out a planned surveillance of the measurement campaigns. This is performed in order to periodically check the power supplies of the system and review the measurement values, the storage, and the integrity of the data. In all of these processes, it is necessary to perform periodic saves of the databases obtained, according to the data security strategy that has been established.
In some cases, data storage occurs on the sensor device itself. It is also common to use wired or different types of signal and wireless communication protocols that allow the storage of measurements in centralised databases. In the case of monitoring systems linked to remote devices, it is possible to schedule external backups that guarantee the integrity of the data, and even access and control the system remotely.
The team must regularly ensure that the system functions correctly and perform reinitializations, when necessary, data downloads, and the writing of partial and final reports concerning the operation. These reports must include a record of possible incidents, such as power or communication failures, possible interference, etc., that could affect the monitoring system, and serve to identify anomalous information and discontinuities in the data series that will facilitate the interpretation of the results for their validation.
(II) Launching a 3D-TCV sensor requires several stages that must previously be solved. The essentials steps concern the calibration of components (thermal camera and the 3D source) and the communication system. The thermal camera has three different calibrations. Firstly, the intrinsic calibration reduces the visual errors, due to the lens of the camera, as well as for geometrical calibration and measurement purposes. This process can be performed following the standard method of Heikkila et al. [53]. Secondly, the thermal calibration correlates the infrared radiation collected by the camera with the yielded temperature. This is performed under controlled conditions with a blackbody reference source. Thermal cameras are calibrated to factory specifications, but over time, electronic component aging can cause calibration shift and produce inaccurate temperature measurements. Thirdly, the calibration of the vignetting effect must be empirically corrected after calculating a function that provides the radial temperature loss [54].
Regarding the 3D geometric source, and assuming that this is a laser-scanner, most of the laser-scanners have a precise calibration that must be reviewed every four years by the laser scanner factory.
External calibration of the set thermal camera and laser scanner is essential here. Very few 3D devices integrate both components; thus, external calibration is mandatory. This calibration consists of finding the projective transformation between the laser scanner and the thermal camera coordinate systems [44].
With respect the communication system, a local server, with sufficient storage capacity, is connected via Wi-Fi with the laser scanner and via ethernet with the thermal camera. The information transmitted consists of the coordinates and the thermal images corresponding to several million points reached by the laser sensor. An initial validation of the data obtained can be performed with a preview of a sample of the thermal point clouds in each session.
3.5. Data Processing, Results and Disemination
(I) The information obtained in the monitoring process can be processed with different objectives. It will basically be used to carry out studies and analyses. It can also be used by the building management and control systems, when they exist. Whatever the case may be, it will be necessary to consider which data formats and types of signals are compatible with the results, analysis tools, or other building systems. Finally, any interested entities can be provided with the results obtained.
(II) In the case of thermal point clouds, the processing can be very varied and complex. Specifically, we refer to the following topics and references: creation of thermal point clouds [55], multi-session point cloud alignment procedure [56], data segmentation by structural elements [57], creation of semantic 3D models [44,58], processing of thermal orthoimages [59], clustering algorithms of characteristic regions in thermal orthoimages [59], and software tools for the visualisation and exploration of 3D thermal models obtained with scanners [55]. In Section 4.4.3, a brief summary of the processes used in the case study with our 3D-TCV platform is provided.
4. Case Study
The hygrothermal ambient monitoring of the main nave of a church was carried out using traditional techniques during a seasonal period, before using a 3D thermal digitising platform. The two systems performed simultaneous data collection during 8 h and 24 h periods of two consecutive autumn days, respectively.
4.1. Objective
The principal objective was to apply the usual monitoring methodology, but to include 3D thermal technology to obtain dense information on the surface temperatures of frescoes painted on the domes that cover the main nave of the church.
A further objective was to compare the results of the thermal 3D system with those obtained with conventional climate monitoring systems for buildings with sensors. Experiments regarding the possibilities for the integration of the information collected by the different systems were also carried out.
On the one hand, the measurements obtained instantly by the scanner were compared with those obtained by means of point measurements using local surface sensors.
On the other hand, the results of the surface temperature measurement series were rendered in a time series of temperature maps. This allowed us to locate differences in surface temperature, temperature maps, and check a possible correspondence with differences in the construction and materials in the building, the existence of humidity, possible hidden gaps, etc., and also the action of temporary events that may have affected them.
4.2. Building Description
The experimental phases of this research were carried out in the main nave of the Santos Juanes church (Valencia, Spain). This church has been declared a site of cultural interest. It was originally built in the 13th century and has undergone several transformations. In the 17th century, a Baroque dome with frescoes of recognised value was integrated, hiding the original Gothic structure throughout the central interior nave. The central nave contains the two areas that were thermally monitored using environmental sensors. These two spaces correspond to the areas delimited by the existing domes and walls that form the presbytery (Zone 1) and by the ceiling domes and walls surrounding the west access to the temple (Zone 2) (Figure 2).
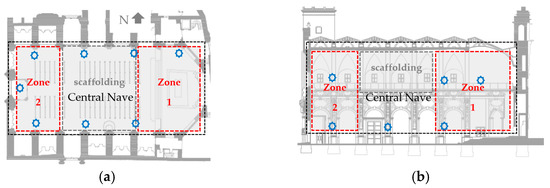
Figure 2.
(a) Plan and (b) section of the main nave of the temple. The areas indicated in red correspond to two series of thermal 3D scans carried out every 30 min, between 10 a.m. and 7 p.m. on 16 September 2019 (Zone 2), at 10 a.m. on 17 September 2019, and at 10 a.m. on 18 September 2019. The blue dots represent the temperature and relative humidity measurement locations of environmental monitoring system (EMS) data collection during September 2019.
4.3. Monitoring Methodology Used
The main nave space of the church was monitored over one month with the environmental monitoring system (EMS) described in Section 4.4.1. External data were collected from the meteorological station n.8416 of the Spanish Meteorological Agency (AEMET). All data were recorded during the monitoring campaign in September. For its part, the 3D-TCV system took thermal scans during two consecutive characteristic days within the monitoring period. In addition, the surface temperature monitoring system (PSTMS) system described in Section 4.4.2 also monitored four points of its surface in the same period of time.
This work was carried out as the first test for the monitoring of architectural heritage with 3D-TCV systems in order to characterise in more detail the thermal conservation conditions provided by the most conventional monitoring systems. The following sections technically describe each of the systems used prior to the presentation of results in Section 5.
4.4. Monitoring Systems Used
Three monitoring systems were used simultaneously. On the one hand, an environmental monitoring system (EMS) based on low-cost devices and software implemented by Domolibre [52], and on the other, a surface temperature monitoring system (PSTMS) corresponding to commercial equipment from the manufacturer Onset. The 3D thermographic station appertaining to the Computer Vision and Robotics Group at the University of Castilla-La Mancha (UCLM) was used as an intensive surface temperature measurement system (3D-TCV system). Together with the data series obtained in situ, validated outdoor climatic data were collected from an AEMET meteorological station.
Table 1 shows the different accuracy, resolution, and range values of the temperature sensors of the three monitoring systems used.

Table 1.
Range, resolution, and accuracy of the sensors used.
4.4.1. Environmental Monitoring System
The first system (EMS) collected ambient temperatures and humidity using Si7021A20 sensors. This system consisted of the devices that appear in Figure 3, and comprises a Raspberry PI mini-pc, a PanStik 4.0 USB Carrier Board communication module equipped with a communication antenna for radio signals, 10 installed sensor modules, respectively, for a PanStamp Minibat Sensor Board 2.0, the possibility of integrating an actuator with six relays onto a PanStamp NRG Board, and a 3G GSM modem to provide remote communication with the system (Figure 3a). The system control was based on the action of Lagarto SWAP and MQTT in order to enable the PC to communicate with the devices, MariaDB and Apache, for the control of databases, and a web interface developed by Domolibre that allows the information to be visualised and the monitoring system to be remotely controlled (Figure 3b).
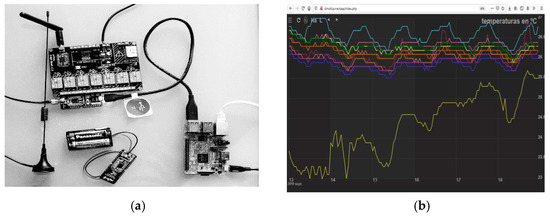
Figure 3.
Environmental monitoring and control system (EMS). (a) Raspberry Pi mini-pc, panStamp communication module with radio communication antenna, and one of the independent modules with a TH sensor connected to its batteries. (b) Domolibre interface for data visualisation and for the control of the monitoring system through remote connection by means of a web client.
A total of ten Si7021A20 sensors of the EMS system were installed in the church under study and used during the years 2018 and 2019. These sensors were factory-calibrated and stored the calibration data in an on-chip non-volatile memory. This ensured that the sensors were fully interchangeable, with no recalibration or software changes required. For our experiment, six of them were installed in the lower zone of the main nave of the church and four in the upper zone near the domes, as can be seen in Figure 2. Data logging was scheduled every 10 min. This system provided the interior climate data for the month of September, 2019.
4.4.2. Local Surface Temperature Monitoring System (PSTMS)
This system corresponds to an Onset Hobo monitoring system, which is made up of a U30-NRC control and storage unit and has 10 ports for different types of wired sensors and a power supply to the network or to its own batteries, thus providing autonomy by not depending on a power supply obtained exclusively from the mains electricity supply. S-TMB-M0xx (10) surface temperature sensors were used in this study (Figure 4). These sensors cannot be calibrated. Proper verification and programming measures every 10 min were performed before installation.
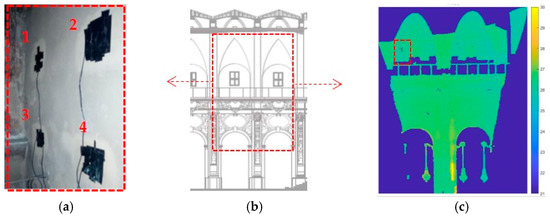
Figure 4.
(a) Photograph and (b) map showing the location of point surface sensors on the north face of Zone 2 at 10 a.m. on 17 September 2019, and those at 10 a.m. on 18 September 2019. (c) Location of the same area is indicated on a thermal orthoimage of the lateral wall.
The temperature information provided by the PSTMS has made it possible to verify thermal data from the scanner by means of statistical analyses of the results of eight measurement points coinciding with the thermal surfaces obtained.
4.4.3. D-TCV Monitoring System
- An overview of the system
A thermal scanning platform comprising a Riegl VZ-400 3D laser scanner model and an FLIR A65 thermal camera was used for the dense data acquisition of the surface temperature of the domes (Figure 5a). The scanner obtained point clouds in a range of 500 m. A reading covered an area of 360 × 100°, and five million points were obtained in 47 s for angular resolutions of 0.065° (both vertical and horizontal). The distance measurement precision was 5 mm, and the repeatability was 3 mm. The FLIR A65 thermal camera had a resolution of 640 × 512 pixels, a field of view (FOV) of 45 × 37°, and a frequency of 30 Hz. The temperature range in high gain mode was 233–823 K, with an accuracy of 0.4 K. The temperature values provided by the camera were corrected according to a previously attained blackbody calibration.
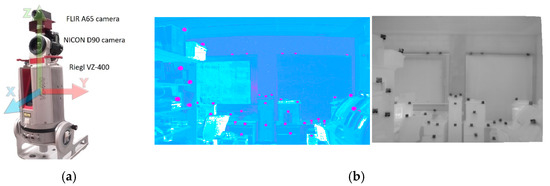
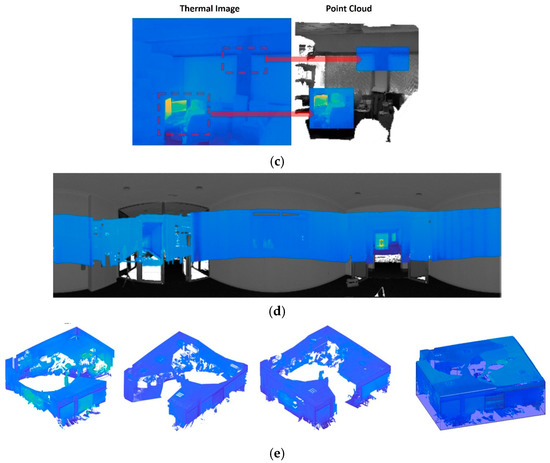
Figure 5.
(a) Riegl 3D-VZ400 scanner coupled with a 65 A FLIR IR camera and RGB NICO D90 camera. (b) Highlighted targets in the point cloud (left) and in the thermal image (right). (c) An example of a 3D-thermal image. (d) An example of a 360° thermal scan visualised on a polar image. (e) Aligning three 360° thermal scans and obtaining a single-subsampled thermal point cloud.
- Obtaining a 3D-thermal image
The transformation of a 3D point , in the scanner coordinate system, into the corresponding pixel of the thermal image, was defined by means of a 3 × 4 matrix M, called projective transformation.
Therefore, according to Equation (2) and assuming that r34 = 1, given the coordinates of a point P, from our laser scanner, the temperature assigned to P can be obtained from the corresponding coordinates in the thermal image and the coefficients of M.
The external calibration of the set laser scanner-thermal camera precisely consists of calculating the projective transformation M. This process can be solved identifying n (usually n > 15) 3D points of the point cloud and their corresponding pixels on the thermal image, and later solving an overdetermined system. In practice, a set of targets with high reflectance and low temperature were used (see Figure 5b).
In order to obtain a 3D-thermal image, the system identified which of the points of the point cloud fell into the thermal image and separated the right and wrong projection directions. At the end of this process, a set of 3D points had an associate temperature.
- Obtaining a thermal point cloud
Although a laser scanner collects a 360° point cloud with a wide field of view, the thermal camera has a reduced FOV (45 × 37°), which signifies that a single image can only provide temperature to a small part of the point cloud.
The thermal camera rotates in the same axis as the scanner; therefore, only 10 photos are necessary to obtain a panoramic thermal image and assign temperature to the majority of the points of the point cloud.
Owing to the reduced vertical field of view of the thermal camera, a part of the ceiling and floor of the room were not sensed. In order to obtain a more complete 3D thermal model of the scene, the system can take several T-scans from different positions and later fuse the corresponding thermal point clouds. To do this, we first carried out a coarse alignment by manually indicating several corresponding points in consecutive overlapping scans, and the ICP algorithm [60] was then run. The alignment was repeated for the next T-scan. More information about the external calibration process and the generation of a thermal point cloud can be found in Prado et al. [55].
Depending on the specific application, and if necessary, the scanner can be rotated in the tilt angle to collect data of a specific part of the building. For example, in order to take data from the ceiling and walls, as was necessary in the case study presented in this paper, the scanner was rotated 90° (see Figure 10a).
Further processes are denoising and subsampling, which were carried out under dedicated programming algorithms in MATLAB 20a. Figure 5e shows three aligned 360-thermal scans and the final thermal point cloud.
- Segmentation and visualisation processes
Apart from the processes related with the data acquisition and the generation of thermal point clouds, other important processes in this case study were data segmentation and visualisation.
Regarding segmentation, the thermal point cloud was split into its structural elements (SEs): ceiling, floor, walls and columns. This segmentation is based on the well-known RANSAC algorithm [61]. Each one of the 3D segments was converted afterwards into a thermal orthoimage, in which each pixel contained a temperature value. This process was carried out by projecting the 3D segment onto its corresponding fitted plane and then discretizing the projected points. The scene can thus be represented as a set of thermal-orthoimages, which were later used to study the energetic behaviour of each SE separately, as shown in Section 5.2.
Regarding visualisation, a virtual navigation system allows the user to move in the scene, orientate the camera, and view the thermal point cloud from all possible perspectives and positions. Other resources such as orbiting the whole scene around a fixed point, zooming on specific regions, and customising temperature scales and colour palettes are also available.
The system has also other processing tools which have not been used in this case study, such as data analysis and artificial intelligence algorithms, which were developed for analysis of the thermal behaviour of interior walls of buildings over time. This behaviour is obtained by processing thermal orthoimages at different times [62].
5. Results
5.1. Results Attained with Conventional Methodology
The wireless monitoring system (EMS) has collected data in the lower zone of the main nave of the church and in the upper zone near the domes. Hourly average data can be found in Figure 6. This graphical data shows constant temperatures; nevertheless, a certain correlation and lag between the exterior and interior climate exists, the upper zone being more outdoor temperature-dependent due to greater ventilation of the existing windows under the domes. The basic statistical values in Table 2 show similarities between the monthly mean values and those corresponding to the days of the measurement with the 3D-TCV system. The model obtained with the 3D-TCV system provides dense data of the dome surfaces that are analysed in Section 5.2.
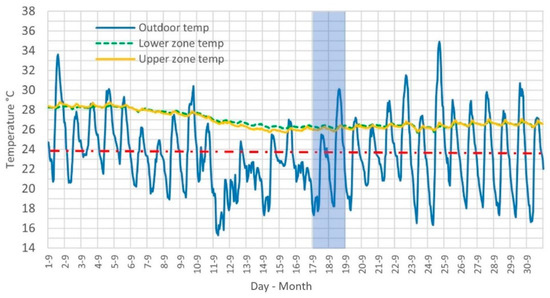
Figure 6.
Average hourly ambient temperature EMS values in upper and lower main nave zones of Santos Juanes church in September 2019. The dotted red line represents the maximum value of the admissible temperature range for the conservation of fresco paintings [63]. The blue rectangle represents the period of two characteristic days selected for the 3D-TCV test.
Table 2.
Average monthly ambient temperature EMS values in the upper and lower main nave zones of Santos Juanes church in September 2019 compared with average values of two characteristic days selected for the 3D-TCV test.
Considering standard values for the conservation of frescoes, we verified that, during the entire period analysed, the temperature was higher than the ideal range for better conservation (10–24 °C) [63].
A visual analysis of the graphs in Figure 6 reveals that a control of the infiltrations and the ventilation of the central nave of the church of Santos Juanes could attenuate the constant excess temperature that affects fresco paintings, which are currently in a restoration phase. The data clearly make us think that promoting nocturnal ventilation and reducing daytime ventilation can be an easy-to-implement bioclimatic strategy to improve environmental conditions towards better conservation. A detailed overview and subsequent analysis of the surface temperatures of the frescoes is presented in Section 5.2.
Figure 7, Figure 8 and Figure 9 correspond to the monitoring systems data (EMS and PSTMS) collected on 16 September 2019 from 9:00 a.m. to 7:00 p.m. for the north orientation, and for the south and west orientations from 17 September 2019 at 9:00 a.m. to 18 September 2020 at 9:00 a.m. The standard deviations and the average values of the temperature data collected in each orientation have been calculated.
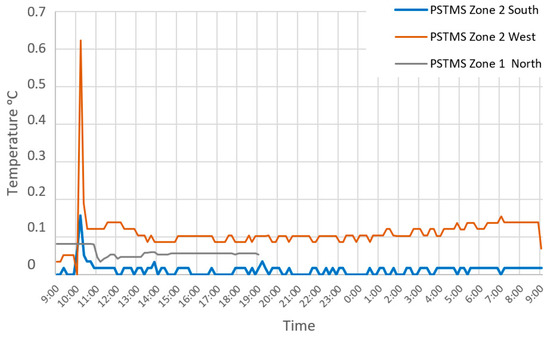
Figure 7.
Standard deviation on north, south and west surfaces. North zone on 16 September 2019, and west and south zones on 17 September 2019.
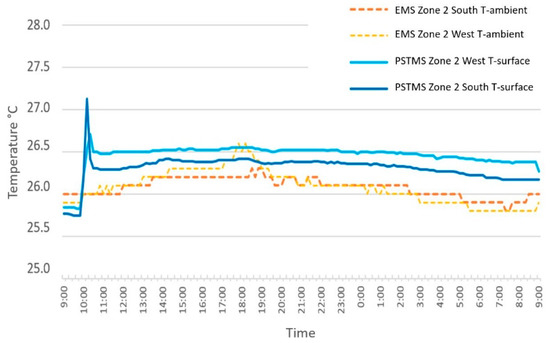
Figure 8.
Air and surface temperature in Zone 1 for north orientation on 16 September 2019.
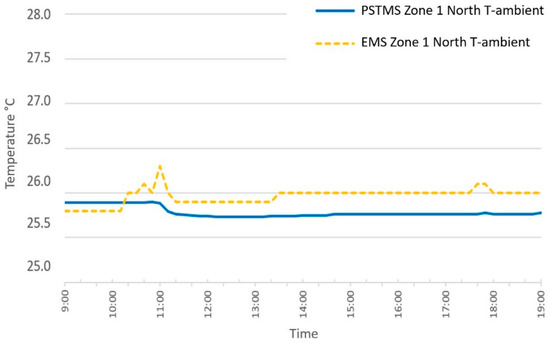
Figure 9.
Air and surface temperature in Zone 2 for east and west orientation on 17 September 2019.
Figure 7 shows the standard deviation of the surface temperatures collected with the PSTMS equipment for each zone and orientation on two consecutive days. Note that there were four sensors on the north surface (Zone 1), there were two sensors in the south orientation (Zone 2), and there were another two sensors in the west orientation. Data were collected for Zone 1 on 16 September 2019 for a period of 12 h, and for Zone 2 on 17 September 2019 for a period of 24 h. The graph clearly shows that during the first minutes of temperature data recording, the standard deviation was greater than 0.2 °C for the south and west orientations; therefore, it is possible to consider that the sensors are valid from 10:00 a.m. in all the cases analysed. It is also noted that there was a higher deviation in the west sensor and that the lowest was in the north sensor. Nevertheless, these were small values that were within the values allowed by the surface sensors used.
Figure 8 shows the temperature data collected inside the church in the northern area. Some occasional rises can be seen, which we assume are due to external actions owing to the use of the EMS. In this case, each piece of data collected from the surfaces with the PSTMS has also been compared with the interior temperature of the sensors closest to the scenario analysed.
Figure 9 shows the temperatures on the south and west surfaces when compared with the indoor ambient temperature of the closest scenarios using EMS. The data collected with PSTMS is also represented. On these surfaces, they are stable for 24 h with the exception of an initial peak, which is owing to the manual manipulation of the sensors.
5.2. Results Achieved with the 3D-TCV Technology
The scanning platform was placed in two different positions and rotated by 90°. A single 180° scan, with 20% overlapping between images, thus made it possible to obtain a point cloud that covered the sidewalls and the dome (Figure 10). A series of thermal scans was subsequently repeated every 30 min. A total of 16 and 48 scans were taken in Zone 1 and Zone 2, in 8 and 24 h sessions, respectively. The system was programmed to automatically take the thermal scans at specific periods of time, thus allowing the operator to leave the scene during the scanning session. This facilitated the data acquisition process, especially in the night sessions.
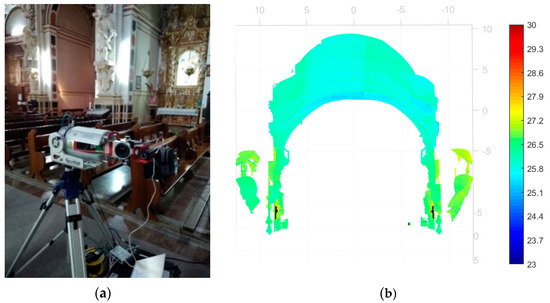
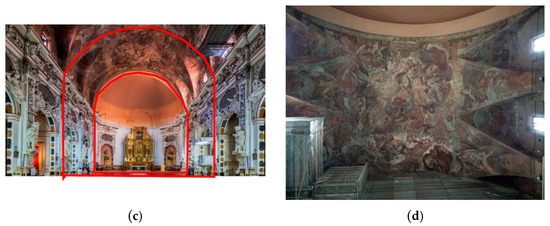
Figure 10.
(a) The 3D-TCV monitoring system. Riegl 3D-400 scanner coupled with 65A FLIR IR camera. (b) Thermal point cloud of Zone 1. (c) Region digitised from Position 1. (d) A detailed image of the dome.
A single thermal point cloud is composed of five million points, which entails 1.5 Gb of memory per scan, including colour and temperature information. The first process is focused on filtering outliers and erroneous data. Outliers were data obtained from outside the building and were collected by the scanner through windows or open doors. Erroneous data are usually generated by sparkling surfaces or accidental reflections.
The filtered thermal point cloud was then segmented into partial point clouds of the principal architectonic components of the scene. In this case, the 3D segments corresponded to the dome and the vertical walls of the church. Each one of the 3D segments was then turned into 2D thermal orthoimages, which could be explored using standard visual tools. Each orthoimage was visualised with a false-colour code in order to better identify variations in temperature.
The thermal scans were repeated every 30 min; therefore, a set of orthoimages was obtained per structural element, which was later visualised and explored using a tool developed in our lab. We carried out a thermal analysis of this whole database, considering the following aspects and measurements:
- Visualisation and measurements in the thermal point cloud (Figure 11a,b);
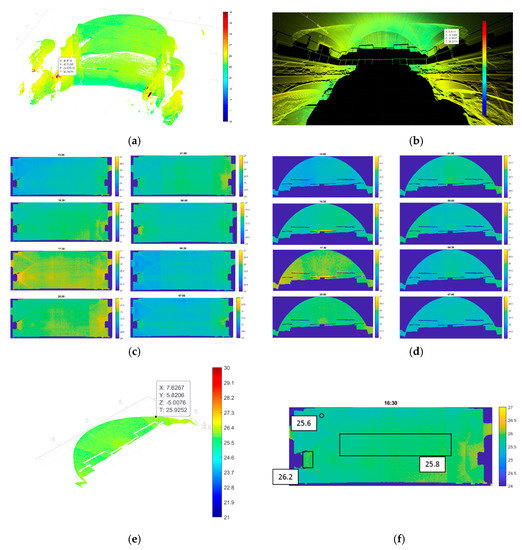
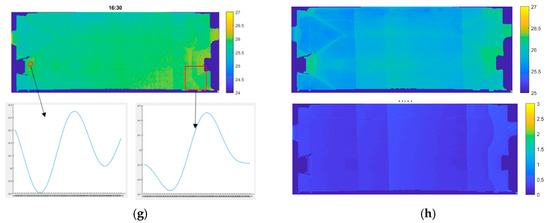 Figure 11. Visualisation and measurement resources. (a,b) Thermal point cloud using two kinds of visual resources. (c,d) Thermal orthoimages at different times. (e) A 3D representation of a structural element. (f) Measurement in thermal orthoimages. (g) Thermal evolution over time. (h) Mean thermal orthoimage and standard deviation image.
 - Temporal evolution of the temperature of a structural element of the building using thermal orthoimages (Figure 11c,d);
- Visualisation and local/regional measurements on the 3D point cloud of a structural element (Figure 11e);
- Visualisation and local/regional measurements on orthoimages (Figure 11f);
- Evolution of the temperature of selected regions of the scene using both the thermal point cloud and the corresponding orthoimage (Figure 11g);
- Mean orthoimage and standard deviation of a structural component (Figure 11h).
A qualitative discussion of the static and dynamic surface temperature behaviour can be derived from Figure 11. The segmentation of the thermal cloud and the possibility of presenting successive thermal orthoimages in time shows a detailed evolution of the temperature distribution that occurs on the surfaces of the dome. This proves that not all regions evolve in the same way and that, therefore, the thermal stress of the pictorial layer is uneven according to the areas that are clearly differentiated by the structure itself. This structure is manifested in the different regimes of thermal evolution in the daily cycle, as clearly verified in the nocturnal images of Figure 11b.
The quantitative reading of the thermal orthoimages indicates that some regions are closer to the upper limit of the ideal range of conservation of the frescoes that we have established for this study. These values indicate a higher thermal transmittance of the dome in these areas, because there is a ventilated chamber over the domes that transmits external thermal variations more easily in the areas with less mass, i.e., of less thickness. Therefore, from the values of the data obtained and the applications developed (Figure 11e), certain regionalised physical phenomena can be quantified, such as the thermal stress of the support layer of the paints and thermal transmittances, to name two examples.
The graphical representation of the automated statistical treatment of the orthoimages (Figure 11f) indicates a small increase in surface temperatures in the elements oriented to the south, which was probably due to a greater effect of solar radiation on the roof oriented in that direction.
5.3. Data Sharing from Conventional and 3D-TCV Technologies
Data obtained from the different methodologies were matched. Figure 12 illustrates some results concerning the temperatures collected using traditional environmental systems (EMS), surface methodologies (Method 1; PSTMS) and (Method 2; 3D-TCV) in Zones 1 and 2. The locations of the local sensors employed in Method 1 were manually identified in the orthoimages obtained from Method 2. The respective values of maximum, minimum, mean, and standard deviation are shown on the right-hand side of Figure 11.
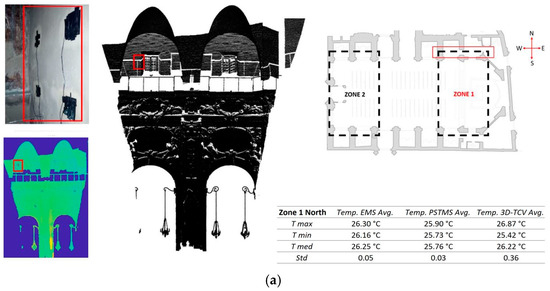
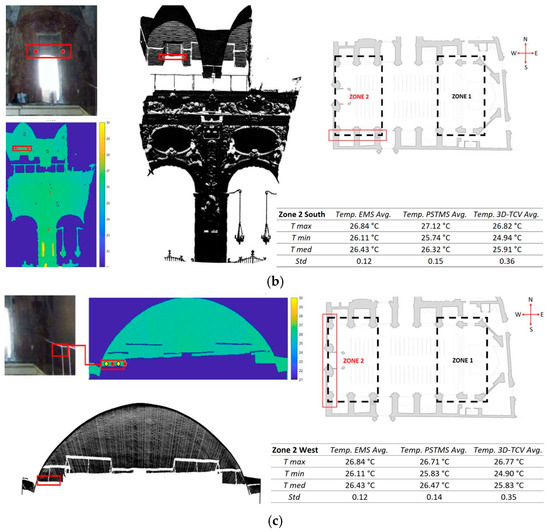
Figure 12.
Examples of data sharing of Methods 1 and 2 for Zones 1 and 2 in the case study. (a) Results of Position 1, north; (b) results of Position 2, south; (c) results of Position 2, west.
In Zone 1, north side, the data provided by both methods yielded similar temperatures during the eight hour session. In the case of Position 2, the results of the south and west sides are reported. There were slight variations in temperature of 0.41 °C and 0.64 °C between the two methods. In general, ambient temperatures were higher than surface temperatures, and Method 1 provided higher mean and lower standard variation values, which may be due to the different nature of the temperatures that these two systems measure.
In Method 1, the sensors were in contact with the surface to be measured. For reasons of accessibility and possible damage of the paint, the probes were placed in the lowest surfaces of the vault. The sensors were covered by the probe material and 1 cm thick extruded polyurethane insulation. The assembly was then adhered to the wall with adhesive tape, ensuring good thermal contact of the sensor with the surface by using adherent paste. In this way, each measurement point was isolated from the air and infrared radiation. Note that the probe was in contact with the surface of the object and, consequently, could alter the heat exchange between the object and the environment [47].
On the other hand, the sensor of Method 2 measured the infrared radiation flux emitted by the surfaces of domes and walls remotely and without contact. This system obtained dense information of the visible surface, avoiding the aforementioned access and damage problems. For a correct interpretation of the results, it is necessary to consider that these measurements are radiometric in nature, and therefore correspond to apparent temperatures [31].
In the three tables of Figure 12, slight temperature differences between Methods 1 and 2 can be seen, which are in accordance with the respective repeatability values of 0.2 °C (contact sensors) and 0.5 °C (distance sensors) imposed by the EN 15,758 standard [47].
6. Discussion and Future Improvements
We have presented a revision and updating of the current building energetic monitoring methodologies including thermal computer vision-based technologies (3D-TCV). This paper provides a detailed definition of the most significant aspects of this new extended methodology and presents a case study showing the potential of 3D-TCV techniques and how they complement the current techniques. It has been proven that 3D-TCV techniques can be incorporated as new forms of monitoring that can complement current existing building energy monitoring methodologies and integrate them in heritage buildings to promote their conservation and avoid pathologies.
The incorporation of these thermal computer vision-based technologies has several advantages and disadvantages compared with the conventional monitoring technologies, which are synthetised in the following aspects:
- Kind of analysis. In contrast with conventional systems, which provide data for quantitative and precise analysis, thermography and the 3D-TCV systems are mostly oriented towards qualitative analysis. Therefore, the combination of the quantitative data of a conventional system and the qualitative data of thermography helps us to determine the thermal comfort conditions with greater precision;
- Data density. These 3D-TCV systems provide high-density data in a monitoring session, which depends on the scanner and thermal camera resolutions. For example, in the case study, the data density used was of 1 data point/cm3. However, conventional systems collect a reduced number of single data points at a time;
- Local vs. Global data. Related to the previous item, it can be said that conventional techniques collect local single data that characterise a local or global variable. Thus, our surface temperature monitoring system (PSTMS) provides a single temperature value of a single point of a surface, and the environmental monitoring system (EMS) yields a unique value that characterises the global external temperature. On the contrary, a 3D-TCV system provides millions local data points of a global scenario. For instance, our 3D-TCV system can yield two million temperature values of the points of a visible scene;
- Measurements’ locations. The measurements taken with a 3D-TCV system were located in the space by means of their associated 3D coordinates, which signifies that they could easily be integrated into a 3D model of the scene. This important characteristic was not available for most of the conventional monitoring systems, in which the location of the sensors in a 3D environment must be manually provided;
- Temporality. Conventional methods work for long periods of time (i.e., weeks, months, and years) in permanent positions. Nevertheless, 3D-TCV techniques are useful for sporadic campaigns. In this sense, 3D thermography collects data from the entire space simultaneously, which allows us to analyse the entire space under the same environmental conditions at a time;
- Detection of irregularities. By using 3D-TCV, the user can detect and precisely localise some irregularities concerning pathologies in surfaces (such as cracks, humidity or air infiltrations), hidden irregular architectural elements, different construction systems, and different materials used in construction;
- Cost. Usually, conventional monitoring systems are low-cost devices compared to laser scanners and infrared cameras;
- Operators. It can be said that both conventional and 3D-TCV monitoring systems require skilled workers and operators in different areas;
- Setup installation. The 3D-TCV platforms require only one installation at the beginning of their construction and calibration. They are moved afterwards and used in the same way for different scenarios, which entails an easy-to-use advantage. On the contrary, conventional technologies require a wide deployment of sensors and means for their installation. Moreover, the reliability of the results will depend on the number of sensors placed;
- Thermal comfort analysis. Conventional monitoring systems are generally used to provide thermal comfort conditions. However, the comfort analysis might be incomplete because these systems collect punctual data, which are assumed to be representative of the volume or area to be further analysed. However, surface temperatures also affect thermal comfort, so this information would allow extrapolation to the overall comfort data of the building. The integration of 3D-TCV methodology into conventional systems would help to conduct precise evaluations of the surface temperatures of different elements of the building, leading a more reliable assessment of the comfort;
- Accessibility. The 3D-TCV technique obtains the temperatures of surfaces that are frequently difficult to access remotely and without contact. This a special advantage compared to the conventional techniques.
Future actions are aimed at polishing and completing this methodology regarding aspects related to increasing the automation of the process (segmentation and representation of information), more effective sharing with other technologies in the acquisition and result analysis phases, and the treatment of emissivity in data processing.
For future works in the use of this methodology, it will be interesting to consider an analysis procedure that covers all seasonal periods, using conventional monitoring systems to gather temperature and humidity data throughout the year and proposing four 3D-CTV scans over 24 h on days with different conditions. The objective is to analyse the heating and cooling processes according to the annual period, as well as to evaluate the thermal discontinuities of the surfaces, which will enable us to discover pathologies, hidden elements, material discontinuities, etc.
Author Contributions
Conceptualisation, A.A., C.A.-F., J.-L.V. and V.P.; methodology, A.A. and V.P.; software, A.A. and S.A.P.; validation, A.A. and S.A.P.; formal analysis, A.A., C.A.-F. and V.P.; investigation, A.A. and J.-L.V.; writing—original draft preparation, A.A.; writing—review and editing, A.A., C.A.-F., J.-L.V., S.A.P. and V.P.; supervision, A.A. and J.-L.V.; All authors have read and agreed to the published version of the manuscript.
Funding
This research was funded by the European Regional Development Fund (SBPLY/19/180501/000094 project) and the Ministry of Science and Innovation (PID2019-108271RB-C31 and PID2019-108271RB-C33).
Institutional Review Board Statement
Not applicable.
Informed Consent Statement
Not applicable.
Data Availability Statement
Not applicable.
Acknowledgments
The study could not have taken place without the assistance of the wardens of the Royal Parish of Santos Juanes.
Conflicts of Interest
The authors declare no conflict of interest.
References
- Camuffo, D.; Pagan, E.; Rissanen, S.; Bratasz, Ł.; Kozłowski, R.; Camuffo, M.; della Valle, A. An advanced church heating system favourable to artworks: A contribution to European standardisation. J. Cult. Herit. 2010, 11, 205–219. [Google Scholar] [CrossRef]
- Camuffo, D.; Giorio, R. Quantitative evaluation of water deposited by dew on monuments. Boundary-Layer Meteorol. 2003, 107, 655–672. [Google Scholar] [CrossRef]
- Camuffo, D.; Bernardi, A. Study of the Microclimate of the Hall of the Giants in the Carrara Palace in Padua. Stud. Conserv. 1995, 40, 237–249. [Google Scholar] [CrossRef]
- Baer, N.S.; Camuffo, D. Microclimate for Cultural Heritage. Stud. Conserv. 2000, 45, 143. [Google Scholar] [CrossRef]
- Camuffo, D. Calibration and instrumental errors in early measurements of air temperature. Clim. Change 2002, 53, 297–329. [Google Scholar] [CrossRef]
- Camuffo, D. Standardization activity in the evaluation of moisture content. J. Cult. Herit. 2018, 31, S10–S14. [Google Scholar] [CrossRef]
- Varas-Muriel, M.J.; Fort, R.; Martínez-Garrido, M.I.; Zornoza-Indart, A.; López-Arce, P. Fluctuations in the indoor environment in Spanish rural churches and their effects on heritage conservation: Hygro-thermal and CO2 conditions monitoring. Build. Environ. 2014, 82, 97–109. [Google Scholar] [CrossRef]
- Camuffo, D. Microclimate for Cultural Heritage: Conservation, Restoration, and Maintenance of Indoor and Outdoor Monuments; Elsevier Science: Amsterdam, The Netherlands, 2014; ISBN 9780444632968. [Google Scholar]
- Hall, C.; Hamilton, A.; Hoff, W.D.; Viles, H.A.; Eklund, J.A. Moisture dynamics in walls: Response to micro-environment and climate change. Proc. R. Soc. A Math. Phys. Eng. Sci. 2011, 467, 194–211. [Google Scholar] [CrossRef]
- Valderrama-Ulloa, C.; Silva-Castillo, L.; Sandoval-Grandi, C.; Robles-Calderon, C.; Rouault, F. Indoor Environmental Quality in Latin American Buildings: A Systematic Literature Review. Sustainability 2020, 12, 643. [Google Scholar] [CrossRef]
- Richardson, G.; Barton, A.; Basham, M.; Foy, C.; Eick, S.A.; Somerville, M. The Watcombe housing study: The short-term effect of improving housing conditions on the indoor environment. Sci. Total Environ. 2006, 361, 73–80. [Google Scholar] [CrossRef]
- Martínez-Garrido, M.I.; Aparicio, S.; Fort, R.; Anaya, J.J.; Izquierdo, M.A.G. Effect of solar radiation and humidity on the inner core of walls in historic buildings. Constr. Build. Mater. 2014, 51, 383–394. [Google Scholar] [CrossRef][Green Version]
- Vella, R.C.; Martinez, F.J.R.; Yousif, C.; Gatt, D. A study of thermal comfort in naturally ventilated churches in a Mediterranean climate. Energy Build. 2020, 213, 109843. [Google Scholar] [CrossRef]
- Yang, Z.; Becerik-Gerber, B. Modeling personalized occupancy profiles for representing long term patterns by using ambient context. Build. Environ. 2014, 78, 23–35. [Google Scholar] [CrossRef]
- Perles, A.; Pérez-Marín, E.; Mercado, R.; Segrelles, J.D.; Blanquer, I.; Zarzo, M.; Garcia-Diego, F.J. An energy-efficient internet of things (IoT) architecture for preventive conservation of cultural heritage. Futur. Gener. Comput. Syst. 2018, 81, 566–581. [Google Scholar] [CrossRef]
- Varas-Muriel, M.J.; Martínez-Garrido, M.I.; Fort, R. Monitoring the thermal–hygrometric conditions induced by traditional heating systems in a historic Spanish church (12th–16th C). Energy Build. 2014, 75, 119–132. [Google Scholar] [CrossRef]
- Terrill, T.J.; Morelli, F.J.; Rasmussen, B.P. Energy analysis of religious facilities in different climates through a long-term energy study. Energy Build. 2015, 108, 72–81. [Google Scholar] [CrossRef]
- Martínez-Garrido, M.I.; Fort, R.; Gómez-Heras, M.; Valles-Iriso, J.; Varas-Muriel, M.J. A comprehensive study for moisture control in cultural heritage using non-destructive techniques. J. Appl. Geophys. 2018, 155, 36–52. [Google Scholar] [CrossRef]
- Muñoz-González, C.M.; León-Rodríguez, A.L.; Navarro-Casas, J. Air conditioning and passive environmental techniques in historic churches in Mediterranean climate. A proposed method to assess damage risk and thermal comfort pre-intervention, simulation-based. Energy Build. 2016, 130, 567–577. [Google Scholar] [CrossRef]
- Martínez-Garrido, M.I.; Fort, R. Experimental assessment of a wireless communications platform for the built and natural heritage. Meas. J. Int. Meas. Confed. 2016, 82, 188–201. [Google Scholar] [CrossRef]
- Mesas-Carrascosa, F.J.; Verdú Santano, D.; de Larriva, J.E.M.; Ortíz Cordero, R.; Hidalgo Fernández, R.E.; García-Ferrer, A. Monitoring heritage buildings with open source hardware sensors: A case study of the mosque-cathedral of Córdoba. Sensors 2016, 16, 1620. [Google Scholar] [CrossRef]
- Muñoz-González, C.M.; León-Rodríguez, Á.L.; Medina, R.C.S.; Teeling, C. Hygrothermal performance ofworship spaces: Preservation, comfort, and energy consumption. Sustainability 2018, 10, 3838. [Google Scholar] [CrossRef]
- Poortinga, W.; Jiang, S.; Grey, C.; Tweed, C. Impacts of energy-efficiency investments on internal conditions in low-income households. Build. Res. Inf. 2018, 46, 653–667. [Google Scholar] [CrossRef]
- Litti, G.; Audenaert, A. An integrated approach for indoor microclimate diagnosis of heritage and museum buildings: The main exhibition hall of Vleeshuis museum in Antwerp. Energy Build. 2018, 162, 91–108. [Google Scholar] [CrossRef]
- Lucero-Gómez, P.; Balliana, E.; Izzo, F.C.; Zendri, E. A new methodology to characterize indoor variations of temperature and relative humidity in historical museum buildings for conservation purposes. Build. Environ. 2020, 185, 107147. [Google Scholar] [CrossRef]
- Danese, M.; Demsar, U.; Masini, N.; Charlton, M. Investigating material decay of historic buildings using visual analitycs with multi-temporal infrared thermographic data. Archaeometry 2009, 52, 482–501. [Google Scholar] [CrossRef]
- Avdelidis, N.; Moropoulou, A. Applications of infrared thermography for the investigation of historic structures. J. Cult. Herit. 2004, 5, 119–127. [Google Scholar] [CrossRef]
- Grinzato, E.; Bison, P.G.; Marinetti, S. Monitoring of ancient buildings by the thermal method. J. Cult. Herit. 2002, 3, 21–29. [Google Scholar] [CrossRef]
- Balaras, C.A.; Argiriou, A.A. Infrared thermography for building diagnostics. Energy Build. 2002, 34, 171–183. [Google Scholar] [CrossRef]
- Mercuri, F.; Cicero, C.; Orazi, N.; Paoloni, S.; Marinelli, M.; Zammit, U. Infrared Thermography Applied to the Study of Cultural Heritage. Int. J. Thermophys. 2015, 36, 1189–1194. [Google Scholar] [CrossRef]
- Gayo, E.; Palomo, A.; Macías, A. La termografía infrarroja: Posibilidades y aplicación al estudio superficial de los materiales. Mater. Construcción 1992, 42, 5–14. [Google Scholar] [CrossRef]
- Nardi, I.; Sfarra, S.; Ambrosini, D. Quantitative thermography for the estimation of the U-value: State of the art and a case study. J. Phys. Conf. Ser. 2014, 547, 1–9. [Google Scholar] [CrossRef]
- Tang, P.; Huber, D.; Akinci, B.; Lipman, R.; Lytle, A. Automatic reconstruction of as-built building information models from laser-scanned point clouds: A review of related techniques. Autom. Constr. 2010, 19, 829–843. [Google Scholar] [CrossRef]
- Brilakis, I.; Lourakis, M.; Sacks, R.; Savarese, S.; Christodoulou, S.; Teizer, J.; Makhmalbaf, A. Toward automated generation of parametric BIMs based on hybrid video and laser scanning data. Adv. Eng. Inform. 2010, 24, 456–465. [Google Scholar] [CrossRef]
- Dimitrov, A.; Golparvar-Fard, M. Segmentation of building point cloud models including detailed architectural/structural features and MEP systems. Autom. Constr. 2015, 51, 32–45. [Google Scholar] [CrossRef]
- Xiong, X.; Adan, A.; Akinci, B.; Huber, D. Automatic creation of semantically rich 3D building models from laser scanner data. Autom. Constr. 2013, 31, 325–337. [Google Scholar] [CrossRef]
- Adán, A.; Quintana, B.; Vázquez, A.S.; Olivares, A.; Parra, E.; Prieto, S. Towards the automatic scanning of indoors with robots. Sensors 2015, 15, 11551–11574. [Google Scholar] [CrossRef] [PubMed]
- Cho, Y.K.; Ham, Y.; Golpavar-Fard, M. 3D as-is building energy modeling and diagnostics: A review of the state-of-the-art. Adv. Eng. Inform. 2015, 29, 184–195. [Google Scholar] [CrossRef]
- Chen, J.; Fang, Y.; Cho, Y.K. Performance evaluation of 3D descriptors for object recognition in construction applications. Autom. Constr. 2018, 86, 44–52. [Google Scholar] [CrossRef]
- Wang, C.; Cho, Y.K.; Gai, M. As-Is 3D Thermal Modeling for Existing Building Envelopes Using a Hybrid LIDAR System. J. Comput. Civ. Eng. 2013, 27, 645–656. [Google Scholar] [CrossRef]
- Demisse, G.G.; Borrmann, D.; Nüchter, A. Interpreting Thermal 3D Models of Indoor Environments for Energy Efficiency. J. Intell. Robot. Syst. Theory Appl. 2015, 77, 55–72. [Google Scholar] [CrossRef]
- Ham, Y.; Golparvar-Fard, M. Mapping actual thermal properties to building elements in gbXML-based BIM for reliable building energy performance modeling. Autom. Constr. 2015, 49, 214–224. [Google Scholar] [CrossRef]
- Adán, A.; Prado, T.; Prieto, S.A.; Quintana, B. Fusion of Thermal Imagery and LiDAR Data for Generating TBIM Models. In Proceedings of the IEEE Sensors, Socttish Event Campus (SEC), Glasgow, UK, 29 October–1 November 2017; p. 3. [Google Scholar]
- Adán, A.; Prieto, S.A.; Quintana, B.; Prado, T.; García, J. An Autonomous Thermal Scanning System with Which to Obtain 3D Thermal Models of Buildings. In Proceedings of the Advances in Informatics and Computing in Civil and Construction Engineering; Mutis, I., Hartmann, T., Eds.; Springer International Publishing: Cham, Switzerland, 2019; pp. 489–496. [Google Scholar]
- Rodríguez-Rodríguez, I.; González Vidal, A.; Ramallo González, A.; Zamora, M. Commissioning of the Controlled and Automatized Testing Facility for Human Behavior and Control (CASITA). Sensors 2018, 18, 2829. [Google Scholar] [CrossRef]
- CEN. European Standard EN 726:1998; Ergonomics of the Thermal Environment—Determination and Interpretation of Cold Stress When Using Required Clothing Insulation (IREQ) and Local Cooling Effects; CEN: Brussels, Belgium, 2007; p. 34. [Google Scholar]
- CEN. EN 15758:2010; Conservation of Cultural Property—Procedures and Instruments for Measuring Temperatures of the Air and the Surfaces of Objects; CEN: Brussels, Belgium, 2010; p. 15. [Google Scholar]
- International Organization for Standardization. International_Standard ISO 12569; Thermal Performance of Buildings and Materials—Determination of Specific Airflow Rate in Buildings—Tracer Gas Dilution Method; International Organization for Standardization: Geneva, Switzerland, 2006. [Google Scholar]
- Comite Europeen de Normalisation. EN 13187; Thermal Performance of Buildings—Qualitative Detection of Thermal Irregularities in Building Envelopes—Infrared Method (ISO 6781:1983 Modified); Comite Europeen de Normalisation: Brussels, Belgium, 1998. [Google Scholar]
- Martínez-Molina, A.; Tort-Ausina, I.; Cho, S.; Vivancos, J.L. Energy efficiency and thermal comfort in historic buildings: A review. Renew. Sustain. Energy Rev. 2016, 61, 70–85. [Google Scholar] [CrossRef]
- De la Flor, F.J.S.; Domínguez, S.Á.; Félix, J.L.M.; Falcón, R.G. Climatic zoning and its application to Spanish building energy performance regulations. Energy Build. 2008, 40, 1984–1990. [Google Scholar] [CrossRef]
- Pérez-Andreu, V.; Aparicio-Fernández, C.; Vivancos, J.-L. Open source building automation system for reduction of energy demand in buildings. In Proceedings of the 1st International Conference on Data for Low Energy Buildings, Murcia, Spain, 28–29 June 2018. [Google Scholar]
- Heikkila, J.; Silven, O. Four-step camera calibration procedure with implicit image correction. In Proceedings of the IEEE Computer Society Conference on Computer Vision and Pattern Recognition, San Juan, PR, USA, 17–19 June 1997. [Google Scholar]
- Li, H.; Zhu, M. Simulation of vignetting effect in thermal imaging system. In Proceedings of the MIPPR 2009: Multispectral Image Acquisition and Processing, Yichang, China, 30 October–1 November 2009; Volume 7494. [Google Scholar]
- Prado, T.; Quintana, B.; Prieto, S.A.; Adán, A. T-Scan: Obtención de nubes de puntos con color y temperatura en interior de edificios. In Proceedings of the XXXVIII Jornadas de Automática, Gijón, Spain, 6–8 September 2017; Universidade da Coruña, Servizo de Publicacións: Corunna, Spain, 2020; pp. 1007–1017. [Google Scholar]
- Prieto, S.A.; Quintana, B.; Adán, A.; Vázquez, A.S. As-is building-structure reconstruction from a probabilistic next best scan approach. Rob. Auton. Syst. 2017, 94, 186–207. [Google Scholar] [CrossRef]
- Quintana, B.; Prieto, S.A.; Adán, A.; Vázquez, A.S. Semantic scan planning for indoor structural elements of buildings. Adv. Eng. Informatics 2016, 30, 643–659. [Google Scholar] [CrossRef]
- Adán, A.; Quintana, B.; Prieto, S.A.; Bosché, F. An autonomous robotic platform for automatic extraction of detailed semantic models of buildings. Autom. Constr. 2020, 109, 102963. [Google Scholar] [CrossRef]
- Adán, A.; García, J.; Quintana, B.; Castilla, F.J.; Pérez, V. Temporal-Clustering Based Technique for Identifying Thermal Regions in Buildings. In Advanced Concepts for Intelligent Vision Systems; Including Subseries Lecture Notes in Artificial Intelligence and Lecture Notes in Bioinformatics; Springer: Cham, Switzerland, 2020; Volume 12002 LNCS. [Google Scholar]
- Besl, P.J.; McKay, N.D. A method for registration of 3-D shapes. IEEE Trans. Pattern Anal. Mach. Intell. 1992, 14, 239–256. [Google Scholar] [CrossRef]
- Fischler, M.A.; Bolles, R.C. Random sample consensus. Commun. ACM 1981, 24, 381–395. [Google Scholar] [CrossRef]
- García, J.; Quintana, B.; Adán, A.; Pérez, V.; Castilla, F.J. 3D-TTA: A Software Tool for Analyzing 3D Temporal Thermal Models of Buildings. Remote Sens. 2020, 12, 2250. [Google Scholar] [CrossRef]
- Corgnati, S.P.; Fabi, V.; Filippi, M. A methodology for microclimatic quality evaluation in museums: Application to a temporary exhibit. Build. Environ. 2009, 44, 1253–1260. [Google Scholar] [CrossRef]


Publisher’s Note: MDPI stays neutral with regard to jurisdictional claims in published maps and institutional affiliations. |
© 2021 by the authors. Licensee MDPI, Basel, Switzerland. This article is an open access article distributed under the terms and conditions of the Creative Commons Attribution (CC BY) license (https://creativecommons.org/licenses/by/4.0/).