Assessing Deep Convolutional Neural Networks and Assisted Machine Perception for Urban Mapping
Abstract
1. Introduction
2. Materials and Methods
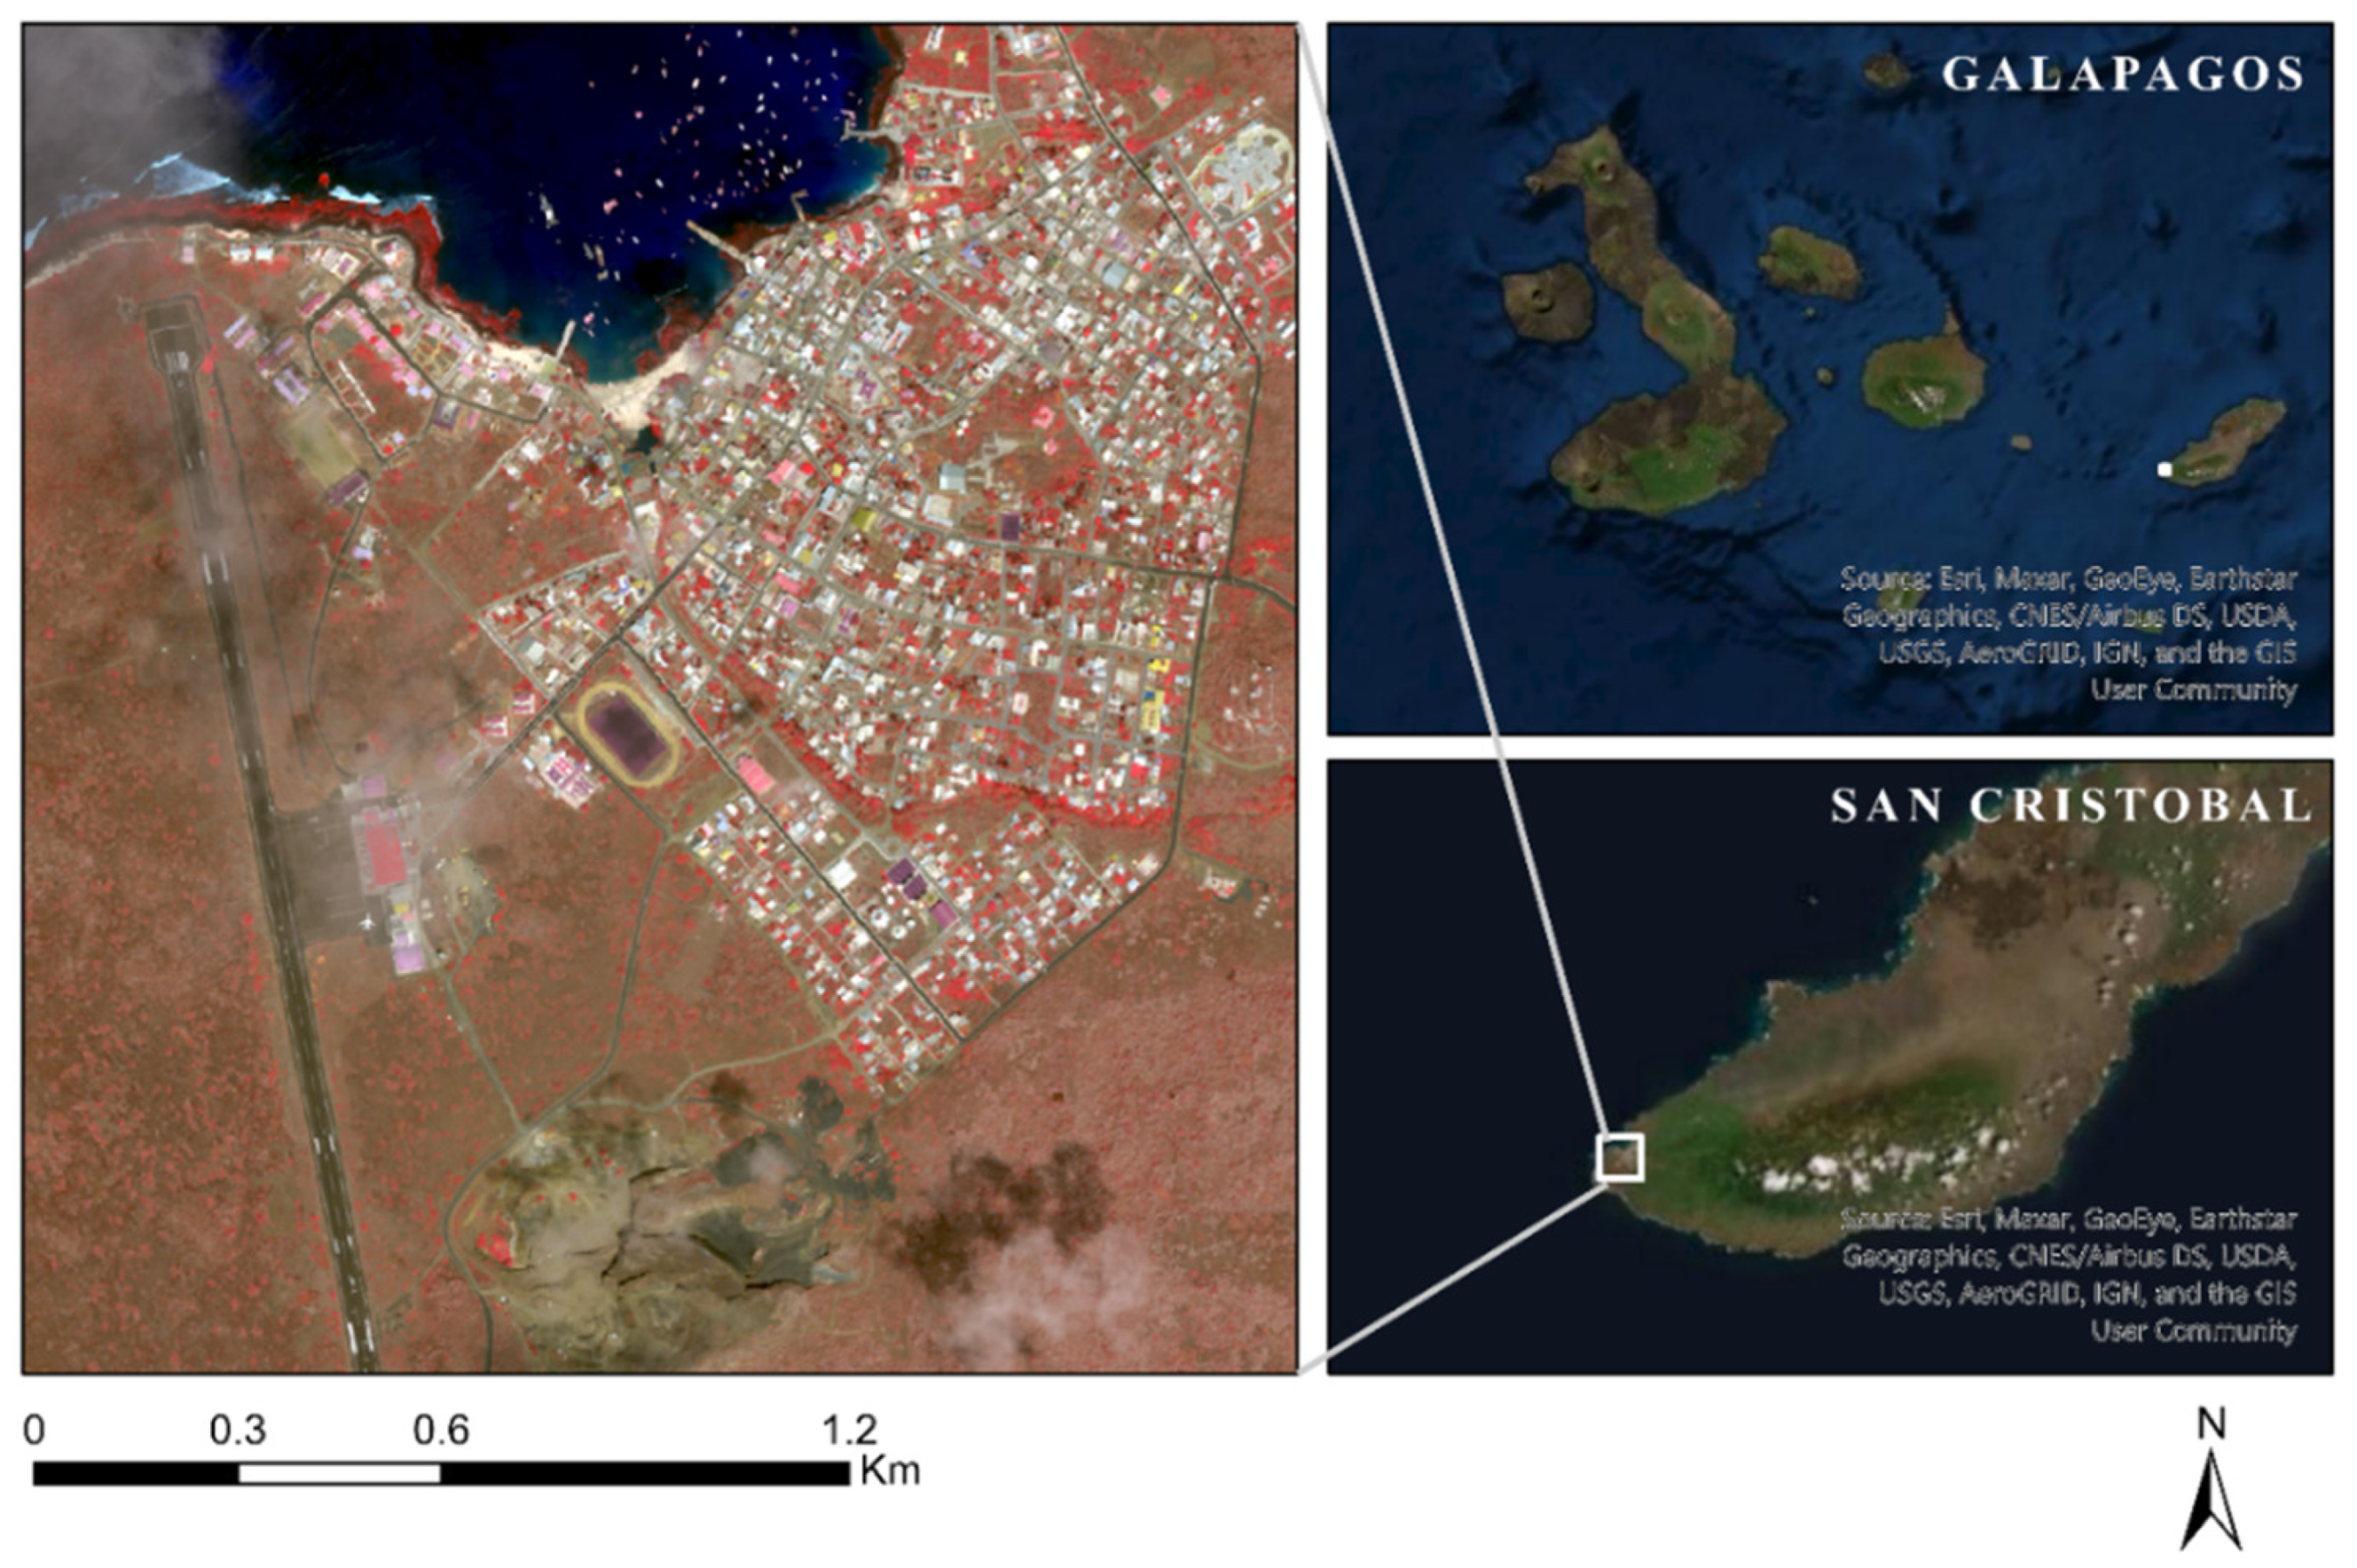
2.1. Study Area and Data
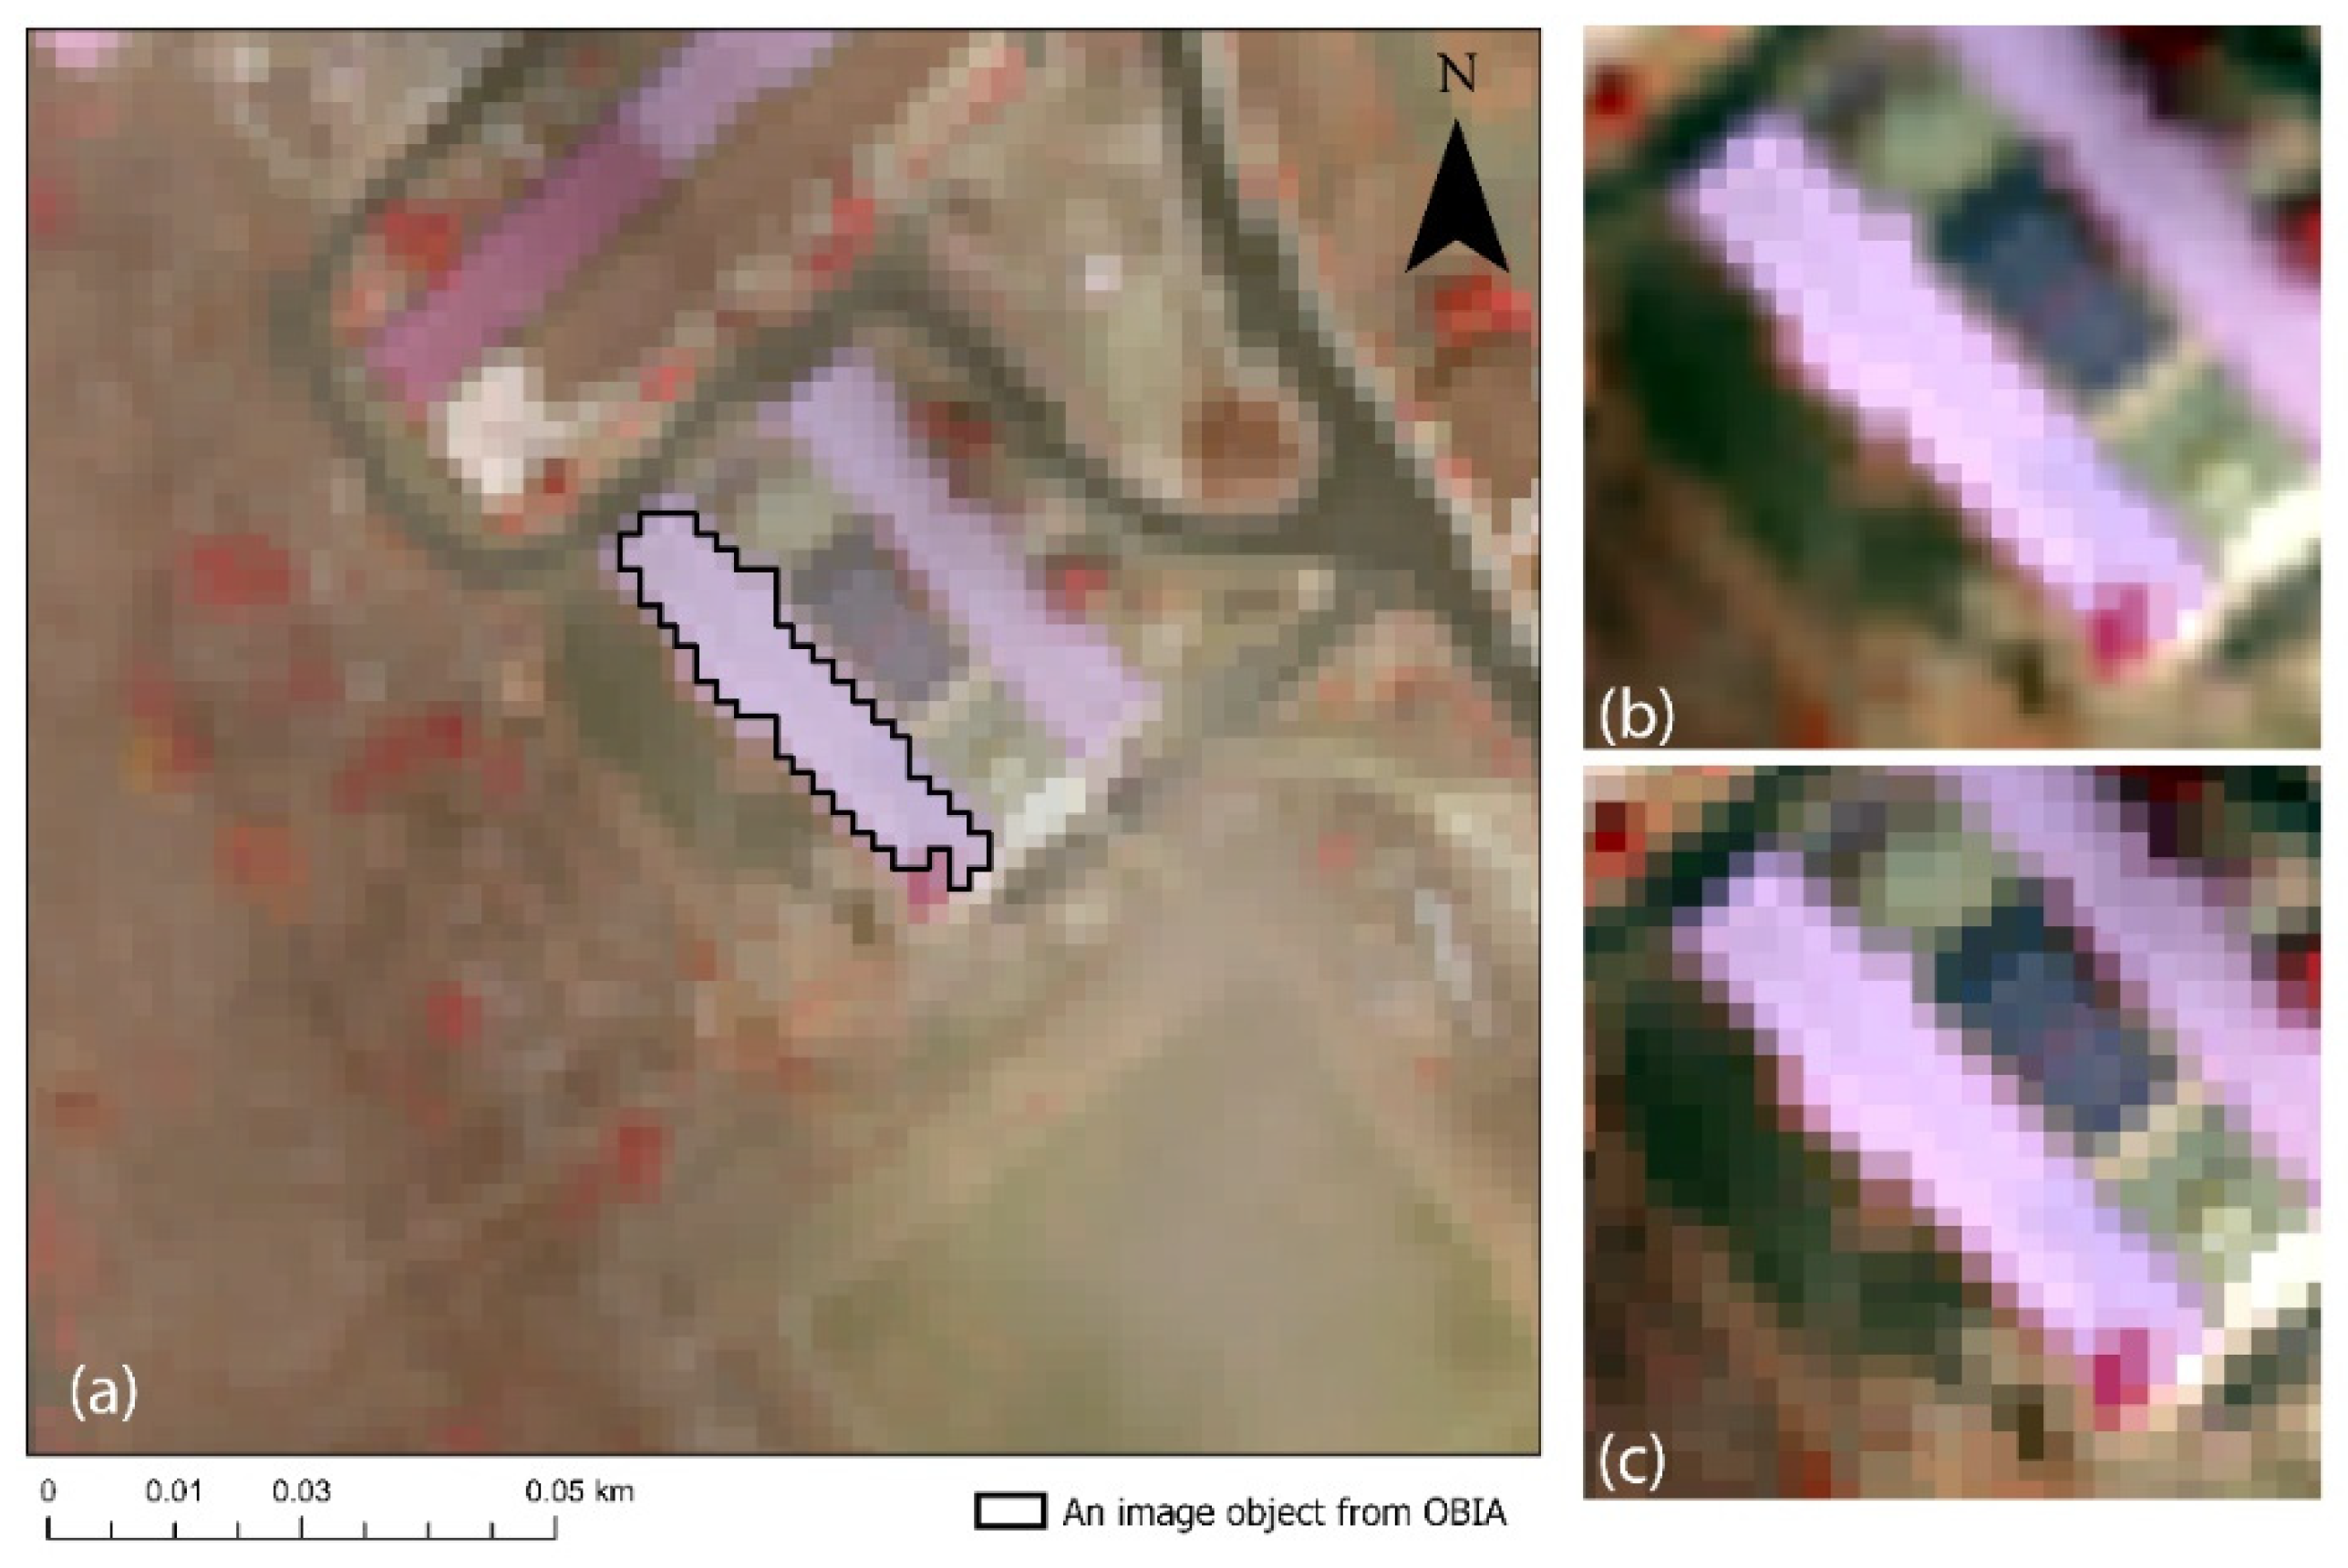
2.2. OBIA Image Classification
2.3. Image Classification Using U-Net
2.4. Image Classification Using VGG16
3. Results
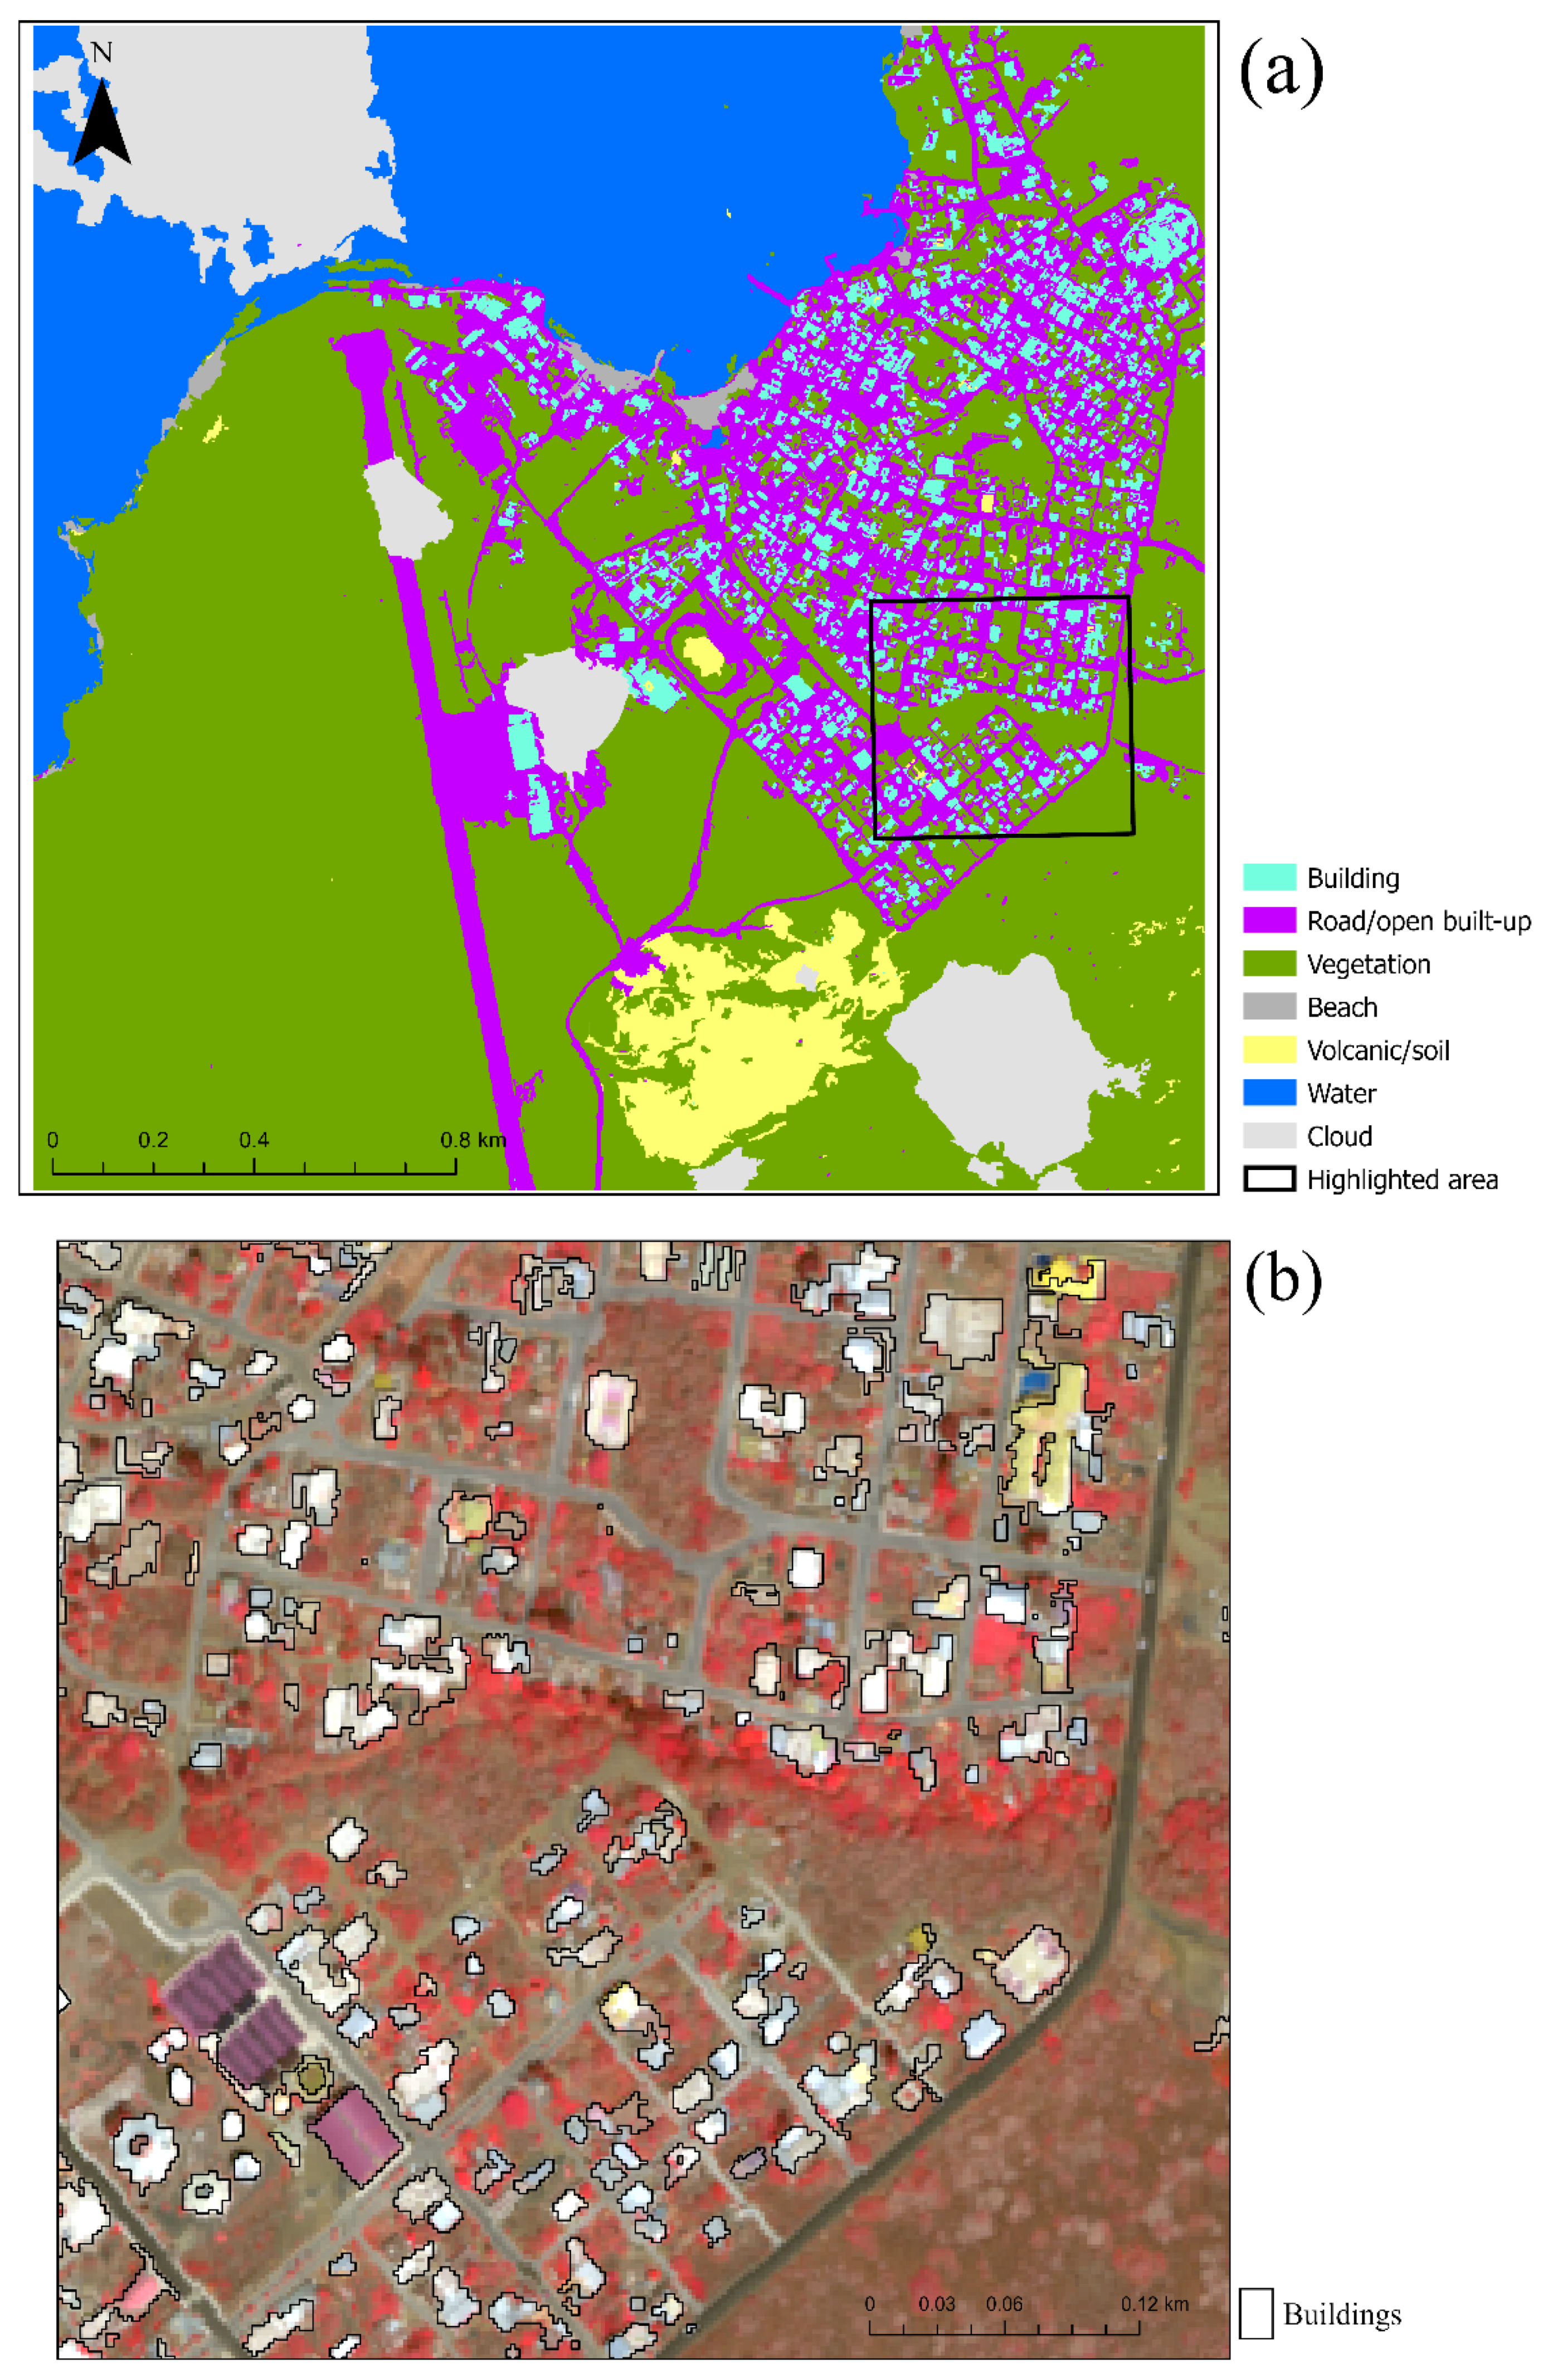
3.1. OBIA
3.2. U-Net Mapping
3.3. VGG16 Mapping
4. Discussion
5. Conclusions
Author Contributions
Funding
Institutional Review Board Statement
Informed Consent Statement
Data Availability Statement
Conflicts of Interest
References
- Manandhar, D.; Shibasaki, R. Auto-extraction of urban features from vehicle-borne laser data. Int. Arch. Photogramm. Remote Sens. Spat. Inf. Sci. 2002, 34, 650–655. [Google Scholar]
- Huang, X.; Lu, Q.; Zhang, L. A multi-index learning approach for classification of high-resolution remotely sensed images over urban areas. ISPRS J. Photogramm. Remote Sens. 2014, 90, 36–48. [Google Scholar] [CrossRef]
- Huang, X.; Zhang, L. Morphological building/shadow index for building extraction from high-resolution imagery over urban areas. IEEE J. Sel. Top. Appl. Earth Obs. Remote Sens. 2011, 5, 161–172. [Google Scholar] [CrossRef]
- Pu, R.; Landry, S.; Yu, Q. Object-based urban detailed land cover classification with high spatial resolution IKONOS imagery. Int. J. Remote Sens. 2011, 32, 3285–3308. [Google Scholar] [CrossRef]
- Hamedianfar, A.; Shafri, H.Z.M.; Mansor, S.; Ahmad, N. Improving detailed rule-based feature extraction of urban areas from WorldView-2 image and lidar data. Int. J. Remote Sens. 2014, 35, 1876–1899. [Google Scholar] [CrossRef]
- Yu, Q.; Gong, P.; Clinton, N.; Biging, G.; Kelly, M.; Schirokauer, D. Object-based detailed vegetation classification with airborne high spatial resolution remote sensing imagery. Photogramm. Eng. Remote Sens. 2006, 72, 799–811. [Google Scholar] [CrossRef]
- Blaschke, T.; Lang, S.; Hay, G. (Eds.) Object-Based Image Analysis: Spatial Concepts for Knowledge-Driven Remote Sensing Applications; Springer Science & Business Media: Berlin/Heidelberg, Germany, 2008. [Google Scholar]
- Walsh, S.J.; McCleary, A.L.; Mena, C.F.; Shao, Y.; Tuttle, J.P.; González, A.; Atkinson, R. QuickBird and Hyperion data analysis of an invasive plant species in the Galapagos Islands of Ecuador: Implications for control and land use management. Remote Sens. Environ. 2008, 112, 1927–1941. [Google Scholar] [CrossRef]
- Shao, Y.; Taff, G.N.; Walsh, S.J. Shadow detection and building-height estimation using IKONOS data. Int. J. Remote Sens. 2011, 32, 6929–6944. [Google Scholar] [CrossRef]
- Pu, R.; Landry, S. A comparative analysis of high spatial resolution IKONOS and WorldView-2 imagery for mapping urban tree species. Remote Sens. Environ. 2012, 124, 516–533. [Google Scholar] [CrossRef]
- Moskal, L.M.; Styers, D.M.; Halabisky, M. Monitoring urban tree cover using object-based image analysis and public domain remotely sensed data. Remote Sens. 2011, 3, 2243–2262. [Google Scholar] [CrossRef]
- Shahi, K.; Shafri, H.Z.M.; Hamedianfar, A. Road condition assessment by OBIA and feature selection techniques using very high-resolution WorldView-2 imagery. Geocarto Int. 2017, 32, 1389–1406. [Google Scholar] [CrossRef]
- Ito, Y.; Hosokawa, M.; Lee, H.; Liu, J.G. Extraction of damaged regions using SAR data and neural networks. Int. Arch. Photogramm. Remote Sens. 2000, 33, 156–163. [Google Scholar]
- Dong, L.; Shan, J. A comprehensive review of earthquake-induced building damage detection with remote sensing techniques. ISPRS J. Photogramm. Remote Sens. 2013, 84, 85–99. [Google Scholar] [CrossRef]
- Sohn, G.; Dowman, I. Data fusion of high-resolution satellite imagery and LiDAR data for automatic building extraction. ISPRS J. Photogramm. Remote Sens. 2007, 62, 43–63. [Google Scholar] [CrossRef]
- Cooner, A.J.; Shao, Y.; Campbell, J.B. Detection of urban damage using remote sensing and machine learning algorithms: Revisiting the 2010 Haiti earthquake. Remote Sens. 2016, 8, 868. [Google Scholar] [CrossRef]
- Krizhevsky, A.; Sutskever, I.; Hinton, G.E. Imagenet classification with deep convolutional neural networks. Adv. Neural Inf. Process. Syst. 2012, 25, 1097–1105. [Google Scholar] [CrossRef]
- Simonyan, K.; Zisserman, A. Very deep convolutional networks for large-scale image recognition. arXiv 2014, arXiv:1409.1556. [Google Scholar]
- Kemker, R.; Salvaggio, C.; Kanan, C. Algorithms for semantic segmentation of multispectral remote sensing imagery using deep learning. ISPRS J. Photogramm. Remote Sens. 2018, 145, 60–77. [Google Scholar] [CrossRef]
- Chatfield, K.; Simonyan, K.; Vedaldi, A.; Zisserman, A. Return of the devil in the details: Delving deep into convolutional nets. arXiv 2014, arXiv:1405.3531. [Google Scholar]
- Chen, L.C.; Papandreou, G.; Kokkinos, I.; Murphy, K.; Yuille, A.L. Semantic image segmentation with deep convolutional nets and fully connected crfs. arXiv 2014, arXiv:1412.7062. [Google Scholar]
- Long, J.; Shelhamer, E.; Darrell, T. Fully convolutional networks for semantic segmentation. In Proceedings of the IEEE Conference on Computer Vision and Pattern Recognition, Boston, MA, USA, 7–12 June 2015; pp. 3431–3440. [Google Scholar]
- Ronneberger, O.; Fischer, P.; Brox, T. U-net: Convolutional networks for biomedical image segmentation. In Proceedings of the International Conference on Medical Image Computing and Computer Assisted Interventions, Munich, Germany, 5–9 October 2015; Springer: Cham, Switzerland; pp. 234–241. [Google Scholar]
- Ma, L.; Liu, Y.; Zhang, X.; Ye, Y.; Yin, G.; Johnson, B.A. Deep learning in remote sensing applications: A meta-analysis and review. ISPRS J. Photogramm. Remote Sens. 2019, 152, 166–177. [Google Scholar] [CrossRef]
- Zou, Q.; Ni, L.; Zhang, T.; Wang, Q. Deep learning based feature selection for remote sensing scene classification. IEEE Geosci. Remote Sens. Lett. 2015, 12, 2321–2325. [Google Scholar] [CrossRef]
- Sun, Y.; Huang, J.; Ao, Z.; Lao, D.; Xin, Q. Deep Learning Approaches for the Mapping of Tree Species Diversity in a Tropical Wetland Using Airborne LiDAR and High-Spatial-Resolution Remote Sensing Images. Forests 2019, 10, 1047. [Google Scholar] [CrossRef]
- Lagrange, A.; Le Saux, B.; Beaupere, A.; Boulch, A.; Chan-Hon-Tong, A.; Herbin, S.; Randrianarivo, H.; Ferecatu, M. Benchmarking classification of earth-observation data: From learning explicit features to convolutional networks. In Proceedings of the IEEE International Geoscience and Remote Sensing Symposium (IGARSS), Milan, Italy, 26–31 July 2015; pp. 4173–4176. [Google Scholar]
- Marmanis, D.; Wegner, J.D.; Galliani, S.; Schindler, K.; Datcu, M.; Stilla, U. Semantic segmentation of aerial images with an ensemble of CNSS. ISPRS Ann. Photogramm. Remote Sens. Spat. Inf. Sci. 2016, 3, 473–480. [Google Scholar] [CrossRef]
- Paisitkriangkrai, S.; Sherrah, J.; Janney, P.; Hengel, V.D. Effective semantic pixel labelling with convolutional networks and conditional random fields. In Proceedings of the IEEE Conference on Computer Vision and Pattern Recognition Workshops, Boston, MA, USA, 7–12 June 2015; pp. 36–43. [Google Scholar]
- Flood, N.; Watson, F.; Collett, L. Using a U-net convolutional neural network to map woody vegetation extent from high resolution satellite imagery across Queensland, Australia. Int. J. Appl. Earth Obs. Geoinf. 2019, 82, 101897. [Google Scholar] [CrossRef]
- Kattenborn, T.; Eichel, J.; Fassnacht, F.E. Convolutional Neural Networks enable efficient, accurate and fine-grained segmentation of plant species and communities from high-resolution UAV imagery. Sci. Rep. 2019, 9, 1–9. [Google Scholar] [CrossRef] [PubMed]
- Wagner, F.H.; Sanchez, A.; Tarabalka, Y.; Lotte, R.G.; Ferreira, M.P.; Aidar, M.P.; Gloor, E.; Phillips, O.L.; Aragao, L.E. Using the U-net convolutional network to map forest types and disturbance in the Atlantic rainforest with very high resolution images. Remote Sens. Ecol. Conserv. 2019, 5, 360–375. [Google Scholar] [CrossRef]
- Brewington, L.; Frizzelle, B.G.; Walsh, S.J.; Mena, C.F.; Sampedro, C. Remote sensing of the marine environment: Challenges and opportunities in the Galapagos Islands of Ecuador. In The Galapagos Marine Reserve; Springer: Berlin/Heidelberg, Germany, 2014; pp. 109–136. [Google Scholar]
- Zheng, B.; Campbell, J.B.; Shao, Y.; Wynne, R.H. Broad-Scale Monitoring of Tillage Practices Using Sequential Landsat Imagery. Soil Sci. Soc. Am. J. 2013, 77, 1755–1764. [Google Scholar] [CrossRef]
- Tonbul, H.; Kavzoglu, T. Semi-Automatic Building Extraction from WorldView-2 Imagery Using Taguchi Optimization. Photogramm. Eng. Remote Sens. 2020, 86, 547–555. [Google Scholar] [CrossRef]
- Çiçek, Ö.; Abdulkadir, A.; Lienkamp, S.S.; Brox, T.; Ronneberger, O. 3D U-Net: Learning dense volumetric segmentation from sparse annotation. In Proceedings of the International Conference on Medical Image Computing and Computer Assisted Intervention, Athens, Greece, 17–21 October 2016; Springer: Cham, Switzeland, 2016; pp. 424–432. [Google Scholar]
- Pires de Lima, R.; Marfurt, K. Convolutional Neural Network for Remote-Sensing Scene Classification: Transfer Learning Analysis. Remote Sens. 2020, 12, 86. [Google Scholar] [CrossRef]
- Wei, S.; Zhang, H.; Wang, C.; Wang, Y.; Xu, L. Multi-temporal SAR data large-scale crop mapping based on U-Net model. Remote Sens. 2019, 11, 68. [Google Scholar] [CrossRef]


| Object Size (Average of Width and Height, Pixels) | Frame Size |
|---|---|
| ≤50 | 75 × 75 |
| 50–500 | S*W × S*H |
| ≥500 | W × H |
| Building | Road/Open Built-Up | Vegetation | Total | UA | |
|---|---|---|---|---|---|
| Building | 42 | 5 | 3 | 50 | 84.0 |
| Road/open built-up | 6 | 42 | 2 | 50 | 84.0 |
| Vegetation | 1 | 3 | 46 | 50 | 92.0 |
| Total | 49 | 50 | 51 | ||
| PA | 85.7 | 84.0 | 90.2 | Overall = 86.7% | Kappa = 0.80 |
| Building | Road/Open Built-Up | Vegetation | Sum | UA | |
|---|---|---|---|---|---|
| Building | 26 | 3 | 1 | 30 | 86.7 |
| Road/open built-up | 2 | 24 | 4 | 30 | 80.0 |
| Vegetation | 0 | 1 | 29 | 30 | 96.7 |
| Sum | 28 | 28 | 34 | ||
| PA | 92.9 | 85.7 | 85.3 | OA = 87.8 | Kappa = 0.82 |
| Building | Road/Open Built-Up | Vegetation | Total | UA | |
|---|---|---|---|---|---|
| Building | 38 | 10 | 2 | 50 | 76.0 |
| Road/open built-up | 8 | 37 | 5 | 50 | 74.0 |
| Vegetation | 3 | 6 | 41 | 50 | 82.0 |
| Total | 49 | 53 | 48 | ||
| PA | 77.6 | 69.8 | 85.4 | Overall = 77.3% | Kappa = 0.66 |
Publisher’s Note: MDPI stays neutral with regard to jurisdictional claims in published maps and institutional affiliations. |
© 2021 by the authors. Licensee MDPI, Basel, Switzerland. This article is an open access article distributed under the terms and conditions of the Creative Commons Attribution (CC BY) license (https://creativecommons.org/licenses/by/4.0/).
Share and Cite
Shao, Y.; Cooner, A.J.; Walsh, S.J. Assessing Deep Convolutional Neural Networks and Assisted Machine Perception for Urban Mapping. Remote Sens. 2021, 13, 1523. https://doi.org/10.3390/rs13081523
Shao Y, Cooner AJ, Walsh SJ. Assessing Deep Convolutional Neural Networks and Assisted Machine Perception for Urban Mapping. Remote Sensing. 2021; 13(8):1523. https://doi.org/10.3390/rs13081523
Chicago/Turabian StyleShao, Yang, Austin J. Cooner, and Stephen J. Walsh. 2021. "Assessing Deep Convolutional Neural Networks and Assisted Machine Perception for Urban Mapping" Remote Sensing 13, no. 8: 1523. https://doi.org/10.3390/rs13081523
APA StyleShao, Y., Cooner, A. J., & Walsh, S. J. (2021). Assessing Deep Convolutional Neural Networks and Assisted Machine Perception for Urban Mapping. Remote Sensing, 13(8), 1523. https://doi.org/10.3390/rs13081523


