Abstract
The aim of this study is to evaluate the effectiveness of the identification of Natura 2000 wetland habitats (Alkaline fens—code 7230, and Transition mires and quaking bogs—code 7140) depending on various remotely sensed (RS) data acquired from an airborne platform. Both remote sensing data and botanical reference data were gathered for mentioned habitats in the Lower (LB) and Upper Biebrza (UB) River Valley and the Janowskie Forest (JF) in different seasonal stages. Several different classification scenarios were tested, and the ones that gave the best results for analyzed habitats were indicated in each campaign. In the final stage, a recommended term of data acquisition, as well as a list of remote sensing products, which allowed us to achieve the highest accuracy mapping for these two types of wetland habitats, were presented. Designed classification scenarios integrated different hyperspectral products such as Minimum Noise Fraction (MNF) bands, spectral indices and products derived from Airborne Laser Scanning (ALS) data representing topography (developed in SAGA), or statistical products (developed in OPALS—Orientation and Processing of Airborne Laser Scanning). The image classifications were performed using a Random Forest (RF) algorithm and a multi-classification approach. As part of the research, the correlation analysis of the developed remote sensing products was carried out, and the Recursive Feature Elimination with Cross-Validation (RFE-CV) analysis was performed to select the most important RS sub-products and thus increase the efficiency and accuracy of developing the final habitat distribution maps. The classification results showed that alkaline fens are better identified in summer (mean F1-SCORE equals 0.950 in the UB area, and 0.935 in the LB area), transition mires and quaking bogs that evolved on/or in the vicinity of alkaline fens in summer and autumn (mean F1-SCORE equals 0.931 in summer, and 0.923 in autumn in the UB area), and transition mires and quaking bogs that evolved on dystrophic lakes in spring and summer (mean F1-SCORE equals 0.953 in spring, and 0.948 in summer in the JF area). The study also points out that the classification accuracy of both wetland habitats is highly improved when combining selected hyperspectral products (MNF bands, spectral indices) with ALS topographical and statistical products. This article demonstrates that information provided by the synergetic use of data from different sensors can be used in mapping and monitoring both Natura 2000 wetland habitats for its future functional assessment and/or protection activities planning with high accuracy.
1. Introduction
Wetlands for many years were treated all over the world as wastelands [1]. Currently, it is already well recognized how significant a role they play by providing various ecosystem services [2,3]. They shape local and regional water relations, retain water, reduce the volume of maximum and minimum flows, participate in the process of water purification and regeneration, play a significant role in the carbon and nitrogen cycle, and shape the microclimate of the environment by increasing air humidity. Wetlands are a refuge for many rare plants, animals, and increase biodiversity. Wetlands provide more ecosystem services than any other terrestrial ecosystem on Earth [4,5,6]. Despite their significant role, they are one of the most threatened ecosystems, suffering from continuous degradation and loss [7].
Increasing destruction, deterioration, and fragmentation of wetlands has forced the search for effective protection solutions. A result is an increasing number of monitoring, conservation, and restoration programs as well as research studies that focus on changes in the quantity and quality of wetland habitats at the global, regional, or local level. In order to assure the long-term survival of Europe’s most valuable and threatened species and habitats, the European Union established in 1992 under the Habitats Directive (the European Union Council 92/43/EEC Directive, or Habitats Directive [8]) the EU-wide ecological network of protected areas—Natura 2000. The habitats protected by the Habitats Directive are listed in its Annex 1, and wetland habitats cover over 40 types. Among them, bogs, mires (habitat code: 7140), and fens (habitat code: 7230), with their ability to accumulate and store dead organic matter, are one of the most valuable and important due to their role in global carbon balance. Unfortunately, these two habitats are also one of the most sensitive to environmental changes. Protection of these habitats needs to be based on effective planning that requires the use of high accuracy data presenting their present distribution.
Monitoring of Natura 2000 sites is carried out in already defined protected areas [9,10,11] and is associated with the monitoring of species (both fauna and flora). The data collected include the habitat range and distribution, characteristics of the vegetation occurring in the habitat, and the selected abiotic elements relevant for the assessment of its condition, conservation status, and future prospects of the habitat. In many cases, research is conducted every year (mainly one visit to a given site of unevenly distributed reference plots), but observations made every five or six years also have a relatively large share e.g., Article 17 requires the Member States to report every six years about the progress made with the implementation of the Habitats Directive considering status and trends of habitats and species. Time-consuming fieldwork is followed by data processing, analysis, and preparation of maps and reports. The whole procedure is also relatively expensive. Consequently, evaluation and monitoring of wetland habitats are limited to accessible and small areas [12,13]. For these reasons, the development of effective monitoring methods for wetland habitats is critical. Today’s level of development of remote sensing enables mapping of Natura 2000 wetland habitats more effectively through the synergistic use of both approaches: Field monitoring and remotely sensed one. The development of new multi- and hyperspectral sensors, increase in the availability of remote sensing (RS) data, the appearance of innovative technologies like Synthetic Aperture Radar (SAR), or airborne LiDAR has significantly improved the quality of habitat delineation, their functional assessment, and change detection analysis in different scales. The use and dissemination of diverse RS products in habitat reconnaissance improved the effectiveness of traditionally conducted monitoring, also limiting the impact of subjective assessment. For some time now, the fusion of RS data analysis and field surveying with close cooperation between the remote sensing specialists and ecologists or botanists is a recommended approach that delivers the most precise results (EEA Technical report, 2014, [14]).
What unfortunately is still missing is associated mainly with the lack of standardization of RS methods and tools used for a given habitat. It is necessary to develop a methodology that will be practical and implementable. Methods of habitat identification should be reliable, objective, repeatable, efficient, and economically viable. Neither the past nor the current practices of habitats monitoring have been well-reviewed in Europe, as it was also marked by Lengyel et al., 2008 [11] almost a decade ago. In addition, each of the Natura 2000 habitats has its own unique features, which also need the development of specific guidelines defining the principles of monitoring within them in accordance with the Habitat Directive (92/43/EEC; European Commission, 1992, [8]). For this reason, research showing methodology for identifying and monitoring specific habitats using remote sensing is important because it allows assessing capabilities and limitations of RS techniques in a particular type of habitat. Vanden Borre et al. (2011) [15] disclosed and summarized the real data needs behind the legal requirements for Natura 2000 habitat monitoring and reporting, analyzed opportunities and constraints for remote sensing, and featured bottlenecks and pathways to resolve them.
Amongst the most recent developments in applying RS data for mapping wetland habitats are examples of biochemical and biophysical parameters of wetland species and vegetation physiognomy and geomorphology studies using Airborne Laser Scanning data (ALS). Hyperspectral remote sensing can detect distinct spectral signatures variations across several hundred discrete bands, thereby providing more information on structure and biochemistry than any multispectral imagery. Moreover, if acquired from the flight ceiling, it has very high spatial resolution, allowing us to delineate more precisely the extent of different habitats and capture transition areas between them. This is particularly important, as the use of RS data with low spatial resolution in wetland areas due to mixed pixels of heterogeneous vegetation increases the uncertainty of classification results. In turn, he benefits of using ALS data is focused mainly on characterization of the horizontal and vertical structure of the vegetation with high altimetry accuracy [16,17] or on microtopography [18]. Despite many possibilities, LiDAR sometimes fails, especially in areas with very dense vegetation of wetlands where it is impossible for the laser to completely penetrate the canopy [16,19,20,21,22]. Similarly, aquatic vegetation also tends to be problematic when saturated ground conditions or less dense erectophilic vegetation is present [23]. The specific hydrological conditions of wetland areas determine the type of data used for analysis. Therefore, SAR data is becoming more popular due to the differentiation of textural and moisture attributes of the target related to its dielectric properties as soil moisture characteristics, surface water, and inundated emergent vegetation [6], as well as fusion ALS data with hyperspectral [24] or thermal data [25], are used in order to reduce the restrictions resulting from the use of only one data source. Data fusion integrates information acquired from different sensors to produce a dataset that contains more detailed information than the sources alone [26,27]. This approach is recommended in analyses within wetlands, as it results from the fact that in a simplified way, wetlands can be defined by two main criteria: Geomorphological—gradient of the land surface, and vegetal—vegetation types and structure [28]. Therefore, a combination of different ALS products with optical imagery for mapping wetlands and taking into account these criteria is important [29,30,31,32,33]. Currently, we see that RS techniques providing an enormous resource of spectral, structure, or texture information for natural habitats are becoming more widely available, but there is, nevertheless, a lack of studies disassembling these data into factors indicating these most important features from the point of view of a specific, unique habitat.
Note, however, that from the analysis point of view, not only the type of data and optimal features are important, but also the processing tools and methods. Until recently, the most commonly used methods in the mapping of various wetland habitats were a decision tree—DTC [34,35,36] and maximum likelihood—MLC classifications [31,37,38,39,40,41], as well as Object-Based Image Analysis—OBIA [32,42,43,44,45,46]. However, in recent years, other computer-assisted advanced analytical tools are becoming more popular in wetland habitats mapping. Machine learning methods such as Support Vector Machines—SVM [47], Artificial Neural Network—ANN [48,49], Random Forest—RF [12,25,50,51,52], and techniques such as feature selection [24] have been developed, allowing us to manage a huge amount of RS data. These tools allow us to enhance information extraction and significantly increase the interpretation possibilities by exploring the spectral and spatial information. Using all the features of the analyzed dataset might increase the computational cost as well as error rate due to correlations between features [53]. Automatic classification procedures employing RF and feature selection were successfully implemented in the research of Zlinszky et al., 2015 [54], Marcinkowska-Ochtyra et al., 2019 [55], and Demarchi et al., 2020 [24], where ALS data were used to emerge relevant features for grasslands. To our knowledge for the studied wetlands, there are far too few analyses using such possibilities. They are extremely significant for decision-makers who must have up to date precision information on the occurrence of these habitats. They must also be aware of the accuracy with which these data were developed. The accuracy they can expect determines the possibility of implementing a given RS method in the procedure of identification and monitoring of wetland habitats.
The aim of this study was to develop remote sensing methods for identifying non-forest wetland natural habitats of alkaline fens (code 7230 in Natura 2000 terminology) and transitions mires and quaking bogs (code 7140) currently requiring agricultural use in order to maintain or restore its ecosystem services and biodiversity. The evaluation of identification effectiveness was performed in different seasonal stages depending on various airborne remotely sensed data using Random Forest (RF) classification algorithm in a multi-classification approach and Recursive Feature Elimination with Cross-Validation (RFE-CV). The task was carried out in several stages including preliminary site reconnaissance, planning, and acquisition of remote sensing and botanical data, data archiving, processing, identification of wetland habitats using several classification scenarios and development of maps of their occurrence in a given area. In addition, it was determined in which period of the growing season the studied habitats are classified best and why and which RS products are recommended. Several various experimental scenarios were tested in three periods of the growing season (Spring, Summer, and Autumn).
2. Materials and Methods
2.1. Study Areas and Examined Habitats
The research was carried out in Poland (Figure 1), on two endangered wetland habitats of Natura 2000: Alkaline fens and transition mires and quaking bogs (habitat codes: 7230 and 7140, respectively, the Council Directive 92/43/EEC, [8]).
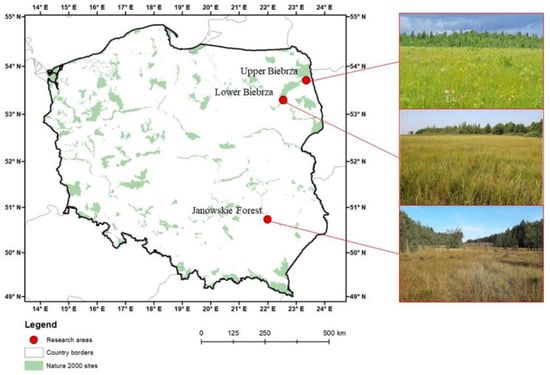
Figure 1.
Location of alkaline fens and transition mires and quaking bogs (habitat codes: 7230 and 7140, respectively, the Council Directive 92/43/EEC, [8]), the Natura 2000 research areas in the Biebrza River Valley (Upper Biebrza—UB; Lower Biebrza—LB), and the Janowskie Forest (JF).
Alkaline fens consist of peat-forming plant communities that originated in areas constantly fed by groundwater usually rich in calcium carbonate. The water table is shallow all year round, and regular inundation is observed. The habitat is found in the ice-marginal valleys, vast flat-bottomed post-glacial depressions, terrestrialized lakes in northern Poland, but also on slopes in highland and mountain regions where groundwater discharges. Vegetation cover is shaped mainly by a species-rich and thick moss layer (e.g., Campylium stellatum (Hedw.) C.E.O. Jensen, Bryum pseudotriquetrum (Hedw.) P.Gaertn., B.Mey. and Scherb., Hamatocaulis vernicosus (Mitt.) Hedenas, Limprichtia cossonii (Schimp.) L.E. Anderson, H.A. Crum and W.R. Buck, Fissidens adianthoides Hedw., Scorpidium scorpioides (Hedw. (Limpr.)), and low sedges (e.g., Carex lasiocarpa Ehrh., C. davalliana L., C. diandra Schrank, C. chordorhiza L., C. buxbaumii Wahlenb., C. panicea L., C. hostiana DC) mainly of Scheuchzerio-Caricetea fuscae (Nordh. 1937) R. Tx. class. Other typical plant species often associated with the habitat and predominant in the vegetation cover are Comarum palustre L., Menyanthes trifoliata L., Thelypteris palustris Schott. Numerous rare and protected species are also spotted in the habitat: Dactylorhiza incarnata L., D. majalis Rchb. f.) P.F. Hunt and Summerh 1965, Epipactis palustris (L.) Crantz, Liparis loeselii (L.) Rich., Parnassia palustris L., Pinguicula vulgaris L., Primula farinosa L., Swertia perennis L., Tofieldia calyculata (L.) Wahlenb., Pedicularis sceptrum-carolinum L. [56]. Currently, in most cases alkaline fens are not mown in Poland, but in the past, extensive mowing (once a year) was quite common, particularly on drained mires located in large river valleys.
Due to changes in water supply, management regime, or trophic status, plant communities related to alkaline fens often contain numerous species of other synecological groups such as rushes (Phragmitetea R. Tx. et Prsg 1942), grass species, and other meadow plants (Molinio-Arrhenatheretea R.Tx. 1937), shrub and forest species (Alnetea glutinosae Br.-Bl. et R. TX. 1943), and plants of transition mires and bogs (Oxycocco-Sphagnetea (NORDHAGEN 1936) R. TX. 1937). The occurrence of forest species, expansive eutrophic rushes, and herbaceous plants is particularly disturbing and leads to habitat degradation. As most wetlands in Poland are drained, and thus destroyed, larger spatial former alkaline fen complexes are nowadays heterogeneous in terms of water regime, trophic conditions, and vegetation cover. In most cases, a groundwater supply (soligenous) typical for alkaline fens is recognized only in the best developed and preserved parts.
Research for alkaline fens was carried out in the Biebrza River Valley (Natura 2000 site—PLH200008) on two research areas in the Upper and Lower Biebrza River Valley (Figure 1), which are one of the best-preserved wetland habitats in Poland. The area located in the Upper Biebrza River Valley has well-preserved patches of alkaline fens of mesotrophic character [57] due to thick peat layer, abundant water supply, stable water condition, and a not very efficient drainage system. The area in the Lower Biebrza River Valley has habitat patches more often overgrown with reed beds, tall sedges, and herbs thus are slightly affected by extensive drainage established already in the 19th century, and on the other hand by eutrophic water entering the area during regular floods in the springtime. The important factor responsible for the current state of the alkaline fens is the relatively shallow peat layer and the occurrence of numerous mineral islands covered nowadays by shrubs and trees.
Transition mires and quaking bogs are peat-forming communities developed in permanently waterlogged areas, fed by waters of the lower trophy, found on overgrowing dystrophic lakes or areas with ombrogenous water supply. The habitat is usually saturated with water, and the level of groundwater is close to the surface. In Poland, they occur in the northern and eastern part of the country, and are related to lake lands. Vegetation cover is formed mainly by a thick layer of various Sphagnum L. species (e.g., Sphagnum fallax Klinggr., S. recurvum P.Beauv., S. magellanicum Brid., S. rubellum Wils., S. warnstorfii Russow) as well as low sedges (e.g., Carex lasiocarpa Ehrh, C. rostrata Stokes, C. limosa L.), cotton-grasses (Eriophorum angustifolium Honck., Eriophorum latifolium Hoppe), Rhynchospora alba (L.) Vahl., and Andromeda polifolia L. that form patches of a different physiognomy. Thus, the habitat itself used to be internally diverse in terms of species composition, vegetation structure, but also share of bare peat soil and open water. Important plant indicators of the habitat are also cranberries Oxycoccus palustris L., Calla palustris L., which often predominates and various sundews Drosera L. sp. The significant share of trees (e.g., Pinus sylvestris L., Betula pubescens Ehrh) and shrubs (e.g., Ledum palustre L., Vaccinium uliginosum L.) is also a typical feature for the transitional mires. Due to oligotrophy and water conditions, the habitat is usually excluded from agricultural use, although it occurs in the rural landscape in some regions quite often. Changes in water regime and natural or anthropogenic eutrophication induce disturbances and cause rapid degradation of the habitat.
Research for transition mires and quaking bogs was carried out in the Uroczyska Lasów Janowskich (Natura 2000 site—PLH060031) in southern Poland and in the Biebrza River Valley, where various types of plant communities occur. In the first location transitional mires developed on terrestrialized dystrophic lakes overgrown by Sphagnum carpet. In the second location, the habitat evolves on alkaline fens where alimentation by relatively nutrient-rich groundwater was cut and plant communities now rely only on nutrient-poor rainwater.
2.2. Remote Sensing Data
The HySpex VNIR-1800 and SWIR-384 hyperspectral cameras and a RIEGL LMS scanner (Riegl Laser Measurements Systems GmbH, Horn, Austria) were used in this study. The VNIR camera (FOV:17–34°; spectral sampling: 3.26 nm) allowed us to record data in 0.4–1.0 µm, while the second SWIR camera (FOV: 16–32°; spectral sampling: 5.45 nm) in 1.0–2.5 µm spectral range (Norsk Elektro Optikk, Oslo, Norway, [58]) with a spatial resolution of 1 m. Due to the fact that images from both cameras were acquired at the same time and a part of the spectral ranges overlap, the data from both were combined to create an image consisting ultimately of 470 spectral bands. The hyperspectral images were radiometrically, geometrically, and atmospherically corrected. Geometric and atmospheric corrections were performed using PARGE and ATCOR 4 software accordingly (ReSe Applications LLC, Switzerland, [59,60]) and validated using ASD FieldSpec 4 spectral measurements (ASD Inc., Longmont, CO, USA, [61]).
Hyperspectral data were also subjected to Minimum Noise Fraction transformation [62] as well as used to calculate 65 Spectral Indices implemented in ENVI 5.3 software (see ENVI’s user guide for a detailed listing, https://www.l3harrisgeospatial.com, (accessed on 1 October 2019) [63]).
The laser scanner data were gathered with a point-cloud density of 7 points/m2. The LiDAR data processing included trajectory alignment, extraction, filtration, point cloud classification, and creation of height models. The point cloud orientation was performed using the RiProcess package in Riegl software (Horn, Austria, [64]) and cloud classification using TerraSolid software (TerraSolid Ltd., Finland, [65]). ALS point cloud data were used to generate several different topographic, vegetation, and intensity products with 1 m spatial resolution to match optical data. Statistical products were calculated in OPALS software (Orientation and Processing of Airborne Laser Scanning; Vienna, Austria, [66]). It consists of 83 discrete and 42 added full-waveform (FWF) raster products representing statistics such as maximum, median, mean, minimum, range, root mean square, and variance of normalized height, amplitude, echo ratio, pulse width, and point density on ground, vegetation or all point classes, as well as exposure, sigma, slope performed on digital height models (DTM—Digital Terrain Model and DSM—Digital Surface Model), and vegetation cover [67]. Topographic products were calculated using SAGA software (Hamburg, Germany, [68]) and included Topographic Wetness Index (TWI), Topographic Position Index (TPI), Direct Insolation (DirI), Duration of Insolation (DurI), Diffuse Insolation (DiffI), Total Insolation (TI), Multiresolution Index of Valley Bottom Flatness (MRVBF), Multi-resolution Ridge Top Flatness (MRRTF), and Modified Catchment Area (MCA). Airborne data were acquired three times per year during the growing season (Table 1) to account for plant seasonal change (in June, July/August and September/October).

Table 1.
Dates of field botanical surveys and flight campaigns.
2.3. Botanical Reference Data
The data collection process was preceded by a stage of a preliminary survey of the area including analysis of archival materials, as well as reconnaissance in the field focused on gaining a general overview of the area considering habitat types, their diversity, current state, land cover, but also of technical and/or logistic problems that could be faced with during gathering botanical reference data. This allowed planning of data acquisition locations. The reference botanical data were collected close to the time when the airborne imagery was taken (Table 1, Figure 2).
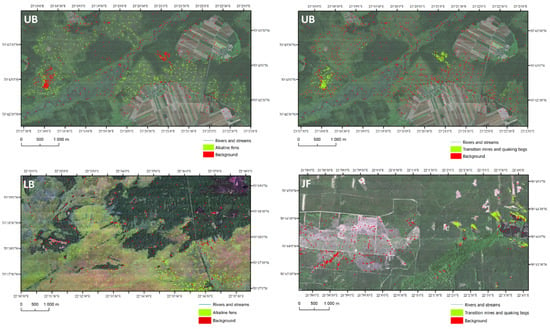
Figure 2.
Location of reference botanical data for each wetland habitat in the Upper Biebrza (UB: Alkaline fens—upper left, and transition mires and quaking bogs—upper right), the Lower Biebrza (LB: Alkaline fens—lower left) and the Janowskie Forest (JF: Transition mires and quaking bogs—lower right).
Data were gathered in three types of land cover. In patches representing the examined wetland habitats, in patches of vegetation constituting the background vegetation, and in patches with other land cover types such as water reservoirs, bare soils, and forests. The background reference data represented patches of plant communities that did not show any features of the examined habitats. Data were collected in reference polygons in the shape of a circle with a radius of 3 m evenly distributed in the area considering their floristic and phytosociological diversity (Figure 3).
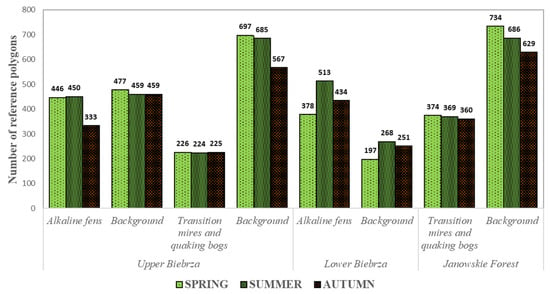
Figure 3.
The number of reference botanical data (polygons) per research area (UB—Upper Biebrza, LB—Lower Biebrza, JF—Janowskie Forest).
Reference polygons were established using a measuring device equipped with a GNSS receiver with a measurement accuracy of 0.2 m (Spectra Precision GPS Mobile Mapper 120; Spectra Geospatial, Westminster, CA, USA) in representative places, homogeneous in terms of vegetation type and plant community structure, without obvious disturbances (no places with visible traces of tractors, freshly mowed, places of old stacks or storage of biomass, flooded with water, etc.). Particular attention was paid to the fact that within the reference there were no trees and shrubs above 1.5 m in height, and the polygons were not in the vicinity of high objects that might shade their surface during the day (forests, escarpments, etc.). The scope of data collected included the date of the measurement, the reference training area radius, habitat type and subtype, their conservation status, plant community, land use, the cover of herbaceous plants, bryophytes, bare soil, open water table, and dead organic matter. In addition, the quality of the data obtained in the field was checked using homogeneity analysis based on t-SNE (t-distributed stochastic neighbor embedding) [69]. The aim was to capture the situation when the reference polygons of a wetland habitat clearly stood out from others, e.g., due to different species composition, as well as cases where the polygons strongly referred to other types of habitats.
2.4. Classification and Accuracy Assessment
In this research, the identification of wetland habitats was carried out using the RF classifier (Figure 4). RF algorithm is a combination of tree predictors such that each tree depends on the values of a random vector sampled independently and with the same distribution for all trees in the forest [70]. The effectiveness of the RF classifier for land-cover classification was proven by Rodriguez-Galiano et al., 2012 [71], among many other authors. Additionally, the calculated accuracy and the ability to check the impact of particular variables on the results were the decisive factors of choosing the RF algorithm. The algorithm copes well with the data of many dimensions (expressed in the number of variables used for the classifier training) and is relatively resistant to the phenomenon of excessive adaptation to the training set.
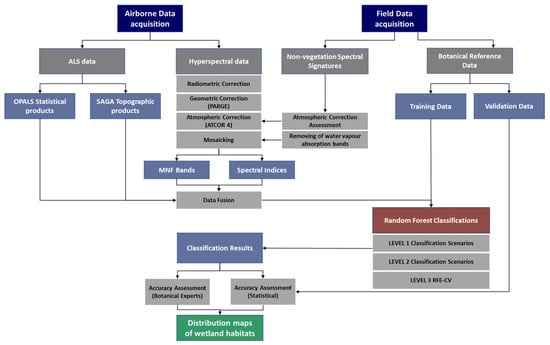
Figure 4.
The simplified workflow of the methodology.
In order to assess the suitability of individual remote sensing products in the identification of the examined habitats, several classification scenarios were developed, and the Recursive Feature Elimination with Cross-Validation was employed (Table 2). The scenarios included hyperspectral bands, MNF transformation bands, spectral indices, OPALS statistical and SAGA topographic products derived from ALS data. The selection of a number of bands in SC2 was based on the analysis of eigenvalues, where low values represented higher noise in the analyzed dataset. SC3 includes the first 3 MNF transformation bands covering more than 95% information of the original hyperspectral dataset.

Table 2.
Data sets used in a given classification scenario. MNF: Minimum Noise Fraction.
The key spectral features for analyzed wetlands were identified by performing analyses on the hyperspectral dataset with 430 bands (SC1). Obtained accuracies were compared with hyperspectral data after the Minimum Noise Fraction transformation—MNF (SC2, SC3), which is a common dimension reduction technique allowing to reduce autocorrelation between bands and remove noise [62].
Classifications in the first three scenarios (SC1, SC2, and SC3; Table 2) were performed using a multi-classification approach (50 classifications). Their goal was to check which data set is an indispensable basic product among the three available ones as well as to check whether the results of a randomly selected set of training and validation data correspond to each other. In each classification scenario, the botanical reference data were randomly split into a 50/50 proportion of training and validation sets, assigning equal numbers of reference polygons to each class for model training and validation. After the selection of the base data set, further classifications were carried out using the selected set of data supplemented with statistical, topographic, or spectral vegetation indices products (scenarios from SC4 to SC7, Table 2). The aim of these experiments was to assess which of the additional products would improve the identification results of the analyzed habitats and whether the fusion of hyperspectral data and ALS significantly improved the accuracy of classification. In this step, the seasonal stage in which both habitats are best identified was also determined.
The last stage of research covered the RF multi-classifications with RFE-CV (SC8, Table 2) in the selected optimal period of the growing season for given habitat mapping with choosing the final set of features. The final distribution maps were developed on the basis of the best results.
The assessment of the accuracy of identification of the examined habitats was carried out using standard procedures used in remote sensing based on statistical measures, as well as by analyzing the spatial differentiation of classification maps by the botanists. The statistical evaluation of the accuracy of the results was carried out based on the validation set. The basis for the quantitative evaluation of the classification accuracy was the error matrix. Multi-classifications were performed automatically in Python 3.7. This approach has significantly increased the efficiency of analyses. As an auxiliary measure of assessing the statistical significance of differences in the accuracies, the Wilcoxon signed-rank test (ⲁ = 0.05) was performed. This is a non-parametric test disregarding data’s distribution. The test assumes that there is no difference between the medians of the tested datasets.
3. Results
This section may be divided by subheadings. It should provide a concise and precise description of the experimental results, their interpretation, as well as the experimental conclusions that can be drawn.
3.1. Results at Level 1 of Classification Scenarios
The analysis at level 1 showed that better results were achieved using the first 30 MNF transformation bands (SC2) than for all hyperspectral bands together (SC1). Similarly, choosing the first three MNF transformation bands (SC3) gave worse results than selecting the first thirty (SC2). Most information on the original image is of course contained in the first three bands of MNF transformation. However, the use of only the first three bands or their manual selection does not bring satisfactory results due to some subtle differences in coverage that are also visible in other seemingly content-free bands such as the humidity of the habitat. The results presented in Table 3 and Figure 5 showed that the highest mean values of Overall Accuracy—OA, Kappa, F1-SCORE, Producer’s Accuracy—PA, and User’s Accuracy—UA coefficients were found by using 30 first MNF transformation bands (SC2). The SC1 gave the worst results (classification of 430 hyperspectral bands). Additionally, the Errors of Commission—EC and Errors of Omission—EO were the lowest in most cases in scenario 2 for both wetland habitats and background class in all research areas. The analysis indicated that the best results were given using the set of data from scenario 2 (30 MNF). Therefore, this raster dataset was chosen for further classifications in level 2. Additional analysis of the date of data acquisition showed that the best results for alkaline fens were found for summer (F1-SCORE equals 0.931 in the UB area and 0.914 in the LB area) with the lowest EC and EO (Table 3). Full vegetation growth in summer (August) emphasizes physiognomic differentiation of alkaline fens (dominance of low sedges and well developed layer of Bryophyta) and their characteristics in comparison with other plant communities (e.g., sedge meadow, reed, hydrophilous tall herb communities—Filipendulion Segal 1966) and land cover categories (e.g., grain crops, forests). On the other hand, for the transition mires and quaking bogs, the results were more diverse in terms of the date of data acquisition and area. The best results were observed in spring for JF area (F1-SCORE equals 0.954) and in summer/autumn for UB area (F1-SCORE equals 0.901/0.907). Plant communities of transitional mires and quaking bogs of JF area are typically developed. There are patches with large coverage of Sphagnum, clumped Eriophorum, and low sedges. Acquiring the images from beginning of June allowed us to capture moss layer as well as clumps of characteristically fruiting Eriophorum latifolium L., Rhynchospora alba (L.) Vahl., and patches in initial stages of succession. In the case of Biebrza Valley, transitional mires and quaking bogs developed on alkaline fens, which in turn make them show a larger share of low sedges, and the Sphagnum layer is less exposed, while characteristically clumped Eriophorum latifolium L. is not present. Moreover, spring images were acquired a month after the Janowskie Forests were recorded. That is why the patch differentiation is seen in summer in full growth and in autumn, when moss layer and Sphagnum that make it undergo discoloration. Additionally, the F1-SCORE for summer and autumn in the JF area was higher than in the UB area and equaled, respectively, 0.942 and 0.943. This is probably due to a different nature of the same habitat in both areas and differences in development resulting from the stage of the growing season in which a given habitat is located (location of habitats in different parts of the country in the north–south direction). Research areas in Biebrza Valley (UB and LB) are located in north–eastern Poland where the growing season is significantly shorter. In spring vegetation start to grow two week after the rest of the country on average. Plant dying phase also starts later, but lasts shorter at the same time.

Table 3.
Results of multi-classification (50 classifications per scenario) on randomly selected botanical reference data for wetland habitats in the UB, LB, and JF areas in scenarios from 1 to 3.
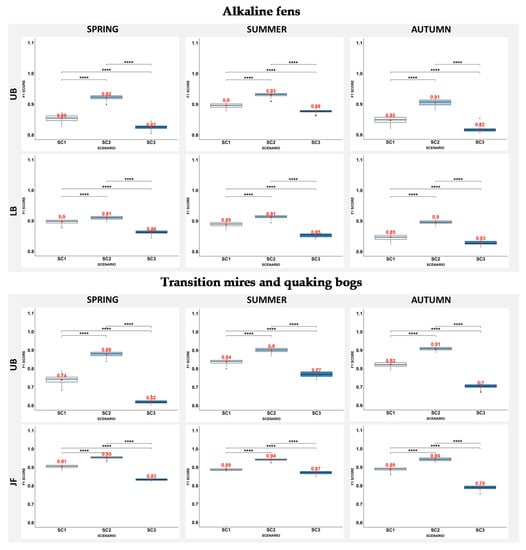
Figure 5.
Boxplots of the F1-SCORE values of alkaline fens and transition mires and quaking bogs in the UB, LB, and JF areas divided into the campaigns corresponding to the period of the growing season. Each box includes the median (central line), mean (red font), the 25th and 75th percentile (the edges of the box), extreme data points (whiskers), outliers (dots), and statistical significance (stars).
Analyzing distribution maps of alkaline fens and transition mires and quaking bogs in autumn, it was found to be overestimated and highly dispersed—recognized even in some crops (Figure 6 and Figure 7). It is connected to accumulation of dead, dry biomass in natural and semi-natural communities, and also to the phase of agriculture cycle on surrounding areas.
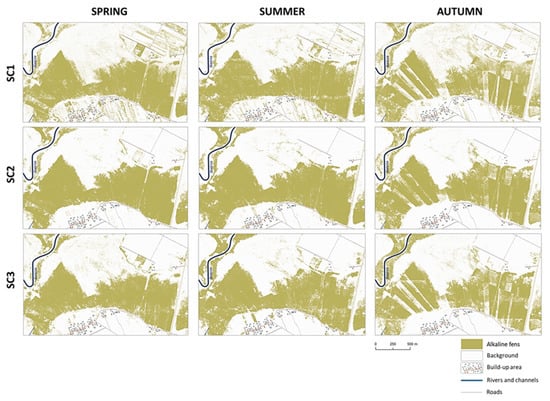
Figure 6.
An Example of comparison of classification results for alkaline fens in the UB area in spring, summer, and autumn campaigns for three scenarios in level 1 (SC1, SC2, and SC3).
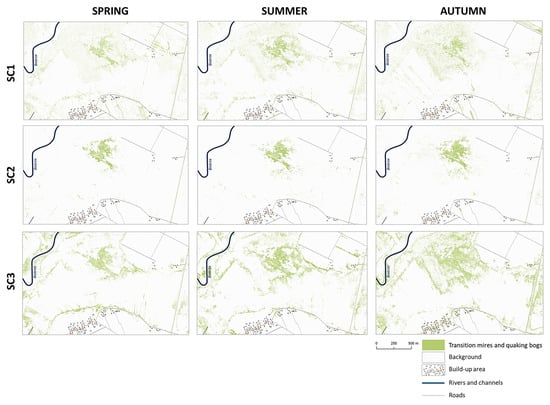
Figure 7.
An Example of comparison of classification results for transition mires and quaking bogs in the UB area in spring, summer, and autumn campaigns for three scenarios in level 1 (SC1, SC2, and SC3).
3.2. Results at Level 2 of Classification Scenarios
In the next step (Level 2—see Table 2), scenarios from 4 to 7 were tested. It was examined whether the additional sets of data in relation to the base scenario (SC4) increase the accuracy of the classification in three campaigns (spring, summer, autumn). The analysis in this step was done similarly by performing 50-fold randomization of training and validation polygons in the proportion of 50/50 for each examined habitat. Statistical results are presented in Table 4, Figure 8, and their graphic representation (for both wetland habitats) is shown in Figure 9 and Figure 10 for a fragment of the Upper Biebrza Valley (the UB area).

Table 4.
Results of multi-classification (50 classifications per scenario) on randomly selected botanical reference data for wetland habitats in the UB, LB and JF areas in scenarios from 4 to 7.
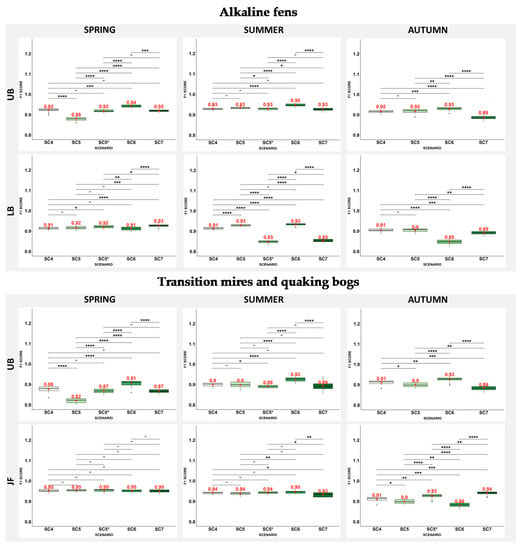
Figure 8.
Boxplots of the F1-SCORE values of alkaline fens and transition mires and quaking bogs in the UB, LB, and JF areas divided into the campaigns corresponding to the period of the growing season. Each box includes the median (central line), mean (red font), the 25th and 75th percentile (the edges of the box), extreme data points (whiskers), outliers (dots), and statistical significance (stars).
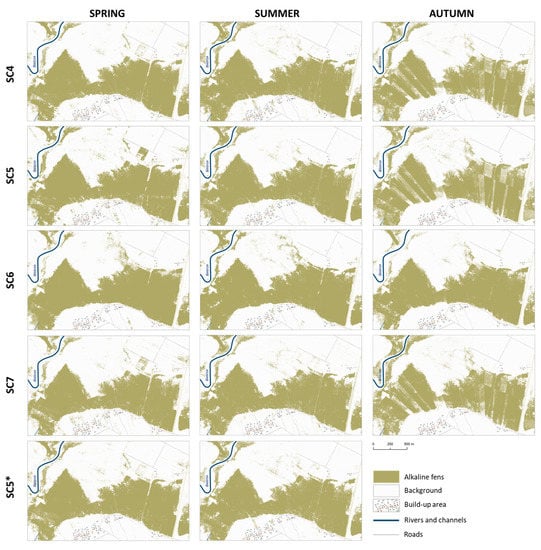
Figure 9.
An example of comparison of classification results for alkaline fens in the UB area in spring, summer, and autumn campaigns for five scenarios in level 2 (SC4, SC5, SC5*, SC6, and SC7).
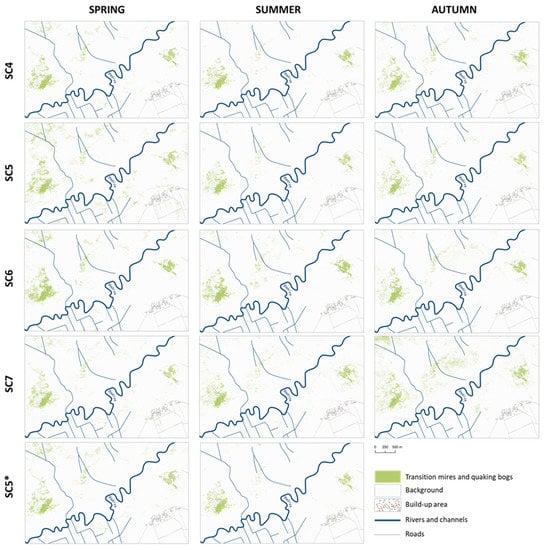
Figure 10.
An example of comparison of classification results for transition mires and quaking bogs in the UB area in spring, summer, and autumn campaigns for five scenarios in level 2 (SC4, SC5, SC5*, SC6, and SC7).
The best results for alkaline fens in the Upper Biebrza were obtained in summer (mean F1-SCORE of 0.930 regardless of data used—Table 4). The classification scenario that gave the best results was the scenario using the 30MNF, CHM, and SAGA topographic products (SC6). The value of the mean F1-SCORE for this scenario was 0.940, by 0.017 higher compared to the base scenario, and the difference was statistically significant. Statistically not significant differences were found for data sets using ALS statistical products or spectral indices (Figure 8). In the Lower Biebrza, the best results for alkaline fens were obtained in spring and in summer (mean F1-SCORE of 0.918 and 0.895 in spring and summer, respectively). However, statistically significant differences were obtained in the summer each time they were compared with the base scenario (SC4)-effect of the optimum plant growth including low sedges, moss layer on alkaline fens, and Magnocaricion Koch 1926 patches frequently grown over by reeds (in blooming stage). The differences in accuracy in spring were statistically significant only in the case of a scenario with spectral indices (SC7), which is probably related to the fact that in spring this area is usually flooded and the vegetation protruding above the water and its spectral characteristics become more important. Under such conditions, the use of ALS data unfortunately does not improve the quality of the identification of the habitat. The use of SAGA topographic products (SC6) in both areas in summer allowed us to increase the accuracy of classification compared to the base scenario (SC4). Topographic products allowed to clearly distinguish different topographical features such as analyzed habitat, uplands, or mineral islands. In the Lower Biebrza good results for summer were obtained using also SC5 and SC7 (mean F1-SCORE for SC5 equals 0.917 and for SC7 equals 0.891), in both cases the differences were statistically significant when compared to the base scenario (Figure 8). The lowest mean F1-SCORE and the highest errors of omission were observed in autumn (which is connected to plants dying and accumulation of dead, dry biomass resulting in lower differentiation between plant communities found in Lower Biebrza Basin).
Choosing the best time of the growing season for data acquisition for alkaline fens based on obtained statistical results and botanical assessment it can be stated that the recommended time for this habitat is summer. This period of the growing season was selected for analysis of alkaline fens at level 3 (Table 2), in which sub-products were selected using the RFE-CV method. During the evaluation of the results, it was found that alkaline fens in the UB area are more overestimated than in the LB area. Both areas differ in floristic composition, vegetation structure, and the occurrence of dominant species which all have an influence on the final results. In summer, in the UB area, slightly more patches of alkaline fens were identified in places with birch and willow, as well as in patches with moss layer, which refers rather to transition mires and quaking bogs (it’s due to the fact that transitional mires in this region evolutionarily developed from alkaline fens so they can share some common traits). It was also found that it is possible to identify alkaline fens even if it is used in an extensive or regular way, but the best results should be expected for permanently unused areas with a high share of sedges (over 50%) and a well-developed moss layer that references to alkaline fens (over 40%).
In the classification of transition mires and quaking bogs, the best results in the UB area (Table 4) were obtained for summer and autumn (mean F1-SCORE equals 0.902 and 0.906, respectively, regardless of the scenario). It is connected to likeness to alkaline fens (large share of low sedges), which are best identified in summer in optimum growth phase on one hand and to autumn dying of sedges and better exposition of discoloring moss layer on the other. Analyzing the accuracy of the classifications as well as the maps of habitat distribution for both periods of the growing season, very similar results were obtained. The scenario that gave the best results was scenario 6 (SC6) using 30MNF bands, CHM, and SAGA topographic data regardless of the growing season (mean F1-SCORE of 0.919). The differences in F1-SCORE accuracy between SC6 and SC4 were also statistically significant. Analyzing distribution maps of transition mires and quaking bogs in spring, it was found to be much more dispersed and inaccurate. The mean errors of omission and commission calculated for all scenarios together were the highest here and equals 0.172 and 0.086, respectively. Lowering the value of the mean F1-SCORE in relation to the base scenario (SC4) for the remaining scenarios (i.e., excluding topographic one—SC6) in the UB area may result from relatively not very clear boundaries between transition mires and quaking bogs and neighboring alkaline fens. During the evaluation of the results it was found that transition mires and quaking bogs in the UB area were correctly identified at places of their occurrence, but in some cases recognized also in the forest, which is caused by the presence of deciduous trees and shrubs in the seeding stage on plots where the reference botanical data were gathered.
In the Janowskie Forest classification, results in terms of the time of data acquisition and recommended scenario are ambiguous. Here, the presence of trees and bushes in the seeding stage within habitat plays a much smaller role, and the range of the classified habitat corresponds to reality in almost all cases. Additionally, transition mires and quaking bogs are represented by very clearly distinctive patches of habitat both in relation to neighboring habitats and surrounding areas like a forest. As it was mentioned earlier, transitional mires developed here on terrestrialized dystrophic lakes overgrown by Sphagnum carpet and are of a different character to habitats evolved on or in the vicinity of alkaline fens as in the Upper Biebrza. In the JF area, the best results (Table 4) were obtained in the spring (mean F1-SCORE of 0.953 regardless of classification scenario), but differences in accuracy were not statistically significant when compared to the base scenario (Figure 8). Slightly worse statistical classification results were obtained in summer and autumn (mean F1-SCORE of 0.940 and 0.943, respectively), of which those obtained in summer did not show statistically significant differences in the accuracy, and those obtained in autumn did when compared to the base scenario. The autumn results, despite similar statistical accuracy, were too scattered with a pronounced “salt and pepper” effect. The statistically significant differences observed here, unfortunately, did not result primarily from the change of remote sensing products used in the classification, but from the large dispersion of the habitat. In the case of the classification of transitional mires developed on terrestrialized dystrophic lakes, data obtained in spring and summer provide better habitat distribution than those obtained in autumn. Comparing the scenarios with each other (Table 4, Figure 8), it can be concluded that the data set from scenario 4 is sufficient to identify this habitat, unless there are other wetland habitats in the vicinity, as is the case in Upper Biebrza. Then, it is recommended to use a data set that also takes into account topographic data (SC6).
Choosing the best time of the growing season for data acquisition for transition mires and quaking bogs based on obtained statistical results and botanical assessment it can be stated that the recommended time for this habitat is summer and autumn in case of habitats evolved on or in the vicinity of alkaline fens and spring and summer in case of transition mires developed on terrestrialized dystrophic lakes like those in Janowskie Forest.
3.3. Results at Level 3 of Classification Scenarios—A Selection of Sub-Products
As part of the analyses, the Recursive Feature Elimination with Cross-Validation (RFE-CV) was performed to select the most important RS sub-products for each habitat that allow obtaining high accuracy classification results (Level 3—SC8, Table 2) in the optimal phase of the growing season for their identification chosen in Level 2. RFE-CV is an RFE algorithm adding cross-validation of results that produce averaged score of how well the given feature performed within a classifier (e.g., Random Forest)—feature(s) with the lowest score (importance) are then discarded. Selected features are assigned rank at the end with lower values indicating more importance.
Before starting the Random Forest classifications with RFE-CV, the Spearman’s correlation analysis of the available remote sensing data was carried out in order to exclude from the analysis those features with a correlation coefficient above 0.8 and to increase the accuracy of the obtained final results in relation to those obtained at level 2. This approach allowed to reduce the analyzed datasets and focusing only on those sub-products that carry the most relevant information about the identified habitats (Figure 11 and Figure 12).
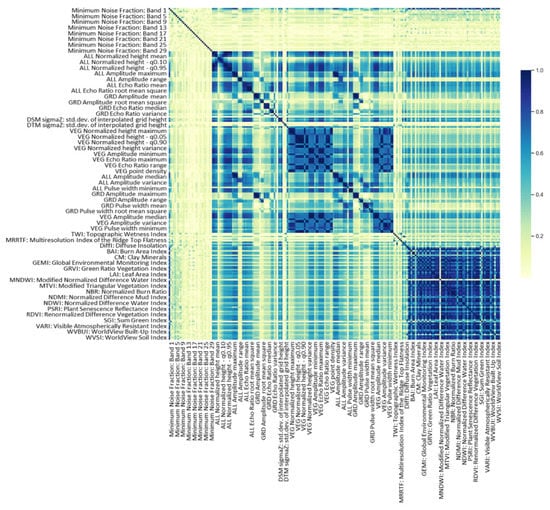
Figure 11.
An example of Spearman’s correlation matrix for data acquired in summer in the UB area.
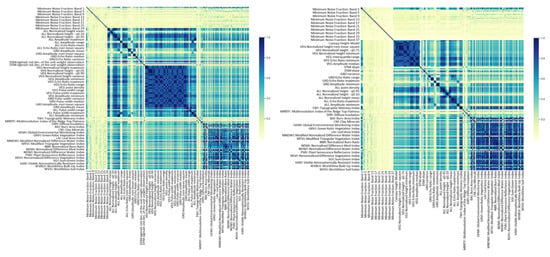
Figure 12.
An example of Spearman’s correlation matrices for data acquired in spring (on the left) and autumn (on the right) in the UB area.
The best results of Random Forest multi-classification with RFE-CV for alkaline fens are presented in Table 5 and the sub-products used to obtain these results are presented in Table 6. The sub-products were chosen based on final feature ranking results for given habitat in both areas (in the UB and LB area). Table 6 is also a list of products recommended for use in the identification of alkaline fens. The products that gave the best results include, apart from the MNF set, selected ALS statistical products developed in OPALS (Canopy Height Model, exposition—slope aspect in radians, normalized height minimum, point density, standard deviation of the unit weight observation—sigmaZ and steepest slope in % and variance), topographic products developed in SAGA describing morphology (MRRTF, MRVBF), wetness (MCA, TPI, TWI,), and light availability (Diffl, Dirl, Durl, and TI), as well as narrow-band spectral indices created using spectral bands from blue (470.5 nm), green (508.9 nm, 531.2 nm, 550.4 nm, 569.6 nm), red (652.7 nm, 700.6 nm, 703.8 nm, 748.6 nm), near-infrared (799.7 nm, 860.4 nm), and short-infrared (1653.4 nm) spectral range.

Table 5.
The best classification results obtained using the Random Forest multi-classification approach with Recursive Feature Elimination with Cross-Validation for alkaline fens in the UB and LB areas and transition mires and quaking bogs in the UB and JF areas.

Table 6.
Recommended RS sub-products in the identification of alkaline fens.
The best results of Random Forest multi-classification with RFE-CV for transition mires and quaking bogs in the UB area are presented in Table 5, and the sub-products used to obtain these results are presented in Table 7. The sub-products were chosen based on final feature ranking results. Table 8 is also a list of products recommended for use in the identification of transition mires and quaking bogs. The products that gave the best classification results include, apart from the MNF set, selected ALS statistical products developed in OPALS (Canopy Height Model, exposition—slope aspect in radians, standard deviation of the interpolated height—sigma0, standard deviation of the unit weight observation—sigmaZ and steepest slope in %), topographic products developed in SAGA describing morphology (MRRTF, MRVBF, TPI), wetness (TWI) and light availability (TI), as well as narrow-band spectral indices created using spectral bands from blue (470.5 nm), green (531.2 nm, 550.4 nm, 569.6 nm), red (652.7 nm, 700.6 nm), near-infrared (796.5 nm, 860.4 nm, 991.8 nm), and short-infrared (1642.6 nm, 1653.4 nm, 2000.5 nm, 2130.7 nm, 2201.2 nm) spectral range.

Table 7.
Recommended RS sub-products in the identification of transition mires and quaking bogs in the Biebrza river valley (UB area).

Table 8.
Recommended RS sub-products in the identification of transition mires and quaking bogs for transition mires and quaking bogs in the Janowskie Forest (JF area).
The best results of Random Forest multi-classification with RFE-CV for transition mires and quaking bogs in the JF area are presented in Table 5, and the sub-products used to obtain these results are presented in Table 8. The sub-products were chosen based on final feature ranking. Table 8 is also a list of products recommended for use in the identification of transition mires and quaking bogs.
The products that gave the best classification results include, apart from the MNF set, selected ALS statistical products developed in OPALS (Canopy Height Model, exposition—slope aspect in radians, standard deviation of the interpolated height—sigma0, standard deviation of the unit weight observation—sigmaZ and steepest slope in %), topographic products developed in SAGA describing morphology (MRRTF, MRVBF, and TPI), wetness (TWI), and light availability (TI), as well as narrow-band spectral indices created using spectral bands from blue (444.9 nm, 470.5 nm), green (550.4 nm, 569.6 nm), red (652.7 nm, 681.4 nm, 700.6 nm), near-infrared (799.7 nm, 860.4 nm), and short-infrared (1648.0 nm) spectral range.
From the statistical accuracy point of view, the obtained classification results using Random Forest are also high, but not as overestimated as in the case of classification at level 1 or 2, comparing the errors of commission and omission. Figure 13 and Figure 14 present the final results of wetland habitats identification using chosen sub-products.
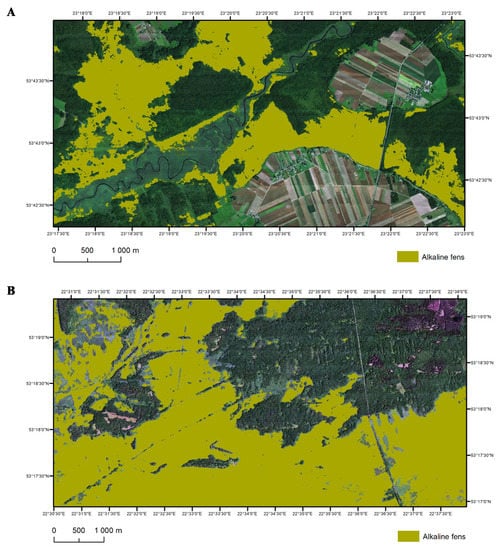
Figure 13.
Distribution maps of alkaline fens obtained from the best classification results performed on chosen sub-products in the Biebrza River Valley ((A): Upper Biebrza—UB, (B): Lower Biebrza—LB).
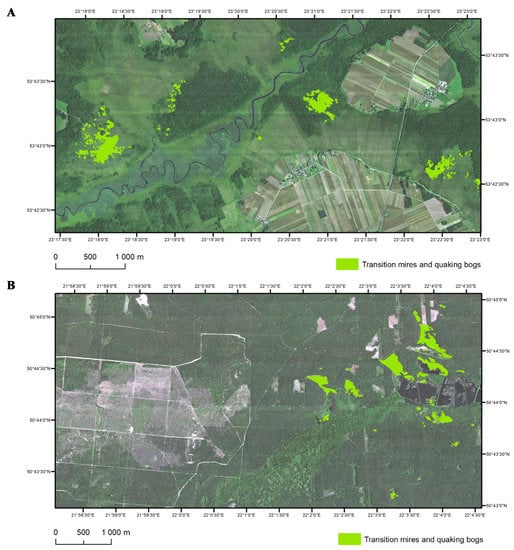
Figure 14.
Distribution maps of transition mires and quaking bogs obtained from the best classification results performed on chosen sub-products in the Biebrza River Valley ((A): Upper Biebrza—UB) and Uroczyska Lasów Janowskich—JF (B).
4. Discussion
4.1. Products and Classification Accuracies
The first preliminary analysis performed at level 1 and scenarios SC1, SC2, and SC3 has shown that better classification results were achieved using hyperspectral data after MNF transformation (SC2) for both wetland habitats. This transformation algorithm based on multivariate statistics is the most commonly used spectral feature extraction method [94]. In this research, a total of 470 hyperspectral bands were used. The processing of such a huge data set is not very effective, especially if the multi-classification approach is used. Limiting the amount of data as well as reducing the autocorrelation between spectral bands is essential both in increasing the efficiency of data analyses as well as in getting results with higher accuracy. Nevertheless, using this transformation technique and focusing only on the first three bands covering more than 95% of information of the original hyperspectral dataset does not give good results due to some subtle differences in coverage that are also visible in other seemingly content-free bands such as the humidity of the habitat. Therefore, careful analysis of eigenvalues is essential to select a representative data set from MNF bands. In the case of the analyzed habitats, the best results were obtained by selecting the first 30 MNF transformation bands.
In the second level of the analysis, the fusion of hyperspectral data with airborne laser scanning data was performed. In this step, different classification scenarios were compared against the base scenario consisting of data after MNF transformation (SC2) and CHM. The mere addition of CHM did not significantly improve the results of classifications in relation to the scenarios at level 1 for both wetland habitats. Only in autumn, slightly better results were obtained in terms of the obtained accuracy of the classification (F1-SCORE was by 0.008 higher using CHM than 30MNF alone for alkaline fens and by 0.004 for transition mires and quaking bogs). The results obtained at Level 2 showed that the use of hyperspectral bands after MNF transformation together with SAGA topographic products (SC6) for alkaline fens allowed to increase the accuracy of classification relative to that obtained for the base dataset. Topographic products allowed for a more precise determination of the boundaries of the habitat, which is located lower than adjacent uplands or mineral islands present in the vicinity.
As shown by the analysis of transition mires and quaking bogs in the Upper Biebrza and the Janowskie Forest this habitat should be analyzed separately. Despite the fact that it is the same Natura 2000 habitat, the differences between them did not allow for obtaining consistent results at level 2. In the Upper Biebrza, the habitat evolved on or in the vicinity of alkaline fens, but in the case of the Janowskie Forest, the habitat developed on terrestrialized dystrophic lakes. As for alkaline fens in the Upper Biebrza, the best results were obtained using data from scenario 6 including MNF, CHM, and SAGA topographic data. In turn, for the habitat in the Janowskie Forest, it was not possible to determine the best data set at level 2. Regardless of the selected scenario, similar accuracy was obtained and the habitat was classified correctly in all cases. The conclusion that emerges is that for correct identification it is sufficient to use a basic data set including MNF and CHM possibly fed with SAGA topographic products as the accuracies of the results obtained in SC4 and SC6 are almost the same.
Random Forest multi-classification with RFE-CV was introduced in order to narrow the list of remote sensing products needed in the identification process and to increase the statistical and botanical accuracy assessments of the obtained results. Effective identification of habitats that should be monitored on an ongoing basis should be based on a list of recommended products that allow obtaining accurate maps of habitat distribution with the smallest possible amount of data. This should significantly reduce the costs of data acquisition, but also increase the efficiency of work in the future. The MNF transformation bands in RFE-CV approach were of the highest feature rank in the classification process of both wetland habitats. Nevertheless, the analysis showed that the inclusion of other RS sub-products increased the accuracy of habitat identification over the results obtained in Level 1 and 2. For both wetland habitats, the use of topographic features developed at SAGA was of great importance. The morphometric features such as Multiresolution Indices of the Ridge Top Flatness or Valley Bottom Flatness (MRRTF, MRVBF) and Topographic Position Index (TPI) should be mentioned here as well as those representing wetness relations (Topographic Wetness Index—TWI) or light availability (Total Insolation—TI).
The MRVBF index and complementary MRRTF index were developed to identify lowness, depositional areas, and valley bottoms [72], i.e., areas where wetlands usually occur. The TPI value is calculated for every raster cell as the difference between the central cell’s elevation and the mean elevation of the neighborhood [95]. This index was proved to be useful in identifying small depressional wetlands even in low relief areas [96]. In turn, TWI describe the tendency of a raster cell to accumulate water and in wetland identification process allowed distinguishing flat areas and river valley bottoms (high TWI values) and steepest slopes where the river valley ends (upland) or mineral island is present (low TWI values). TI represents the intensity of direct solar irradiation, which is higher in flat open areas with low vegetation than in built-up areas or areas with high vegetation, like forests. All these features, for the reasons mentioned above, also proved to be successful in our research. In the identification of alkaline fens, other features describing the availability of light are also useful (direct, diffuse insolation, duration of insolation) and Modified Catchment Area (MCA) developed in SAGA in order to better represent soil moisture distribution or flooding [97].
Among the statistical products generated in the OPALS software, features such as Canopy Height Model, exposition—slope aspect in radians, the standard deviation of the interpolated height—sigma0, the standard deviation of the unit weight observation—sigmaZ, and steepest slope in % were used in the identification of the studied wetland habitats. In the identification of alkaline fens, it is worth mentioning also point density, normalized height minimum, and variance; in the identification of transition mires and quaking bogs in the UB area—normalized height variance, and in the JF area—amplitude variance. DTM sigma0 feature allowed the distinguishing of reeds from other types of wetland vegetation and DSM sigma0/sigmaZ, as well as normalized height variance—trees and/or shrubs. The presence of reeds and shrubs entering the open alkaline fens is noticeable in ALS data. This type of vegetation is best visualized with the use of raster datasets describing not only spectral properties of vegetation, but also its structural characteristics such as height or density [33,55]. DTM/DSM exposition and DTM slope features highlighted the mineral islands and the upland areas. DTM point density highlighted flat areas like MRVBF and MRRTF indices from SAGA.
Among the spectral indices in the identification of alkaline fens, the most important role played greenness indices (EVI and RENDVI), leaf pigment indices (ARI1, ARI2, CRI2), wetness index—MNDWI, and photosynthetic light use efficiency index—PRI. Transition mires and quaking bogs that evolved on/or in the vicinity of alkaline fens are better identified when using indices such as ARI1 (leaf pigment), PRI (light use efficiency), CAI (necromass), MNDWI, NDMI, and NMDI (wetness or canopy water content indices) and IO (geology). In turn, this habitat that evolved on dystrophic lakes is better recognized using ARI1 and ARI2 (leaf pigment indices), ARVI (greenness index), IO, and FM (geology indices). Greenness indices allowed us, first of all, to distinguish natural vegetation from agricultural land areas. The leaf pigment indices showed mainly variation within the trees. PRI used mainly in assessment of vegetation health in shrublands, forests, and agricultural crops prior to senescence was found to be additionally useful here in the identification of reed and manna grass. Indices such as Iron Oxide very clearly emphasized the areas located higher (uplands and mineral islands) most often overgrown by different types of crops. In the case of habitats with a high share of necromass (dried plant material), indices such as CAI also become important. The use of RS sub-products recommended in the identification of each of the wetland habitats allowed for obtaining better statistical accuracies and higher botanical assessment, proving the usefulness of a methodology that uses a fusion of optical and laser scanning airborne data and Random Forest algorithm with Recursive Feature Elimination with Cross-Validation (RF RFE-CV). Similar conclusions about the effectiveness of RF-RFE in the classification of natural habitats and feature selection were also demonstrated by Demarchi et al., 2020 [24] for meadows and grassland habitats in the Biebrza and Bug river valleys.
4.2. Optimal Term for Data Acquisition
Lower values of the F1-SCORE for alkaline fens in spring in the LB area in relation to the UB area can result from the diversity of plant communities, even though alkaline fens were well-developed here. In both areas, there are patches subject to overgrowth through the reed, patches with low willow thickets, but also vast areas dominated by low sedges (mainly Carex lasiocarpa) and a clearly developed layer of mosses. In spring, no signs of agricultural use were present in both areas. Perhaps the impact on the differences in the F1-SCORE values had a larger share among the dominant Carex elata common in the LB area, and much less often on UB, but this requires further analysis where subclasses are being used in the classification. Additionally, much more often in the area of LB patches with reed domination were identified during field surveys. Among the differences that may affect the values of the F1-SCORE, one may consider the different nature of the areas adjacent to the peat plain with alkaline fens. In the case of UB, the neighboring areas are more diversified, as there are large forest complexes, arable lands, and built-up areas on the plateau, whereas the peat plain is almost exclusively adjacent to extensive forest complexes in the LB area. Another reason affecting the diversity of the F1-SCORE value is the impact of regular use (both habitat and its surrounding)—differences in the way and time of agricultural use of both areas. Very large areas are subject to annual mowing in the Lower Biebrza. In turn, in the Upper Biebrza, the mowing has a smaller range; it takes place later and sometimes every other year.
The best classification results of the habitat were obtained in summer compared to the classification results obtained in spring or autumn. The issue of dominants among which high sedge Carex elata is often found deserves special attention here. In the summer, this sedge began to become discolored and due to this fact, the patches of alkaline fens in which this sedge is dominant more clearly differ from the surroundings. Additionally, important is the reed, quite common in the Biebrza River Valley, which in summer is in its optimum stage of development. The field inventory shows that in the area of LB, Phragmites australis has a large share and often occurs in relatively dense patches, but due to regular use, the density of the reed, as well, as its height, is different here from place to place. In the area of UB, encroachment of reed into alkaline fens is also observed, but this process is not as clear as in the case of the LB area. An important element differentiating both areas is also the share of dominant species of high sedges (next to Carex elata, Carex appropinquata is also often noted), which is more common in the LB area. Alkaline fens were classified properly in places where it occurs, but in surrounded areas intensively used for agriculture as in the UB area was misclassified in some crops. This can be improved by using a mask developed based on ALS data cutting off the plateau and mineral islands where this habitat never occurs.
It should also be noted that in the studied wetland habitats, there are also species present in other types of habitats and land cover. These species contribute to lowering the accuracy of the classification. The results also allowed us to conclude that identification of alkaline fens in autumn is also possible and gives similar results in relation to the results obtained in summer when using SC6. This similarity arises from the fact that summer and autumn campaigns in both areas were conducted in almost the same phenological stage of vegetation in the Biebrza River Valley, due to the late date of image acquisition in summer.
Spring classification results of transition mires and quaking bogs for the JF and UB areas differ due to reasons mentioned earlier, but also due to a different stage of vegetation development as well as different water conditions observed during data acquisition. In the area of the UB, the vegetation was not fully developed, there was also no flooding present, hence the layer of mosses was clearly visible. The transition mires and quaking bogs are excluded from agricultural use so the vegetation development in both areas was unaffected by human activity and the share of dead organic matter was large (~22% in the Biebrza River Valley—UB and ~23% in the Uroczyska Lasy Janowskie—JF), which could also influence the identification accuracy of the 7140 habitat. The internal structure of the habitat did not show much variation. Patches were fragmented, small, and with indistinct borders, often in a mosaic with alkaline fens (on the UB area), which was also confirmed during field surveys. In the area of JF, the layer of mosses was observable due to low vegetation development and water was quite often found on the surface.
In summer more plants showed discoloration in the UB area. The growing season in the UB area is shorter than on the JF area. This, in the context of the monthly difference in retrieving remote sensing data in both areas significantly affects the classification results and possibilities of comparing and assessing them as the state of vegetation development in both areas was different. In summer, on the UB and JF areas, the layer of mosses was mostly covered by higher plants. In Biebrza river valley by Menyanthes trifoliata, Comarum palustre, Carex lasiocarpa, Phragmites australis, Betula humilis, and Salix rosmarinifolia in many places. In comparison with spring, the dead organic matter showed a much smaller cover in the UB and JF areas. The lack of inundation caused higher mean values of the F1-SCORE in the UB area compared to the spring campaign.
In contrast to the transition mires and quaking bogs of the Upper Biebrza River Valley, the stagnant water was often found between the clusters of Eriophorum vaginatum in the JF area, which may have influenced the slightly lower value of the F1-SCORE compared to spring. An important aspect that could affect the difference in the value of the F1-SCORE is a moss layer observable during field surveys in spring, which was not covered by other plants. The summer or early autumn aspect was manifested by discoloration of some species (e.g., Eriophorum angustifolium) or flowering (e.g., Rhynchospora alba) as noted by expert botanists during field campaigns (Figure 15). In the JF and the UB areas, the water conditions were also different due to higher precipitation on the JF in the previous months.
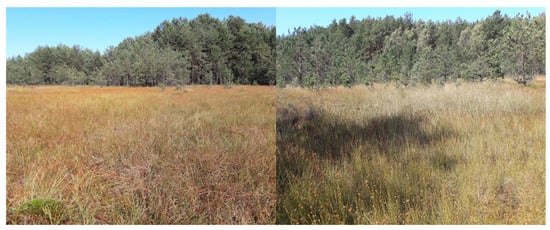
Figure 15.
7140 habitats in the JF area with discolored Eriophorum angustifolium (left picture) and flowering Rhynchospora alba (right picture).
Some authors indicated that the main unresolved issue for image analysis of wetland areas was seasonal differences [39]. They pointed out that using more than one image for an area doubles the resources and is not practical. Therefore, research on determining both the scope of data acquisition and the date is particularly important. However, recent literature asserts that fusion of multitemporal data can also be essential in habitat mapping allowing to achieve higher classification accuracy than the use of data from a single collection [55]. Nevertheless, the results presented in this publication allow reducing the amount of remote sensing data necessary to identify and monitor alkaline fens and transition mires and quaking bogs to several selected raster products. They also showed that the optimal dates for collecting data were summer for alkaline fens and spring and summer for transition mires and quaking bogs. To sum up, the term for identifying both wetland habitats is very important in order to better differentiate these habitats from adjacent areas and other habitats, but also to prevent identification problems in the presence of inconvenient conditions such as surface water presence in early spring.
5. Conclusions
The results showed that fusing hyperspectral and ALS topographical products highly improve classification accuracy. The benefits of using such combination of data for discriminating wetland habitats result from providing more detailed information about vegetation features allowing the ability to better separate classes. The synergetic use of hyperspectral and ALS data also improved discrimination of wetlands from other land cover types present in the research area.
The analyses also allowed to limit the number of remotely sensed sub-products used in the classification to only those necessary and sufficient for mapping alkaline fens and transition mires and quaking bogs with high accuracy. This is equally important in terms of time and efficiency of data processing where final maps should be used in operational applications related to habitat occurrence, distribution, change analysis, and protection. Recursive Feature Elimination with Cross-Validation enabled to choose the most informative RS data sub-products from large RS data sets.
RF algorithm also showed possible errors of commission for reed and some sedges—Scheuchzerietalia palustris, Caricetalia nigrae, Phragmition, Magnocaricion, and some crops (concerns alkaline fens) and sedges and grasslands—Caricetalia davalianae, Molinietalia (concerns transition mires and quaking bogs). Errors of omissions typically concern transition mires and quaking bogs in places where trees and shrubs enter the open area of wetland.
Alkaline fens are better identified in summer, transition mires and quaking bogs that evolved on/or in the vicinity of alkaline fens in summer and autumn, and transition mires and quaking bogs that evolved on dystrophic lakes in spring and summer. Therefore, it is sufficient to collect data once or twice during the growing season when the plant growth stage is optimal for identification. This limits the costs of procuring airborne data and performing field surveys.
Remote sensing is an essential support tool in many preservation actions, nature monitoring, and identification of threats. Identification of wetland habitats can be successfully carried out by also employing data with lower spectral or spatial resolution. The problem arises when more detailed information is needed, both in terms of quality and quantity. Different wetland habitats with their unique requirements require various preservation measures to maintain them in a proper condition. In a situation where they occur in the same area, it is necessary to precisely define their boundaries or/and transition zones to be able to plan appropriate conservation actions. In addition, high spectral and spatial resolution data enables analyzes beyond the mere identification of their location. Identification of their condition, plant treats, risk of wetland overdrying, as well as encroachment of alien invasive plant species or the threat resulting from the secondary succession, can be an example here. Therefore, it is crucial, in our opinion, to obtain data of appropriate quality and accuracy to be able to monitor their condition and conduct effective conservation management.
The RS products we propose for use during the identification process can also be developed on the basis of data obtained by low-cost sensors. The MNF is a common dimension reduction technique allowing reducing autocorrelation between bands and remove noise, however, for multispectral imagery, the PCA can be used alternatively. We have also pointed out several useful spectral indices that can be calculated using multispectral or hyperspectral satellite imagery. The same applies to topographic data, where the laser scanning data may come from government agencies, like data from the ISOK program in Poland. It is, in addition, definitely worth checking the currently implemented government projects that subsidize National Parks in obtaining aviation data. It is also worth taking into account the fact of the dynamic development of UAV technology, where the possibility of using hyperspectral and thermal cameras and even laser scanning is becoming more and more available.
The presented methodology can be of key importance for the monitoring of wetland habitats in high spatial resolution.
The study confirmed the high potential of airborne remote sensing methods in wetland habitat mapping. However, the significance of field surveys for the accuracy of the results should not be neglected.
Author Contributions
S.S.-W. designed and performed experiments, data analysis, result analysis, conceptualized and wrote the manuscript, prepared figures and tables. H.P. supervised botanical data collection for UB and LB areas, analyzed the resulting maps, and co-authored discussion. F.J. co-authored botanical data description. D.K. and Ł.S. co-authored the experimental design. W.C. helped in data preparation. All authors have read and agreed to the published version of the manuscript.
Funding
“This research was funded by the Polish National Centre for Research and Development (NCBR) and MGGP Aero under the program “Natural Environment, Agriculture and Forestry” BIO-STRATEG II.: The innovative approach supporting monitoring of non-forest Natura 2000 habitats, using remote sensing methods (HabitARS), project number: DZP/BIOSTRATEG-II/390/2015.
Acknowledgments
The study was co-financed by the Polish National Centre for Research and Development (NCBR) and MGGP Aero under the program “Natural Environment, Agriculture and Forestry” BIO-STRATEG II.: The innovative approach supporting monitoring of non-forest Natura 2000 habitats, using remote sensing methods (HabitARS), project number: DZP/BIOSTRATEG-II/390/2015. The Consortium Leader is MGGP Aero. The project partners include the University of Lodz, the University of Warsaw, Warsaw University of Life Sciences, the Institute of Technology and Life Sciences, the University of Silesia in Katowice, Warsaw University of Technology. Authors would like to express their deepest gratitude to all botanists involved in the gathering of botanical reference data.
Conflicts of Interest
Authors declare no conflict of interests.
References
- Okruszko, T. Kryteria Hydrologiczne w Ochronie Mokradeł. In Rozprawy Naukowe i Monografie; Wydawnictwo SGGW: Warszawa, Poland, 2005. (In Polish) [Google Scholar]
- Mitsch, W.J.; Gosselink, J.G. The value of wetlands: Importance of scale and landscape setting. Ecol. Econ. 2000, 35, 25–33. [Google Scholar] [CrossRef]
- Mitsch, W.J.; Bernal, B.; Hernandez, M.E. Ecosystem services of wetlands. Int. J. Biodivers. Sci. Ecosyst. Serv. Manag. 2015, 11, 1–4. [Google Scholar] [CrossRef]
- Maltby, E. Functional Assessment of Wetlands: Toward Evaluation of Ecosystem Services; Woodhead Publishing: Sawston, Cam-bridge, UK, 2009. [Google Scholar]
- Maltby, E.; Acreman, M.C. Ecosystem services of wetlands: Pathfinder for a new paradigm. Hydrol. Sci. J. 2011, 56, 1341–1359. [Google Scholar] [CrossRef]
- Chasmer, L.; Mahoney, C.; Millard, K.; Nelson, K.; Peters, D.; Merchant, M.; Hopkinson, C.; Brisco, B.; Niemann, O.; Montgomery, J.; et al. Remote Sensing of Boreal Wetlands 2: Methods for Evaluating Boreal Wetland Ecosystem State and Drivers of Change. Remote Sens. 2020, 12, 1321. [Google Scholar] [CrossRef]
- Mitsch, W.J.; Gosselink, J.G. Wetlands 1993, 2nd ed.; John Wiley: Hoboken, NJ, USA, 1993. [Google Scholar]
- Council Directive 92/43/EEC of 21 May 1992 on the conservation of natural habitats and of wild fauna and flora. Off. J. Eur. Union 1992, 206, 7–50.
- Firbank, L.; Barr, C.; Bunce, R.; Furse, M.; Haines-Young, R.; Hornung, M.; Howard, D.; Sheail, J.; Sier, A.; Smart, S. Assessing stock and change in land cover and biodiversity in GB: An introduction to Countryside Survey 2000. J. Environ. Manag. 2003, 67, 207–218. [Google Scholar] [CrossRef]
- Bloch-Petersen, M.; Brandt, J.; Olsen, M. Integration of European habitat monitoring based on plant life form composition as an indicator of environmental change and change in biodiversity. Geogr. Tidsskr. J. Geogr. 2006, 106, 61–74. [Google Scholar] [CrossRef]
- Lengyel, S.; Déri, E.; Varga, Z.; Horváth, R.; Tóthmérész, B.; Henry, P.-Y.; Kobler, A.; Kutnar, L.; Babij, V.; Seliškar, A.; et al. Habitat monitoring in Europe: A description of current practices. Biodivers. Conserv. 2008, 17, 3327–3339. [Google Scholar] [CrossRef]
- Feilhauer, H.; Dahlke, C.; Doktor, D.; Lausch, A.; Schmidtlein, S.; Schulz, G.; Stenzel, S. Mapping the local variability of Natura 2000 habitats with remote sensing. Appl. Veg. Sci. 2014, 17, 765–779. [Google Scholar] [CrossRef]
- Lafage, D.; Bonis, A.; Rapinel, S.; Bouzille, J.-B. Using landscape metrics on satellite imagery to assess conservation status of Natura 2000 habitats. Documents phytosociologiques—Actes du colloque de Saint-Mandé 2012. In Prodrome et Cartographie des Végétations de France; Actes du Colloque de Saint-Mandé: Saint Mandé, France, 2017; Volume 6, pp. 395–411. [Google Scholar]
- EEA. Terrestrial Habitat Mapping in EUROPE: An Overview; EEA Technical Report; Joint MNHN-EEA Report; European Environment Agency—EEA, Publications Office of the European Union: Luxembourg, 2014; ISSN 1725-2237.
- Borre, J.V.; Paelinckx, D.; Mücher, C.A.; Kooistra, L.; Haest, B.; De Blust, G.; Schmidt, A.M. Integrating remote sensing in Natura 2000 habitat monitoring: Prospects on the way forward. J. Nat. Conserv. 2011, 19, 116–125. [Google Scholar] [CrossRef]
- Hopkinson, C.; Chasmer, L.E.; Sass, G.; Creed, I.F.; Sitar, M.; Kalbfleisch, W.; Treitz, P. Vegetation class dependent errors in lidar ground elevation and canopy height estimates in a boreal wetland environment. Can. J. Remote Sens. 2005, 31, 191–206. [Google Scholar] [CrossRef]
- Bässler, C.; Stadler, J.; Müller, J.; Förster, B.; Göttlein, A.; Brandl, R. LiDAR as a rapid tool to predict forest habitat types in Natura 2000 networks. Biodivers. Conserv. 2010, 20, 465–481. [Google Scholar] [CrossRef]
- Alexander, C.; Deák, B.; Kania, A.; Mücke, W.; Heilmeier, H. Classification of vegetation in an open landscape using full-waveform airborne laser scanner data. Int. J. Appl. Earth Obs. Geoinf. 2015, 41, 76–87. [Google Scholar] [CrossRef]
- Rosso, P.; Ustin, S.; Hastings, A. Use of lidar to study changes associated with Spartina invasion in San Francisco Bay marshes. Remote Sens. Environ. 2006, 100, 295–306. [Google Scholar] [CrossRef]
- Schmid, K.A.; Hadley, B.C.; Wijekoon, N. Vertical Accuracy and Use of Topographic LIDAR Data in Coastal Marshes. J. Coast. Res. 2011, 275, 116–132. [Google Scholar] [CrossRef]
- Hladik, C.; Alber, M. Accuracy assessment and correction of a LIDAR-derived salt marsh digital elevation model. Remote Sens. Environ. 2012, 121, 224–235. [Google Scholar] [CrossRef]
- Fernandez-Nunez, M.; Burningham, H.; Zujar, J.O. Improving accuracy of LiDAR-derived digital terrain models for saltmarsh management. J. Coast. Conserv. 2017, 21, 209–222. [Google Scholar] [CrossRef]
- Hopkinson, C.; Lovell, J.; Chasmer, L.; Jupp, D.; Kljun, N.; van Gorsel, E. Integrating terrestrial and airborne lidar to calibrate a 3D canopy model of effective leaf area index. Remote Sens. Environ. 2013, 136, 301–314. [Google Scholar] [CrossRef]
- Demarchi, L.; Kania, A.; Ciężkowski, W.; Piórkowski, H.; Oświecimska-Piasko, Z.; Chormański, J. Recursive Feature Elimination and Random Forest Classification of Natura 2000 Grasslands in Lowland River Valleys of Poland Based on Airborne Hyperspectral and LiDAR Data Fusion. Remote Sens. 2020, 12, 1842. [Google Scholar] [CrossRef]
- Kopeć, D.; Michalska-Hejduk, D.; Sławik, Ł.; Berezowski, T.; Borowski, M.; Rosadziński, S.; Chormański, J. Application of multisensoral remote sensing data in the mapping of alkaline fens Natura 2000 habitat. Ecol. Indic. 2016, 70, 196–208. [Google Scholar] [CrossRef]
- Zhang, J. Multi-source remote sensing data fusion: Status and trends. Int. J. Image Data Fusion 2010, 1, 5–24. [Google Scholar] [CrossRef]
- Sławik, Ł.; Niedzielko, J.; Kania, A.; Piórkowski, H.; Kopeć, D. Multiple Flights or Single Flight Instrument Fusion of Hyperspectral and ALS Data? A Comparison of their Performance for Vegetation Mapping. Remote Sens. 2019, 11, 970. [Google Scholar] [CrossRef]
- Maltby, E.; Barker, T. The Wetlands Handbook 2009; John Wiley & Sons: Hoboken, NJ, USA, 2009. [Google Scholar]
- Bork, E.W.; Su, J.G. Integrating LIDAR data and multispectral imagery for enhanced classification of rangeland vegetation: A meta analysis. Remote Sens. Environ. 2007, 111, 11–24. [Google Scholar] [CrossRef]
- Gilmore, M.S.; Wilson, E.H.; Barrett, N.; Civco, D.L.; Prisloe, S.; Hurd, J.D.; Chadwick, C. Integrating multi-temporal spectral and structural information to map wetland vegetation in a lower Connecticut River tidal marsh. Remote Sens. Environ. 2008, 112, 4048–4060. [Google Scholar] [CrossRef]
- Hladik, C.M.; Schalles, J.F.; Alber, M. Salt marsh elevation and habitat mapping using hyperspectral and LIDAR data. Remote Sens. Environ. 2013, 139, 318–330. [Google Scholar] [CrossRef]
- Rapinel, S.; Hubert-Moy, L.; Clément, B. Combined use of LiDAR data and multispectral earth observation imagery for wetland habitat mapping. Int. J. Appl. Earth Obs. Geoinf. 2015, 37, 56–64. [Google Scholar] [CrossRef]
- Zhang, C.; Denka, S.; Mishra, D.R. Mapping freshwater marsh species in the wetlands of Lake Okeechobee using very high-resolution aerial photography and lidar data. Int. J. Remote Sens. 2018, 39, 5600–5618. [Google Scholar] [CrossRef]
- Chasmer, L.; Hopkinson, C.; Veness, T.; Quinton, W.; Baltzer, J. A decision-tree classification for low-lying complex land cover types within the zone of discontinuous permafrost. Remote Sens. Environ. 2014, 143, 73–84. [Google Scholar] [CrossRef]
- Berhane, T.M.; Lane, C.R.; Wu, Q.; Autrey, B.C.; Anenkhonov, O.A.; Chepinoga, V.V.; Liu, H. Decision-Tree, Rule-Based, and Random Forest Classification of High-Resolution Multispectral Imagery for Wetland Mapping and Inventory. Remote Sens. 2018, 10, 580. [Google Scholar] [CrossRef] [PubMed]
- McCarthy, M.J.; Radabaugh, K.R.; Moyer, R.P.; Muller-Karger, F.E. Enabling efficient, large-scale high-spatial resolution wet-land mapping using satellites. Remote Sens. Environ. 2018, 208, 189–201. [Google Scholar] [CrossRef]
- Sanchez-Hernandez, C.; Boyd, D.S.; Foody, G.M. One-Class Classification for Mapping a Specific Land-Cover Class: SVDD Classification of Fenland. IEEE Trans. Geosci. Remote Sens. 2007, 45, 1061–1073. [Google Scholar] [CrossRef]
- Sanchez-Hernandez, C.; Boyd, D.S.; Foody, G.M. Mapping specific habitats from remotely sensed imagery: Support vector machine and support vector data description based classification of coastal saltmarsh habitats. Ecol. Inform. 2007, 2, 83–88. [Google Scholar] [CrossRef]
- MacAlister, C.; Mahaxay, M. Mapping wetlands in the Lower Mekong Basin for wetland resource and conservation man-agement using Landsat ETM images and field survey data. J. Environ. Manag. 2009, 90, 2130–2137. [Google Scholar] [CrossRef]
- Collin, A.; Long, B.; Archambault, P. Salt-marsh characterization, zonation assessment and mapping through a du-al-wavelength LiDAR. Remote Sens. Environ. 2010, 114, 520–530. [Google Scholar] [CrossRef]
- Onojeghuo, A.O.; Blackburn, G.A. Optimising the use of hyperspectral and LiDAR data for mapping reedbed habitats. Remote Sens. Environ. 2011, 115, 2025–2034. [Google Scholar] [CrossRef]
- Alexandridis, T.K.; Lazaridou, E.; Tsirika, A.; Zalidis, G.C. Using Earth Observation to update a Natura 2000 habitat map for a wetland in Greece. J. Environ. Manag. 2009, 90, 2243–2251. [Google Scholar] [CrossRef]
- Wagner-Lücker, I.; Lanz, E.; Forster, M.; Janauer, G.A.; Reiter, K. Knowledge-based framework for delineation and classification of ephemeral plant communities in riverine landscapes to support EC Habitat Directive assessment. Ecol. Inform. 2013, 14, 44–47. [Google Scholar] [CrossRef]
- Bochenek, Z.; Shrestha, S.; Małek, I. Hybrid approach for mapping wetland habitats based on application of VHR satellite images. Geoinf. Issues 2013, 5, 21–28. [Google Scholar]
- Mui, A.; He, Y.; Weng, Q. An object-based approach to delineate wetlands across landscapes of varied disturbance with high spatial resolution satellite imagery. ISPRS J. Photogramm. Remote Sens. 2015, 109, 30–46. [Google Scholar] [CrossRef]
- Jeong, S.G.; Mo, Y.; Kim, H.G.; Park, C.H.; Lee, D.K. Mapping riparian habitat using a combination ofremote-sensing techniques. Int. J. Remote Sens. 2016, 37, 1069–1088. [Google Scholar] [CrossRef]
- Rapinel, S.; Mony, C.; Lecoq, L.; Clément, B.; Thomas, A.; Hubert-Moy, L. Evaluation of Sentinel-2 time-series for mapping floodplain grassland plant communities. Remote Sens. Environ. 2019, 223, 115–129. [Google Scholar] [CrossRef]
- Morris, J.T.; Porter, D.; Neet, M.; Noble, P.A.; Schmidt, L.; Lapine, L.A.; Jensen, J.R. Integrating LIDAR elevation data, multi-spectral imagery and neural network modelling for marsh characterization. Int. J. Remote Sens. 2005, 26, 5221–5234. [Google Scholar] [CrossRef]
- Collin, A.; Lambert, N.; Etienne, S. Satellite-based salt marsh elevation, vegetation height, and species composition mapping using the superspectral WorldView-3 imagery. Int. J. Remote Sens. 2018, 39, 5619–5637. [Google Scholar] [CrossRef]
- Van Beijma, S.; Comber, A.; Lamb, A. Random forest classification of salt marsh vegetation habitats using quad-polarimetric airborne SAR, elevation and optical RS data. Remote Sens. Environ. 2014, 149, 118–129. [Google Scholar] [CrossRef]
- Zlinszky, A.; Deák, B.; Kania, A.; Schroiff, A.; Pfeifer, N. Biodiversity mapping via Natura 2000 conservation status and EBV assessment using airborne laser scanning in alkali grasslands. Int. Arch. Photogramm. Remote Sens. Spat. Inf. Sci. 2016, XLI–B8, 1293. [Google Scholar] [CrossRef]
- Wendelberger, K.S.; Gann, D.; Richards, J.H. Using Bi-Seasonal WorldView-2 Multi-Spectral Data and Supervised Random Forest Classification to Map Coastal Plant Communities in Everglades National Park. Sensors 2018, 18, 829. [Google Scholar] [CrossRef]
- Al-Jarrah, O.; Siddiqui, A.; ElSalamouny, M.; Yoo, P.; Muhaidat, S.; Kim, K. Machine-Learning-Based Feature Selection Techniques for Large-Scale Network Intrusion Detection. In Proceedings of the 2014 IEEE 34th International Conference on Distributed Computing Systems Workshops, Madrid, Spain, 30 June–3 July 2014; pp. 177–181. [Google Scholar]
- Zlinszky, A.; Deák, B.; Kania, A.; Schroiff, A.; Pfeifer, N. Mapping Natura 2000 Habitat Conservation Status in a Pannonic Salt Steppe with Airborne Laser Scanning. Remote Sens. 2015, 7, 2991–3019. [Google Scholar] [CrossRef]
- Marcinkowska-Ochtyra, A.; Gryguc, K.; Ochtyra, A.; Kopeć, D.; Jarocińska, A.; Sławik, Ł. Multitemporal Hyperspectral Data Fusion with Topographic Indices—Improving Classification of Natura 2000 Grassland Habitats. Remote Sens. 2019, 11, 2264. [Google Scholar] [CrossRef]
- Wołejko, L.; Stańko, R.; Pawlikowski, P.; Jarzombkowski, F.; Kiaszewicz, K.; Chapiński, P.; Bregin, M.; Kozub, Ł.; Krajewski, Ł.; Szczepański, M. Krajowy Program Ochrony Torfowisk Alkalicznych (7230); Wydawnictwo Klubu Przyrodników: Świebodzin, Poland, 2012. (In Polish) [Google Scholar]
- Jarzombkowski, F. Torfowiska w Basenie Górnym doliny Biebrzy. W: A. Obidziński (red.) Z Mazowsza na Polesie i Wileńszczyznę. Zróżnicowanie i Ochrona Szaty Roślinnej Pogranicza Europy Środkowej i Północno-Wschodniej. 2010, pp. 331–340. Available online: https://bagna.pl/images/biblioteczka/z_Mazowsza_na_Polesie_i_Wilenszczyzne.pdf (accessed on 1 October 2019). (In Polish).
- Norsk Elektro Optikk. Hyperspectral Imaging Systems. Available online: www.hyspex.no (accessed on 1 October 2019).
- ReSe Applications LLC, Switzerland. Available online: https://www.rese-apps.com (accessed on 1 October 2019).
- Cristóbal, J.; Graham, P.; Prakash, A.; Buchhorn, M.; Gens, R.; Guldager, N.; Bertram, M. Airborne Hyperspectral Data Acquisition and Processing in the Arctic: A Pilot Study Using the Hyspex Imaging Spectrometer for Wetland Mapping. Remote Sens. 2021, 13, 1178. [Google Scholar] [CrossRef]
- ASD Inc., Longmont, CO, USA. Malvern Panalytical Ltd. Is a Spectris Company. Available online: https://www.malvernpanalytical.com/en (accessed on 1 October 2019).
- Boardman, J.W.; Kruse, F.A. Automated Spectral Analysis: A Geological Example Using AVIRIS Data, North Grapevine Moun-Tains, Nevada. In Proceedings of the ERIM Tenth Thematic Conference on Geologic Remote Sensing, San Antonio, TX, USA, 9–12 May 1994; Environmental Research Institute of Michigan: Ann Arbor, MI, USA, 1994. [Google Scholar]
- Harris Geospatial Solutions, Inc. Available online: https://www.l3harrisgeospatial.com (accessed on 1 October 2019).
- RIEGL Laser Measurement Systems GmbH. Available online: www.riegl.com (accessed on 1 October 2019).
- Terrasolid Ltd. Available online: https://terrasolid.com (accessed on 1 October 2019).
- Mandlburger, G.; Otepka, J.; Karel, W.; Wagner, W.; Pfeifer, N. Orientation and Processing of Airborne Laser Scanning. In ISPRS Workshop Laserscanning; Technische Universität: Wien, Vienna, Austria, 2009; Available online: https://opals.geo.tuwien.ac.at/html/stable/index.html (accessed on 1 October 2019).
- Mallet, C.; Bretar, F. Full-waveform topographic lidar: State-of-the-art. ISPRS J. Photogramm. Remote Sens. 2009, 64, 1–16. [Google Scholar] [CrossRef]
- System for Automated Geoscientific Analyses. Available online: http://www.saga-gis.org/en/index.html (accessed on 1 October 2019).
- Halladin-Dąbrowska, A.; Kania, A.; Kopeć, D. The t-SNE Algorithm as a Tool to Improve the Quality of Reference Data Used in Accurate Mapping of Heterogeneous Non-Forest Vegetation. Remote Sens. 2019, 12, 39. [Google Scholar] [CrossRef]
- Breiman, L. Random Forests. In Machine Learning; Kluwer Academic Publishers: Amsterdam, The Netherlands, 2001; Volume 45, pp. 5–32. [Google Scholar]
- Rodriguez-Galiano, V.F.; Ghimire, B.; Rogan, J.; Chica-Olmo, M.; Rigol-Sanchez, J.P. An assessment of the effectiveness of a random forest classifier for land-cover classification. ISPRS J. Photogramm. Remote Sens. 2012, 67, 93–104. [Google Scholar] [CrossRef]
- Gallant, J.C.; Dowling, T.I. A multiresolution index of valley bottom flatness for mapping depositional areas. Water Resour. Res. 2003, 39, 1347–1360. [Google Scholar] [CrossRef]
- Boehner, J.; Antonic, O. Land Surface Parameters Specific to Topo-Climatology. Dev. Soil Sci. 2009, 33, 195–226. [Google Scholar]
- Guisan, A.; Weiss, S.B.; Weiss, A.D. GLM versus CCA spatial modeling of plant species distribution. Plant Ecol. 1999, 143, 107–122. [Google Scholar] [CrossRef]
- Boehner, J.; Selige, T. Spatial prediction of soil attributes using terrain analysis and climate regionalisation. In SAGA—Analysis and Modelling Applications; Boehner, J., McCloy, K.R., Strobl, J., Eds.; Goettinger Geographische Abhandlungen: Goettingen, Germany, 2006; pp. 13–28. [Google Scholar]
- Boehner, J.; Koethe, R.; Conrad, O.; Gross, J.; Ringeler, A.; Selige, T. Soil Regionalisation by Means of Terrain Analysis and Process Parameterisation. In Soil Classification 2001; Micheli, E., Nachtergaele, F.O., Jones, R.J.A., Montanarella, L., Eds.; European Soil Bureau Research Report No.7, EUR 20398 EN; Office for Official Publications of the European Communities: Luxembourg, 2002; pp. 213–222. [Google Scholar]
- Gitelson, A.; Merzlyak, M.; Chivkunova, O. Optical Properties and Nondestructive Estimation of Anthocyanin Content in Plant Leaves. Photochem. Photobiol. 2001, 74, 38–45. [Google Scholar] [CrossRef]
- Huete, A.; Didan, K.; Miura, T.; Rodriguez, E.P.; Gao, X.; Ferreira, L.G. Overview of the Radiometric and Biophysical Per-formance of the MODIS Vegetation Indices. Remote Sens. Environ. 2002, 83, 195–213. [Google Scholar] [CrossRef]
- Penuelas, J.; Baret, F.; Filella, I. Semi-Empirical Indices to Assess Carotenoids/Chlorophyll-a Ratio from Leaf Spectral Reflec-tance. Photosynthetica 1995, 31, 221–230. [Google Scholar]
- Penuelas, J.; Filella, I.; Gamon, J.A. Assessment of photosynthetic radiation-use efficiency with spectral reflectance. New Phytol. 1995, 131, 291–296. [Google Scholar] [CrossRef]
- McFeeters, S.K. The use of the Normalized Difference Water Index (NDWI) in the delineation of open water features. Int. J. Remote Sens. 1996, 17, 1425–1432. [Google Scholar] [CrossRef]
- Xu, H. Modification of normalised difference water index (NDWI) to enhance open water features in remotely sensed imagery. Int. J. Remote Sens. 2006, 27, 3025–3033. [Google Scholar] [CrossRef]
- Gitelson, A.; Merzlyak, M.N. Spectral Reflectance Changes Associated with Autumn Senescence of Aesculus hippocastanum L. and Acer platanoides L. Leaves. Spectral Features and Relation to Chlorophyll Estimation. J. Plant Physiol. 1994, 143, 286–292. [Google Scholar] [CrossRef]
- Sims, D.; Gamon, J. Relationships between Leaf Pigment Content and Spectral Reflectance across a Wide Range of Species, Leaf Structures and Developmental Stages. Remote Sens. Environ. 2002, 81, 337–354. [Google Scholar] [CrossRef]
- Bernstein, L.S.; Jin, X.; Gregor, B.; Adler-Golden, S.M. Quick atmospheric correction code: Algorithm description and recent upgrades. Opt. Eng. 2012, 51, 111719. [Google Scholar] [CrossRef]
- Wang, L.; Qu, J.J. NMDI: A normalized multi-band drought index for monitoring soil and vegetation moisture with satellite remote sensing. Geophys. Res. Lett. 2007, 34, 20405. [Google Scholar] [CrossRef]
- Wang, L.; Qu, J.J.; Hao, X. Forest fire detection using the normalized multi-band drought index (NMDI) with satellite measurements. Agric. For. Meteorol. 2008, 148, 1767–1776. [Google Scholar] [CrossRef]
- Segal, D. Theoretical Basis for Differentiation of Ferric-Iron Bearing Minerals, Using Landsat MSS Data. In Proceedings of the Symposium for Remote Sensing of Environment 1982, 2nd Thematic Conference on Remote Sensing for Exploratory Geology, Fort Worth, TX, USA, 6–10 December 1982; Environmental Research Institute of Michigan: Ann Arbor, MI, USA, 1982; pp. 949–951. [Google Scholar]
- Drury, S.A. Image interpretation in geology. Geocarto Int. 1987, 2, 48. [Google Scholar] [CrossRef]
- Tucker, C.J. Red and photographic infrared linear combinations for monitoring vegetation. Remote Sens. Environ. 1979, 8, 127–150. [Google Scholar] [CrossRef]
- Daughtry, C. Discriminating Crop Residues from Soil by Short-Wave Infrared Reflectance. Agron. J. 2001, 93, 125–131. [Google Scholar] [CrossRef]
- Daughtry, C.E.; Hunt, E.R., Jr.; McMurtrey, J., III. Assessing Crop Residue Cover Using Shortwave Infrared Reflectance. Remote Sens. Environ. 2004, 90, 126–134. [Google Scholar] [CrossRef]
- Kaufman, Y.; Tanre, D. Atmospherically resistant vegetation index (ARVI) for EOS-MODIS. IEEE Trans. Geosci. Remote Sens. 1992, 30, 261–270. [Google Scholar] [CrossRef]
- Liu, X.; Zhang, B.; Gao, L.; Chen, N. A maximum noise fraction transform with improved noise estimation for hyperspectral images. Sci. China Ser. F Inf. Sci. 2009, 52, 1578–1587. [Google Scholar] [CrossRef]
- Brasil. Decreto—Lei n° 227, de 28 de Fevereiro de 1967. Dá nova Redação ao Decreto-lei nº 1.985, de 29 de Janeiro de 1940 (Código de Minas). Brasília. 1967. Available online: http://www.planalto.gov.br/ccivil_03/Decreto-Lei/Del0227.htm (accessed on 19 October 2020).
- Riley, J.W.; Calhoun, D.L.; Barichivich, W.J.; Walls, S.C. Identifying Small Depressional Wetlands and Using a Topographic Position Index to Infer Hydroperiod Regimes for Pond-Breeding Amphibians. Wetlands 2017, 37, 325–338. [Google Scholar] [CrossRef]
- García-Rivero, A.E.; Olivera, J.; Salinas, E.; Yuli, R.A.; Bulege, W. Use of Hydrogeomorphic Indexes in SAGA-GIS for the Characterization of Flooded Areas in Madre de Dios, Peru. Int. J. Appl. Eng. Res. 2017, 12, 9078–9086. [Google Scholar]
Publisher’s Note: MDPI stays neutral with regard to jurisdictional claims in published maps and institutional affiliations. |
© 2021 by the authors. Licensee MDPI, Basel, Switzerland. This article is an open access article distributed under the terms and conditions of the Creative Commons Attribution (CC BY) license (https://creativecommons.org/licenses/by/4.0/).