Abstract
Monitoring rice production is essential for securing food security against climate change threats, such as drought and flood events becoming more intense and frequent. The current practice to survey an area of rice production manually and in near real-time is expensive and involves a high workload for local statisticians. Remote sensing technology with satellite-based sensors has grown in popularity in recent decades as an alternative approach, reducing the cost and time required for spatial analysis over a wide area. However, cloud-free pixels of optical imagery are required to produce accurate outputs for agriculture applications. Thus, in this study, we propose an integration of optical (PROBA-V) and radar (Sentinel-1) imagery for temporal mapping of rice growth stages, including bare land, vegetative, reproductive, and ripening stages. We have built classification models for both sensors and combined them into 12-day periodical rice growth-stage maps from January 2017 to September 2018 at the sub-district level over Java Island, the top rice production area in Indonesia. The accuracy measurement was based on the test dataset and the predicted cross-correlated with monthly local statistics. The overall accuracy of the rice growth-stage model of PROBA-V was 83.87%, and the Sentinel-1 model was 71.74% with the Support Vector Machine classifier. The temporal maps were comparable with local statistics, with an average correlation between the vegetative area (remote sensing) and harvested area (local statistics) is 0.50, and lag time 89.5 days (n = 91). This result was similar to local statistics data, which correlate planting and the harvested area at 0.61, and the lag time as 90.4 days, respectively. Moreover, the cross-correlation between the predicted rice growth stage was also consistent with rice development in the area (r > 0.52, p < 0.01). This novel method is straightforward, easy to replicate and apply to other areas, and can be scaled up to the national and regional level to be used by stakeholders to support improved agricultural policies for sustainable rice production.
1. Introduction
Rice (Oryza sativa L.) is one of the main crops grown in the tropical and subtropical area, with more than half the world population depending on rice as a staple food [1]. However, global production is close to its limits while the dependent population is expected to grow up to 9.26 billion by 2050 [2]. Moreover, urbanization, depleting water resources, climate change, and natural disasters have been threatening the sustainable production of rice despite its increased production by introducing new cultivars, chemical fertilizer, and better irrigation. Near-real-time and accurate information about rice growth stages is vital to support stakeholders to make better decisions to maximize production volumes and secure food production.
Rice fields have been traditionally monitored by a local field statistician to calculate the planting and harvesting area from the local to a national scale. However, this is a long and exhausting field-sampling process that may not be compatible with the current and future situation where climate change may cause reduced agricultural productivity in developing countries by 2080 (based on emissions-forecasting worst-case scenarios) [3].
Remote sensing has been widely used to monitor crops, including projects such as Monitoring Agricultural ResourceS (MARS) by the EU [4,5]. They have developed an automated system for rice monitoring for Europe, which has limited portability for tropical countries with limited free satellite image sources and high cloud occurrences. Other rice monitoring projects exist, such as Geo Global Agricultural Monitoring by multiple international organizations [6] and CropWatch by China [7]. However, the monitoring system only works for dedicated countries, making it difficult to be developed and replicated to other countries, especially for developing ones.
In recent years, many attempts have been made for mapping rice areas using multitemporal Synthetic-aperture radar (SAR) images based on backscattering profiles [8,9,10,11,12,13,14,15,16]. Compared to optical sensors, the SAR sensors such as Sentinel-1 [14,17], TerraSAR-X [18,19] and Radarsat-2 [20,21,22] has the advantage of penetrating through the clouds, which is the major obstacle in monitoring efforts. The previous studies reported that backscattering profiles could detect rice area [13,23,24,25], rice cropping pattern [25,26,27], and rice growth stages [8,27] with high precision. Based on these results, Remote sensing-based Information and Insurance for Crops in Emerging economies (RIICE) has been developing a method with Sentinel-1 to map rice area in six Asian countries [28,29].
Several studies highlighted that multiple-sensor data could increase the accuracy by 3–9% of rice mapping under different landscapes [30,31,32,33]. For example, optical sensors can enhance or confirm the rice-specific backscattering profile with SAR data challenging to interpret in a complex area [27]. Furthermore, the vertical-horizontal/vertical-vertical (VH/VV) backscatter images can detect inundating of rice area using the spikes of backscatter values [33,34]. On the other hand, vegetation indices such as Enhanced Vegetation Index (EVI) and Normalized Difference Vegetation Index (NDVI) from Sentinel-2 or Landsat-8, can also detect changes by using a phenology method for rice cultivation by capturing the increase and decrease in indices values [34,35]. However, the phenology method requires long temporal data (>3 months), which may challenge building automated rice growth-stage detection methods. The Project for On-Board Autonomy-Vegetation (PROBA-V) is a satellite mission to monitor vegetation globally with a 2–5 days revisit time, and 100 m spatial resolution. It has been used for mapping land use classification using vegetation indices with better spatial resolution than the Moderate-Resolution Imaging Spectroradiometer (MODIS) based products [36,37]. Despite the advantages of PROBA-V, the application of this technology for rice growth stages is limited.
The Indonesian Ministry of Agriculture has been developing several rice monitoring projects utilizing remote sensing technology to update food production statistics. The first project they supported undertook rice monitoring with the MODIS with Terra sensor with a spatial resolution of 250 m to map rice growth stages in 2012 (https://sipandora.lapan.go.id/site/fasepertumbuhanpadi, accessed date: 11 November 2020) with accuracy <70% [38]. In 2016, another project was undertaken using Landsat-8 Operational Land Imager (OLI) using NDVI threshold (http://sig.pertanian.go.id/, accessed date: 21 December 2020 ) with accuracy <60% without cloud masking [38]. However, both projects have one major limitation; cloud occurrence causes uncertainty over a specific timeframe.
The Indonesian Agency for Agricultural Research and Development has recently launched a rice monitoring system using Sentinel-2, allowing users to have detailed information about rice conditions in 10 m resolution (S-2 RGS). The S-2 RGS uses a machine learning model to classify rice conditions using ten bands of Sentinel-2 as a predictor [39]. The information can be accessed freely online and android with an interactive map (http://katam.litbang.pertanian.go.id/sc/, accessed date: 15 January 2021). However, the existing monitoring approach is incapable of temporal tracking using local statistics due to missing data in some periods, and the results are not consistent.
This study aims to overcome these challenges by proposing a new workflow to integrate ground observations and high-frequency revisit optical sensors with PROBA-V and radar sensors such as Sentinel-1. Furthermore, images from both sensors are available on the Google Earth Engine (GEE), which is freely accessible for public use. Thus, the objectives of this study are as follows: building classification models for mapping the rice growth stages using the integration of PROBA-V and Sentinel-1; and measuring the correlation between the area of rice growth stages with local statistics at sub-district levels. This study will provide a foundation for mapping the rice growth stages accurately and making these available to the stakeholders for making better decisions when manual observations are limited.
2. Background, Study Area, and Data
2.1. Rice Growth Stages
The rice production cycle usually takes about 3–4 months, depending on the variety and environmental conditions, to grow from seed to mature plants. They experience three general phases of growth: vegetative, reproductive, and ripening [40]. Figure 1 illustrates the rice growth phases and surface condition in the rice fields [41]. First, the seed is planted in a small bed and, after 25 days, is transplanted into the main rice field to produce a higher yield and reduce weed occurrences. The vegetative stage spans from seed germination to maximum tillering. The next stage is the reproductive stage, where the plant grows from panicle initiation to heading. The last phase is ripening. The young grain in the panicle starts to develop starch. The grain colour becomes gold and then it is harvested. Within this study, we added a bare land class to capture the dynamics of the changing land surface within rice fields.
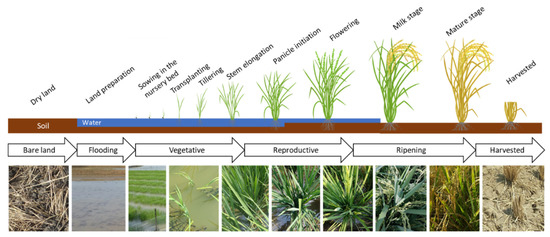
Figure 1.
The rice growth stages with actual images from the field campaign.
2.2. Study Area
The study area is located on Java Island, the leading rice producer in Indonesia, with a combination of irrigated and low land areas. The area consists of three regencies: Karawang, Subang, and Indramayu, with 309,046 ha in West Java Province (Figure 2), which is split into 91 sub-districts administratively [42]. The leading rice production areas are usually within the sub-districts in Indramayu (116,869 ha) and Subang (90,474 ha). Karawang (101,703 ha) is a regency with high land-use change rates due to industrialization and housing construction. The most significant paddy field area is Losarang, Indramayu, with 7244 ha, and the smallest is Cikampek, Karawang (416 ha). The average rice field area, over 91 sub-districts, is 3373 ha.
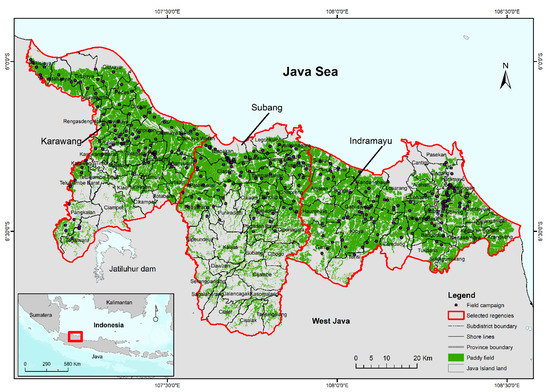
Figure 2.
The map of rice area on the study area for Karawang, Subang, and Indramayu regency.
The majority of the land area is irrigated and dominated by alluvial soils which are most suitable for rice cultivation. This comes from deposition from the Cimanuk, Citarum, and Cilamaya rivers. A state-owned company maintains the water distribution from the Jatiluhur dam in the south of the study area. The climate is monsoon with two seasons: the wet and dry seasons, and is classified as tropical rainforest based on Köppen–Geiger climate classifications [43]. The paddy cultivation includes the use of short-duration rice varieties such as IR64, Ciherang, glutinous rice, and other varieties [26,27]. Fertilizer is applied twice during growth, and chemical pesticides used to remove pests. Crops are harvested using manual tools and labor. The rice crop typically cultivates twice a year, with farmers starting sowing during the rainy season in November–December and harvest in January–February. The second sowing is undertaken in March–April and harvest from June to July. However, some areas have scheduled water irrigation which allows rice cultivation even in the dry season. The complete cropping pattern of the study area is well described in the previous study [26].
2.3. Satellite Imagery
This study uses two multitemporal imagery sources: Project for On-Board Autonomy-Vegetation (PROBA-V) and Sentinel-1 satellite imagery was downloaded directly from GEE storage within the period from January 2017 to August 2018. PROBA-V Top of Canopy dataset comes from Flemish Institute for Technological Research/European Satellite Agency (GEE id: VITO_PROBAV_C1_S1_TOC_100M). The product contains five bands, e.g., red (658 nm), near-infrared (NIR) (834 nm), blue (460 nm), short-wave infrared (SWIR) (1610 nm), and the NDVI values were calculated from the red band and NIR band [44]. This dataset comes from a composite of 300 m spatial resolution every two days, and 100 m every five days, which has been corrected at the atmospheric and radiometric level [45].
The Sentinel-1 dataset comes from the Copernicus project by the European Space Agency (ESA) as one of the space missions to monitor land on a global scale. Sentinel-1 has a dual-polarization C-band Synthetic Aperture Radar (SAR) with two satellites in the same orbit to have shorter revisit times (6–12 days). The dataset has been processed with the Sentinel-1 toolbox to remove thermal noise, calibrate radiometric problems, and correct the terrain (GEE id: COPERNICUS_S1_GRD). The dataset contains vertical–horizontal (VH) and vertical–vertical (VV) cross-polarization with Interferometric Wide Swath mode in order to have the largest area in one swath with 10 m resolution from a descending orbit dataset. A revised Lee filter was run to decrease speckle noise [46]. In the next step, the Sentinel-1 (VH only) images were resampled to 100 m to match the PROBA-V’s resolution.
The total number of images of PROBA-V and Sentinel-1 processed from 1 January 2017 to 23 July 2018 were 598 and 132 images, respectively. All the PROBA-V and Sentinel-1 processed images were masked with existing rice field maps from the official Indonesian Ministry of Agriculture, which come from high-resolution images obtained in 2010. The masking process was carried out to ensure only rice fields remain within the image.
2.4. Local Statistics
The agriculture agencies at the regency level have been collecting rice statistics, including planting area, harvesting area, and productivity for each month at the sub-district level since the 1980s. The planting and harvesting data are from farmer-provided information to the local agriculture statistics group. The collated data report would be sent to the agricultural division at the regency, province, and national level for the Indonesian Central Bureau of Statistics and Indonesia Ministry of Agriculture.
The overall statistics of rice planting and harvested area are illustrated in Figure 3. The highest rice planting area between January 2017 to July 2018 was 94,428 ha in December 2017, and the harvested area was 76,300 ha in March 2018 for all three regencies [47,48,49].
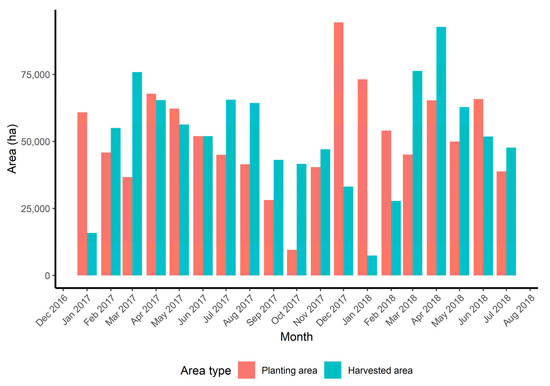
Figure 3.
The fluctuations between the rice planting and rice harvested area on Karawang, Subang, and Indramayu regency from January 2017 to July 2018.
3. Methods
There are four steps to find the cross-correlation between rice growth stages and rice planting and harvested areas. The first step was collecting data from the field campaign to generate the ground-truthing dataset. The second step is to build a statistical learning model to classify rice growth stages using images from PROBA-V and Sentinel-1 and ground-truthing dataset. In the third step, the time-series rice growth stages prediction maps were generated, and sub-district level maps are calculated. The last step was to calculate cross-correlation and map the correlation value to each sub-district to generate a correlated and lag-day distribution map, as shown in Figure 4.
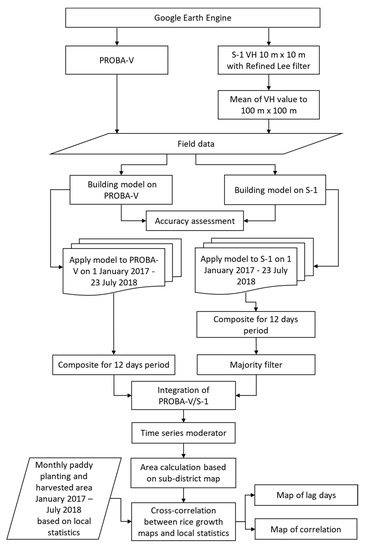
Figure 4.
The workflow of methodology for rice growth stages mapping using PROBA-V and Sentinel-1.
3.1. Data Sampling
The purposive random sampling was undertaken during a field campaign based on rice field area from Indonesia Ministry of Agriculture from 4 July to 1 August 2018, yielding 316 points. The surveyor visited the designated points to take field photos and record the rice field surface conditions such as land preparation, bare land, flooding, vegetative, reproductive, ripening, or harvested using a GPS-enabled smartphone. The designated points should have uniform and wide enough to represent the distribution of the area for reducing the mixed pixel effect [50]. An example of a field survey under various conditions is shown in Figure 5.
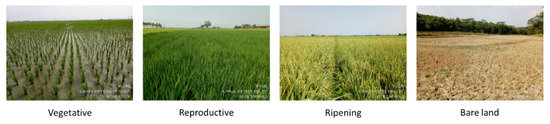
Figure 5.
The examples of rice conditions in the field campaign.
3.2. Building Classification Models
The resulting data from the field surveys were labelled into four classes: bare land, vegetative, reproductive, and ripening, and then synchronized with the PROBA-V and Sentinel-1 dataset to the closest date. Thus, the dataset was used to build a prediction model using a machine learning classifier with the caret package in the R statistical program [51,52] with leave-one-out cross-validation (LOOCV). The total dataset was divided into training (70%) and test (30%) datasets for building a training model and testing, respectively. Here, we used the Support Vector Machine (SVM) with the radial basis function kernel (SVM-RBF) classifier, which is one of the most used classifiers for solving multi-class problems developed by Vapnik [53,54] and suitable for this application due to its flexibility of high variability and complex dataset [25,55]. Additionally, Griffiths, et al. [56] suggested that SVM have high accuracy when used with a small dataset. Moreover, the previous study shows that SVM has better performance than the neural network and random forest classifier [57]. It could be used to create the automatization of rice growth stages map [39]. The SVM-RBF has two hyperparameters to increase separability between classes: Cost and Gamma, which need to be found using a grid search with initial values.
A classification model was built using the five predictors of PROBA-V bands with 223 points as a training dataset and 103 points as the test dataset. Another classification model was built using time series Sentinel-1 images. In contrast to the PROBA-V model, S-1 VH1, VH2, and VH3 images were collected from three consecutive dates as predictors to build the S-1 model. The predictor VH1 refers to the sampling date, VH2 is the previous 12-days VH data, and VH3 is the previous 24-days of VH data from the sampling date, respectively. The VH has better sensitivity to detect rice phenology than vertically emitted and vertically receiving (VV) due to cross-polarization having more signal depolarization in the rice canopy with multiple reflections [15,25].
3.3. Accuracy Assessment
The accuracy of PROBA-V and Sentinel-1 models were assessed using the comparison of predicted values from the training dataset and test dataset within pixels using the confusion matrix. The overall accuracy (OA), user’s accuracy (UA), producer’s accuracy (PA) can be calculated as suggested by Foody [58].
3.4. Integration Map of PROBA-V and Sentinel-1, and Time Series Modulator
Initially, rice growth stage maps were generated using PROBA-V, and then cloud pixels were filled with the S-1 prediction map. Consequently, time series maps were generated from the integration of both images. To increase the consistency of time series maps, a time series modulator was applied. The modulator’s work is to check whether the current map is consistent with the previous period map and correct it automatically. For example, if the previous map had a bare land class and the current map shows a ripening class, which is not consistent, the current map’s value was changed into a bare land class. This modulator also applied with ripening (the previous map)—reproductive class (the current map) and vegetative (the previous map)—ripening class (the current map).
The prediction maps for rice growth stages were overlayed with sub-district maps. The intersect maps were calculated to obtain an area of rice growth stages over a 12-day period for each sub-district (using Geographic Information System software) to compare with the local statistical records.
3.5. Cross-Correlation
The similarity between rice growth stages and rice planting and harvesting area in time series was calculated using cross-correlation. Cross-correlation allows finding the best correlation and lag days between two-time series data. The time series pair datasets are from the generated rice growth-stage maps (vegetative, reproductive, and ripening) and time series from monthly locally collected statistics (planting area and harvested) as shown in Table 1. The lag days information with correlation index shows how strong the relationship between the two classes has the same temporal pattern but at different times.

Table 1.
The five time-series pair dataset.
The cross-correlation (r) on five pair datasets can be calculated as follows [59]:
where = cross-correlation coefficient for a k period lag for x and y time series, = mean of y time series, = value of time series y on period t, = value of time series k periods before period t = mean of x time series, and are the standard deviation of the x and y time series, respectively. The p-value with the two-tailed test was also calculated using the highest correlation value on a specific range for each pair of time series.
In addition, distribution maps of the correlation and the lag time among sub-districts to show the spatial information were created to understand the spatial distribution. Moreover, the classification of correlation value can be grouped as follows: (1) high (0.6 < r ≤ 1.0), medium (0.4 < r ≤ 0.59), and low (r ≤ 0.39).
4. Results
4.1. Spectral Bands of PROBA and VH Backscattering
Figure 6a illustrates the distribution of surface reflectance of different rice growth stages. The graph shows that bare land and rice growth stages have distinctive spectral features. The bare land is significantly different from rice growth stages in the SWIR region due to its high surface reflectance, while the vegetative stage has lower values. On the other hand, reproductive and ripening phases have overly similar reflectance values.
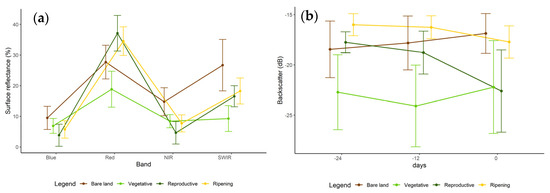
Figure 6.
(a) Spectral band of PROBA-V related to rice growth stages and (b) backscattering of VH on three consecutive dates.
The backscattering of VH signatures over three consecutive acquisitions show that the vegetative stage has the lowest value (<−22 dB) due to water scattering from wet soil [60] (Figure 6b). The reproductive stage tends to decrease from −18 to −21 dB, which is the same as the ripening phase but in the higher value range from −16 to −23 dB. Additionally, the bare land has a steady increase in backscattering value from −19 to −16 dB due to less biomass on the ground [61]. The SAR data show a larger separation between the reproductive and ripening phases than the optical data.
4.2. Accuracy of the Machine Learning Model
Table 2 shows the accuracy of rice growth stages of the PROBA-V model has higher OA (83.87%) than the Sentinel-1 model (71.74%). The majority of rice growth stages were predicted with high accuracy (>80%), except for the ripening stage with PA (50.00%) for the PROBA-V model. The UA of the ripening class shows the least accuracy than other classes.
Table 2.
The confusion matrix performance on the test dataset on PROBA-V and Sentinel-1.
On the other hand, the rice growth stages of the Sentinel-1 model shows an acceptable PA and UA (>66%) for all classes except the ripening class. The highest PA was noticed with the bare land (75.00%) and the highest UA with the reproductive stage (80.77%). The vegetative stages are more likely to overlap with bare land due to limitations of Sentinel-1 detecting the wet soil from land preparation and vegetative stage.
4.3. Rice Growth Stages Maps from the Integration of PROBA-V and Sentinel-1
Figure 7 displays the predicted maps of different rice growth stages using PROBA-V alone and Sentinel-1 alone and the integration of both sensors data. The imaging dates are 5–16 August, 17–28 August, and 29 August–9 September 2017. The PROBA-V in 5–16 August 2017 is affected by cloud cover. Thus, the rice growth stage map of Sentinel-1 can be used to fill the gap (Figure 7). The Sentinel-1 based maps have a high similarity of PROBA-V on 17–28 August 2017, which show the prediction model can estimate the rice growth stages with acceptable accuracy. However, the downside of the Sentinel-1 rice growth stage map is less sensitive to the ripening phase (Figure S4). Nonetheless, the integration of two satellites data can significantly improve data continuity of the rice growth stages every 12-days (more maps are available on Supplementary Data (Figures S1–S16)).
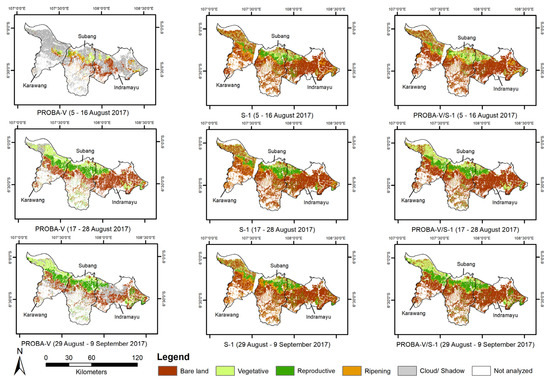
Figure 7.
Example of integration PROBA-V and Sentinel-1 image on 5–16 August 2017, 17–28 August, and 29 August–9 September 2017.
4.4. Time-Series Rice Growth Stages Area
Figure 8 shows the temporal pattern of the rice growth stage area predicted from remote sensing images. In the Indramayu regency, the bare land area increased steadily until April 2017 and then decreased. The second planting time was also captured in April–May 2017 as the vegetative stages area increased on Indramayu and Subang Regency. Conversely, the Karawang Regency had a different peak of planting time in July 2017 (Figure 8). The harvested area in the three regencies also fluctuates and is lower than the vegetative area, except for Indramayu on April–May 2018.
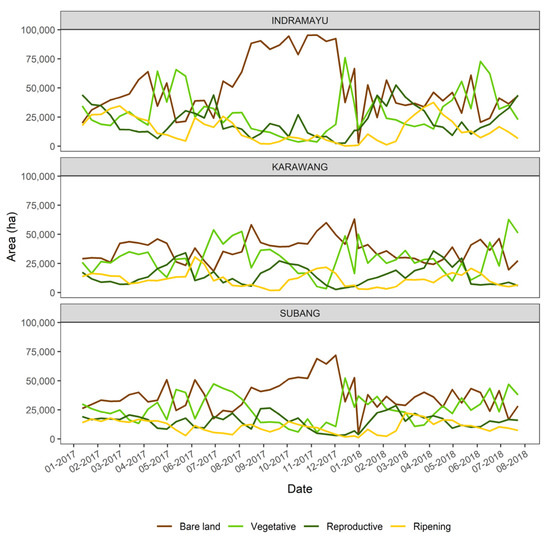
Figure 8.
The temporal area of rice growth stages for Indramayu, Karawang, and Subang Regency from 1 January–23 July 2017.
Figure 9 shows the planting and harvested area calculated from local statistics and remote sensing data (vegetative and the ripening regions). The temporal trend was closely aligned with both methods. However, remote sensing data overestimated the vegetative area, which was almost double the actual rice planting area. This phenomenon is due to double counting of the vegetative stage from flooding to maximum tillering, lasting for four months. The ripening phase also has a similarity of paddy harvested area in three regencies in February 2017, August 2017, March 2018, and May 2018. However, it has less area than the paddy harvested area due to the ripening stage during the last 30 days.
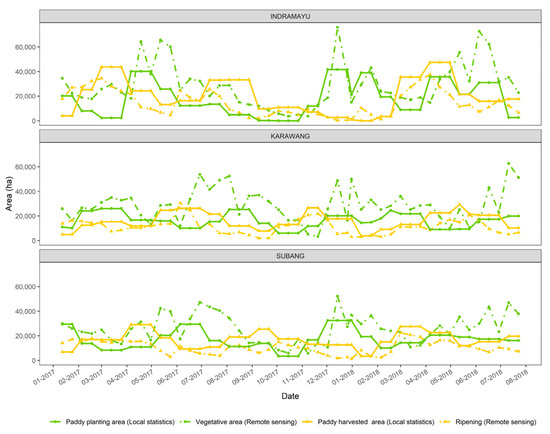
Figure 9.
The comparison of temporal rice growth stages (vegetative and ripening) with local statistics (planting and harvested area) for Indramayu, Karawang, and Subang Regency from 1 January 2017–23 July 2018.
Figure 10 shows the comparison of rice growth stages in temporal at the six sub-districts with >7000 ha. It shows that every sub-district has its unique temporal data, but some sub-districts had similar trend and cropping pattern, such as Gantar, Kroya, and Terisi in the Indramayu Regency. Those areas had a peak of planting time in April 2017, December 2017, and May 2018. On the other hand, sub-districts in Subang, such as Ciasem and Patokbeusi, had later planting times in February 2017, June 2017, January 2018, and June 2018.
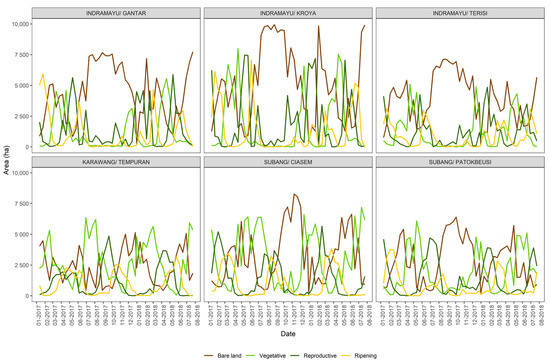
Figure 10.
The comparison of temporal rice growth stages area for six sub-districts with rice area >7000 ha on Indramayu, Karawang, and Subang Regency from 1 January 2017–23 July 2018.
Figure 11 shows the temporal comparison between vegetative and ripening stages and rice planting and harvested area in the sub-districts level. Most of the sub-district indicates that there is a temporal relationship between predicted data and observation data. There was some overlap between the rice planting area and vegetative stage in March–April 2017 on sub-districts such as Gantar, Kroya, and Terisi. Moreover, the vegetative stage peak was higher than the rice planting area, and the ripening stage also less than the rice harvested area such as Ciasem, Subang Regency. More details of each sub-district temporal plots can be seen on https://github.com/FadhlullahRamadhani/Remote-sensed-correlation-statistics/tree/master/Results_PROBA_S1/sd, accessed date: 13 April 2021.
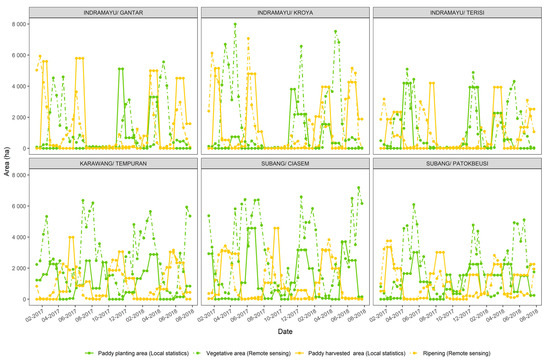
Figure 11.
The comparison of temporal rice growth stages area (vegetative and ripening) with local statistics area (planting and harvested) for six sub-districts with rice area >7000 ha on Indramayu, Karawang, and Subang Regency from 1 January 2017–23 July 2018.
4.5. Results of Cross-Correlation Analysis
Multitemporal rice growth stage maps were compared with local statistics, especially at the sub-districts level (n = 91). Figure 12a shows the correlation values of predicted values to the local statistics. The paired comparison between rice growth stages have a high correlation (>0.6), and the lag time is similar to rice cultivation time (Figure 12b). The vegetative stage area has a 5.27 day lag time with rice planting (r = 0.52, p < 0.01) and 89.47 day lag time with the harvested area (r = 0.50, p < 0.01), which is similar to the rice planting area and harvested area (Table S1). The correlation between reproductive and harvested area has a medium relationship (r = 0.57, p < 0.01) and the lag day (44.04 days), also consistent with the rice farming in the study area. However, the lag time for ripening and harvested pair is 12 days (r = 0.60, p < 0.01), which is less than the 30 days for ripening stages, indicating that the model only predicted half of the period of ripening.
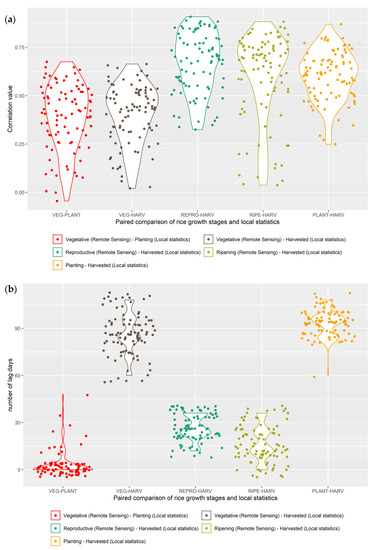
Figure 12.
The distribution of correlation value (a) and lag (b) from temporal analysis of rice growth stages and local statistics with jitters position.
Most of the sub-districts have high correlation values such as Cikedung, Cilamaya Wetan, and Cipunagara (r > 0.7, p < 0.01). Nevertheless, some sub-districts have the least correlation value such as Gantar, Klari, and Cipeundeuy (r < 0.3, p > 0.05) (Table S1).
Figure 13 shows the map of the correlation coefficient’s distribution in the study area from cross-correlation analysis. It shows that most of the north of the study area has a high to medium correlation for five paired time-series, especially reproductive–harvested and ripening–harvested pair. Moreover, many sub-districts have more high correlation value on the three pair dataset, such as the reproductive–harvested, ripening–harvested, and planting–harvested dataset. However, the south part of Subang Regency has the lowest correlation for all comparison except the planting–harvested stage area, especially Cijambe, Cisalak, Ciater, Kasomalang, Jalancagak, Sagalherang, and Serapanjang sub-district.
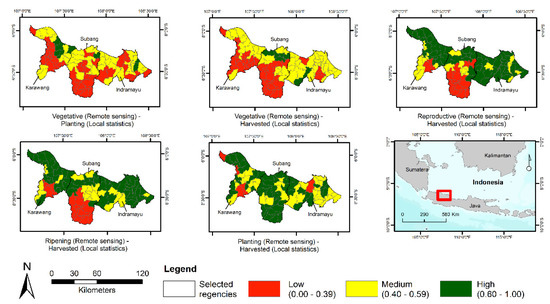
Figure 13.
Distribution map of correlation value from cross-correlation analysis in sub-district level for Indramayu, Karawang, and Subang Regency.
The distribution map of lag time for three regencies is illustrated in Figure 14. The lag time for vegetative–planting is well distributed through three regencies with a lag time of 0–12 days. The distribution of lag days on vegetative–the harvested area is also similar to the distribution of local statistics (96–108 days). Only seven sub-districts are less than 72 days, particularly the Cikampek sub-district.
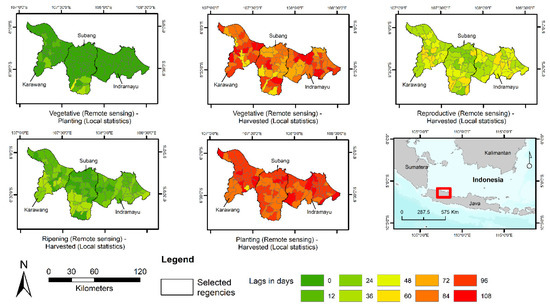
Figure 14.
Distribution map of lag time from cross-correlation analysis in sub-district level for Indramayu, Karawang, and Subang Regency.
However, other comparisons have varied lag days, indicating the variability of the relationship between rice growth stages and local statistics tabulation. For example, the reproductive stage—harvested area pair has a varied lag time (24–60 days), where it should be around 45–60 days. Moreover, some inconsistency in lag time (0–12 days) in the reproductive stage—the harvested area should be 24–36 days in 15 subdistricts, mainly located north of Karawang and Subang.
5. Discussion
This study has demonstrated the capability to integrate PROBA-V and Sentinel-1 satellite images to produce a cloud-free multitemporal map from 1 July 2017–23 July 2018. The approach was one solution to increase data availability, certainty, and consistency compared with the locally-derived statistics. The integration approach between optical and radar sensor has been demonstrated to increase the accuracy and data accessibility in other studies [39,62]. The radar sensor can generate maps in the wet season when the optical sensor failed to provide the required information. However, the accuracy of the Sentinel-1 model in the dry season is lower than the wet season due to scattering on dry land being indistinct from the vegetative stage, especially in July–August on the north of Subang and Indramayu regencies. Conversely, the PROBA-V model will give a more accurate result on the dry season, which has less cloud.
The results of this study show the integration of PROBA-V and Sentinel-1 can be one alternative to deliver rice growth stage maps in the near-real-time with high accuracy of each rice growth stage models with cloud-free data, compared with a previous study [57]. Figure 15 shows the fluctuation of the composition of the integration of two sensors. It illustrates that PROBA-V based maps have >60% in the dry season (April–September), and Sentinel-1’s rice growth stages maps are more dominant in the wet season (January–February, and October–December). The advantage of fusion at the decision level is an easily implemented monitoring system than pixel-level or features-level fusion, which required pixel co-registration and high memory requirements [63].
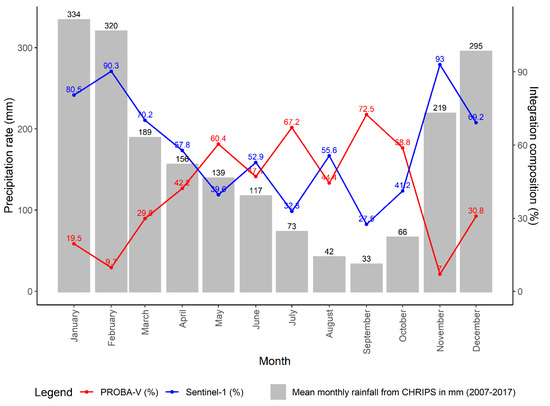
Figure 15.
The monthly average sensor’s composition is based on clear images from 1 January 2017–23 July 2018.
The correlation analysis on the sub-districts level shows a high similarity of the vegetative—harvested area from generated maps with planting—harvested area (Figure 12b). Other similarities also applied to vegetative—planting area and reproductive—harvested area. However, the pair of ripening and harvested areas with low similarity may be due to remote sensing maps failing to capture the harvested area in a specific time. The other explanation is that the many farmers are still harvested with manual labor, only cut half of the rice canopy to get the grain rather than all rice stem with a combined harvester, leading to false classification to ripening class in the model.
Moreover, the correlation value distribution map shows that south of Subang Regency has low correlation values (Figure 13). Based on the ground truth, the low correlation between those areas is due to different irrigation schemes with the north Subang Regency. The south of Subang Regency is mostly a rainfall-dependent area where the model can have false classification predominantly vegetative with bare land class and ripening to bare land. Moreover, the rice area on those areas is small patches in the valley or hillside where remote sensing area is difficult to capture due to interference with other canopies, such as trees on Sentinel-1 and limited pixel resolution PROBA-V.
Nevertheless, our rice growth stage maps are similar to previous studies on the north of West Java island, where rice cultivation season starts from the south of the Indramayu region in September and end on the north of Karawang Regency February [27]. Moreover, Sianturi, Jetten and Sartohadi [26] investigated that the north of the study area is prone to flood due to sea-level rise every wet season.
Our study can be compared with the work of Rudiyanto, Minasny, Shah, Che Soh, Arif and Indra Setiawan [27] using time-series Sentinel-1 data with the unsupervised method to produce rice area and monthly rice growth stages area in the same study location. The advantage of their work on rice growth stage maps is the ability to distinguish secondary non-rice patterns where our study assumed that all crop cultivation on the area is rice cultivation. However, this proposed method indicates the simplicity of the implementation classification procedure. It can be used for the near-real-time application due to high accuracy in two rice growth stage models where their work depends on local knowledge expertise. The temporal resolution of our study is 12-days, representing a significant improvement compared to Rudiyanto, Minasny, Shah, Che Soh, Arif and Indra Setiawan [27], which have a monthly period. A shorter period is preferred by stakeholders as the rice cultivation period is a short duration farming, and where the change of rice growth stages is imminent and easy to verify, it can also be complemented with crop modeling to produce rice production estimation [64].
The overall result of the present work shows that a 100 m spatial and 12-day temporal resolution period can be one of the methods for filling the data gap with other information that has been available from MODIS (250 m, 16 days revisited time), Landsat-8 OLI (30 m, 16 days revisited time), and Sentinel-2 (10 m, five days revisited time). The three mentioned methods have difficulties compared with the existing local statistics data due to cloud interference in temporal space.
This study proved that remote sensing data obtained from multiple platforms could have a beneficial impact on the prediction model accuracies (Table 2). Therefore, it can be integrated into rice growth stage mapping efforts from regional to country scales. Our methodology can be evaluated and deployed elsewhere, with other crops using new training and test datasets. The source code can be viewed on https://github.com/FadhlullahRamadhani/Remote-sensed-correlation-statistics, accessed date: 01 April 2021. Additionally, the machine learning classifier can be changed to deep learning classifiers where previous studies may increase the accuracy and the speed of image processing [65,66,67,68].
Despite the positive result of this study, some limitations need to be acknowledged in the future. The overall accuracy still depends on the capability and size of the ground-truthing data. The classification error could be caused by the presence of mixed pixels, where some regions commonly grow two-three crops at a time. Another limitation is the official rice field area which we used as the masking area, may not be accurate in some areas, especially in the Karawang Regency, where it has a high land-use change frequency [69]. In the future, this study can be combined with a scene-based classification of rice areas using an area sampling framework to increase the accuracy of the machine learning model, thus increasing the consistency over time [70]. Furthermore, the climate can shift the cropping pattern to some extent where the farmer is unable to cultivate rice in a few years, especially in strong El-Nino season [71].
6. Conclusions
The rice production stakeholders for the public and private sectors need accurate information to provide supply and trade information efficiently. In this paper, we have developed a cloud-free method of mapping rice growth stages with a spatial resolution of 100 m and a 12-day periodic time with a high correlation with local statistics, making the outputs more likely to be utilized by the agriculture stakeholder due to acceptable accuracy. Additionally, this method can be implemented or combined in near-real-time and automatic rice monitoring system such as S-2 RGS to fill the missing information.
This project was developed to increase the crop information availability of the Indonesian Ministry of agriculture to provide better information for more reliable policy, especially for climate change adaptation and mitigation action planning. In the future, the integration of multiple sensors (MODIS, PROBA-V, Landsat-8 OLI, Sentinel-1, Sentinel-2, or Sentinel-3) with different resolution data can be applied to provide a cloud-free map for rice production or other crops. Moreover, the application development in the GEE environment is a preferable option due to the free, fast, and less infrastructure needed to download the images, analyses processing, and information dissemination. The future launch of Landsat 9, Sentinel-1 C and D, and freely available satellite data such as Hyperspectral Precursor of the Application Mission (PRISMA) can be used to increase data volume and variety, especially for the countries prone to crop failure due to natural climate variability and extreme weather events.
Supplementary Materials
The following are available online at https://www.mdpi.com/article/10.3390/rs13081498/s1, Table S1: The cross-correlation between rice growth stage areas (vegetative, reproductive, and ripening) and local statistics (rice planting and harvested area). Figures S1–S16: The rice growth stage maps from PROBA-V, Sentinel-1, and the integration of PROBA-V and Sentinel-1 on 47 periods from 1–12 January 2017 to 12–23 July 2018.
Author Contributions
Conceptualization: F.R. and R.P., investigation: F.R. and R.P., data curation: F.R., formal analysis: F.R., methodology: F.R. and R.P., software: F.R., visualization: F.R. and G.K., and writing—original draft preparation: F.R., writing—review and editing: R.P, G.K. and J.P., and supervision: R.P., G.K. and J.P. All authors have read and agreed to the published version of the manuscript.
Funding
This research was funded by the Sustainable Management of Agricultural Research and Technology Dissemination scholarship from the Indonesian Ministry of Agriculture.
Institutional Review Board Statement
Not applicable.
Informed Consent Statement
Not applicable.
Data Availability Statement
The source codes and scripts used in this study are freely available from https://github.com/FadhlullahRamadhani/Remote-sensed-correlation-statistics, accessed on 13 April 2021.
Acknowledgments
Indonesia Ministry of Agriculture through the Indonesian Centre for Agricultural Land Resources Research and Development (ICALRRD) to provide high resolution of the official rice area on the study area. Authors also acknowledge the local agriculture data from Agriculture Division on Karawang, Subang, and Indramayu, Misnawati for data tabulation, and M. Ronal Koswara for fieldwork.
Conflicts of Interest
The authors declare no conflict of interest.
References
- Normile, D. Reinventing Rice to Feed the World. Science 2008, 321, 330. [Google Scholar] [CrossRef]
- FAO: Food Agriculture Organization. FAOSTAT Citation Database Results; FAO: Rome, Italy, 1997. [Google Scholar]
- Parry, M.; Rosenzweig, C.; Livermore, M. Climate change, global food supply and risk of hunger. Philos. Trans. R. Soc. B Biol. Sci. 2005, 360, 2125–2138. [Google Scholar] [CrossRef]
- Van der Velde, M.; Bareuth, B. A quality assessment of the MARS crop yield forecasting system for the European Union. In Proceedings of the European Geosciences Union General Assembly 2015, Vienna, Austria, 12–17 April 2015. [Google Scholar]
- De Boissezon, H. Rapid estimates of acreage and potential yield in the European Union. In Proceedings of the Workshop for the Central and Eastern Europe on: Agrometereological Models: Theory and Applications in the MARS Project, Ispra, Italy, 21–25 November 1994. [Google Scholar]
- Whitcraft, A.; Becker-Reshef, I.; Justice, C. A Framework for Defining Spatially Explicit Earth Observation Requirements for a Global Agricultural Monitoring Initiative (GEOGLAM). Remote Sens. 2015, 7, 1461–1481. [Google Scholar] [CrossRef]
- Wu, B.; Meng, J.; Li, Q.; Yan, N.; Du, X.; Zhang, M. Remote sensing-based global crop monitoring: Experiences with China’s CropWatch system. Int. J. Digit. Earth 2014, 7, 113–137. [Google Scholar] [CrossRef]
- Phung, H.-P.; Nguyen, L.-D.; Nguyen-Huy, T.; Le-Toan, T.; Apan, A. Monitoring rice growth status in the Mekong Delta, Vietnam using multitemporal Sentinel-1 data. J. Appl. Remote Sens. 2020, 14, 014518. [Google Scholar] [CrossRef]
- Mansaray, L.R.; Wang, F.; Kanu, A.S.; Yang, L.; Mansaray, L.R.; Wang, F.; Kanu, A.S.; Yang, L. Evaluating Sentinel-1A datasets for rice leaf area index estimation based on machine learning regression models. Geocarto Int. 2020, 1–12. [Google Scholar] [CrossRef]
- Jo, H.-W.; Lee, S.; Park, E.; Lim, C.-H.; Song, C.; Lee, H.; Ko, Y.; Cha, S.; Yoon, H.; Lee, W.-K. Deep Learning Applications on Multitemporal SAR (Sentinel-1) Image Classification Using Confined Labeled Data: The Case of Detecting Rice Paddy in South Korea. IEEE Trans. Geosci. Remote Sens. 2020, 58, 7589–7601. [Google Scholar] [CrossRef]
- Inoue, S.; Ito, A.; Yonezawa, C. Mapping Paddy Fields in Japan by Using a Sentinel-1 SAR Time Series Supplemented by Sentinel-2 Images on Google Earth Engine. Remote Sens. 2020, 12, 1622. [Google Scholar] [CrossRef]
- Wakabayashi, H.; Motohashi, K.; Kitagami, T.; Tjahjono, B.; Dewayani, S.; Hidayat, D.; Hongo, C. Flooded area extraction of rice paddy field in Indonesia using Sentinel-1 SAR data. Int. Arch. Photogramm. Remote Sens. Spat. Inf. Sci. 2019, XLII-3/W7, 73–76. [Google Scholar] [CrossRef]
- Bazzi, H.; Baghdadi, N.; El Hajj, M.; Zribi, M.; Minh, D.H.T.; Ndikumana, E.; Courault, D.; Belhouchette, H. Mapping paddy rice using Sentinel-1 SAR time series in Camargue, France. Remote Sens. 2019, 11, 887. [Google Scholar] [CrossRef]
- Lasko, K.; Vadrevu, K.P.; Tran, V.T.; Justice, C. Mapping Double and Single Crop Paddy Rice with Sentinel-1A at Varying Spatial Scales and Polarizations in Hanoi, Vietnam. IEEE J. Sel. Top. Appl. Earth Obs. Remote Sens. 2018, 11, 498–512. [Google Scholar] [CrossRef]
- Nguyen, D.B.; Gruber, A.; Wagner, W. Mapping rice extent and cropping scheme in the Mekong Delta using Sentinel-1A data. Remote Sens. Lett. 2016, 7, 1209–1218. [Google Scholar] [CrossRef]
- Satalino, G.; Balenzano, A.; Mattia, F. Sentinel-1 SAR Data for Mapping Agricultural Crops Not Dominated by Volume Scattering. In Proceedings of the 2012 IEEE International Geoscience and Remote Sensing Symposium, Munich, Germany, 22–27 July 2012; pp. 6801–6804. [Google Scholar]
- Mandal, D.; Kumar, V.; Bhattacharya, A.; Rao, Y.S.; Siqueira, P.; Bera, S. Sen4Rice: A Processing Chain for Differentiating Early and Late Transplanted Rice Using Time-Series Sentinel-1 SAR Data With Google Earth Engine. IEEE Geosci. Remote Sens. Lett. 2018, 15, 1947–1951. [Google Scholar] [CrossRef]
- Yuzugullu, O.; Erten, E.; Hajnsek, I. Rice Growth Monitoring by Means of X-Band Co-polar SAR: Feature Clustering and BBCH Scale. IEEE Geosci. Remote Sens. Lett. 2015, 12, 1218–1222. [Google Scholar] [CrossRef]
- Koppe, W.; Gnyp, M.L.; Hütt, C.; Yao, Y.; Miao, Y.; Chen, X.; Bareth, G. Rice monitoring with multi-temporal and dual-polarimetric TerraSAR-X data. Int. J. Appl. Earth Obs. Geoinf. 2013, 21, 568–576. [Google Scholar] [CrossRef]
- Zhang, Y.; Yang, B.; Liu, X.; Wang, C. Estimation of rice grain yield from dual-polarization Radarsat-2 SAR data by integrating a rice canopy scattering model and a genetic algorithm. Int. J. Appl. Earth Obs. Geoinf. 2017, 57, 75–85. [Google Scholar] [CrossRef]
- Li, K.; Brisco, B.; Yun, S.; Touzi, R. Polarimetric decomposition with RADARSAT-2 for rice mapping and monitoring. Can. J. Remote Sens. 2012, 38, 169–179. [Google Scholar] [CrossRef]
- Wu, F.; Wang, C.; Zhang, H.; Zhang, B.; Tang, Y. Rice Crop Monitoring in South China With RADARSAT-2 Quad-Polarization SAR Data. IEEE Geosci. Remote Sens. Lett. 2011, 8, 196–200. [Google Scholar] [CrossRef]
- Zhang, G.; Xiao, X.; Dong, J.; Xin, F.; Zhang, Y.; Qin, Y.; Doughty, R.B.; Moore, B. Fingerprint of rice paddies in spatial–temporal dynamics of atmospheric methane concentration in monsoon Asia. Nat. Commun. 2020, 11. [Google Scholar] [CrossRef] [PubMed]
- Mascolo, L.; Forino, G.; Nunziata, F.; Pugliano, G.; Migliaccio, M. A New Methodology for Rice Area Monitoring with COSMO-SkyMed HH-VV PingPong Mode SAR Data. IEEE J. Sel. Top. Appl. Earth Obs. Remote Sens. 2019, 12, 1076–1084. [Google Scholar] [CrossRef]
- Son, N.-T.; Chen, C.-F.; Chen, C.-R.; Minh, V.-Q. Assessment of Sentinel-1A data for rice crop classification using random forests and support vector machines. Geocarto Int. 2017, 1–15. [Google Scholar] [CrossRef]
- Sianturi, R.; Jetten, V.G.; Sartohadi, J. Mapping cropping patterns in irrigated rice fields in West Java: Towards mapping vulnerability to flooding using time-series MODIS imageries. Int. J. Appl. Earth Obs. Geoinf. 2018, 66, 1–13. [Google Scholar] [CrossRef]
- Rudiyanto; Minasny, B.; Shah, R.M.; Che Soh, N.; Arif, C.; Indra Setiawan, B. Automated Near-Real-Time Mapping and Monitoring of Rice Extent, Cropping Patterns, and Growth Stages in Southeast Asia Using Sentinel-1 Time Series on a Google Earth Engine Platform. Remote Sens. 2019, 11, 1666. [Google Scholar] [CrossRef]
- Nelson, A.; Setiyono, T.; Rala, A.; Quicho, E.; Raviz, J.; Abonete, P.; Maunahan, A.; Garcia, C.; Bhatti, H.; Villano, L.; et al. Towards an Operational SAR-Based Rice Monitoring System in Asia: Examples from 13 Demonstration Sites across Asia in the RIICE Project. Remote Sens. 2014, 6, 10773–10812. [Google Scholar] [CrossRef]
- Holecz, F.; Barbieri, M.; Collivignarelli, F.; Gatti, L.; Nelson, A.; Setiyono, T.D.; Boschetti, M.; Manfron, G.; Brivio, P.A.; Quilang, E.J.; et al. An Operational Remote Sensing Based Service for Rice Production Estimation at National Scale. ESA Living Planet Symp. 2013. [Google Scholar] [CrossRef]
- Yang, X.; Chen, Y.; Wang, J. Combined use of Sentinel-2 and Landsat 8 to monitor water surface area dynamics using Google Earth Engine. Remote Sens. Lett. 2020, 11, 687–696. [Google Scholar] [CrossRef]
- Liu, L.; Xiao, X.; Qin, Y.; Wang, J.; Xu, X.; Hu, Y.; Qiao, Z. Mapping cropping intensity in China using time series Landsat and Sentinel-2 images and Google Earth Engine. Remote Sens. Environ. 2020, 239, 111624. [Google Scholar] [CrossRef]
- Perbet, P.; Fortin, M.; Ville, A.; Béland, M. Near real-time deforestation detection in Malaysia and Indonesia using change vector analysis with three sensors. Int. J. Remote Sens. 2019, 40, 7439–7458. [Google Scholar] [CrossRef]
- Cai, Y.; Lin, H.; Zhang, M. Mapping paddy rice by the object-based random forest method using time series Sentinel-1/Sentinel-2 data. Adv. Space Res. 2019, 64, 2233–2244. [Google Scholar] [CrossRef]
- Mansaray, L.; Huang, W.; Zhang, D.; Huang, J.; Li, J. Mapping Rice Fields in Urban Shanghai, Southeast China, Using Sentinel-1A and Landsat 8 Datasets. Remote Sens. 2017, 9, 257. [Google Scholar] [CrossRef]
- Tian, H.; Wu, M.; Wang, L.; Niu, Z. Mapping early, middle and late rice extent using Sentinel-1A and Landsat-8 data in the poyang lake plain, China. Sensors 2018, 18, 185. [Google Scholar] [CrossRef]
- Shimabukuro, Y.E.; Ieee, S.; Arai, E.; Duarte, V.; Dutra, A.C. Discriminating Land Use and Land Cover Classes in Brazil Based on the Annual PROBA-V 100 m Time Series. IEEE J. Sel. Top. Appl. Earth Obs. Remote Sens. 2020. [Google Scholar] [CrossRef]
- Bórnez, K.; Descals, A.; Verger, A.; Peñuelas, J. Land surface phenology from VEGETATION and PROBA-V data. Assessment over deciduous forests. Int. J. Appl. Earth Obs. Geoinf. 2020, 84, 101974. [Google Scholar] [CrossRef]
- PUSDATIN. Manual of SIMOTANDI application (in Indonesian). Available online: http://sig.pertanian.go.id/pdf/Pedoman_Pemanfaatan_Aplikasi%20_Simotandi.pdf (accessed on 28 March 2019).
- Ramadhani, F.; Pullanagari, R.; Kereszturi, G.; Procter, J. Automatic Mapping of Rice Growth Stages Using the Integration of SENTINEL-2, MOD13Q1, and SENTINEL-1. Remote Sens. 2020, 12, 3613. [Google Scholar] [CrossRef]
- Bouman, B. Rice Knowledge Bank. Available online: www.knowledgebank.irri.org (accessed on 20 July 2019).
- Kawamura, K.; Ikeura, H.; Phongchanmaixay, S.; Khanthavong, P. Canopy Hyperspectral Sensing of Paddy Fields at the Booting Stage and PLS Regression can Assess Grain Yield. Remote Sens. 2018, 10, 1249. [Google Scholar] [CrossRef]
- BPS-West-Java. West Java Province in Figures 2018; Statistics of West Java Agency: Bandung, West Java, Indonesia, 2018. [Google Scholar]
- Kottek, M.; Grieser, J.; Beck, C.; Rudolf, B.; Rubel, F. World Map of the Köppen-Geiger climate classification updated. Meteorol. Z. 2006, 15, 259–263. [Google Scholar] [CrossRef]
- Meroni, M.; Fasbender, D.; Balaghi, R.; Dali, M.; Haffani, M.; Haythem, I.; Hooker, J.; Lahlou, M.; Lopez-Lozano, R.; Mahyou, H.; et al. Evaluating NDVI Data Continuity Between SPOT-VEGETATION and PROBA-V Missions for Operational Yield Forecasting in North African Countries. IEEE Trans. Geosci. Remote Sens. 2016, 54, 795–804. [Google Scholar] [CrossRef]
- Sterckx, S.; Benhadj, I.; Duhoux, G.; Livens, S.; Dierckx, W.; Goor, E.; Adriaensen, S.; Heyns, W.; Van Hoof, K.; Strackx, G.; et al. The PROBA-V mission: Image processing and calibration. Int. J. Remote Sens. 2014, 35, 2565–2588. [Google Scholar] [CrossRef]
- Lee, J.-S. Refined filtering of image noise using local statistics. Comput. Graph. Image Process. 1981, 15, 380–389. [Google Scholar] [CrossRef]
- Dinas Pertanian, K.I. Rice Statistics in Indramayu Regency (in Bahasa Indonesia); Dinas Pertanian Kab. Indramayu: Indramayu, Indonesia, 2018. [Google Scholar]
- Dinas Pertanian, K.K. Rice Statistics in Karawang Regency (in Bahasa Indonesia); Dinas Pertanian Kab. Karawang: Karawang, Indonesia, 2018. [Google Scholar]
- Dinas Pertanian, K.S. Rice Statistics in Subang Regency (in Bahasa Indonesia); Dinas Pertanian Kab. Subang: Subang, Indonesia, 2018. [Google Scholar]
- Pi-Fuei, H.; Lee, L.C.; Nai-Yu, C. Effect of spatial resolution on classification errors of pure and mixed pixels in remote sensing. IEEE Trans. Geosci. Remote Sens. 2001, 39, 2657–2663. [Google Scholar] [CrossRef]
- R Core Team. R: A Language and Environment for Statistical Computing; R Foundation for Statistical Computing: Vienna, Austria, 2017. [Google Scholar]
- Kuhn, M. Building Predictive Models in R Using the caret Package. J. Stat. Softw. 2008, 28, 26. [Google Scholar] [CrossRef]
- Guyon, I.; Vapnik, V.; Boser, B.; Bottou, L.; Solla, S.A. Capacity control in linear classifiers for pattern recognition. In Proceedings of the 11th IAPR International Conference on Pattern Recognition. Vol.II. Conference B: Pattern Recognition Methodology and Systems, The Hague, The Netherlands, 30 August–3 September 1992; 1992; Volume 2, pp. 385–388. [Google Scholar]
- Cortes, C.; Vapnik, V. Support-Vector Networks. Mach. Learn. 1995, 20, 273–297. [Google Scholar] [CrossRef]
- Onojeghuo, A.O.; Blackburn, G.A.; Wang, Q.; Atkinson, P.M.; Kindred, D.; Miao, Y. Mapping paddy rice fields by applying machine learning algorithms to multi-temporal Sentinel-1A and Landsat data. Int. J. Remote Sens. 2018, 39, 1042–1067. [Google Scholar] [CrossRef]
- Griffiths, P.; Hostert, P.; Gruebner, O.; der Linden, S.v. Mapping megacity growth with multi-sensor data. Remote Sens. Environ. 2010, 114, 426–439. [Google Scholar] [CrossRef]
- Ramadhani, F.; Pullanagari, R.; Kereszturi, G.; Procter, J. Mapping of rice growth phases and bare land using Landsat-8 OLI with machine learning. Int. J. Remote Sens. 2020, 41, 8428–8452. [Google Scholar] [CrossRef]
- Foody, G.M. Status of land cover classification accuracy assessment. Remote Sens. Environ. 2002, 80, 185–201. [Google Scholar] [CrossRef]
- Holmes, E.; Ward, E. Applied Time Series Analysis for Fisheries and Environmental Sciences; NOAA Fisheries: Seattle, WA, USA, 2019. [Google Scholar]
- Liu, Y.; Chen, K.; Xu, P.; Li, Z. Modeling and Characteristics of Microwave Backscattering From Rice Canopy Over Growth Stages. IEEE Trans. Geosci. Remote Sens. 2016, 54, 6757–6770. [Google Scholar] [CrossRef]
- Soo Chin, L.; Suan-Pheng, K.; To-Phuc, T.; Ping, C.; Vo Quang, M.; Hock, L. Application of multitemporal ERS-2 synthetic aperture radar in delineating rice cropping systems in the Mekong River Delta, Vietnam. IEEE Trans. Geosci. Remote Sens. 1998, 36, 1412–1420. [Google Scholar] [CrossRef]
- Roy, D.P.; Huang, H.; Boschetti, L.; Giglio, L.; Yan, L.; Zhang, H.H.; Li, Z. Landsat-8 and Sentinel-2 burned area mapping—A combined sensor multi-temporal change detection approach. Remote Sens. Environ. 2019, 231, 111254. [Google Scholar] [CrossRef]
- Ghassemian, H. A review of remote sensing image fusion methods. Inf. Fusion 2016, 32, Part A. 75–89. [Google Scholar] [CrossRef]
- Arumugam, P.; Chemura, A.; Schauberger, B.; Gornott, C. Near Real-Time Biophysical Rice (Oryza sativa L.) Yield Estimation to Support Crop Insurance Implementation in India. Agronomy 2020, 10, 1674. [Google Scholar] [CrossRef]
- Cao, R.; Tu, W.; Yang, C.; Li, Q.; Liu, J.; Zhu, J.; Zhang, Q.; Li, Q.; Qiu, G. Deep learning-based remote and social sensing data fusion for urban region function recognition. ISPRS J. Photogramm. Remote Sens. 2020, 163, 82–97. [Google Scholar] [CrossRef]
- Chen, Y.; Li, C.; Ghamisi, P.; Jia, X.; Gu, Y. Deep fusion of remote sensing data for accurate classification. IEEE Geosci. Remote Sens. Lett. 2017, 14, 1253–1257. [Google Scholar] [CrossRef]
- Ndikumana, E.; Minh, D.H.T.; Baghdadi, N.; Courault, D.; Hossard, L. Deep recurrent neural network for agricultural classification using multitemporal SAR Sentinel-1 for Camargue, France. Remote Sens. 2018, 10, 1217. [Google Scholar] [CrossRef]
- Zhu, H.; Ma, W.; Li, L.; Jiao, L.; Yang, S.; Hou, B. A Dual–Branch Attention fusion deep network for multiresolution remote–Sensing image classification. Inf. Fusion 2020, 58, 116–131. [Google Scholar] [CrossRef]
- Franjaya, E.E.; Syartinilia; Setiawan, Y. Monitoring of landscape change in paddy fields: Case study of Karawang District—West Java Province. IOP Conf. Ser. Earth Environ. Sci. 2017, 54, 012016. [Google Scholar] [CrossRef]
- Gandharum, L.; Mulyani, M.E.; Hartono, D.M.; Karsidi, A.; Ahmad, M. Remote sensing versus the area sampling frame method in paddy rice acreage estimation in Indramayu regency, West Java province, Indonesia. Int. J. Remote Sens. 2021, 42, 1738–1767. [Google Scholar] [CrossRef]
- Surmaini, E.; Hadi, T.W.; Subagyono, K.; Puspito, N.T. Early detection of drought impact on rice paddies in Indonesia by means of Niño 3.4 index. Theor. Appl. Climatol. 2015, 121, 669–684. [Google Scholar] [CrossRef]


Publisher’s Note: MDPI stays neutral with regard to jurisdictional claims in published maps and institutional affiliations. |
© 2021 by the authors. Licensee MDPI, Basel, Switzerland. This article is an open access article distributed under the terms and conditions of the Creative Commons Attribution (CC BY) license (https://creativecommons.org/licenses/by/4.0/).