National Mapping of New Zealand Pasture Productivity Using Temporal Sentinel-2 Data
Abstract
1. Introduction
2. Materials and Methods
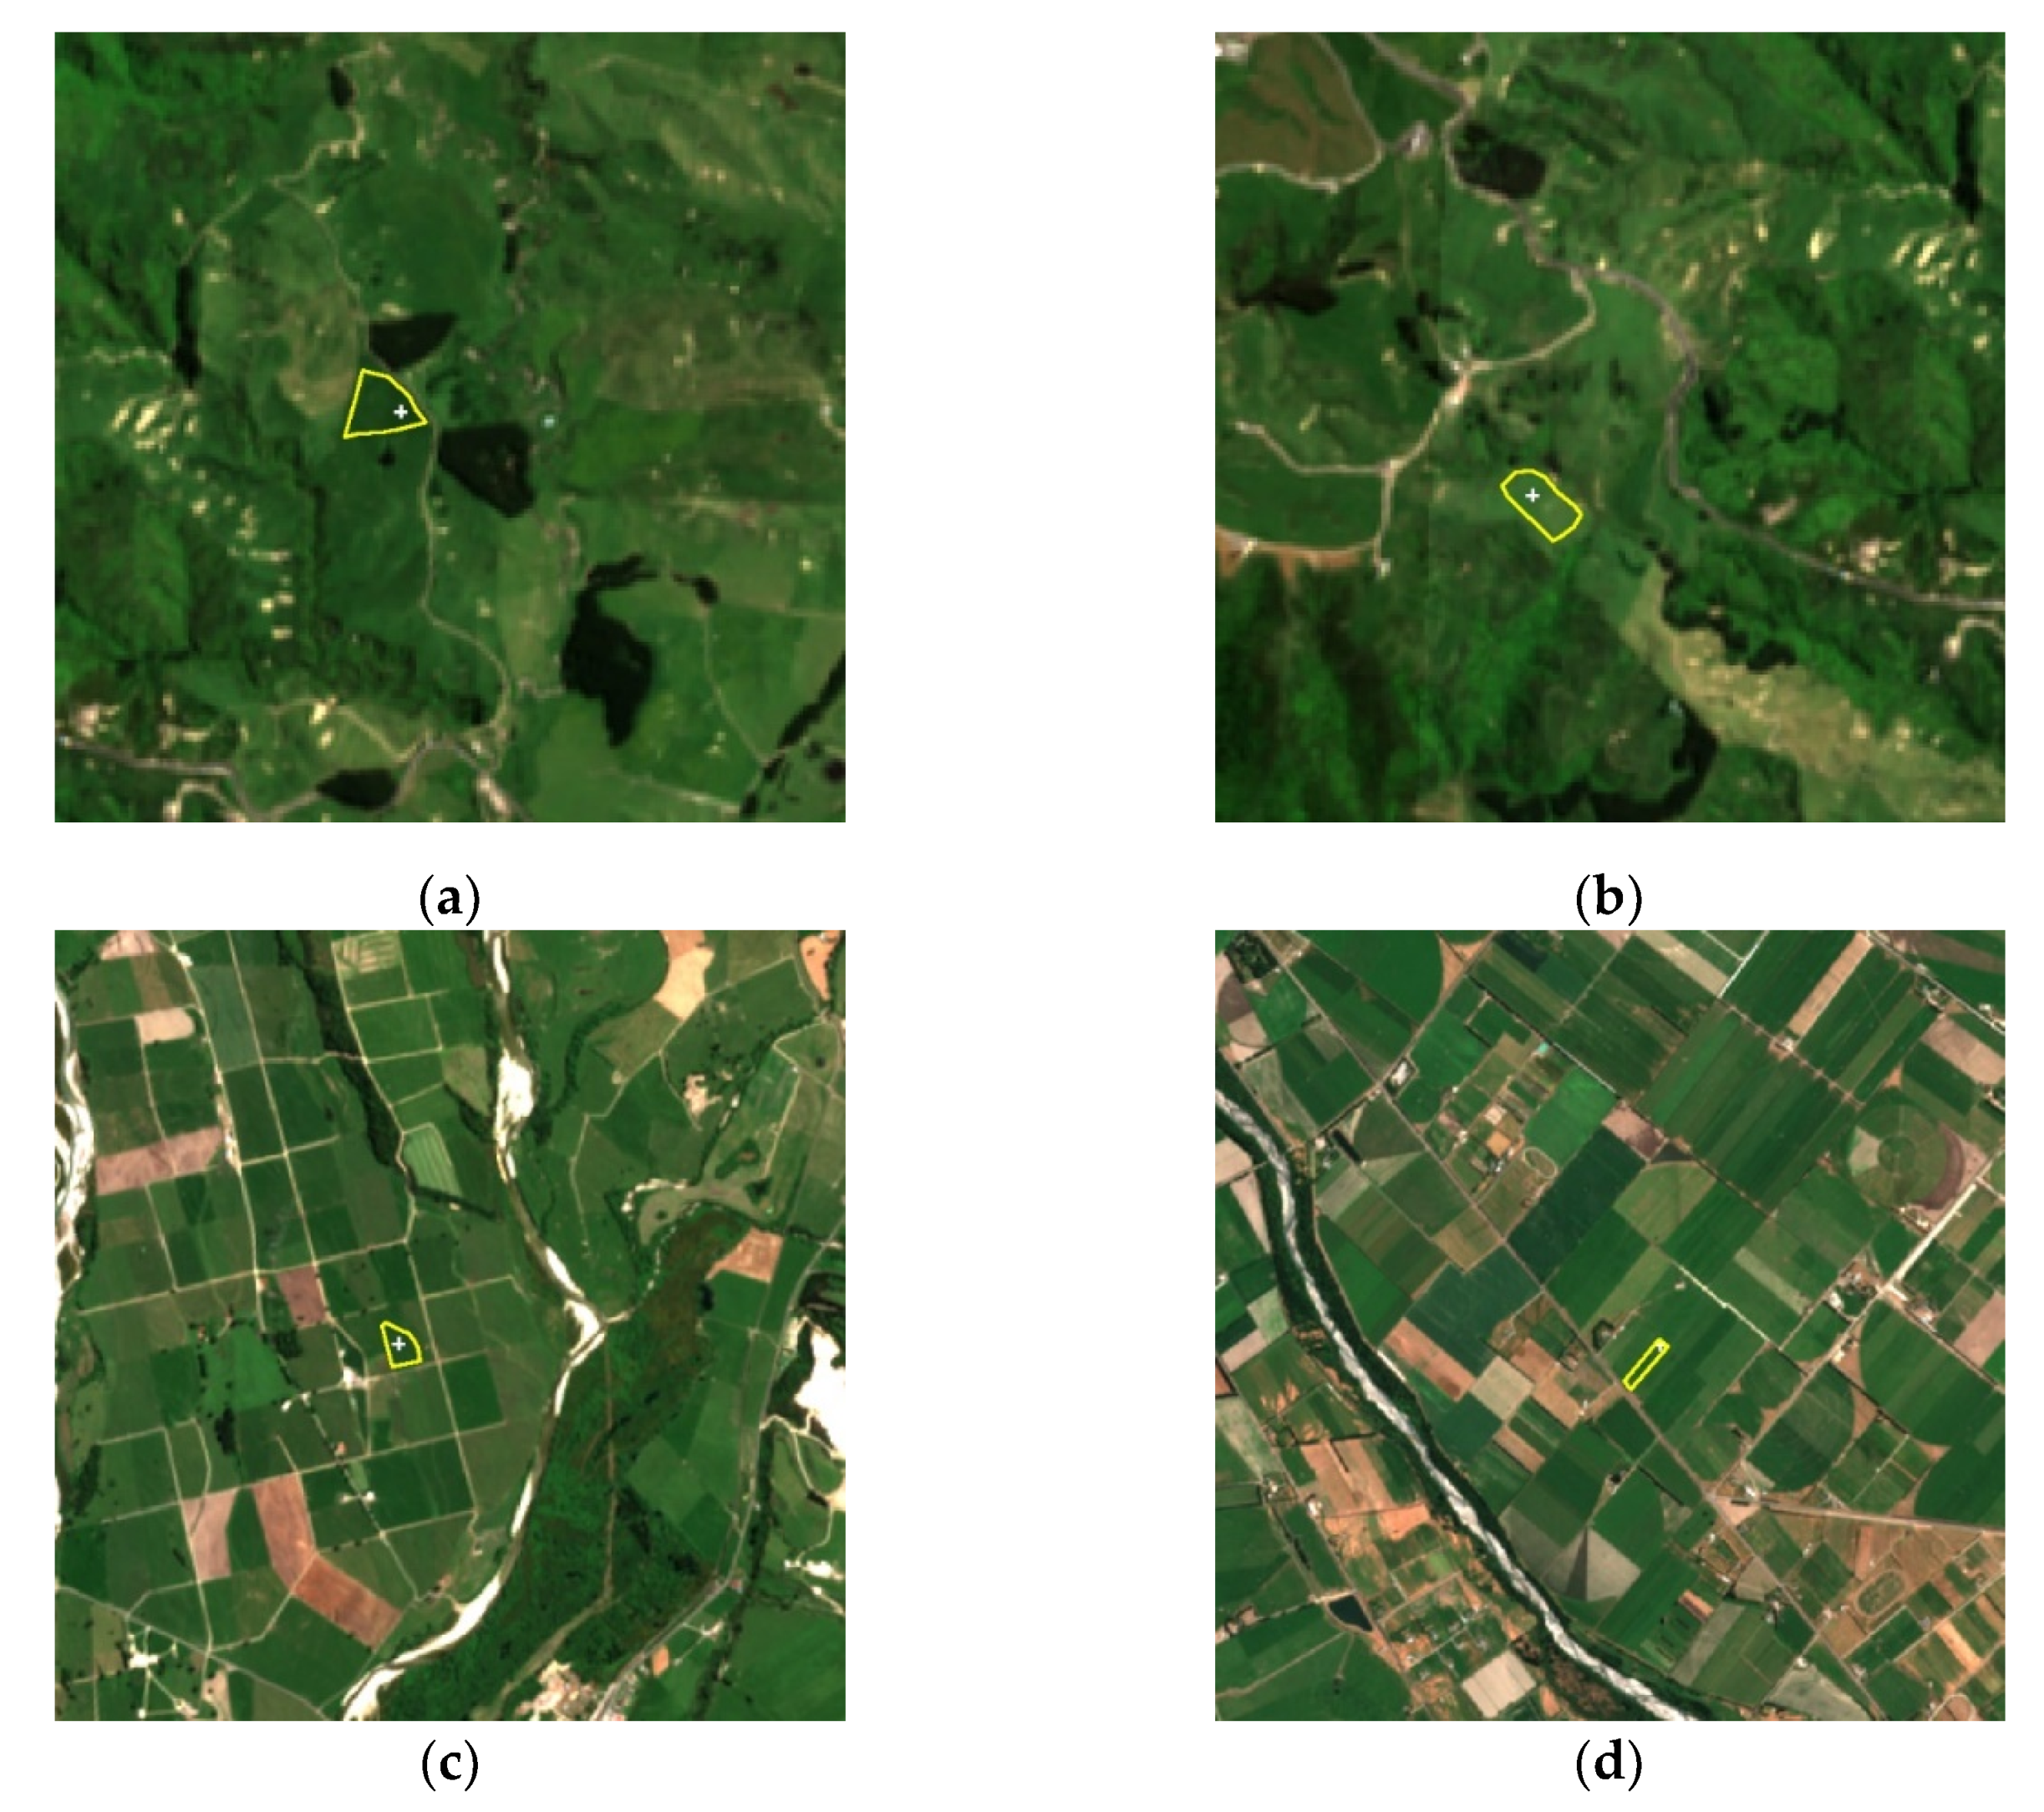
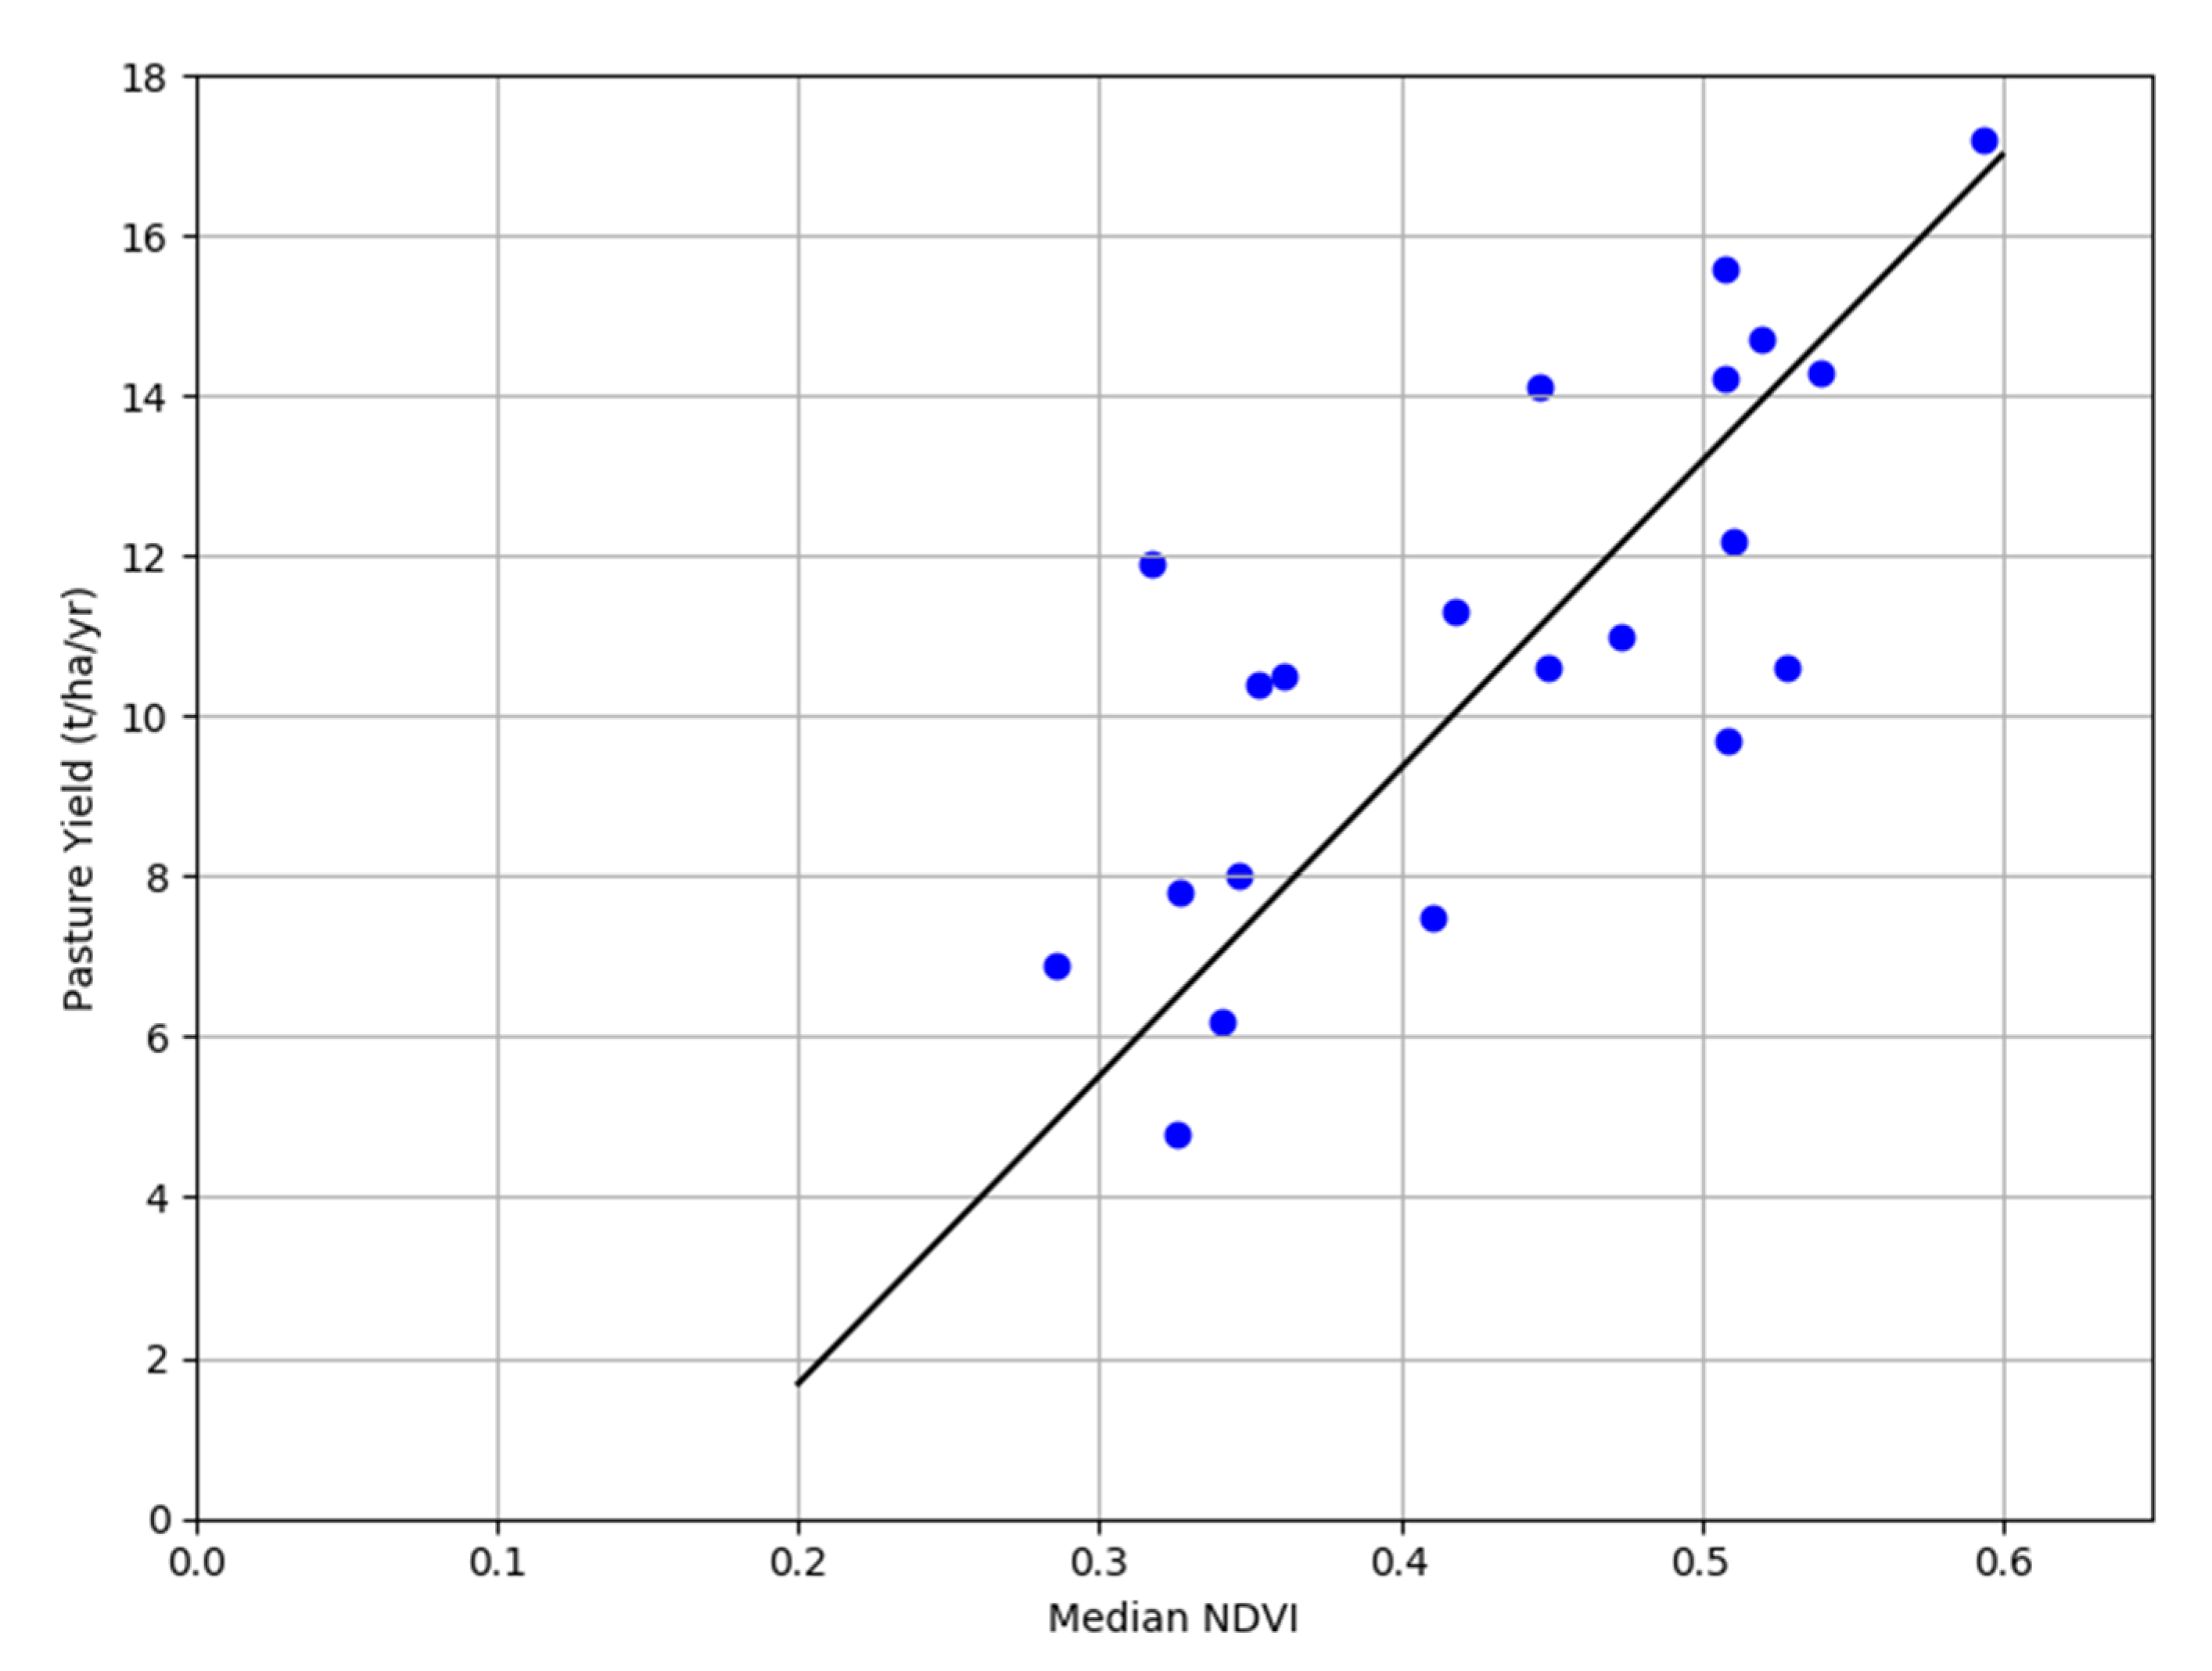
2.1. Development of Pasture Productivity Model from Sentinel-2 Imagery
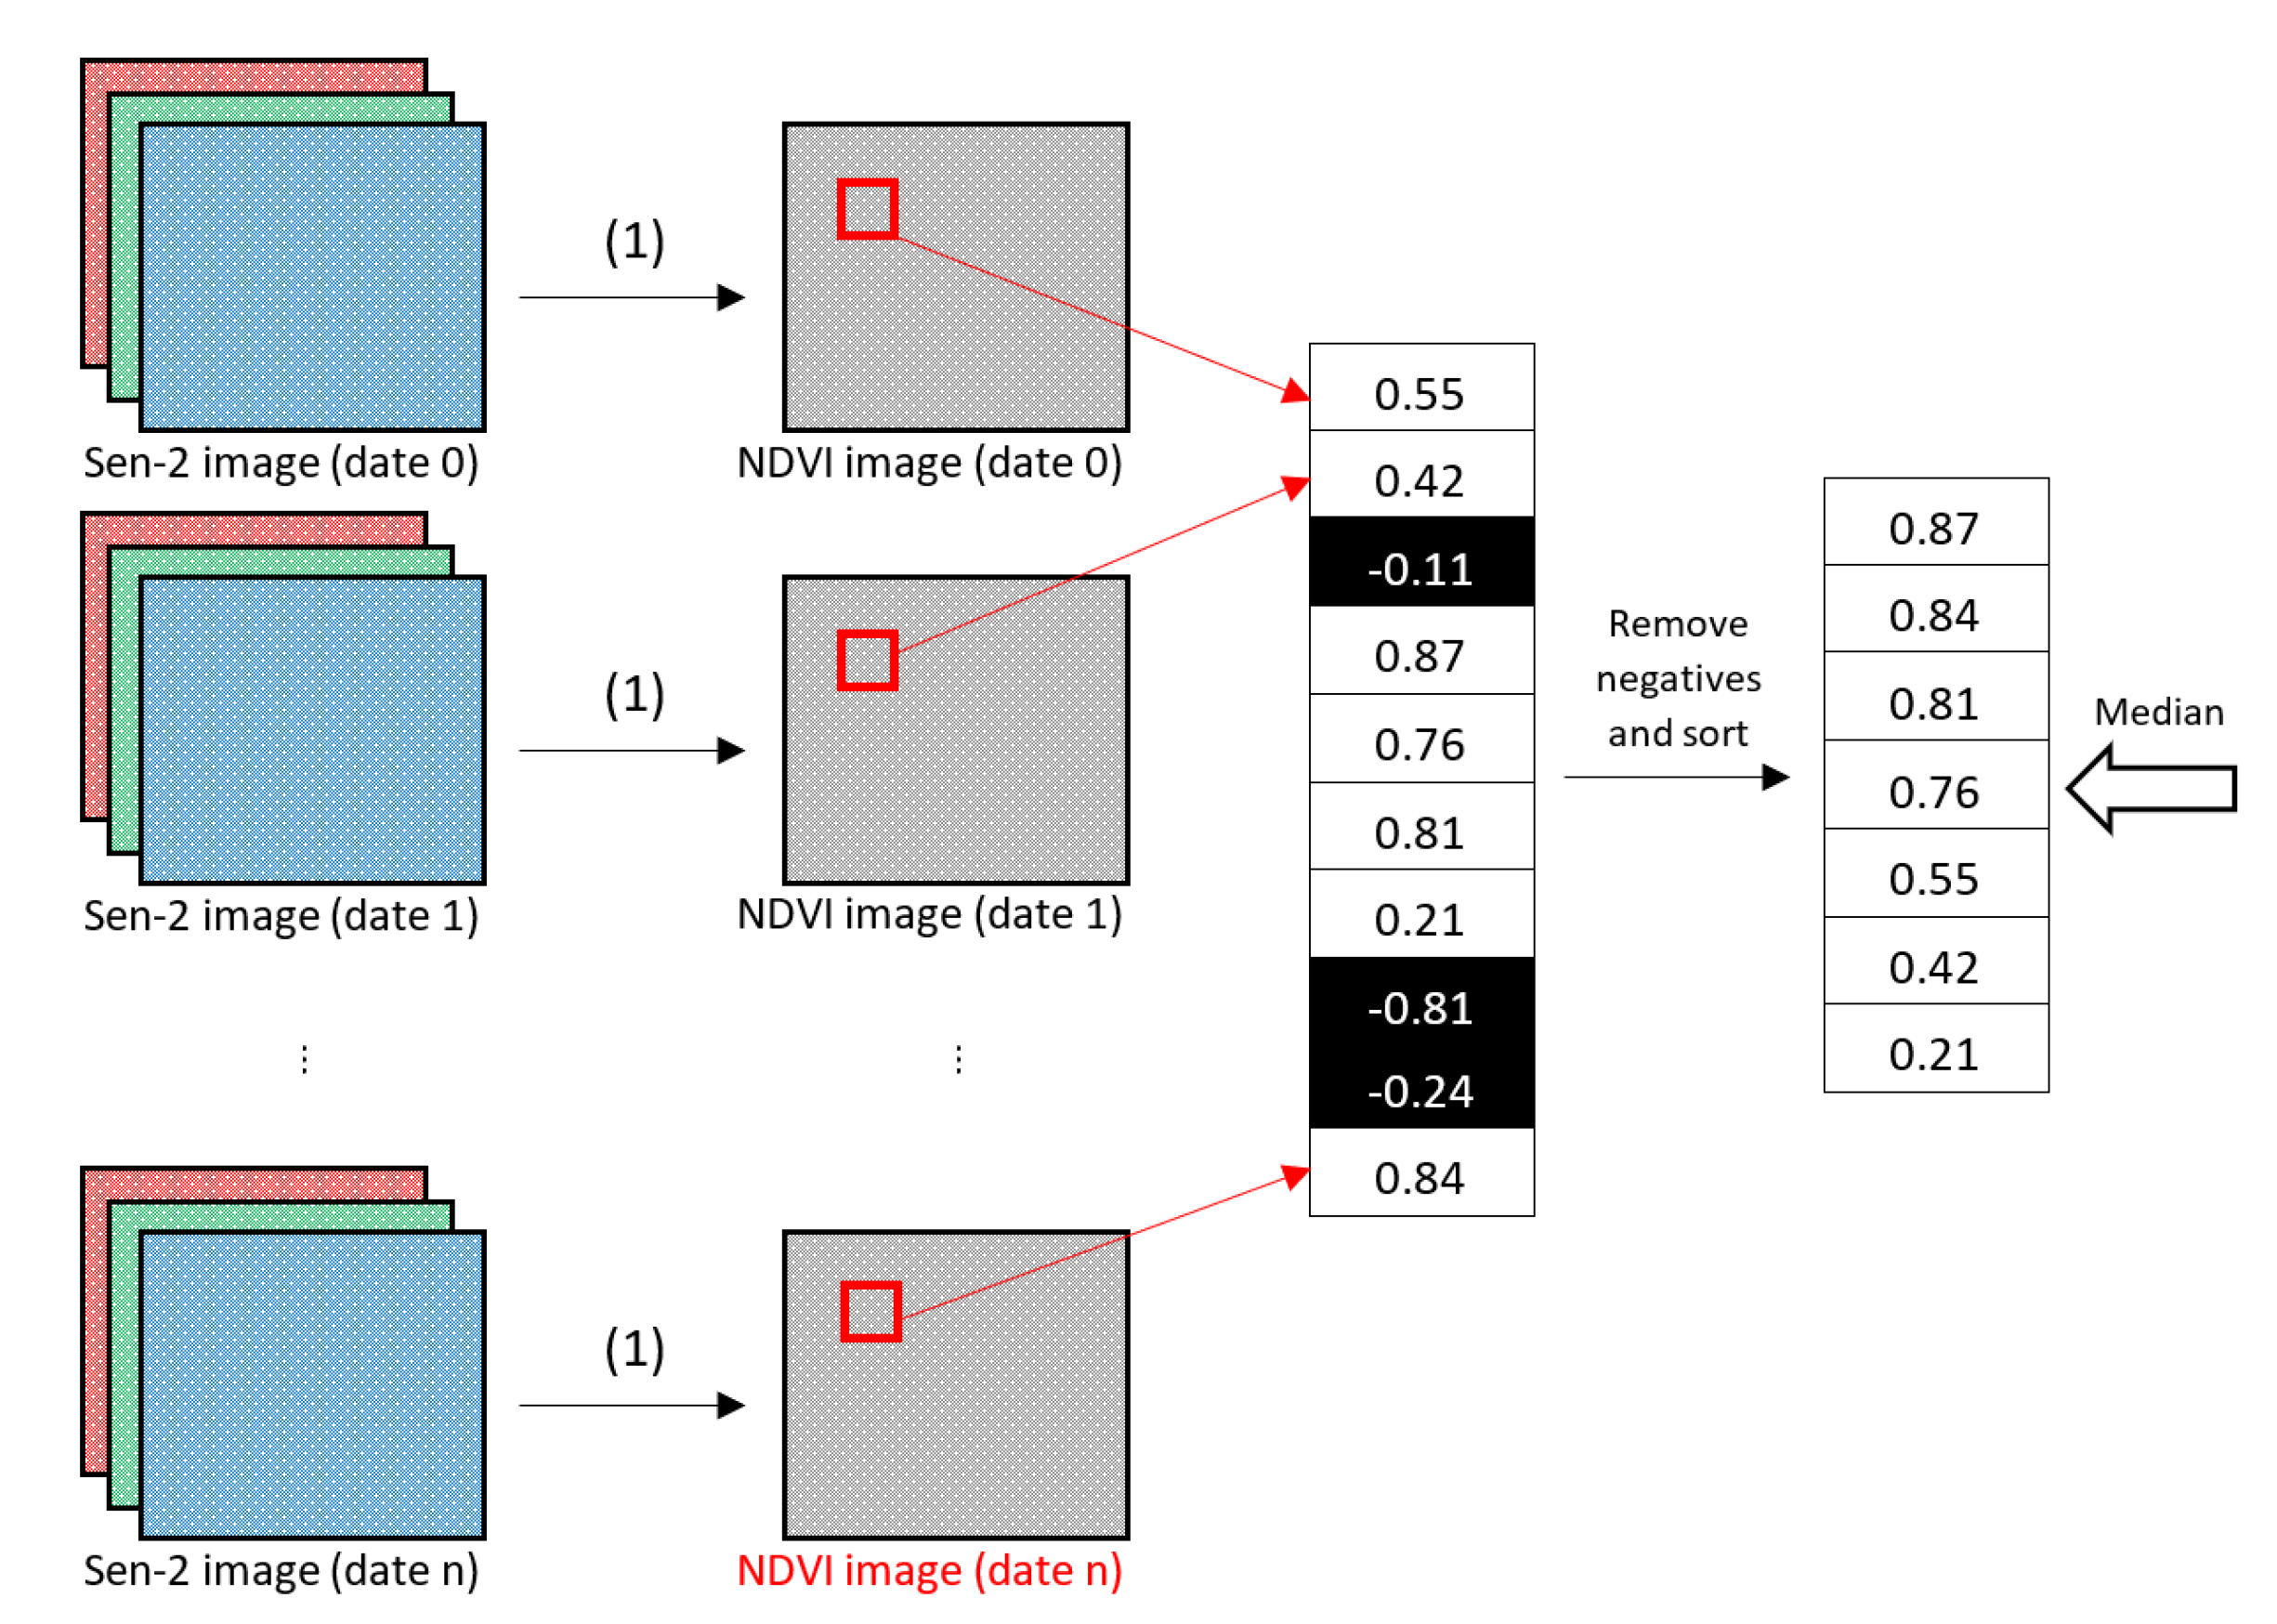
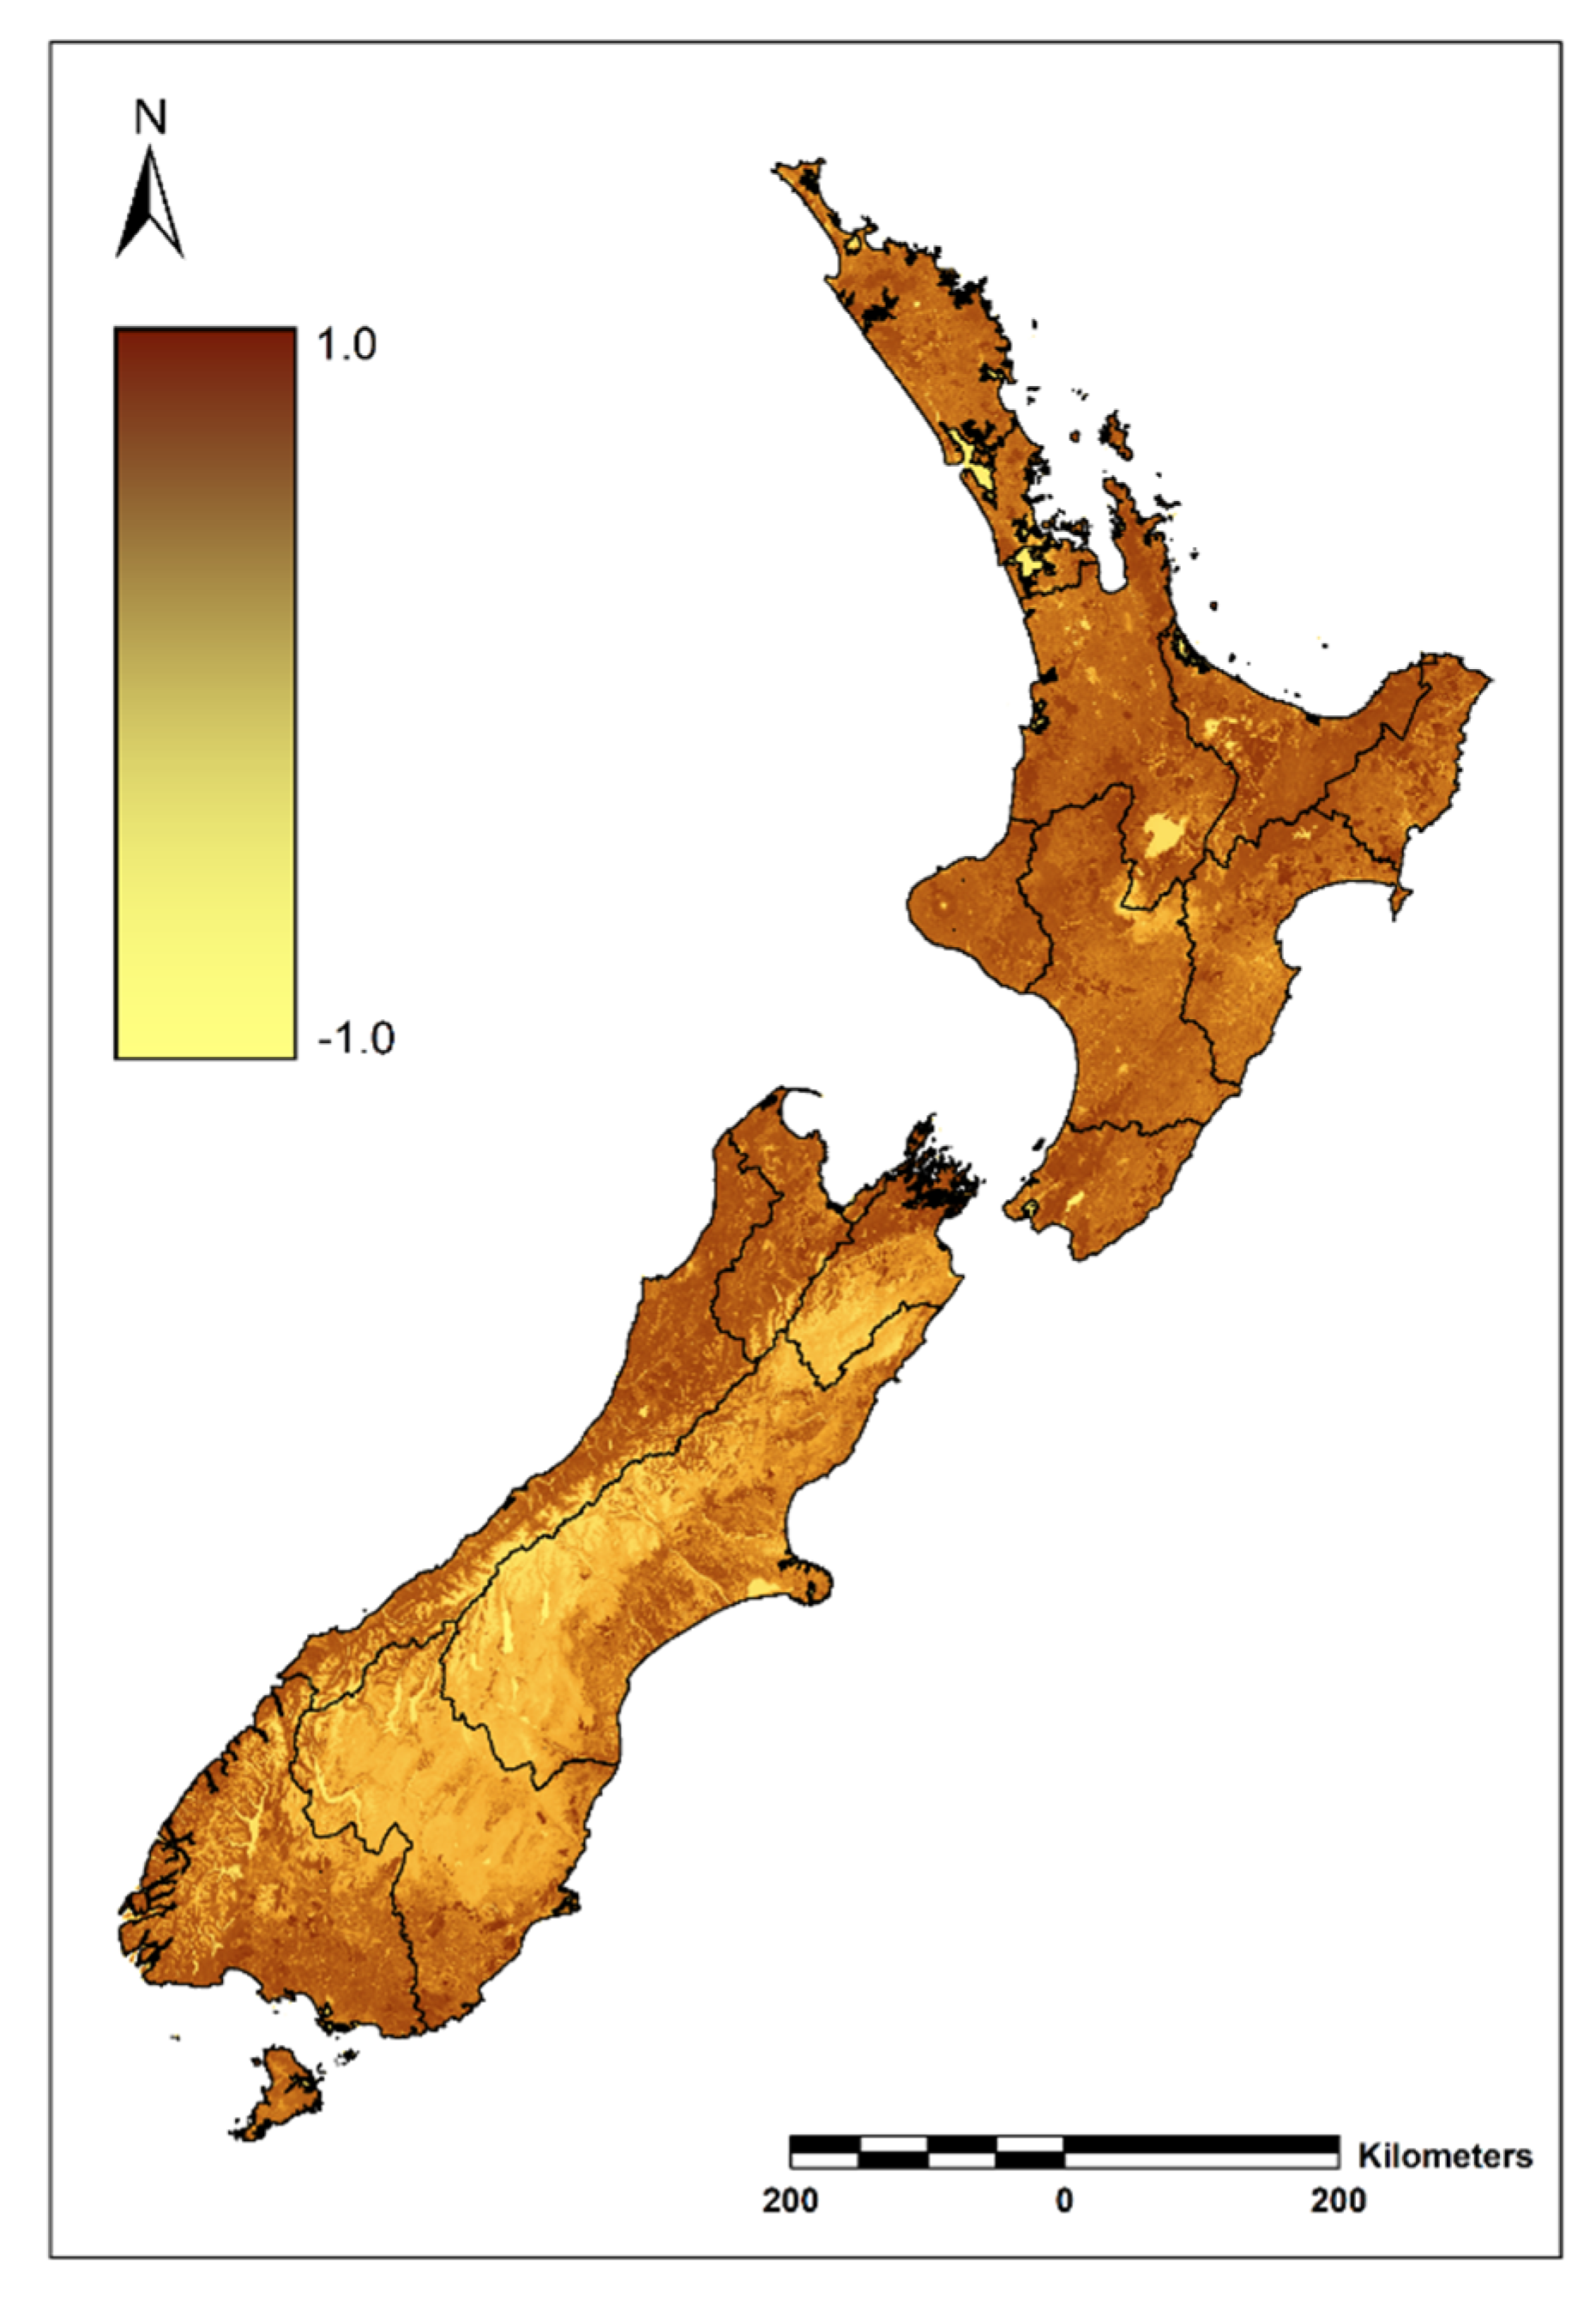
2.2. Generation of a Median NDVI Image of New Zealand
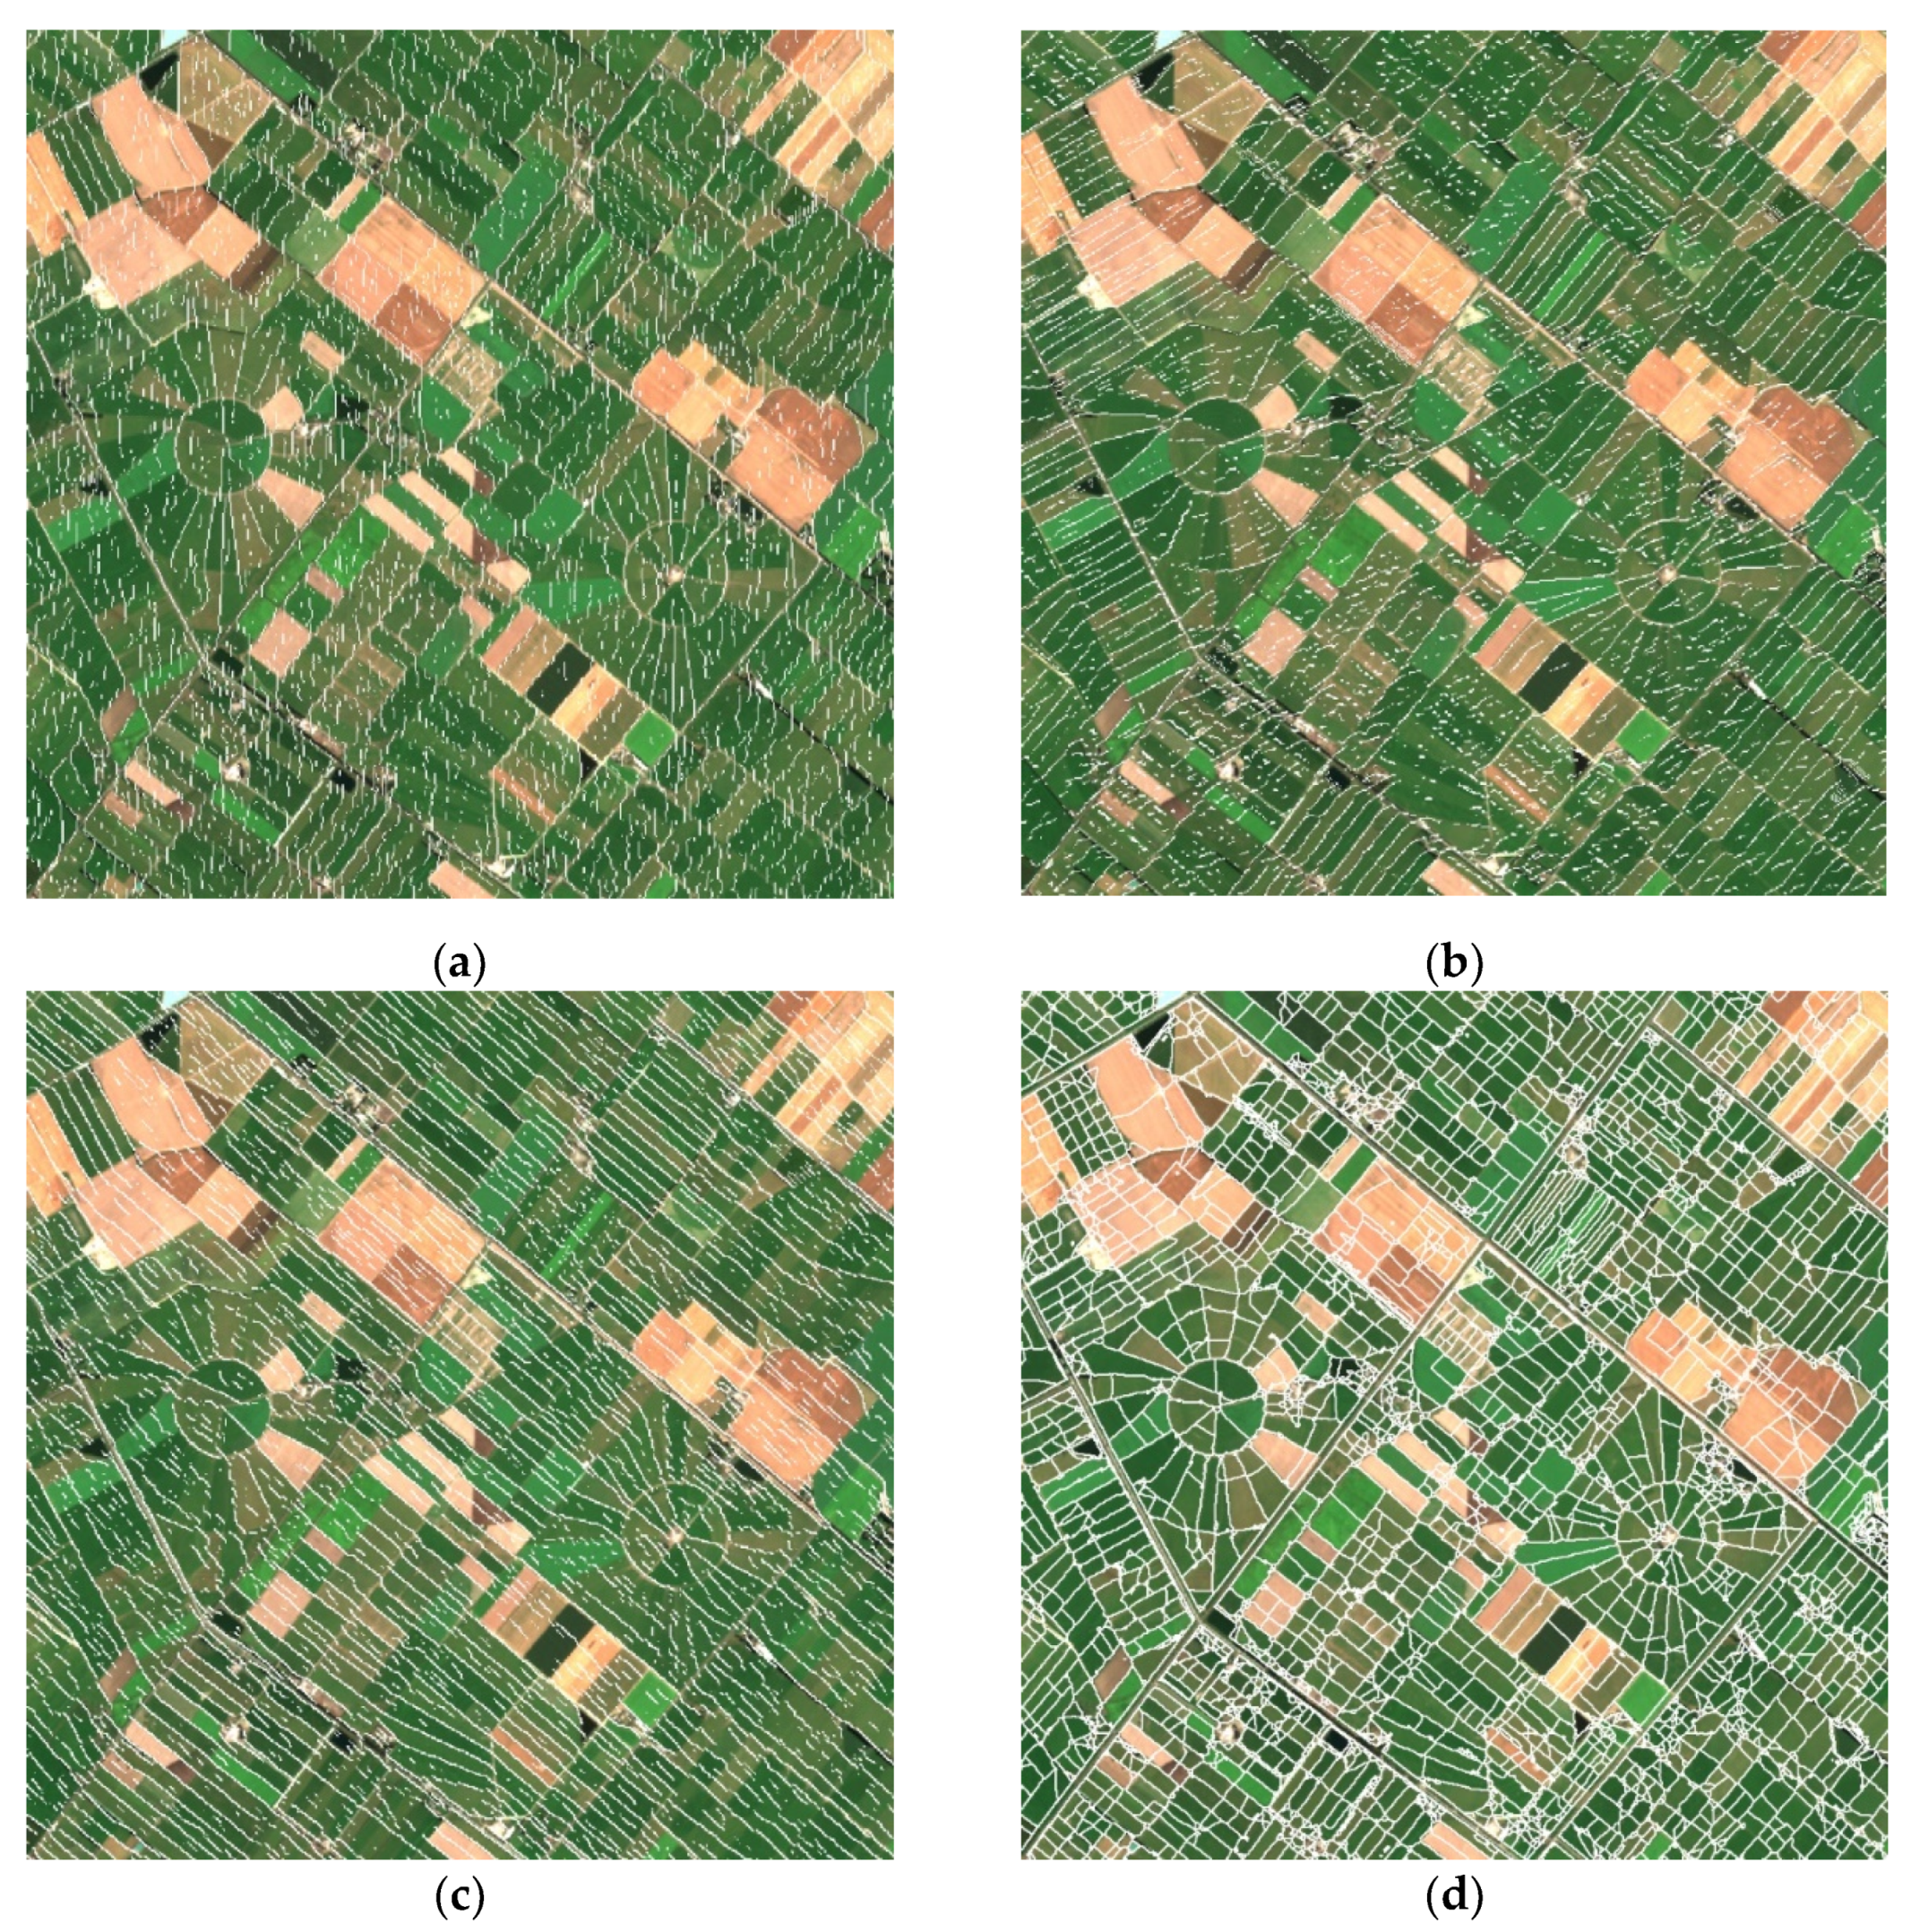
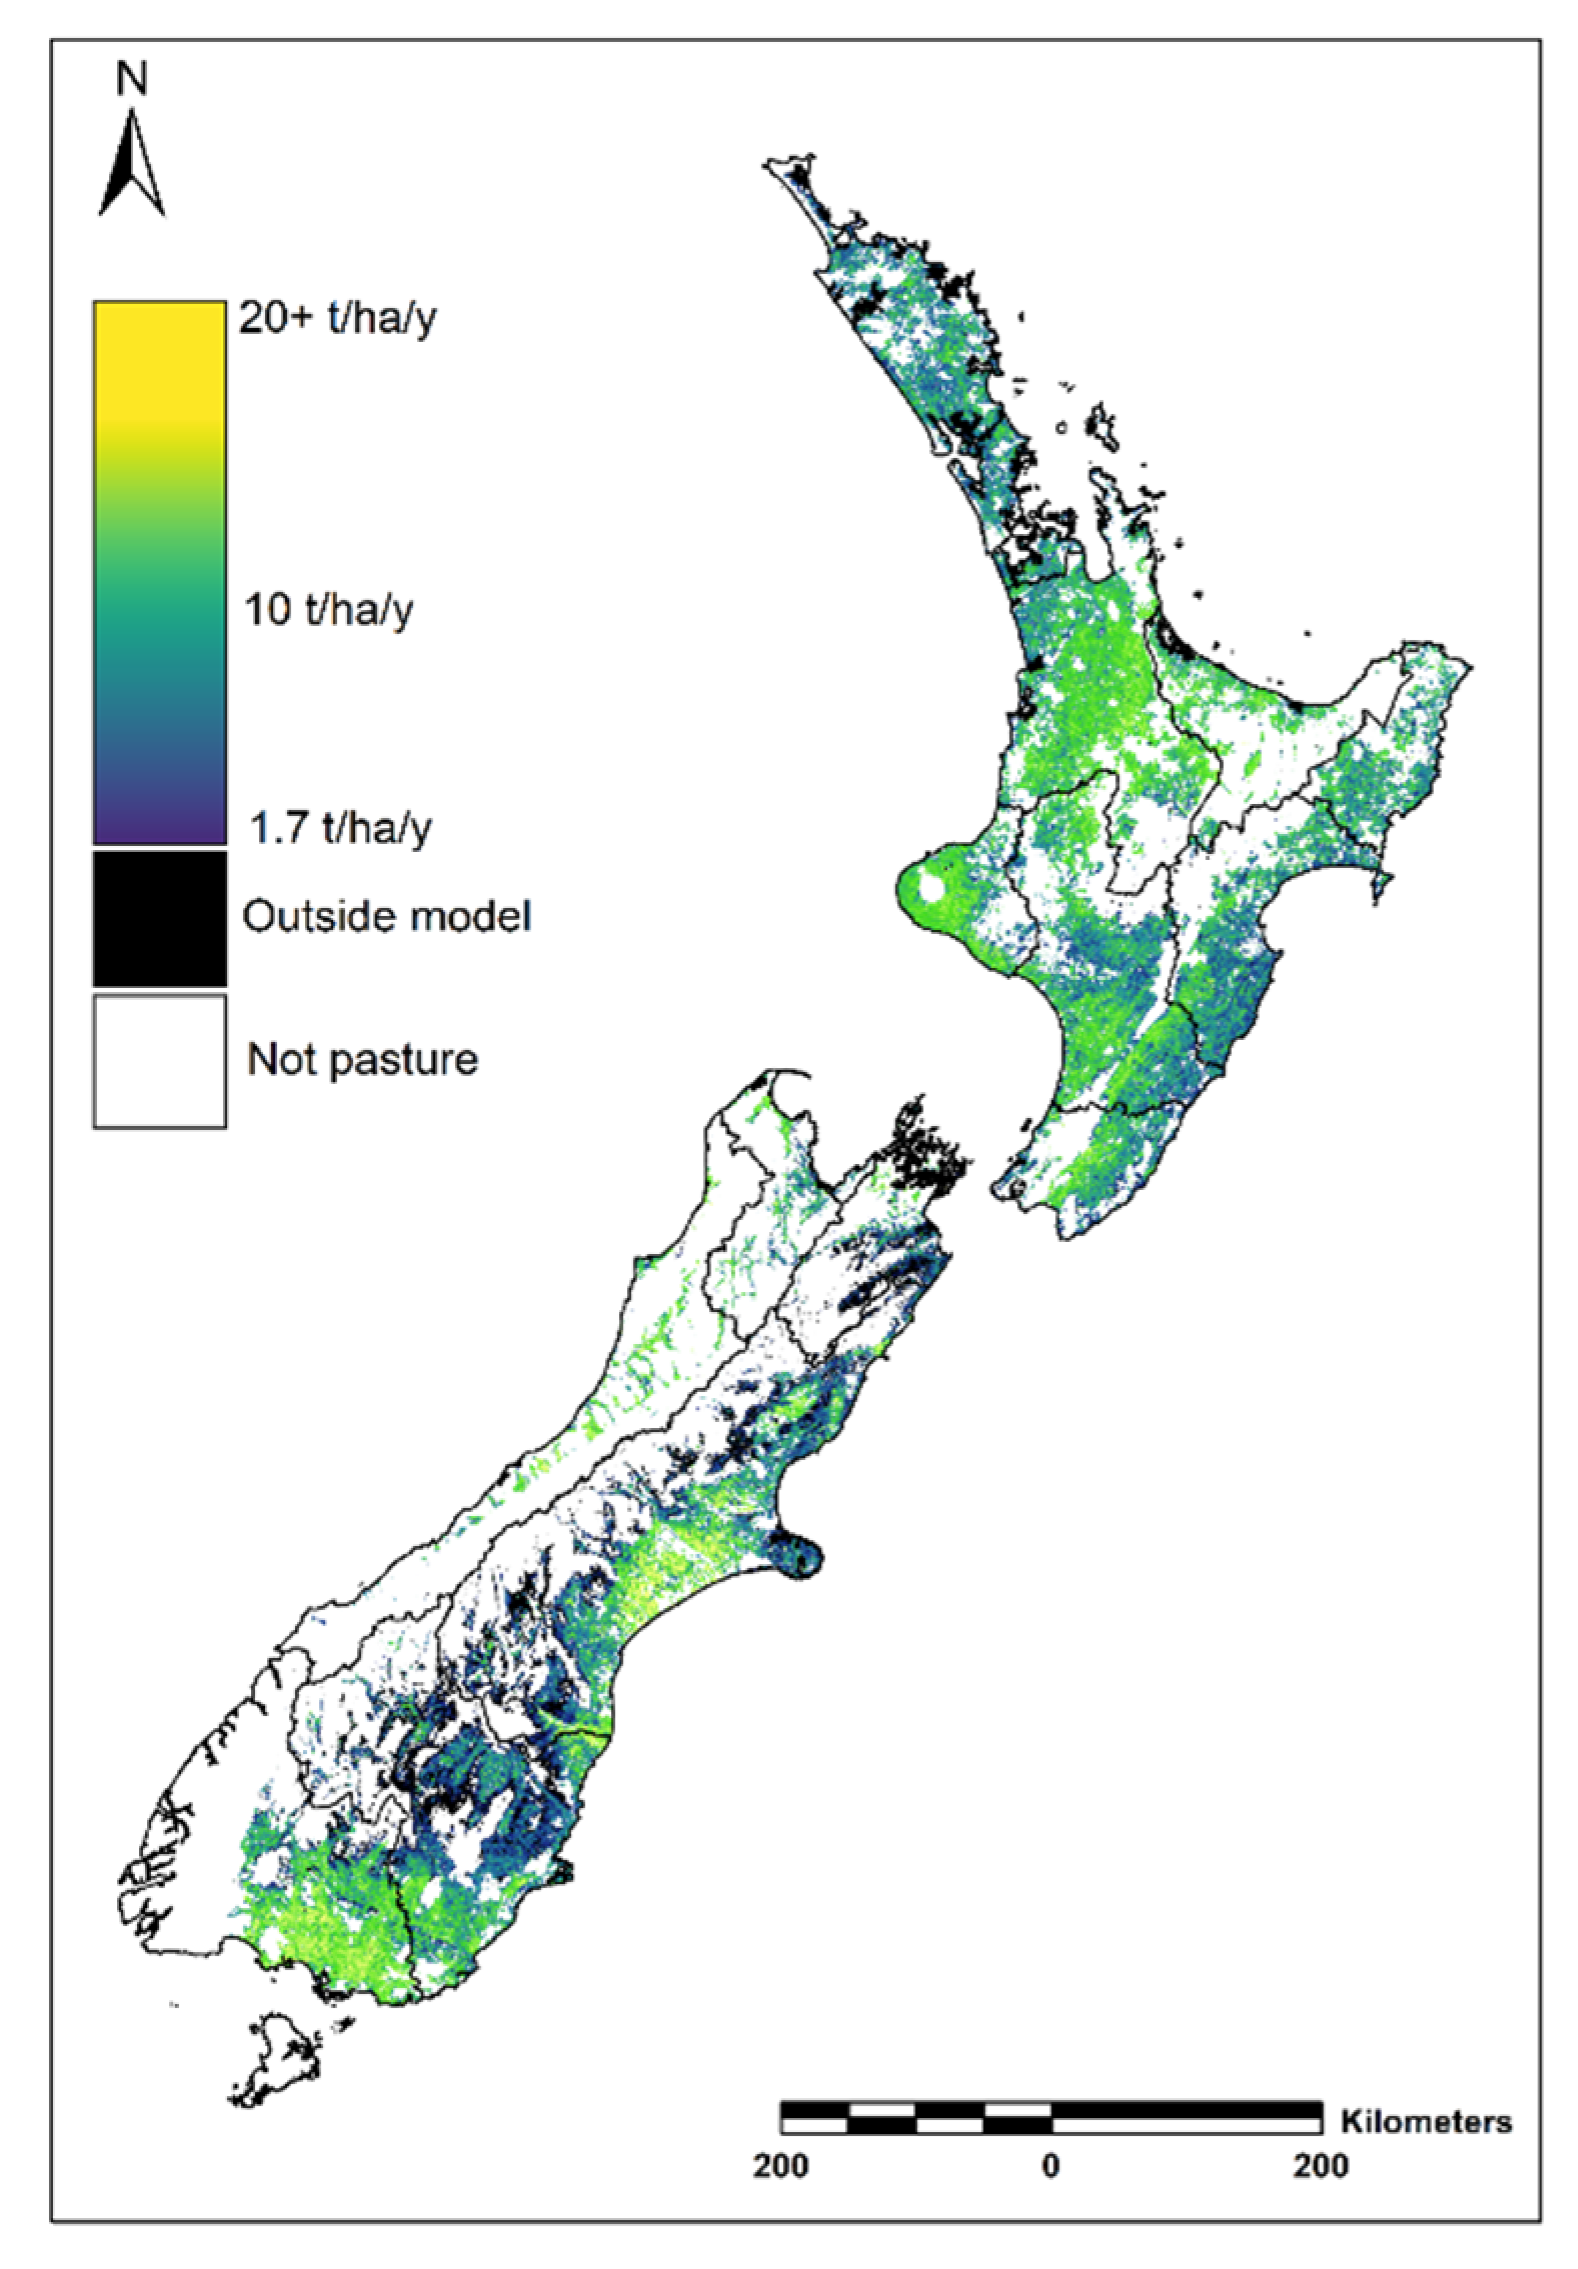
2.3. Generation of a National Vector Map of Average Median NDVI
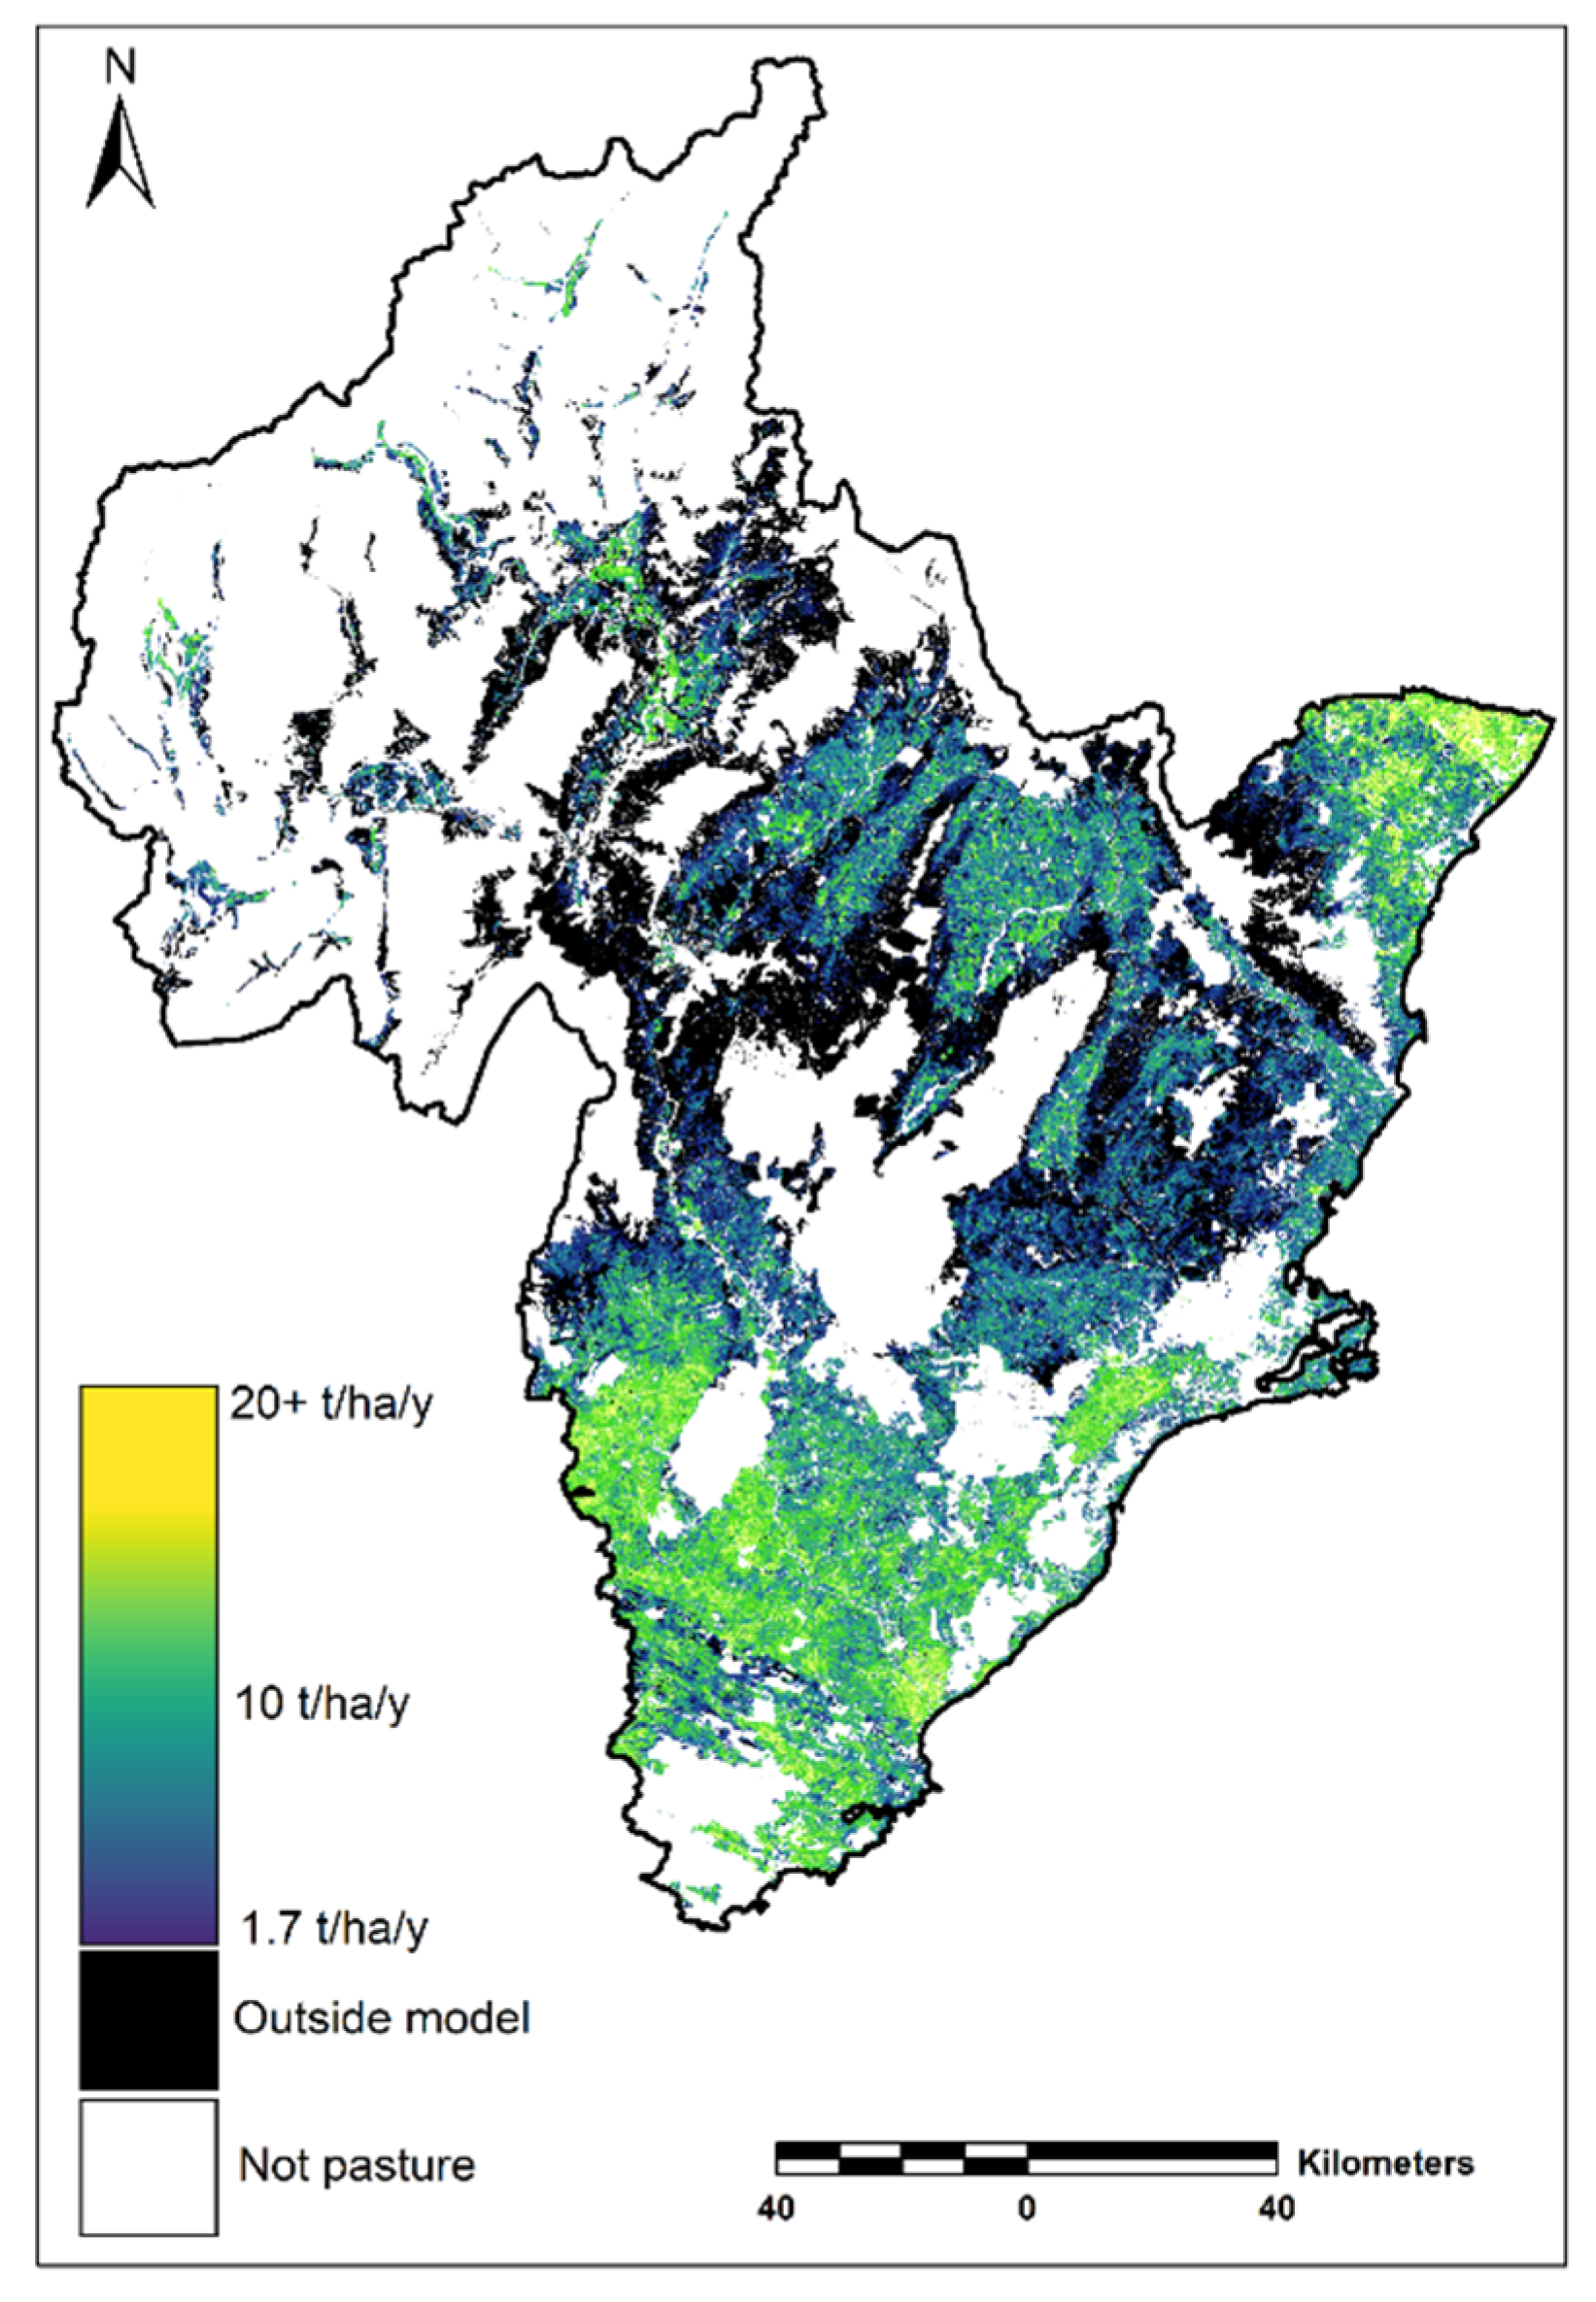
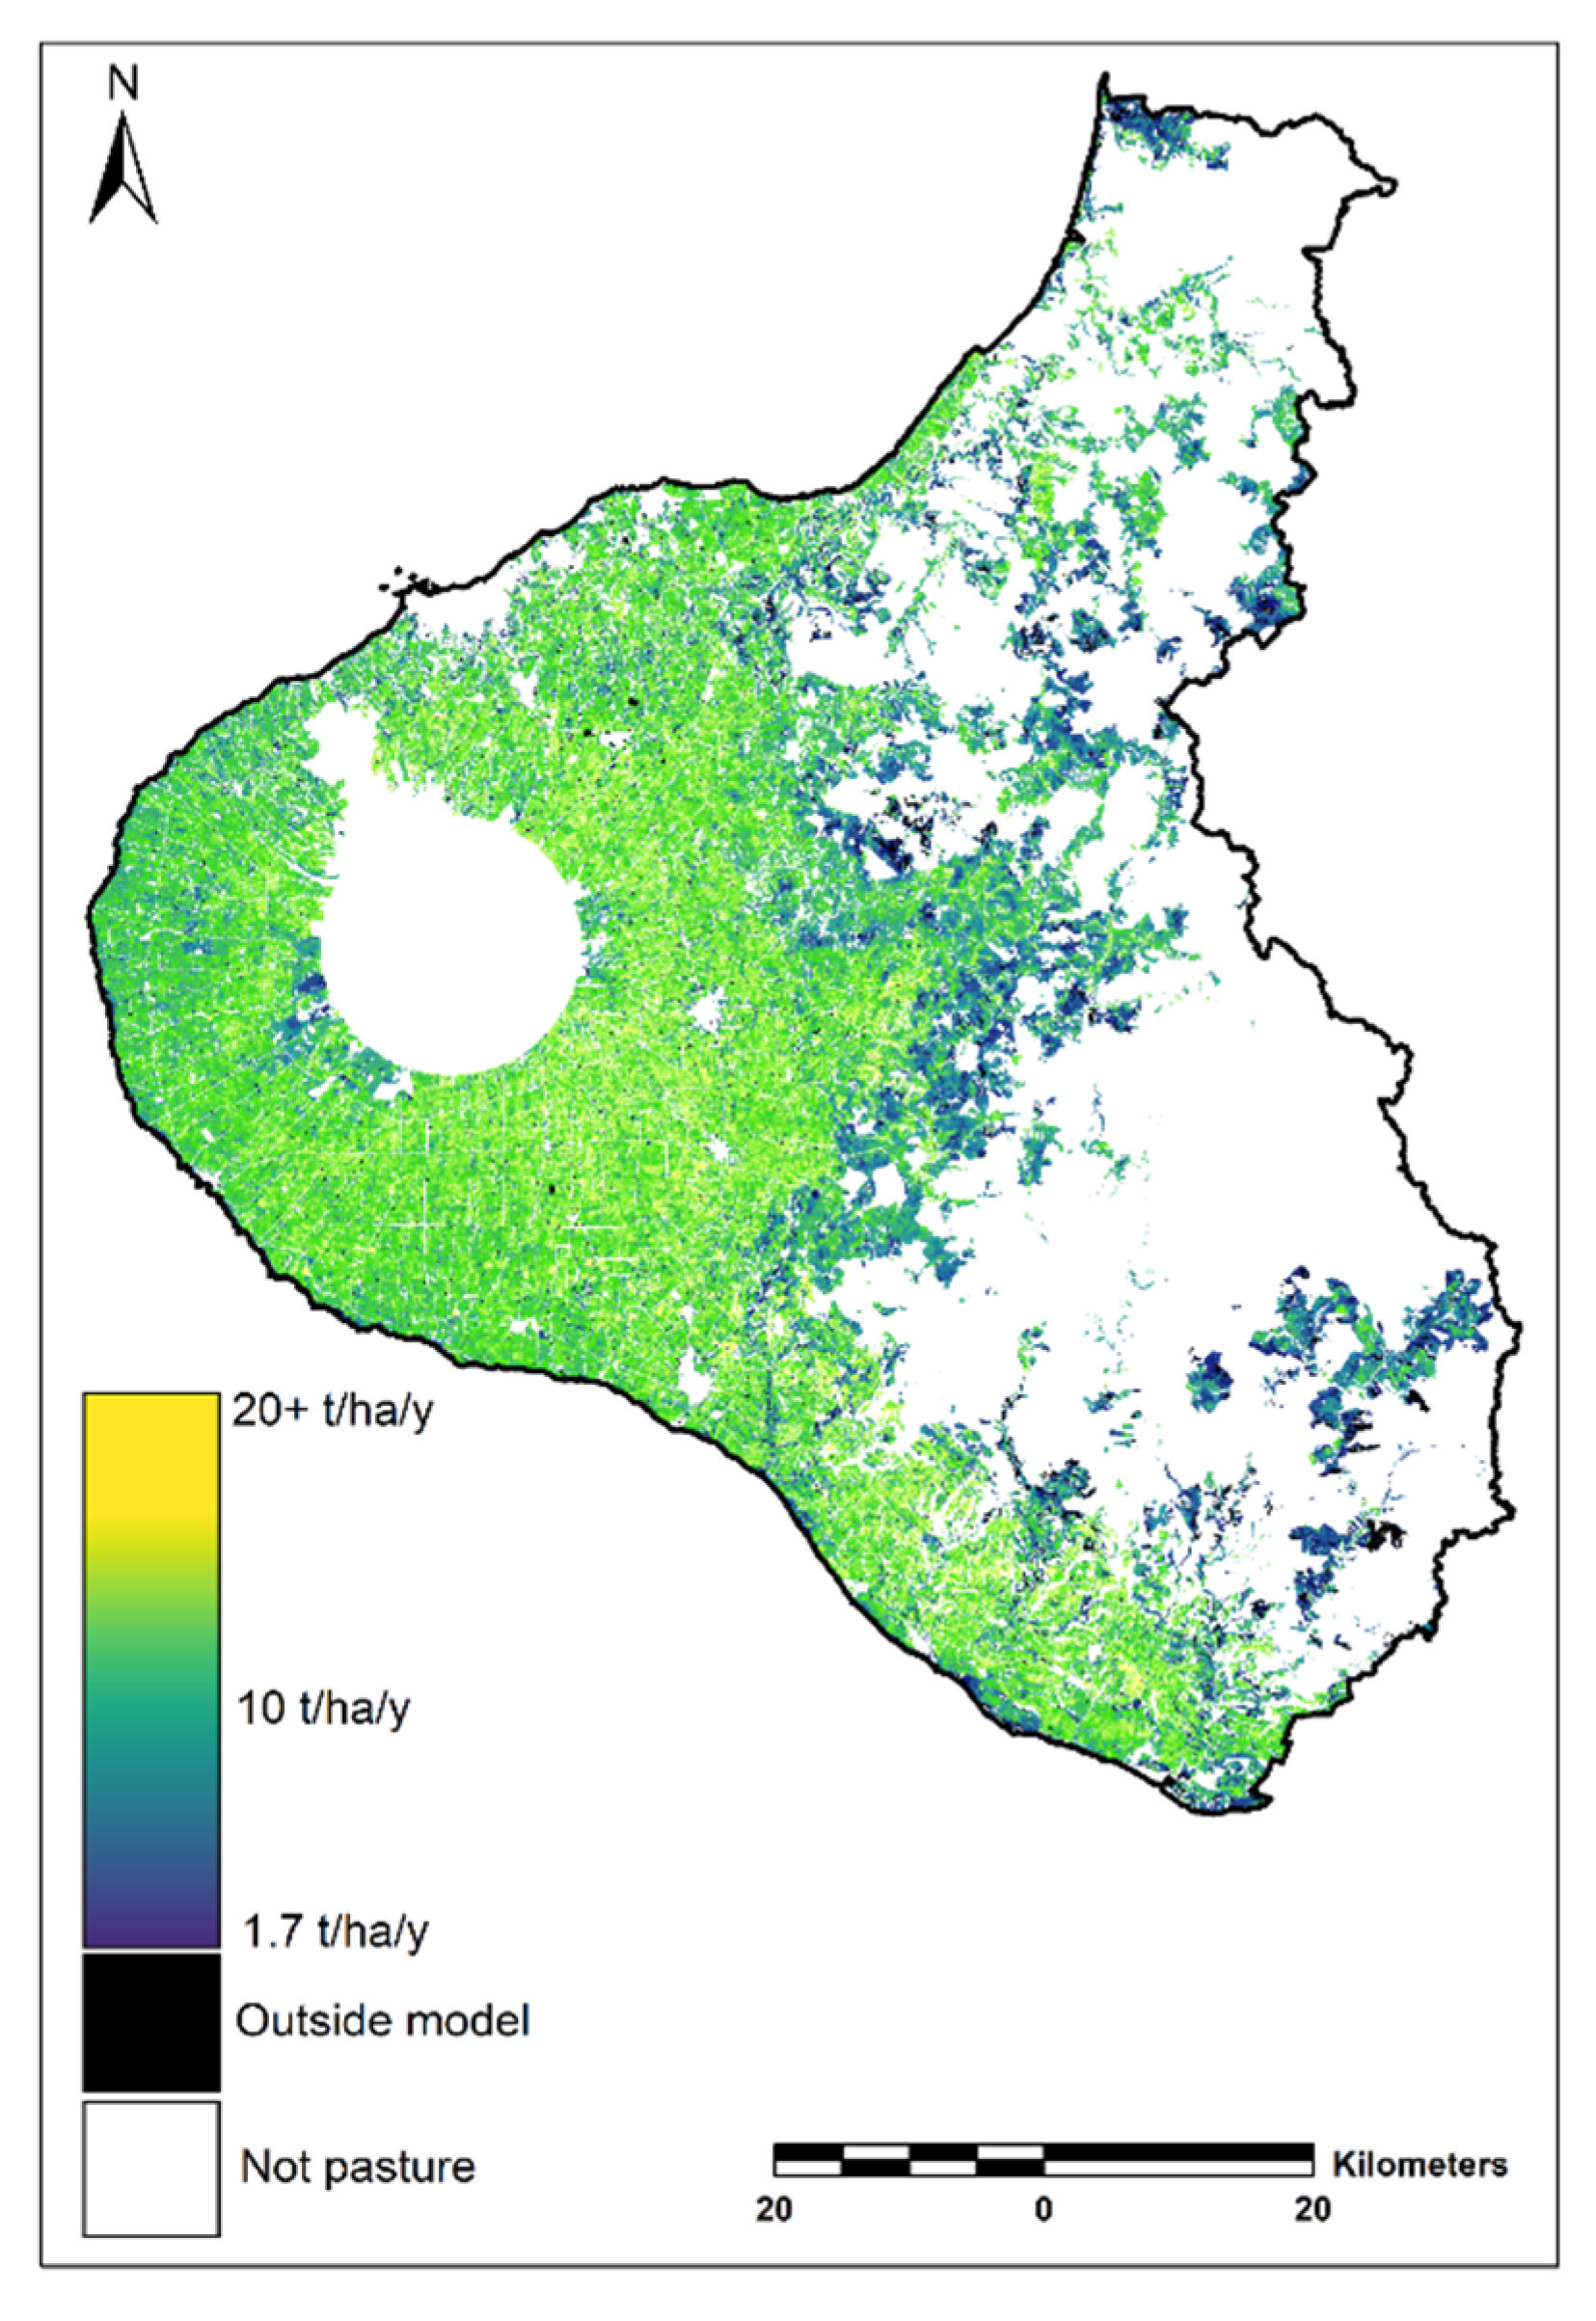
3. Results
4. Discussion
4.1. Accuracy of Results
4.2. Computational Complexities
4.3. Implications of LCDB
4.4. Further Implications for Science
5. Conclusions
Author Contributions
Funding
Data Availability Statement
Conflicts of Interest
References
- Livestock Improvement Corporation. 1998–1999 New Zealand Dairy Statistics. 1999. Available online: https://www.lic.co.nz/documents/486/New_Zealand_Dairy_Statistics_1998-1999.pdf (accessed on 25 February 2021).
- Livestock Improvement Corporation. 2018–2019 New Zealand Dairy Statistics. 2019. Available online: https://www.lic.co.nz/documents/638/2018-19_New_Zealand_Dairy_Statistics.pdf (accessed on 25 February 2021).
- Monaghan, R.M.; Paton, R.J.; Smith, L.C.; Drewry, J.J.; Littlejohn, R.P. The impacts of nitrogen fertilisation and increased stocking rate on pasture yield, soil physical condition and nutrient losses in drainage from a cattle-grazed pasture. N. Z. J. Agric. Res. 2005, 48, 227–240. [Google Scholar] [CrossRef]
- Edirisinghe, A.; Clark, D.; Waugh, D. Spatio-temporal modelling of biomass of intensively grazed perennial dairy pastures using multispectral remote sensing. Int. J. Appl. Earth Obs. Geoinf. 2012, 16, 5–16. [Google Scholar] [CrossRef]
- López Díaz, J.; González-Rodríguez, A. Measuring grass yield by non-destructive methods. In Optimal Forage Systems for Animal Production and the Environment, Proceedings of the 12th Symposium of the European Grassland Federation, Pleven, Bulgaria, 26–28 May 2003; Institute of Forage Crops: Pleven, Bulgaria, 2003; pp. 569–572. [Google Scholar]
- Nobilly, F.; Bryant, R.; McKenzie, B.; Edwards, G. Productivity of Rotationally Grazed Simple and Diverse Pasture Mixtures under Irrigation in Canterbury; New Zealand Grassland Association: Wellington, New Zealand, 2013; pp. 165–172. [Google Scholar]
- Reinermann, S.; Asam, S.; Kuenzer, C. Remote Sensing of Grassland Production and Management—A Review. Remote Sens. 2020, 12, 1949. [Google Scholar] [CrossRef]
- Colwell, J.E. Vegetation canopy reflectance. Remote Sens. Environ. 1974, 3, 175–183. [Google Scholar] [CrossRef]
- Huete, A.; Didan, K.; Miura, T.; Rodriguez, E.P.; Gao, X.; Ferreira, L.G. Overview of the radiometric and biophysical performance of the MODIS vegetation indices. Remote Sens. Environ. 2002, 83, 195–213. [Google Scholar] [CrossRef]
- Huete, A. A soil-adjusted vegetation index (SAVI). Remote Sens. Environ. 1988, 25, 295–309. [Google Scholar] [CrossRef]
- McEntee, P.J.; Bennett, S.J.; Belford, R.K. Mapping the spatial and temporal stability of production in mixed farming systems: An index that integrates crop and pasture productivity to assist in the management of variability. Precis. Agric. 2019, 21, 77–106. [Google Scholar] [CrossRef]
- Ferreira, L.G.; Fernandez, L.E.; Sano, E.E.; Field, C.; Sousa, S.B.; Arantes, A.E.; Araújo, F.M. Biophysical Properties of Cultivated Pastures in the Brazilian Savanna Biome: An Analysis in the Spatial-Temporal Domains Based on Ground and Satellite Data. Remote Sens. 2013, 5, 307–326. [Google Scholar] [CrossRef]
- Hoogendoorn, C.; Newton, P.C.D.; DeVantier, B.P.; Rolle, B.; Theobald, P.; Lloyd-West, C. Grazing intensity and micro-topographical effects on some nitrogen and carbon pools and fluxes in sheep-grazed hill country in New Zealand. Agric. Ecosyst. Environ. 2016, 217, 22–32. [Google Scholar] [CrossRef]
- Hoogendoorn, C.J.; Lambert, M.G.; DeVantier, B.P.; Theobald, P.W.; Park, Z.A. Nitrogen fertiliser application rates and nitrogen leaching in intensively managed sheep grazed hill country pastures in New Zealand. N. Z. J. Agric. Res. 2017, 60, 154–172. [Google Scholar] [CrossRef]
- Hoogendoorn, C.J.; Betteridge, K.J.; Ledgard, S.F.; Costall, D.A.; Park, Z.A.; Theobald, P.W. Nitrogen leaching from sheep-, cattle- and deer-grazed pastures in the Lake Taupo catchment in New Zealand. Anim. Prod. Sci. 2011, 51, 416–425. [Google Scholar] [CrossRef]
- Schon, N.S.; Mackay, A.D.; Gray, R.A. Changes in the abundance and diversity of earthworms in hill soils under different long-term fertiliser and sheep stocking regimes. N. Z. J. Agric. Res. 2021, 64, 162–177. [Google Scholar] [CrossRef]
- Puha, M.; King, W.; Burggraaf, V.; Roberts, A. Pasture Production Gains from Strategic Winter Nitrogen Applications on a North Island Sheep and Beef Hill Country Farm; New Zealand Grassland Association: Wellington, New Zealand, 2008; Volume 70, pp. 117–121. [Google Scholar]
- Dalley, D.; Geddes, T. Pasture Growth and Quality on Southland and Otago Dairy Farms; New Zealand Grassland Association: Wellington, New Zealand, 2012; Volume 74, pp. 237–241. [Google Scholar]
- Moot, D.J.; Smith, M.C.; Mills, A. Liveweight production, dry matter yield and seasonal composition from dryland lucerne and lucerne/grass mixes over five years. N. Z. J. Agric. Res. 2020, 63, 272–300. [Google Scholar] [CrossRef]
- Smith, L.; Moss, R.; Morton, J.; Metherell, A.; Fraser, T. Pasture production from a long-term fertiliser trial under irrigation. N. Z. J. Agric. Res. 2012, 55, 105–117. [Google Scholar] [CrossRef]
- Rosser, B.; Ross, C. Recovery of pasture production and soil properties on soil slip scars in erodible siltstone hill country, Wairarapa, New Zealand. N. Z. J. Agric. Res. 2011, 54, 23–44. [Google Scholar] [CrossRef]
- Vermote, E.F.; Tanre, D.; Deuze, J.L.; Herman, M.; Morcette, J.-J. Second Simulation of the Satellite Signal in the Solar Spectrum, 6S: An overview. IEEE Trans. Geosci. Remote Sens. 1997, 35, 675–686. [Google Scholar] [CrossRef]
- Dymond, J.R.; Shepherd, J.D. The spatial distribution of indigenous forest and its composition in the Wellington region, New Zealand, from ETM+ satellite imagery. Remote Sens. Environ. 2004, 90, 116–125. [Google Scholar] [CrossRef]
- Power, G.J.; Ullman, S. High-Level Vision: Object-Recognition and Visual Cognition. Opt. Eng. 1997, 36, 3224. [Google Scholar] [CrossRef]
- Zhu, Z.; Woodcock, C.E. Object-based cloud and cloud shadow detection in Landsat imagery. Remote Sens. Environ. 2012, 118, 83–94. [Google Scholar] [CrossRef]
- Zhu, Z.; Woodcock, C.E. Automated cloud, cloud shadow, and snow detection in multitemporal Landsat data: An algorithm designed specifically for monitoring land cover change. Remote Sens. Environ. 2014, 152, 217–234. [Google Scholar] [CrossRef]
- Shepherd, J.; Schindler, J.; Dymond, J. Automated Mosaicking of Sentinel-2 Satellite Imagery. Remote Sens. 2020, 12, 3680. [Google Scholar] [CrossRef]
- North, H.C.; Pairman, D.; Belliss, S.E. Boundary Delineation of Agricultural Fields in Multitemporal Satellite Imagery. IEEE J. Sel. Top. Appl. Earth Obs. Remote Sens. 2018, 12, 237–251. [Google Scholar] [CrossRef]
- Manaaki Whenua—Landcare Research. Land Cover Database Version 5.0, Mainland New Zealand. Available online: https://lris.scinfo.org.nz/layer/104400-lcdb-v50-land-cover-database-version-50-mainland-new-zealand/ (accessed on 25 February 2021).
- Dymond, J.R.; Stephens, P.R.; Newsome, P.F.; Wilde, R.H. Percentage vegetation cover of a degrading rangeland from SPOT. Int. J. Remote Sens. 1992, 13, 1999–2007. [Google Scholar] [CrossRef]
- StatsNZ. Regional Council 2018 (Generalised). Available online: https://datafinder.stats.govt.nz/layer/92204-regional-council-2018-generalised/ (accessed on 25 February 2021).

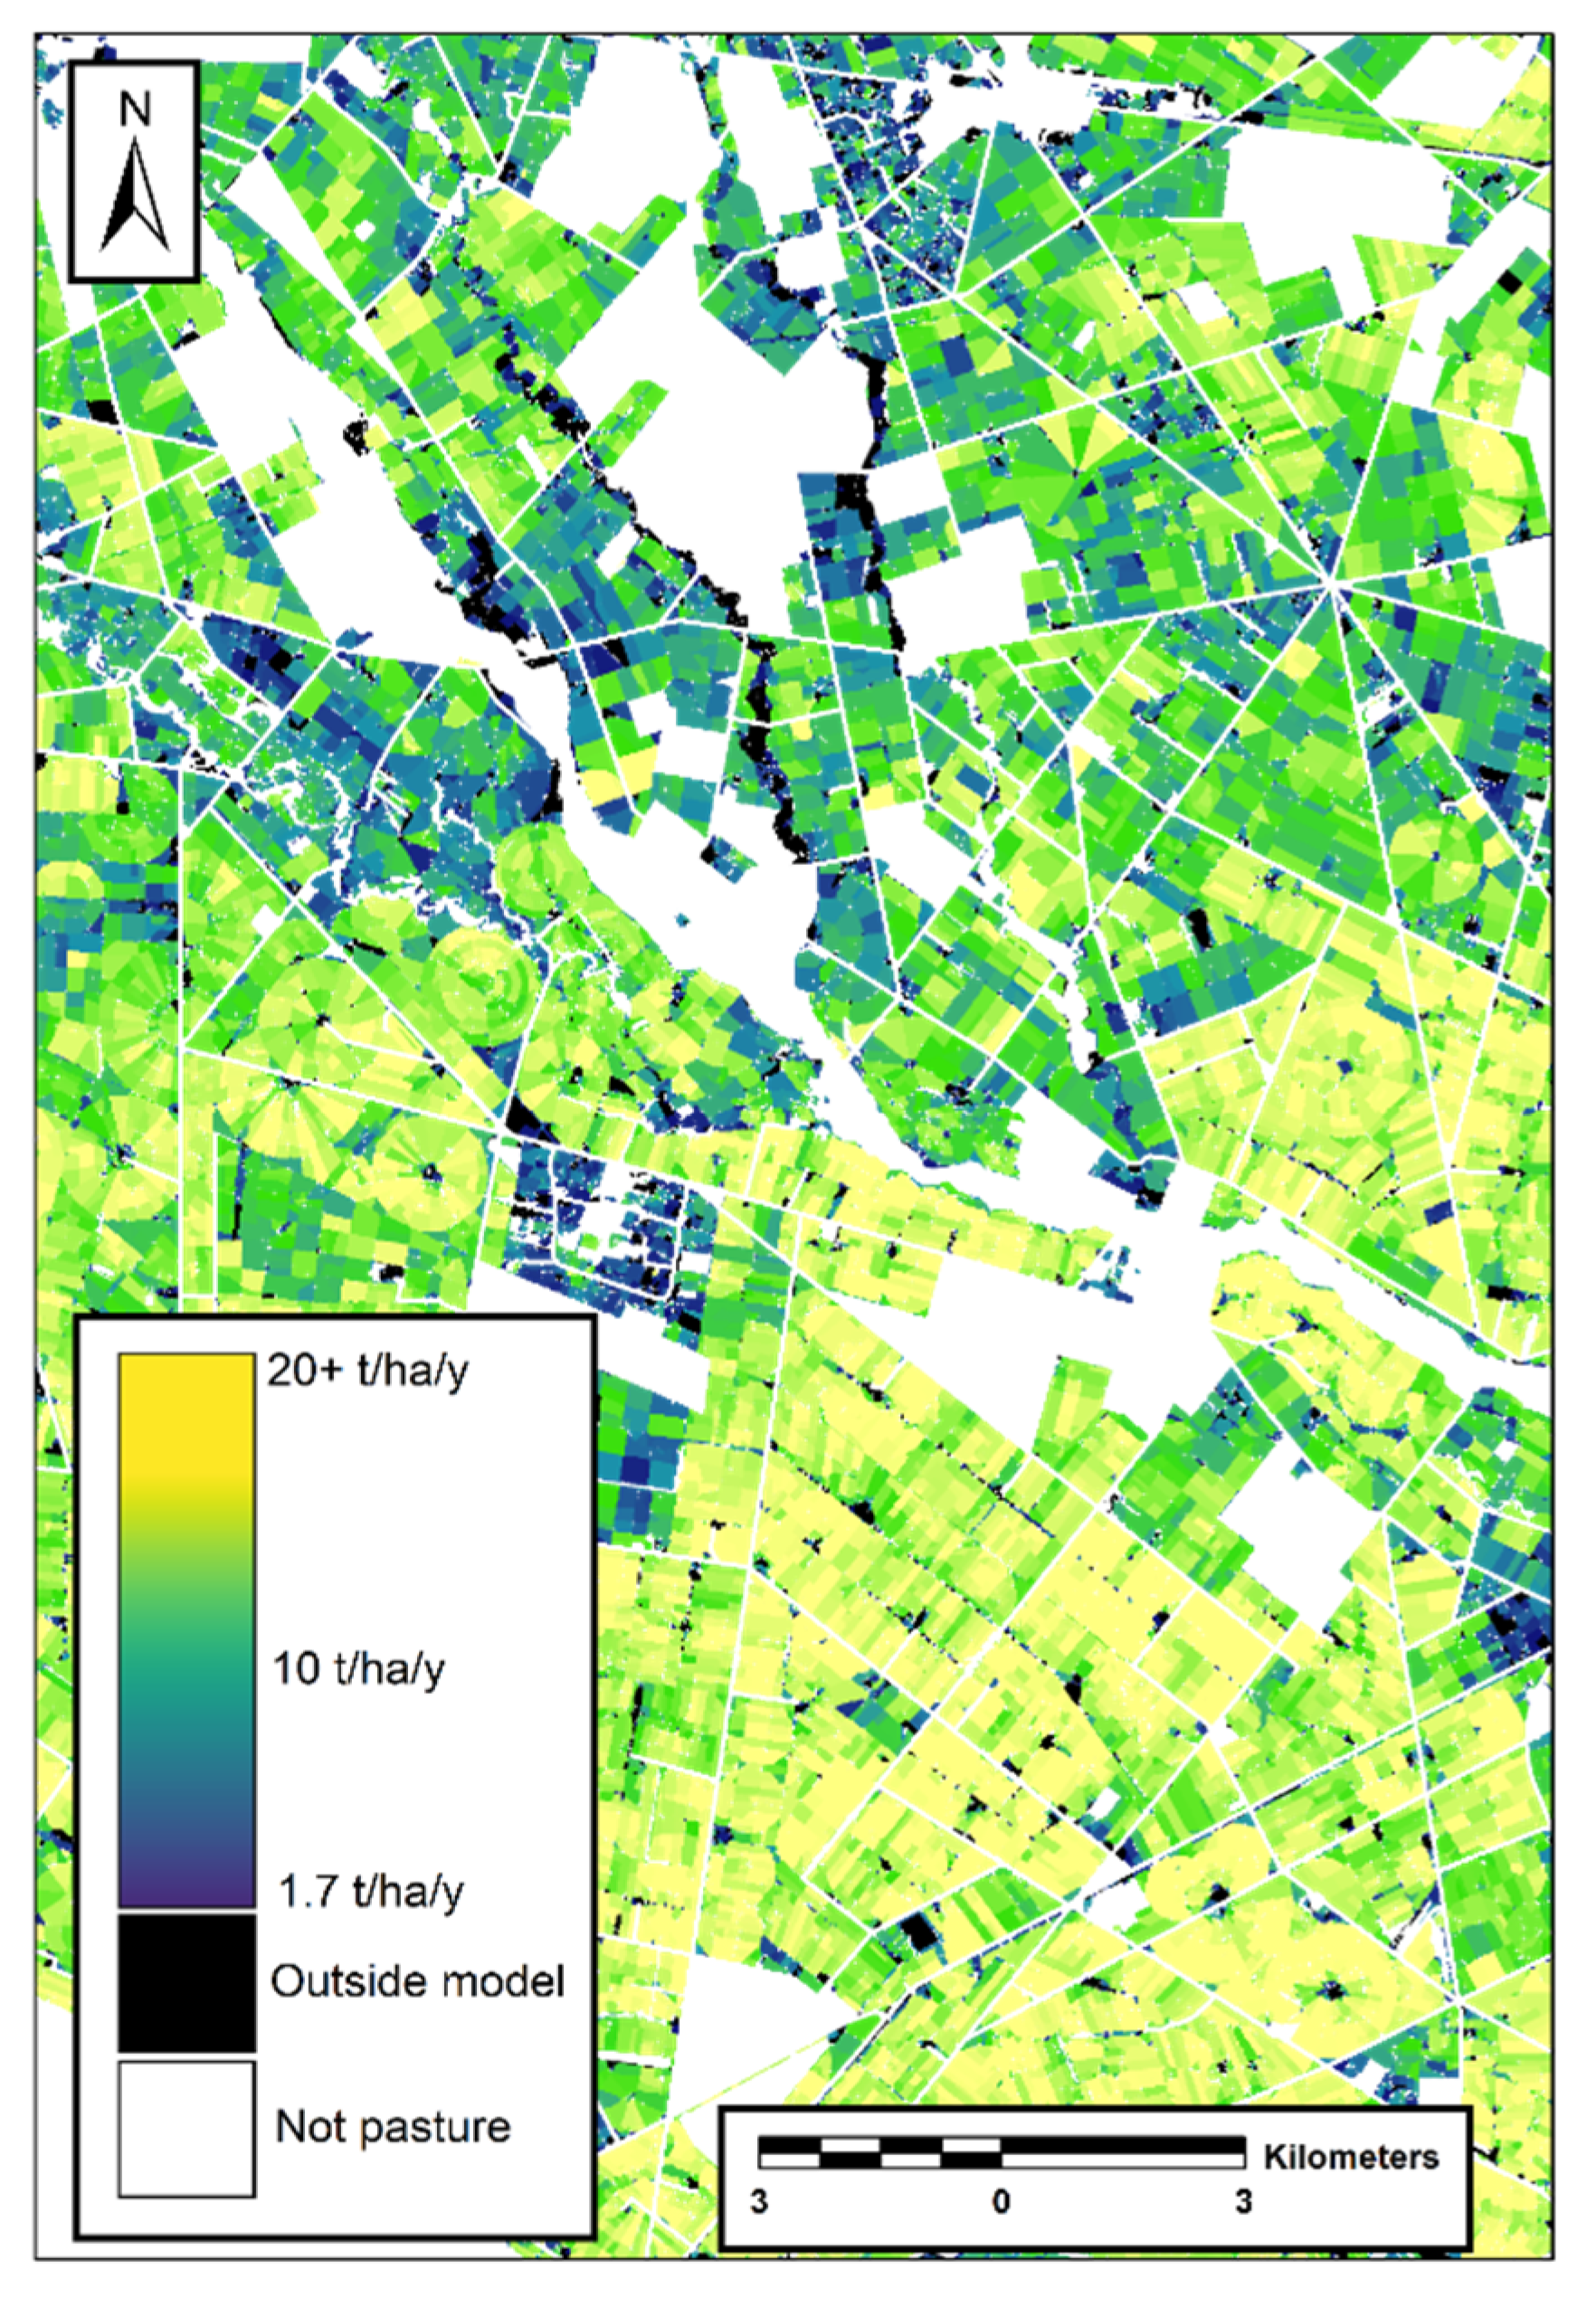
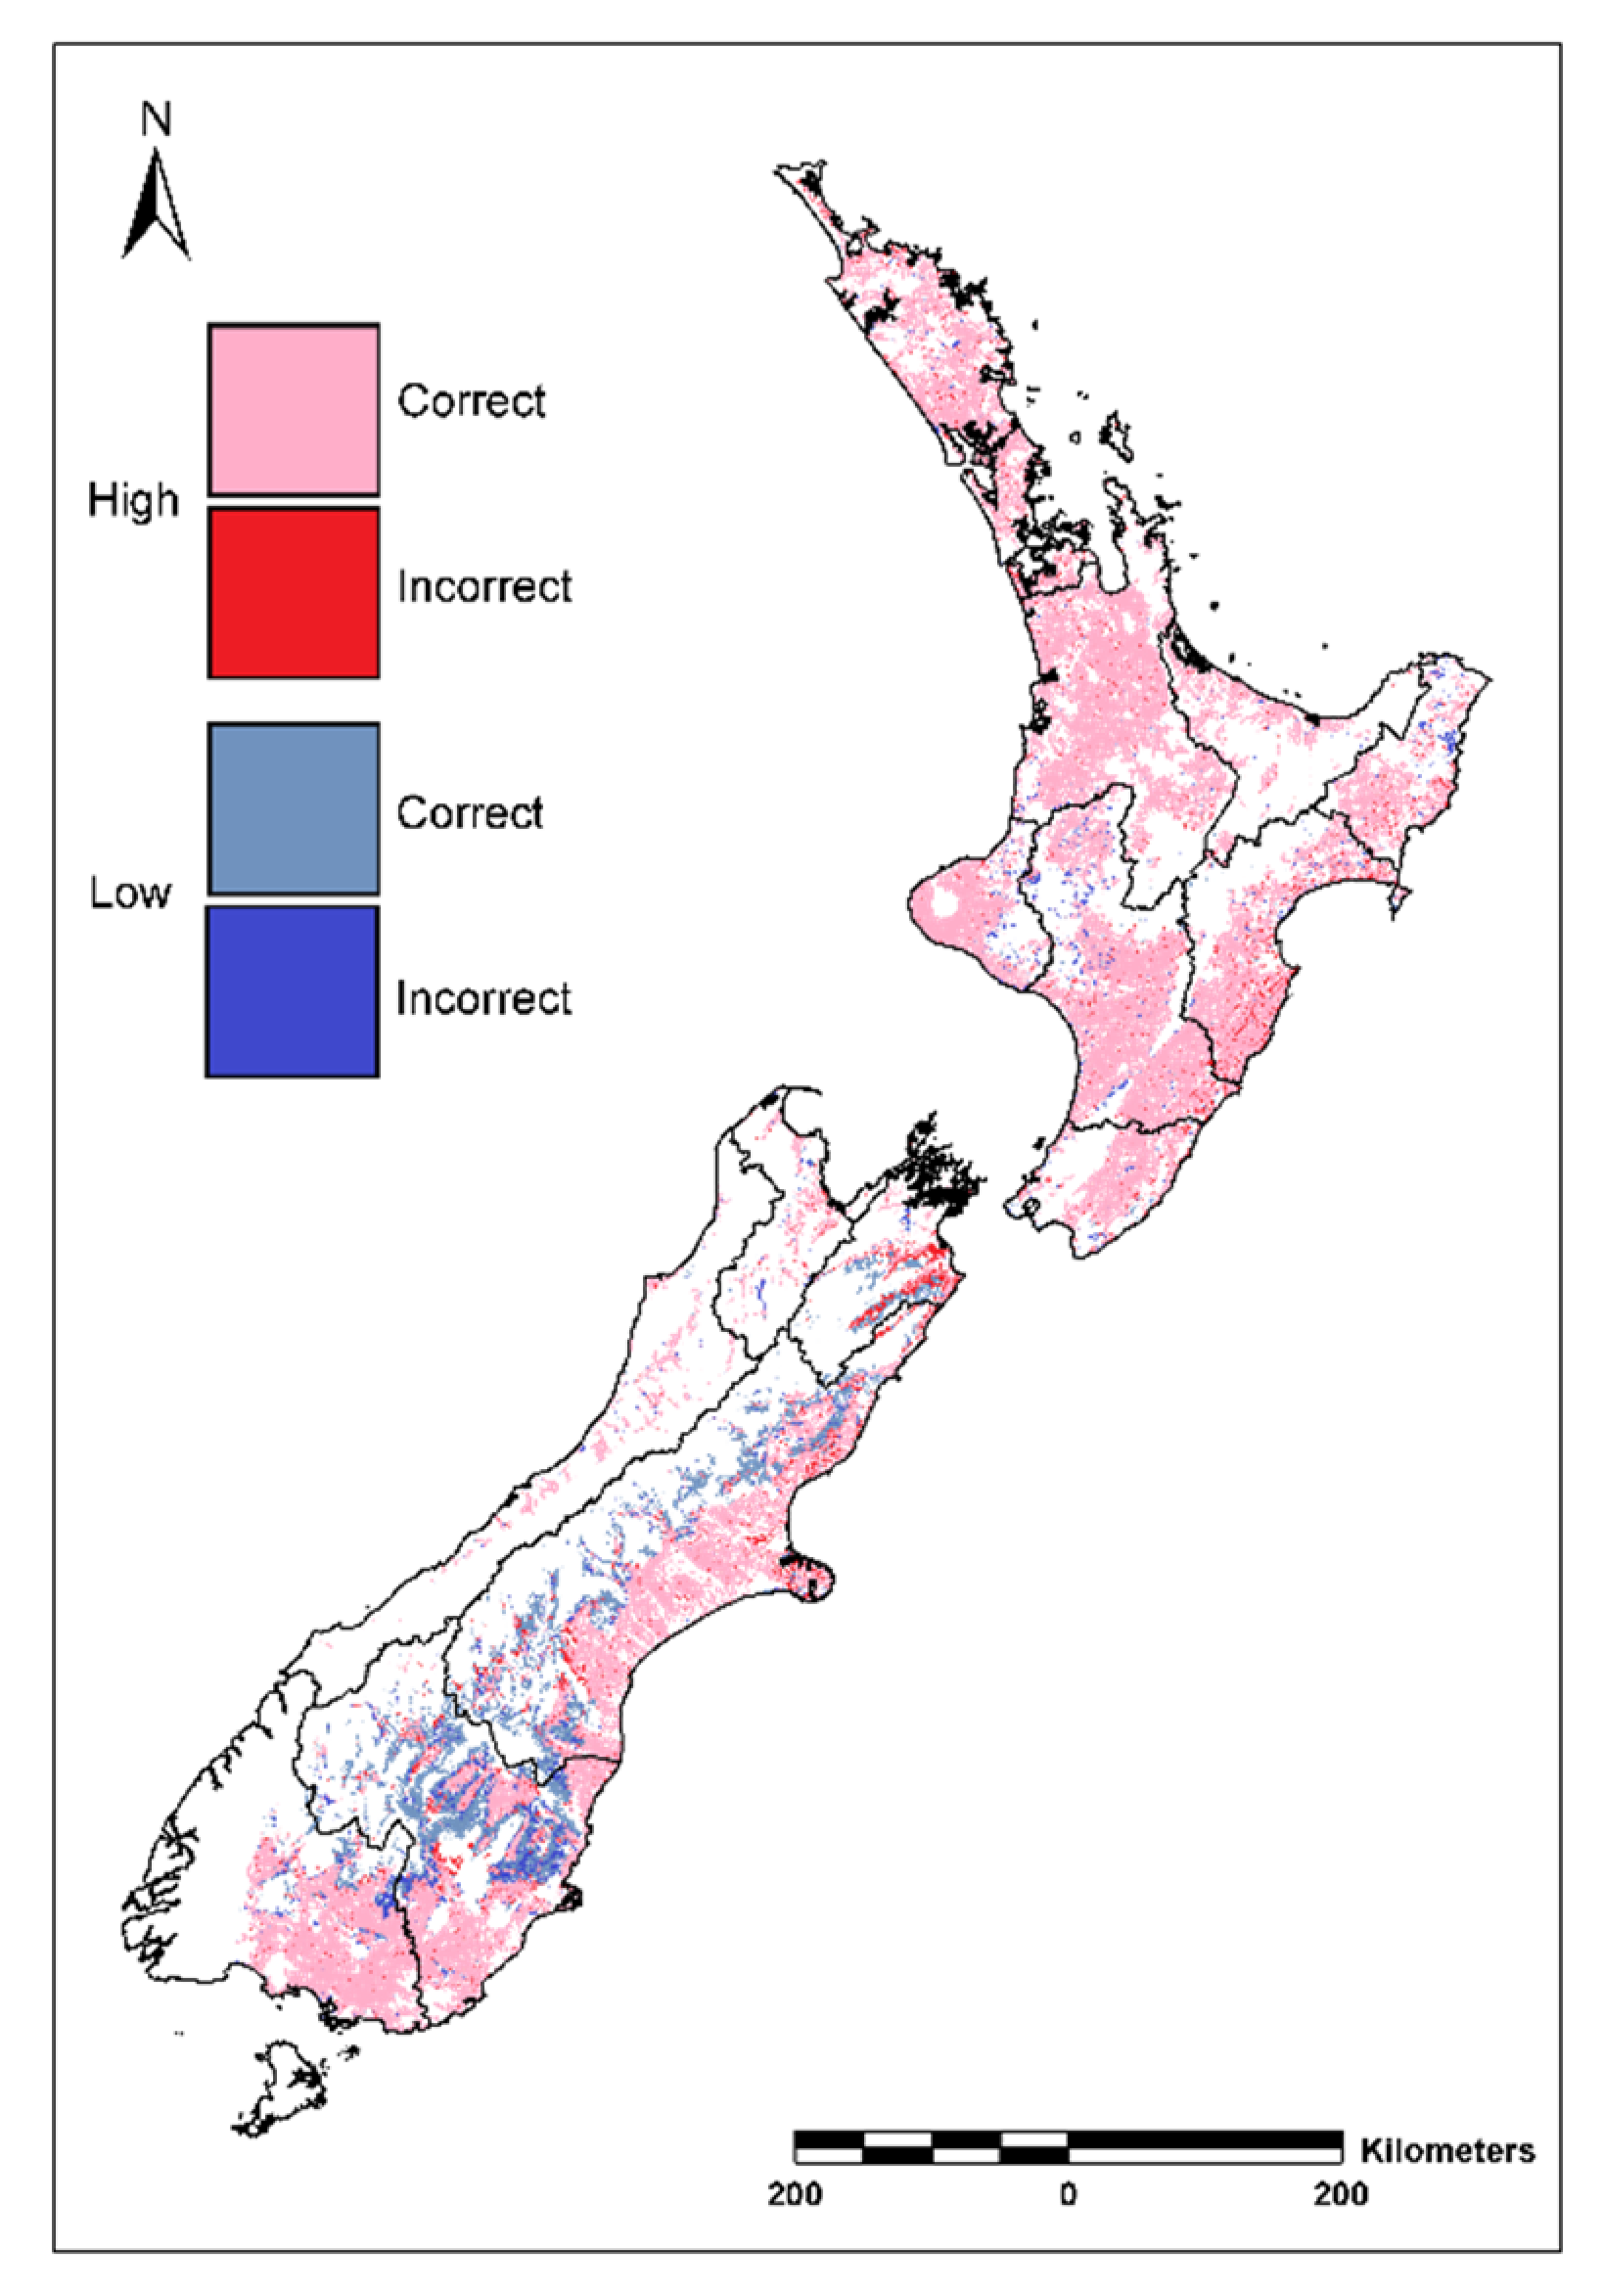

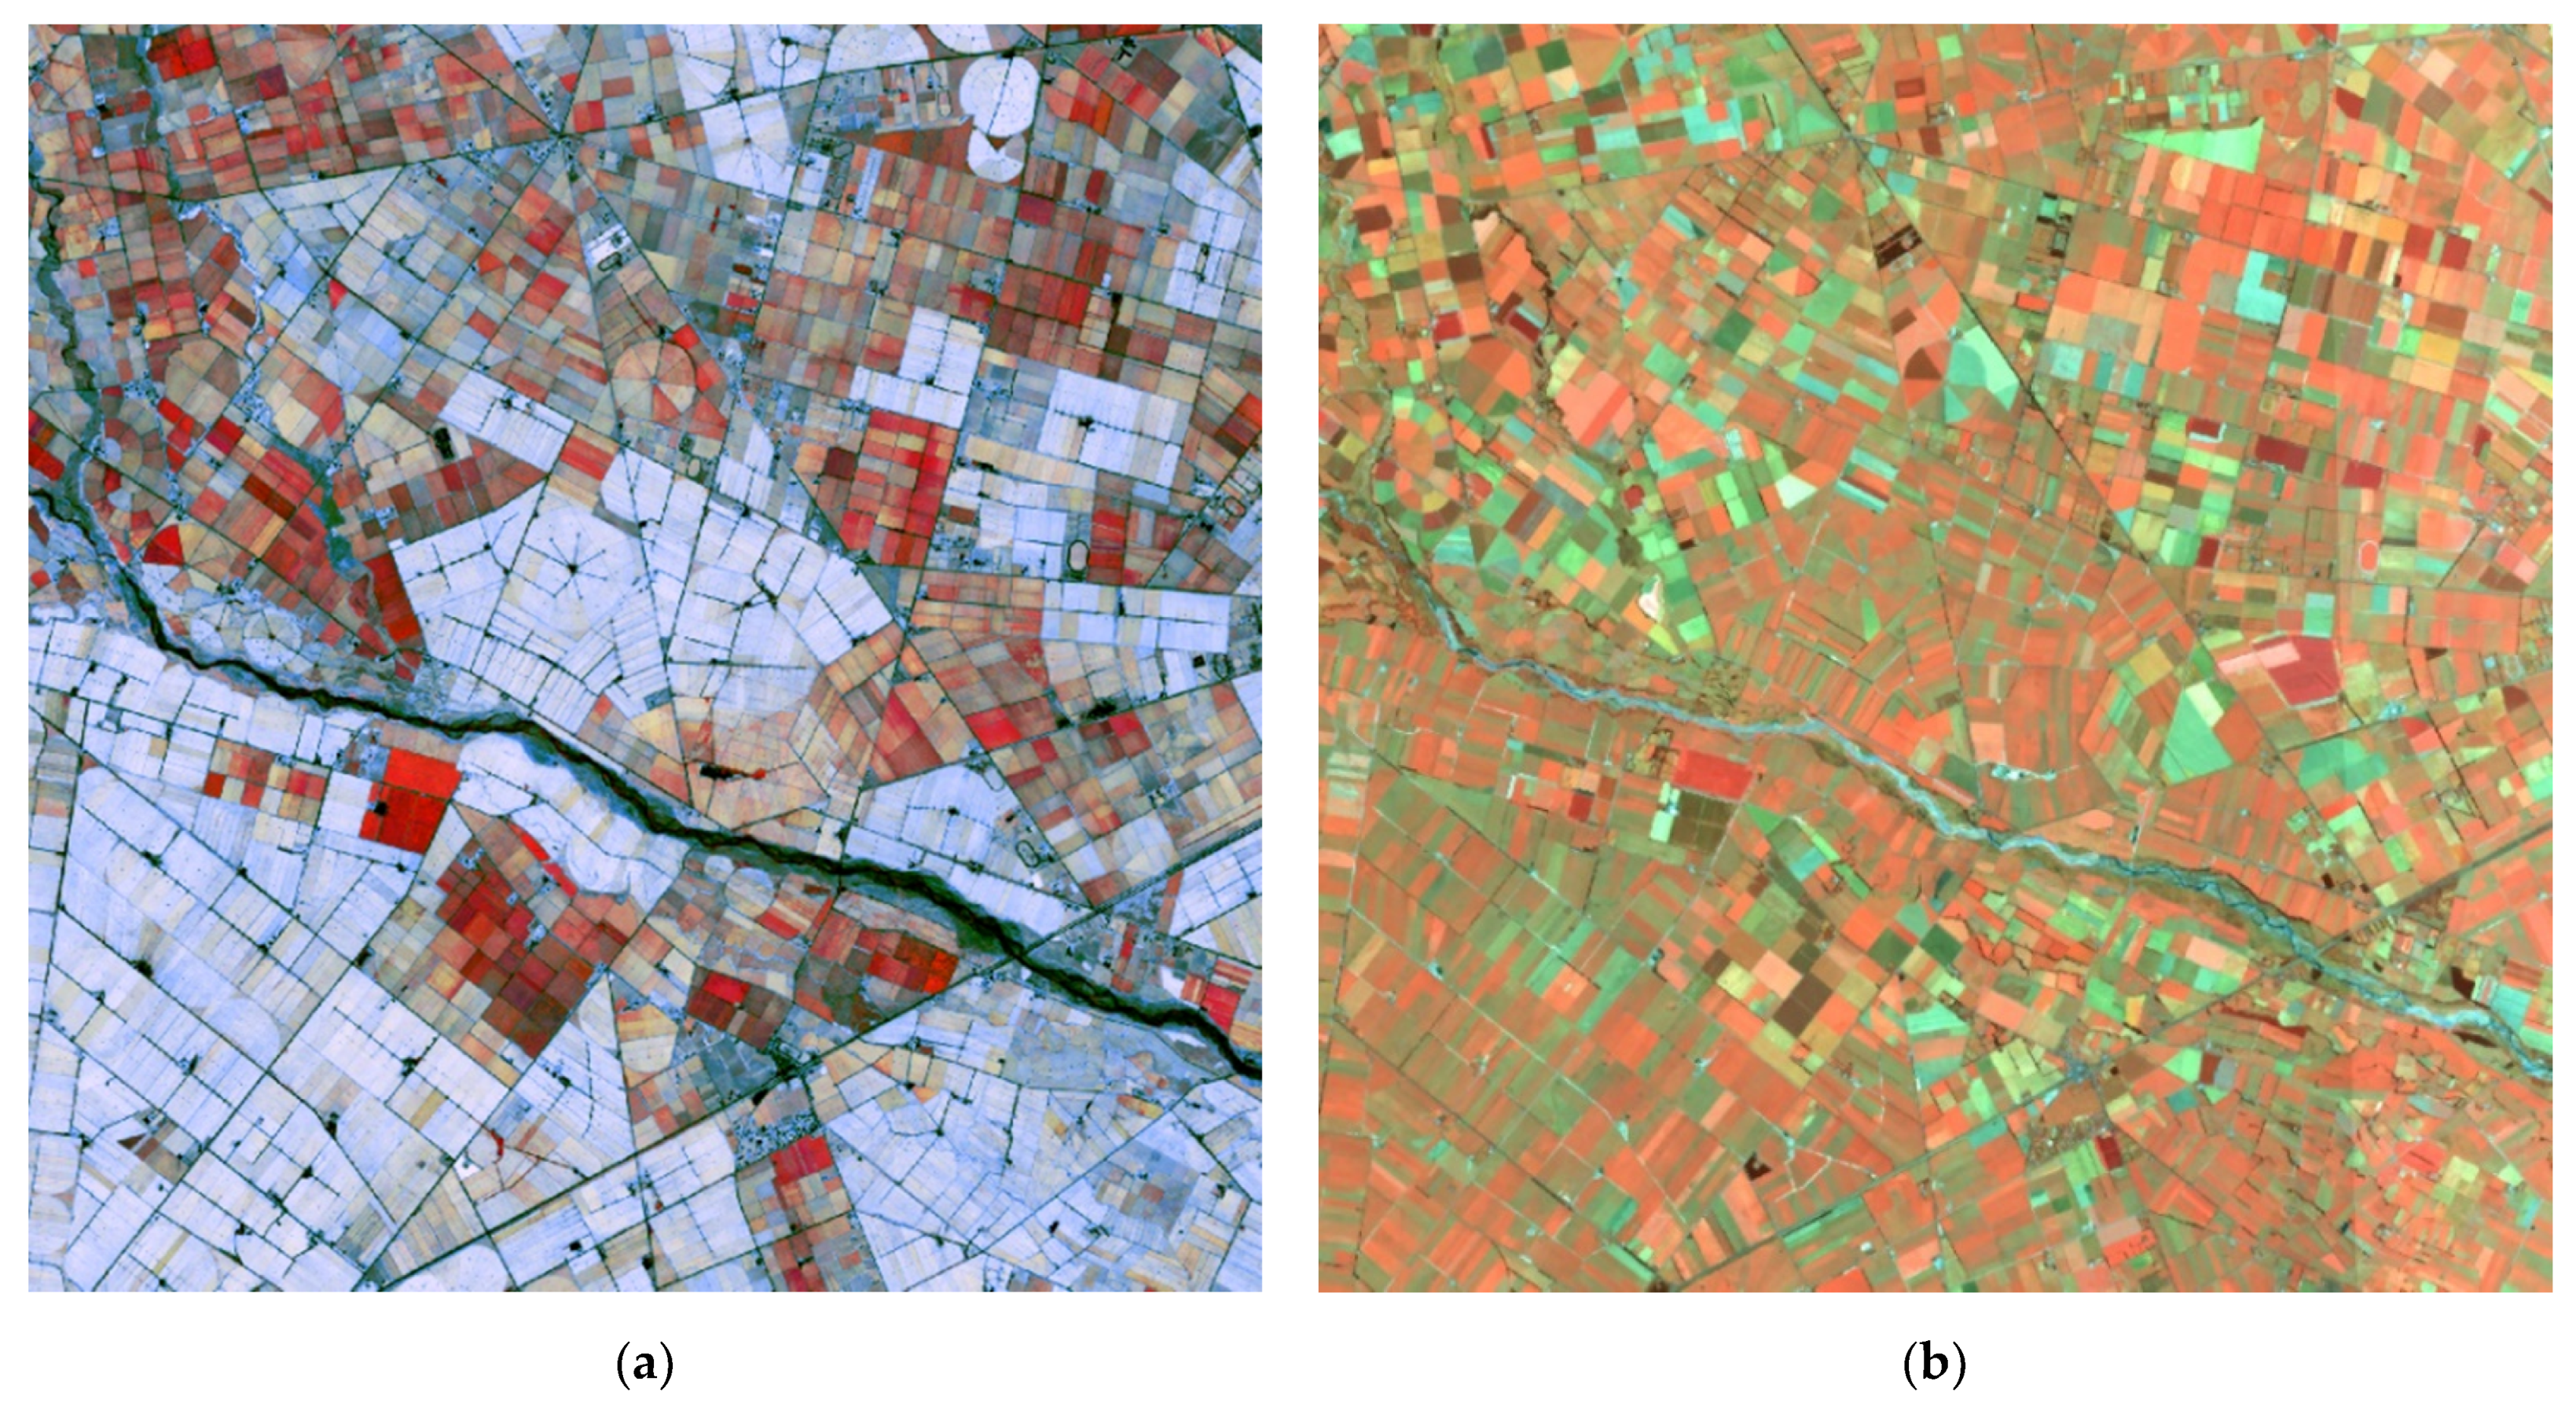
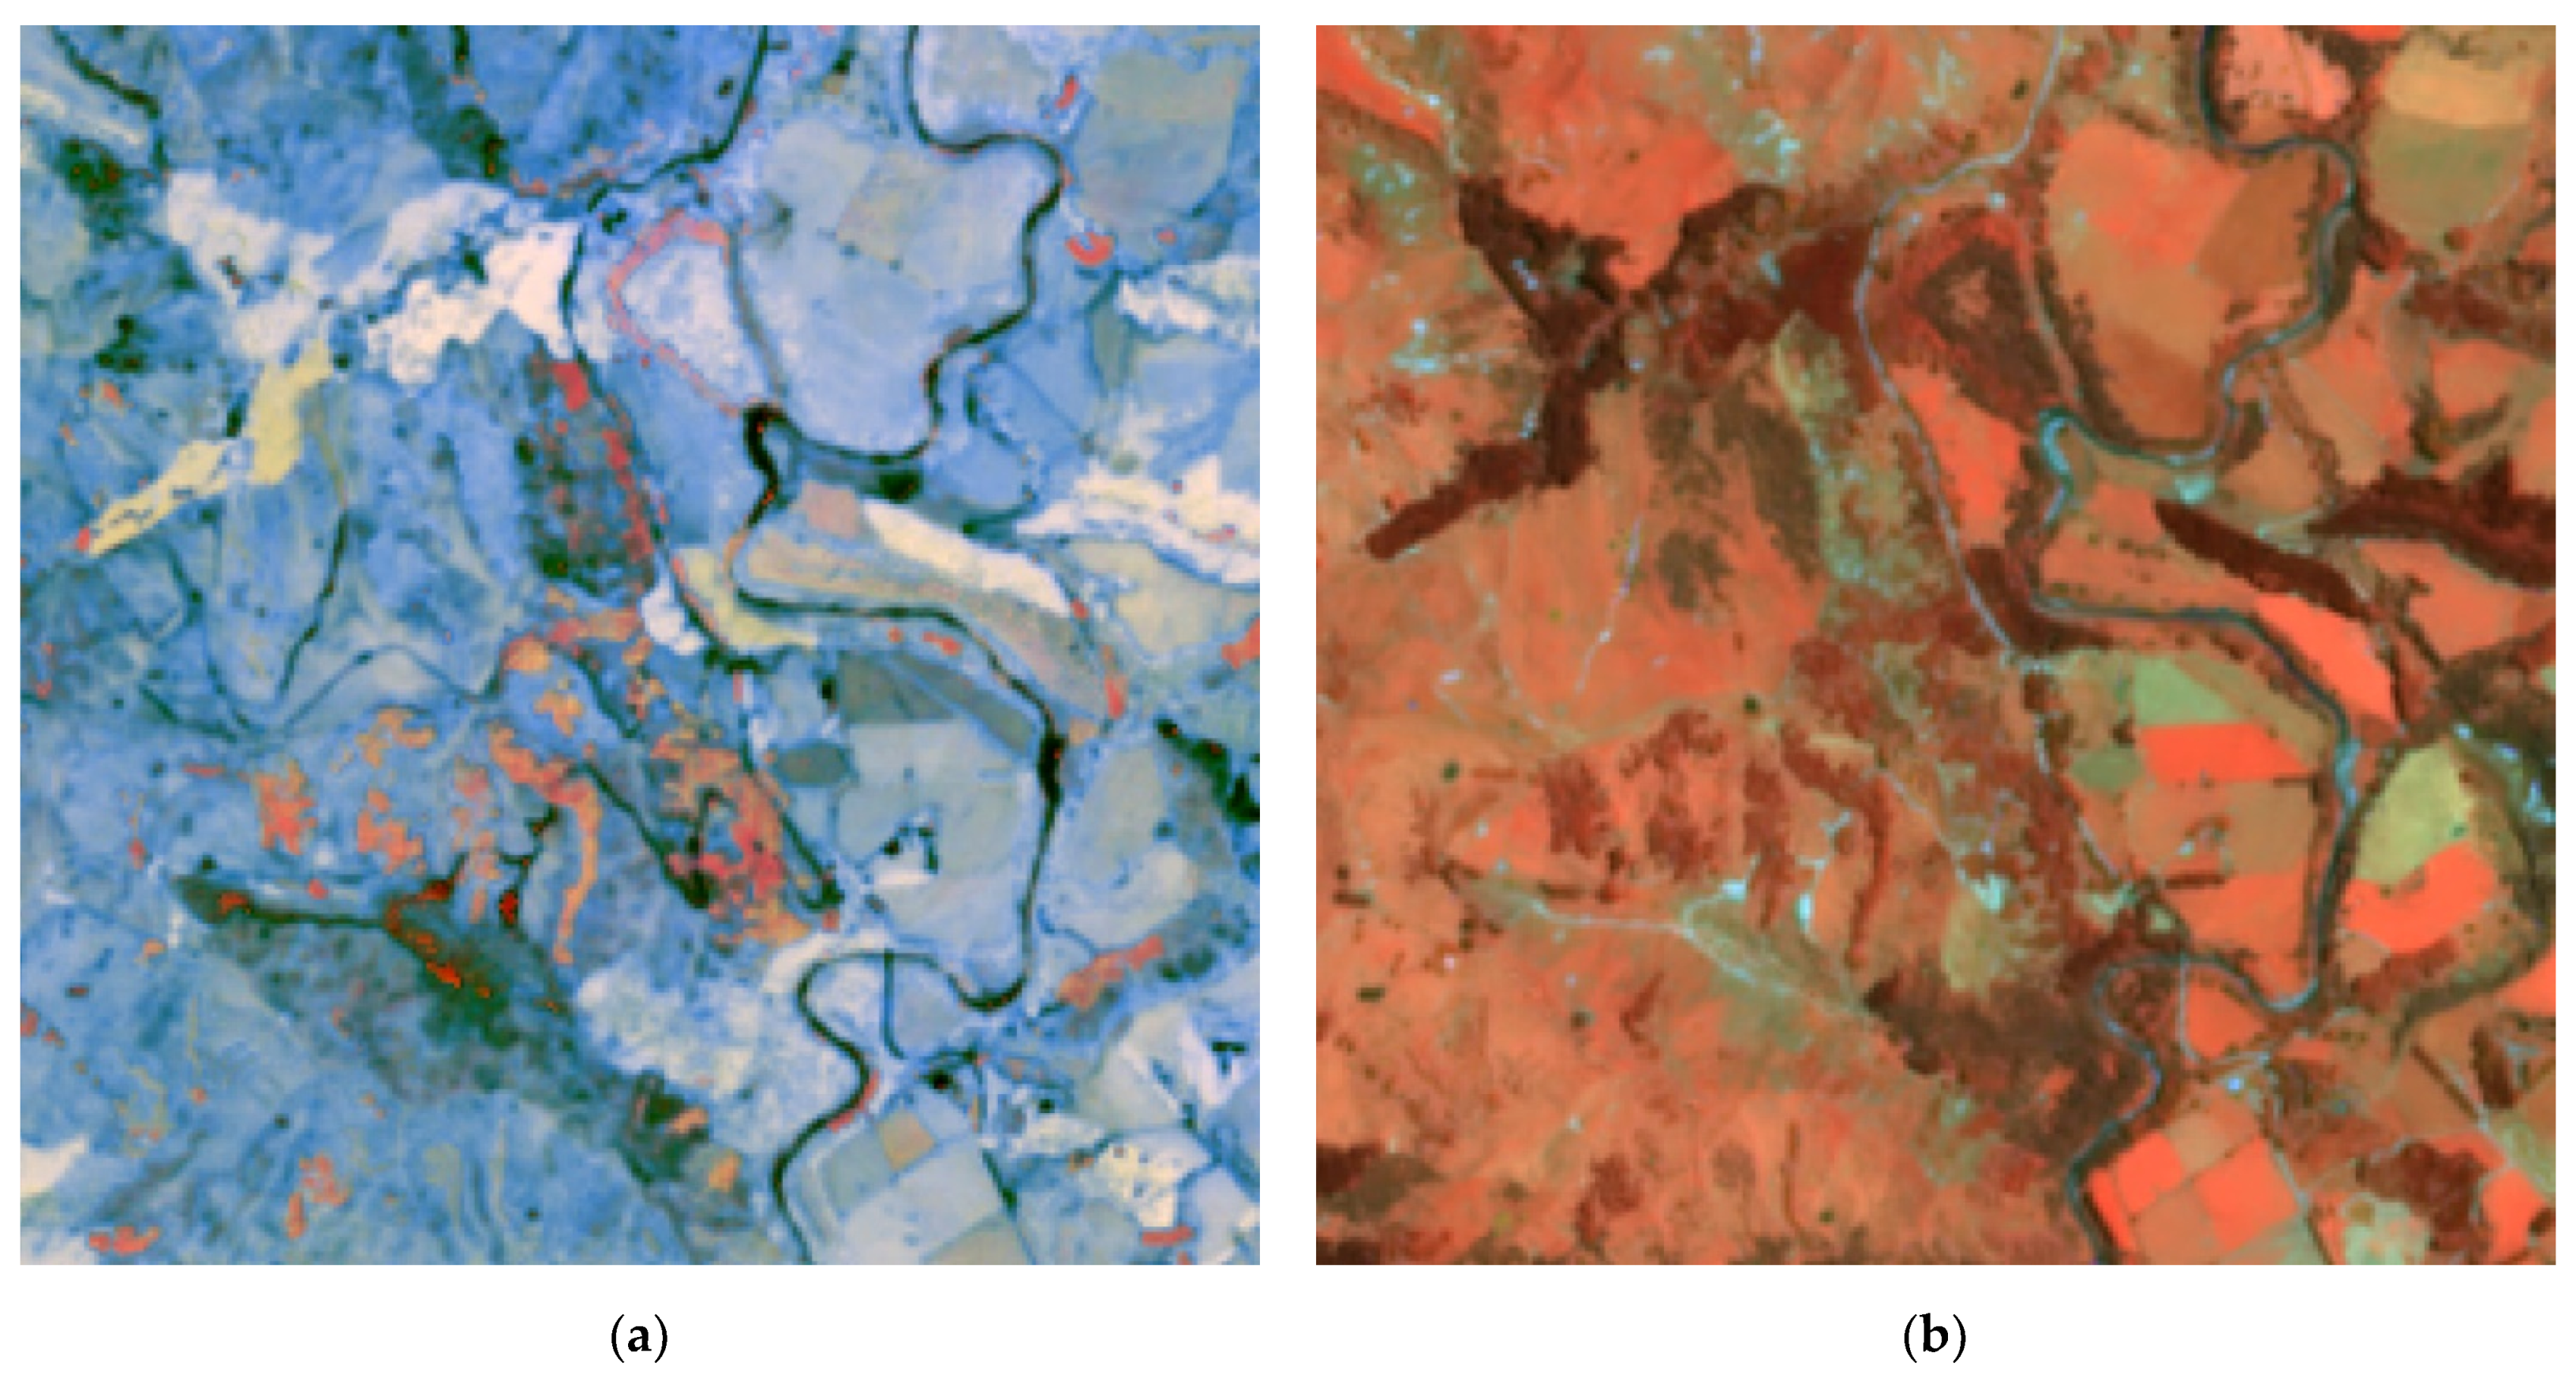
| ID | Location | Region | Dates | Latitude | Longitude | Yield | Source |
|---|---|---|---|---|---|---|---|
| 1 | Ballantrae | Southern Hawkes Bay | 2010–2013 | −40.302507 | 175.843082 | 7.5 | [13] |
| 2 | Ballantrae | Southern Hawkes Bay | 2005–2008 | −40.315197 | 175.835806 | 11.3 | [14] |
| 3 | Taupo Motere | Central Plateau | 2004–2007 | −38.780150 | 175.703780 | 7.8 | [15] |
| 4 | Ballantrae | Southern Hawkes Bay | 2016–2018 | −40.308179 | 175.825518 | 11.9 | [16] |
| 5 | Limestone Downs | Coastal Waikato | 2005–2008 | −37.468969 | 174.751678 | 6.2 | [17] |
| 6 | Limestone Downs | Coastal Waikato | 2005–2008 | −37.459106 | 174.739811 | 10.5 | [17] |
| 7 | Limestone Downs | Coastal Waikato | 2005–2008 | −37.483423 | 174.755535 | 8.0 | [17] |
| 8 | Limestone Downs | Coastal Waikato | 2005–2008 | −37.485536 | 174.756484 | 4.8 | [17] |
| 9 | Woodlands | Southland | 2007–2012 | −46.361536 | 168.601233 | 11.0 | [18] |
| 10 | Seaward Downs | Southland | 2007–2012 | −46.379947 | 168.765976 | 15.6 | [18] |
| 11 | Wallacetown | Southland | 2007–2012 | −46.343730 | 168.273704 | 14.3 | [18] |
| 12 | Riversdale | Southland | 2007–2012 | −45.901116 | 168.723648 | 10.4 | [18] |
| 13 | Tapanui | Otago | 2007–2012 | −45.943107 | 169.229372 | 14.1 | [18] |
| 14 | Telford | Otago | 2007–2012 | −46.295310 | 169.722479 | 14.7 | [18] |
| 15 | Westport | Buller | 2008–2012 | −41.786953 | 171.610288 | 14.2 | [18] |
| 16 | Ikamatua | Grey | 2008–2012 | −42.255964 | 171.675040 | 17.2 | [18] |
| 17 | Kotuku | Grey | 2008–2012 | −42.545579 | 171.466934 | 9.7 | [18] |
| 18 | Kowhitirangi | Westland | 2008–2012 | −42.873994 | 171.016692 | 10.6 | [18] |
| 19 | Ashley Dene | Canterbury | 2012–2017 | −43.643981 | 172.346619 | 10.6 | [19] |
| 20 | Winchmore | Canterbury | 1981–2011 | −43.822160 | 171.713380 | 12.2 | [20] |
| 21 | Te Whanga Station | Wairarapa | 2007–2009 | −41.030738 | 175.729591 | 6.9 | [21] |
| Region | Pasture Fields (ha) | Production Fields (ha) | Yield (Mt/y) | Mean Yield (t/ha/y) |
|---|---|---|---|---|
| Northland | 518,000 | 471,000 | 3.2 | 6.8 |
| Auckland | 187,000 | 168,000 | 1.2 | 7.1 |
| Waikato | 1,134,000 | 1,102,000 | 10.8 | 9.8 |
| Bay of Plenty | 218,000 | 211,000 | 2.0 | 9.7 |
| Gisborne | 308,000 | 284,000 | 2.3 | 7.9 |
| Hawke’s Bay | 619,000 | 549,000 | 4.1 | 7.5 |
| Taranaki | 344,000 | 335,000 | 3.3 | 9.9 |
| Manawatū-Whanganui | 1,114,000 | 1,071,000 | 9.0 | 8.4 |
| Wellington | 323,000 | 297,000 | 2.5 | 8.3 |
| Tasman | 103,000 | 90,000 | 0.8 | 8.6 |
| Nelson | 4000 | 3000 | <0.1 | 6.2 |
| Marlborough | 206,000 | 74,000 | 0.5 | 6.9 |
| West Coast | 134,000 | 129,000 | 1.4 | 10.7 |
| Canterbury | 1,603,000 | 1,046,000 | 9.2 | 8.8 |
| Otago | 1,344,000 | 848,000 | 6.2 | 7.4 |
| Southland | 862,000 | 782,000 | 8.4 | 10.7 |
| Total | 9,021,000 | 7,460,000 | 64.9 | 8.7 |
Publisher’s Note: MDPI stays neutral with regard to jurisdictional claims in published maps and institutional affiliations. |
© 2021 by the authors. Licensee MDPI, Basel, Switzerland. This article is an open access article distributed under the terms and conditions of the Creative Commons Attribution (CC BY) license (https://creativecommons.org/licenses/by/4.0/).
Share and Cite
Amies, A.C.; Dymond, J.R.; Shepherd, J.D.; Pairman, D.; Hoogendoorn, C.; Sabetizade, M.; Belliss, S.E. National Mapping of New Zealand Pasture Productivity Using Temporal Sentinel-2 Data. Remote Sens. 2021, 13, 1481. https://doi.org/10.3390/rs13081481
Amies AC, Dymond JR, Shepherd JD, Pairman D, Hoogendoorn C, Sabetizade M, Belliss SE. National Mapping of New Zealand Pasture Productivity Using Temporal Sentinel-2 Data. Remote Sensing. 2021; 13(8):1481. https://doi.org/10.3390/rs13081481
Chicago/Turabian StyleAmies, Alexander C., John R. Dymond, James D. Shepherd, David Pairman, Coby Hoogendoorn, Marmar Sabetizade, and Stella E. Belliss. 2021. "National Mapping of New Zealand Pasture Productivity Using Temporal Sentinel-2 Data" Remote Sensing 13, no. 8: 1481. https://doi.org/10.3390/rs13081481
APA StyleAmies, A. C., Dymond, J. R., Shepherd, J. D., Pairman, D., Hoogendoorn, C., Sabetizade, M., & Belliss, S. E. (2021). National Mapping of New Zealand Pasture Productivity Using Temporal Sentinel-2 Data. Remote Sensing, 13(8), 1481. https://doi.org/10.3390/rs13081481


