Article

A CNN-Based High-Accuracy Registration for Remote Sensing Images

1
Department of Computer Engineering, Kwangwoon University, Seoul 139701, Korea
2
Department of Electronic Engineering, Kwangwoon University, Seoul 139701, Korea
*
Author to whom correspondence should be addressed.
Remote Sens. 2021, 13(8), 1482; https://doi.org/10.3390/rs13081482
Submission received: 17 March 2021 / Revised: 5 April 2021 / Accepted: 10 April 2021 / Published: 12 April 2021
(This article belongs to the Section AI Remote Sensing)

Abstract

:
In this paper, a convolutional neural network-based registration framework is proposed for remote sensing to improve the registration accuracy between two remote-sensed images acquired from different times and viewpoints. The proposed framework consists of four stages. In the first stage, key-points are extracted from two input images—a reference and a sensed image. Then, a patch is constructed at each key-point. The second stage consists of three processes for patch matching—candidate patch pair list generation, one-to-one matched label selection, and geometric distortion compensation. One-to-one matched patch pairs between two images are found, and the exact matching is found by compensating for geometric distortions in the matched patch pairs. A global geometric affine parameter set is computed using the random sample consensus algorithm (RANSAC) algorithm in the third stage. Finally, a registered image is generated after warping the input sensed image using the affine parameter set. The proposed high-accuracy registration framework is evaluated using the KOMPSAT-3 dataset by comparing the conventional frameworks based on machine learning and deep-learning-based frameworks. The proposed framework obtains the least root mean square error value of 34.922 based on all control points and achieves a 68.4% increase in the matching accuracy compared with the conventional registration framework.

1. Introduction

Image registration is the process of geometric synchronization between a reference image and a current image from the same area. These images are acquired from different times and viewpoints by different sensors [1]. Thus, image registration is an essential preprocess step in many remote sensing applications because the main process, which includes change detection, image fusion, image mosaic, environment monitoring, and map updating can be drastically influenced by these differences [1,2]. Many types of image registration techniques have been developed in the areas of remote sensing over the past few decades. The registration frameworks can be classified into two categories—area-based frameworks and feature-based frameworks [1].
We introduce the two conventional image registration frameworks for the two categories—area-based frameworks and feature-based frameworks. In area-based frameworks, the registration problem is transformed into an optimization problem, where the similarity between reference and sensed images is maximized. Conventional area-based registration frameworks find correspondences at multiple key-points between input and reference images using similarity measures such as mutual information (MI) [3,4] or normalized cross-correlation (NCC) [5]. The detected correspondences are used in the estimation of the global geometric transform. However, they are sensitive to illumination changes and noise [1]. Liang et al. proposed spatial and mutual information (SMI) as the similarity metric for searching similar local regions using ant colony optimization [3]. Patel and Thakar employed mutual information (MI) based on maximum likelihood to expedite MI computation [4]. In contrast, feature-based frameworks are less susceptible to attacks and geometric distortions as they involve the matching of prominent features, such as points, lines, and regions. Scale invariant feature transform (SIFT) [6], speeded-up robust features [7], histogram of oriented gradients [8], and maximally stable extremal regions [9] are some of the widely applied feature detectors in practice. The SIFT-based framework is a well-known geometric transform approach [10]. Other approaches focus on the shape features or geometric structures. Ye et al. proposed the histogram of oriented phase congruency as a feature descriptor representing the structural properties of images, and then they used NCC as a reference matching similarity metric [11]. Yang et al. proposed a combination of shape context features and SIFT feature descriptors for remote sensing image registration [12]. There are approaches that integrate the advantages of the area-based and feature-based frameworks. The iterative multi-level strategy proposed by Xu at el. could re-extract and re-match features by adjusting the parameters [13]. The coarse-to-fine image registration framework by Gong et al. acquired coarse results from SIFT and then obtained precise registration based on MI [14].
Conventional feature-based frameworks require domain knowledge to design a feature extractor. This makes the handcrafted features less generic for diverse applications and data. Researchers often recommend feature-based frameworks if the images contain distinct artifacts. Feature-based frameworks are used in remote sensing image applications because the remote sensing images contain distinct artifacts [1]. To ensure the accuracy of feature-based frameworks, a well-designed feature extractor that can extract reliable features through trial and error is required. Aerial images used for remote sensing applications contain a large amount of appearance distortions caused by radiometric and geometric factors, attitude acquisition-related factors, seasonal factors, and so on. Consequently, many registration frameworks suffer poor correspondence between points detected by handcrafted feature extractors. In worst-case scenarios, these handcrafted feature extractors may be unable to detect a sufficient number of correspondence points to achieve satisfactory registration.
In recent years, deep learning has proven to be superior and robust in the field of remote sensing imaging—object detection [15,16], image classification [17,18], and image registration [19]. In particular, patch-based convolutional neural network (CNN) architectures have been extensively used in the area of image matching. Finding accurate correspondences between patches is instrumental to a broad range of applications, including wide-baseline stereo matching, multi-view reconstruction, image stitching, and structure from motion. Conventional patch matching methods use handcrafted features and distance measures. Zagoruyko and Komodakis proposed a CNN-based model that directly trains a general similarity function for comparing image patches from image data [20]. CNNs can generate powerful feature descriptors that are more robust to appearance changes than classical descriptors. These approaches divide the input image into a set of local patches and extract descriptors individually from each patch. The extracted descriptors are then compared with an appropriate distance measure to measure the similarity score even for a binary matching/unmatching decision. Han et al. proposed “MatchNet”, which extracts patch pair features from two identical CNNs via the Siamese network for image patch matching [21]. Alternatively, Zagoruyko and his colleagues proposed an image matching method by training the joint features of patches from two input images and evaluating the features extracted from two similar CNNs or two different CNNs [22].
Wang and his colleagues proposed a deep learning framework for remote sensing image registration [19]. They employed the deep belief network (DBN) to maintain the invariance feature against the distortion characteristics of remote-sensed images. Unlike conventional feature-based frameworks, their proposal directly trained an end-to-end mapping function by taking the image patch pairs as inputs using DBN and matching the labels as output. Furthermore, they attempted to reduce the computation cost in the training step. Their framework not only reduced the training time but also demonstrated better registration performance. As vectorized one-dimensional data from two-dimensional images are fed into the DBN, which may remove the spatial information for patch matching, they cannot handle geometric invariances in terms of rotation, translation, scale, shearing and so on. These variance factors in DBN may generate distortion in the registration result. To address this problem, Lee and Oh have proposed a MatchNet-based method which can improve the registration accuracy by maintaining the spatial information of features [23]. However, there still exists geometric distortion as shown in Figure 1. Rocco and his colleagues recently proposed the CNN architecture for geometric matching where they could handle global changes of appearance and incorrect matches between two matched images in a robust way [24]. However, it is not efficient to apply their model to applications which require a precise local patch matching process in each matched patch of two input images such as remote sensing image registration. Therefore, their robust model should be modified for remote sensing image registration.
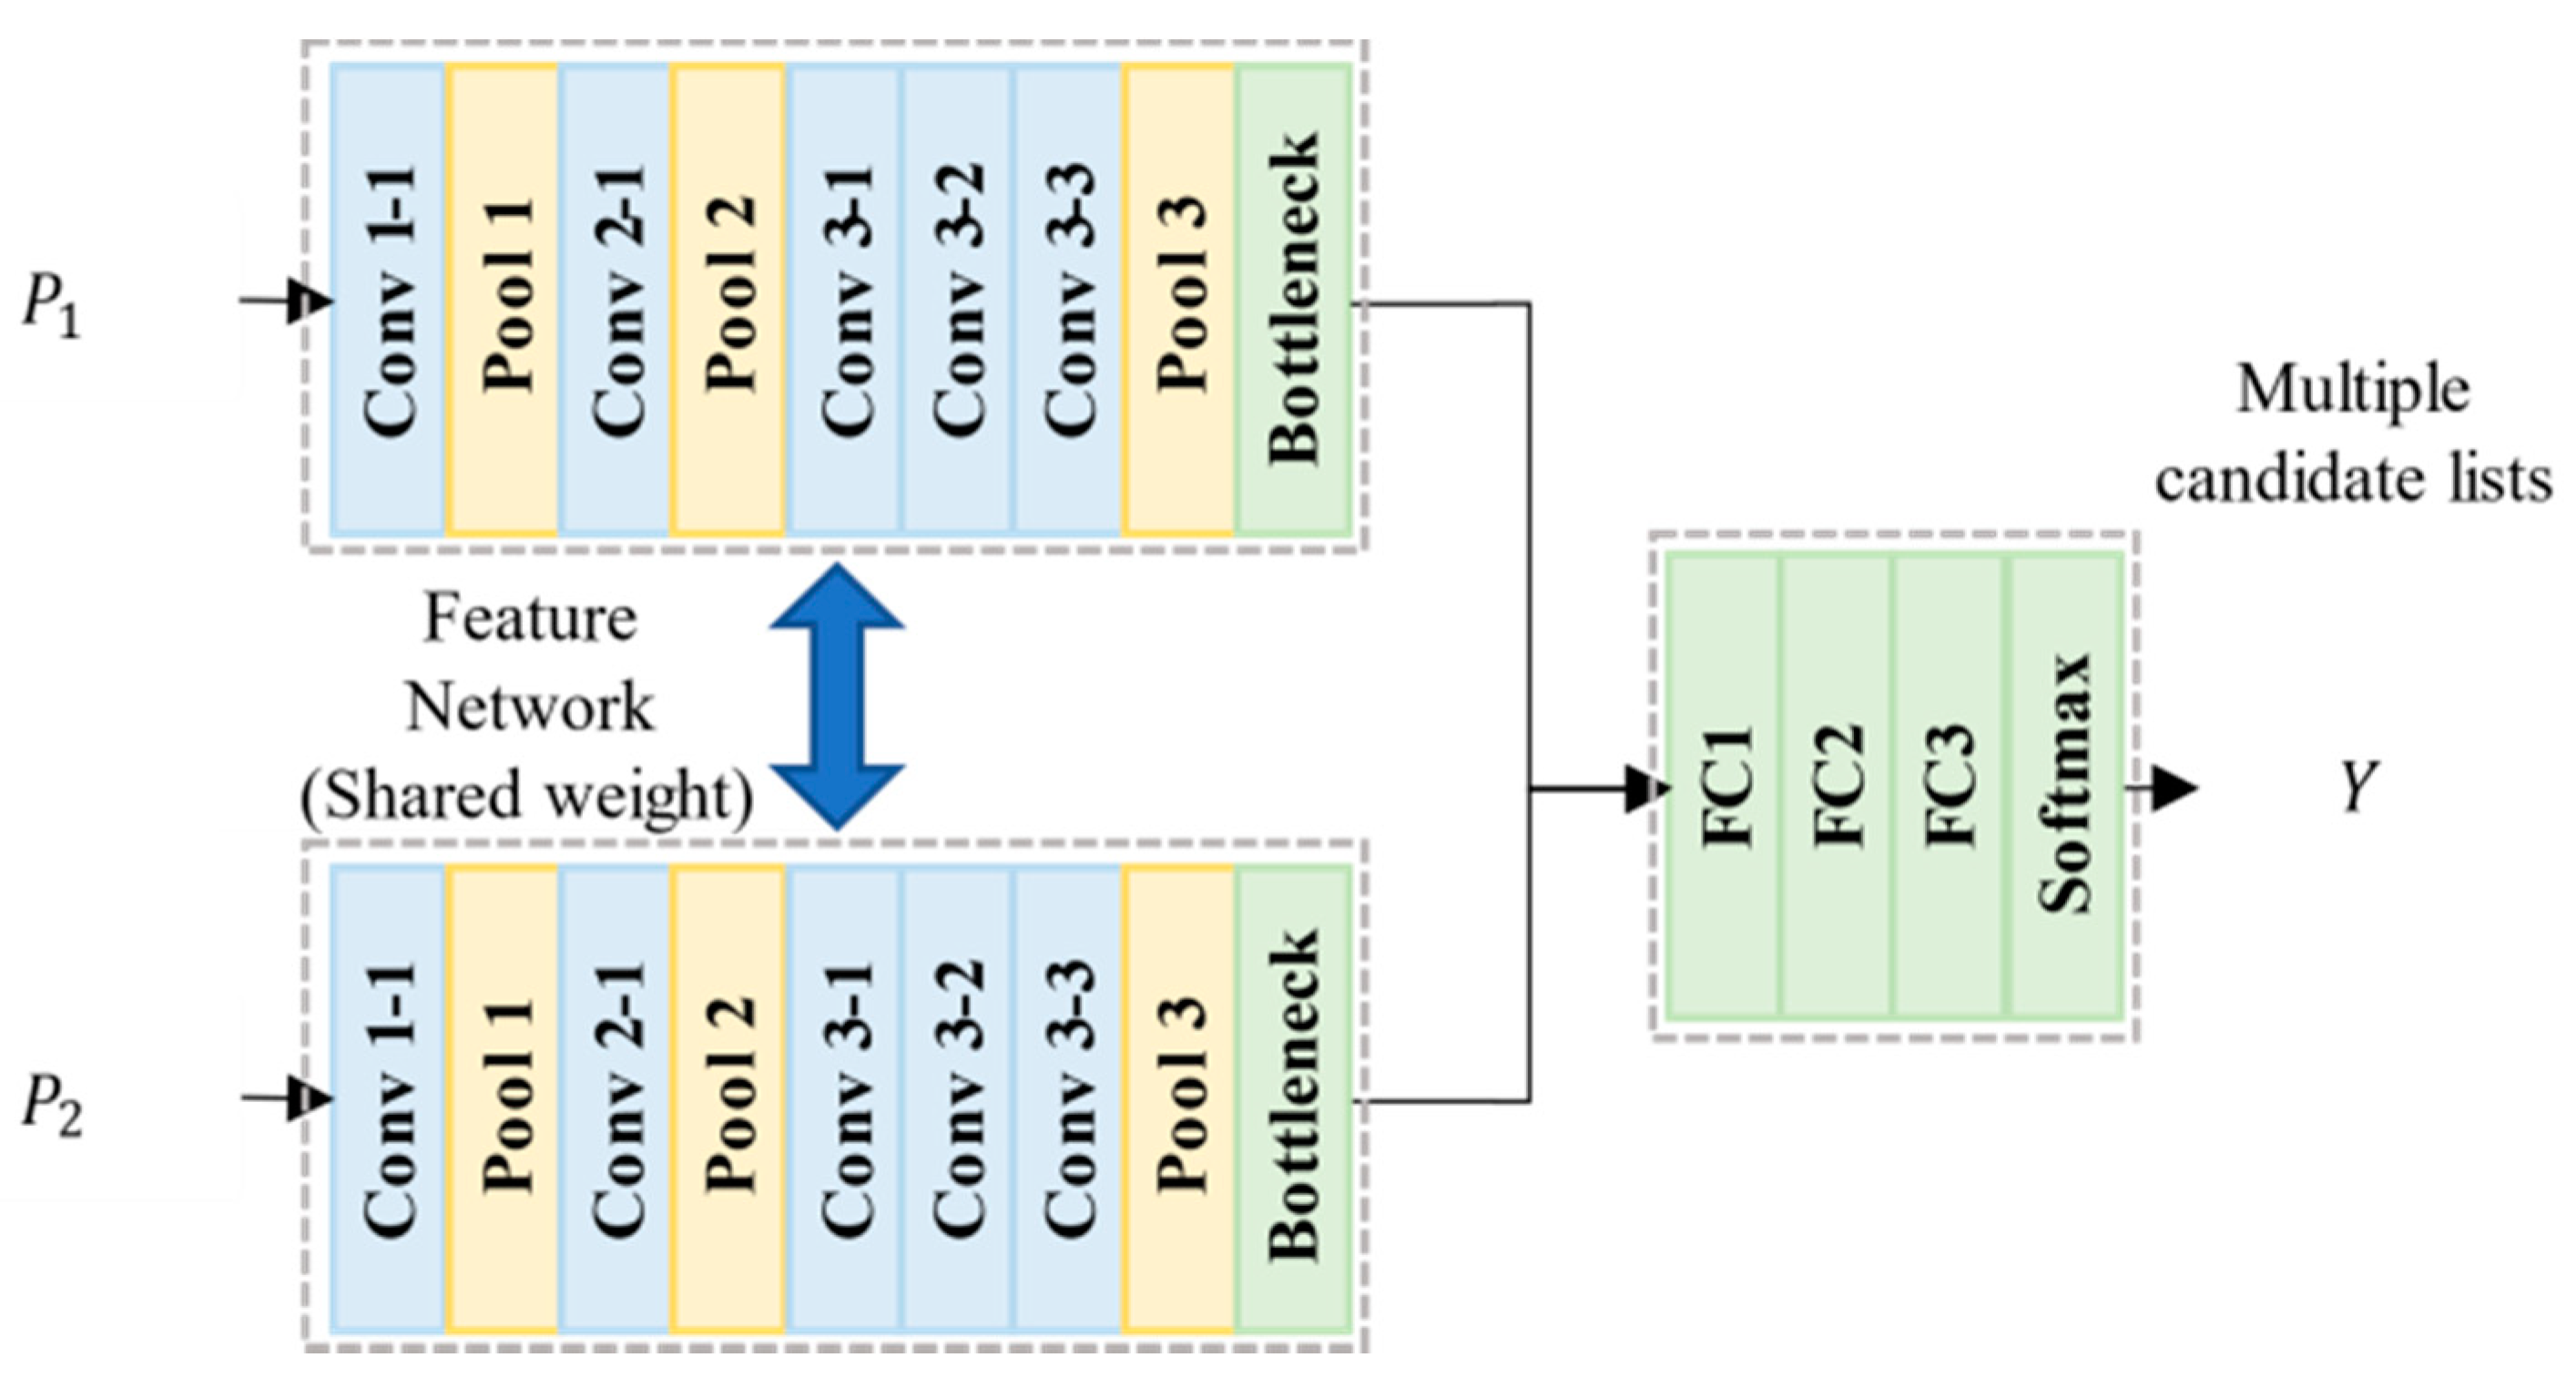
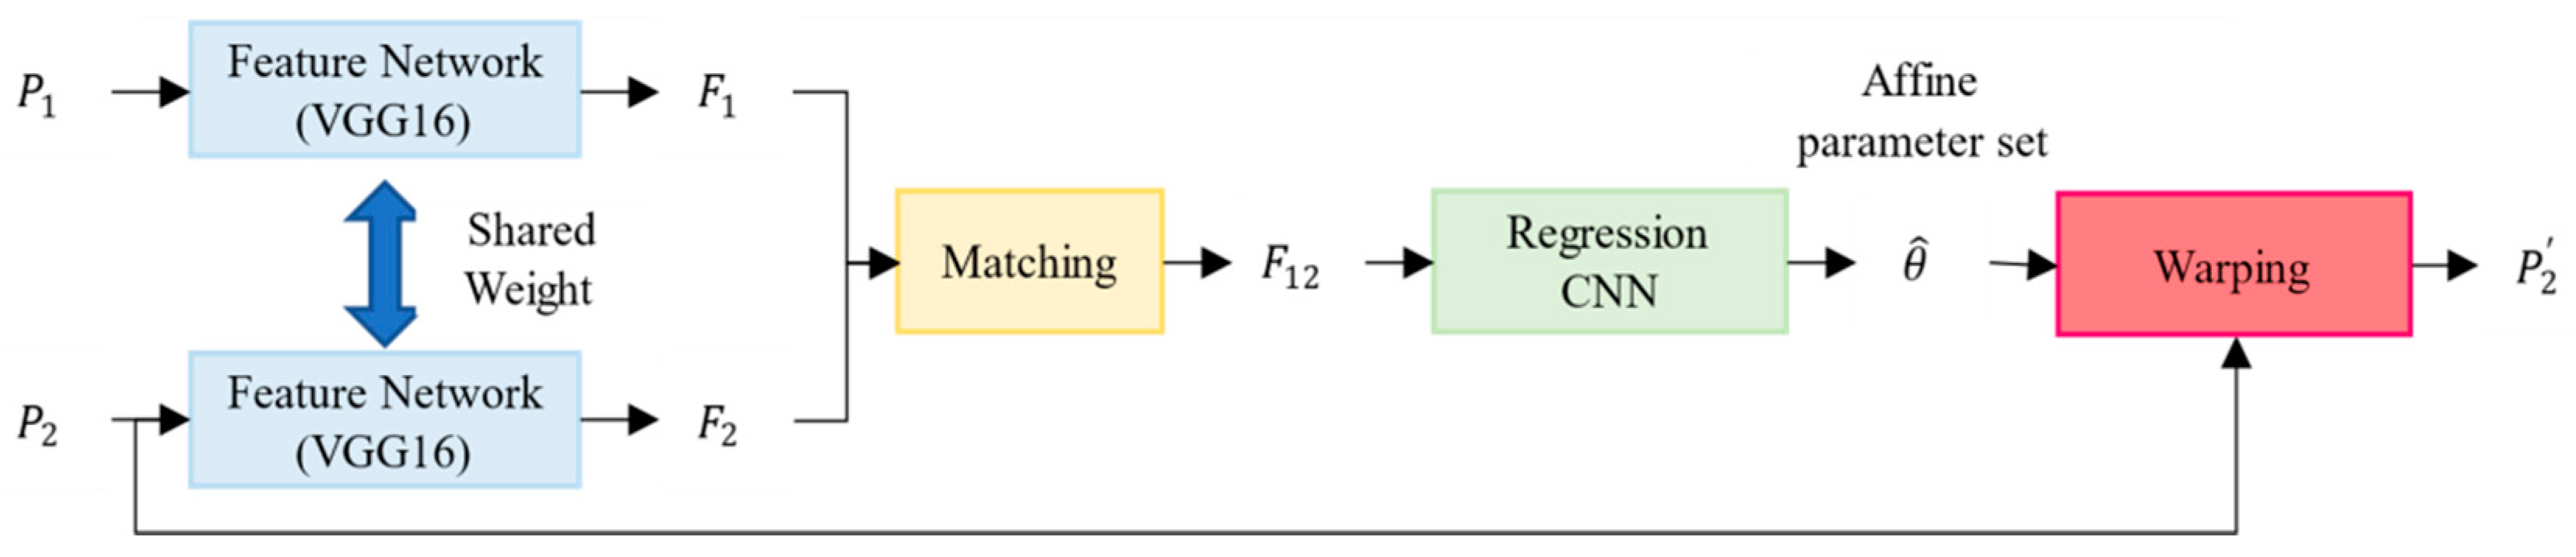
In this paper, we propose a CNN-based registration framework for remote sensing that can improve the registration accuracy between two remote-sensed images acquired from different times and viewpoints. The framework can be summarized as follows: First, multiple key-points and their patches are extracted from two input images using scale–space extrema detection. Each patch contains one key-point at its center. Using the conventional network, finding the corresponding patch pair in the matching step would yield geometric distortions, such as translation, scale, and shearing because learning the invariance mapping function is difficult. For an accurate local patch matching process, we adopt the geometric CNN proposed in [24] to compensate the geometric distortion of each matched patch pair. From now on, the geometric CNN is called GMatchNet. A local geometric transformation is estimated from each matched patch pair. Using this local geometric transform, the corresponding center coordinate of each input patch is finely adjusted. Then, we compute the global geometric affine parameter set from all the adjusted coordinates by the random sample consensus algorithm (RANSAC). Finally, a registered image is generated after warping the input sensed image by the global affine parameter set. The proposed framework is evaluated on the KOMPSAT-3 dataset by comparing the conventional frameworks based on machine learning and deep-learning-based frameworks. We perform registration of images in which magnetic north is aligned with the universal transverse Mercator coordinate system. It is shown that the proposed high-accuracy registration framework can improve the accuracy of image registration by compensating the geometric distortion between matched patch pairs and can be applied to other registration frameworks based on patches.
The remainder of this paper is structured as follows: Section 2 introduces related work on image registration, deep learning, and patch matching. Section 3 details the proposed registration framework that uses the estimated geometric transformation in the corresponding patch pairs. Section 4 discusses the experimental results, and, finally, Section 4 summarizes the conclusions of the study.

2. High-Accuracy Registration Framework

The proposed framework consists of two different CNNs—MatchNet [21] and GMatchNet [24], as shown in Figure 2. First, multiple key-points and their patches were extracted from the reference image and the sensed image. Note that each patch (64 × 64 pixels) includes one key-point at its center. The next stage consists of three distinct processes for patch matching. For each reference patch of the reference image, multiple candidate lists were selected from the sensed image by MatchNet. Then, one-to-one matched labels for each reference patch were determined for its matched candidate lists based on cross correlation. The local affine parameter set was estimated between each input patch from the output of matched labels selection by GMatchNet, and the coordinate of the matched patch was finely adjusted using a local transformation. Then, the global geometric affine parameter set was computed from all the adjusted reference coordinates using the RANSAC algorithm. Finally, the warping process was performed to geometrically synchronize the reference image and sensed image.

2.1. Patch Extraction Based on Scale–Space Extrema

In the first stage of key-point detection, the locations and scales that can be repeatably assigned for different views of a same object were identified. Locations that are invariant to a change in the scale of the image can be detected by searching for stable features across all possible scales using a continuous function of scale known as the scale–space. Subsequently, the Laplacian of Gaussian (LoG) for the image with various standard deviation ( σ ) values was determined. The LoG operates as a blob detector that detects blobs in various sizes due to changes in σ . However, the LoG requires, to some extent, a heavier computational load. Therefore, the proposed framework adopts the difference of Gaussians (DoG), which approximates the LoG. The DoG is the difference between the Gaussian blurring of an image with two different standard deviations, denoted by σ and k σ . When this DoG is generated, the local extrema are retrieved from the image, which results in the key-points. Lowe proposed several empirical parameter set, the number of octaves set to 4, number of scale levels set to 5, initial σ set to 1.6, and k set to 2 [6]. In the second step, the detected key-points as the central point were used to extract the image patches with a size of 64 × 64 pixels. Here, we assumed that the reference images and the sensed images are I 1 and I 2 , respectively. If I 1 has m key-points, then the patches are P 1 = { p 1 1 ,   p 1 2 , , p 1 m } . If I 2 has n key-points, the patches are P 2 = { p 2 1 ,   p 2 2 , , p 2 n } . Thus, we can acquire the image patch pairs { ( p 1 i , p 2 j ) } by combining the patches in images I 1 and I 2 , where i = 1 , 2 , , m , j = 1 , 2 , , n .

2.2. Training Method for Matched Candidate List Generation

MatchNet is a deep network architecture that determines the correspondence of two images by analyzing the similarity of features in two input images. The structure of MatchNet is illustrated in Figure 3, and its layer parameters are listed in Table 1. To compare the similarity of two patches, they are first passed through the same feature network. In the training stage, only one of the two feature networks is trained, while the other shares parameters.
The performance of MatchNet strongly depends on sufficient training dataset for optimizing parameters. However, it is difficult to obtain a labeled remote sensing image dataset. Thus, we adopt augmentation to construct a training dataset. The augmented dataset consists of remote sensing images transformed by a set of rotation matrices, where θ = { 0 ° , 90 ° , 180 ° , 270 ° } . Let P i and M be the i-th image patch and the number of image patches, respectively. Then, P i can be transformed to an image set of R θ ( P i ) . The patch size of MatchNet is 64 × 64. The matched patch pairs are { ( P i , R θ ( P j ) ) , i = j   and   θ = 0 ° } and unmatched patch pairs { ( P i , R θ ( P j ) ) , i = j   and   θ 0 ° } and { ( P i , R θ ( P j ) ) , i j } , where i and j = 1 , 2 , M . Therefore, the structure of a training sample is { ( P i , R θ ( P j ) ) , y i j θ } .
y i j θ = { 1 ,   i = j   and   θ = 0 ° 0 ,   otherwise                    
Figure 4 illustrates examples of training patch pairs. The feature and metric networks were jointly trained in a supervised setting using the Siamese structure. The training dataset was constructed with a matched patch pairs to unmatched patch pairs ratio of 1:1 using the sampling method [21]. The cross-entropy error was minimized over a training set of n patch pairs using the SGD with momentum. The cross-entropy was defined by
E = 1 n i = 1 n [ y i log ( y i ^ ) + ( 1 y i ) log ( 1 y i ^ ) ]
The training parameters were set as follows: 200 iterations of MatchNet training and a learning rate of 0.01, a batch size of 32, and a momentum item parameter of 0.9 [21].

2.3. Matched Label Selection

In the matched label selection of the proposed framework, all image patch pairs { ( p 1 i , p 2 j ) } from the sensed image I 1 and the reference image I 2 were fed to the trained CNN to predict multiple candidate lists. These lists were generated through patches with matched label sets. Owing to the remote sensing imaging mechanism and the small patch size, MatchNet is capable of finding more than one similar image patches between I 1 and I 2 . This one-to-many matching leads to an ill-posed problem, which can be a major reason for the appearance of an inaccurate geometric affine parameter set. We adopted a local constraint using NCC to select one matching pair among the patches from the multiple candidate lists.
The NCC measures the similarity of two patches based on pixel intensity as the local constraint. In this study, we only selected the matched patch pair with the maximum NCC. The NCC of a patch pair ( p 1 i , p 2 j ) was computed as follows:
c ( p 1 j , p 2 j ) = x , y [ ( p 1 i ( x , y ) p ¯ 1 i ) ( p 2 j ( x , y ) p ¯ 2 j ) ] x , y ( p 1 i ( x , y ) p ¯ 1 i ) 2 x , y ( p 2 j ( x , y ) p ¯ 2 j ) 2
where p 1 i ( x , y ) and p 2 j ( x , y ) are the gray values of image patches p 1 i and p 2 j at location ( x , y ) , respectively. Further, p ¯ 1 i and p ¯ 2 j are the average gray values of image patches p 1 i and p 2 j , respectively. One patch with the highest NCC value among the patches from multiple candidate lists was selected as the matched label.

2.4. Matched Patch Compensation with Local Geometric Transformation

As learning the invariance mapping function is difficult, geometric distortions, such as translation, scale, and shearing, appear between the matched patch pairs. It is necessary to correct the geometric distortion in the matched patch pairs. Figure 5a,b illustrate the matched patch pairs; however, two patches exhibit geometric distortions. To compensate for the geometric distortion, we adopted a pre-trained GMatchNet, which has been proposed for determining correspondences between two images in agreement with a geometric model, such as the geometric affine parameter set. Figure 6 shows a diagram of the GMatchNet architecture. The process of GMatchNet proceeds in four steps. First, input images P 1 and P 2 are passed through the Siamese architecture consisting of the convolutional layers, thus extracting feature maps F 1 and F 2 . Second, feature maps across images are matched to a tentative correspondence map F 12 . Third, a regression CNN that directly outputs the geometric affine parameter set θ ^ is constructed. Finally, the network generates a new transformed image, P 2 , by applying the transform T θ ^ to image P 2 . We calculated the central coordinates of the newly generated image P t 2 and used it to adjust the key-point position. In the case of GMatchNet, pre-trained weights were publicly available and could be used without any fine tuning since we could achieve the satisfied performance when those pretrained weights were applied to our framework. Figure 5 depicts an example of an adjusted key-point position. The red and yellow crosshairs indicate the central point of patch (a) and patch (b), respectively. In patch (c), the geometric distortion is compensated through GMatchNet, the previous yellow central position is shifted, and a new blue center position is assigned.

2.5. Global Constraints and Warping

The RANSAC algorithm estimates a model from a set of observed data through a random sampling and voting scheme often interpreted as an outlier detection method, which can further remove the falsely matched points globally associated with local constraints. By using the compensated matching labels from the previous step in the RANSAC algorithm, we calculated the global geometric affine parameter set W with the RANSAC algorithm. Finally, we warped the sensed image using the global geometric affine parameter set W , generating the registered image I 2 .

3. Results

In this study, we constructed datasets for both patch matching and registration using multispectral red, green, and blue images of cities around Seoul, South Korea, captured by the KOMPSAT-3 satellite with a resolution of 2.8 meter. Regions in Seoul are densely populated and their landscape is frequently changed by the emergence of new skyscrapers. On the other hand, areas around Seoul are agricultural areas with different colors depending on the seasonal conditions. The experiment was performed on a computer powered by an Intel (R) Core i7-8700K 3.40 GHz CPU with an NVIDIA GeForce GTX 1080 Ti GPU. In the following sections, we discuss the training and validation methods for patch matching via MatchNet and the evaluation metrics, and evaluate the performance of each remote sensing image registration framework.
We also explain the details of the dataset used for MatchNet. The training sets and validation sets for patch matching consisted of images from Suwon City. This dataset came with patches extracted using the scale–space extrema detection for extracting the key-points [6]. The size of the image patch used was 64 × 64 pixels. The resulting dataset was divided into 130k for training sets and 50k for validation sets. We used a sampler to generate an equal number of matched and unmatched patch pairs in each batch so that the network would not be overly biased toward the unmatched decision [25].

3.1. Evaluation Datasets and Metrics for Remote Sensing Image Registration Frameworks

The datasets for evaluation of remote sensing image registration consisted of images from Seoul and its surroundings from different times—three areas in the city and one area around it. Table 2 lists the detailed information of those images. In the same area, the upper row represents the reference image and the lower row represents the sensed image. All satellite images were divided into 500 × 500 images. Each pair of images consisted of images from the same area captured at different times. The characteristics for each area are as follows: Area 1 dataset consists of images of residential areas, Area 2 dataset consists of images of residential and green lung areas, Area 3 dataset consists of images of industrial facilities, and Area 4 dataset consists of images of skyscrapers.
The metrics from [26] were employed in this study to objectively evaluate the proposed high-accuracy registration framework, which are as follows: the number of control points ( N r e d ) ; the root-mean-square error ( R M S E ) based on all control points and normalized to the pixel size ( R M S a l l ) ; the R M S E computed by the control point residuals based on the leave-one-out method ( R M S l o o ) ; the statistical evaluation of the residual distribution across quadrants ( P q u a r d ) ; the bad point proportion with a norm greater than 1.0 ( B P P ( 1.0 ) ) ; the statistical evaluation of the presence of a preference axis on the residual scatter plot ( S k e w ) ; the statistical evaluation of the goodness of control points distribution across the image ( S c a t ) ; and the weighted sum of the above seven measures, the cost function ( ϕ ) . Smaller values indicate better performance for six metrics except N r e d . The cost function was used as an objective tool to evaluate the different control points for the pair of images. The equation of the cost function ϕ is expressed as follows:
ϕ = 2 N r e d + R M S a l l + 2 × R M S l o o + 1.5 × P q u a d + 2 × B P P + 1.5 × S k e w + 2 × S c a t
The registration accuracy was measured in terms of R M S a l l and R M S l o o . The quantity and quality of matching points were measured in terms of N r e d and ϕ , respectively. The lower the values of these metrics, the better N r e d . We can observe that both R M S a l l and R M S l o o equal or tend to the subpixel error, which are significant results of registration. N r e d measures the number of points that have been matched correctly. Further, a larger N r e d and a smaller R M S imply a higher accuracy of point matching.

3.2. Evaluation of Remote Sensing Image Registration Framework

The proposed frameworks were compared with the conventional feature-based image registration framework, SIFT, and the state-of-the-art deep learning-based image registration framework. We used the DBN network structure proposed by Wang et al. [19]. The deep learning-based frameworks were experimented with two trained methods—the conventional method and proposed training method. We defined the improved accuracy, I A ϕ , of ϕ as follows:
I A ϕ = S I F T ϕ D N N ϕ S I F T ϕ × 100   ( % )
where S I F T ϕ and D N N ϕ are the ϕ values of the SIFT-based framework and each DNN-based framework, respectively.
N r e d measures the number of correct corresponding points. A larger N r e d and a smaller R M S a l l imply more accurate point matching. Table 3 summarize the experimental results using eight metrics on four evaluation datasets. The last line in Table 3 illustrates the averaged results using eight metrics for the evaluation datasets in all areas. In the DBN-based framework of Wang et al. [19], although the number of control points ( N r e d ) was large, it had mismatched points and therefore an increased R M S a l l value. For qualitative assessment, we used the checkerboard mosaic image, which can demonstrate the subjective quality better than any other image in terms of edge continuity and region overlapping.
In Table 3, on the one hand, the DBN-based framework generated a large N r e d , but the R M S values increased due to the R M S E for all control points. On the other hand, the proposed framework for the Area 1 dataset had a smaller N r e d , but the lowest R M S value representing the pixel error. In addition, the smallest N r e d of 0.855 was obtained for the quality of matching points ϕ . The performance of the proposed framework was 40.2% better than that of the SIFT-based framework in Area 1. 
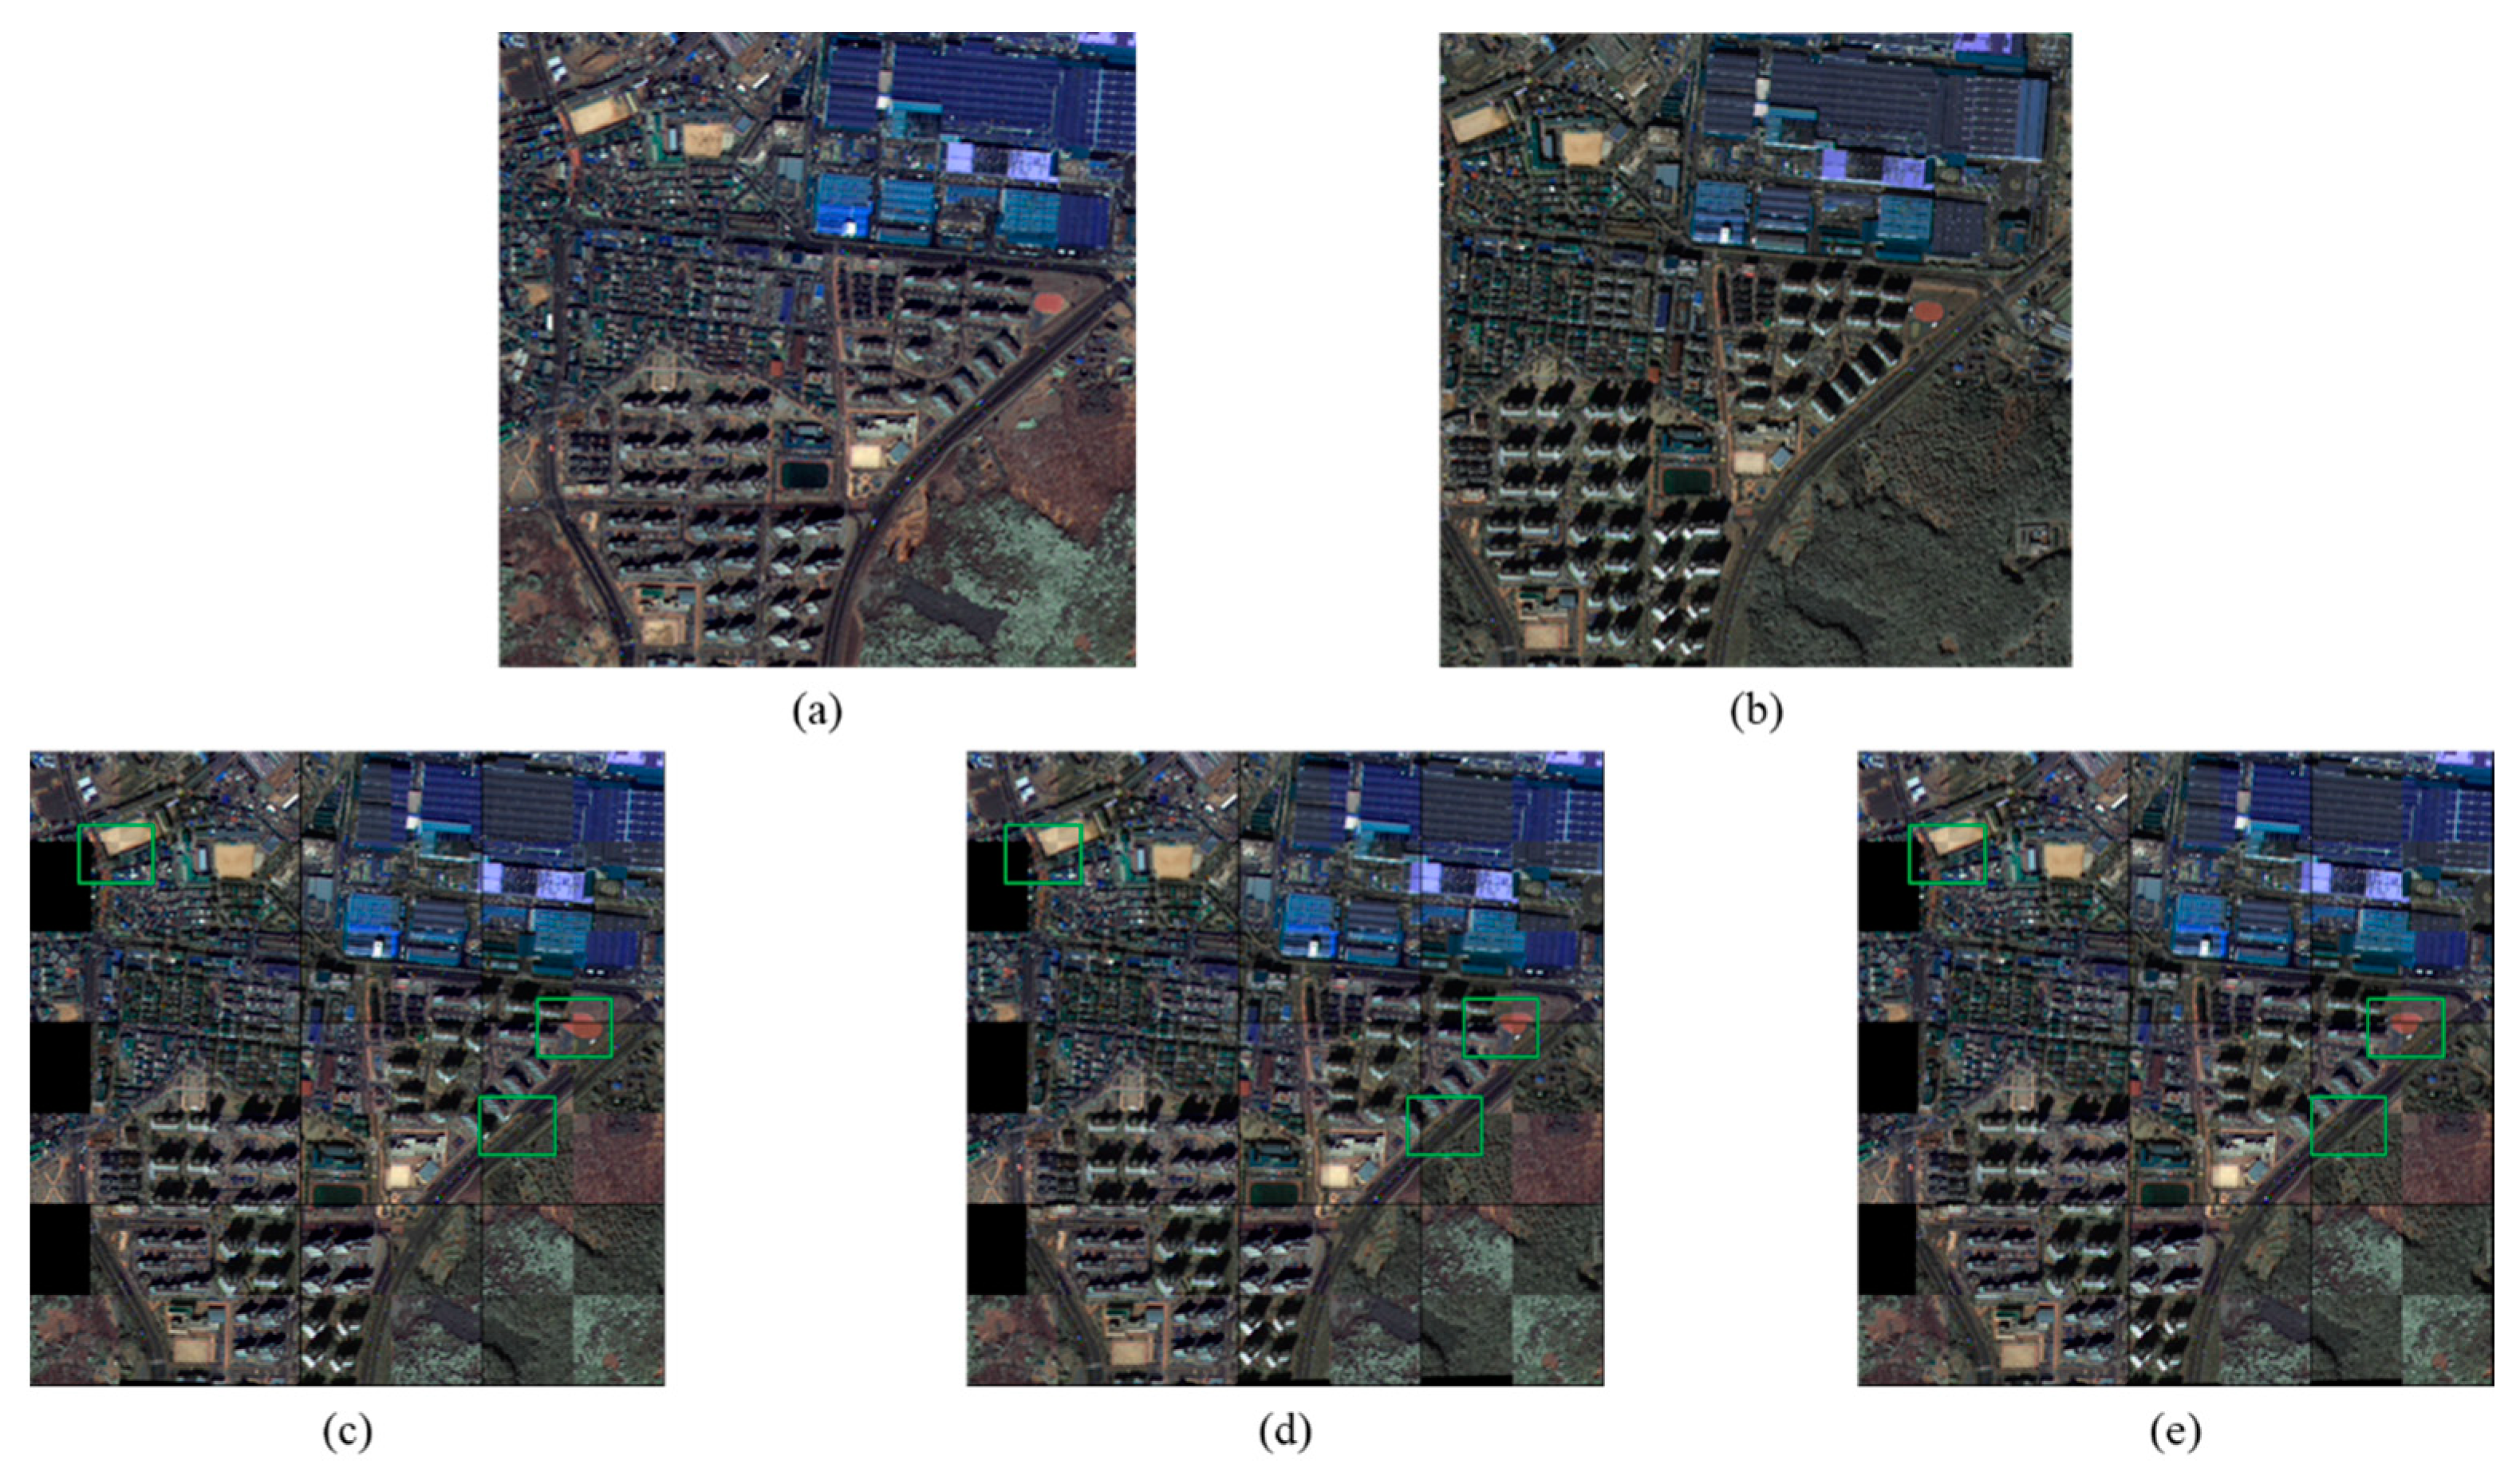
Figure 7a,b illustrate the pair of images from Area 1, which were acquired by the KOMPSAT-3 satellite in March 2014 and October 2015. The green boxes indicate the same region in the three images and show smooth edges.
In Area 2, on the one hand, the DBN-based framework increased the R M S values representing the quality of the matching point because the points did not match. Thus, the performance reduced by 79.54%. On the other hand, the proposed framework on the Area 2 dataset had a relatively large N r e d and the lowest R M S value representing the pixel error. In addition, the smallest result of 1.478 was obtained from the quality of matching points ϕ . The performance of the proposed framework was 68.98% better than that of the SIFT-based framework in Area 2. 
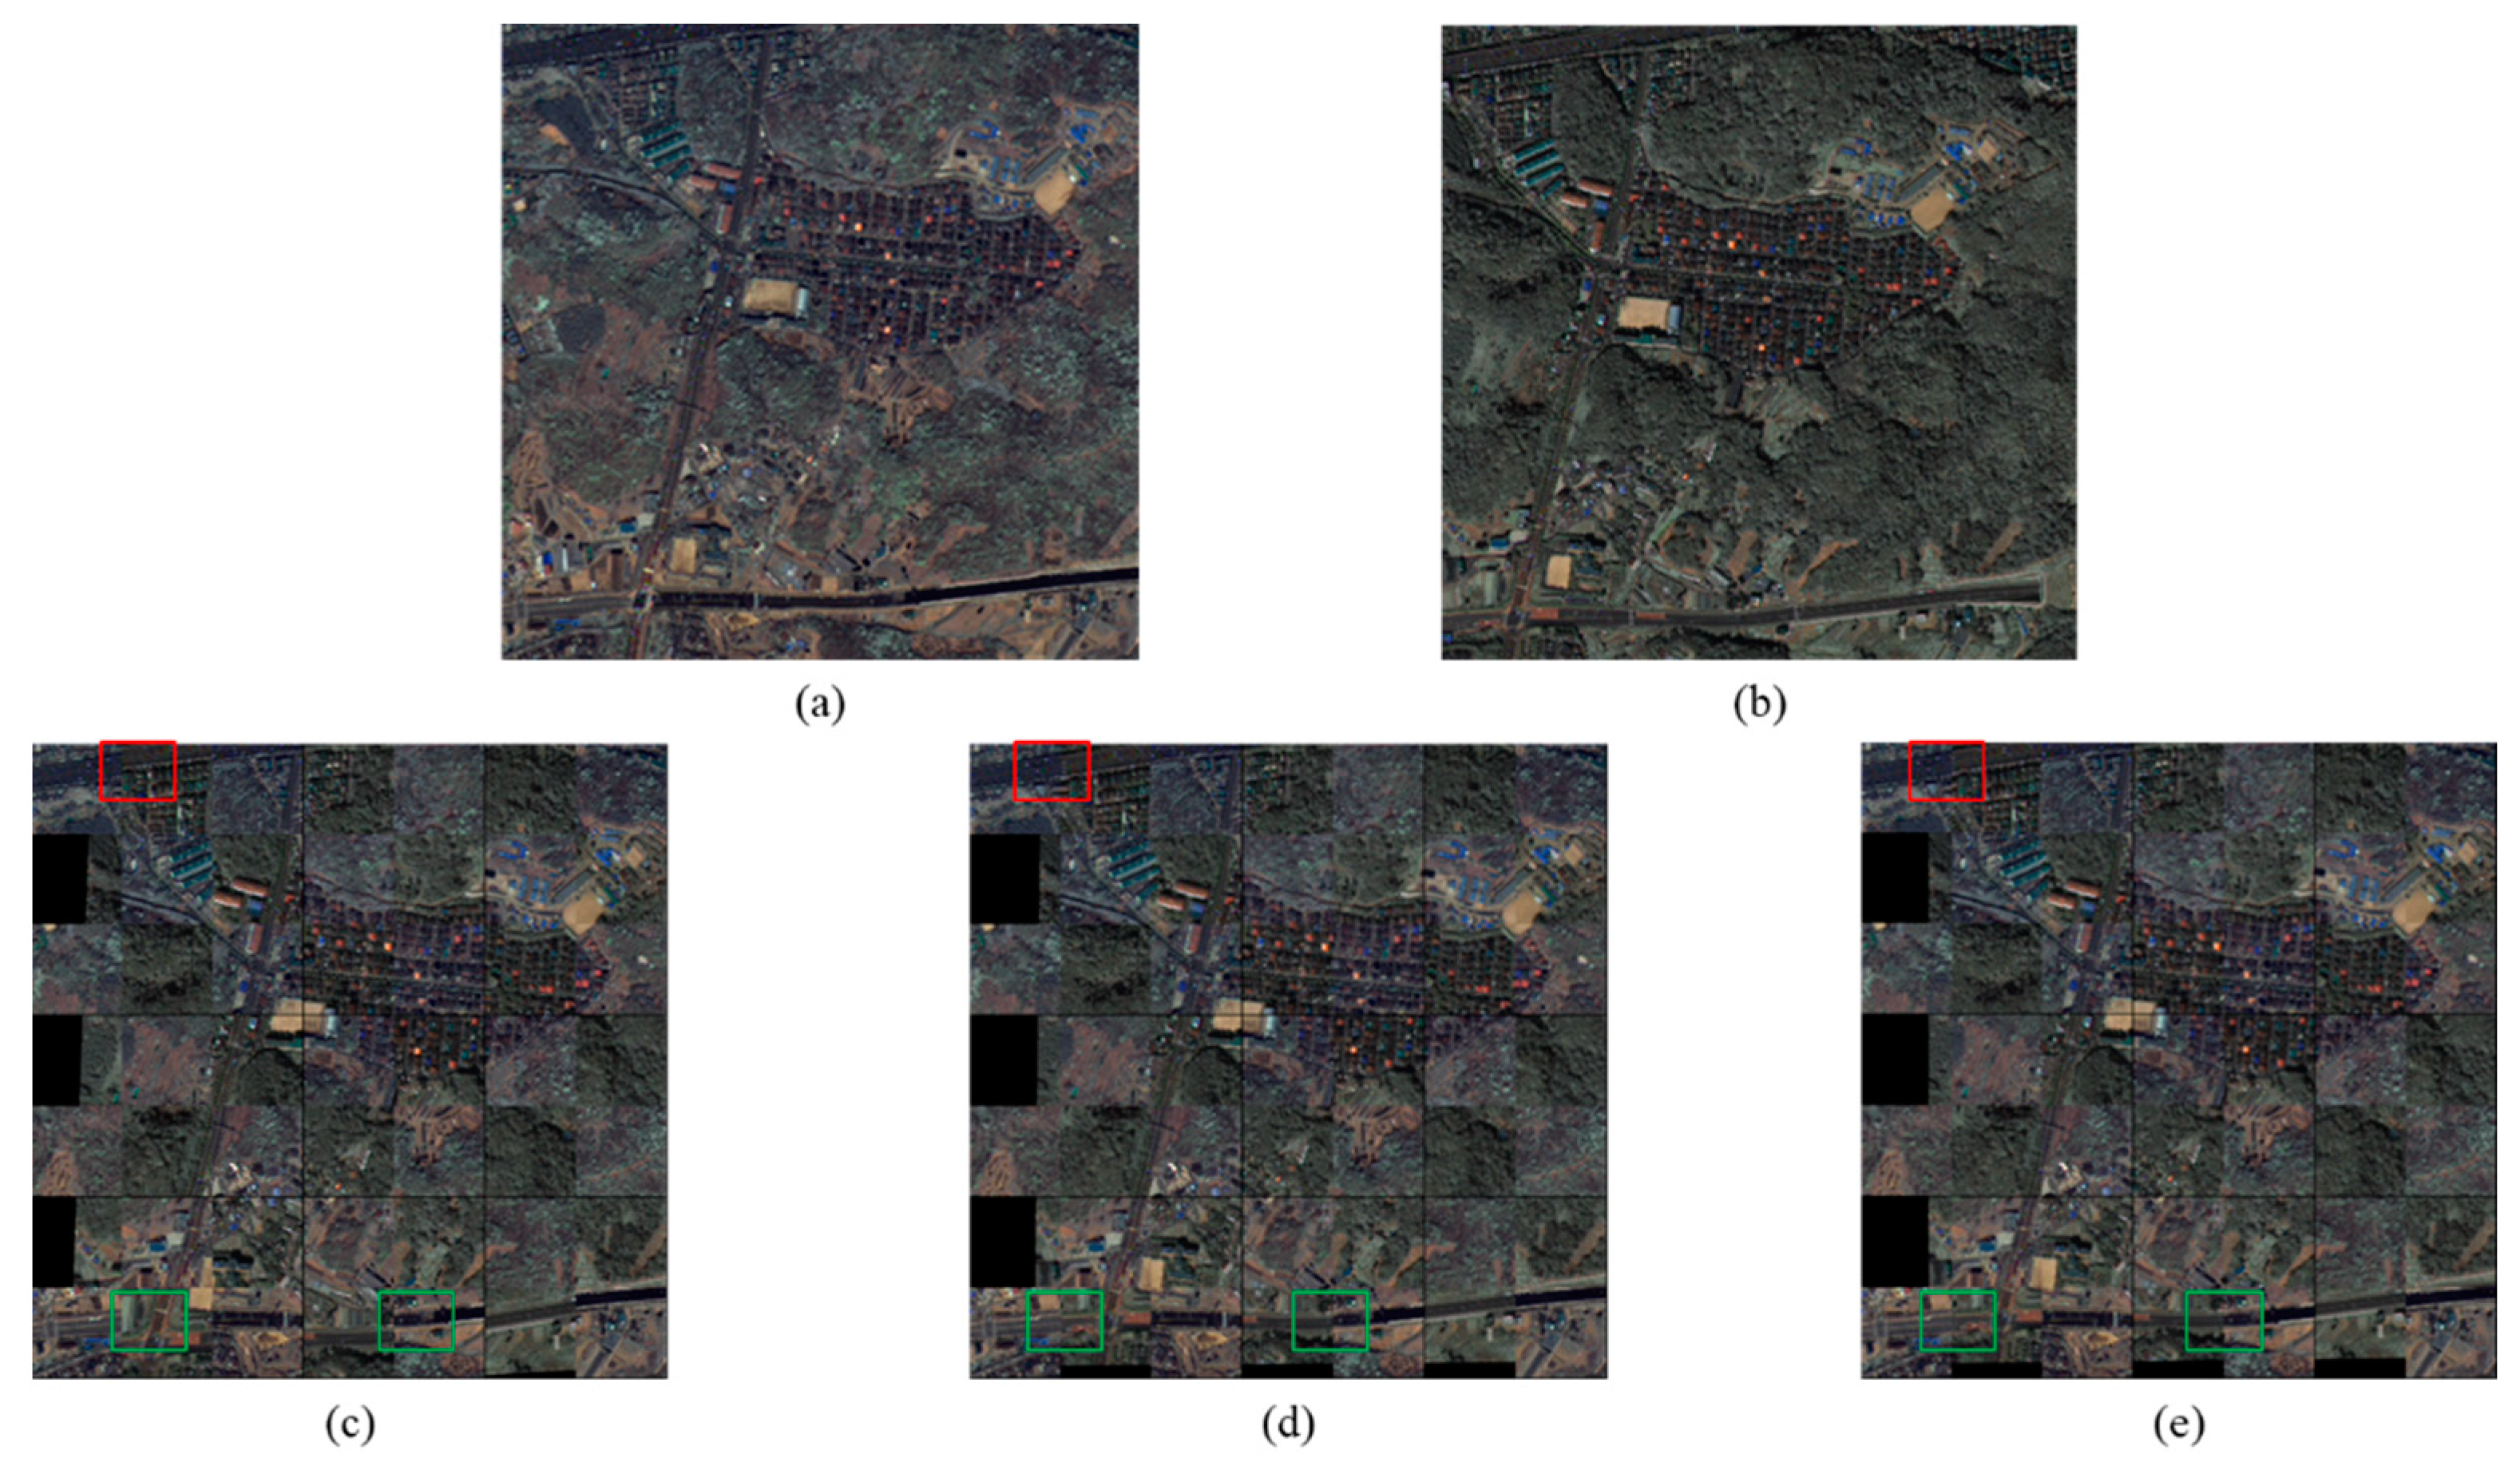
Figure 8a,b illustrate the pair of images from Area 2 acquired by the satellite in April 2014 and October 2015. The green boxes in the three images represent the same region and demonstrate smooth edges. The red boxes in the three images indicate the same region and highlight the deviation of results of the conventional frameworks from those of the proposed framework.
In Area 3, on the one hand, using the DBN-based framework increased the R M S values because the points did not match. Thus, the performance reduced by 315.32%. On the other hand, using the proposed framework on the Area 3 dataset produced the largest N r e d and the least R M S value representing the pixel error. In addition, the smallest result of 3.093 was obtained from the quality of matching points ϕ . The proposed framework performed 85.88% better the SIFT-based framework in Area 3. The greatest performance improvement was observed in the industrial facility areas. Figure 9a,b illustrates the pair of images from Area 3 acquired by KOMPSAT-3 satellite in April 2014 and October 2015. The green boxes in the three images represent the same region and demonstrate smooth edges.
In Area 4, on the one hand, the DBN-based framework generated a large N r e d along with an increased R M S . On the other hand, the proposed framework produced the second-largest N r e d but the lowest R M S representing the pixel error. In addition, the smallest result of 29.187 was obtained from the quality of matching points ϕ . The proposed framework performed 78.63% better than the SIFT-based framework in Area 4. The largest performance improvement occurred in the industrial facility areas. Figure 10a,b illustrate the pair of images from Area 4 acquired in December 2014 and October 2015. The changes observed in Figure 10 are large owing to the difference between skyscrapers and viewports. The SIFT-based framework failed to register the image. By contrast, the two proposed models successfully registered the images. Figure 10c,d are the image registration results of the SIFT-based framework and the DBN-based framework, respectively. Both frameworks failed to register the images.
In the KOMPSAT-3 image datasets, the DBN-based framework generated the largest N r e d along with a larger R M S value representing the matching point quality because the points did not match. The DBN-based framework reduced the R M S a l l value representing the registration accuracy by 165.786, but the R M S a l l value of the proposed framework significantly reduced to 34.922. The DBN-based framework reduced the ϕ value representing the matching points quality by 41.904, but that of the proposed framework significantly reduced to 8.653. The proposed framework achieved a performance improvement of 68.4%. The remarkable improvement in the performance of the proposed framework can be observed in the difference between the high-rise building and the image as the viewpoint shifts.

4. Conclusions

In this study, we proposed a CNN-based registration framework for remote sensing that can improve the image registration accuracy between two remote-sensed images acquired from different times and viewpoints. The matching step often produces geometric distortions, such as translation, scale, and shearing between the matched patch pairs given that the invariance mapping function is difficult to learn. To correct these distortions, we adopted a geometric CNN with a stronger invariance feature to find a local affine parameter set for each matched patch pairs. Therefore, we constructed multiple candidate lists, from which we estimated the local geometric transform. The proposed framework was evaluated on the KOMPSAT-3 dataset by comparing the conventional machine-learning-based frameworks and the proposed deep-learning-based framework. The proposed framework obtained the smallest RMSE of 34.922 based on all control points and achieved a 68.4% increase in the matching accuracy compared with the conventional registration framework. As the proposed framework is composed of two different networks, there is a computational complexity owing to the redundancy of the two feature networks. A unified network to alleviate the computational complexity can be the future direction of this research.

Author Contributions

All authors contributed to the writing of the manuscript. W.L. and D.S. conceived and designed the experiments; W.L. performed the experiments and analyzed the data; S.-J.O. supervised this study. All authors have read and agreed to the published version of the manuscript.

Funding

This research was supported by the MSIT (Ministry of Science and ICT), Korea, under the ITRC (Information Technology Research Center) support program (IITP-2021-2016-0-00288) supervised by the IITP (Institute for Information & Communications Technology Planning & Evaluation) and the present research has been conducted by the Research Grant of Kwangwoon University in 2020.

Institutional Review Board Statement

Not applicable.

Informed Consent Statement

Not applicable.

Data Availability Statement

Data sharing not applicable.

Acknowledgments

The authors sincerely appreciate that academic editors and reviewers give their helpful comments and constructive suggestions.

Conflicts of Interest

The authors declare no conflict of interest.

References

  1. Zitiva, B.; Flusser, J. Image registration methods: A survey. Image Vis. Comput. 2003, 21, 977–1000. [Google Scholar] [CrossRef] [Green Version]
  2. Moigne, J.L. Introduction to remote sensing image registration. In Proceedings of the IEEE International Geoscience and Remote Sensing Symposium, Fort Worth, TX, USA, 23–28 July 2017; pp. 2565–2568. [Google Scholar]
  3. Liang, J.; Liu, X.; Huang, K.; Li, X.; Wang, D.; Wang, X. Automatic registration of multi sensor images using an integrated spatial and mutual information (SMI) metric. IEEE Trans. Geosci. Remote Sens. 2014, 52, 603–615. [Google Scholar] [CrossRef]
  4. Patel, M.I.; Thakar, V.K. Speed improvement in image registration using maximum likelihood based mutual information. In Proceedings of the International Conference on Advanced Computing and Communication Systems, Kochi, Kerala, India, 2–7 January 2015; pp. 5–7. [Google Scholar]
  5. Lemieux, L.; Jagoe, R.; Fish, D.R.; Kitchen, N.D.; Thomas, D.G.T. A patient-to-computed-tomography image registration method based on digitally reconstructed radiographs. Med. Phys. 1994, 21, 1749–1760. [Google Scholar] [CrossRef] [PubMed]
  6. Lowe, D.G. Distinctive image features from scale-invariant keypoints. Int. J. Comput. Vis. 2004, 60, 91–110. [Google Scholar] [CrossRef]
  7. Herbert, B.; Andreas, E.; Luc, V.G. Speeded-up robust features (SURF). Comput. Vis. Image Understand. 2008, 110, 346–359. [Google Scholar]
  8. Dalal, N.; Triggs, B. Histograms of oriented gradients for human detection. In Proceedings of the IEEE Conference on Computer Vision and Pattern Recognition, San Diego, CA, USA, 20–25 June 2005; pp. 886–893. [Google Scholar]
  9. Matas, J.; Chum, O.; Urban, M.; Pajdla, T. Robust wide-baseline stereo from maximally stable extremal regions. Image Vis. Comput. 2004, 22, 761–767. [Google Scholar] [CrossRef]
  10. Kupfer, B.; Netanyahu, N.S.; Shimshoni, I. An efficient SIFT-based mode-seeking algorithm for sub-pixel registration of remotely sensed images. IEEE Geosci. Remote Sens. Lett. 2015, 12, 379–383. [Google Scholar] [CrossRef]
  11. Ye, Y.; Shan, H.; Bruzzone, L.; Shen, L. Robust registration of multimodal remote sensing images based on structural similarity. IEEE Trans. Geosci. Remote Sens. 2017, 55, 2941–2958. [Google Scholar] [CrossRef]
  12. Yang, K.; Pan, A.; Yang, Y.; Zhang, S.; Ong, S.H.; Tang, H. Remote sensing image registration using multiple image features. Remote Sens. 2017, 9, 581. [Google Scholar] [CrossRef] [Green Version]
  13. Xu, C.; Sui, H.G.; Li, D.R.; Sun, K.M.; Liu, J.Y. An automatic optical and SAR image registration method using iterative multi-level and refinement model. ISPRS J. Photogramm. Remote Sens. 2016, 7, 593–600. [Google Scholar]
  14. Gong, M.; Zhao, S.; Jiao, L.; Tian, D.; Wang, S. A novel coarse-to-fine scheme for automatic image registration based on SIFT and mutual information. IEEE Trans. Geosci. Remote Sens. 2013, 52, 4328–4338. [Google Scholar] [CrossRef]
  15. Cheng, G.; Zhou, P.; Han, J. Learning rotation-invariant convolutional neural networks for object detection in VHR optical remote sensing images. IEEE Trans. Geosci. Remote Sens. 2016, 54, 7405–7415. [Google Scholar] [CrossRef]
  16. Cheng, G.; Zhou, P.; Han, J. Rifd-cnn: Rotation-invariant and fisher discriminative convolutional neural networks for object detection. In Proceedings of the IEEE Conference on Computer Vision and Pattern Recognition, Las Vegas, CA, USA, 26 June – 1 July 2016; pp. 2884–2893. [Google Scholar]
  17. Scott, G.J.; England, M.R.; Starms, W.A.; Marcum, R.A.; Davis, C.H. Training deep convolutional neural networks for land–cover classification of high-resolution imagery. IEEE Geosci. Remote Sens. Lett. 2017, 14, 549–553. [Google Scholar] [CrossRef]
  18. Zhao, W.; Du, S. Spectral–spatial feature extraction for hyperspectral image classification: A dimension reduction and deep learning approach. IEEE Trans. Geosci. Remote Sens. 2016, 54, 4544–4554. [Google Scholar] [CrossRef]
  19. Wang, S.; Quan, D.; Liang, X.; Ning, M.; Guo, Y.; Jiao, L. A deep learning framework for remote sensing image registration. ISPRS J. Photogramm. Remote Sens. 2018, 145, 148–164. [Google Scholar] [CrossRef]
  20. Zagoruyko, S.; Komodakis, N. Learning to compare image patches via convolutional neural networks. In Proceedings of the IEEE Conference on Computer Vision and Pattern Recognition, Boston, MA, USA, 7–12 June 2015; pp. 4353–4361. [Google Scholar]
  21. Han, X.; Leung, T.; Jia, Y.; Sukthankar, R.; Berg, A.C. Matchnet: Unifying feature and metric learning for patch-based matching. In Proceedings of the IEEE Conference on Computer Vision and Pattern Recognition, Boston, MA, USA, 7–12 June 2015; pp. 3279–3286. [Google Scholar]
  22. Zagoruyko, S.; Komodakis, N. Deep compare: A study on using convolutional neural networks to compare image patches. Comput. Vis. Image Understand. 2017, 164, 38–55. [Google Scholar] [CrossRef]
  23. Lee, W.; Oh, S. Remote sensing image registration using equivariance features. In Proceedings of the International Conference on Information Networking, Jeju Island, Korea, 13–16 January 2021; pp. 776–781. [Google Scholar]
  24. Rocco, I.; Arandjelovic, R.; Sivic, J. Convolutional neural network architecture for geometric matching. In Proceedings of the IEEE Conference on Computer Vision and Pattern Recognition, Long Beach, CA, USA, 21–26 July 2017; pp. 6148–6157. [Google Scholar]
  25. Vitter, J.S. Random sampling with a reservoir. ACM Trans. Math. Softw. 1985, 11, 37–57. [Google Scholar] [CrossRef] [Green Version]
  26. Goncalves, H.; Goncalves, J.; Corte-Real, L. Measures for an objective evaluation of the geometric correction process quality. IEEE Geosci. Remote Sens. Lett. 2009, 6, 292–296. [Google Scholar] [CrossRef]
Figure 1. Examples of matched patch pairs using MatchNet. (a) Patch of reference image, (b) patch of current image, and (c) checkerboard mosaic image of the reference and current images.
Remotesensing 13 01482 g001
Figure 2. Proposed high-accuracy registration framework.
Remotesensing 13 01482 g002
Figure 3. MatchNet architecture for matched candidate list generation.
Remotesensing 13 01482 g003
Figure 4. Examples of training patch pairs.
Remotesensing 13 01482 g004
Figure 5. Example of an adjusted key-points position. (a) Patch of reference image, (b) patch of sensed image, and (c) patch of sensed image with compensated geometric distortion.
Remotesensing 13 01482 g005
Figure 6. GMatchNet architecture for matched patch compensation.
Remotesensing 13 01482 g006
Figure 7. Representative image registration of the proposed and conventional framework for Area 1. (a) Reference image acquired by KOMPSAT-3 satellite in March 2014. (b) Sensed image acquired by KOMPSAT-3 satellite in October 2015. (c) Checkerboard mosaic image of the reference and registered images obtained using the scale invariant feature transform (SIFT)-based framework. (d) Checkerboard mosaic image of the reference and registered images obtained using the conventional deep belief network (DBN)-based framework. (e) Checkerboard mosaic image of the reference and registered images obtained using the proposed framework.
Remotesensing 13 01482 g007
Figure 8. Representative image registration of the proposed and conventional frameworks for Area 2. (a) Reference image acquired by KOMPSAT-3 satellite in April 2014. (b) Sensed image acquired by KOMPSAT-3 satellite in October 2015. (c) Checkerboard mosaic image of the reference and registered images obtained using the SIFT-based framework. (d) Checkerboard mosaic image of the reference and registered images obtained using the conventional DBN-based framework. (e) Checkerboard mosaic image of the reference and registered images obtained using the proposed framework.
Remotesensing 13 01482 g008
Figure 9. Representative image registration of the proposed and conventional frameworks for Area 3. (a) Reference image acquired by KOMPSAT-3 satellite in April 2014. (b) Sensed image acquired by KOMPSAT-3 satellite in October 2015. (c) Checkerboard mosaic image of the reference and registered images obtained using the SIFT-based framework. (d) Checkerboard mosaic image of the reference and registered images obtained using conventional the DBN-based framework. (e) Checkerboard mosaic image of the reference and registered images obtained using the proposed framework.
Remotesensing 13 01482 g009
Figure 10. Representative image registration of the proposed and conventional frameworks for Area 4. (a) Reference image acquired by KOMPSAT-3 satellite in December 2014. (b) Sensed image acquired by KOMPSAT-3 satellite in October 2015. (c) Checkerboard mosaic image of the reference and registered images obtained using the SIFT-based framework. (d) Checkerboard mosaic image of the reference and registered images obtained using the conventional DBN-based framework. (e) Checkerboard mosaic image of the reference and registered images obtained using the proposed framework.
Remotesensing 13 01482 g010
Table 1. Layer parameters of MatchNet.
NameTypeOutput DimensionPatch SizeStride
Conv 1-1Convolution64 × 64 × 247 × 71
Pool 1Max pooling32 × 32 × 243 × 32
Conv 2-1Convolution32 × 32 × 645 × 51
Pool 2Max pooling16 × 16 × 643 × 32
Conv 3-1Convolution16 × 16 × 963 × 31
Conv 3-2Convolution16 × 16 × 643 × 31
Conv 3-3Convolution16 × 16 × 643 × 31
Pool 3Max pooling8 × 8 × 643 × 32
BottleneckFully connected256--
FC1Fully connected512--
FC2Fully connected512--
FC3Fully connected2--
Table 2. Evaluation datasets description.
ClassLocationSizeTime
Area 1Gwanak-gu500 × 500March 2014
500 × 500October 2015
Area 2Guro-gu500 × 500April 2014
500 × 500October 2015
Area 3Gwangmyeong City500 × 500April 2014
500 × 500October 2015
Area 4Yeongdeungpo-gu500 × 500December 2014
500 × 500October 2015
Table 3. Quantitative comparison of model performance in evaluation datasets.
ClassFramework N r e d R M S a l l R M S l o o P q u a r d B P P ( 1.0 ) S k e w S c a t ϕ I A ϕ
Area 1SIFT-based1544.5503.9420.9490.5250.2490.9201.431-
DBN-based [19]8692.6712.6711.0000.5270.0611.0001.10529.5%
Proposed high accuracy4352.1611.7921.0000.4740.0441.0000.85575.2%
Area 2SIFT-based1017.97116.5450.9770.9630.4000.9634.765-
DBN-based [19]183 32.369 32.388 1.000 1.000 0.002 1.000 8.555 −79.54%
Proposed high accuracy3294.6524.0580.9870.7220.0261.0001.47868.98%
Area 3SIFT-based2620.69118.0310.9981.0000.3040.99821.899-
DBN-based [19]118 362.339 361.022 1.000 1.000 1.000 1.000 90.951 −315.32%
Proposed20711.8099.8261.0000.9670.1371.0003.09385.88%
Area 4SIFT-based12619.558506.1671.0001.0000.9660.907136.576-
DBN-based [19]85 265.764 265.770 1.000 1.000 0.807 1.000 67.004 50.94%
Proposed high accuracy36121.066111.8150.9790.8610.2120.99029.18778.63%
AverageSIFT-based51165.693136.1710.9810.8720.4800.94741.168-
DBN-based [19]314165.786165.4631.0000.8820.4681.00041.904−80.3%
Proposed high accuracy25234.92231.8730.9920.7560.1050.9988.65368.4%
Publisher’s Note: MDPI stays neutral with regard to jurisdictional claims in published maps and institutional affiliations.

