Article

Automated Global Shallow Water Bathymetry Mapping Using Google Earth Engine

1
Center for Global Discovery and Conservation Science, Arizona State University, Tempe, AZ 85281, USA
2
Remote Sensing Research Centre, School of Earth and Environmental Sciences, University of Queensland, Brisbane QLD 4072, Australia
3
The Nature Conservancy, Caribbean Division, Coral Gables, FL 33134, USA
*
Author to whom correspondence should be addressed.
Remote Sens. 2021, 13(8), 1469; https://doi.org/10.3390/rs13081469
Submission received: 22 March 2021 / Revised: 8 April 2021 / Accepted: 8 April 2021 / Published: 10 April 2021
(This article belongs to the Section Ocean Remote Sensing)

Abstract

:
Global shallow water bathymetry maps offer critical information to inform activities such as scientific research, environment protection, and marine transportation. Methods that employ satellite-based bathymetric modeling provide an alternative to conventional shipborne measurements, offering high spatial resolution combined with extensive coverage. We developed an automated bathymetry mapping approach based on the Sentinel-2 surface reflectance dataset in Google Earth Engine. We created a new method for generating a clean-water mosaic and a tailored automatic bathymetric estimation algorithm. We then evaluated the performance of the models at six globally diverse sites (Heron Island, Australia; West Coast of Hawaiʻi Island, Hawaiʻi; Saona Island, Dominican Republic; Punta Cana, Dominican Republic; St. Croix, United States Virgin Islands; and The Grenadines) using 113,520 field bathymetry sampling points. Our approach derived accurate bathymetry maps in shallow waters, with Root Mean Square Error (RMSE) values ranging from 1.2 to 1.9 m. This automatic, efficient, and robust method was applied to map shallow water bathymetry at the global scale, especially in areas which have high biodiversity (i.e., coral reefs).

1. Introduction

Shallow marine ecosystems (depths < 20 m) including coral reefs, seagrass, and kelp beds are among the most valuable and productive in the world [1,2,3,4,5]. These ecosystems play a significant role in protecting communities from storms, delivering goods and services to millions of people, and serving as critical biodiversity and “blue carbon” reservoirs [6,7,8,9,10,11,12,13,14,15]. Globally, coastal ecosystems are threatened by heavy exploitation and require urgent protection and improved management [7,16,17]. Accurate mapping of shallow bathymetry is critical for understanding and characterizing coastal environments [5,18,19], providing a foundation for measuring underwater light density, mapping and monitoring benthic habitats, and planning marine operations and transportation [20].
Historically, methods for estimating shallow water bathymetry have suffered from a variety of trade-offs and limitations. Conventional methods such as shipborne sounding or airborne LiDAR have limited spatial coverage [21]. Such methods cannot be deployed at global scales since they are both time-consuming and labor-intensive [19,22]. As a result, alternative methods using satellite data to derive bathymetry have been developed [23,24,25,26]. Past studies have applied low-spatial-resolution (>30 m) satellite sensors including NASA MODIS, SeaWiFS, and VIIRS [27,28,29,30], as well as land-viewing satellite imagery including Landsat-8, Sentinel-2, and Worldview 2-4 [22,23,31,32,33,34] to estimate bathymetry. However, these methods involve trade-offs between spatial resolution and satellite-based observation frequency. Low spatial-resolution sensors can lead to large uncertainties in land-water mixed pixels along coastlines, while land-viewing sensors can have a low temporal frequency that results in a more limited selection of cloud-free satellite images, especially in tropical coastal regions with frequent cloud cover [4]. Furthermore, satellite-based bathymetric algorithms often rely on field data calibration [19,20,22,35,36] or intensive calculations to physically simulate broad water column conditions [21,23,26,31,32,33,37,38], and are often limited to a single scene of multispectral or hyperspectral satellite images. Overall, these many drawbacks limit the mapping of shallow water bathymetry at a global scale.
To overcome many of these challenges in estimating shallow water bathymetry, we investigate the use of Google Earth Engine (GEE), a powerful cloud-based computational platform that provides easy access to high-coverage global-scale analysis-ready satellite reflectance datasets and high-resolution innovation to bathymetry estimation. GEE has been used for a variety of global-scale products including land cover, forest change, water surface extent, and urban land use [39,40,41,42,43]. In particular, the Sentinel-2 surface reflectance dataset in GEE has been widely used in terrestrial environment studies [22,43], but it is not fully understood if the Sentinel-2 reflectance dataset in GEE can be directly used to generate shallow water bathymetry at the global scale. Overall, an automated (i.e., no field calibration) and computationally efficient shallow water bathymetry estimation algorithm is needed for the Sentinel-2 reflectance dataset in GEE at the global scale.
Here, we developed a new method to automatically map global shallow water depth using Google Earth Engine in both coastal and offshore marine environments. We used the Sentinel-2 surface reflectance dataset in the GEE to build a “clean-water” mosaic that minimizes cloud, cloud shadow, sun glint, and other disturbances. This clean-water mosaic enabled us to derive a 10 m spatial resolution bathymetry in shallow marine environments (< 20 m) without field data calibration. We evaluated the performance of our bathymetric estimation method using 113,520 field sampling points across six globally distributed sites that represent different depths and diverse benthic habitats. Our study strives to resolve the challenge of developing an automatic, efficient, and robust method to map bathymetry at the global scale.

2. Materials and Methods

2.1. Study Sites and Data

We tested our automatic bathymetric mapping method across broad geographic ranges, benthic types, and water column conditions at six study sites worldwide. Figure 1 presents Sentinel-2 true color mosaics and field sample locations that were used for our study sites in the Pacific Ocean and the Caribbean Sea: Heron Island, Australia; West Coast of Hawaiʻi Island, Hawaiʻi (hereafter “West Hawaiʻi”); Saona Island, Dominican Republic; Punta Cana, Dominican Republic; St. Croix, U.S. Virgin Islands; The Grenadines (Table 1, Figure 1). These sites represent a variety of geomorphic zones (reef crest, patch reef, lagoon, and open ocean) and benthic types (coral reef, seagrass, sand). These sites provide a wide range of bottom reflectance signatures and geographic conditions for examining our automatic shallow water bathymetry mapping method.
We utilized field-measured bathymetry samples to verify satellite-derived bathymetry results (Table 1). In total, we collected 113,520 field sampling points to globally validate our bathymetry method. To supplement depth measurements, we also recorded benthic composition types in the Dominican Republic and the US Virgin Islands [25].

2.2. Clean Water Mosaic Generation Using Google Earth Engine

We developed a method to build a Sentinel-2 surface reflectance mosaic for shallow waters using the Reducer function in GEE. We selected satellite images with minimal cloud coverage, sun glint, and water turbidity over a selected period (e.g., 12 months). We then aggregated the input dataset into a single, clean-water mosaic output. This step is fundamental for building an automatic bathymetry mapping method at a global scale. A clean water mosaic with minimal water column attenuation enables our automatic bathymetry estimation algorithm to have reduced uncertainties caused by water column attenuations.
We applied different filters to mask low-quality (e.g., cloud, cloud shadow, wave breaks, sun glint, etc.) Sentinel-2 surface reflectance ( ρ ( λ ) ) in the input raster dataset. First, we used the QA60 band to exclude pixels with clouds. Next, we applied the Scene Classification map (SCL) band to mask non-water targets including cloud shadows, vegetation, bare soil, clouds of medium probability, clouds of high probability, and cirrus. We also used several band threshold values to mask high turbidity waters, sun glint and wave breaks after intensive testing (i.e., green band > 0.01, red edge 1 band < 0.1, NIR band < 0.03, 0.005 < water vapor band < 0.03). We further masked non-water targets by using a normalized difference water index (NDWI) with surface reflectance inputs [44], using only pixels with positive NDWI values in the input datasets:
N D W I =   ρ ( G r e e n ) ρ ( N I R ) ρ ( G r e e n ) + ρ ( N I R ) ,
Finally, we aggregated the selected clean satellite reflectance by taking the median of the pixel stack (i.e., median statistic of the Reducer function). We built mosaics over different time ranges (i.e., three months (Jan 2019 to March 2019), six months (Jan 2019 to June 2019), 12 months (Jan 2019 to December 2019)) to compare our method by mosaic time period.

2.3. An Automatic Bathymetry Estimation Algorithm

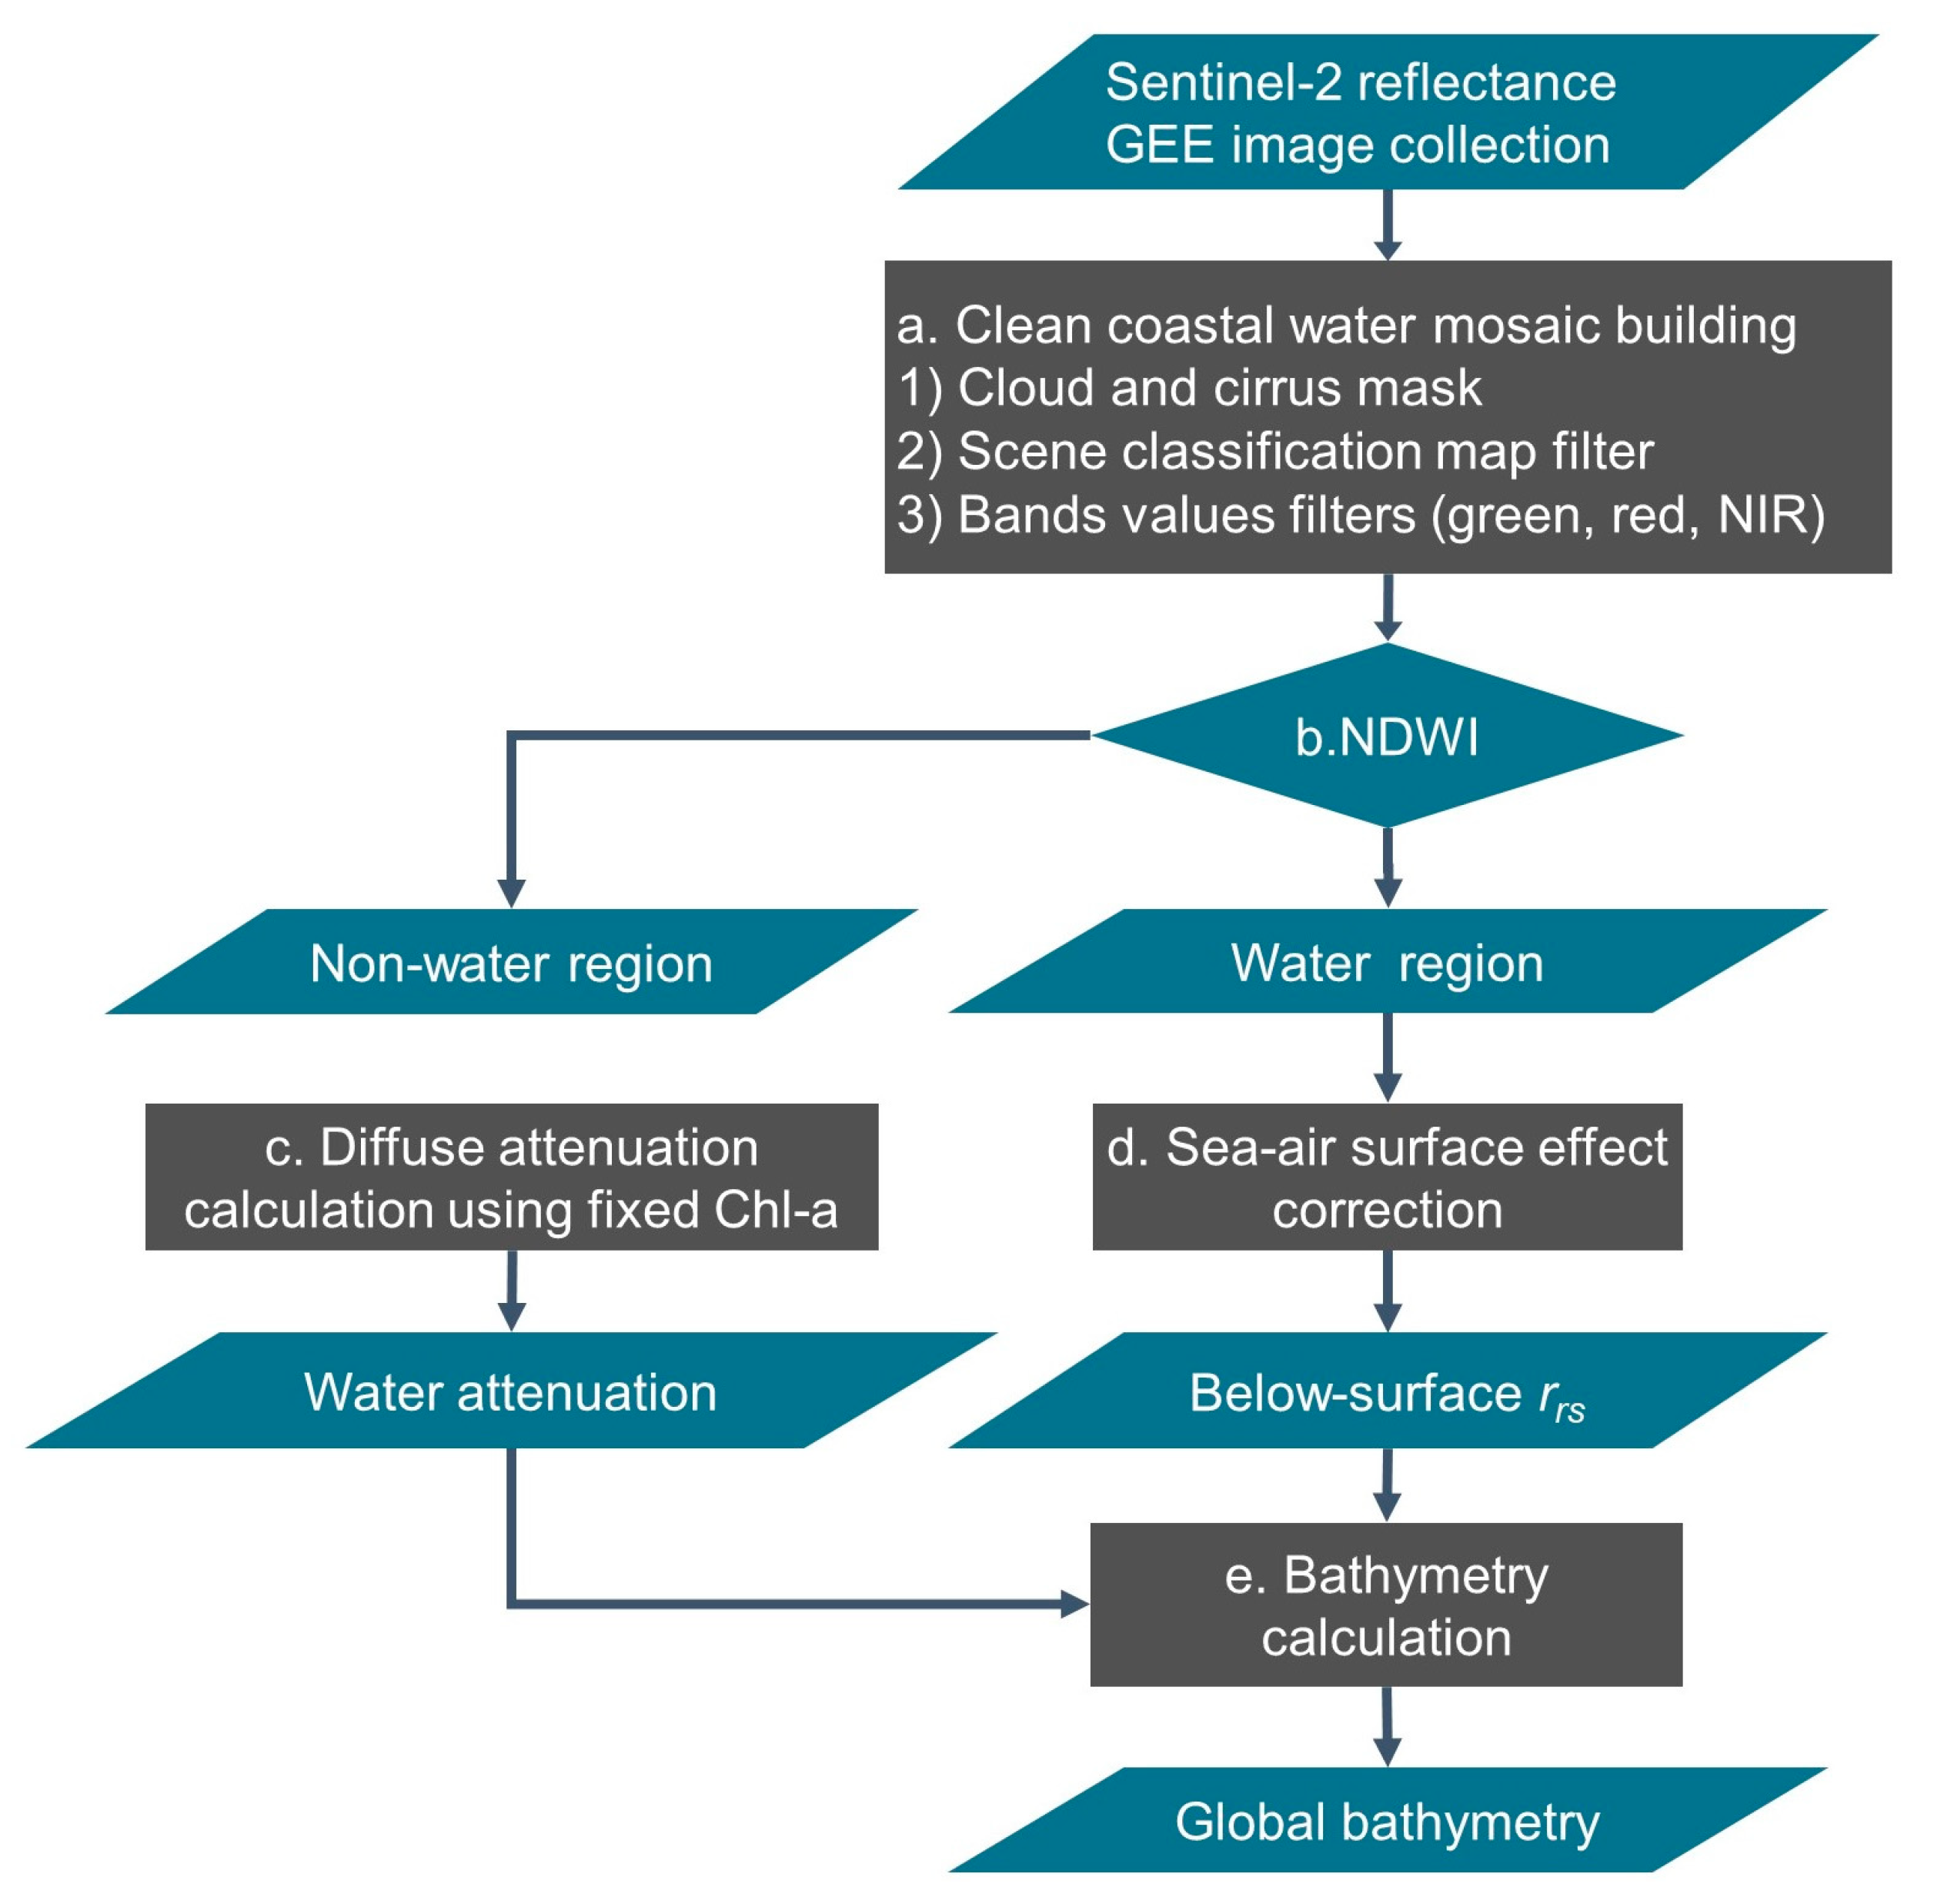
We developed a new automatic bathymetry mapping method based on a previous single-scene adaptive bathymetry algorithm [25]. Our algorithm was tailored to the clean water mosaic built by GEE. Figure 2 illustrates the detailed steps of our approach. We first calculated remote sensing reflectance R r s from the mosaic surface reflectance ρ ( λ ) as [45]:
R r s ( λ ) = ρ m ( λ ) / π
Next, we derived below-surface remote sensing reflectance ( r r s ( λ ) ) from the R r s ( λ ) to remove the air-water surface effect [38]:
r r s ( λ ) = R r s ( λ ) 0.52 + 1.7 R r s ( λ )
We estimated shallow water bathymetry by quantifying different attenuation levels between the blue and green bands as [19]:
D e p t h =   m 0 ln ( 1000 r r s b l u e ) ln ( 1000 r r s g r e e n ) m 1
The bathymetry estimation parameters ( m 0 and m 1 ) were calculated using Chlorophyll-a (Chl-a) concentration values as [25] representative for clean offshore waters:
m 0 = 52.073 e ( 0.957 C h l a )
m 1 = 50.156 e ( 0.957 C h l a )
As noted previously, we only selected satellite images with low water turbidity to build the mosaic. Additionally, given that water mosaic values represent the median value over time (e.g., 12 months), we used a fixed Chl-a value (Chl-a = 0.5 mg m-3) to calculate m 0 and m 1 in our clean shallow water mosaic. This Chl-a value (Chl-a = 0.5 mg m-3) is a mean value calculated from GEE outputted 12-month clean water mosaic in 26 sites globally (Chl-a ranges in these 26 sites: 0.4 mg m-3 < Chl-a < 0.6 mg m-3). These sites are Heron Island, Australia; West Hawaiʻi; Saona Island, Dominican Republic; Punta Cana, Dominican Republic; St. Croix, U.S. Virgin Islands; The Grenadines; Mo’orea, French Polynesia; Taha’a, French Polynesia; Samoa; Fiji; New Caledonia; Solomon Islands; Sudest Island, Papua New Guinea; Kiriwina Island, Papua New Guinea; Manus Island, Papua New Guinea; Great Barrier Reef, Australia; the Maldives; Madagascar; Msimbati, Tanzania; Lighthouse, Belize; Saint John, Antigua and Barbuda; Cuba; Turks and Caicos Islands; and O‘ahu, Hawaiʻi.
We validated our satellite-derived bathymetry results by comparing image values with field measurements, applying Root Mean Squared Error (RMSE), R2, and Mean Normalized Bias (MNB) to evaluate results.

3. Results

3.1. Clean Shallow Water Mosaic Created from Google Earth Engine

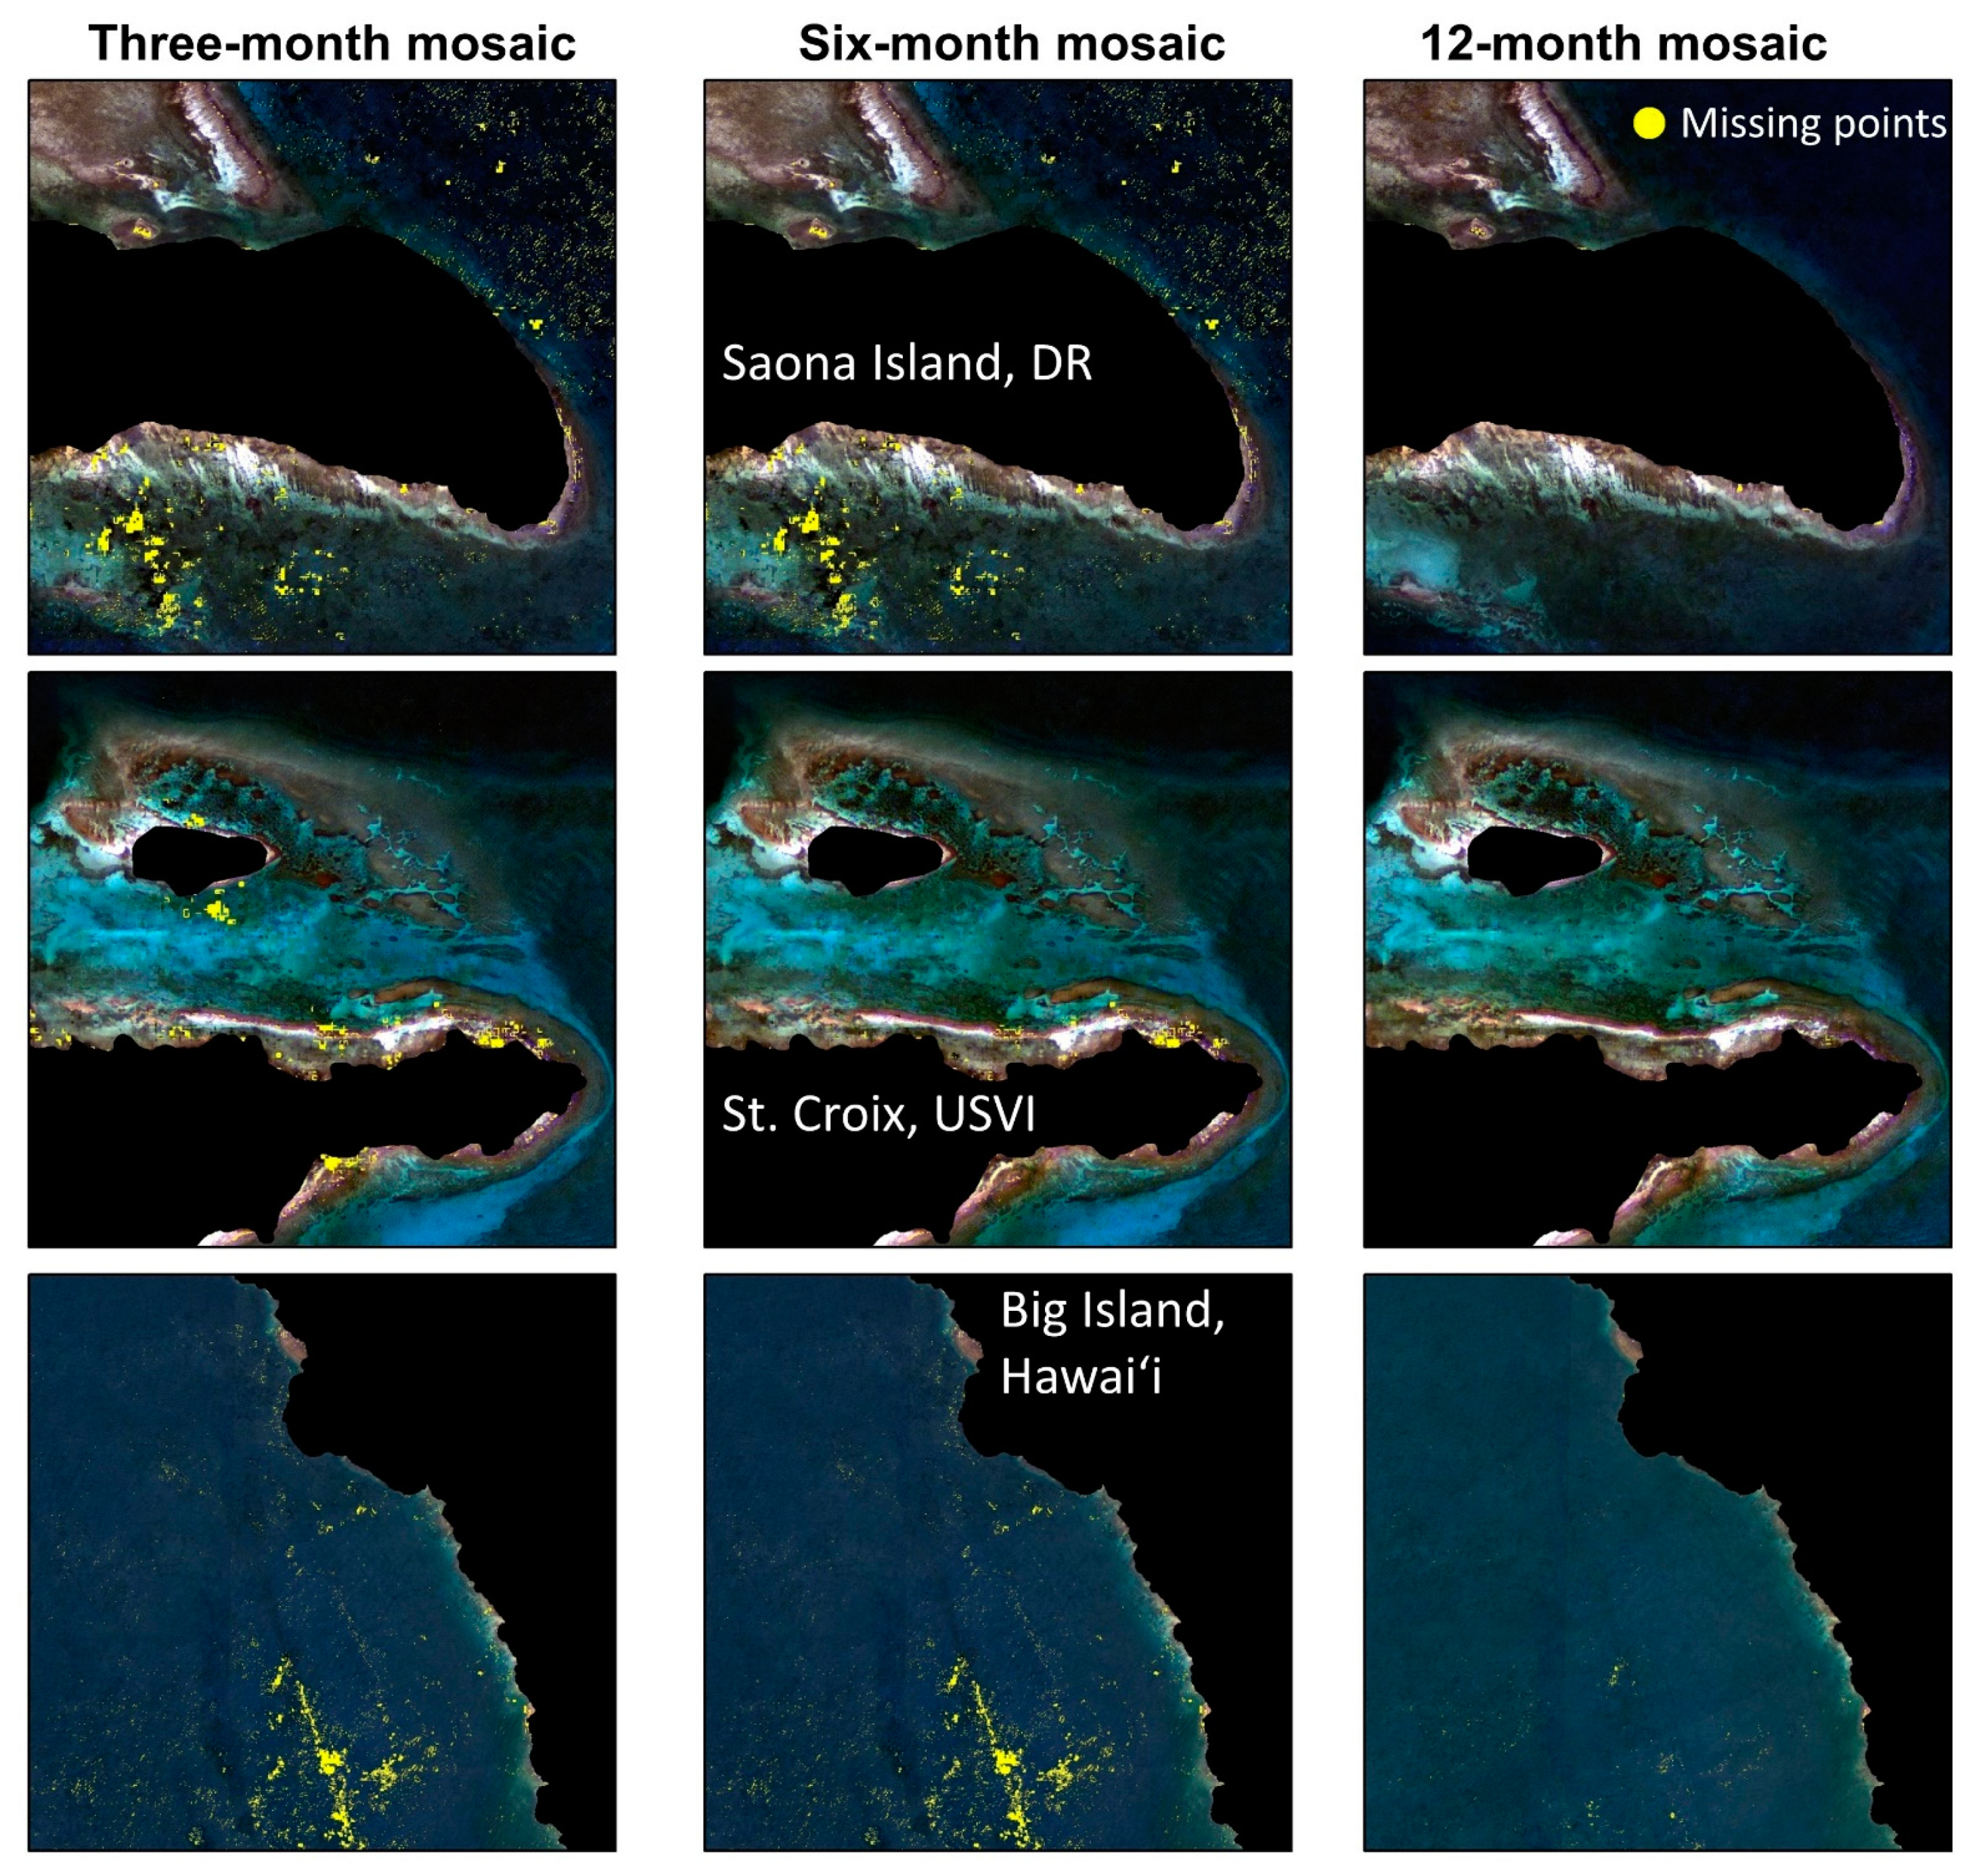
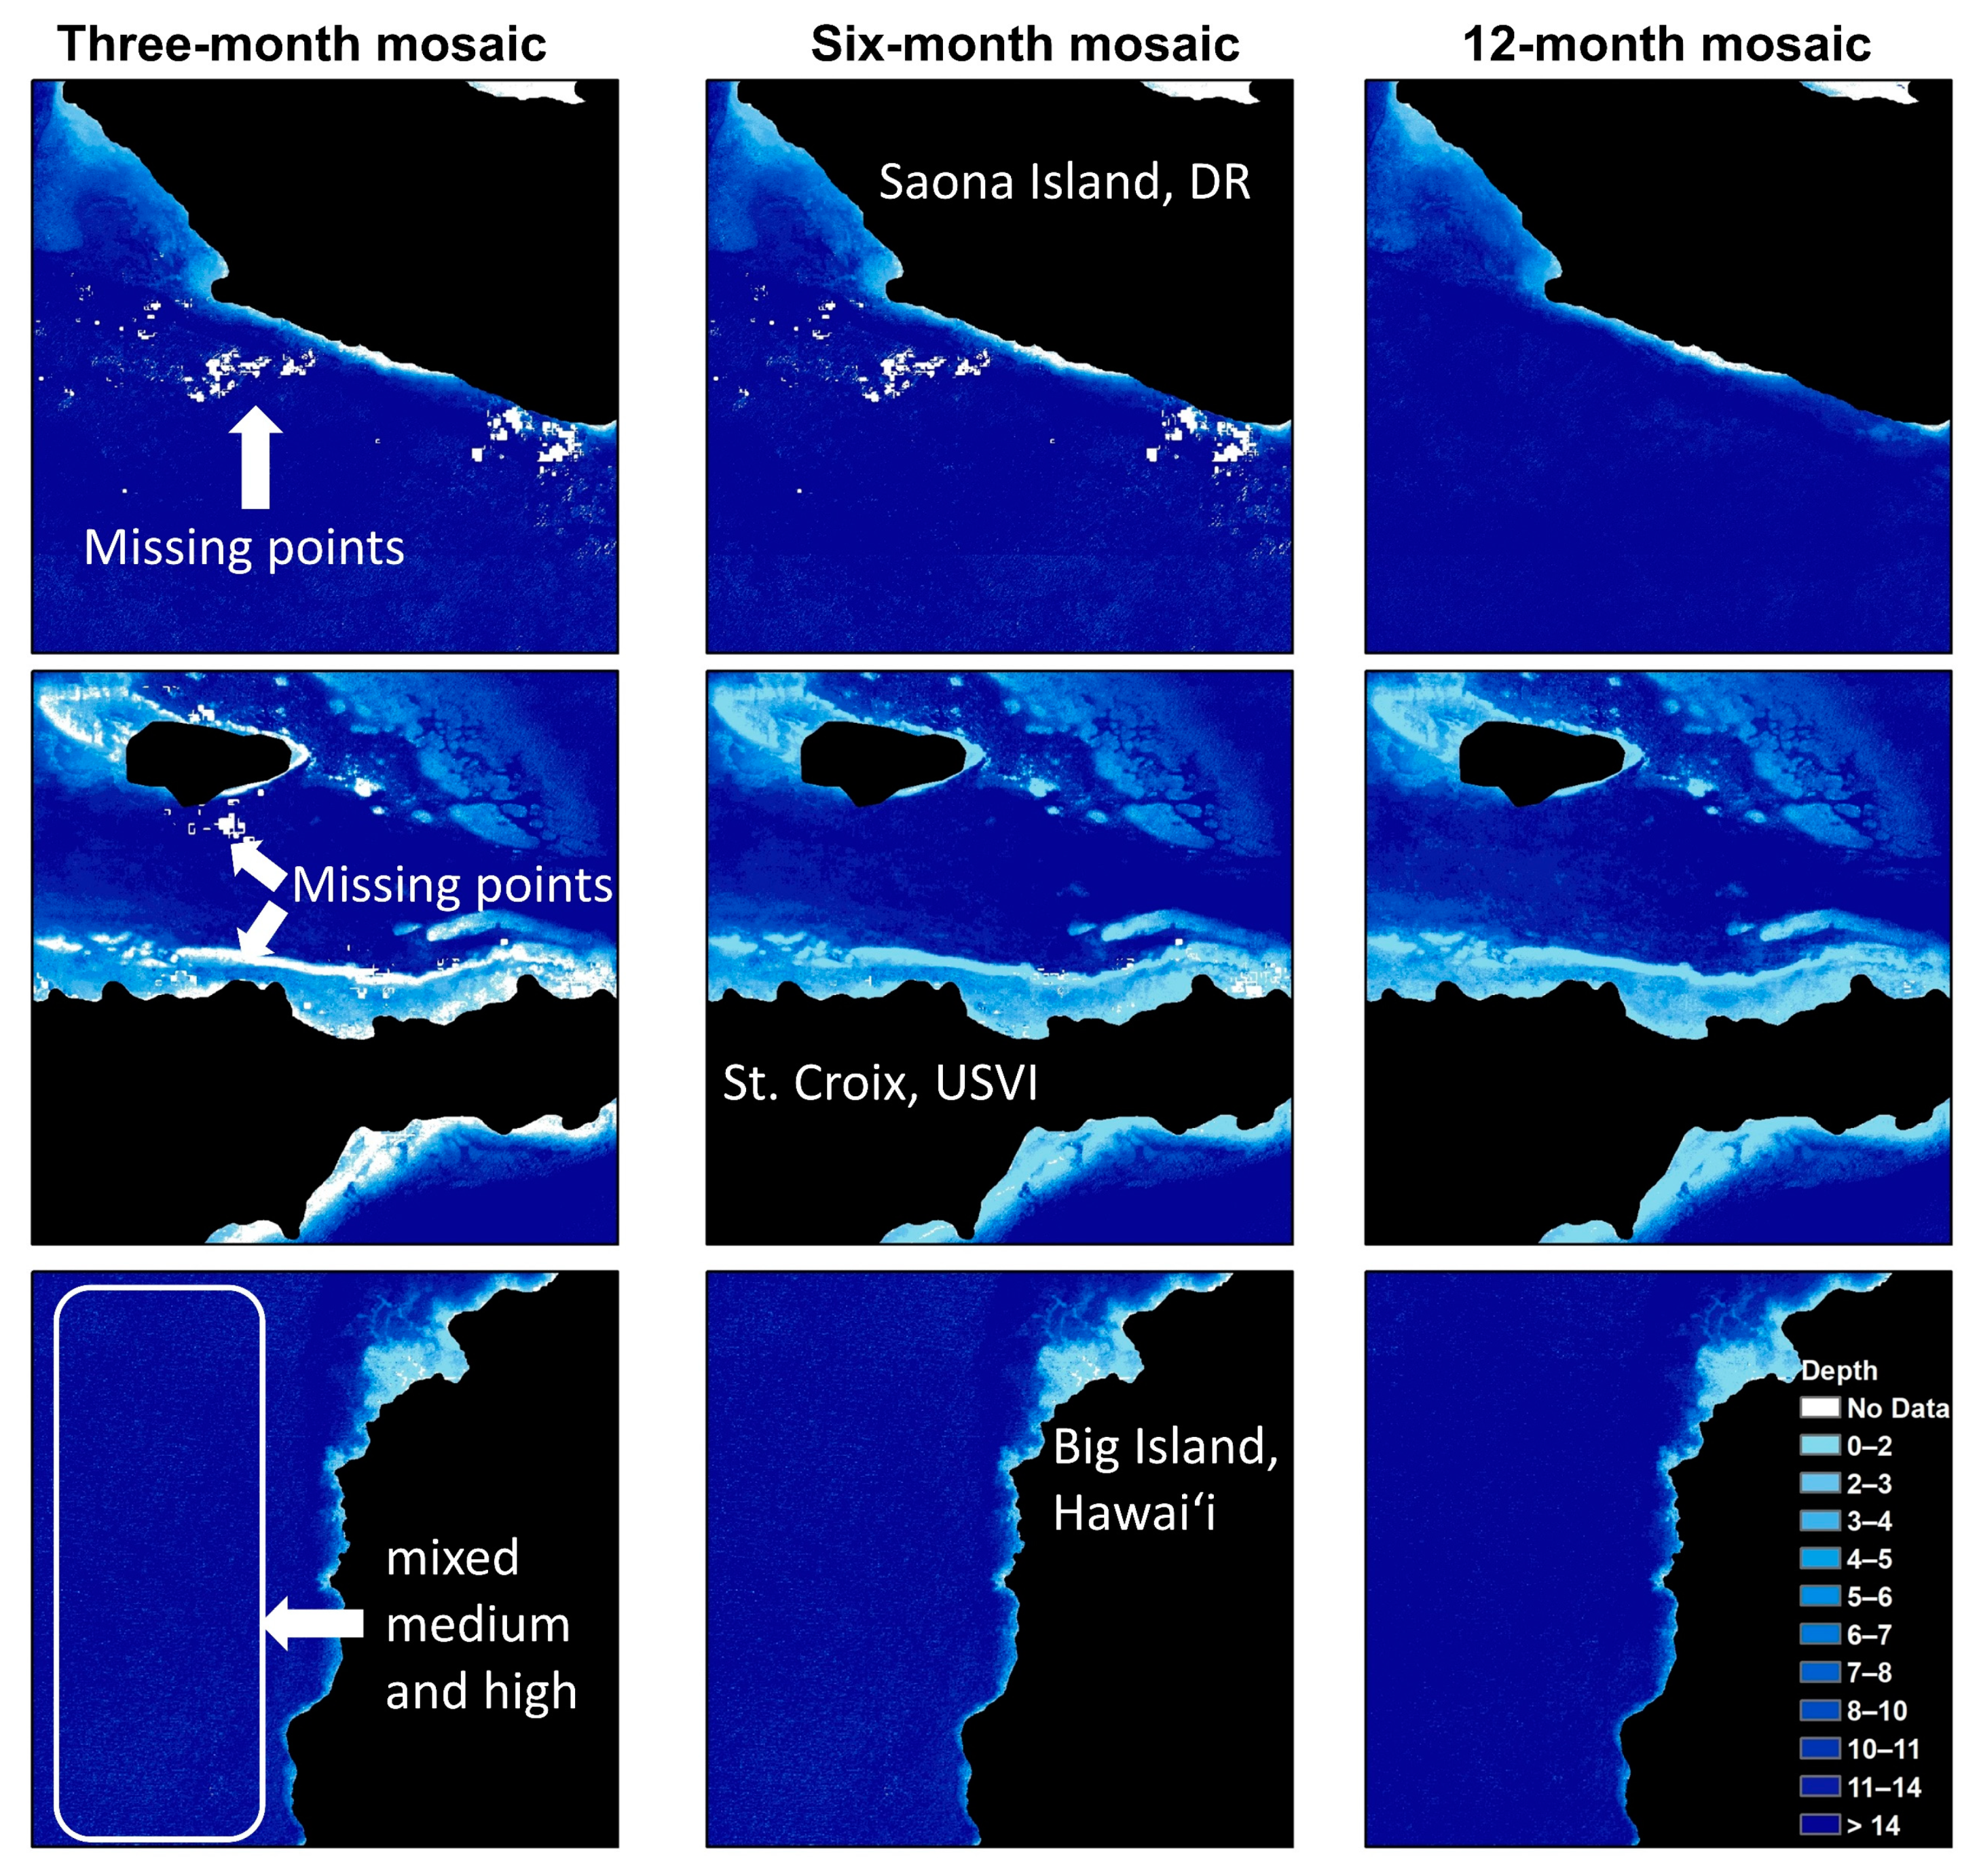
The mosaics over three different time ranges (i.e., 3, 6, and 12 months) were created using GEE and provided clean shallow water composites without clouds, breaking waves, and sun glint. Figure 3 illustrates our clean-water mosaic results across varying time ranges within three of the six sites. Overall, benthic habitats, such as coral reef, sandy bottom, hard bottom, and seagrass beds, are clearly identifiable in the mosaics (i.e., shallow waters of St. Croix, USVI).
Selecting scenes over a longer mosaic time range resulted in an overall higher quality mosaic (i.e., lower numbers of missing points) (Figure 3). We found that the 12-month mosaic had many fewer missing point quantities than the other mosaics in all three sites, where missing points are areas where no reflectance pixels were selected in the time range to build the mosaic. While image quality was similar when comparing between the six-month and three-month mosaics, performance was much improved going from six to twelve months. Missing points were primarily concentrated in near-coastal regions in the Dominican Republic and St. Croix, USVI, and in the latter, almost all missing points were located along the coastline. In West Hawaiʻi, missing points were located primarily in the open ocean.
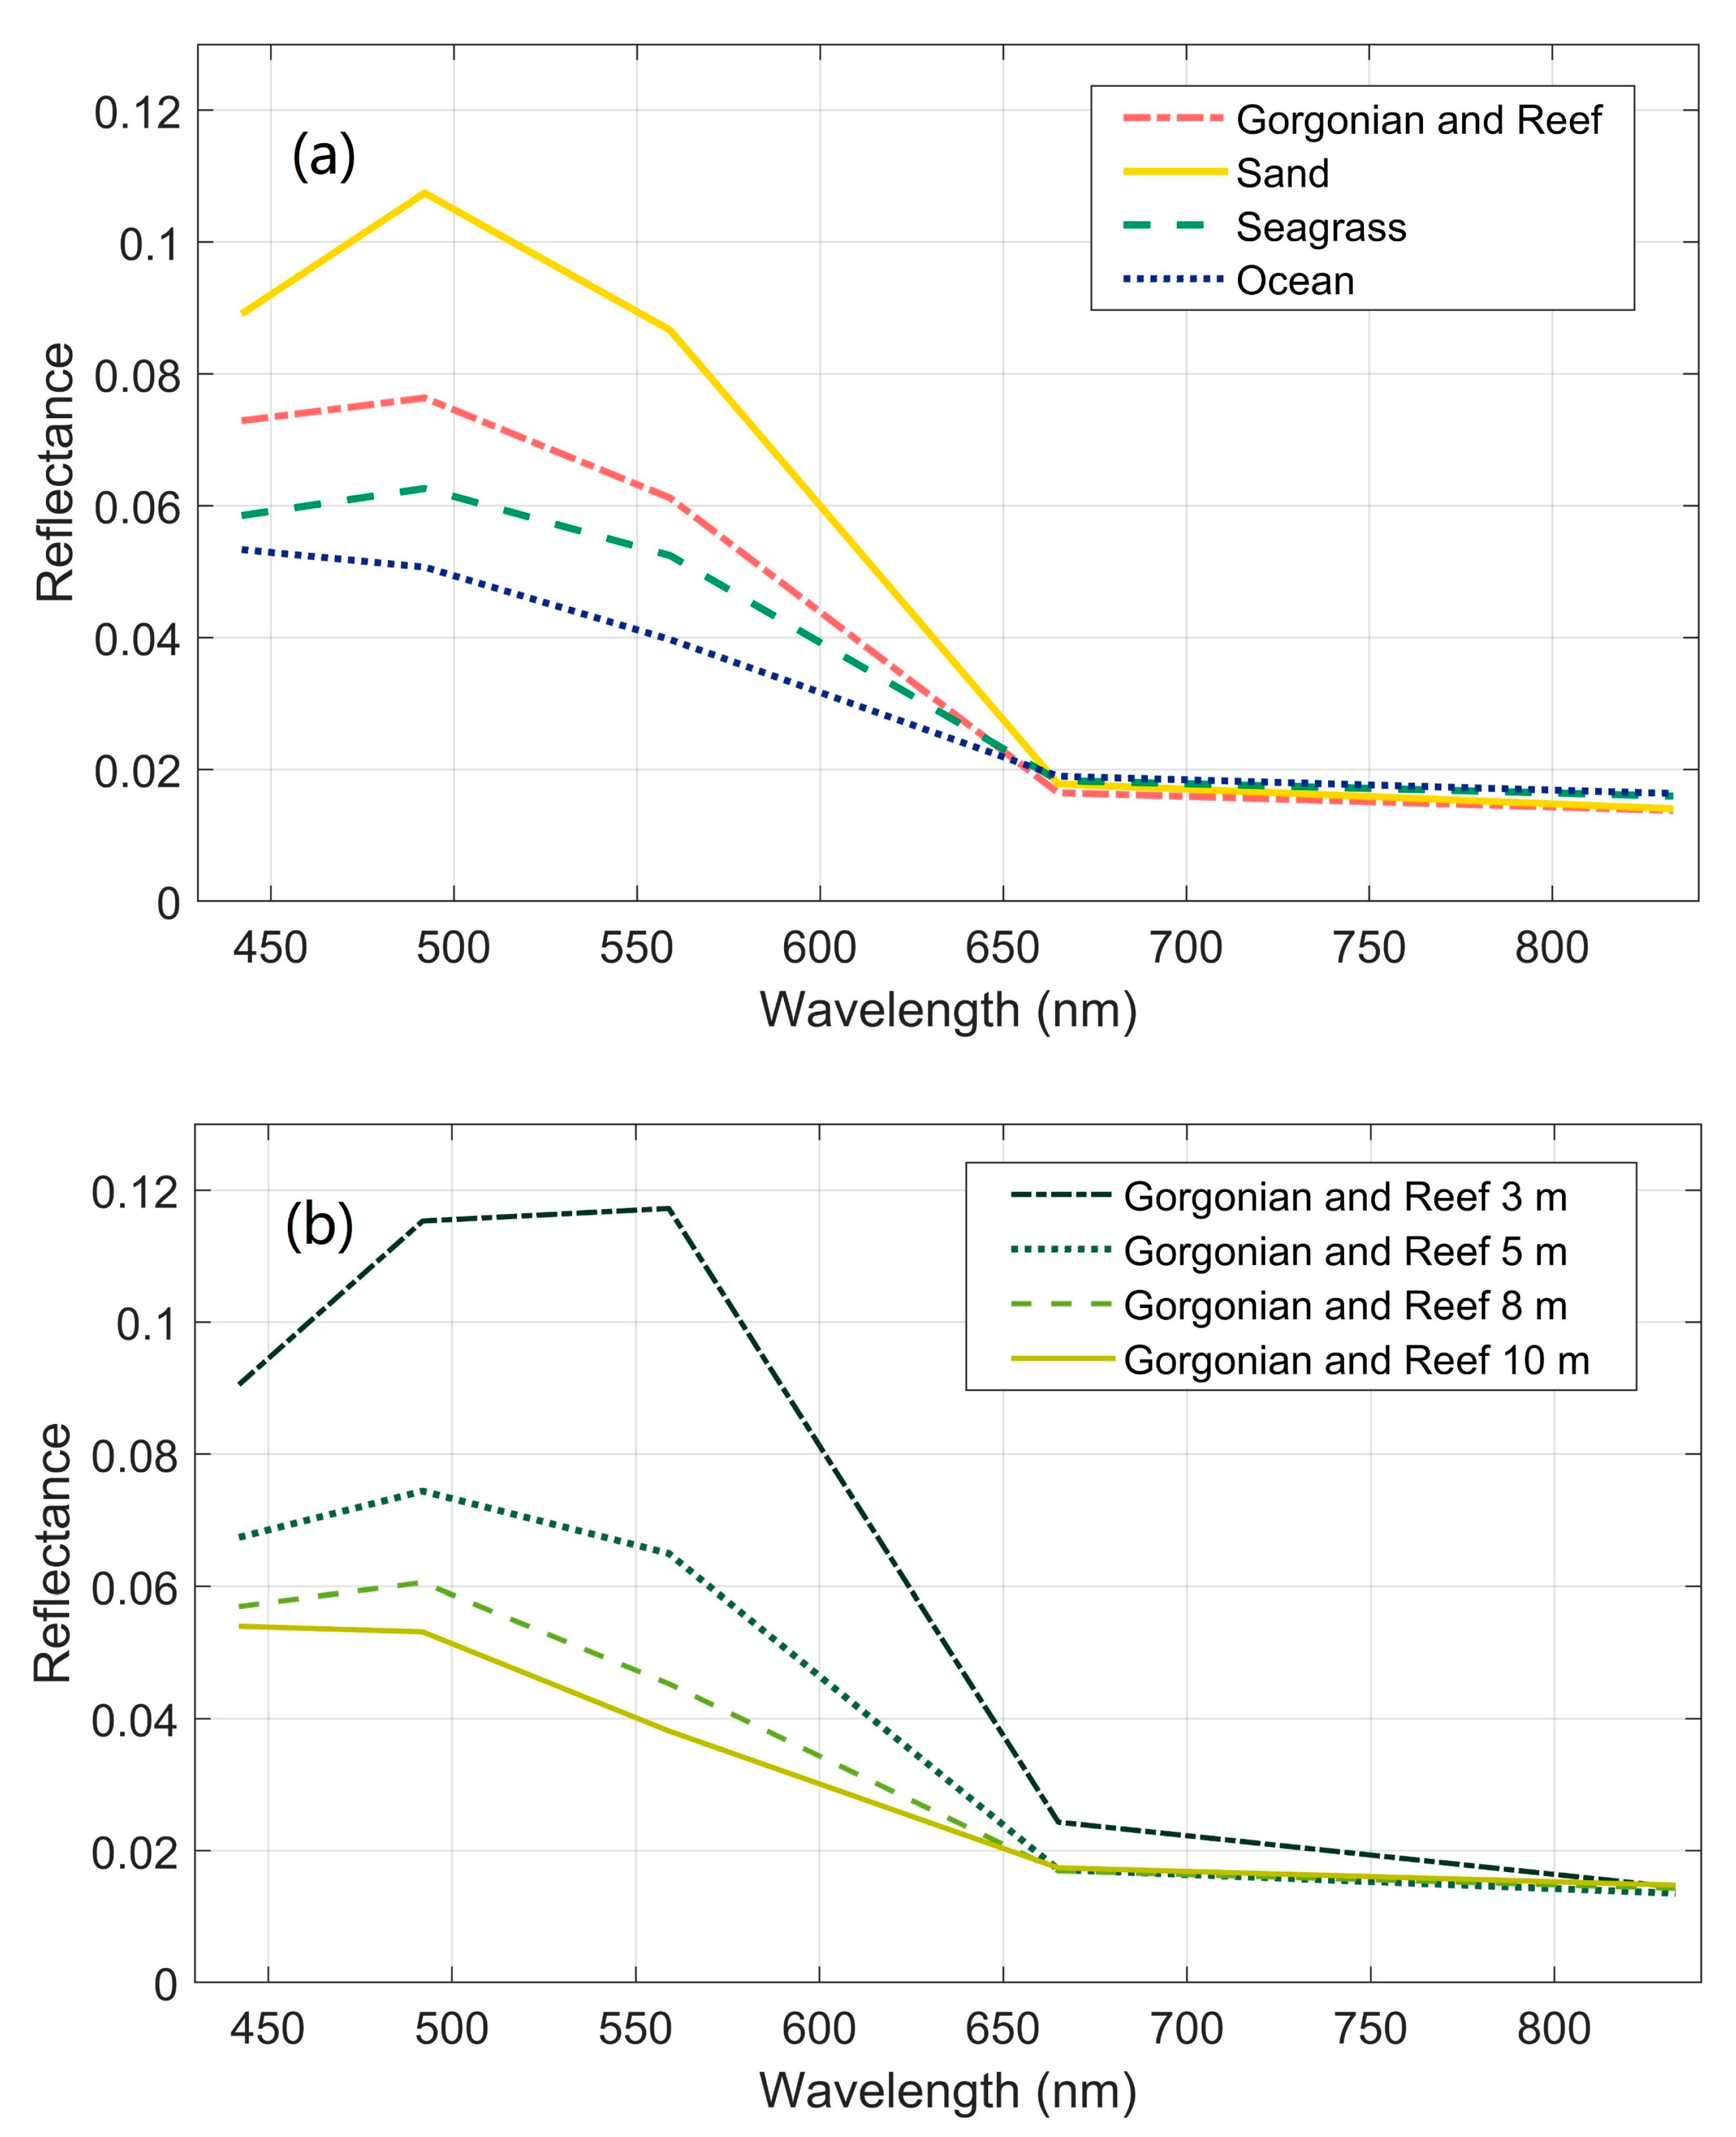
To examine mosaic reflectance, we plotted surface reflectance values of the 12-month Dominican Republic mosaic using different benthic targets (Figure 4), since the 12-month mosaic has the best quality. Using the field sample locations, we extracted mean spectral reflectance values of different benthic targets at similar depths (Gorgonian and Reef, Sand and Seagrass at 6 m depth, and Ocean deeper than 10 m depth, Figure 4a), and compared them to the same benthic targets across different depths (Figure 4b). The spectral shape and corresponding values represented the signal variations across different benthic targets and varying depths. For instance, a sandy bottom was characterized as having the highest average reflectance values, while seagrass beds and ocean (dark targets) had the lowest average values. A decrease in surface reflectance values from the red to NIR bands was observed across all targets. As expected, we also observed a decreasing pattern in spectral values from shallow to deep water across the same targets (Gorgonian and Reef, Figure 4b).

3.2. Bathymetry Spatial Variation Analysis

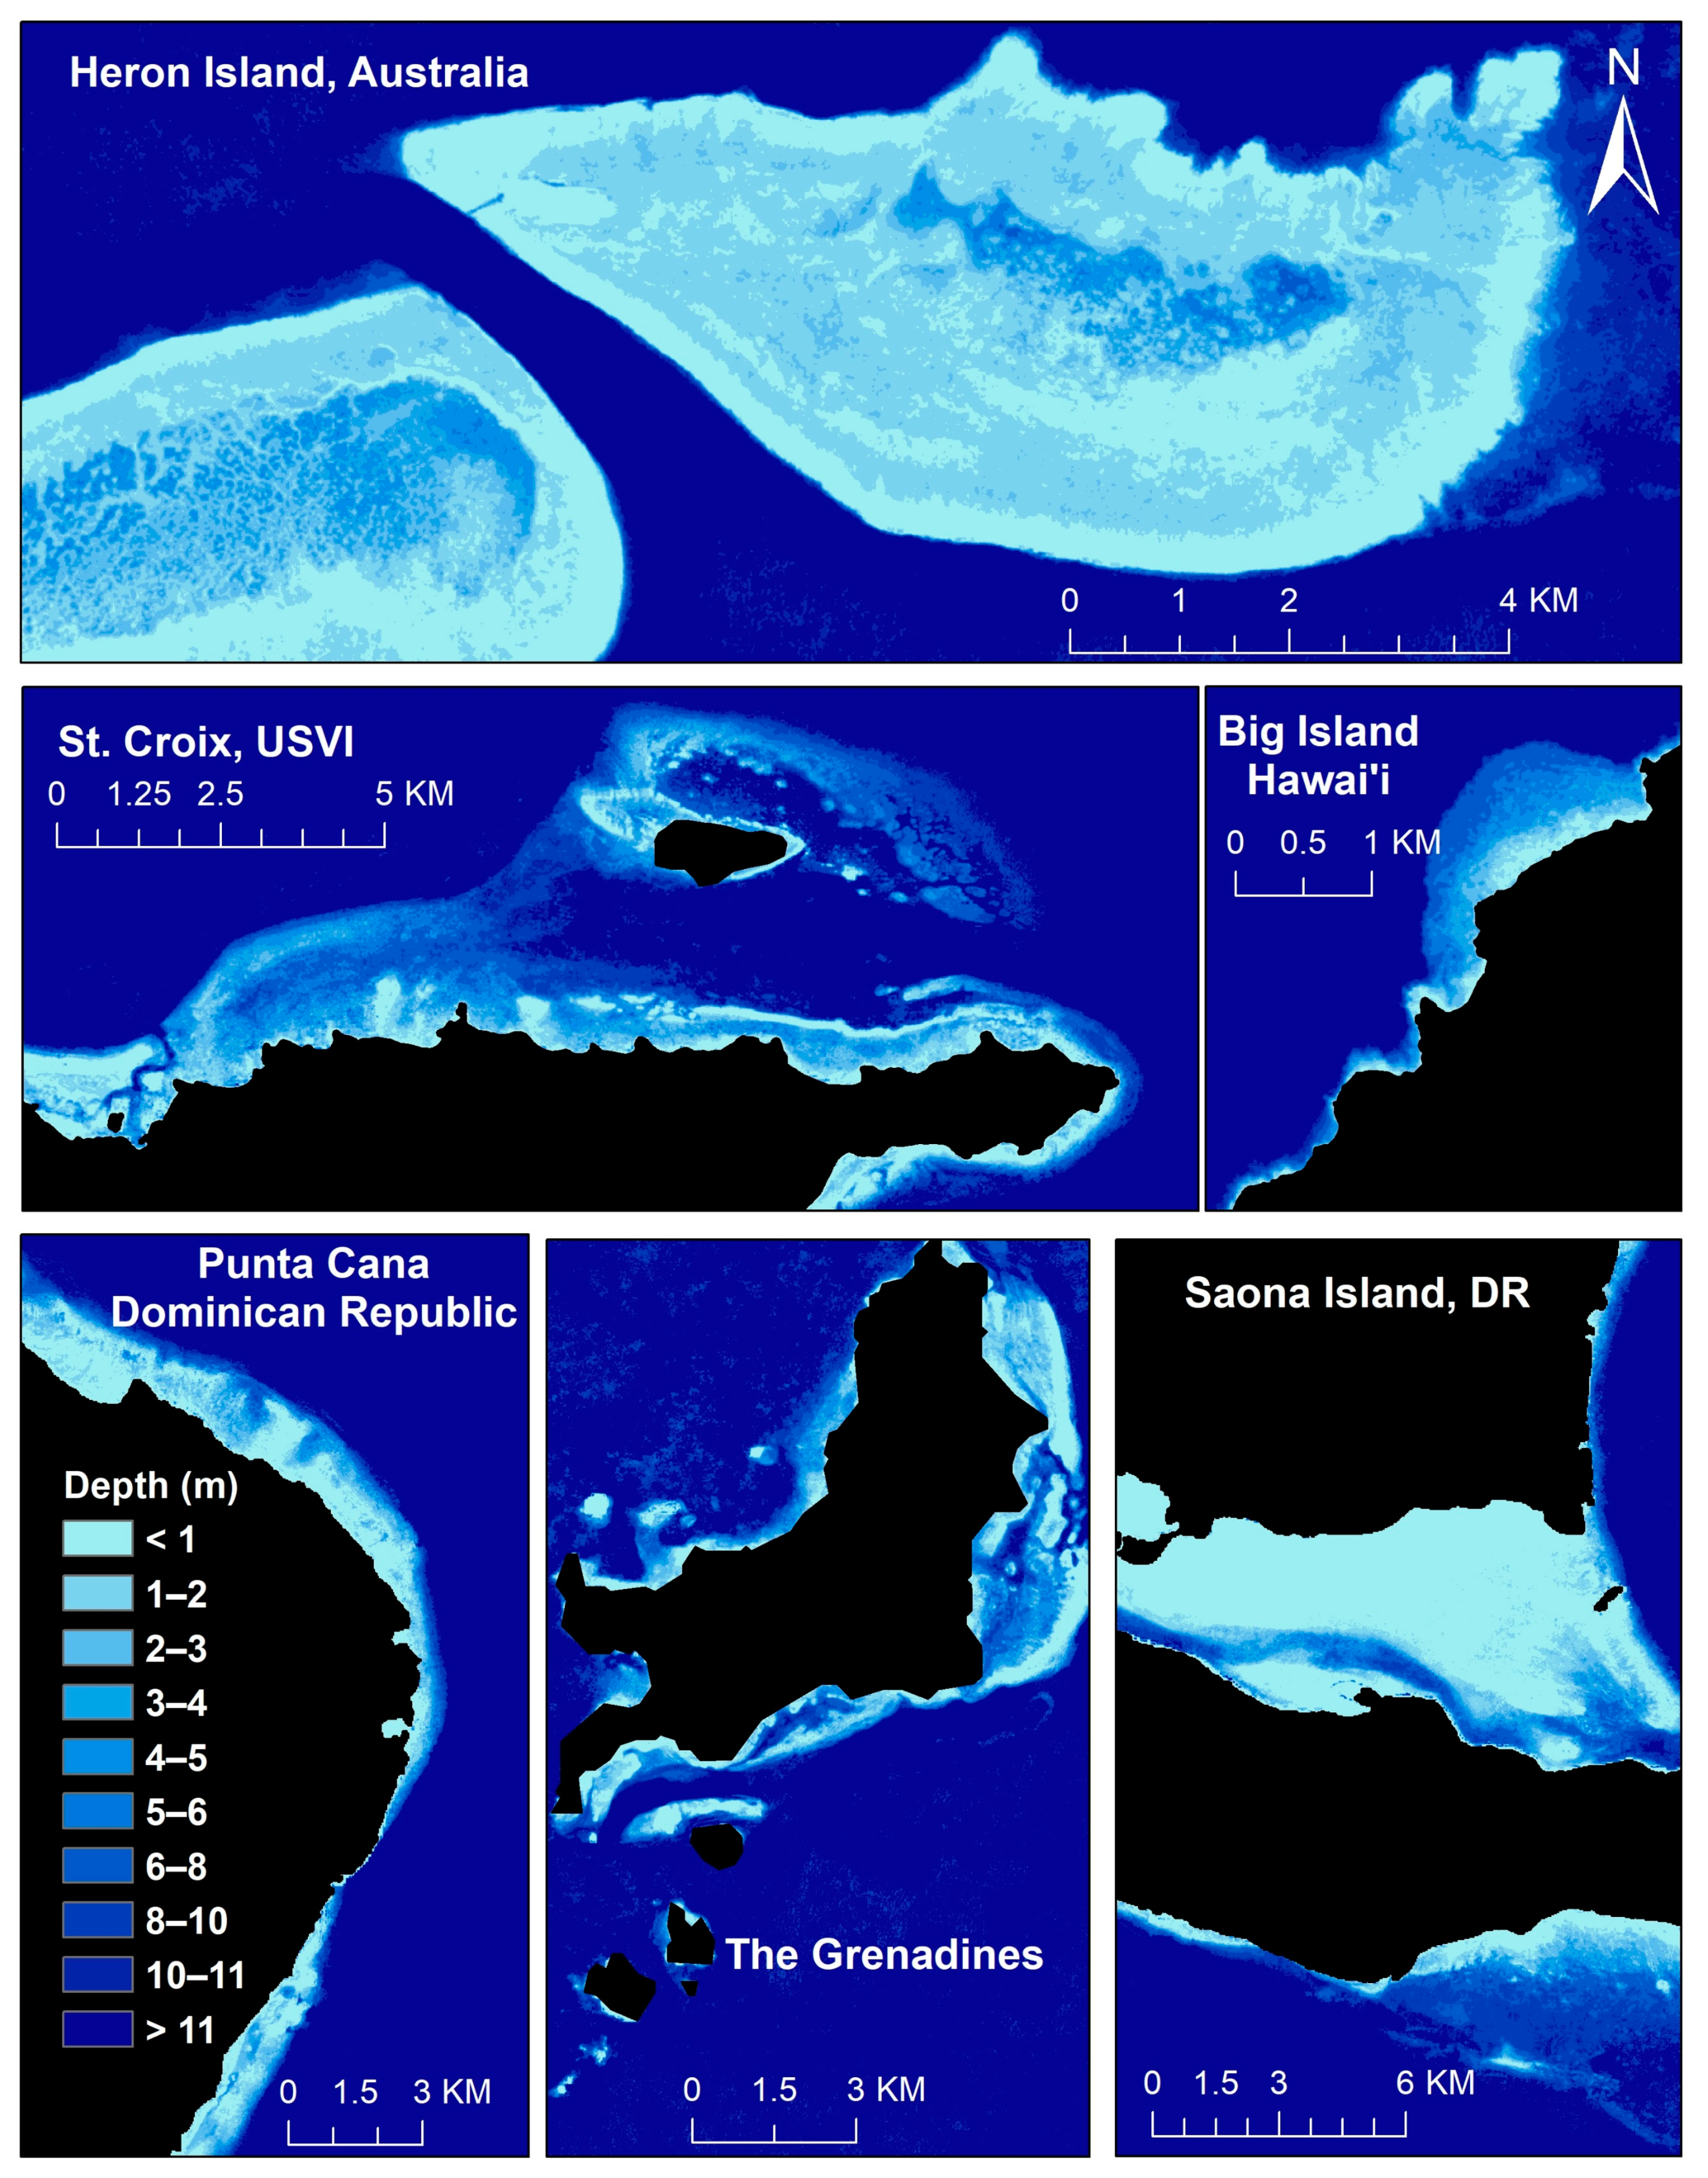
Figure 5 shows the results of bathymetry maps generated using 12-month mosaics that were created in GEE. These bathymetric models exhibited expected spatial patterns, such as bathymetry values increasing from shallow to deep waters in the direction from the coastline to the ocean. This pattern was consistent across all five land-linked study areas. For example, in Punta Cana, Dominican Republic, shallow depths (<5 m) were observed nearshore, transitioning to medium depths (5–10 m) at a distance of ~1 km from land, followed by deeper water (>12 m) in the open ocean. In Heron Island, Australia (nearly 80 km north east of Queensland, Australia), we found the expected depth pattern in a reef area. It showed the bathymetry increased from 3 to 15 m between the reef rim and open ocean. In the reef rim regions, depth was observed less than 3 m. By contrast, beyond the reef rim regions, depth sharply increased to over 15 m. Moreover, our bathymetry maps showed constant high values (e.g., depths > 15 m) in the optically deep ocean waters.
Each of the bathymetry maps that were created using the different temporal mosaic composites (i.e., 3-, 6-, and 12-month mosaic) were investigated to determine the effect the mosaic time period had on the estimated bathymetry values (Figure 6). Consistent with the surface reflectance mosaic results, the 12-month mosaic provided the lowest number of missing data pixels and the cleanest bathymetric spatial patterns (Figure 6). For instance, in St. Croix, USVI, both three-month and six-month mosaics show a dense area of missing depth points along the coastline. Moreover, the depth values across the ocean yielded less consistent patterns in the three and six-month mosaics compared to the 12-month mosaic. For instance, in the Dominican Republic and West Hawaiʻi, depth values of the three-month mosaic showed more errors, resulting in mixed medium (~8 m) and deep values (>10 m) in the open ocean. In contrast, the 12-month mosaic yielded more accurate deeper values (>10 m) in the open ocean.

3.3. Evaluation of Bathymetry Estimation

We compared depth point values from the satellite bathymetry map with field depth sample locations. Table 2 shows four error metrics capturing differences between the satellite-derived bathymetry and field-derived depth values. In the 12-month mosaic, our approach effectively generated depth values with a Root Mean Square Error (RMSE) ranging from 1.26 to 1.98 m. Heron Island and Punta Cana, Dominican Republic performed best with RMSE values of 1.35 m and 1.26 m, respectively. West Hawaiʻi, St Vincent and the Grenadines also had relatively high RMSE values, around 1.9 m. Bias results within the six sites ranged from −0.83 to 1.09 m, where Punta Cana, Dominican Republic and St. Croix showed lowest bias values of, 0.06 m and −0.02 m, respectively. Mean normalized bias (MNB) values confirmed high performance, with values ranging from −0.15 to 0.13. Finally, R2 values demonstrated high correlation between GEE-derived bathymetry and field measurements (Table 2).
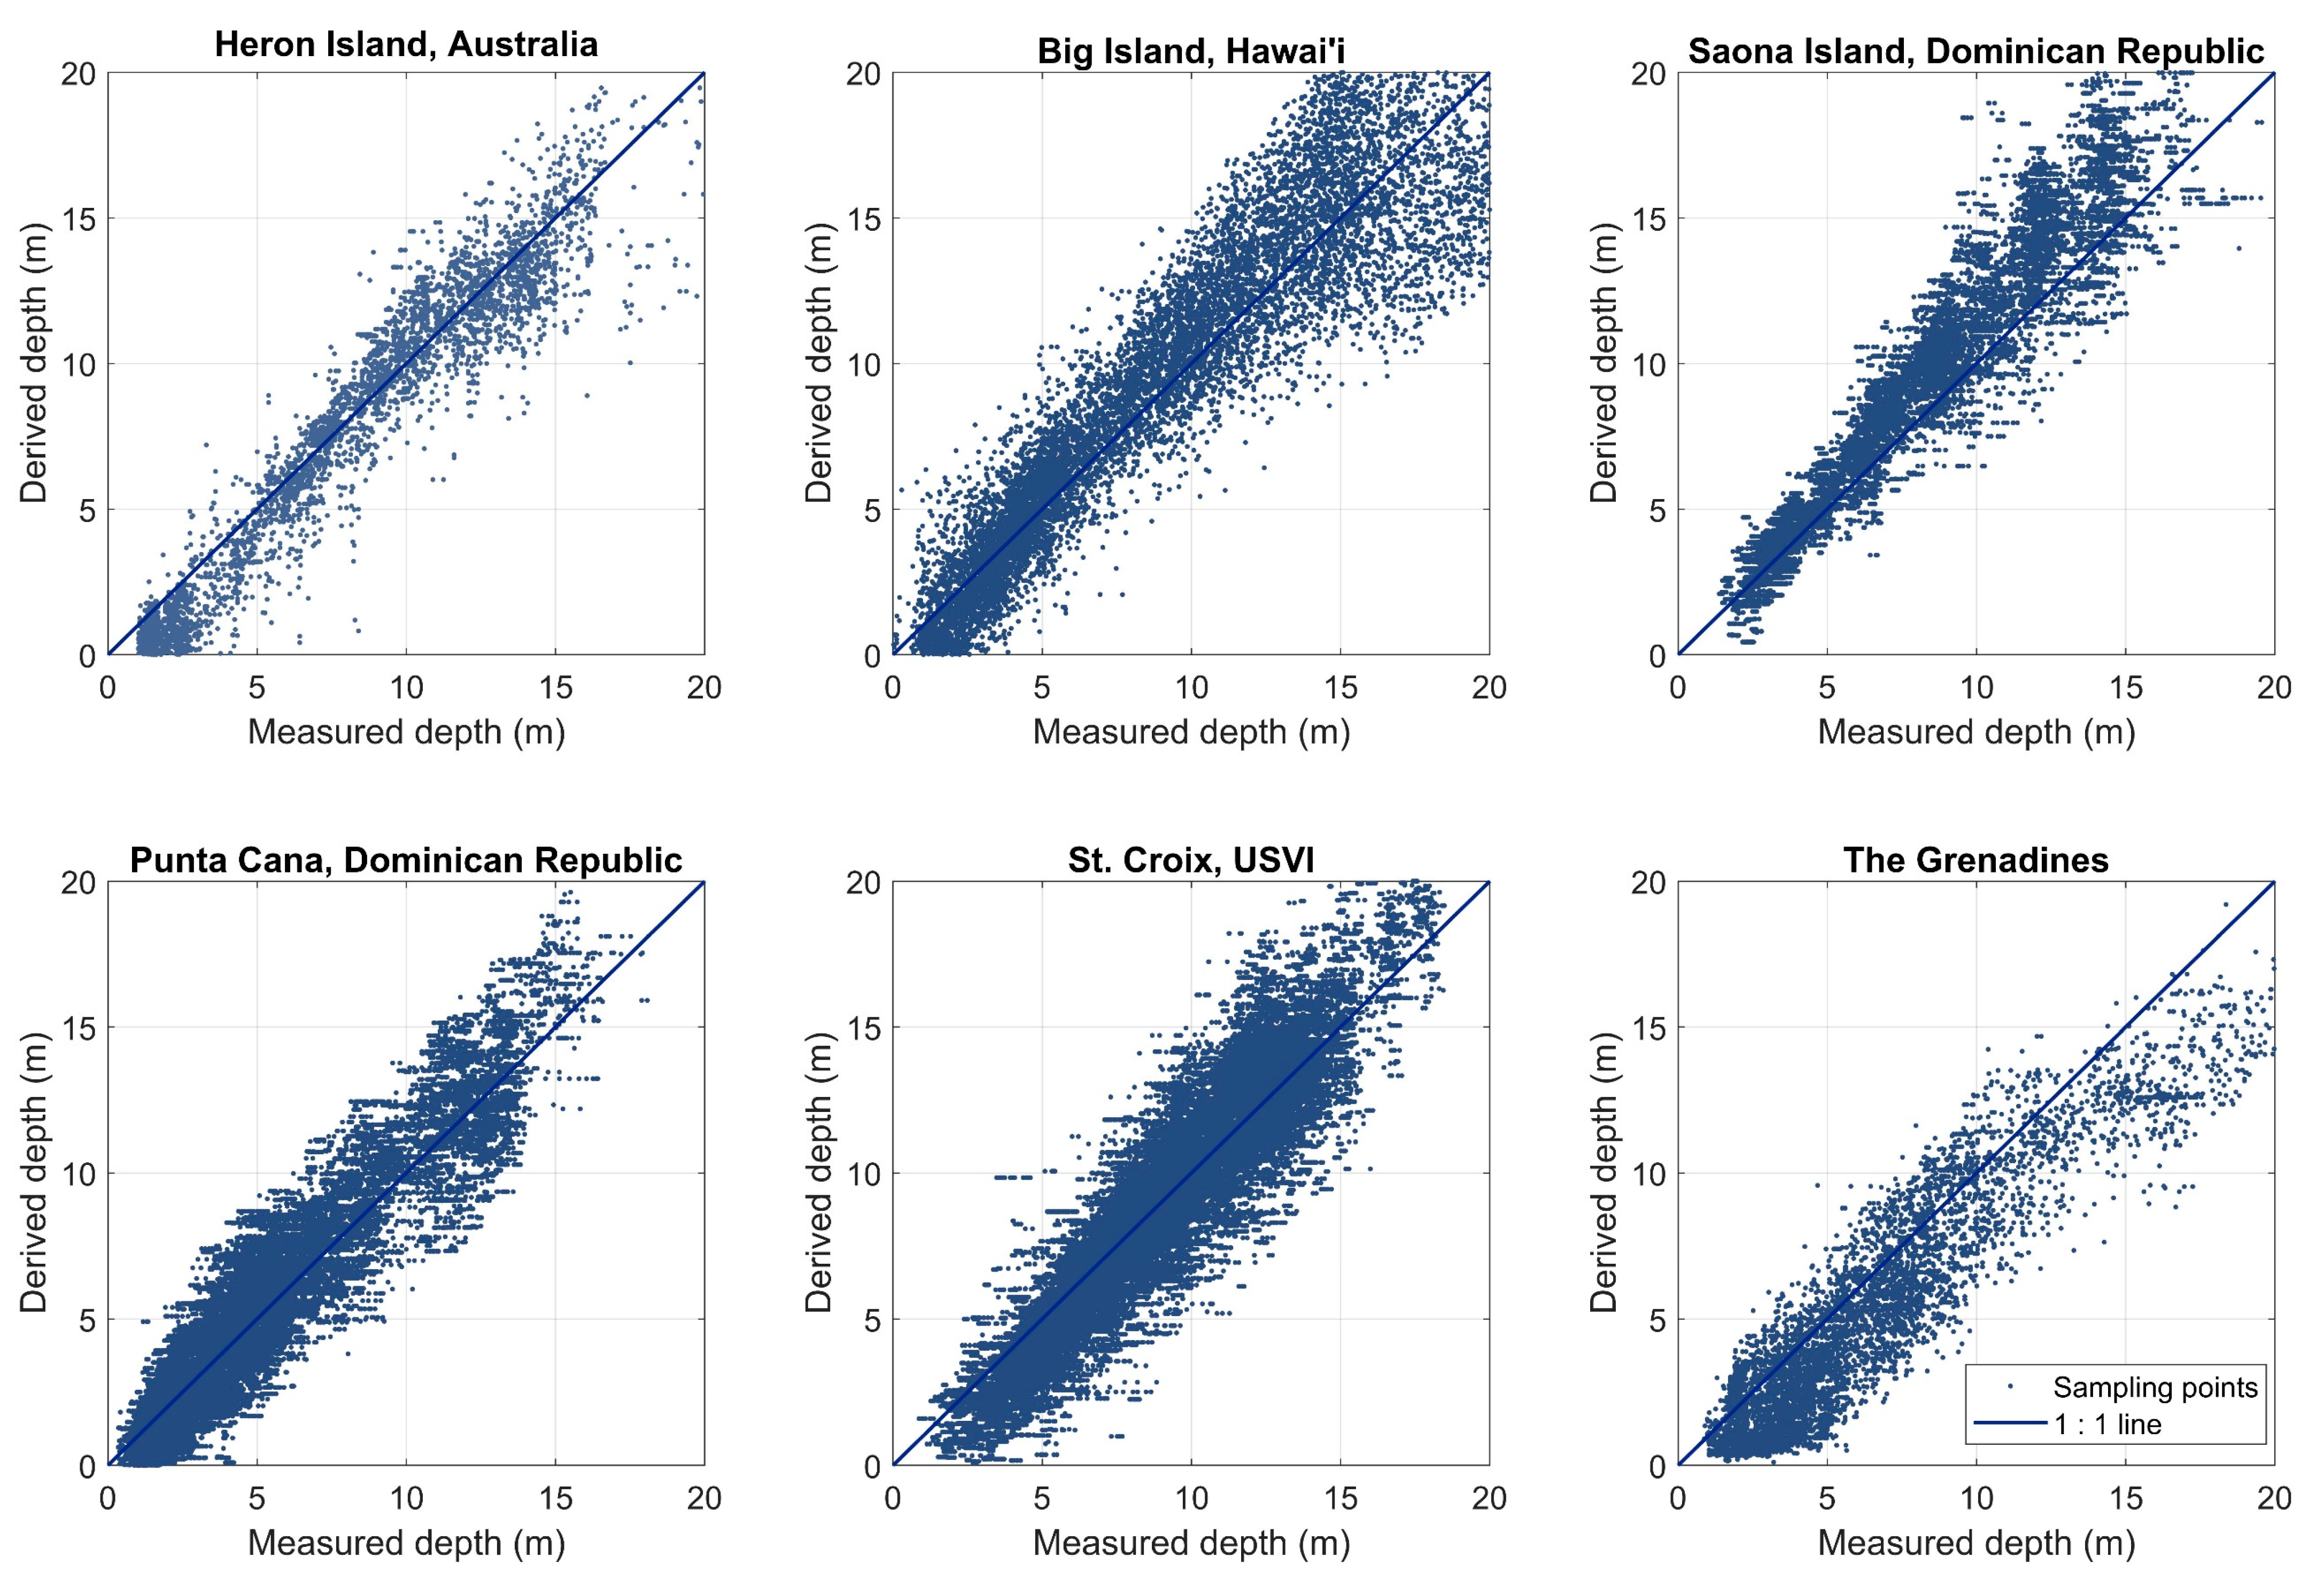
We compared 12-month mosaic-derived depth with field depth samples at six different sites (Figure 7). We found the satellite-derived depth was highly correlated with field depth samples across all sites. As shown in the plots, the majority of points follow the 1:1 line. Overall, R2 values ranged from 0.78 to 0.98 (Table 2), with Heron Island (R2 = 0.98) and Punta Cana, Dominican Republic (R2 = 0.86) showing the highest correlation. In particular, depth points tightly followed the 1:1 line for depths < 15 m. We observed more sparsely distributed points when the 15 m depth was exceeded. For instance, we found underestimated values in The Grenadines and overestimated values in Saona Island over 15 m.

3.4. Bathymetry Estimation Performance Impacted by Mosaic, Depth and Bottom Conditions

We evaluated the performance of our approach across different parameters including mosaic time range (three months, six months and 12 months), depth range (0 to 5 m, 5 to 10 m, 10 to 15 m and 15 to 20 m), and bottom benthic types (coral reef, sand, seagrass, and ocean). We found that longer-time frame mosaics offered better results in all error metrics (Table 2). 12-month mosaics had 20% lower RMSE values and better Bias, MNB and R2 values compared with six-month and three-month mosaics. Performance (e.g., RMSE and R2 values) did not dramatically improve between three- and six-month mosaics. Overall, a majority of the mosaic depth results had the same Bias and MNB trend (e.g., over-estimation: Saona Island; under-estimation: Heron, The Grenadines).
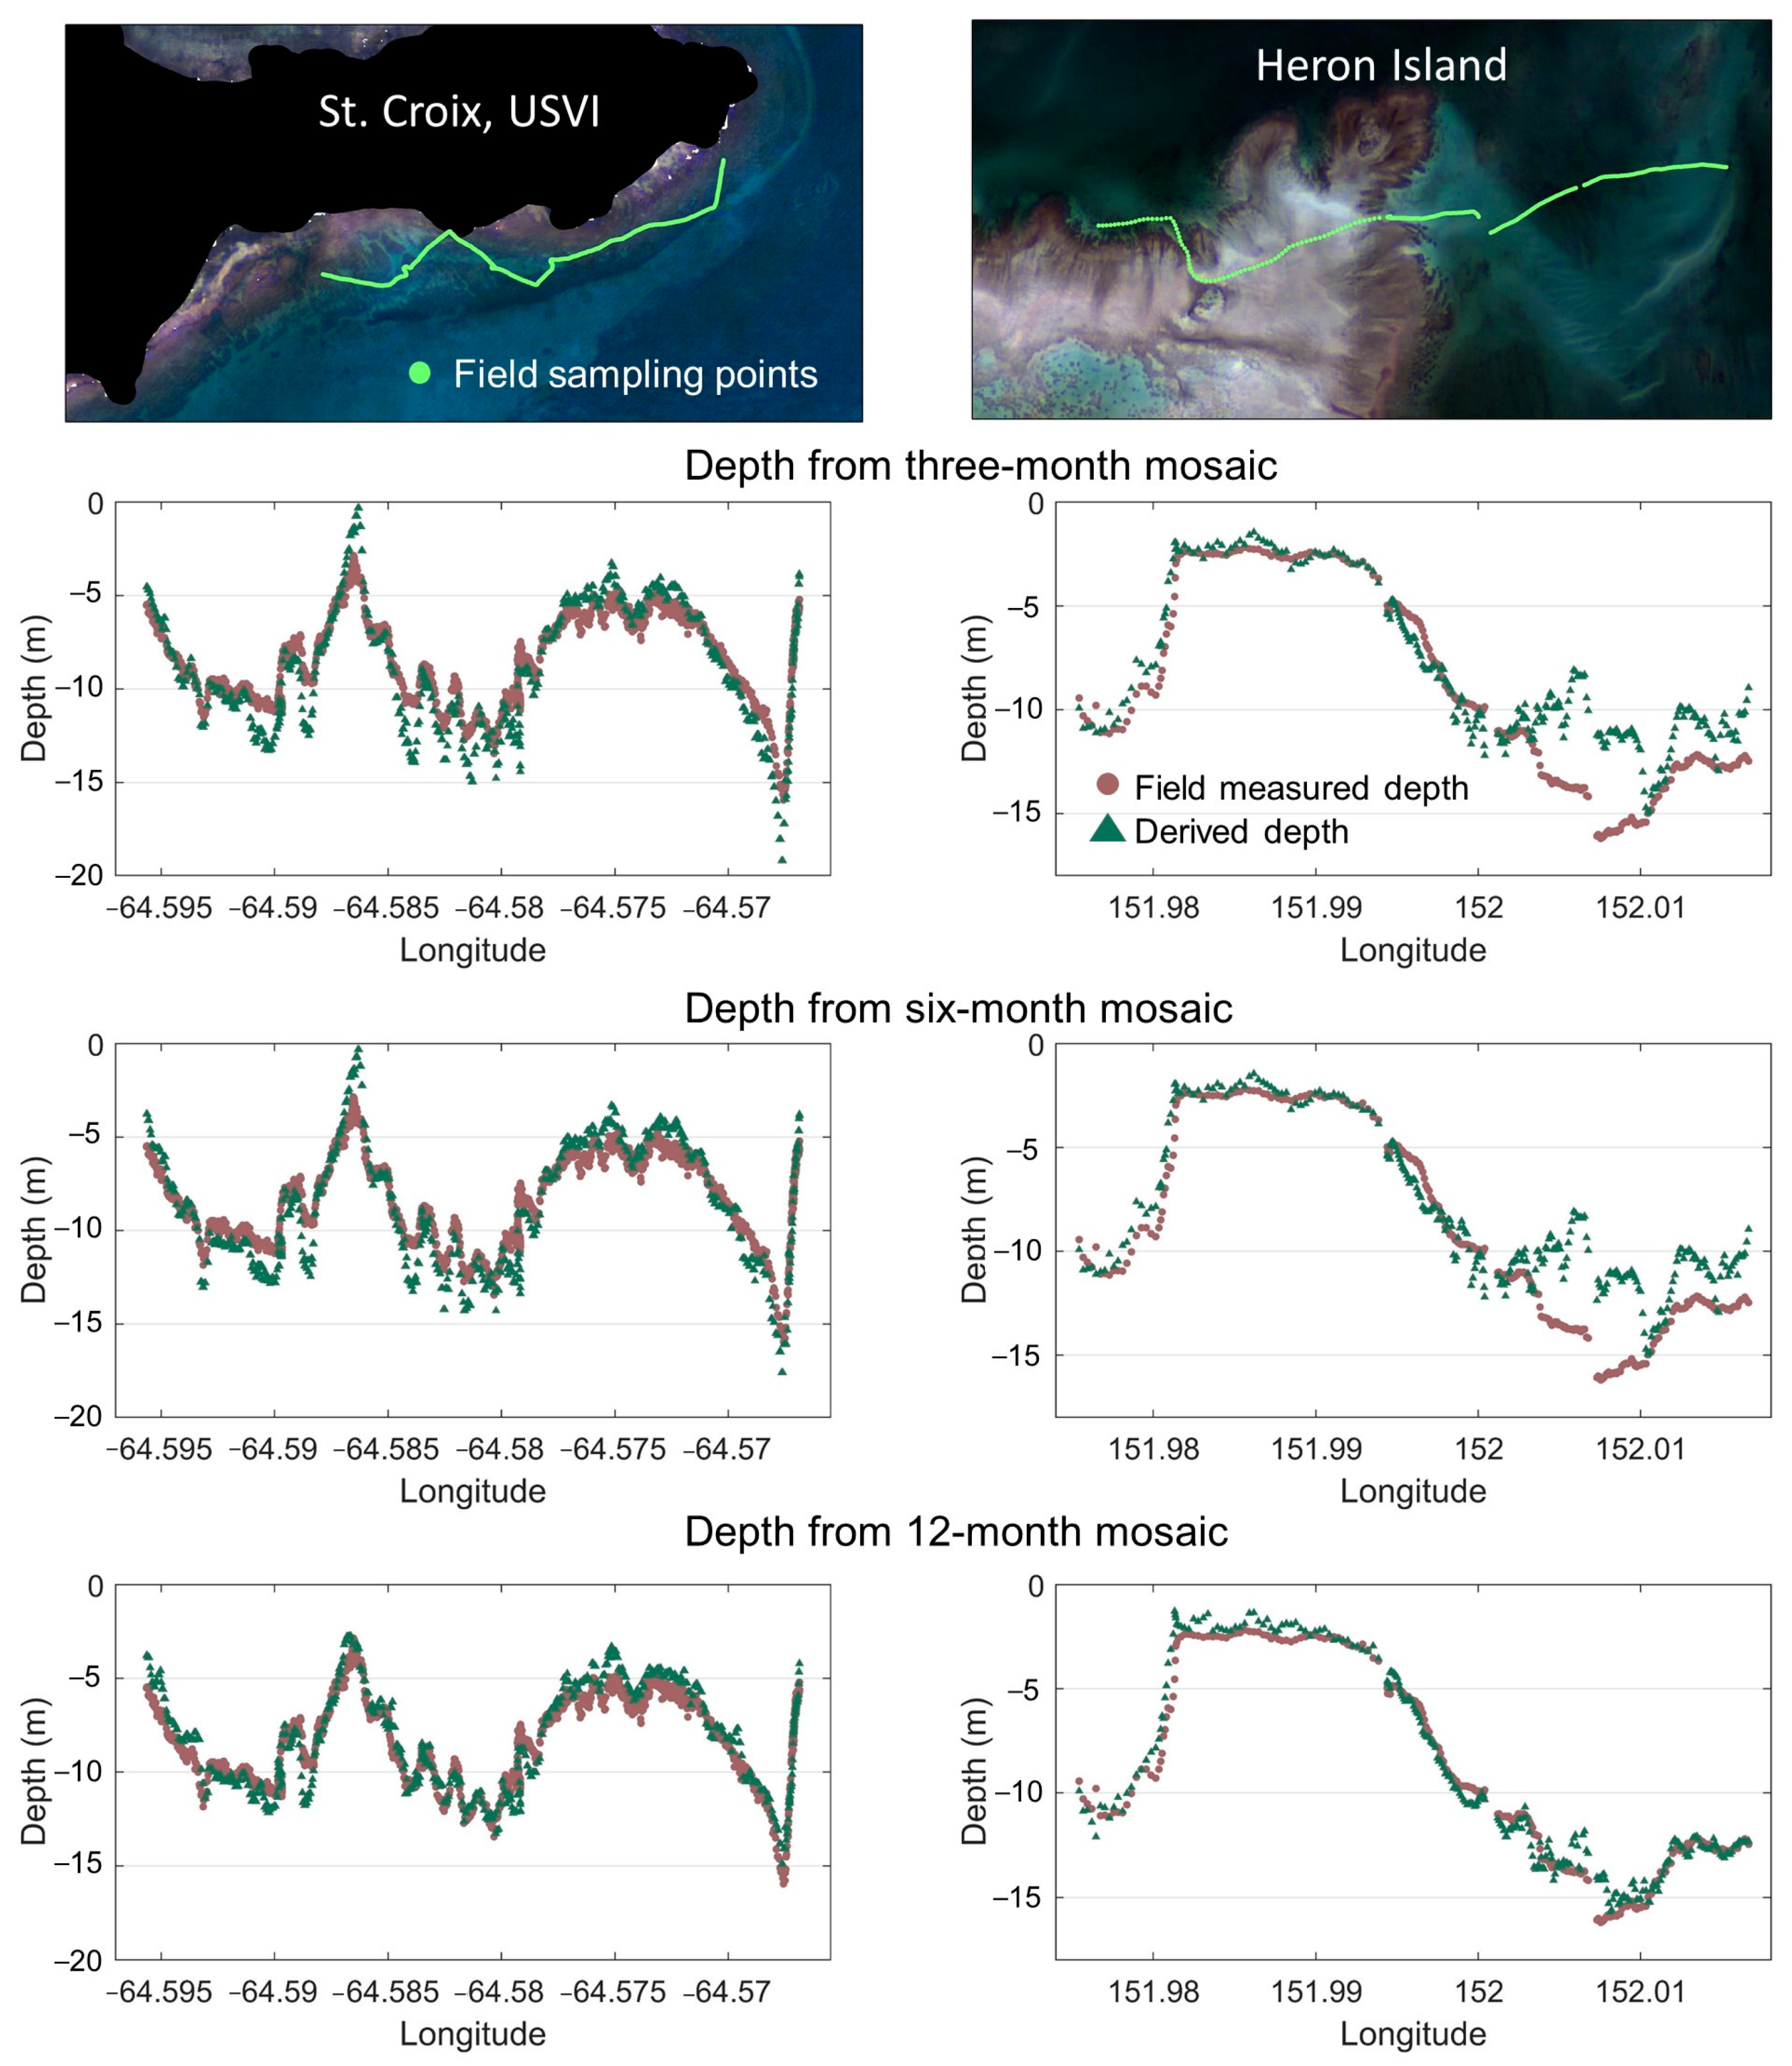
We compared satellite-derived depths with field-measured values along two transects in St. Croix and Heron Island (Figure 8). These transects traversed different geomorphologic regions and benthic types, and therefore provided variable environments for testing performance. Depth results from all period mosaics and study sites followed the spatial trend of field measurements. As expected, 12-month mosaics showed the best correlation with field measurements, while three- and six-month mosaics resulted in a lower correlation. For example, three-month mosaics slightly over-estimated (1 to 2 m higher) values at edge points of the transect in St. Croix, and underestimated a discrete section of the transect at Heron Island.
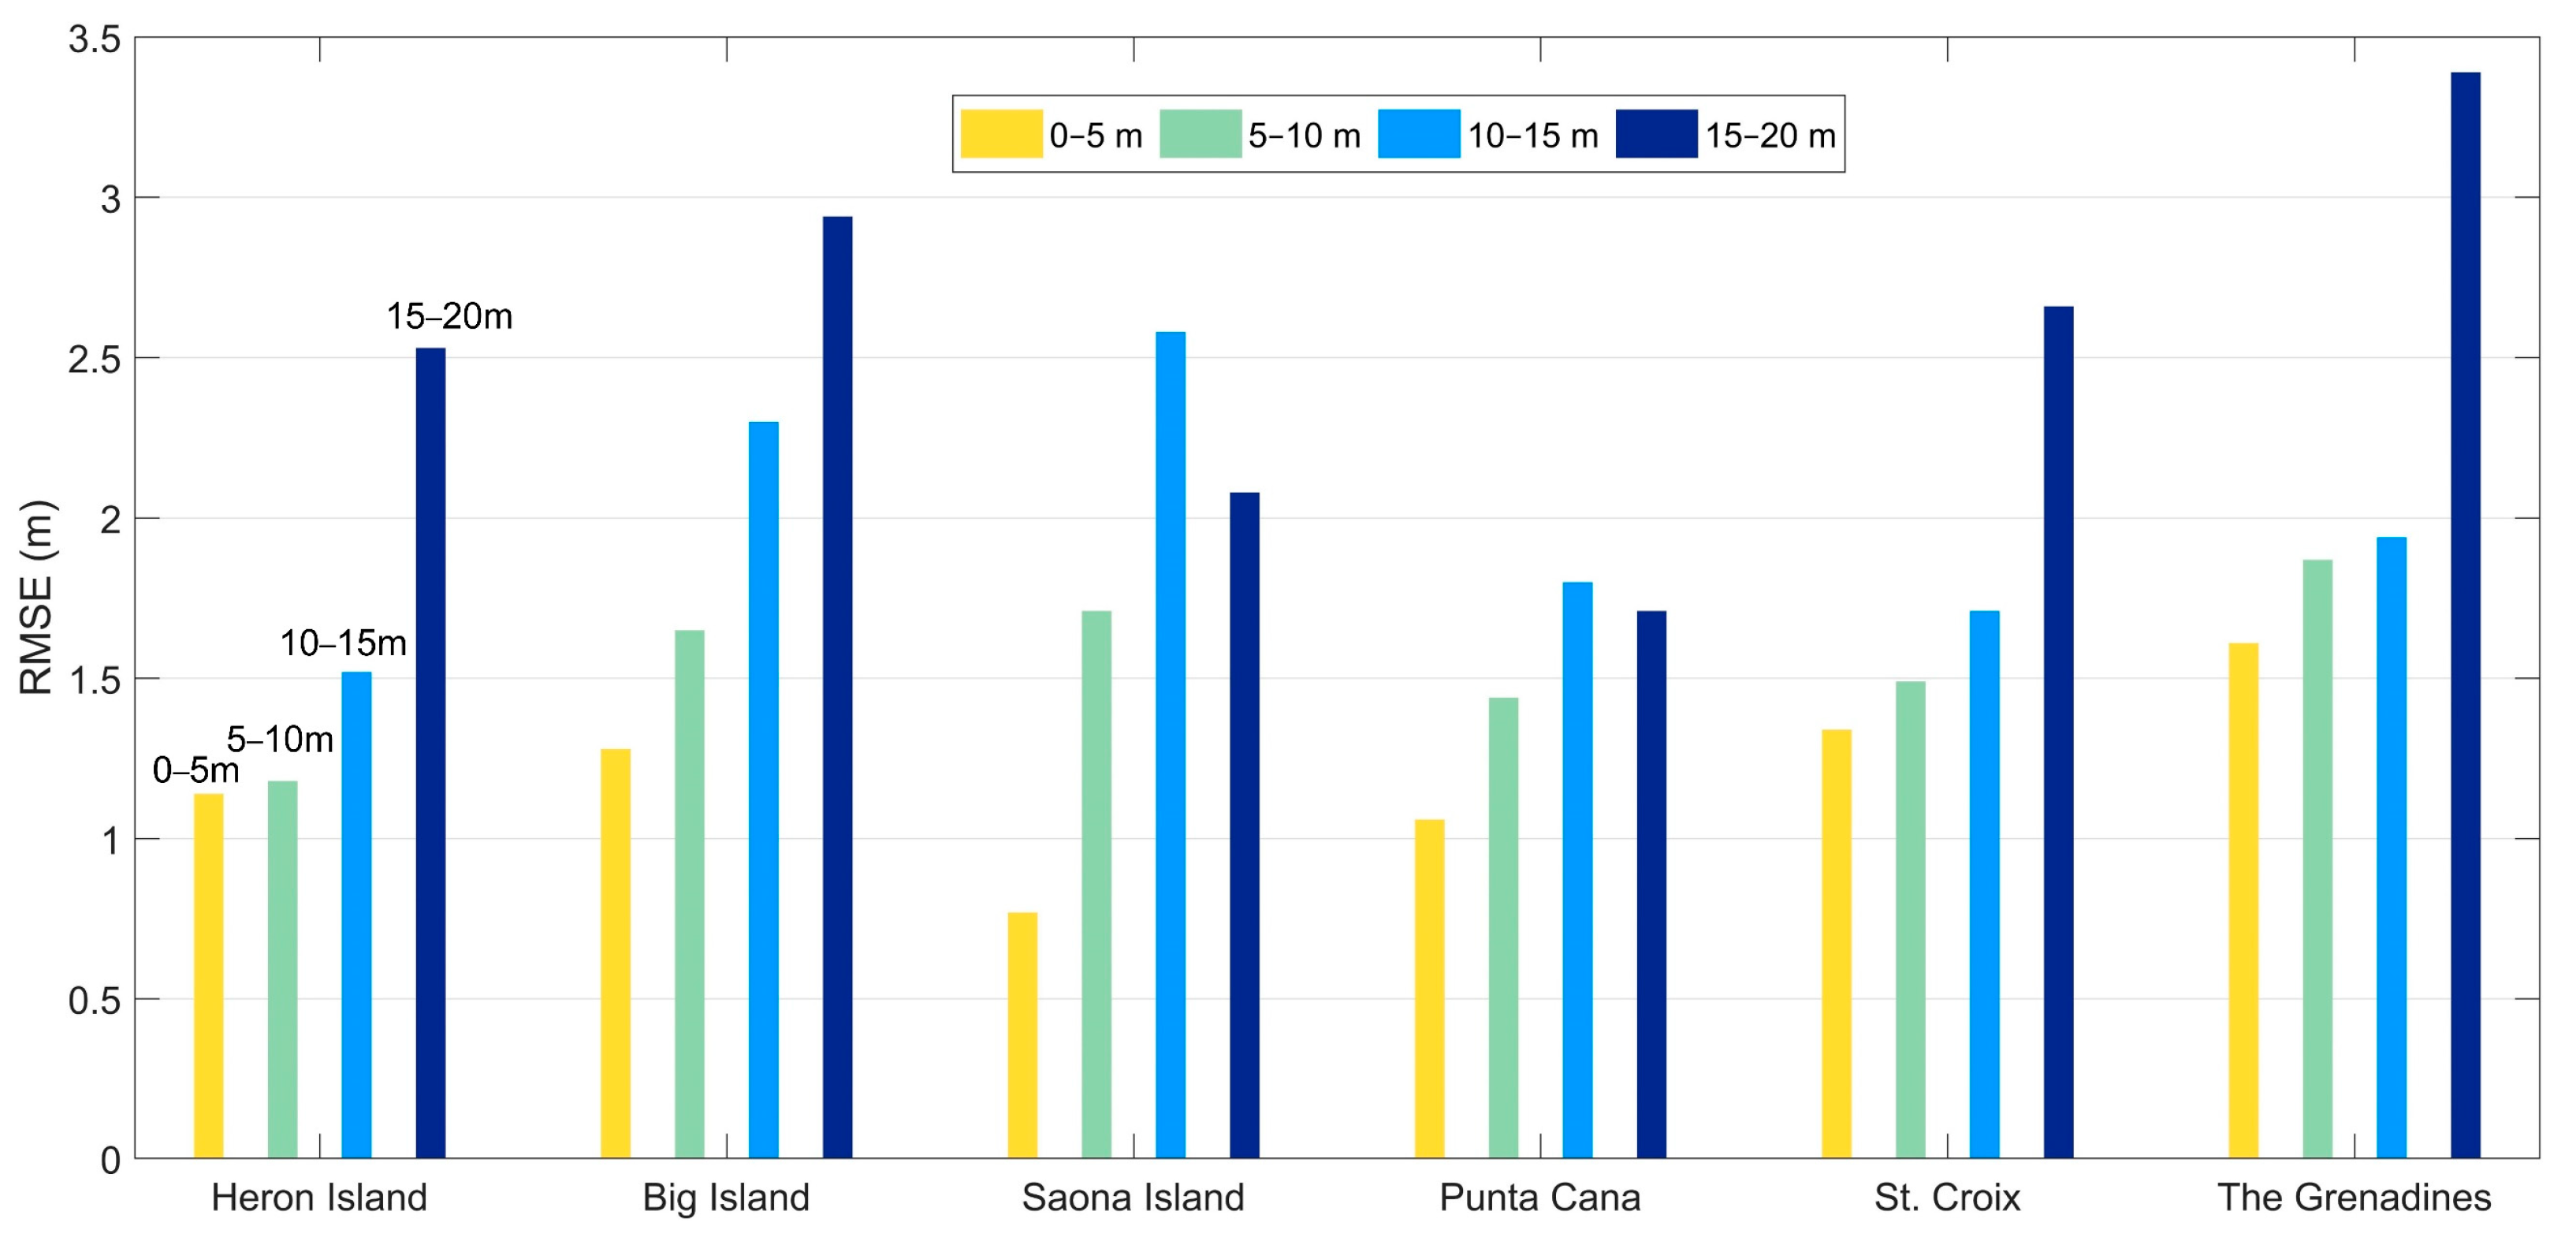
To further analyze how our method performed at different depths, we calculated RMSE values of bathymetry results (12-month mosaics) in different depth groups (0 to 5 m, 5 to 10 m, 10 to 15 m and 15 to 20 m) according to the field depth records (Figure 9). We found that RMSE increases as depth increased. Our method performed better in shallow (0 to 5 m, 5 to 10 m) and medium depth waters (10 to 15 m), and worse in deeper waters (15 to 20 m). RMSE values of deep waters are nearly twice as high as shallow waters. This phenomenon is clearly visible in Heron Island, Saona Island and St. Croix. RMSE values in both the 0 to 5 m and 5 to 10 m groups are similar across most of the sites. Overall, our method offered the most accurate depth estimations for waters shallower than 10 m.
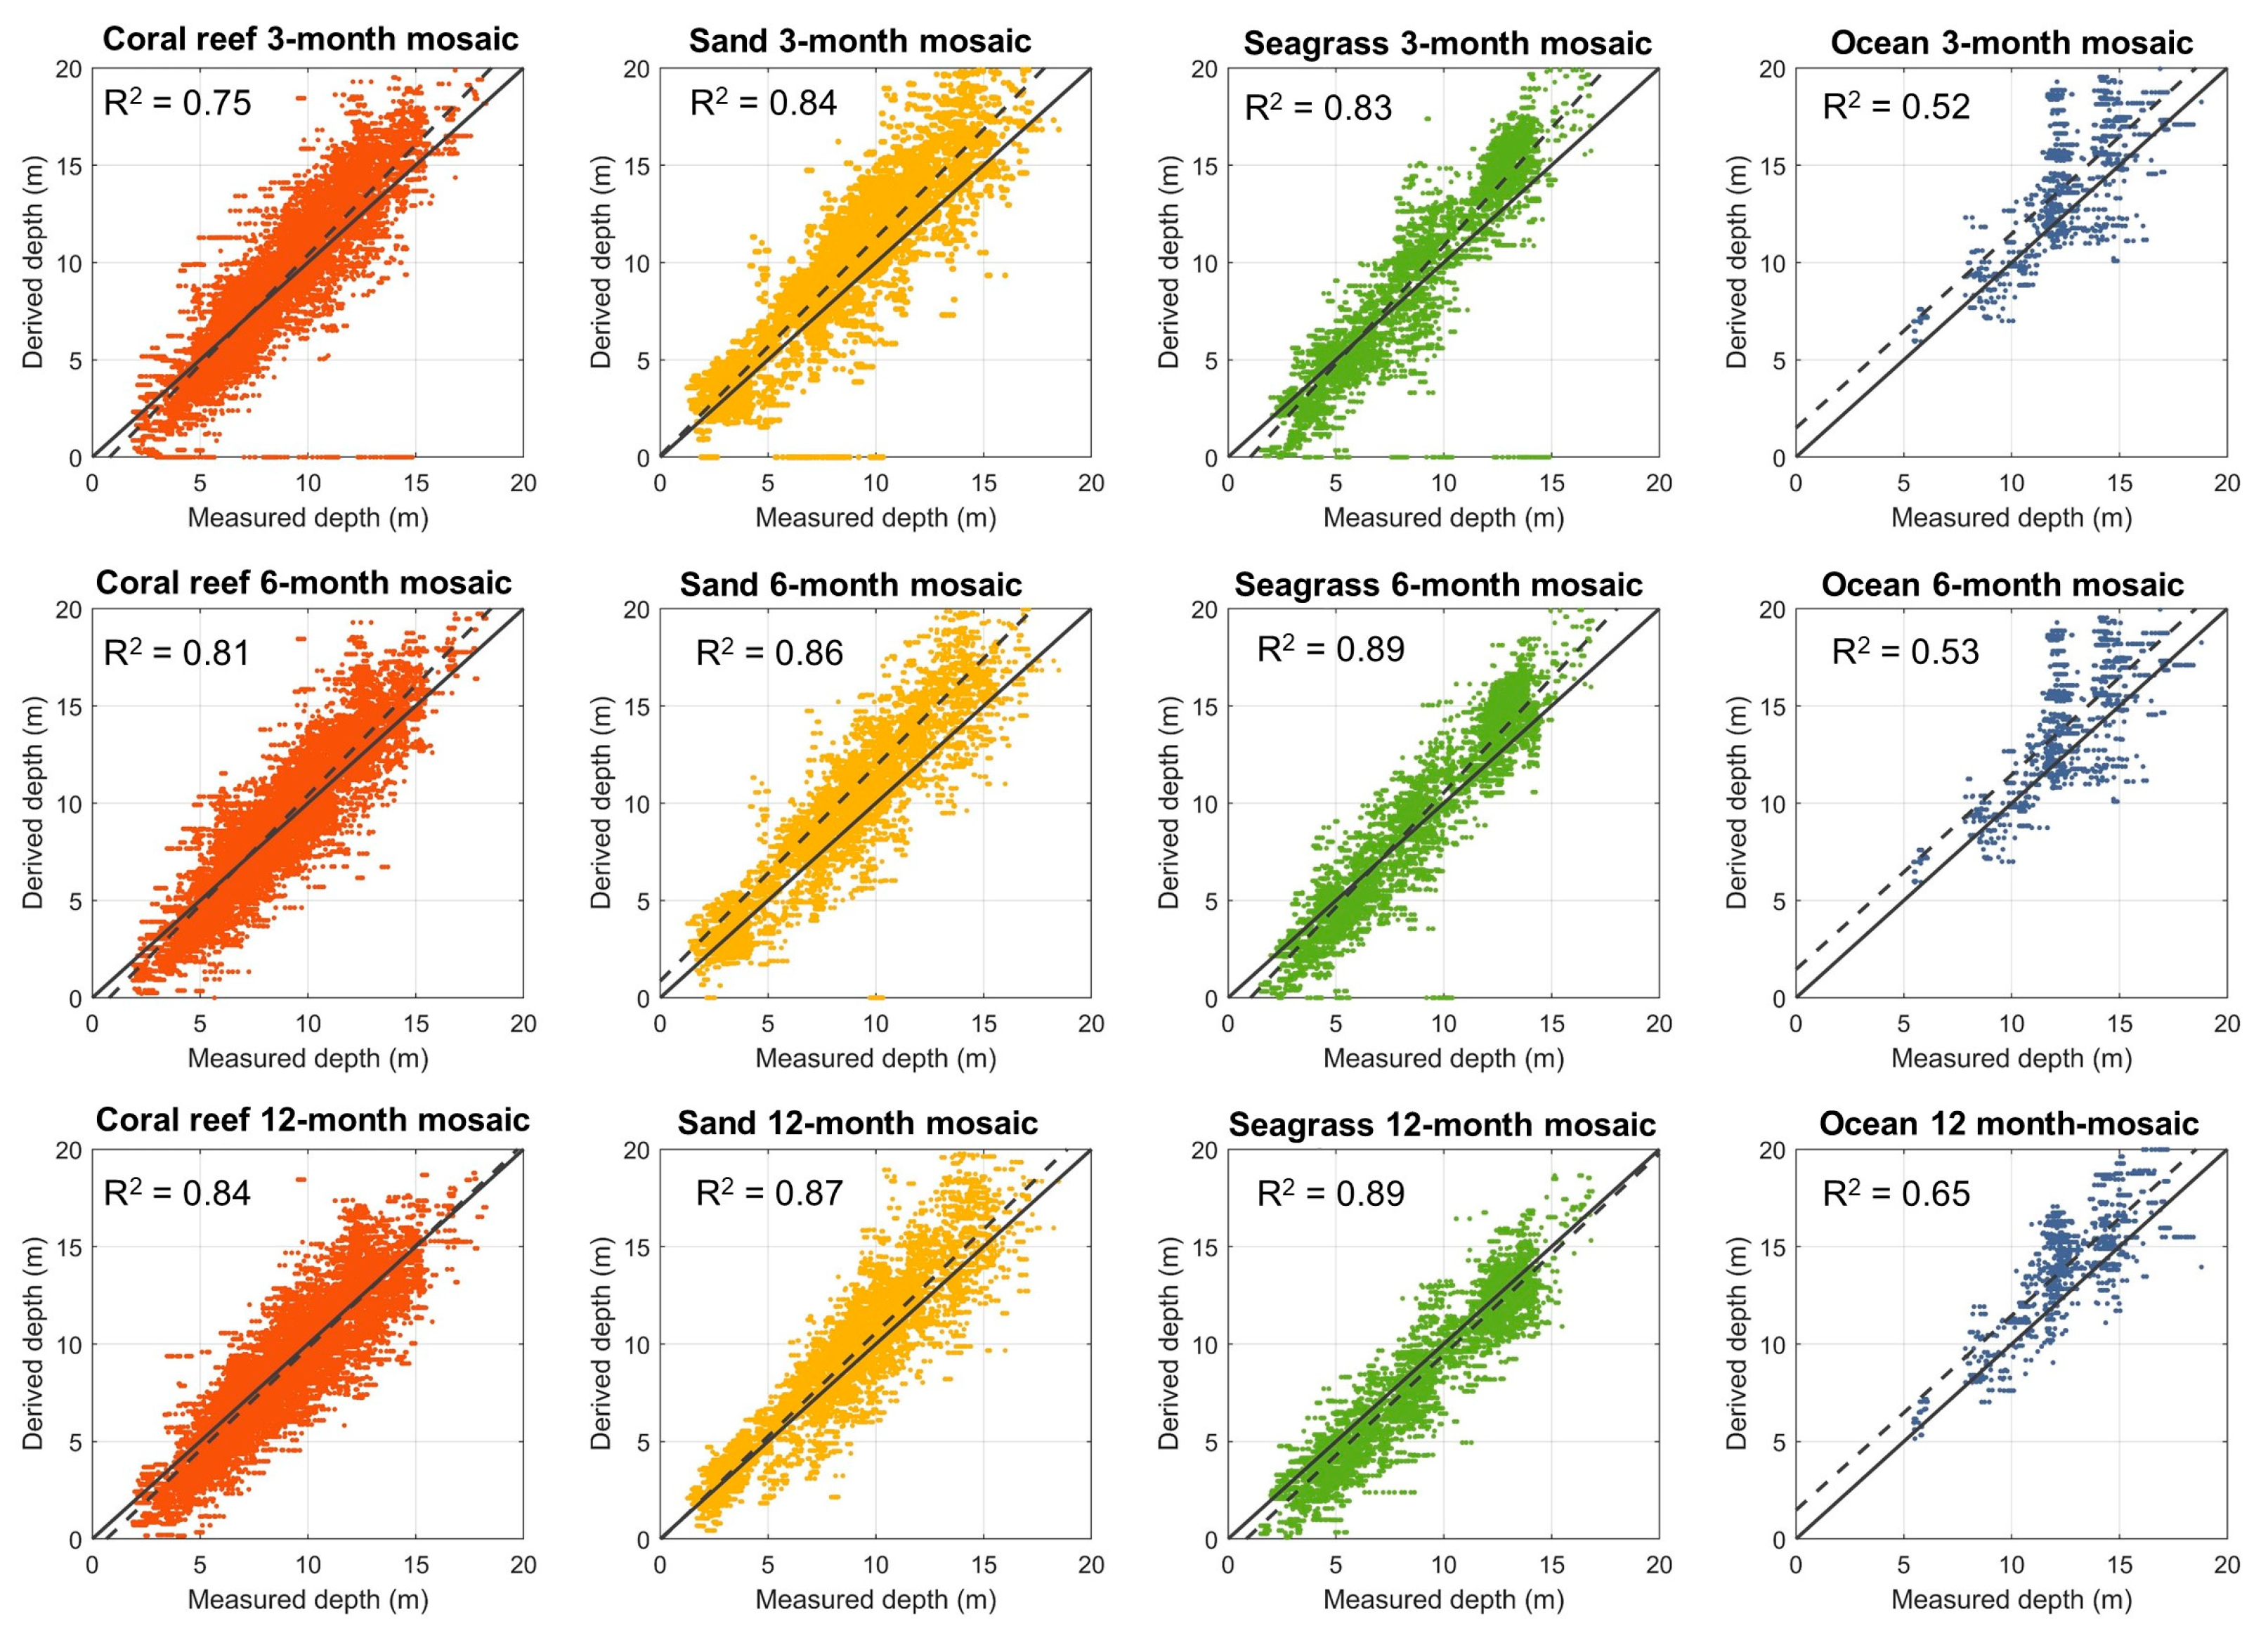
Multiple benthic habitats at the study sites allowed us to further analyze algorithm performance by combining mosaic time range and bottom reflectance types (Figure 10). In St. Croix, USVI and the Dominican Republic, we compared different mosaic derived depths with field measured data according to different benthic types (coral reef, sand, seagrass, and ocean). Sand and seagrass showed stronger correlations between satellite and field data compared to other benthic habitats. Ocean points had the lowest correlated pattern of all benthic types. Additionally, increasing the mosaic time range from three to twelve months clearly resulted in more accurate depth points for coral reef, sand, and seagrass benthic types, based on a comparison of results to the 1:1 line. In the 12-month mosaics, we found the trend line of coral reef, sand, and seagrass followed the 1:1 line more accurately than the three-month and six-month mosaic. Increasing mosaic time ranges showed the lowest improvement in ocean points than in coral reef, sand and seagrass.

4. Discussion

Today, open available global bathymetry datasets (e.g., GEBCO’s gridded bathymetric data set) are often designed for the deep ocean and have coarse spatial resolutions. In this study, we developed an automatic bathymetric mapping approach for shallow water in coastal and offshore marine environments at the global scale using Sentinel-2 satellite images (10 m resolution). In particular, our method can efficiently derive water bathymetry in high biodiversity benthic habitats (i.e., coral reefs). Our approach is based on a new clean-water mosaic built in GEE, which allowed us to directly use the process-ready Sentinel-2 surface reflectance datasets in GEE [44]. Although GEE’s Sentinel-2 reflectance datasets are mostly designed for land application, we demonstrated the novel application of Sentinel-2 to water-color studies by filtering out clouds, cloud shadow, break waves, and high-turbidity waters. We largely reduced the uncertainties from atmospheric correction for turbid waters, cloud shadow, and waves [45,46]. Once these errors were removed, we aggregated selected pixels into a single clean-water mosaic. Therefore, our method is suitable for the sites where the bottom is visible in the satellite images during a year. As demonstrated by the resulting clean surface reflectance mosaics (Figure 3) and accurate reflectance spectral data for benthic targets (Figure 4), our GEE clean-water mosaic provided reliable Sentinel-2 imagery for bathymetric modeling. All processing was conducted in the GEE platform which took advantage of powerful cloud computation capabilities [47].
Our clean-water mosaic using Sentinel-2 provides a reliable method for creating highly detailed information in multiple types of coastal environment studies, including bathymetry to support mapping and monitoring of coastal benthic habitats (coral reef, seagrass, and algae cover), marine transportation navigation, and physical modeling of waves and flooding [4,19,20,23,24,32,48,49,50,51,52,53]. The amount of time incorporated into the mosaics determined the image quality since a longer time period allows more clean-water pixels to enter the aggregation process. Therefore, 12-month mosaics showed the highest quality, especially near the coastline (wave- and bubble- enriched regions) and ocean (high cloud/cloud shadow regions) which offered the best bathymetry results [54,55,56]. However, three-month mosaics provided reasonable reflectance values and can be usefully applied to seasonal coastal environmental monitoring, such as tracking benthic habitat seasonal changes [57,58,59].
We generated bathymetry through a tailored clean water bathymetric estimation algorithm. In previous studies, the dynamics of water column attenuation have posed a challenge in bathymetry estimation. Thus, previous bathymetric algorithms have relied on field calibration or complex physical modeling to simulate a broad range of water conditions [19,51,60]. However, these methods are not sufficient to overcome the dynamics of water column attenuation at a global scale. Our new algorithm is applied to a clean-water mosaic and was therefore developed for low-attenuation waters. We used a large number of field depth measurements (113,520) to validate our approach across a wide range of geographic locations and benthic habitat types. The field sampling points are in low latitude regions in which the benthic geomorphology showed distinct variations in shallow depth (i.e., from lagoon to reef crest). Therefore, the bathymetry variations can be validated in a diverse range of geomorphology. The high accuracy (RMSE ranges from 1.26 to 1.92 m) of our automatic method demonstrated that the fixed water attenuation condition index (Chl-a values related m 0 and m 1 ) is sufficient to generate bathymetry.
We evaluated the performance of our approach under different depth and bottom reflectance conditions to uncover strengths and weaknesses. Generally, our approach works best in shallow to moderate water depths (0 to 15 m). Our algorithm was designed based on the quantification of water attenuation differences between blue and green bands [25]. In the same water condition, high water attenuation in deep water (depth > 15 m) had weaker differences than shallow water (depth < 10 m) [23]. Users could easily tailor our approach for specific applications to further reduce uncertainty or constrain the estimation bounds. For example, this could include adjacency correction of depth values, or additional pixel masking during mosaic generation to exclude pixels with a low noise equivalent difference in reflectance [23,31]. Different benthic habitats have different strengths of bottom reflectance [24,59].

5. Conclusions

We developed an automated bathymetric mapping method using the Sentinel-2 surface reflectance dataset in Google Earth Engine. A new clean water mosaic creation method and a tailored bathymetry estimation algorithm were designed. We tested our method in six diverse globally distributed sites with abundant field bathymetry sampling points. Our automatic and efficient method could be applied to map shallow water bathymetry at a global scale.

Author Contributions

Conceptualization, J.L. and G.P.A.; methodology, J.L., D.E.K., M.L.; validation, J.L., C.R., S.P. and S.R.S.; formal analysis, J.L., D.E.K., and G.P.A.; writing—original draft preparation, J.L. and G.P.A.; writing—review and editing, J.L., D.E.K., M.L., C.R., S.R.S. and G.P.A.; funding acquisition, G.P.A. All authors have read and agreed to the published version of the manuscript.

Funding

This study was supported by Paul G. Allen’s Vulcan Inc. under contract to Arizona State University.

Data Availability Statement

The global bathymetry maps of shallow coral reefs regions are openly available through the Allen Coral Atlas (https://allencoralatlas.org/; accessed on 1 January 2021). The code for Google Earth Engine framework is accessible online (github.com/CoralMapping/GEE_Sentinel2_Bathymetry_Paper; accessed on 1 January 2021).

Conflicts of Interest

The authors declare no conflict of interest.

References

  1. Kutser, T.; Miller, I.; Jupp, D.L. Mapping Coral Reef Benthic Substrates Using Hyperspectral Space-Borne Images and Spectral Libraries. Estuar. Coast. Shelf Sci. 2006, 70, 449–460. [Google Scholar] [CrossRef]
  2. Lyons, M.B.; Roelfsema, C.M.; Kennedy, E.V.; Kovacs, E.M.; Borrego-Acevedo, R.; Markey, K.; Roe, M.; Yuwono, D.M.; Harris, D.L.; Phinn, S.R.; et al. Mapping the World’s Coral Reefs Using a Global Multiscale Earth Observation Framework. Remote Sens. Ecol. Conserv. 2020. [Google Scholar] [CrossRef] [Green Version]
  3. Moberg, F.; Folke, C. Ecological Goods and Services of Coral Reef Ecosystems. Ecol. Econ. 1999, 29, 215–233. [Google Scholar] [CrossRef]
  4. Purkis, S.J. Remote Sensing Tropical Coral Reefs: The View from Above. Annu. Rev. Mar. Sci. 2018, 10, 149–168. [Google Scholar] [CrossRef] [PubMed]
  5. Roelfsema, C.; Kovacs, E.; Ortiz, J.C.; Wolff, N.H.; Callaghan, D.; Wettle, M.; Ronan, M.; Hamylton, S.M.; Mumby, P.J.; Phinn, S. Coral Reef Habitat Mapping: A Combination of Object-Based Image Analysis and Ecological Modelling. Remote Sens. Environ. 2018, 208, 27–41. [Google Scholar] [CrossRef]
  6. Asner, G.P.; Martin, R.E.; Mascaro, J. Coral Reef Atoll Assessment in the South China Sea Using Planet Dove Satellites. Remote Sens. Ecol. Conserv. 2017, 3, 57–65. [Google Scholar] [CrossRef]
  7. Barbier, E.B.; Koch, E.W.; Silliman, B.R.; Hacker, S.D.; Wolanski, E.; Primavera, J.; Granek, E.F.; Polasky, S.; Aswani, S.; Cramer, L.A. Coastal Ecosystem-Based Management with Nonlinear Ecological Functions and Values. Science 2008, 319, 321–323. [Google Scholar] [CrossRef] [PubMed]
  8. Bruckner, A.W. Life-Saving Products from Coral Reefs. Issues Sci. Technol. 2002, 18, 39–44. [Google Scholar]
  9. Carr, M.H.; Anderson, T.W.; Hixon, M.A. Biodiversity, Population Regulation, and the Stability of Coral-Reef Fish Communities. Proc. Natl. Acad. Sci. USA 2002, 99, 11241–11245. [Google Scholar] [CrossRef] [PubMed] [Green Version]
  10. Gove, J.M.; Whitney, J.L.; McManus, M.A.; Lecky, J.; Carvalho, F.C.; Lynch, J.M.; Li, J.; Neubauer, P.; Smith, K.A.; Phipps, J.E. Prey-Size Plastics Are Invading Larval Fish Nurseries. Proc. Natl. Acad. Sci. USA 2019, 116, 24143–24149. [Google Scholar] [CrossRef] [Green Version]
  11. Li, J.; Schill, S.R.; Knapp, D.E.; Asner, G.P. Object-Based Mapping of Coral Reef Habitats Using Planet Dove Satellites. Remote Sens. 2019, 11, 1445. [Google Scholar] [CrossRef] [Green Version]
  12. Pendleton, L.; Donato, D.C.; Murray, B.C.; Crooks, S.; Jenkins, W.A.; Sifleet, S.; Craft, C.; Fourqurean, J.W.; Kauffman, J.B.; Marbà, N. Estimating Global “Blue Carbon” Emissions from Conversion and Degradation of Vegetated Coastal Ecosystems. PLoS ONE 2012, 7, e43542. [Google Scholar] [CrossRef] [Green Version]
  13. Roelfsema, C.; Kovacs, E.; Roos, P.; Terzano, D.; Lyons, M.; Phinn, S. Use of a Semi-Automated Object Based Analysis to Map Benthic Composition, Heron Reef, Southern Great Barrier Reef. Remote Sens. Lett. 2018, 9, 324–333. [Google Scholar] [CrossRef]
  14. Schill, S.R.; Knowles, J.E.; Rowlands, G.; Margles, S.; Agostini, V.; Blyther, R. Coastal Benthic Habitat Mapping to Support Marine Resource Planning and Management in St. Kitts and Nevis. Geogr. Compass 2011, 5, 898–917. [Google Scholar] [CrossRef]
  15. Wilson, M.A.; Farber, S. Accounting for Ecosystem Goods and Services in Coastal Estuaries. Econ. Mark. Value Coasts Estuaries Whats Stake 2008, 13–32. [Google Scholar]
  16. Carlson, R.R.; Foo, S.A.; Asner, G.P. Land Use Impacts on Coral Reef Health: A Ridge-to-Reef Perspective. Front. Mar. Sci. 2019, 6, 562. [Google Scholar] [CrossRef]
  17. Foo, S.A.; Asner, G.P. Scaling Up Coral Reef Restoration Using Remote Sensing Technology. Front. Mar. Sci. 2019, 6, 79. [Google Scholar]
  18. Kutser, T.; Hedley, J.; Giardino, C.; Roelfsema, C.; Brando, V.E. Remote Sensing of Shallow Waters–A 50 Year Retrospective and Future Directions. Remote Sens. Environ. 2020, 240, 111619. [Google Scholar] [CrossRef]
  19. Stumpf, R.P.; Holderied, K.; Sinclair, M. Determination of Water Depth with High-resolution Satellite Imagery over Variable Bottom Types. Limnol. Oceanogr. 2003, 48, 547–556. [Google Scholar] [CrossRef]
  20. Lyzenga, D.R.; Malinas, N.P.; Tanis, F.J. Multispectral Bathymetry Using a Simple Physically Based Algorithm. IEEE Trans. Geosci. Remote Sens. 2006, 44, 2251–2259. [Google Scholar] [CrossRef]
  21. Zhao, J.; Barnes, B.; Melo, N.; English, D.; Lapointe, B.; Muller-Karger, F.; Schaeffer, B.; Hu, C. Assessment of Satellite-Derived Diffuse Attenuation Coefficients and Euphotic Depths in South Florida Coastal Waters. Remote Sens. Environ. 2013, 131, 38–50. [Google Scholar] [CrossRef]
  22. Traganos, D.; Poursanidis, D.; Aggarwal, B.; Chrysoulakis, N.; Reinartz, P. Estimating Satellite-Derived Bathymetry (SDB) with the Google Earth Engine and Sentinel-2. Remote Sens. 2018, 10, 859. [Google Scholar] [CrossRef] [Green Version]
  23. Brando, V.E.; Anstee, J.M.; Wettle, M.; Dekker, A.G.; Phinn, S.R.; Roelfsema, C. A Physics Based Retrieval and Quality Assessment of Bathymetry from Suboptimal Hyperspectral Data. Remote Sens. Environ. 2009, 113, 755–770. [Google Scholar] [CrossRef]
  24. Hedley, J.D.; Roelfsema, C.; Brando, V.; Giardino, C.; Kutser, T.; Phinn, S.; Mumby, P.J.; Barrilero, O.; Laporte, J.; Koetz, B. Coral Reef Applications of Sentinel-2: Coverage, Characteristics, Bathymetry and Benthic Mapping with Comparison to Landsat 8. Remote Sens. Environ. 2018, 216, 598–614. [Google Scholar] [CrossRef]
  25. Li, J.; Knapp, D.E.; Schill, S.R.; Roelfsema, C.; Phinn, S.; Silman, M.; Mascaro, J.; Asner, G.P. Adaptive Bathymetry Estimation for Shallow Coastal Waters Using Planet Dove Satellites. Remote Sens. Environ. 2019, 232, 111302. [Google Scholar] [CrossRef]
  26. Wei, J.; Wang, M.; Lee, Z.; Briceño, H.O.; Yu, X.; Jiang, L.; Garcia, R.; Wang, J.; Luis, K. Shallow Water Bathymetry with Multi-Spectral Satellite Ocean Color Sensors: Leveraging Temporal Variation in Image Data. Remote Sens. Environ. 2020, 250, 112035. [Google Scholar] [CrossRef]
  27. Balsamo, G.; Dutra, E.; Stepanenko, V.M.; Viterbo, P.; Miranda, P.; Mironov, D. Deriving an Effective Lake Depth from Satellite Lake Surface Temperature Data: A Feasibility Study with MODIS Data; ECMWF: Reading, UK, 2010. [Google Scholar]
  28. Barale, V.; Jaquet, J.-M.; Ndiaye, M. Algal Blooming Patterns and Anomalies in the Mediterranean Sea as Derived from the SeaWiFS Data Set (1998–2003). Remote Sens. Environ. 2008, 112, 3300–3313. [Google Scholar] [CrossRef]
  29. Hlaing, S.; Harmel, T.; Gilerson, A.; Foster, R.; Weidemann, A.; Arnone, R.; Wang, M.; Ahmed, S. Evaluation of the VIIRS Ocean Color Monitoring Performance in Coastal Regions. Remote Sens. Environ. 2013, 139, 398–414. [Google Scholar] [CrossRef]
  30. Tedesco, M.; Steiner, N. In-Situ Multispectral and Bathymetric Measurements over a Supraglacial Lake in Western Greenland Using a Remotely Controlled Watercraft. Cryosphere 2011, 5, 445–452. [Google Scholar] [CrossRef] [Green Version]
  31. Dekker, A.G.; Phinn, S.R.; Anstee, J.; Bissett, P.; Brando, V.E.; Casey, B.; Fearns, P.; Hedley, J.; Klonowski, W.; Lee, Z.P. Intercomparison of Shallow Water Bathymetry, Hydro-optics, and Benthos Mapping Techniques in Australian and Caribbean Coastal Environments. Limnol. Oceanogr. Methods 2011, 9, 396–425. [Google Scholar] [CrossRef] [Green Version]
  32. Kerr, J.M.; Purkis, S. An Algorithm for Optically-Deriving Water Depth from Multispectral Imagery in Coral Reef Landscapes in the Absence of Ground-Truth Data. Remote Sens. Environ. 2018, 210, 307–324. [Google Scholar] [CrossRef]
  33. Klonowski, W.M.; Fearns, P.R.; Lynch, M.J. Retrieving Key Benthic Cover Types and Bathymetry from Hyperspectral Imagery. J. Appl. Remote Sens. 2007, 1, 011505. [Google Scholar] [CrossRef]
  34. Li, J.; Yu, Q.; Tian, Y.Q.; Becker, B.L.; Siqueira, P.; Torbick, N. Spatio-Temporal Variations of CDOM in Shallow Inland Waters from a Semi-Analytical Inversion of Landsat-8. Remote Sens. Environ. 2018, 218, 189–200. [Google Scholar] [CrossRef]
  35. Albright, A.; Glennie, C. Nearshore Bathymetry From Fusion of Sentinel-2 and ICESat-2 Observations. IEEE Geosci. Remote Sens. Lett. 2020. [Google Scholar] [CrossRef]
  36. Parrish, C.E.; Magruder, L.A.; Neuenschwander, A.L.; Forfinski-Sarkozi, N.; Alonzo, M.; Jasinski, M. Validation of ICESat-2 ATLAS Bathymetry and Analysis of ATLAS’s Bathymetric Mapping Performance. Remote Sens. 2019, 11, 1634. [Google Scholar] [CrossRef] [Green Version]
  37. Hamylton, S.; Hedley, J.; Beaman, R. Derivation of High-Resolution Bathymetry from Multispectral Satellite Imagery: A Comparison of Empirical and Optimisation Methods through Geographical Error Analysis. Remote Sens. 2015, 7, 16257–16273. [Google Scholar] [CrossRef] [Green Version]
  38. Lee, Z.; Weidemann, A.; Arnone, R. Combined Effect of Reduced Band Number and Increased Bandwidth on Shallow Water Remote Sensing: The Case of Worldview 2. IEEE Trans. Geosci. Remote Sens. 2013, 51, 2577–2586. [Google Scholar] [CrossRef]
  39. Hansen, M.C.; Potapov, P.V.; Moore, R.; Hancher, M.; Turubanova, S.A.; Tyukavina, A.; Thau, D.; Stehman, S.V.; Goetz, S.J.; Loveland, T.R. High-Resolution Global Maps of 21st-Century Forest Cover Change. Science 2013, 342, 850–853. [Google Scholar] [CrossRef] [PubMed] [Green Version]
  40. Hird, J.N.; DeLancey, E.R.; McDermid, G.J.; Kariyeva, J. Google Earth Engine, Open-Access Satellite Data, and Machine Learning in Support of Large-Area Probabilistic Wetland Mapping. Remote Sens. 2017, 9, 1315. [Google Scholar] [CrossRef] [Green Version]
  41. Liu, X.; Hu, G.; Chen, Y.; Li, X.; Xu, X.; Li, S.; Pei, F.; Wang, S. High-Resolution Multi-Temporal Mapping of Global Urban Land Using Landsat Images Based on the Google Earth Engine Platform. Remote Sens. Environ. 2018, 209, 227–239. [Google Scholar] [CrossRef]
  42. Pekel, J.-F.; Cottam, A.; Gorelick, N.; Belward, A.S. High-Resolution Mapping of Global Surface Water and Its Long-Term Changes. Nature 2016, 540, 418–422. [Google Scholar] [CrossRef]
  43. Shelestov, A.; Lavreniuk, M.; Kussul, N.; Novikov, A.; Skakun, S. Exploring Google Earth Engine Platform for Big Data Processing: Classification of Multi-Temporal Satellite Imagery for Crop Mapping. Front. Earth Sci. 2017, 5, 17. [Google Scholar] [CrossRef] [Green Version]
  44. Gorelick, N.; Hancher, M.; Dixon, M.; Ilyushchenko, S.; Thau, D.; Moore, R. Google Earth Engine: Planetary-Scale Geospatial Analysis for Everyone. Remote Sens. Environ. 2017, 202, 18–27. [Google Scholar] [CrossRef]
  45. Vanhellemont, Q. Daily Metre-Scale Mapping of Water Turbidity Using CubeSat Imagery. Opt. Express 2019, 27, A1372–A1399. [Google Scholar] [CrossRef] [PubMed]
  46. Vanhellemont, Q.; Ruddick, K. Turbid Wakes Associated with Offshore Wind Turbines Observed with Landsat 8. Remote Sens. Environ. 2014, 145, 105–115. [Google Scholar] [CrossRef] [Green Version]
  47. Parente, L.; Taquary, E.; Silva, A.P.; Souza, C.; Ferreira, L. Next Generation Mapping: Combining Deep Learning, Cloud Computing, and Big Remote Sensing Data. Remote Sens. 2019, 11, 2881. [Google Scholar] [CrossRef] [Green Version]
  48. Asner, G.P.; Vaughn, N.R.; Balzotti, C.; Brodrick, P.G.; Heckler, J. High-Resolution Reef Bathymetry and Coral Habitat Complexity from Airborne Imaging Spectroscopy. Remote Sens. 2020, 12, 310. [Google Scholar] [CrossRef] [Green Version]
  49. Barnard, P.L.; van Ormondt, M.; Erikson, L.H.; Eshleman, J.; Hapke, C.; Ruggiero, P.; Adams, P.N.; Foxgrover, A.C. Development of the Coastal Storm Modeling System (CoSMoS) for Predicting the Impact of Storms on High-Energy, Active-Margin Coasts. Nat. Hazards 2014, 74, 1095–1125. [Google Scholar] [CrossRef]
  50. Caballero, I.; Steinmetz, F.; Navarro, G. Evaluation of the First Year of Operational Sentinel-2A Data for Retrieval of Suspended Solids in Medium-to High-Turbidity Waters. Remote Sens. 2018, 10, 982. [Google Scholar] [CrossRef] [Green Version]
  51. Eugenio, F.; Marcello, J.; Martin, J. High-Resolution Maps of Bathymetry and Benthic Habitats in Shallow-Water Environments Using Multispectral Remote Sensing Imagery. IEEE Trans. Geosci. Remote Sens. 2015, 53, 3539–3549. [Google Scholar] [CrossRef]
  52. Hedley, J.; Roelfsema, C.; Chollett, I.; Harborne, A.; Heron, S.; Weeks, S.; Skirving, W.; Strong, A.; Eakin, C.; Christensen, T. Remote Sensing of Coral Reefs for Monitoring and Management: A Review. Remote Sens. 2016, 8, 118. [Google Scholar] [CrossRef] [Green Version]
  53. Thompson, D.R.; Hochberg, E.J.; Asner, G.P.; Green, R.O.; Knapp, D.E.; Gao, B.-C.; Garcia, R.; Gierach, M.; Lee, Z.; Maritorena, S. Airborne Mapping of Benthic Reflectance Spectra with Bayesian Linear Mixtures. Remote Sens. Environ. 2017, 200, 18–30. [Google Scholar] [CrossRef]
  54. Holman, R.; Haller, M.C. Remote Sensing of the Nearshore. Annu. Rev. Mar. Sci. 2013, 5, 95–113. [Google Scholar] [CrossRef] [PubMed] [Green Version]
  55. Hwang, P.A. High-Wind Drag Coefficient and Whitecap Coverage Derived from Microwave Radiometer Observations in Tropical Cyclones. J. Phys. Oceanogr. 2018, 48, 2221–2232. [Google Scholar] [CrossRef]
  56. Mobley, C.D. Estimation of the Remote-Sensing Reflectance from above-Surface Measurements. Appl. Opt. 1999, 38, 7442–7455. [Google Scholar] [CrossRef]
  57. Coma, R.; Ribes, M.; Gili, J.-M.; Zabala, M. Seasonality in Coastal Benthic Ecosystems. Trends Ecol. Evol. 2000, 15, 448–453. [Google Scholar] [CrossRef]
  58. Li, J.; Fabina, N.S.; Knapp, D.E.; Asner, G.P. The Sensitivity of Multi-Spectral Satellite Sensors to Benthic Habitat Change. Remote Sens. 2020, 12, 532. [Google Scholar] [CrossRef] [Green Version]
  59. Reshitnyk, L.; Costa, M.; Robinson, C.; Dearden, P. Evaluation of WorldView-2 and Acoustic Remote Sensing for Mapping Benthic Habitats in Temperate Coastal Pacific Waters. Remote Sens. Environ. 2014, 153, 7–23. [Google Scholar] [CrossRef]
  60. Goodman, J.A.; Lay, M.; Ramirez, L.; Ustin, S.L.; Haverkamp, P.J. Confidence Levels, Sensitivity, and the Role of Bathymetry in Coral Reef Remote Sensing. Remote Sens. 2020, 12, 496. [Google Scholar] [CrossRef] [Green Version]
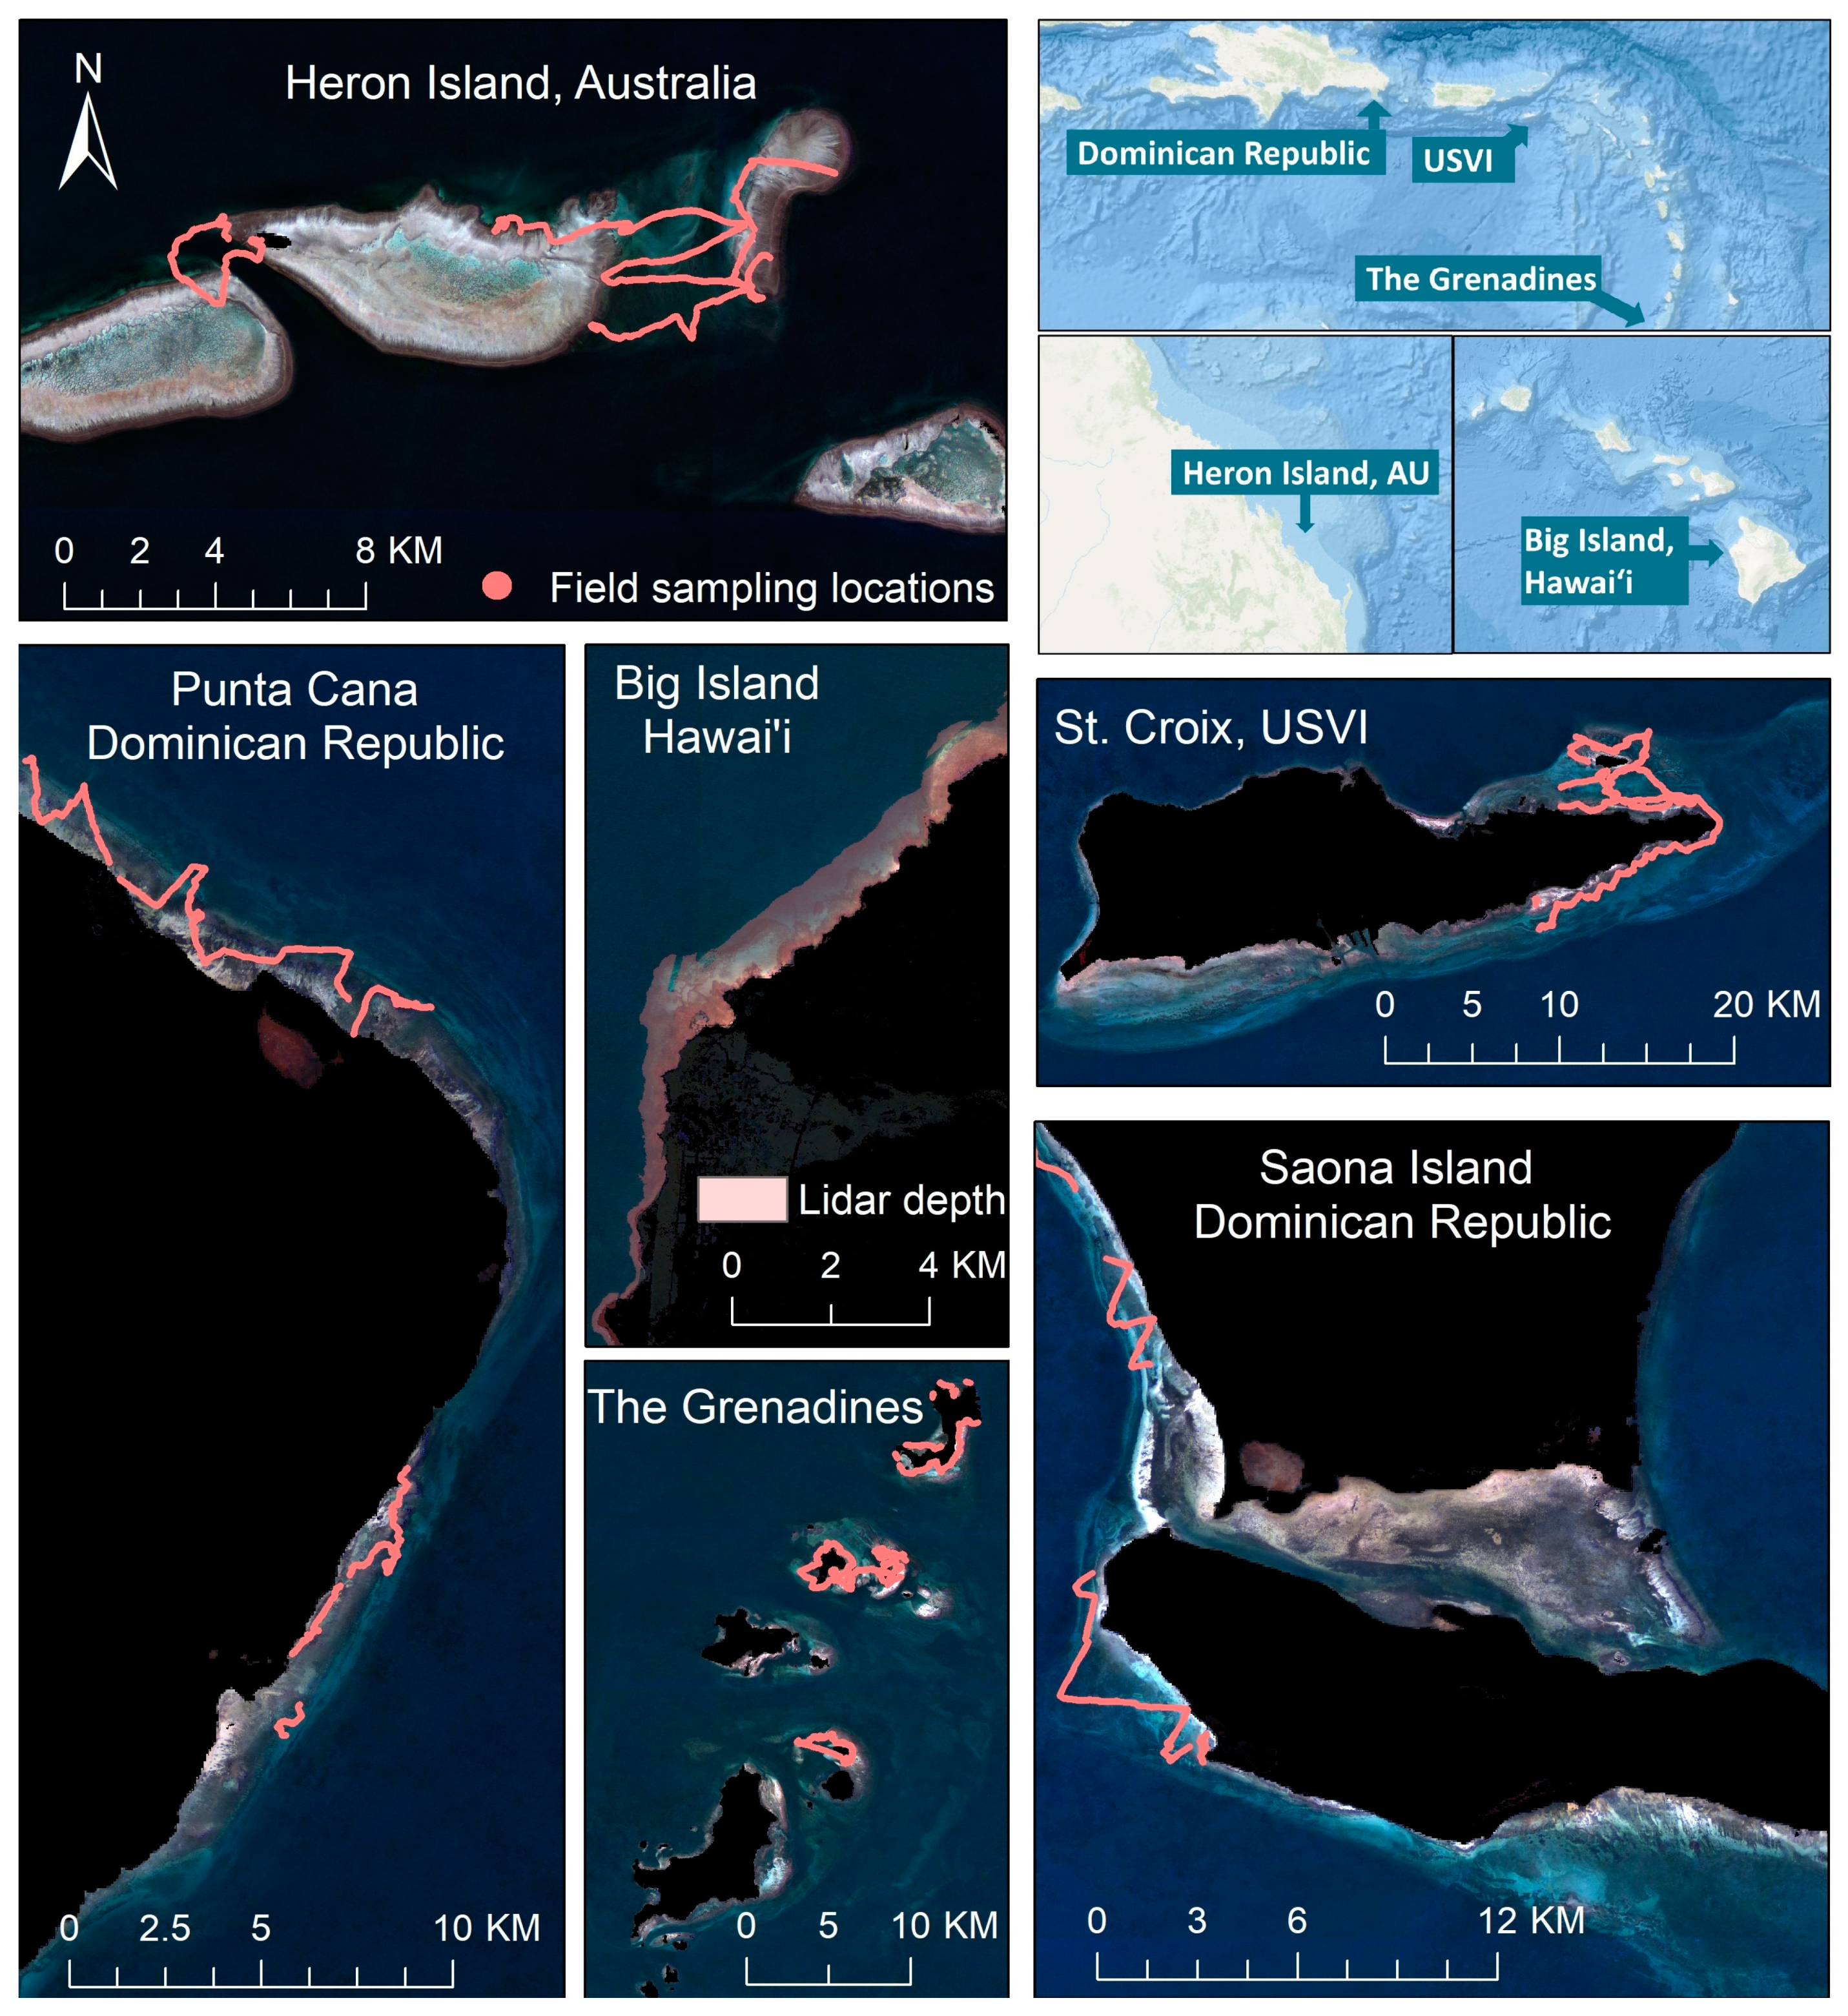
Figure 1. Sentinel-2 true color mosaics (i.e., 12-month mosaic) and field sample locations for the six study sites. We used lidar-derived bathymetry in the Big Island, Hawaiʻi (plotted in pink polygon). Other bathymetry samplings were measured at consecutive points.
Remotesensing 13 01469 g001
Figure 2. Google Earth Engine global bathymetry estimation diagram. Sentinel-2 satellite reflectance images were selected to build the clean water mosaic to derive bathymetry.
Remotesensing 13 01469 g002
Figure 3. Comparison of the surface reflectance mosaics created using different time ranges. The yellow color represents missing points where no reflectance pixels were selected in the time range to build the mosaic.
Remotesensing 13 01469 g003
Figure 4. Surface reflectance plots for different benthic habitats. The spectral shape and corresponding values represent the signal variations across different benthic targets and varying depths in the Sentinel-2 reflectance mosaic.
Remotesensing 13 01469 g004
Figure 5. Spatial variations of shallow bathymetry models within the six study sites created using 12-month mosaics. The bathymetry represents the spatial variation of the benthic geomorphology.
Remotesensing 13 01469 g005
Figure 6. Sentinel-2 bathymetric models based on different temporal mosaic composites. As the time frame selection is increased, the quality of the mosaic also increases, resulting in fewer data gaps and more accurate bathymetric models. The white color represents the missing points in the bathymetry results.
Remotesensing 13 01469 g006
Figure 7. Bathymetry estimation validations using the field measured depth sampling points.
Remotesensing 13 01469 g007
Figure 8. Comparisons between Google Earth Engine derived depth with field measured depth at St Croix, USVI, and Heron Island, Australia. The 12-month mosaic offered better bathymetry results than the three-month and six-month mosaics.
Remotesensing 13 01469 g008
Figure 9. Root mean square error (RMSE) comparisons across different depth ranges. Deep depth regions (>15 m) have higher RMSE than shallow depth regions.
Remotesensing 13 01469 g009
Figure 10. Results performance in coral reef, sand, seagrass and ocean in three different mosaic time frames. The trend line of 12-month mosaic followed the 1:1 line more accurately than the three-month and six-month mosaics.
Remotesensing 13 01469 g010
Table 1. Location of field sampling sites and the number of depth validation points.
Site NameLat / LonNo. of Depth Validation Points
Heron, Australia23.45 S / 151.96 E5100
Big Island, Hawaiʻi19.74 N / 156.06 W10,000
Saona Island, DR18.20 N / 68.69 W13,120
Punta Cana, DR18.60 N / 68.31 W37,400
St. Croix, USVI17.76 N / 64.57 W41,500
The Grenadines12.47 N / 61.45 W6400
Table 2. Validation comparisons between different mosaic date ranges. Bold values represented the best estimation results.
RMSE (m)Bias (m)MNBR2
Heron, AU12-month mosaic1.35−0.38−0.180.98
6-month mosaic1.98−0.96−0.160.95
3-month mosaic2.06−1.08−0.170.94
Big Island Hawaiʻi12-month mosaic1.980.300.030.85
6-month mosaic2.160.05−0.010.82
3-month mosaic2.160.04−0.010.82
Saona Island, DR12-month mosaic1.831.090.130.78
6-month mosaic2.221.260.150.68
3-month mosaic2.171.250.150.69
Punta Cana, DR12-month mosaic1.260.06−0.020.86
6-month mosaic1.56−0.20−0.100.78
3-month mosaic1.57−0.21−0.100.78
St. Croix, USVI12-month mosaic1.60−0.02−0.030.79
6-month mosaic2.080.810.070.64
3-month mosaic2.691.050.100.41
The Grenadines12-month mosaic1.92−0.83−0.150.81
6-month mosaic1.94−0.91−0.160.80
3-month mosaic2.01−1.19−0.210.79
Publisher’s Note: MDPI stays neutral with regard to jurisdictional claims in published maps and institutional affiliations.