Article

Image Enhancement Driven by Object Characteristics and Dense Feature Reuse Network for Ship Target Detection in Remote Sensing Imagery

1
Electronic Information School, Wuhan University, Wuhan 430072, China
2
Beijing System Design Institute of Electro-Mechanical Engineering, Beijing 100854, China
3
State Key Laboratory of Information Engineering in Surveying, Mapping and Remote Sensing, Wuhan University, Wuhan 430079, China
*
Author to whom correspondence should be addressed.
Remote Sens. 2021, 13(7), 1327; https://doi.org/10.3390/rs13071327
Submission received: 8 February 2021 / Revised: 20 March 2021 / Accepted: 23 March 2021 / Published: 31 March 2021
(This article belongs to the Section Remote Sensing Image Processing)

Abstract

:
As the application scenarios of remote sensing imagery (RSI) become richer, the task of ship detection from an overhead perspective is of great significance. Compared with traditional methods, the use of deep learning ideas has more prospects. However, the Convolutional Neural Network (CNN) has poor resistance to sample differences in detection tasks, and the huge differences in the image environment, background, and quality of RSIs affect the performance for target detection tasks; on the other hand, upsampling or pooling operations result in the loss of detailed information in the features, and the CNN with outstanding results are often accompanied by a high computation and a large amount of memory storage. Considering the characteristics of ship targets in RSIs, this study proposes a detection framework combining an image enhancement module with a dense feature reuse module: (1) drawing on the ideas of the generative adversarial network (GAN), we designed an image enhancement module driven by object characteristics, which improves the quality of the ship target in the images while augmenting the training set; (2) the intensive feature extraction module was designed to integrate low-level location information and high-level semantic information of different resolutions while minimizing the computation, which can improve the efficiency of feature reuse in the network; (3) we introduced the receptive field expansion module to obtain a wider range of deep semantic information and enhance the ability to extract features of targets were at different sizes. Experiments were carried out on two types of ship datasets, optical RSI and Synthetic Aperture Radar (SAR) images. The proposed framework was implemented on classic detection networks such as You Only Look Once (YOLO) and Mask-RCNN. The experimental results verify the effectiveness of the proposed method.

Graphical Abstract

1. Introduction

Object detection on remote sensing imagery has broad prospects in both military and civilian fields [1], and it plays a huge role in various scenarios, such as in the ocean, forestry [2], and transportation. Compared with natural imagery, remote sensing images obtained from satellite sensors have different viewing angles. They contain different complex landscapes and are usually more susceptible to atmospheric, background clutter, and lighting differences, having fewer spatial details [3]. In addition, the data size and area coverage of remote sensing images are also larger.
For ship target detection studies with remote sensing imagery (RSI), ship targets show unique target characteristics. According to the different imaging mechanism of satellite imagery, RSI can be roughly divided into two types of datasets, namely, optical datasets and SAR datasets. In the optical remote sensing dataset, it is usually difficult to directly detect small ship targets due to the poor image resolution, which requires a detector with high detection capacity and robustness of small targets. At the same time, the ship target characteristics under different image scenes are also considerably different. For example, the contrast between the foreground and background of a ship in a relatively dark environment is poor [4]; in the environment of dense waves, the detection of the ship is greatly disturbed by the wave wake. For the small target ship with a long wake, it is especially difficult to distinguish the positive sample from the wave wake; In an environment with dense clouds, the texture and clarity of the ship are also greatly disturbed. The detection of ships in the coastal environment is often susceptible to the influence of coastal bridges or shore buildings due to the similar characteristics of grayscale and texture between ships and targets at the wharf or shore; thus, the false alarm rate can easily increase.
Regarding SAR images, the distribution range of image resolution is relatively wider than that of optical datasets, involving ships with different resolutions from 1 to 15 m. The aspect ratio of ships is also relatively wide, ranging from 0.4 to 3 [5]. There are high requirements on the rotation invariance of the detector. When it comes to ship detection in near-shore environments, there is also the problem of interference from the wharf or shore buildings. Traditional detection methods need to divide the ocean and the land with the help of image texture or shape features to reduce the false alarm rate. On the other hand, due to the special imaging mechanism of the SAR image, which exhibits inherent speckle characteristics, the ship targets in the image are susceptible to this noise, and the detection accuracy is affected.
For ship target detection tasks from a satellite perspective, image quality is greatly interfered by satellite image sources, the weather, and background noise clutter. Moreover, ship samples obtained from the same sea area generally have scale imbalance and other problems. Therefore, identifying how the characteristics of ships on the sea surface should be taken advantage of, how multi-scale information for prediction should be utilized, and how the interference of other negative samples on the sea surface or land for detection should be reduced represents the main challenge of this task. In this paper, considering the characteristics of ship targets, a multi-module detection framework for remote sensing images is proposed to strengthen the characteristics of ship targets and to reuse the features of the targets through dense connection mode with a multi-scale receptive field expansion module in order to better detect ship targets of different sizes.

1.1. Related Work

There are mainly two kinds of deep learning-based object detection algorithms: multi-stage detectors, which are generally developed from the region-based CNN (RCNN) [6] model, and single-stage detectors that unify classification and regression end to end [7]. The most classic single-stage detectors are Single Shot MultiBox Detector (SSD) [8], YOLOV1ṽ3 [9,10,11] and RetinaNet [12]. Additionally RCNN [6], fast RCNN [13], and faster RCNN [14] are some of the most famous multi-stage detectors. Multi-stage detectors first determine the region of interests (ROIs) through selective search or the region proposal network (RPN) [14] and then traverse all the ROIs to adjust the position of the bounding box and predict the target category. In contrast, single-stage detectors remove the region proposal network and detect all possible positions through a set of pre-set size anchors. Therefore, single-stage detectors usually have a fast detection speed but low detection accuracy.
Lin et al. [15] proposed a top-down architecture with horizontal connections named the feature pyramid network (FPN). This structure effectively improves object detection performance by constructing multi-scale semantic feature maps, can better adapt to the detection task for small targets in remote sensing images, and has been widely used in multi-stage detection networks. Liu et al. [16] researched the structure of receptive fields (RFs) in human vision and proposed the RFB-Net. By integrating the proposed receptive field block (RFB) module into the head of the SSD network, the detector takes the size and the eccentricity of RFs into consideration, increasing the feature expression ability and robustness.
In order to detect small objects more accurately, many algorithms have been developed. Feature Fusion Single Shot Multibox Detector (FSSD) [17] includes the FPN structure on the basis of SSD and concatenates the multi-scale feature maps from different layers together; then, it generates a feature pyramid on the fusion feature. In addition, Zhu et al. [18] designed a single-shot target detector (ScratchDet) that was trained from scratch. They added batch normalization (BN) layers to both the backbone and the head of the detector to make the network easier to converge, and the root block was designed to eliminate the adverse effects of multiple downsampling operations on small target detection. RefineDet [19] is another single-shot detection network, which mainly consists of three parts: an anchor refinement module (ARM), an object detection module (ODM), and a transfer connection block (TCB). It introduces the coarse-to-fine regression idea in multi-stage object detection, first generating refined anchor boxes through the ARM and then performing regression on the refined anchor boxes in the ODM.
All of the aforementioned work was performed for natural images. An increasing number of CNN-based object detectors have been proposed for remote sensing imagery to detect ships [20], planes [21], vehicles [22,23,24], and other small objects. A CNN was introduced in R3-Net [23] to detect multi-oriented vehicles from satellite imagery. Yang et al. [20] proposed a rotating dense feature pyramid network (R-DFPN), which uses the rotated anchor with improved Faster RCNN to detect small targets in remote sensing images. In order to reduce false positives and improve the recall rate, Tang et al. [25] used a cascade boosting classifier to mine hard negative examples and used a hyper-regional proposal network to verify candidate regions. Furthermore, Ren et al. [26] proposed a modified RPN and utilized context information in the network. To solve the limitation of the lack of remote sensing image data, researchers proposed an end-to-end detection method based on transfer learning [21]. The large image is divided into smaller blocks to detect the target separately, and then the results are mapped to the original image so as to eliminate the neural network input size restrictions. In [27], the author used sliding window technology and optimized convolutional neural networks to detect oil palm trees in high-resolution remote sensing images. At the same time, there are some articles showing a comprehensive review of object detection [28,29]. They summarize the general paradigm of detection algorithms and explain the advantages and disadvantages of different algorithms according to different application scenarios.

1.2. Problem Description and Motivations

Unlike mainstream optical natural image object detection, the object detection task for RSIs is more affected by the imagery characteristics of the imagery itself, which leads to the poor detection effect caused by directly using the existing large complex network. The difficulties and challenges in the object detection task for RSIs are mainly reflected in the following aspects:
(1)
Under different sea conditions and backgrounds, the color, texture, and noise distribution information of images vary greatly. Common deep learning networks have poor resistance to datasets, which means that small pixel differences between images may lead to drastic changes in detection results. On the other hand, for SAR images, the gray value of pixels (intensity or amplitude) is related to the radar cross-section of ground objects, including the radar irradiation angle, object geometry, material, and other factors. In practice, the reflectivity of target radar is easily interfered with by the complex background, meaning that the target is easily submerged in the background noise.
(2)
Due to the complexity of the background texture information of RSIs and the influence of various environmental factors on the feature expression of ships, the ability of the CNN to extract the geometric shape and texture information of ships is weakened, and it is difficult to distinguish between ships and shore false-alarm targets. The CNN with outstanding results is often accompanied by a high computation and a large amount memory storage, and the feature vectors of the high-level output lose a lot of spatial location information required by detection tasks due to multiple pooling or sampling.
(3)
Ship targets on the sea have the problem of unbalanced scales. In the same scene, larger warships and smaller fishing boats may exist at the same time. The detection effect of multi-scale targets in a general single-scale network is not ideal, which often makes the detection accuracy for small target objects very low.
In recent years, due to the development of deep learning technology, automated image processing technologies have emerged in an endless stream. Some image enhancement algorithms based on neural networks have been proposed. These methods, unlike traditional methods that require multiple manual adjustments to obtain the best results, are more efficient and robust and can adapt to a variety of image categories. The generative adversarial network (GAN) [30] is often used to generate sample images with different styles and texture characteristics as a complement to the original dataset. Compared with the traditional methods of data augmentation, which include rotation, random cropping, grayscale exposure, and Gaussian blur, generating images with enhanced details for the dataset based on the GAN can further improve the richness of the dataset and improve the generalization ability of the model.
On the other hand, the disappearing gradients and overfitting cause the more complex models to not necessarily obtain better results. Therefore, it is necessary to rationally design the network structure so that the CNN can make full use of the information of multi-scale; improve the feature reuse rate; and fully improve the performance of the CNN. For different scenarios, designing different convolutional structures to improve the generalization ability and robustness of the model is the basis of target detection as a pre-task for other projects. This research explores the efficient convolution structure in the CNN to verify the effect of structural improvement on its detection ability.

1.3. Contributions and Structure

Regarding these problems, this paper proposes an RSI ship target detection framework, First, based on the scattering matrix and coherent matrix, high-dimensional polarized features of PolSAR data were extracted and color-coded according to different decomposition methods. Then, inspired by transfer learning, the synthesized multi-color maps were fed into the Multiple-parallel Full Convolution Network (MFCN) model, which was pre-trained on optical images, for deep multi-scale spatial feature learning. Feature maps from the last layer of the multi-parallel FCN-8s models were concatenated to generate better fused features. Finally, the manifold graph embedding model was applied to determine the effective representation of the fused feature in a low-dimensional subspace, which serves as the input of a Support Vector Machines (SVM) to obtain the final classification results. The main contributions of this paper are as follows:
(1)
Inspired by the GAN [30] and the DLSR photo enhancement dataset (DPED) [31], a generator subnetwork and a discriminator subnetwork were employed to form the object characteristic-driven image enhancement (OCIE) module. This was utilized to automatically generate visually pleasing satellite images with enough target information, which makes them conducive to the target detection task, while augmenting the training set. This module optimizes the texture, color, smoothness, and semantic information of the training image and greatly improves the target background contrast, having a good effect on the background classification in RPN.
(2)
The dense feature reuse (DFR) module contains multi-level residual networks with dense connections that explore the spatial location feature without extra increases in the parameters, avoiding the problem of gradient disappearance. Inspired by the original dense-block, it uses 1 × 1 convolution to suppress channel growth and merge low-level position information and information of different resolutions. It retains identity mapping and strengthens the transmission of information flow.
(3)
In order to further improve the ability to obtain spatial scale information, multi-scale atrous convolution kernels with different sparsity and sizes were combined in a manner similar to spatial pyramid pooling (SPP). The generated ASPP (atrous spatial pyramid pooling) structure was integrated with the FPN to form the receptive field expansion (RFE) module, which enhances the receptive field and strengthens the network’s ability to obtain information of different scales and better process global information.
This article is organized as follows: Section 2 briefly introduces the development background and research history of the target detection task field and the structure of the classic target detection network. The next section, Section 3, introduces the main work of this article and describes the method in detail. The description of datasets and experimental results are shown in Section 4, and the final discussion is presented in Section 5.

2. Preliminaries

2.1. Image Enhancement Network Based on GAN

The definition of image enhancement is very broad. Generally, image enhancement is conducted to purposefully emphasize the overall or local characteristics of an image, such as improving the color, brightness, and contrast of the image; improving the clarity of the image; emphasizing the difference between the characteristics of different objects in the image; and improving the visual effect of the image.
Traditional image enhancement has been studied for a long time, and the existing methods can be roughly divided into three categories: the spatial-domain method, which is used to directly process pixel values, such as histogram equalization [32] and gamma transform [33]; the frequency-domain method, which is used to transform operations in the domain, such as wavelet transform; and hybrid domain methods, which combine the spatial and frequency domains. Traditional methods are generally simpler and faster, but they do not take into account the context information in the image, so the effect is not good. In recent years, convolutional neural networks have made great breakthroughs in many low-level computer vision tasks. Compared with traditional methods, some methods based on the CNN have greatly improved the quality of image enhancement. Most of the existing methods are supervised learning. For an original image and a target image, the mapping relationship between them is learned to obtain an enhance images. However, such datasets are relatively small, and many of them are artificially adjusted. Therefore, self-supervised or weakly supervised methods are needed to solve this problem.
The success of the generative adversarial network (GAN) in image translation provides the possibility to generate large-scale training data. Training the GAN can skip the tedious process of data annotation, as it aims to learn the joint distribution of two domains and learn the conversion of modifying low-quality images to high-quality images. Therefore, the goal is to learn a cross-distribution translation function. Ignatov et al. [31] proposed a dataset DPED in ICCV2017, which contains more than 6K photos that were taken at the same time under a variety of outdoor conditions using three mobile phones and a single SLR. They proposed a new image enhancement algorithm based on the GAN model. By learning the mapping relationship between photos taken by mobile phones and SLR photos, the photos taken by mobile phones could be upgraded to the level of SLR. This is end-to-end training without additional supervision and the artificial addition of features. However, it has to retrain a model for each dataset, which is not universal. In [34], the author proposes a new weakly supervised network model, weakly supervised photo enhancer (WESPE). The input data and output data are low-quality images and high-quality images, respectively, but they do not need to correspond in content. WESPE uses a transitive CNN-GAN structure to learn the mapping relationship between them, so it can be applied to any outdoor dataset and does not require paired enhancement images for training. The authors of [35] first proposed the use of GANs to achieve unsupervised image enhancement, but the mentioned unsupervised means that the datasets used are not consistent in content. The two-way GAN used in this method is similar in structure to CycleGAN and uses U-Net to add global features, adaptive weighted WGAN (adaptive WGAN), and an independent BN layer to learn images with user desired features. The authors of [36] propose dynamic image enhancement based on classification, which combines image enhancement tasks with classification and uses the accuracy of the classification results to measure the quality of image enhancement. The author achieved this goal by adaptively enhancing the features in the image by dynamic convolution so that the CNN structure could selectively enhance the features that provide assistance in improving image classification. In addition, CycleGAN [37], DiscoGAN [38], and DualGAN [39] make image conversion possible by introducing cyclic consistency constraints. CoGAN [40] is a model that is also suitable for unpaired images, using two shared weight generators to generate images in two domains with random noise.

2.2. Densely Connected Convolutional Networks

In order to achieve state-of-the-art performance on classic optical datasets, many neural networks with increasingly complex structures have been proposed, but this has brought about problems, such as vanishing gradients and parameter redundancy. In recent years, some algorithms, such as ResNet [41], stochastic depth [42], and highway networks [43], were proposed to deal with these limitations. Although the network structure of these algorithms is different, the core is based on the shortcut connection structure, which means that short connections are created between different layers. Some of the original input is passed to the subsequent layer without processing to avoid the loss of information passing between the layers. For example, the residual structure introduced in ResNet adds a skip connection that bypasses the non-linear transformations with an identity function, making the output contain the output features of the current layer along with the original input features of the previous layer. This process can be described as
X l = H l X l 1 + X l 1
where X l refers to the output of the l-th layer in the network; H l ( · ) represents a non-linear composite function, which is usually defined as a combination of operations such as batch normalization (BN) [44], rectified linear units (ReLU) [45], pooling, or convolution.
This structure can help the gradient back-propagation during training to train a deeper neural network. It makes the deep layer and the shallow layer more correlated, and the loss at the output can more effectively constrain the optimization direction of the shallow layer’s parameters.
In general, an advantage of ResNet is that the identity mapping of input and output improves the gradient back-propagation. However, the output features of the residual module are the summation on each channel, which affects the transmission of information such as the target position in the neural network, and there is still some parameter redundancy within the feature maps of the individual layers that can be optimized.
DenseNet was proposed based on the continuation of ResNet, and it uses a densely connected method between different layers. Each layer in the dense block accepts the feature maps of all previous layers as its additional input and combines these feature maps from different layers by concatenating them, which is different from ResNet. The specific operation can be described as
X l = H l X 0 , X 1 , , X l 1
where the l-th layer receives the feature maps of all preceding layers, X 0 , , X l 1 refer to input features, and [ X 0 , , X l 1 ] represents the concatenation of these feature maps.
This structure reduces the problem of vanishing gradients while enhancing the efficiency of feature reuse and greatly reducing the number of parameters. It can achieve better performance than ResNet under the condition of less parameters.

3. Proposed Method

3.1. The Overall Framework of Ship Detection Methods

Compared with traditional manual feature methods, deep neural networks have better feature expression capabilities and can extract deep semantic information in image information. How to design more efficient networks has been a hot topic in the field of deep learning research over the past two years. Our proposed ship target detection method is considered from three aspects, and then three modules are designed to be combined with the basic network to improve the overall performance of remote sensing image ship detection. Figure 1 shows the overall process description of the proposed method.
Considering the data-driven characteristics of neural networks, we designed an object characteristic-driven image enhancement (OCIE) module to enhance the input data and generate a image of high quality in detail and texture relative to the original image in order to highlight the visibility of the ship in the sample, providing the CNN with an enhanced ability to learn the geometric and texture characteristics of ships and expanding the diversity of dataset samples to a certain extent. From the perspective of network learning space exploration, feature reuse is a form of identity mapping, so we designed an dense feature reuse (DFR) module to enable location information at the lower layers to be retained and passed deep into the higher layers, which is conducive to improving the effectiveness of detection tasks sensitive to location information. Receptive field expansion and multi-scale prediction as a way of simulating the process of observing objects in real vision, which deal with targets of different sizes with receptive fields of different sizes, are common solutions in current visual tasks. Therefore, we designed a receptive field expansion (RFE) module to be combined with the multi-scale structure, thereby allowing the detection network to be adapted to the detection of ship targets of different scales.

3.2. Image Enhancement Method Considering Ship Target Characteristics

In image analysis, the quality of the image directly affects the effect accuracy of the algorithm. Therefore, before image processing (feature extraction, segmentation, matching, recognition, etc.), preprocessing is required. The main purpose of image preprocessing is to eliminate irrelevant information in the image, restore useful real information, enhance the detectability of relevant information, simplify data to the greatest extent, and thus improve the reliability of recognition. Due to the strong correlation between the target position and features in the image and the detection performance, pre-processing is very important for the target detection task. General pre-processing operations often require a combination of multiple processes to achieve the desired effect, which are cumbersome and uncertain. In response to this, an intelligent image enhancement module is designed in this section to implement an end-to-end image enhancement method.
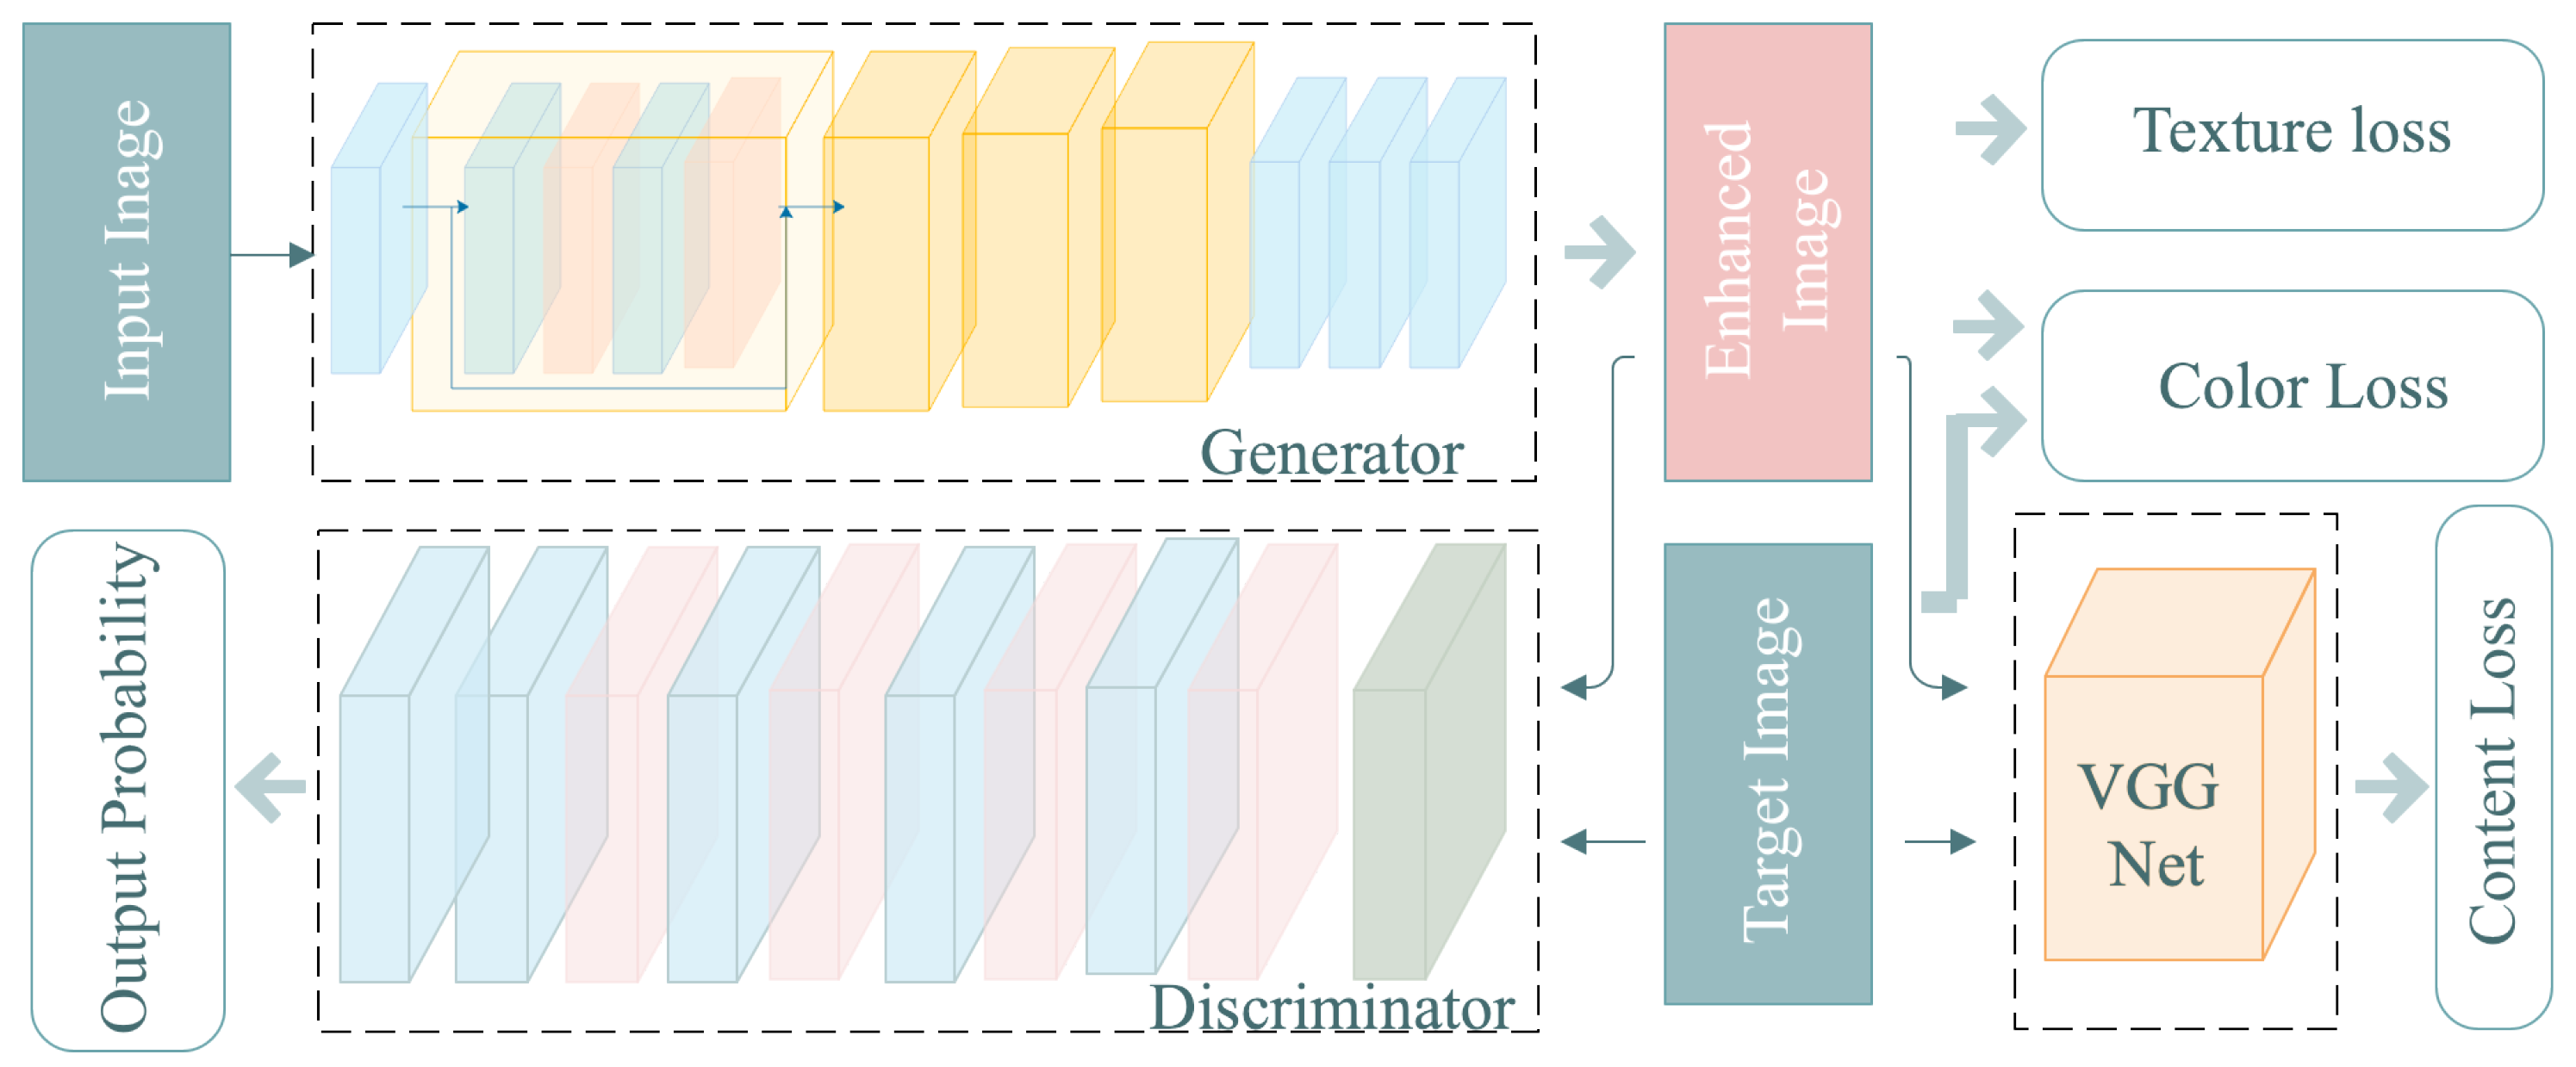
Considering the small number of samples in the training dataset and the problem of a large number of ship targets and backgrounds with low discrimination in the RSIs, a fully convolutional network (FCN) based on GAN mode was used to enhance the training set. Figure 2 illustrates the overall architecture of the network.
As shown in Figure 2, the GAN is a framework for estimating generative models that mainly composed of two networks, a generator G and a discriminator D, the entire network is a adversarial process, G captures the training data distribution and generates new data, D estimates the probability that the data come from the training data instead of from G.
In generator G, a low-quality image was first inputted. After it was preprocessed by a convolution layer of 9 × 9, four residual blocks were used, each of which was alternately composed of two 3 × 3 convolution layers and the BN layer. Then, the feature passed through three convolution layers to provide the enhanced image. The activation function for all of the previous layers is R e L U , and the activation function for the last layer is T a n h . The main purpose of T a n h is to normalize the pixel value to (−1, 1). The output is a three-channel image with the same shape as the input.
The discriminant network is composed of five convolutional layers, and the last fully connected layer outputs the final result through a sigmoid function. First, the target image and the obtained enhanced image were grayed out, and then the two types of images were randomly mixed and inputted into the discriminant network. The discriminator needs to discriminate which images are the target and which images are enhanced until the two parts of the image cannot be distinguished. The discriminator CNN was used to judge whether the enhanced image and target image were true or false. The image generated by the generator should deceive the discriminator as much as possible so that the closer the generated image is to the target image, the better the enhanced image.
Due to the local nonlinear distortion caused by the imaging sensor, there was a shift of pixels between the input image and the output image, meaning that the corresponding pixels could not be closely matched. Therefore, the standard mean square error was not suitable. The image quality was evaluated by constructing a composite loss function, which mainly includes three parts: content, texture, and color.
The overall loss is defined as a weighted sum of the following losses:
L total = α · L content + β · L texture + γ · L color
The setting of the coefficient is determined based on experiments on the data set, which reflects the consideration of the unique characteristics of remote sensing images: in order to reduce the interference of prominent backgrounds such as land, clouds and fog, a smaller texture loss coefficient is set accordingly; because remote sensing images are grayscale images, there is no need to pay too much attention to color changes, so the color loss coefficient is the smallest; the content loss will encourage the enhanced image to have a feature representation similar to the original image, which can better preserve the image semantics. Finally in this article, α is set to 1, β is 0.6, and γ is 0.1. The generator G calculates L color losses.
(1) Color loss: To measure the color loss between the generated enhanced image and the target image, Gaussian blur was applied to the image before calculating their Euclidean distance. This has the advantage of eliminating the effects of texture and content to evaluate the brightness, contrast, and color differences between the two images. The color loss can be written as follows:
L color ( X , Y ) = I e I t F 2
where I e refers to the enhanced image; I t refers to the target image; and I e and I t are the blurred images of I e and I t , respectively; ‘F’ refers to Frobenius norm. In actual network design, the Gaussian blur operation is equivalent to an additional convolutional layer, and its convolution kernel is a fixed Gaussian kernel.
(2) Texture loss: The texture loss is directly learned by the GAN and used to measure texture quality. The texture loss of the discriminator network is the cross-entropy loss function. It maximizes the difference between the true label and the predicted label (target or enhanced). Because the purpose of the generator is to produce an image that is as close as possible to the real target image, when the discriminator cannot distinguish the difference between the two, it means that the generator is better. It is trained to minimize the cross-entropy loss function, and the texture loss is defined as a standard generator objective:
L texture = i log D G I i , I t
where G and D denote the generator and discriminator networks, respectively; I i refers to the input image; and I t refers to the target image.
(3) Content loss: In order to maintain the semantic information of the image, for the target image and the enhanced image, the Euclidean distance of the feature maps activated after the pre-trained VGG19 network is calculated as the content loss:
L content = 1 K h j G I i h j I t
where K denotes the product of number, height, and width of the feature maps, and h j ( ) be the feature map obtained by the j-th layer of VGG-19.

3.3. Dense Feature Reuse Module

For a multi-layer CNN, the layer closer to the input layer, that is, the shallow layer of the CNN network, generally has a small number of convolution kernels, and the size of the feature map is large, the resolution is high, and the receptive field is small. So it mainly contains local detailed features, mainly including: contours, edges, colors, texture and shape features. The low-level features of the image have less information, but the target location is accurate.
The layer closer to the output layer, that is, the deep layer of the CNN network, generally has more filters, the size of the feature map is small. The features obtained after several convolutions are high-level semantics. Its receptive field is larger, and the extracted features become more and more abstract, mainly containing global information, and the classification ability is stronger. However, detailed information will be lost, which is not conducive to accurate segmentation.
In general, the low-level features have higher resolution and contain more position and detailed information, but due to fewer convolutions, they have more noise. The high-level features have stronger semantic information, but the resolution is very low, and the perception of details is poor.
For the detection task, it is necessary to retain important spatial information during feature extraction by the CNN in order to facilitate the final coordinate regression. In many application scenarios, methods such as ResNet are often used to improve the accuracy of CNN through network structure optimization. Although the identity mapping of the input and output in the residual structure improves the gradient return, the way in which the features are superimposed on the channel destroys the transmission of the information flow in the CNN. As the network deepens, there are partially redundant features in the residual network. Instead of learning redundant features many times, feature reuse is a better way to extract features.
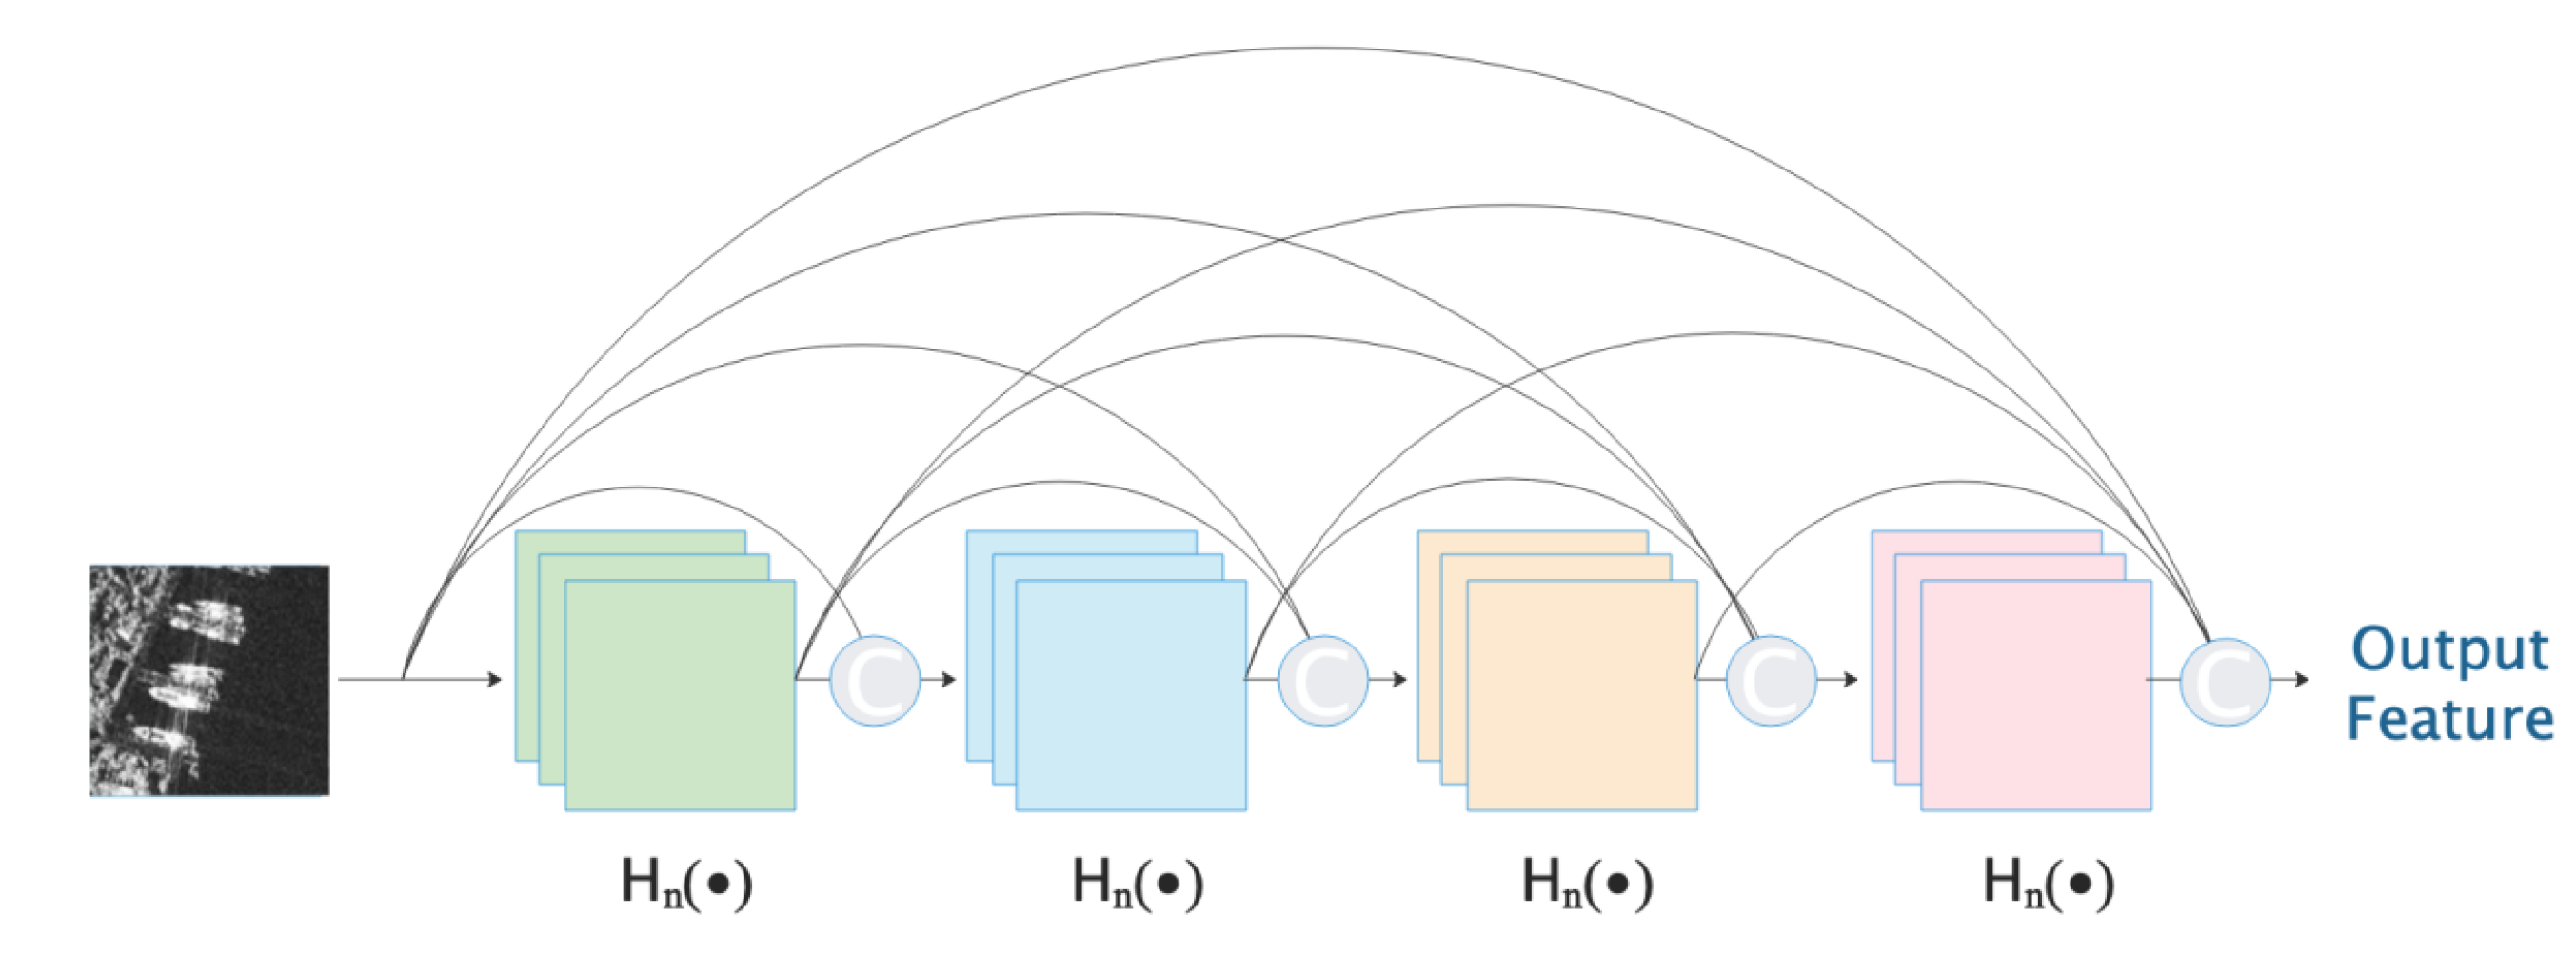
From the perspective of network features, feature reuse and bypass connection can greatly reduce the expansion of CNN parameters on the basis of alleviating the problem of gradient vanishing. As shown in Figure 3, drawing on the idea of feature reuse, the dense feature reuse (DFR) module concatenates multiple consecutive features on the channel as the input of the next convolutional layer, and in this process, the extracted low-level features are utilized.
The reasons for hosing concatenated instead of summed features are to preserve the integrity of low-level feature information, improve the transmission of information flow in the CNN, and ensure the cross-layer identity mapping of gradients, that is, retain the closeness of gradient cross-layer propagation. On the other hand, low-level features in the CNN tend to retain better location information, while high-level features retain deep semantic information. Therefore, after the process of continuous cross-layer connection, the front feature can be fused with the later feature to compensate for the spatial information. In addition, a detail here is that the batch normalization operation is conducted after concatenation rather than after each individual convolution the purpose of this is to normalize the features of different levels in order to improve the regularity of the model.
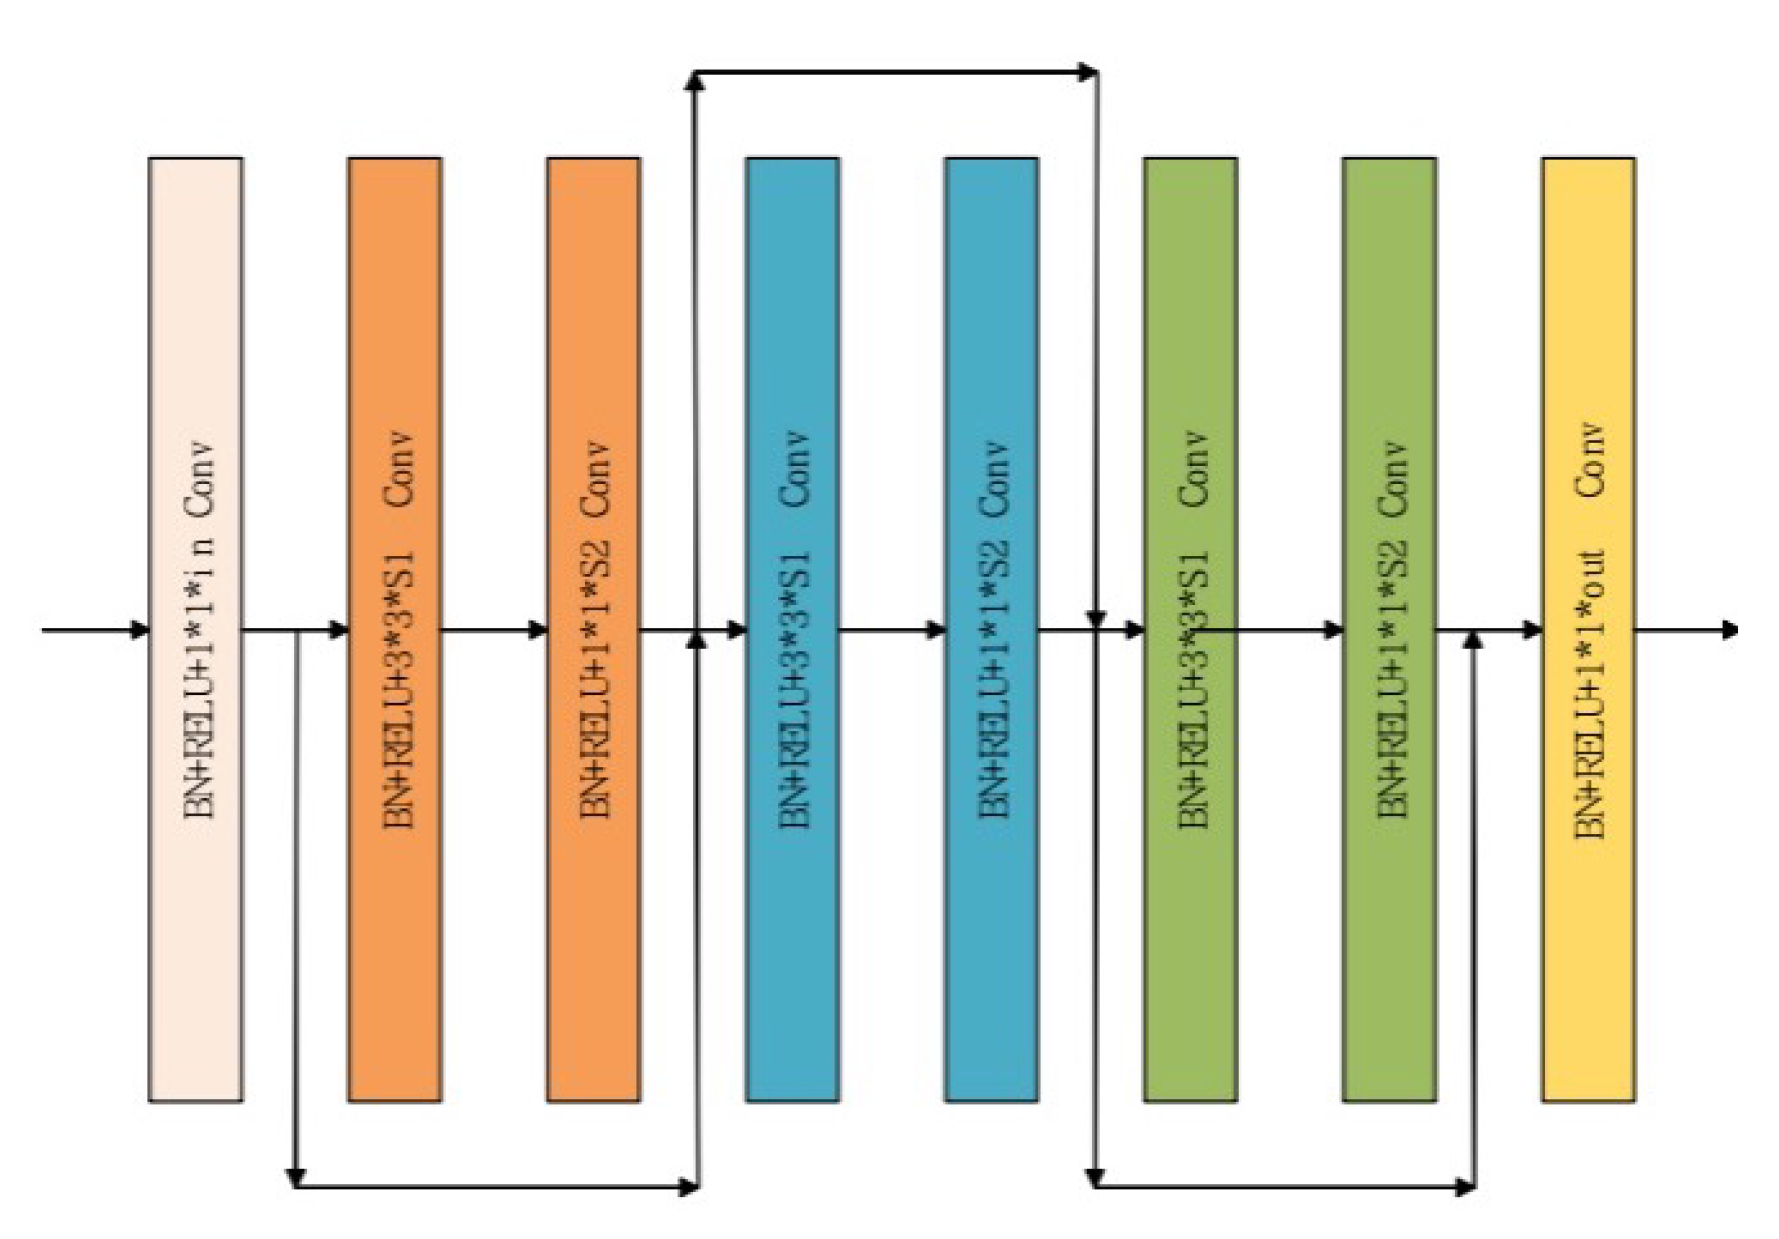
Even when the feature multiplexing is set to accept a smaller number of channels, it still cannot stop the redundant calculations caused by the rapid growth of channels. Therefore, 1 × 1 convolution is used after the 3 × 3 convolution inside each efficient feature reuse module to reduce the dimension in order to slow down the channel increase rate.
Nevertheless, the trend of channel growth is still inevitable. Unlike the dense-block in DenseNet, we did not use continuous 3 × 3 convolutional cascade stacking. Because of the simple 3 × 3 convolutional cascade stacking within the same module, the increase in the amount of calculations and parameters that the channel growth rate causes is unacceptable, and at the same time, in order to increase the robustness and flexibility of the module, the module can replace any convolutional layer and residual block and be flexibly embedded as a component in the backbone. We used 1 × 1 convolution at the input and output to make it a bottleneck model similar to the residual block. At the same time, we did not use the transition layer in DenseNet but set the continuous alternating 3 × 3 and 1 × 1 convolution inside the dense block. The function of 1 × 1 convolution is to suppress the growth rate of the channel with the bypass connection. As shown in Figure 4, we generally took consecutive 6–8 convolutional layers to form an efficient feature multiplexing module, which avoids the problem of an excessive channel count.
Similar to the identity block in ResNet, this structure does not change the size scale of the input and output features; that is, it does not include the downsampling factor, only the fusion and dimensional scaling of the spatial feature information, and the entrance and exit of the module are equipped with 1 × 1 convolution with adjustable parameters to adapt to the input and output requirements of different stages.
The advantages of reducing the number of parameters due to feature reuse are that the training of the network is easier and that it comes with a certain regularization effect to reduce the risk of overfitting, thereby alleviating the problem of gradient vanishing.

3.4. Improved Receptive Field Expansion Module Based on Multi-Scale

As a commonly used feature extraction module in target detection, the higher resolution features in FPN need to fuse multiple up-sampled depth features, and their position information is insufficiently characterized. Moreover, in view of the relationship between the receptive field and anchor in the backbone, a better anchor is acquired. The regression requires that the anchor scale is slightly smaller than the receptive field; thus, for the detection of larger vessels in the dataset, the receptive field is still insufficient, and, as such, need to expand the receptive field in the network.
The spatial pyramid pooling (SPP) operation allows any size of input to obtain a fixed output. It opens up a new idea for spatial multi-scale feature extraction: based on the information extracted from a single scale feature, it only needs to re-extract the information according to different step sizes in the space to extract the effective multi-scale feature of any scale region.
There are two main strategies for capturing features of different scales. One is to introduce continuous cascading atrous convolutions in the backbone to expand the receptive field obtained layer by layer; the other is to perform multiple parallel atrous convolutions of different sparsity on the same feature map and cascade the output. Simply concatenating multiple atrous convolutions will result in the loss of pixel information in the feature; that is, not all pixels participate in the operation. Moreover, it also loses effective information in a continuous small range, which may affect the expression of small object information.
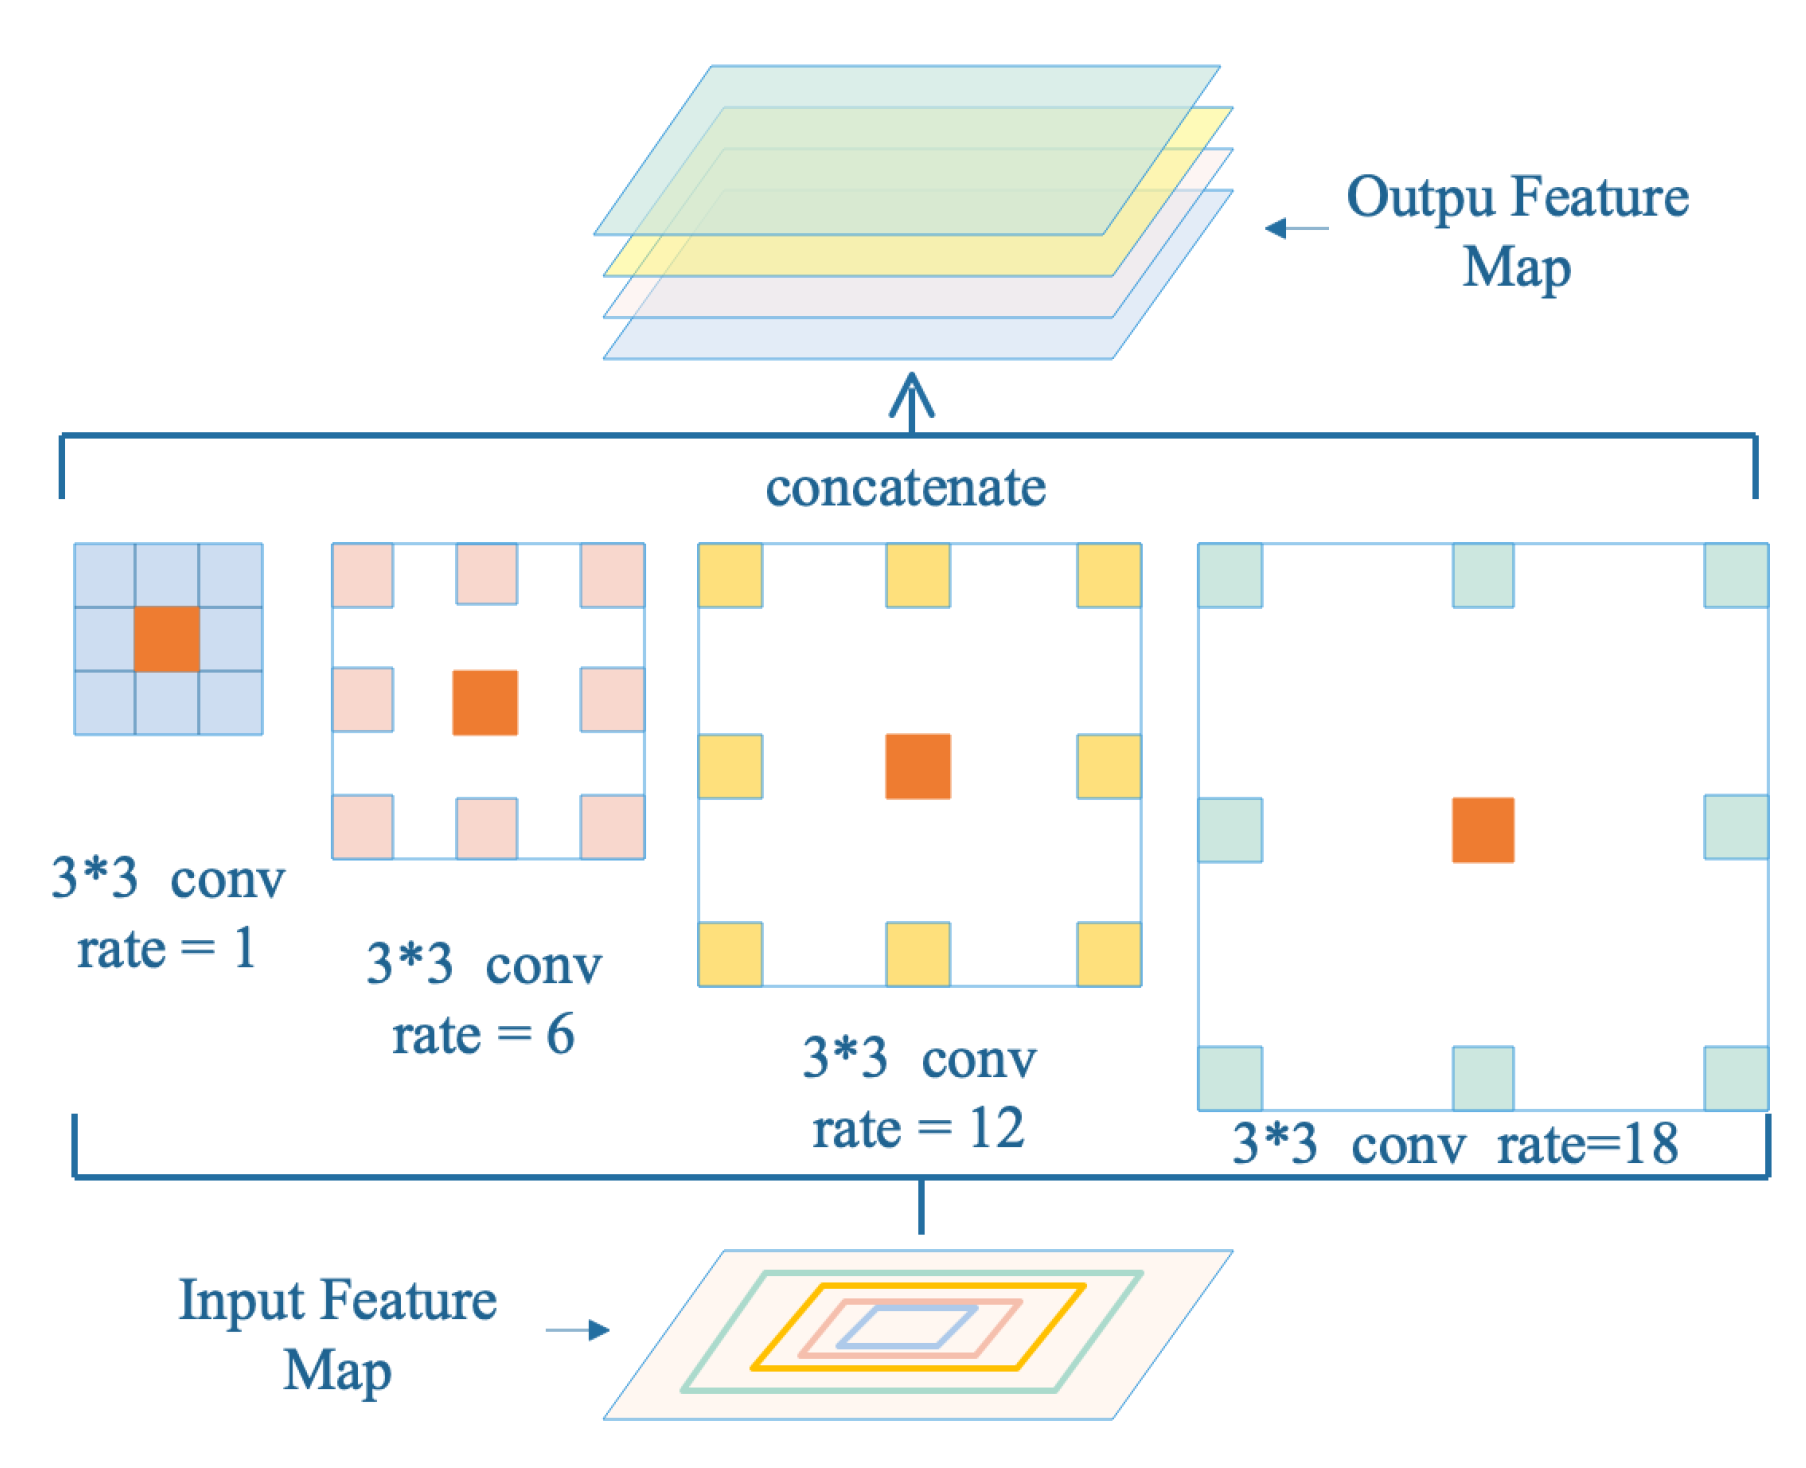
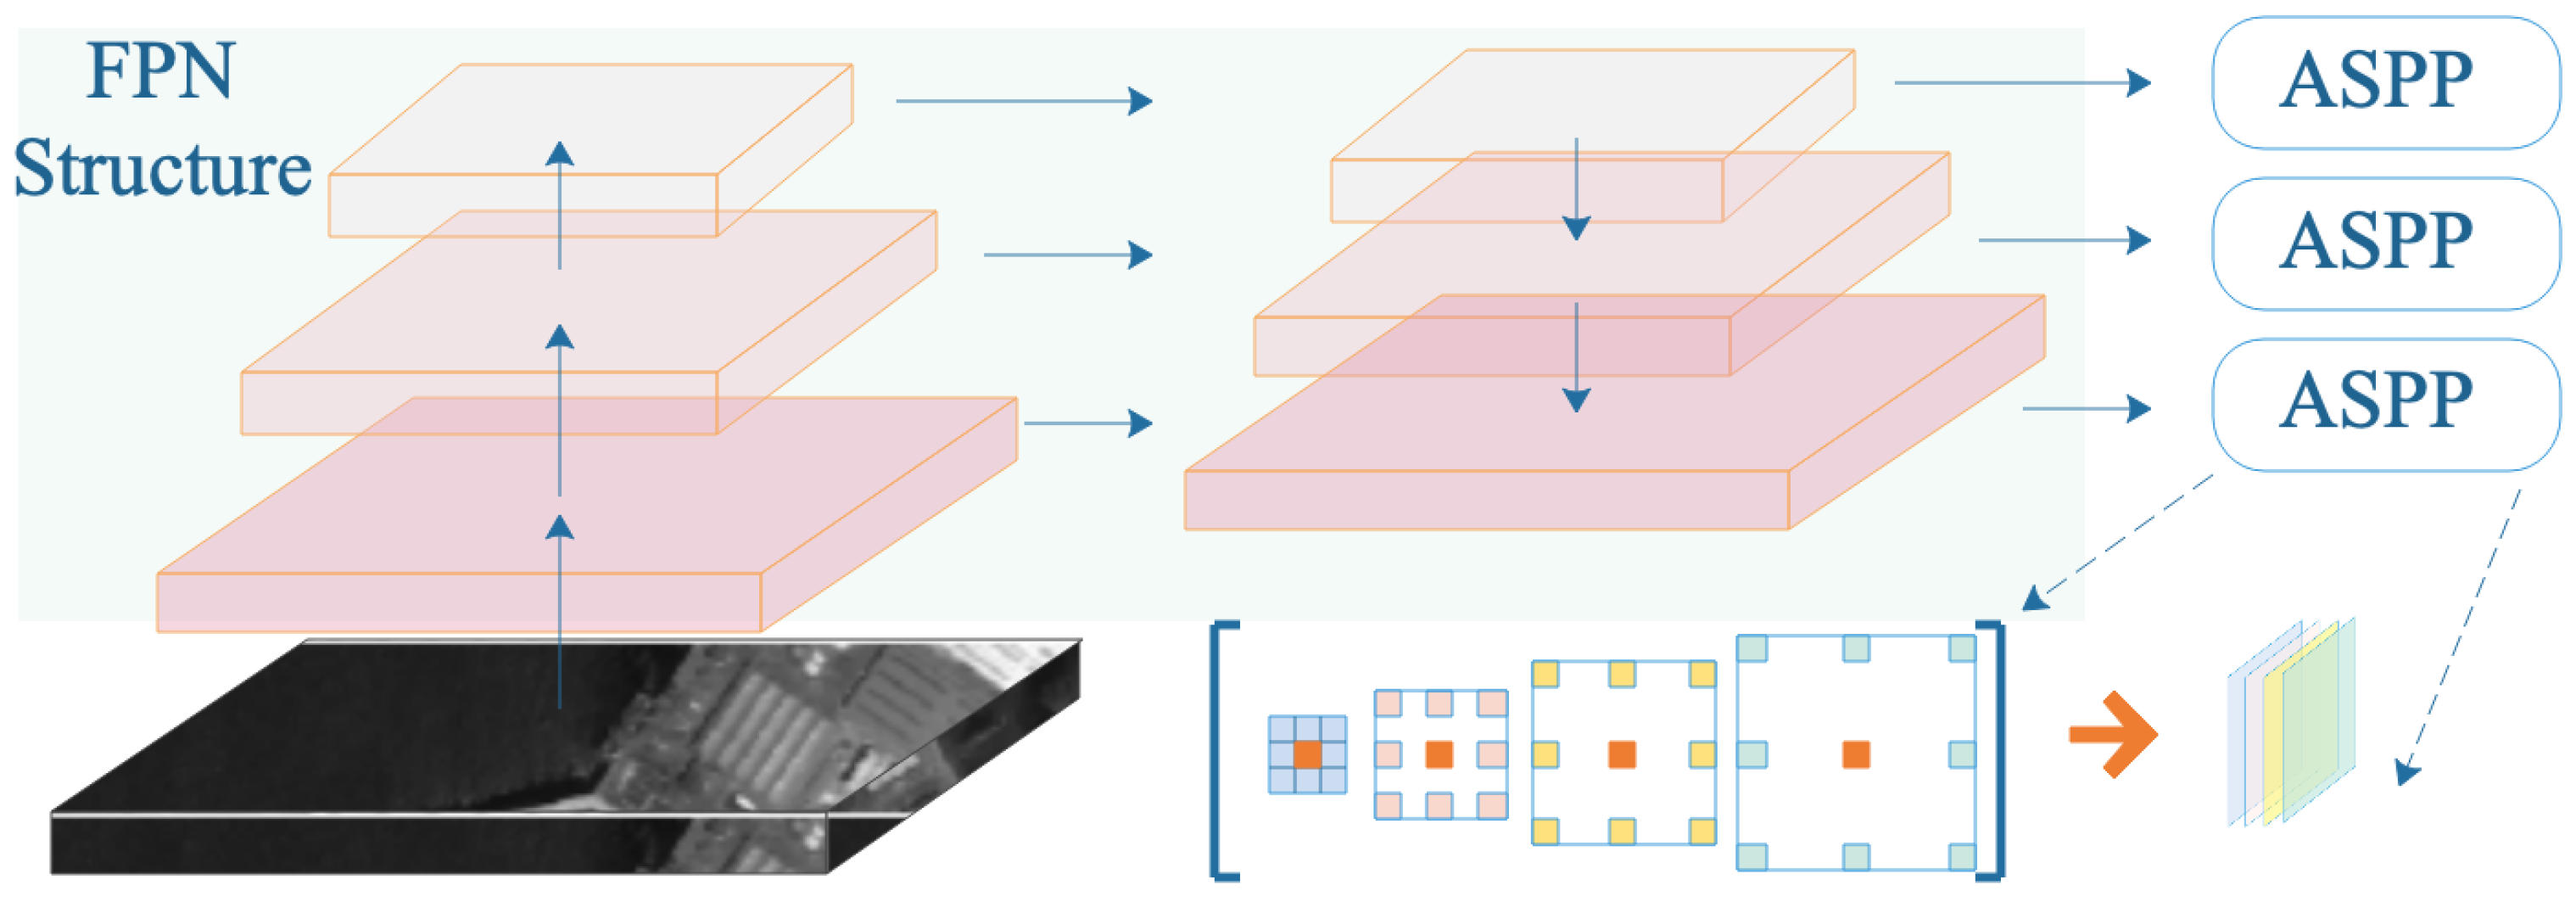
Therefore, instead of simply superimposing multiple atrous convolutions, we designed the receptive field expansion (REF) module, and the used ASPP model is shown in Figure 5. The REF module adopts an idea similar to that of the SPP module to expand the receptive field of atrous convolutions with different dilation rates for the same feature; then, it performs channel concatenation and uses 1 × 1 convolutions to reduce dimensionality. The dilation rate indicates the degree of expansion of the atrous convolution. For the standard ordinary convolution, the dilation rates is 1. As shown in Figure 6, we combined atrous spatial pyramid pooling (ASPP) with FPN to improve the detection effect on targets of different scales, setting the atrous convolution of the four branches with dilation rates of 1, 2, 3, and 4.
In our method, the shallow and deep networks are connected more densely through the DFR module, so that the local detailed features and the deep extracted overall features better match each other; at the same time, the RFE module expands the receptive field to obtain the overall information expression of larger ships, and improves the processing ability of CNN for multi-scale targets.

4. Experiments and Analysis

4.1. Experimental Data

We used two satellite remote sensing datasets in the experiment, which can be divided into two types, namely, SAR and optical due to different data sources.
(1) ChangGuang Dataset: The datasets were derived from the GaoFen-2 satellite of ChangGuang Institute. The original resolution is 8096 × 2048, which is mainly divided into dark targets, waves, clouds, complex scenes, and calm scenes. Figure 7 shows some representative examples in the dataset. In dark target scenes, target ships are easily submerged in the background and have poor target background discrimination. Different types of vessels, such as fishing boats and cruise ships, have poor characteristic resolution, and there are reef interferences in some scenes, regardless of detection and labeling. Both have a certain impact, so RPN extraction of the background is difficult. The image enhancement method in this paper can provide a good foreground and background contrast to the target, and the processing of this part of data is very effective. In waves and clouds, the noise around the target is relatively dense, and the detection is often affected by the wake of the ship or the occlusion of clouds. For example, smaller ships may also have a long and wide wake, which makes it difficult to distinguish between positive and negative samples. In complex scenes, the scale of ships is very different, or the ships are close to the shore, which causes the detection task to be interfered by a variety of negative samples of suspect ships, such as the protruding parts of the dock, bridges, containers on the shore, or white-roof plants. The target and the ship are highly similar in shape, texture, and grayscale, which causes a certain amount of interference, and the data augmentation part can increase the discrimination of different types of targets.
After being cropped, the resolution is 1024 × 1024, which includes various scenes, such as the calm sea, clouds, waves, and nearshore ships, and the sample size is considerably different. A total of 2545 pictures were acquired, of which 2040 were used for training and the remaining 505 for testing.
(2) SAR Ship Detection Dataset (SSDD) [46]: For the SAR dataset, we used an open-source dataset, which is the first publicly available dataset dedicated to SAR image ship detection, using the P A S C A L _ V O C annotation format. The data are mainly from public SAR images downloaded online, and anyone can obtain the complete data by sending an email to the database owner. The data are divided into many different scenes, including simple scenes with a clean background, complex scenes with obvious noise spots, and ships near the shore. Figure 8 shows some representative examples in the dataset. The image is mainly from RadarSat-2, TerraSAR-X, and Sentinel-1 sensors and was obtained by HH, HV, VV, and VH polarization methods. The target area is cropped to a resolution of about 500 × 500, and the resolution range is 1–15 m. The dataset has a total of 1160 images and contains 2456 ship samples. We randomly selected 930 sheets as the training set and the remaining 230 sheets as the test set. Compared with the optical dataset, the ship scale distribution of the dataset is more consistent, and the sample is slightly less than the optical dataset, so it is more necessary for the OCIE module.
(3) D S L R P h o t o E n h a n c e m e n t D a t a s e t ( D P E D ) : The DPED was used for enhanced network training in the OCIE Module. The training samples were taken with various smartphones, and the comparative samples were taken with a Canon 70D DSLR, with a total of about 22,000 pictures. Of these, 4549 were taken with a Sony Xperia Z, 5727 were with an iPhone, and 6015 were taken with a Blackberry Passport.

4.2. Experimental Results and Analysis

4.2.1. Experiment Evaluation of OCIE and DFR Module for RSIs

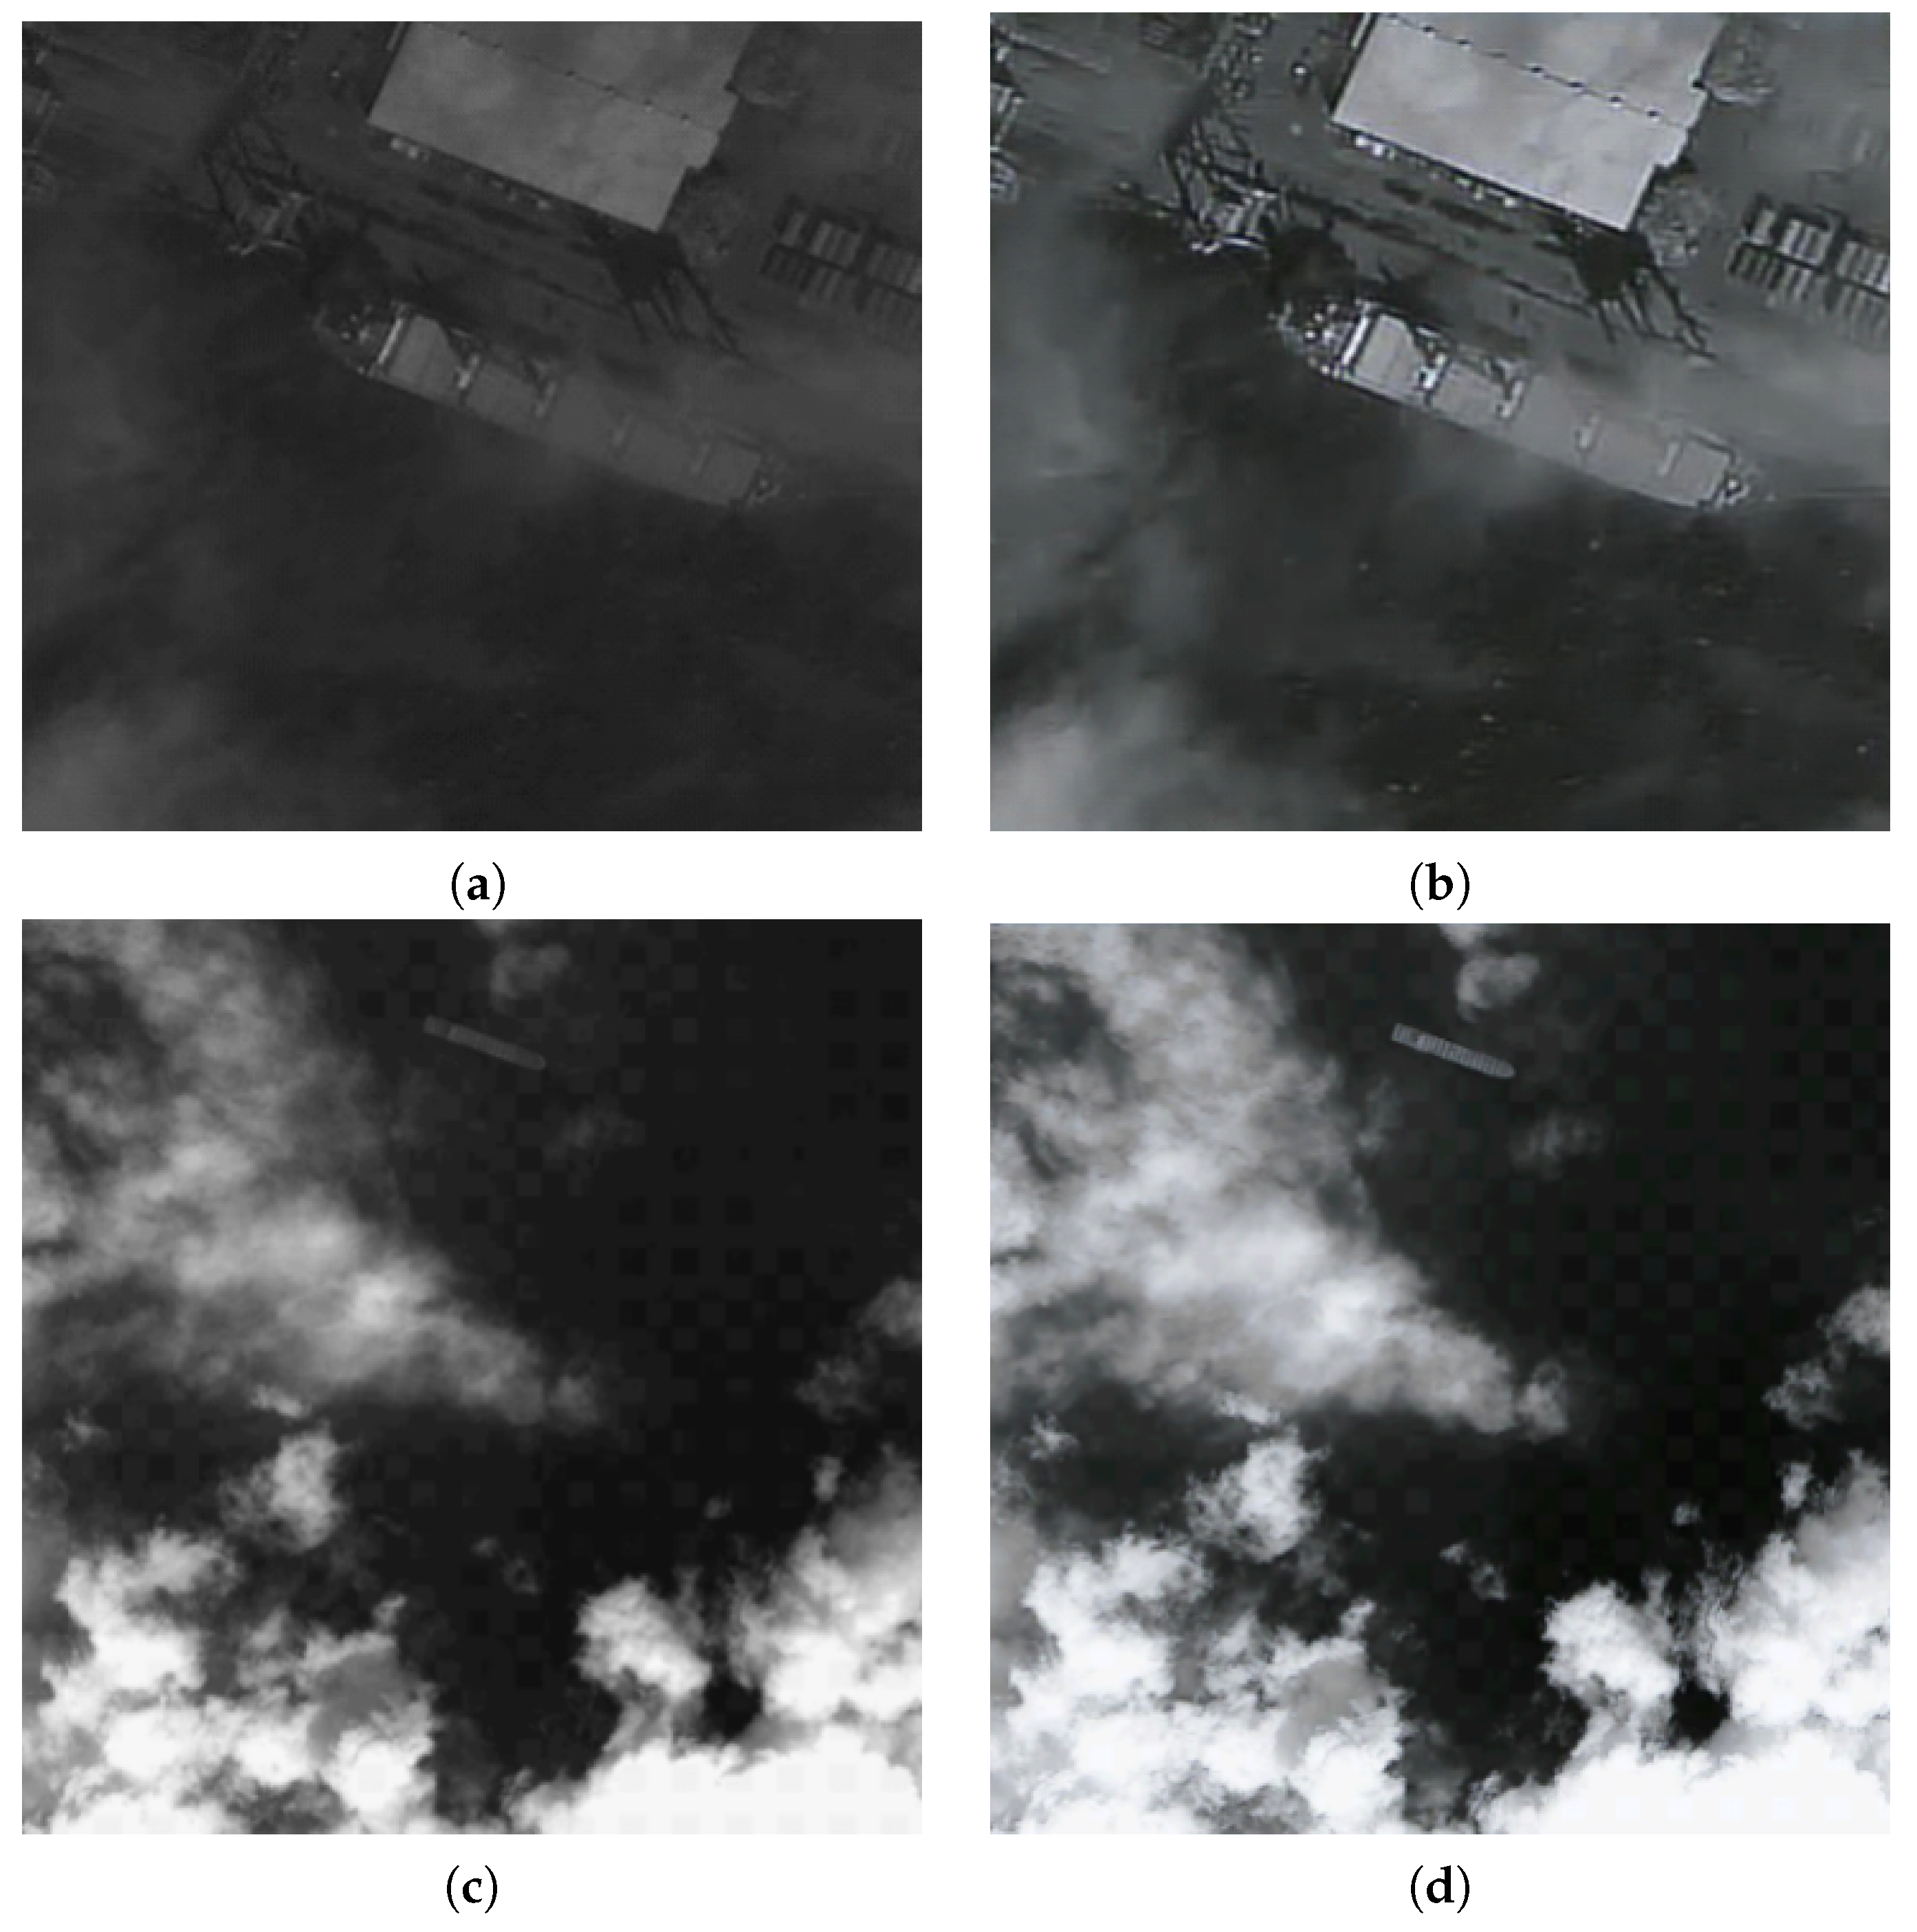
Figure 9 shows two enhanced images in the ChangGuang dataset, the original image on the left and the enhanced effect on the right. The contrast of the color brightness before and after the enhancement is shown. The enhanced image ship target is more prominent in the image, and its texture details are better displayed. The color change is similar to the grayscale enhancement on the original image. The picture is brighter than before, which is similar to the grayscale transformation and image exposure processing in traditional data augmentation. The difference is that the OCIE brings abundant texture features and more obvious target. FCN has 9 × 9 expansion receptive fields at the ends, so the indistinguishable enhancement effect depends on the semantic information around the target. As mentioned previously regarding the mix-up hybrid data enhancement method, the CNN is not sensitive to noise. In the experimental results, we can see that this method is useful for training.
It can be seen in Table 1 that the OCIE module is very effective when there are few data samples, and the data augmentation based on image enhancement has a better effect than traditional methods because the pixel-level mapping transform is added to the dataset. The new information enables the convolution kernel to extract features under different signal-to-noise ratios while reducing the risk of overfitting. Regardless of whether an optical dataset or SAR dataset is used, the gain brought by image enhancement is obvious, and the effect of improving the accuracy of Mask-RCNN [47] is more obvious, which can achieve an improvement of about 3%, while the recall rate has a small increase of about 1%. For YOLOV3, the data expansion also has a certain degree of effect. Such results are consistent with our expectations. Based on the effectiveness of the experiment, our dataset is processed by image augmentation data augmentation in the following experiments.
We verified the effectiveness of the proposed DFR module for multi-stage and single-stage detection algorithms. First, we replaced the residual block with the DFR module that we designed at different stages of ResNet-50 (including C2, C3, C4, and C5), which can make the model size basically unchanged, and we used 1 × 1 convolution to ensure that the output channel number remained the same as before. For the single-stage classic detection algorithm DarkNet-53, before the input of the first regression branch (head), that is, the end of the backbone, a dense block was introduced to replace the residual block.
The results in Table 2 show that the effects of the DFR module on the one-stage and two-stage model backbones are slightly different. Because the one-stage module itself can be regarded as a large RPN, feature reuse has little effect on the recall rate, and has a good improvement in accuracy, the improvement in optical and SAR datasets is about 1% respectively; while for Mask-RCNN, the DFR module can better improve the accuracy and recall rate at the same time. The optical and SAR datasets increased by 2.29 and 1.22% in terms of accuracy rate and by 1.76 and 1.64% in terms of recall rate, respectively. At the same time, it is seen that YOLOV3 has a low baseline on the SAR dataset. One reason for this is that the general One-Stage detector is not as effective as the Two-Stage detector in meeting the statistical distribution of the input image; another reason is that the semantic information used by the segmentation branch of Mask RCNN is more abundant than the information of the YOLO regression branch, and FCN further expands the receptive field for depth features, which is effective for improving the recall rate.

4.2.2. Comparison of Performance between the Proposed Overall Framework and the State of the Art

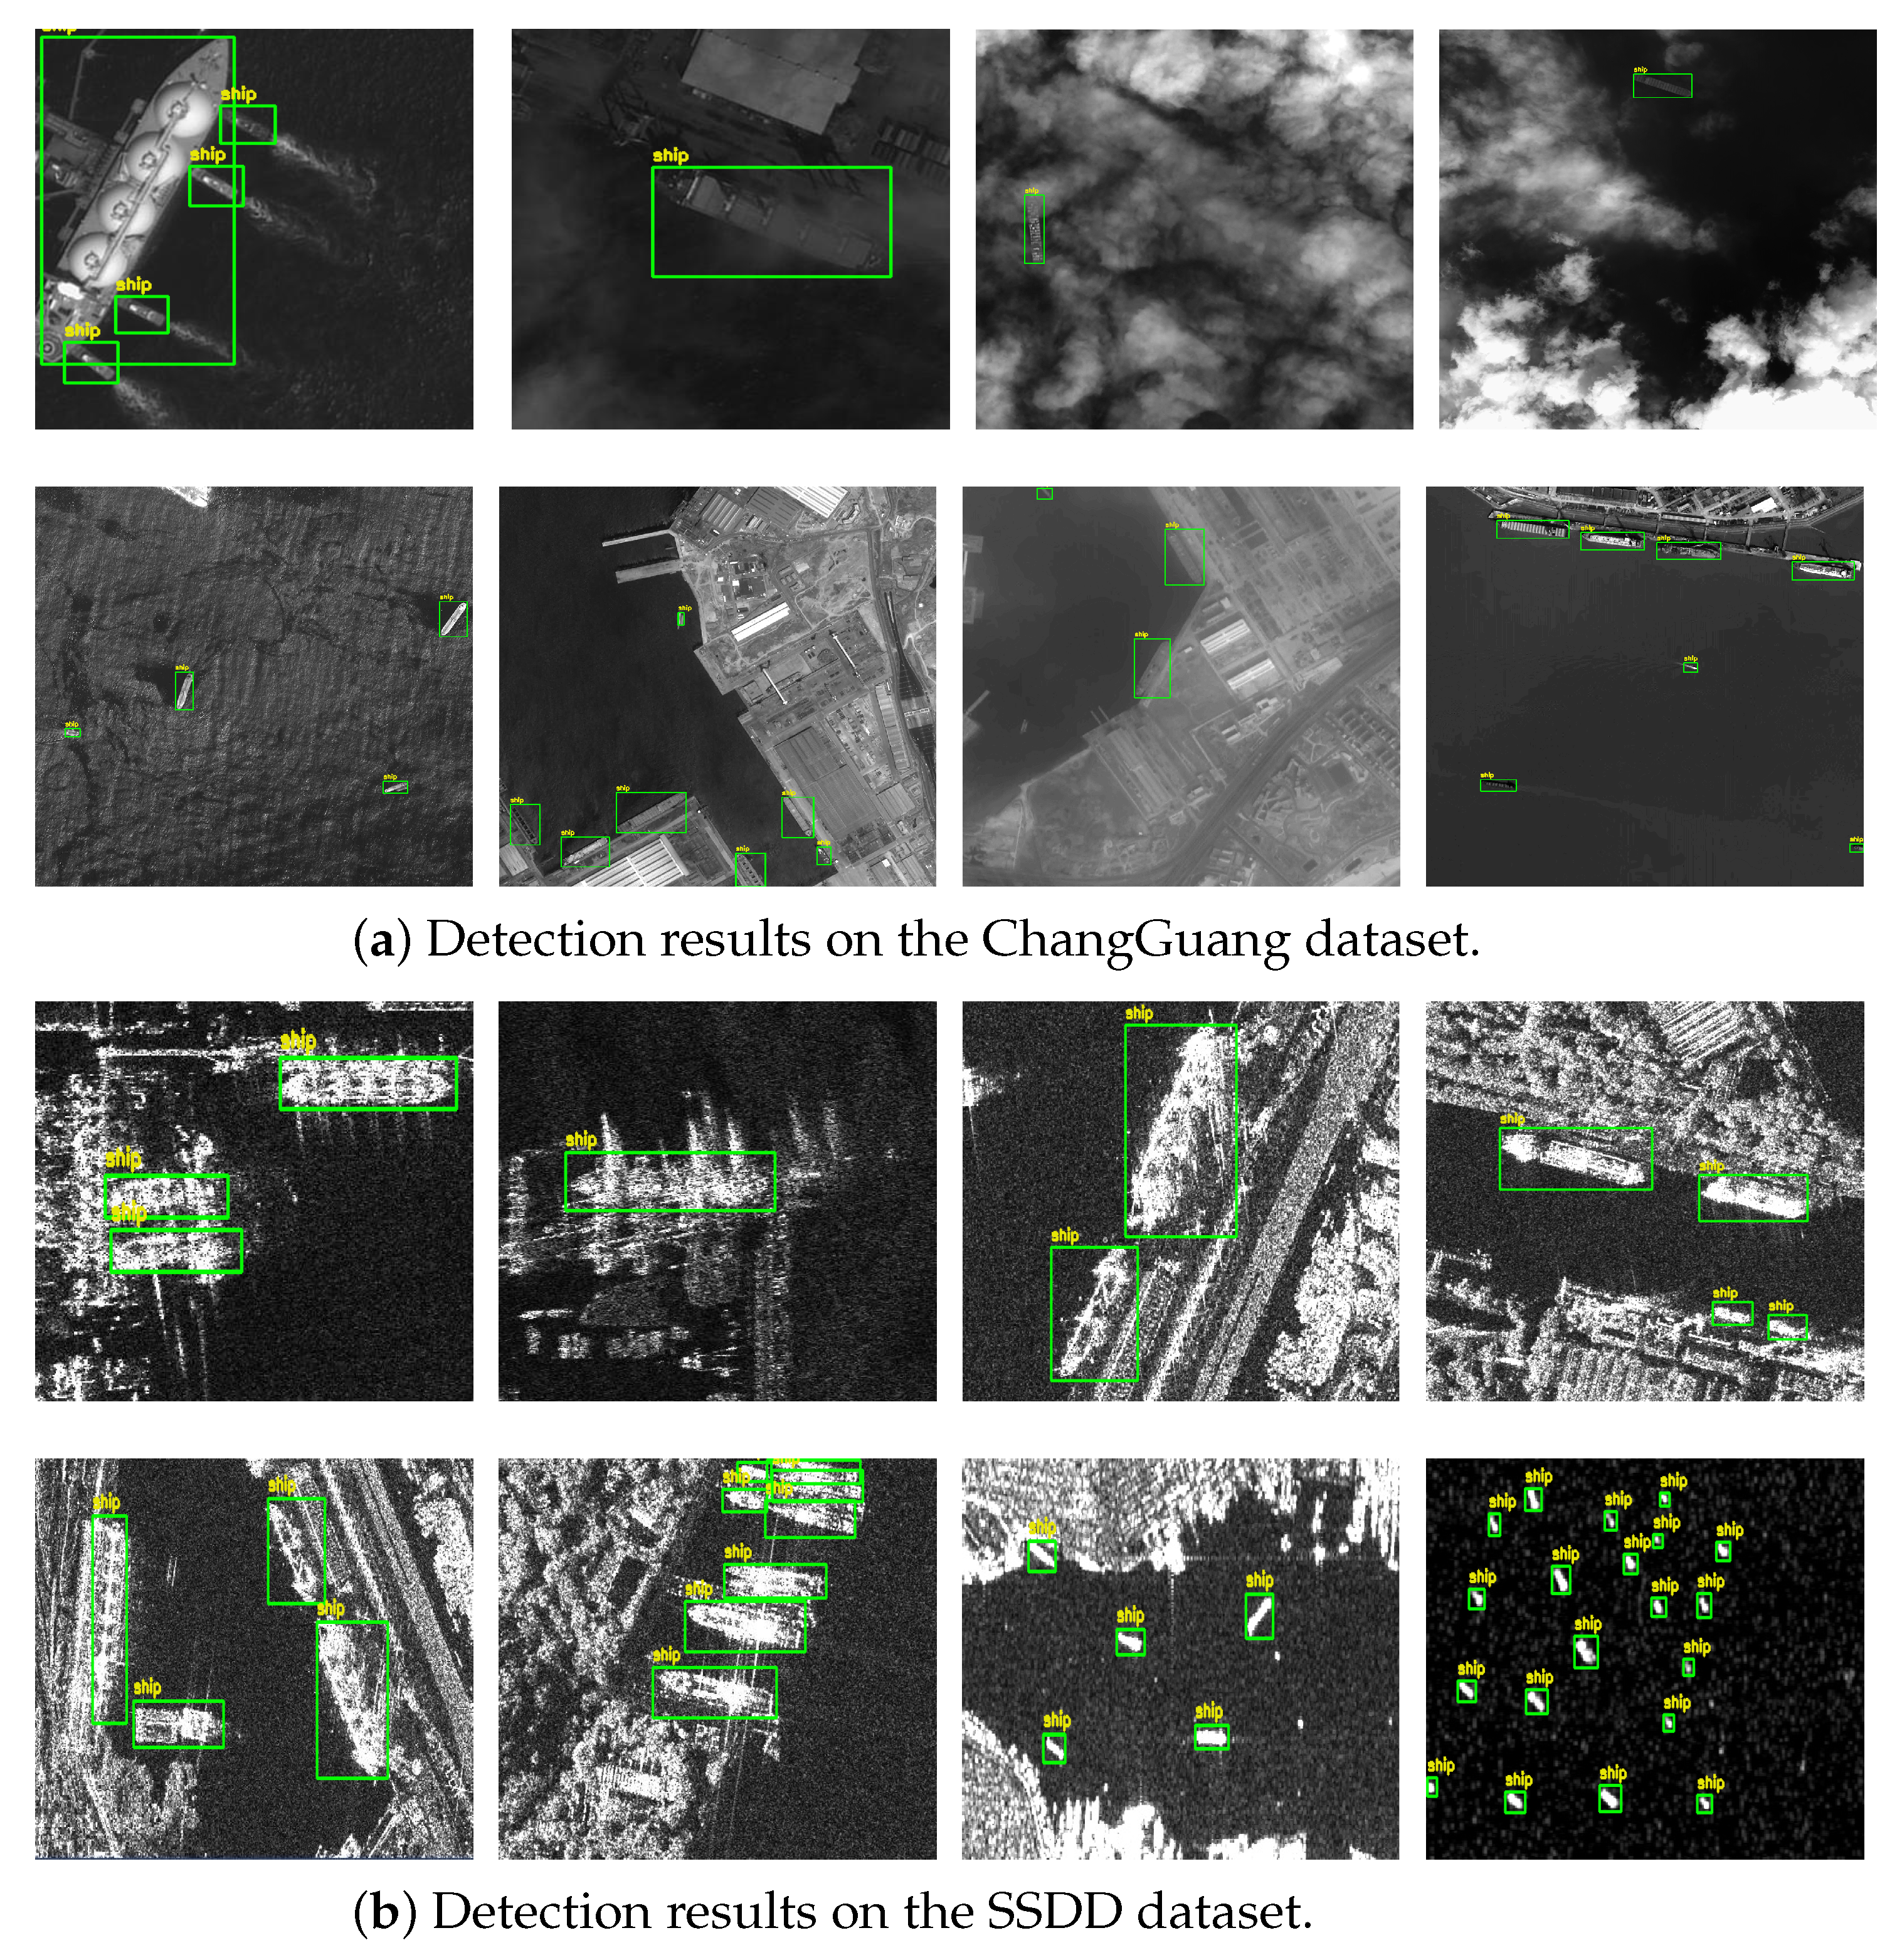
In this experiment, the proposed detection framework was compared to several detectors, including CornerNet, FCOS, faster RCNN, cascade RCNN, YOLOv3-tiny, YOLOV3 ( d a r k n e t -53), and Mask-RCNN ( R e s N e t -50). Figure 10 shows some of the detection results obtained by our overall framework on Mask RCNN. As described in Section 3.3, we considered combining ASPP with FPN. The features with different resolutions extracted by FPN after R e s N e t -50 were fused with ASPP, respectively, to obtain the features after receptive field expansion and performing regression. Similarly, although there is no actual FPN in d a r k n e t -53, its three regression branches also have different resolutions and receptive fields, so we also introduced ASPP at the entrance of the three regression branches of d a r k n e t -53 to expand receptive fields. On this basis, we retained the DFR module in the backbone and combined the RFE for comparative experiments. In Table 3, the parameters and computations (GFLOPs) of different methods are compared. According to the results in the table, it can be seen that the complexity indicators of our method have advantages, especially the optimization of multi-stage detector is more obvious, which may be due to the high redundancy in the feature of multi-stage detector.
In the experimental results shown in Table 4, comparing the network which used the RFE module to the previous results, it is found that the optical dataset achieved good results, especially on YOLOV3, achieving a 3.03% AP improvement, and achieved a slight improvement on Mask-RCNN. While on the SAR dataset, the improvement was smaller, and the YOLOV3 improvement was only 0.4%. In terms of improving the recall rate, both detectors achieved considerable results on two datasets, which proves that the expansion of the receptive field is beneficial to the robustness of the detector. Moreover, in the optical dataset, the distribution of ship sizes was more uneven. There may be ships with obvious size differences in the same area, as well as the situation where a large ship is next to multiple small ships. However, the size of ships in the SAR data set is basically the same, so the expansion of the receptive field on the multi-scale has a more obvious improvement on the optical dataset.

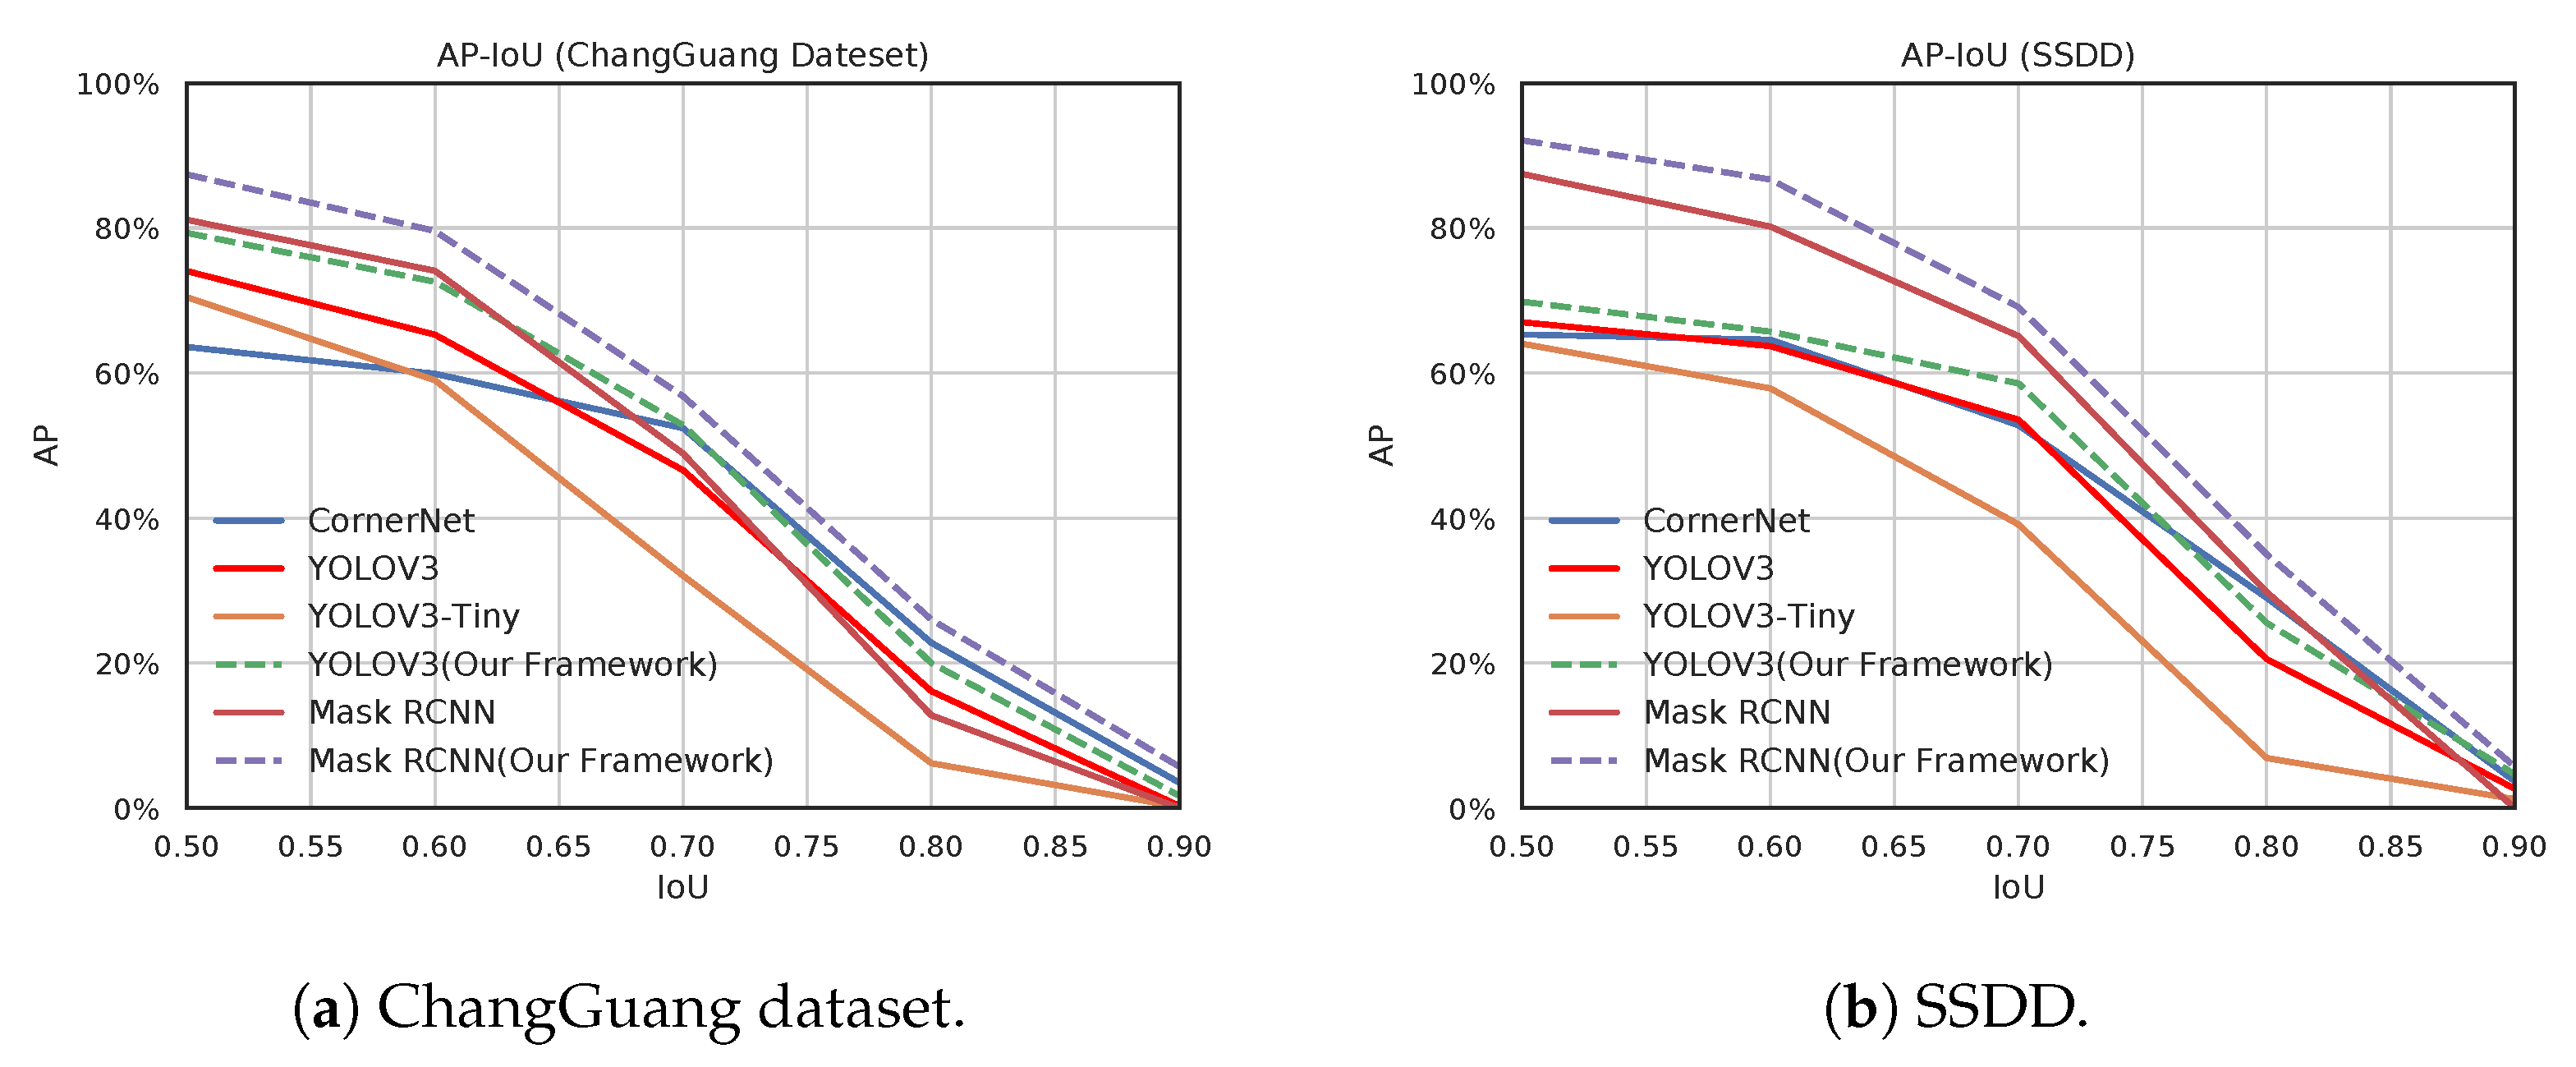
4.2.3. AP versus IoU Curve

We calculated the average precision (AP) values on different intersection over unions (IoUs). In Figure 10, the AP versus IoU curves for our datasets can be observed. The IoU threshold can be pre-set as a hyper-parameter of the inference process. In this section, the IoU was set to different values, and measured the average precision (AP) of the algorithms under different IOU settings. The range of IOU setting is [0.5: 0.1: 0.9]. The performance of the proposed framework used on YOLOV3 and Mask-RCNN is shown in the figure. It can be seen from Figure 11a that although IOU has been improved, our method achieves less AP loss on Mask RCNN compared to the original Mask RCNN, which proves that the bounding boxes detected by our method have obtain a higher degree of confidence. Our detection framework on Mask-RCNN performed better than the other trained network. The difference is most evident for the higher IoU on the two datasets.
Our results indicate excellent performance when compared to the highest possible AP values obtained from other detectors.
The ChangGuang dataset displayed less performance variation compared to that of the SSDD. The object size of the ChangGuang dataset is larger than that of the SSDD dataset. Therefore, the performance difference was not similar to that of the ChangGuang dataset when we compared the original detector and our method on the SSDD dataset. To conclude, training our new architecture in an end-to-end manner displayed an improvement for both the datasets.

4.2.4. Precision versus Recall

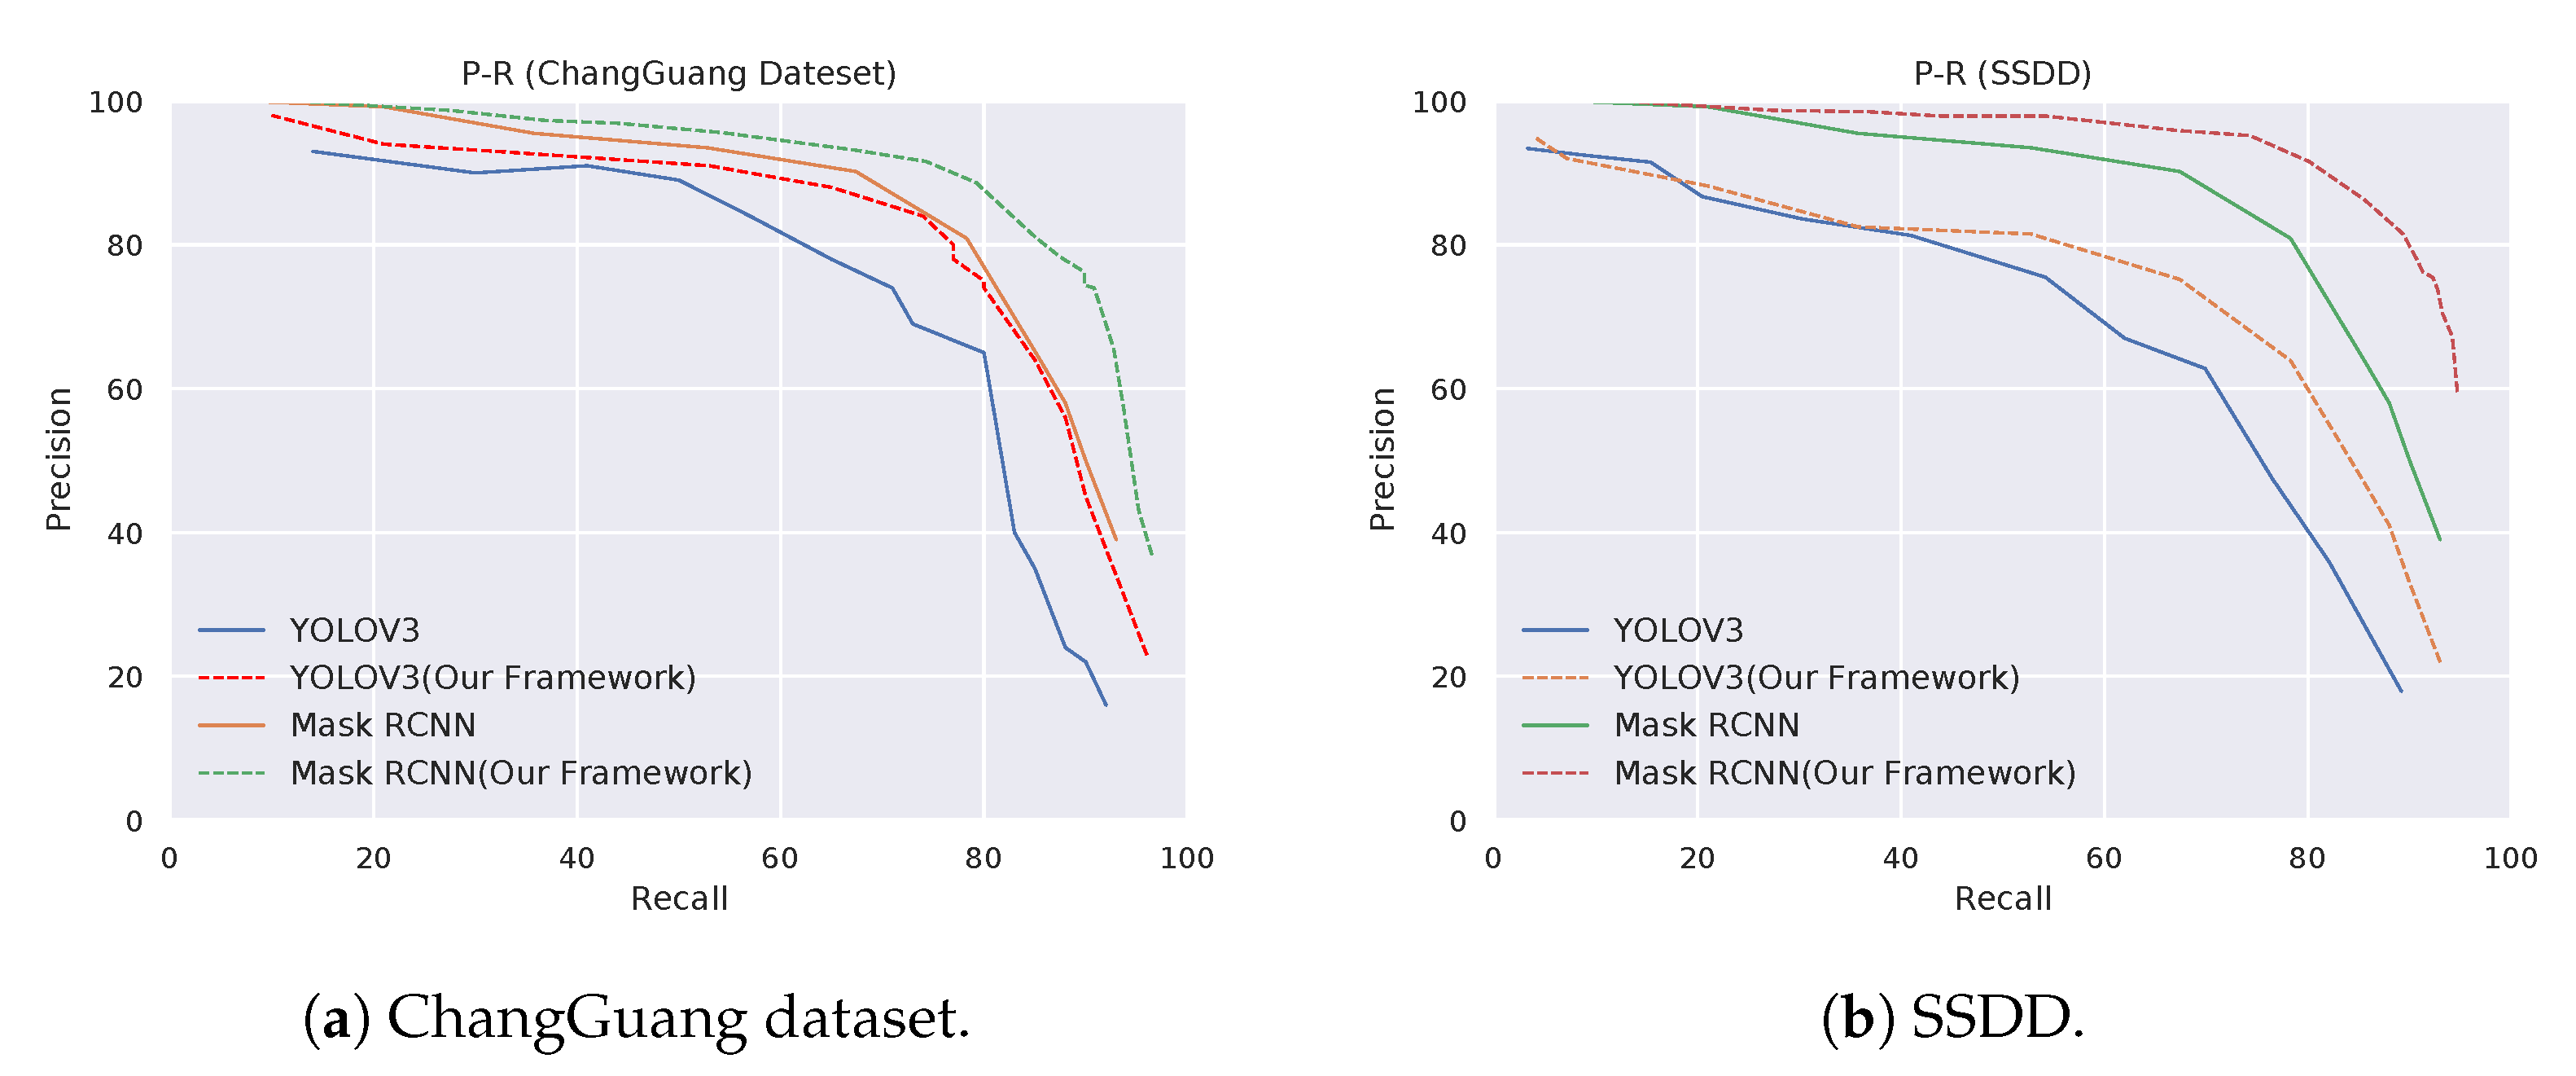
In Figure 12, precision–recall curves are shown for both of our datasets. For each dataset, we plotted the curves for contrast algorithms and our detection framework. We used IoU = 0.5 to calculate precision and recall.
The precision–recall curves for both datasets show that our method has higher precision values and higher recall values than the contrast algorithms. Our detection framework with Mask-RCNN performed better than other models. In particular, the end-to-end models detected more than 80% of the ship with 87% AP in the ChangGuang dataset. For the SSDD dataset, our detection framework detected more than 81% of the ship with 92% AP.

5. Conclusions

In this paper, based on satellite-oriented ship detection task as our basic goal, as well as the characterization of ship datasets, a network framework for ship detection based on remote sensing images is proposed, and three modules, OCIE, DFR, and RFE, are designed. Regarding the problem of the ship target and the background being difficult to distinguish, the FCN-based image enhancement method is used to improve the target contrast, and it is compared with the traditional method as a data augmentation method. Based on the sensitivity of the task to the position information in the target detection and for the problem of imbalanced sample scales in the dataset, we propose using an dense feature reuse (DFR) module in place of the residual block to reduce the loss of position information caused by downsampling. In addition, the idea of multi-scaling is introduced, and the receptive field expansion (RFE) module is designed to integrate a combination of FPN and ASPP in order to improve the detection effect on targets of different scales. Experiments were conducted on open-source SAR datasets and self-made optical datasets. Finally, through the combination of the above modules, maximum improvements in AP of 6.21 and 4.63% were achieved on the optical and SAR datasets, respectively.

Author Contributions

Conceptualization and funding acquisition, L.T.; Methodology, L.T. and B.H.; Writing-original draft, Y.C., B.H. and L.T.; Soft, Y.Z.; Project administration, C.H. and D.L.; Writing-review and editing, B.H. and Y.C. All authors have read and agreed to the published version of the manuscript.

Funding

This research was funded by the National Natural Science Foundation of China (No. 41371342 and No. 61331016).

Conflicts of Interest

The authors declare no conflict of interest.

References

  1. Colomina, I.; Molina, P. Unmanned aerial systems for photogrammetry and remote sensing: A review. ISPRS J. Photogramm. Remote Sens. 2014, 92, 79–97. [Google Scholar] [CrossRef] [Green Version]
  2. Fromm, M.; Schubert, M.; Castilla, G.; Linke, J.; McDermid, G. Automated Detection of Conifer Seedlings in Drone Imagery Using Convolutional Neural Networks. Remote Sens. 2019, 11, 2585. [Google Scholar] [CrossRef] [Green Version]
  3. Cheng, G.; Han, J. A survey on object detection in optical remote sensing images. ISPRS J. Photogramm. Remote Sens. 2016, 117, 11–28. [Google Scholar] [CrossRef] [Green Version]
  4. Svatonova, H. Analysis of Visual Interpretation of Satellite Data. Int. Arch. Photogramm. Remote Sens. Spat. Inf. Sci. 2016, 41. [Google Scholar] [CrossRef]
  5. Chang, Y.L.; Anagaw, A.; Chang, L.; Wang, Y.C.; Hsiao, C.Y.; Lee, W.H. Ship detection based on YOLOv2 for SAR imagery. Remote Sens. 2019, 11, 786. [Google Scholar] [CrossRef] [Green Version]
  6. Girshick, R.; Donahue, J.; Darrell, T.; Malik, J. Rich feature hierarchies for accurate object detection and semantic segmentation. In Proceedings of the IEEE Conference on Computer Vision and Pattern Recognition, Columbus, OH, USA, 23–28 June 2014; pp. 580–587. [Google Scholar]
  7. Tayara, H.; Chong, K.T. Object detection in very high-resolution aerial images using one-stage densely connected feature pyramid network. Sensors 2018, 18, 3341. [Google Scholar] [CrossRef] [Green Version]
  8. Liu, W.; Anguelov, D.; Erhan, D.; Szegedy, C.; Reed, S.; Fu, C.Y.; Berg, A.C. Ssd: Single shot multibox detector. In Proceedings of the European Conference on Computer Vision, Amsterdam, The Netherlands, 11–14 October 2016; Springer: Cham, Switzerland, 2016; pp. 21–37. [Google Scholar]
  9. Redmon, J.; Divvala, S.; Girshick, R.; Farhadi, A. You only look once: Unified, real-time object detection. In Proceedings of the IEEE Conference on Computer Vision and Pattern Recognition, Las Vegas, NV, USA, 27–30 June 2016; pp. 779–788. [Google Scholar]
  10. Redmon, J.; Farhadi, A. YOLO9000: Better, faster, stronger. In Proceedings of the IEEE Conference on Computer Vision and Pattern Recognition, Honolulu, HI, USA, 21–26 July 2017; pp. 7263–7271. [Google Scholar]
  11. Redmon, J.; Farhadi, A. Yolov3: An incremental improvement. arXiv 2018, arXiv:1804.02767. [Google Scholar]
  12. Lin, T.Y.; Goyal, P.; Girshick, R.; He, K.; Dollár, P. Focal loss for dense object detection. In Proceedings of the IEEE International Conference on Computer Vision, Venice, Italy, 22–29 October 2017; pp. 2980–2988. [Google Scholar]
  13. Girshick, R. Fast r-cnn. In Proceedings of the IEEE International Conference on Computer Vision, Santiago, Chile, 7–13 December 2015; pp. 1440–1448. [Google Scholar]
  14. Ren, S.; He, K.; Girshick, R.; Sun, J. Faster r-cnn: Towards real-time object detection with region proposal networks. IEEE Trans. Pattern Anal. Mach. Intell. 2016, 39, 1137–1149. [Google Scholar] [CrossRef] [Green Version]
  15. Lin, T.Y.; Dollár, P.; Girshick, R.; He, K.; Hariharan, B.; Belongie, S. Feature pyramid networks for object detection. In Proceedings of the IEEE Conference on Computer Vision and Pattern Recognition, Honolulu, HI, USA, 21–26 July 2017; pp. 2117–2125. [Google Scholar]
  16. Liu, S.; Huang, D. Receptive field block net for accurate and fast object detection. In Proceedings of the European Conference on Computer Vision (ECCV), Munich, Germany, 8–14 September 2018; pp. 385–400. [Google Scholar]
  17. Li, Z.; Zhou, F. FSSD: Feature fusion single shot multibox detector. arXiv 2017, arXiv:1712.00960. [Google Scholar]
  18. Zhu, R.; Zhang, S.; Wang, X.; Wen, L.; Shi, H.; Bo, L.; Mei, T. ScratchDet: Training single-shot object detectors from scratch. In Proceedings of the IEEE Conference on Computer Vision and Pattern Recognition, Long Beach, CA, USA, 15–20 June 2019; pp. 2268–2277. [Google Scholar]
  19. Zhang, S.; Wen, L.; Bian, X.; Lei, Z.; Li, S.Z. Single-shot refinement neural network for object detection. In Proceedings of the IEEE Conference on Computer Vision and Pattern Recognition, Salt Lake City, UT, USA, 18–23 June 2018; pp. 4203–4212. [Google Scholar]
  20. Yang, X.; Sun, H.; Fu, K.; Yang, J.; Sun, X.; Yan, M.; Guo, Z. Automatic ship detection in remote sensing images from google earth of complex scenes based on multiscale rotation dense feature pyramid networks. Remote Sens. 2018, 10, 132. [Google Scholar] [CrossRef] [Green Version]
  21. Chen, Z.; Zhang, T.; Ouyang, C. End-to-end airplane detection using transfer learning in remote sensing images. Remote Sens. 2018, 10, 139. [Google Scholar] [CrossRef] [Green Version]
  22. Ji, H.; Gao, Z.; Mei, T.; Ramesh, B. Vehicle detection in remote sensing images leveraging on simultaneous super-resolution. IEEE Geosci. Remote Sens. Lett. 2019, 17, 676–680. [Google Scholar] [CrossRef]
  23. Li, Q.; Mou, L.; Xu, Q.; Zhang, Y.; Zhu, X.X. R3-net: A deep network for multi-oriented vehicle detection in aerial images and videos. arXiv 2018, arXiv:1808.05560. [Google Scholar]
  24. Ammour, N.; Alhichri, H.; Bazi, Y.; Benjdira, B.; Alajlan, N.; Zuair, M. Deep learning approach for car detection in UAV imagery. Remote Sens. 2017, 9, 312. [Google Scholar] [CrossRef] [Green Version]
  25. Tang, T.; Zhou, S.; Deng, Z.; Zou, H.; Lei, L. Vehicle detection in aerial images based on region convolutional neural networks and hard negative example mining. Sensors 2017, 17, 336. [Google Scholar] [CrossRef] [Green Version]
  26. Ren, Y.; Zhu, C.; Xiao, S. Small object detection in optical remote sensing images via modified faster R-CNN. Appl. Sci. 2018, 8, 813. [Google Scholar] [CrossRef] [Green Version]
  27. Li, W.; Fu, H.; Yu, L.; Cracknell, A. Deep learning based oil palm tree detection and counting for high-resolution remote sensing images. Remote Sens. 2017, 9, 22. [Google Scholar] [CrossRef] [Green Version]
  28. Zhao, Z.Q.; Zheng, P.; Xu, S.T.; Wu, X. Object detection with deep learning: A review. IEEE Trans. Neural Netw. Learn. Syst. 2019, 30, 3212–3232. [Google Scholar] [CrossRef] [Green Version]
  29. Li, K.; Wan, G.; Cheng, G.; Meng, L.; Han, J. Object detection in optical remote sensing images: A survey and a new benchmark. ISPRS J. Photogramm. Remote Sens. 2020, 159, 296–307. [Google Scholar] [CrossRef]
  30. Goodfellow, I.J.; Pouget-Abadie, J.; Mirza, M.; Xu, B.; Warde-Farley, D.; Ozair, S.; Courville, A.; Bengio, Y. Generative adversarial networks. arXiv 2014, arXiv:1406.2661. [Google Scholar] [CrossRef]
  31. Ignatov, A.; Kobyshev, N.; Timofte, R.; Vanhoey, K.; Van Gool, L. Dslr-quality photos on mobile devices with deep convolutional networks. In Proceedings of the IEEE International Conference on Computer Vision, Venice, Italy, 22–29 October 2017; pp. 3277–3285. [Google Scholar]
  32. Pizer, S.M.; Amburn, E.P.; Austin, J.D.; Cromartie, R.; Geselowitz, A.; Greer, T.; ter Haar Romeny, B.; Zimmerman, J.B.; Zuiderveld, K. Adaptive histogram equalization and its variations. Comput. Vis. Graph. Image Process. 1987, 39, 355–368. [Google Scholar] [CrossRef]
  33. Farid, H. Blind inverse gamma correction. IEEE Trans. Image Process. 2001, 10, 1428–1433. [Google Scholar] [CrossRef] [PubMed]
  34. Ignatov, A.; Kobyshev, N.; Timofte, R.; Vanhoey, K.; Van Gool, L. Wespe: Weakly supervised photo enhancer for digital cameras. In Proceedings of the IEEE Conference on Computer Vision and Pattern Recognition Workshops, Salt Lake City, UT, USA, 18–22 June 2018; pp. 691–700. [Google Scholar]
  35. Chen, Y.S.; Wang, Y.C.; Kao, M.H.; Chuang, Y.Y. Deep photo enhancer: Unpaired learning for image enhancement from photographs with gans. In Proceedings of the IEEE Conference on Computer Vision and Pattern Recognition, Salt Lake City, UT, USA, 18–23 June 2018; pp. 6306–6314. [Google Scholar]
  36. Sharma, V.; Diba, A.; Neven, D.; Brown, M.S.; Van Gool, L.; Stiefelhagen, R. Classification-driven dynamic image enhancement. In Proceedings of the IEEE Conference on Computer Vision and Pattern Recognition, Salt Lake City, UT, USA, 18–23 June 2018; pp. 4033–4041. [Google Scholar]
  37. Zhu, J.Y.; Park, T.; Isola, P.; Efros, A.A. Unpaired image-to-image translation using cycle-consistent adversarial networks. In Proceedings of the IEEE International Conference on Computer Vision, Venice, Italy, 22–29 October 2017; pp. 2223–2232. [Google Scholar]
  38. Kim, T.; Cha, M.; Kim, H.; Lee, J.K.; Kim, J. Learning to discover cross-domain relations with generative adversarial networks. In Proceedings of the International Conference on Machine Learning (PMLR 2017), Sydney, Australia, 6–11 August 2017; pp. 1857–1865. [Google Scholar]
  39. Yi, Z.; Zhang, H.; Tan, P.; Gong, M. Dualgan: Unsupervised dual learning for image-to-image translation. In Proceedings of the IEEE International Conference on Computer Vision, Venice, Italy, 22–29 October 2017; pp. 2849–2857. [Google Scholar]
  40. Liu, M.Y.; Tuzel, O. Coupled generative adversarial networks. arXiv 2016, arXiv:1606.07536. [Google Scholar]
  41. He, K.; Zhang, X.; Ren, S.; Sun, J. Deep residual learning for image recognition. In Proceedings of the IEEE Conference on Computer Vision and Pattern Recognition, Las Vegas, NV, USA, 27–30 June 2016; pp. 770–778. [Google Scholar]
  42. Huang, G.; Sun, Y.; Liu, Z.; Sedra, D.; Weinberger, K.Q. Deep networks with stochastic depth. In Proceedings of the European Conference on Computer Vision, Amsterdam, The Netherlands, 11–14 October 2016; Springer: Berlin/Heidelberg, Germany, 2016; pp. 646–661. [Google Scholar]
  43. Srivastava, R.K.; Greff, K.; Schmidhuber, J. Highway networks. arXiv 2015, arXiv:1505.00387. [Google Scholar]
  44. Ioffe, S.; Szegedy, C. Batch normalization: Accelerating deep network training by reducing internal covariate shift. In Proceedings of the International Conference on Machine Learning, PMLR, Lille, France, 7–9 July 2015; pp. 448–456. [Google Scholar]
  45. Glorot, X.; Bordes, A.; Bengio, Y. Deep sparse rectifier neural networks. In Proceedings of the Fourteenth International Conference on Artificial Intelligence and Statistics, JMLR Workshop and Conference Proceedings, Fort Lauderdale, FL, USA, 11–13 April 2011; pp. 315–323. [Google Scholar]
  46. Li, J.; Qu, C.; Shao, J. Ship detection in SAR images based on an improved faster R-CNN. In Proceedings of the 2017 SAR in Big Data Era: Models, Methods and Applications (BIGSARDATA), Beijing, China, 13–14 November 2017; pp. 1–6. [Google Scholar]
  47. He, K.; Gkioxari, G.; Dollár, P.; Girshick, R. Mask r-cnn. In Proceedings of the IEEE International Conference on Computer Vision, Venice, Italy, 22–29 October 2017; pp. 2961–2969. [Google Scholar]
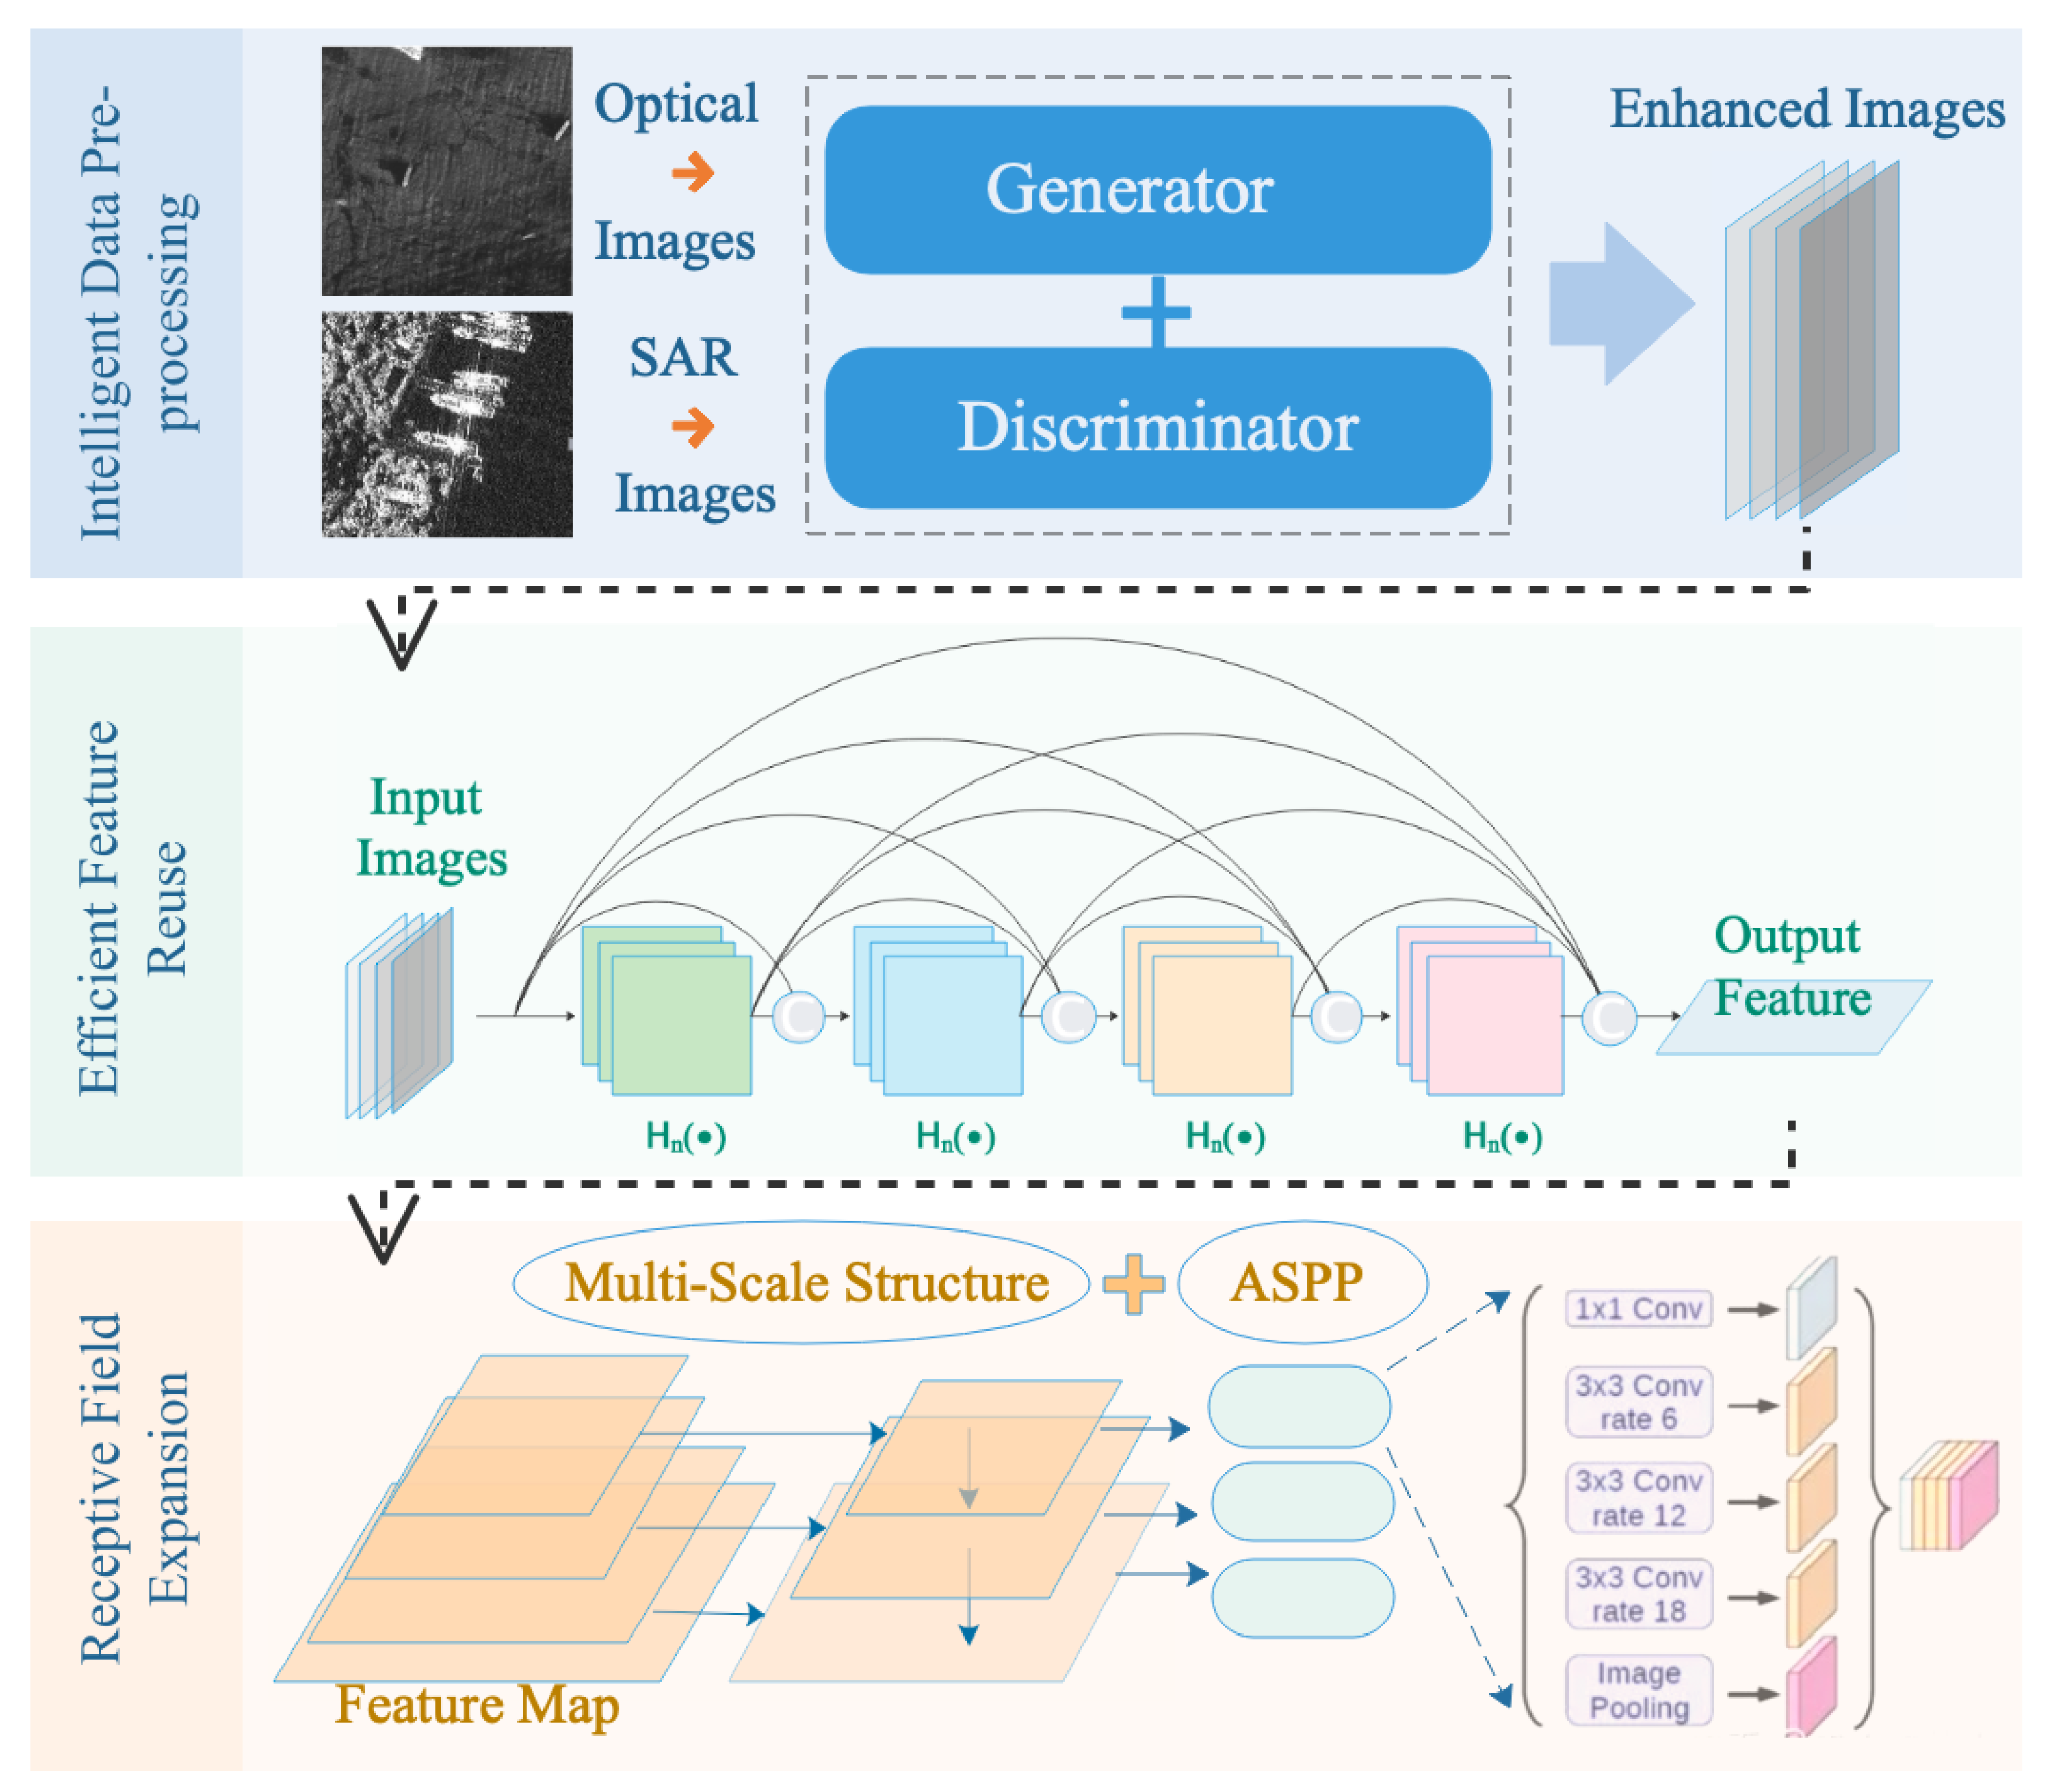
Figure 1. Framework of the proposed algorithm for ship target detection in remote sensing imagery (RSI).
Remotesensing 13 01327 g001
Figure 2. Architectures of the image enhancement network.
Remotesensing 13 01327 g002
Figure 3. Description of dense feature reuse (DFR) module.
Remotesensing 13 01327 g003
Figure 4. Description of the specific implementation of the DFR module.
Remotesensing 13 01327 g004
Figure 5. The atrous spatial pyramid pooling (ASPP) model used in receptive field expansion (RFE) module.
Remotesensing 13 01327 g005
Figure 6. Schematic diagram of the RFE module.
Remotesensing 13 01327 g006
Figure 7. Examples of different scenarios in the ChangGuang dataset. (a) Ocean wave scene, (b) cloud and fog scene, (c) nearshore scene, (d) scenes with different target scales.
Remotesensing 13 01327 g007
Figure 8. Some samples from SSDD. (a) Simple background, (b) complex background, (c) nearshore targets.
Remotesensing 13 01327 g008
Figure 9. Some output results of the OCIE module. (a) is the dark target selected in the Changguang dataset, (c) is the cloudy scene, (b,d) respectively correspond to the output of these two samples through the OCIE module, in which the target is effectively enhanced.
Remotesensing 13 01327 g009
Figure 10. Some of the detection results obtained by the proposed overall framework on Mask RCNN.
Remotesensing 13 01327 g010
Figure 11. Average precision–intersection over union (AP–IoU) curves for the two datasets. Plotted results show the detection performance of our detection framework and some representative detection methods.
Remotesensing 13 01327 g011
Figure 12. Precision–recall curve for the datasets. Plotted results show the detection performance of our detection framework.
Remotesensing 13 01327 g012
Table 1. Experimental results of the object characteristic-driven image enhancement (OCIE) module on the ChangGuang dataset and SSDD.
AlgorithmChangGuang DatasetSSDD
AP (%)AR (%)AP (%)AR (%)
YOLOV374.07%76.34%67.01%66.40%
YOLOV3 (OCIE)75.11%77.43%68.52%68.15%
Mask-RCNN81.18%77.27%87.46%79.18%
Mask-RCNN (OCIE)84.29%78.04%90.13%80.44%
Table 2. Experimental results of the DFR module on the ChangGuang dataset and SSDD.
AlgorithmChangGuang DatasetSSDD
AP (%)AR (%)AP (%)AR (%)
YOLOV3 (OCIE)75.11%77.43%68.52%68.15%
YOLOV3 (OCIE-DFR)76.29%77.95%69.44%68.83%
Mask-RCNN (OCIE)84.29%78.04%90.13%80.44%
Mask-RCNN (OCIE-DFR)86.58%79.80%91.35%82.08%
Table 3. The parameters and GFLOPs of the proposed method. We use input feature map of size [1 × 1800 × 800] to evaluate their complexity during inference. All the number are the smaller the better.
Algorithm#ParamsGFLOPs
YOLOV341.95 M195.55
YOLOV3 (Our Framework)38.17 M181.69
Mask-RCNN44.17 M253.37
Mask-RCNN (Our Framework)40.03 M197.45
Table 4. Experimental results of the overall detection framework on the ChangGuang dataset and SSDD.
AlgorithmChangGuang DatasetSSDD
AP (%)AR (%)AP (%)AR (%)
CornerNet63.61%70.25%74.31%66.70%
FCOS74.10%79.93%84.74%76.30%
Faster CNN79.27%77.34%85.94%78.36%
Cascade RCNN79.11%79.95%87.10%78.93%
YOLOv3-tiny70.46%71.85%64.04%66.23%
YOLOV374.07%76.34%67.01%66.40%
YOLOV3 (OCIE)75.11%77.43%68.52%68.15%
YOLOV3 (OCIE-DFR)76.29%77.95%69.44%68.83%
YOLOV3 (OCIE-DFR-RFE)79.32%78.86%69.84%69.71%
Mask-RCNN81.18%77.27%87.46%79.18%
Mask-RCNN (OCIE)84.29%78.04%90.13%80.44%
Mask-RCNN (OCIE-DFR)86.58%79.80%91.35%82.08%
Mask-RCNN (OCIE-DFR-RFE)87.39%80.56%92.09%82.25%
Publisher’s Note: MDPI stays neutral with regard to jurisdictional claims in published maps and institutional affiliations.