Article

Self-Adaptive Aspect Ratio Anchor for Oriented Object Detection in Remote Sensing Images

School of Computer and Communication Engineering, University of Science and Technology Beijing, Beijing 100083, China
*
Author to whom correspondence should be addressed.
Remote Sens. 2021, 13(7), 1318; https://doi.org/10.3390/rs13071318
Submission received: 25 February 2021 / Revised: 23 March 2021 / Accepted: 26 March 2021 / Published: 30 March 2021
(This article belongs to the Section Remote Sensing Image Processing)

Abstract

:
Object detection is a significant and challenging problem in the study of remote sensing. Since remote sensing images are typically captured with a bird’s-eye view, the aspect ratios of objects in the same category may obey a Gaussian distribution. Generally, existing object detection methods ignore exploring the distribution character of aspect ratios for improving performance in remote sensing tasks. In this paper, we propose a novel Self-Adaptive Aspect Ratio Anchor (SARA) to explicitly explore aspect ratio variations of objects in remote sensing images. To be concrete, our SARA can self-adaptively learn an appropriate aspect ratio for each category. In this way, we can only utilize a simple squared anchor (related to the strides of feature maps in Feature Pyramid Networks) to regress objects in various aspect ratios. Finally, we adopt an Oriented Box Decoder (OBD) to align the feature maps and encode the orientation information of oriented objects. Our method achieves a promising mAP value of 79.91% on the DOTA dataset.

Graphical Abstract

1. Introduction

In recent years, with the developing of spaceborne sensors, the resolution of remote sensing images has greatly increased. This provides us a lot of high remote sensing images for researching and understanding. Object (i.e., plane, baseball diamond, bridge) detection in remote sensing images has become a hot research topic, and it is widely used in many applications, such as urban planning, ship detection, traffic controlling, and resource discovery [1,2].
Most of the existing object detection methods for remote sensing images are upon the popular methods designed for natural scene images. However, objects in remote sensing images (typically taken with a bird’s-eye view) are quite different from objects in natural scene images [3] and are facing the following challenges [1,3,4,5,6,7,8,9]:
  • Arbitrary orientations: Objects in natural scenes are observed from the horizontal view and annotated in horizontal bounding boxes (HBBs). However, objects in remote sensing images can appear in arbitrary orientations and are generally annotated in oriented bounding boxes (OBBs).
  • Background complexity: The complex background in remote sensing images often contains noise or uninteresting objects which may lead to false positives.
  • Scale variations: Due to the resolutions of spaceborne sensors are not completely consistent, the ground sample distance (GSD) (the physical size of one image pixel in meters, i.e. meter per pixel) of images is often in variation. Thus, the scales of the same category of objects, such as vehicles, are often with different number pixels even they are the same type of vehicles. This will cause scale variations in detection.
  • Dense objects: Some objects in remote sensing images are always densely arranged, such as vehicles in parking lots or ships in harbors. It is hard to separate dense and small objects in images.
In general, object detection methods [10,11,12] for natural scenes images contain four parameters dimensions ( [ x , y , w , h ] ), such as Faster R-CNN [13], YOLO V3 [14], RetinaNet [15], etc. However, due to arbitrary orientations, methods for remote sensing images usually utilize five parameters dimensions ( [ x , y , w , h , θ ] ). Thus, most of existing methods for remote sensing images, e.g., RRPN [16], SCRDet [4], S 2 A-Net [17], modified the object detection methods and add the angle dimension. For the background complexity problem, KARNET [18], SCRDet [4], and SCRDet++ [19] utilize attention mechanism to denoise. For scale variations and dense objects problems, enhanced Feature Pyramid Networks (OWSR [20], FFA [21], and RADet [22]) and novel anchor mechanism (A 2 S-Det [23] and DAL [24]) are proposed. The above methods achieve excellent performance in remote sensing images.
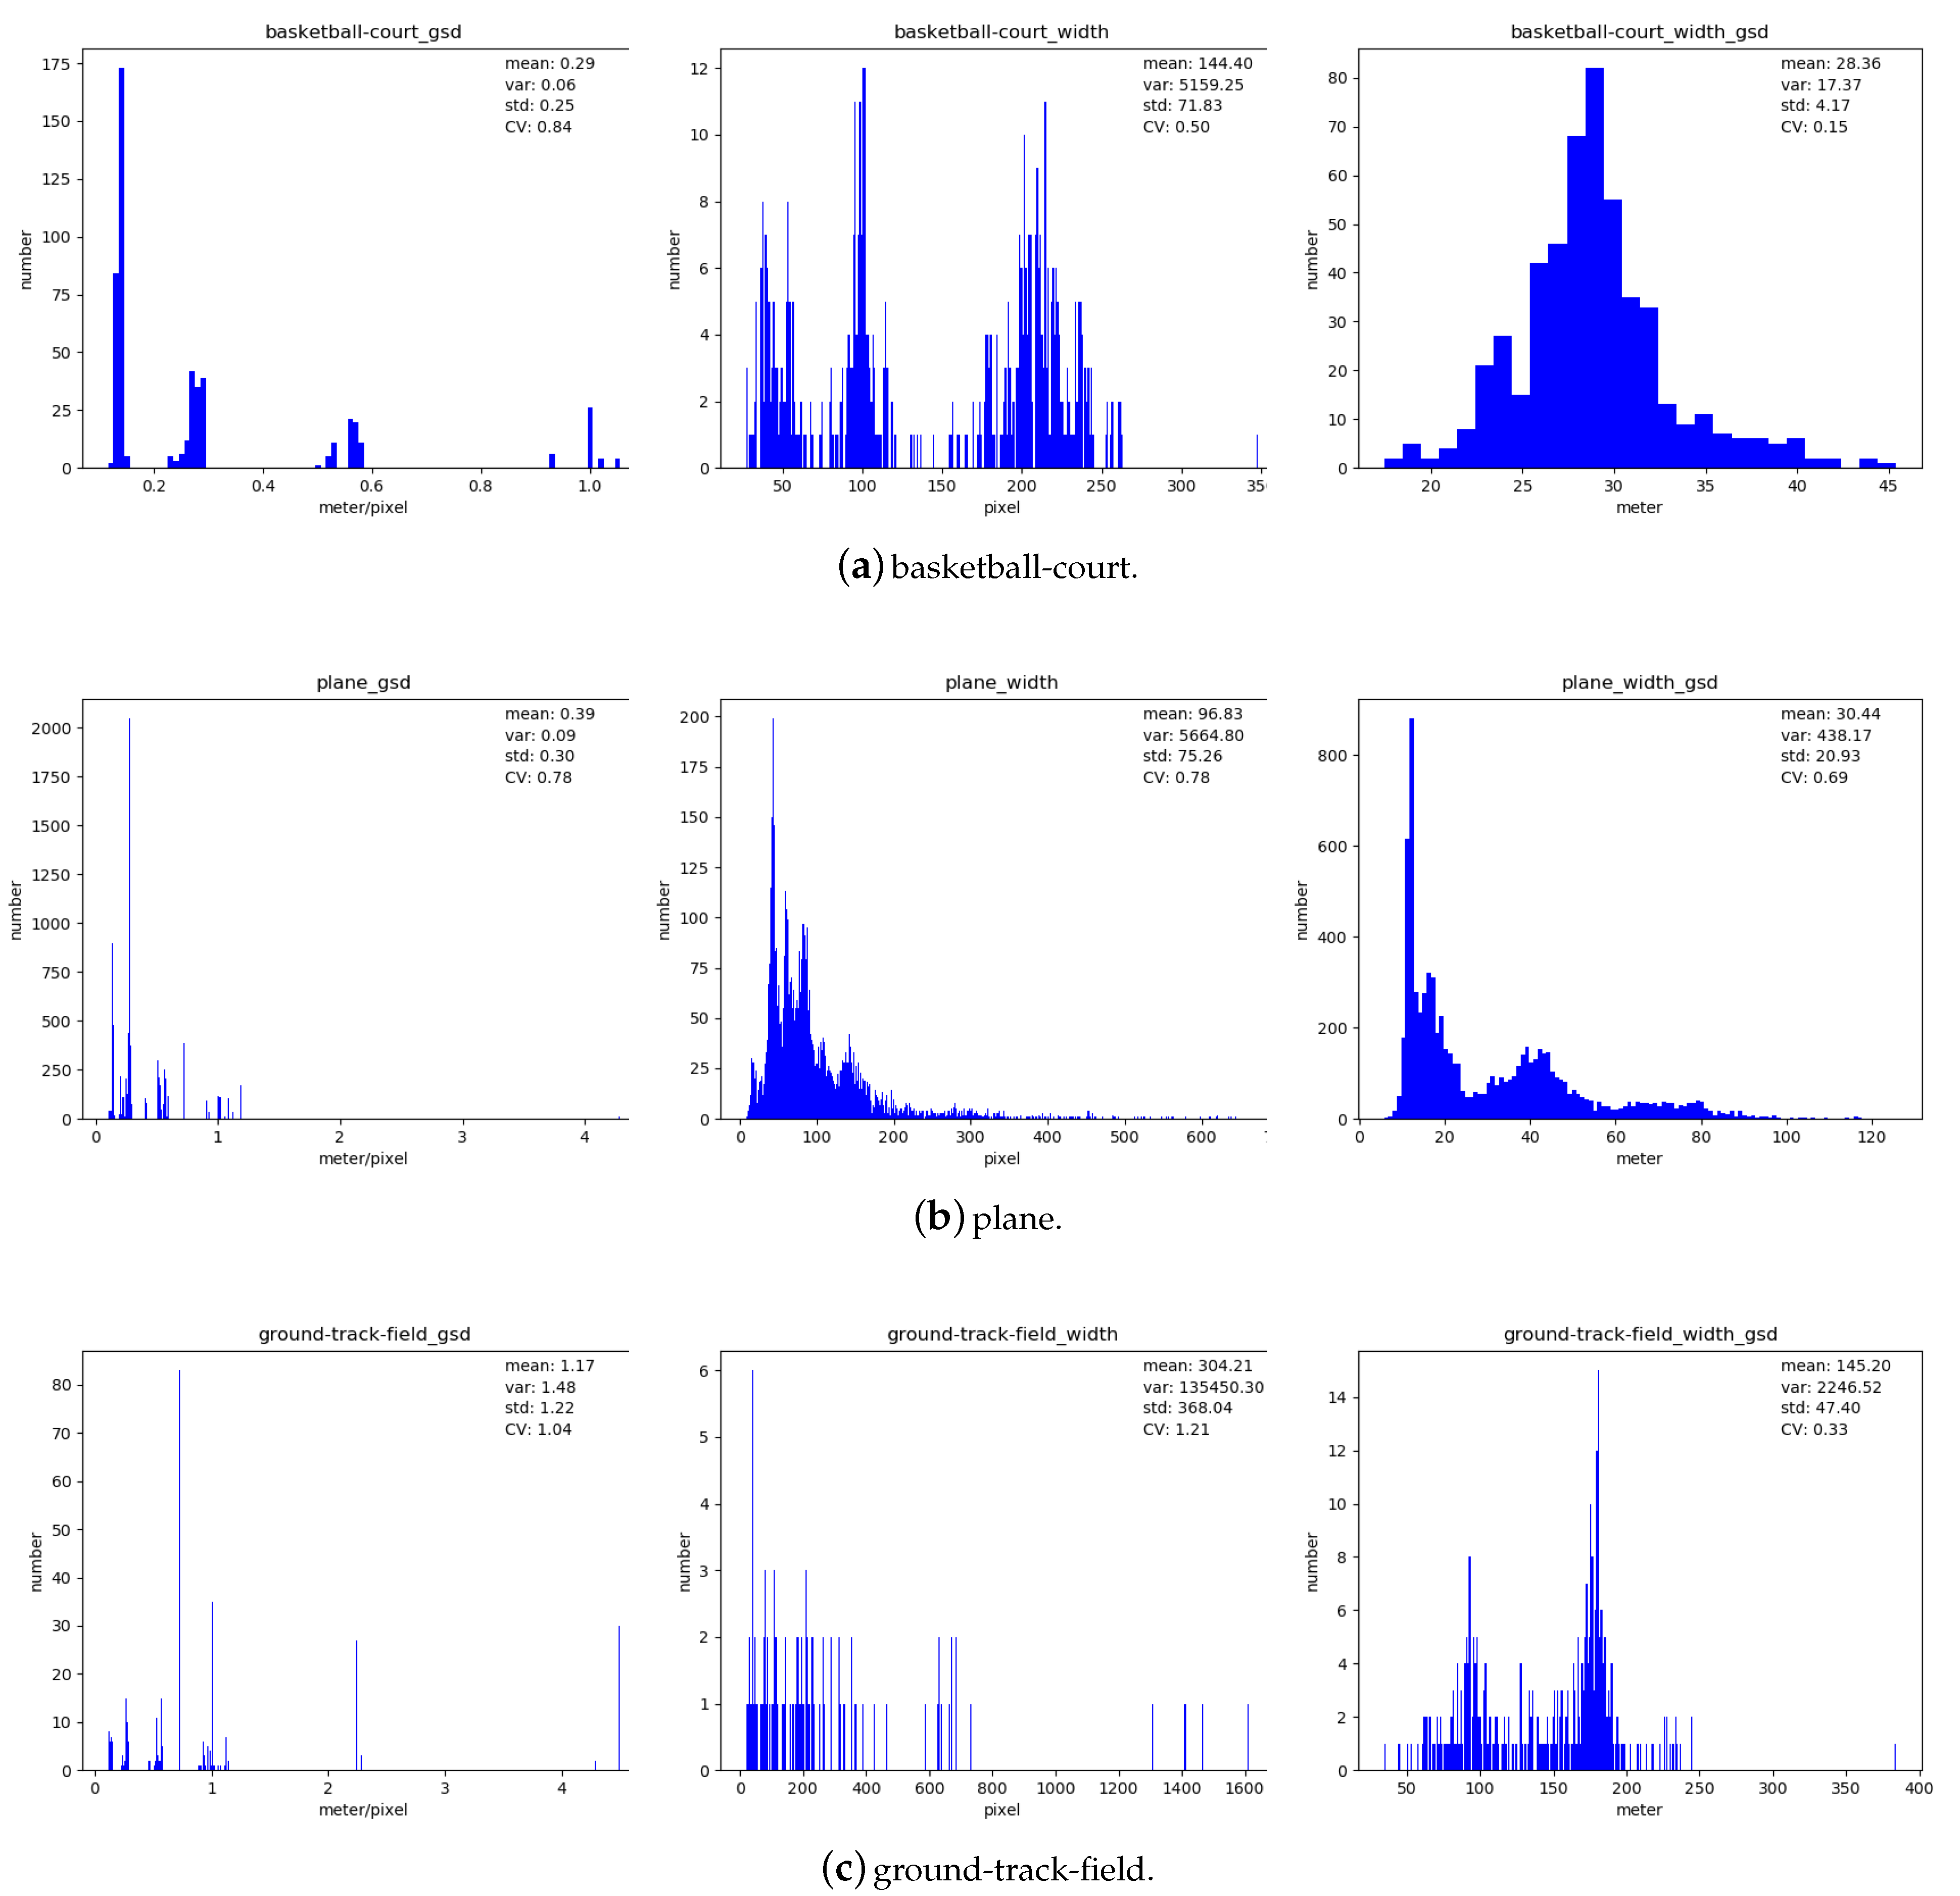
However, most of the existing methods lose sight of the distinguished features of objects in remote sensing images. Objects in natural scene images can be taken 360 around, the aspect ratios will change due to perspective transformation. However, remote sensing images are typically taken with a bird’s-eye view, the aspect ratios of objects in the same category may obey a Gaussian distribution which may be related to its category (as shown in Figure 1f and Figure 2). And as shown in Figure 2 and listed in Table 1, different categories have different aspect ratio distributions. From this key observation, we fit category-wise aspect ratios to benefit the regression of objects in remote sensing images.
Ground sample distance (GSD) is another specific property of remote sensing images; it is one of the causes for scale variations (GSD means how many meters per pixel), and object widths in pixels can be variable (Figure 1d, but could be more cohesive in meters (Figure 1e). GSD of the other two categories are shown in Figure 2, some categories, such as plane and ground-track-field, may still suffer from scale variations in meters, so we focus on aspect ratio and do not lucubrate GSD in this work. Anchor mechanism with several pre-defined ratios is one way to deal with ratio variations, e.g., RRPN [16], utilizes three ratios and totally defines 54 rotated-anchors. But the predefined coefficients may not meet the various shapes of different datasets, and different categories may obey different distributions.
In this paper, we propose a novel framework for oriented object detection in remote sensing images. Our method mainly consists of two components: Self-Adaptive Aspect Ratio Anchor Mechanism (SARA) and Oriented Box Decoder (OBD). We propose a novel Self-Adaptive Aspect Ratio Anchor (SARA) for matching the aspect ratio variations of objects in remote sensing images, which can self-adaptively learn the appropriate aspect ratio for each category (i.e, category-wise aspect ratios). Specifically, SARA learns one aspect ratio value for each category, then utilizes the predicted classification scores as attention weights, i.e., the category-wise aspect ratios multiply by the classification scores, then the weighted sum of them generate the aspect ratio of a given sample. Then, our method can regress the oriented bounding boxes for objects by the reference of aspect ratio and a simple squared anchor (related to the stride of feature maps in Feature Pyramid Networks). In OBD, for better oriented boxes regression, we adopt Alignment Convolution Layer (ACL) [17] and active rotating filters (ARF) [25] to align the feature maps and encode the orientation information, respectively.
  • We propose a novel Self-Adaptive Aspect Ratio Anchor (SARA) for matching the aspect ratio variations of objects in remote sensing images.
  • Our SARA can be Plug-and-Play for methods with anchor-free or simple squared anchor without considering the information of aspect ratio.
  • Our method achieves state-of-the-art on the DOTA dataset.

2. Related Work

2.1. Anchor-Based Methods

An Illustration of anchor-based methods is shown in Figure 3. Faster R-CNN [13] is the first method that introduces the novel “anchor” boxes that serve as references at multiple pre-defined scales and aspect ratios. Anchors enumerate the possible locations and shapes of objects in a sliding-window fashion. A classical anchor can be defined as A = ( x a , y a , w a , h a ) , where x a , y a is the position of anchor’s center point, w a , h a represent the width and height of anchor, respectively. For oriented object detection, rotated anchors [16] A r = ( x a , y a , w a , h a , θ a ) can be adopted for better performance, where θ a denotes the angle of anchor. Anchors are enumerated in each position of feature maps, if the intersection-over-union (IoU) between one sample’s target bounding box and the pre-defined anchor is greater than the threshold, it is assigned as a positive sample, and the regression targets is related to the corresponding anchor. With the help of pre-defined anchors, objects can be classified into different scales and ratios, and the networks can be optimized stably. Anchor-based methods can also be roughly divided into two categories, i.e., one-stage methods and two-stage methods.
Two-stage methods usually utilize Region Proposal Networks (RPN) [13] to generate rough region proposals based on anchors at the first stage, then refines the final predicted boxes through an RoI Pooling layer which resize the cropped feature maps into the same shape. Faster R-CNN [13] is a standard and the first two-stage method. RRPN [16] adds the third dimension angle ( θ ) to anchor, to generate rotated 50 anchors (3 scales, 3 ratios, and 6 angles) for detecting oriented objects. RoITransformer [26] utilizes a learn-able module to transform horizontal RoIs into rotated RoIs, which can avoid a large number of rotated anchors. However, RoITransformer still needs pre-defined horizontal anchors and complex RoI operations. RoITransformer, SCRDet [4], and Azimi et al. [53] are representative methods that mainly focus on the perspective of feature extraction. Mask OBB [6] proposes a mask-oriented bounding box representation, it adopts RoI Align [27] to extract feature maps from proposals, and then it utilizes the segmentation method, i.e., pixel-level classification for detecting oriented objects.
One-stage methods can be regarded as two-stage methods without RoI Pooling, they predict results directly. SSD [11], YOLO [14,28], and RetinaNet [15] are representative one-stage methods, and further improves detection speed. Especially the proposed Focal Loss in RetinaNet [15], which tries to address foreground-background class imbalance problem, and improves the performance of one-stage methods even surpassing the accuracy of two-stage. Focal Loss is still widely used in state-of-the-art detectors. TextBoxes++ [29] is designed for arbitrary-oriented scene text detection, it is modified from SSD and regresses the offsets of the rotated targets to the four points of horizontal anchors. R 3 Det [30] samples features from five locations (center and four corner points) of the corresponding anchor box to balance the trade-off of accuracy and speed.
Anchors are widely utilized in many detectors, however, the design of anchors is complex especially in the rotated object detection task. Two-stage methods need complex RoI operations, which often cost a lot of time, while one-stage methods can balance the trade-off of accuracy and speed by ingenious design, such as Focal Loss.

2.2. Anchor-Free Methods

Due to the complexity of pre-defined anchors, many anchor-free methods have become popular in recent years, they can be roughly divided into three categories: directly regression methods, corner-based methods, and segmentation-based methods.
Directly regression methods usually contain two branches: classification branch and regression branch. The classification branch often adopts Fully Convolutional Networks (FCN) [31] for pixel-wise classification, while the regression branch regresses the offsets of the current position to the four points of rotated or horizontal bounding box directly without anchor references as shown in Figure 4. DenseBox [32] is the first directly regression method for face detection, and it is designed for horizontal bounding box detection. EAST [33] is a popular arbitrary-oriented scene text detection method, it adopts IoU Loss [34] for regressing boxes and regresses an angle for rotated boxes in addition. EAST also designs another regression way, i.e., regress the offset of each positive point to the four points of bounding boxes. DDR [35,36] is another arbitrary-oriented scene text detection method, which is similar to EAST. FCOS [37] proposes a centerness branch to help suppress the low-quality detected bounding boxes and improves the overall performance by a large margin. Zhou et al. [38] utilizes a point to represent one object, which predicts the center point of an object and then regress the width and height of the bounding box. FASF [39] automatically assigns objects into different levels of Feature Pyramid Networks (FPN) [40] rather than based on areas of objects.
Corner-based methods focus on predicting the keypoints of objects. CornerNet [41], CenterNet [42], and ExtremeNet [43] try to predict some key points of objects, such as corners, centers, or extreme points of objects, and then pair them into bounding boxes for detection. There are also some detectors inspired by them for object detection in remote sensing tasks [3,44].
Segmentation-based methods are widely used in arbitrary-oriented scene text detection task. They usually adopt an FCN for foreground/background classification, and try to group target regions by other information, such as embedding. PixelLink [45] learns the eight-neighbors linkage of each pixel and then links pixels into targets through a disjoint-set data structure. TextField [46] predicts the direction field of each point in the text, each direction is the nearest boundary point points to the current text point. Tian et al. [47] utilizes embedding maps to cluster text points into text instances. PSENet [48] shrinks the original target with different scales and then expands the minimal scale kernel to the complete target gradually.

3. Our Method

3.1. Overall Structure

As shown in Figure 5, our method contains two parts: Self-Adaptive Aspect Ratio Anchor Mechanism (SARA) and Oriented Box Decoder (OBD). The SARA can be regarded as a high-quality anchor generator, which products anchor prediction map for the following OBD. The OBD adopts Alignment Convolution Layer (ACL) [17] and Active Rotating Filters (ARF) [25] to align the feature maps and encode the orientation information, respectively. In this way, the feature maps can benefit from the oriented bounding box regression task.

3.2. HBB and OBB

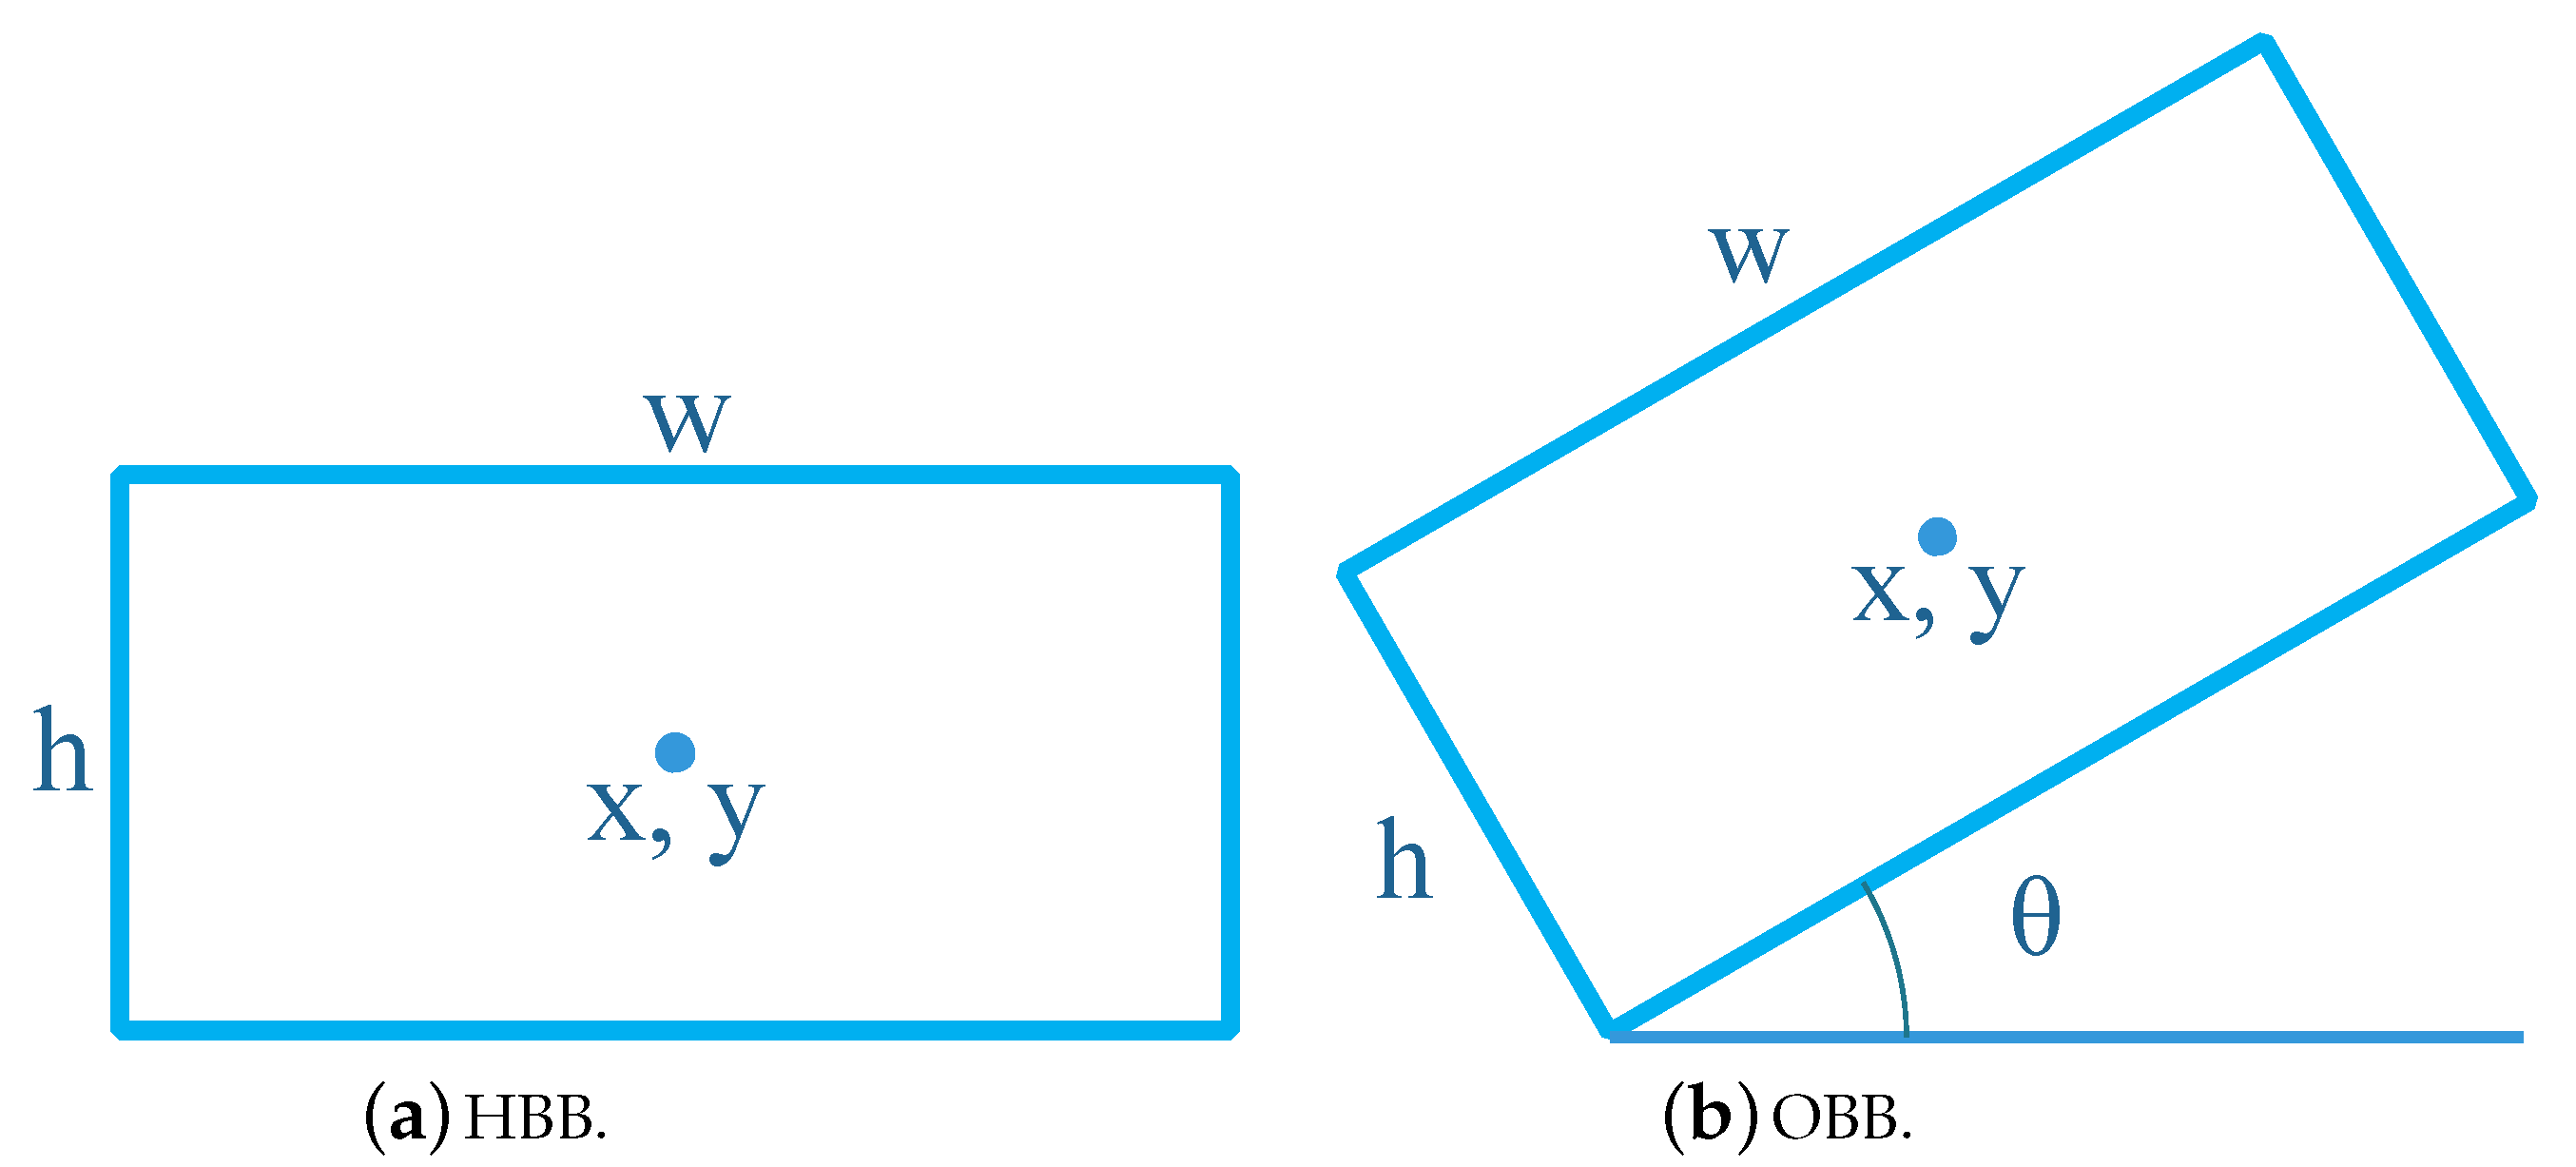
Most of the existing methods for object detection are designed for horizontal bounding boxes (HBB). However, we focus on the oriented bounding boxes (OBB) task of DOTA in this work. As shown in Figure 6a, HBB contains four dimensions ( x , y , w , h ) , which means the center point position ( x , y ) , the width, and the height, respectively. Figure 6b shows that OBB contains five dimensions ( x , y , w , h , θ ) , which means the center point position ( x , y ) , the width (the longest side), the height (the shortest side), and θ denote the angle of OBB. Here, θ [ π 4 , 3 π 4 ] . HBB is a particular case of OBB, i.e., θ = 0.

3.3. Self-Adaptive Aspect Ratio Anchor Mechanism

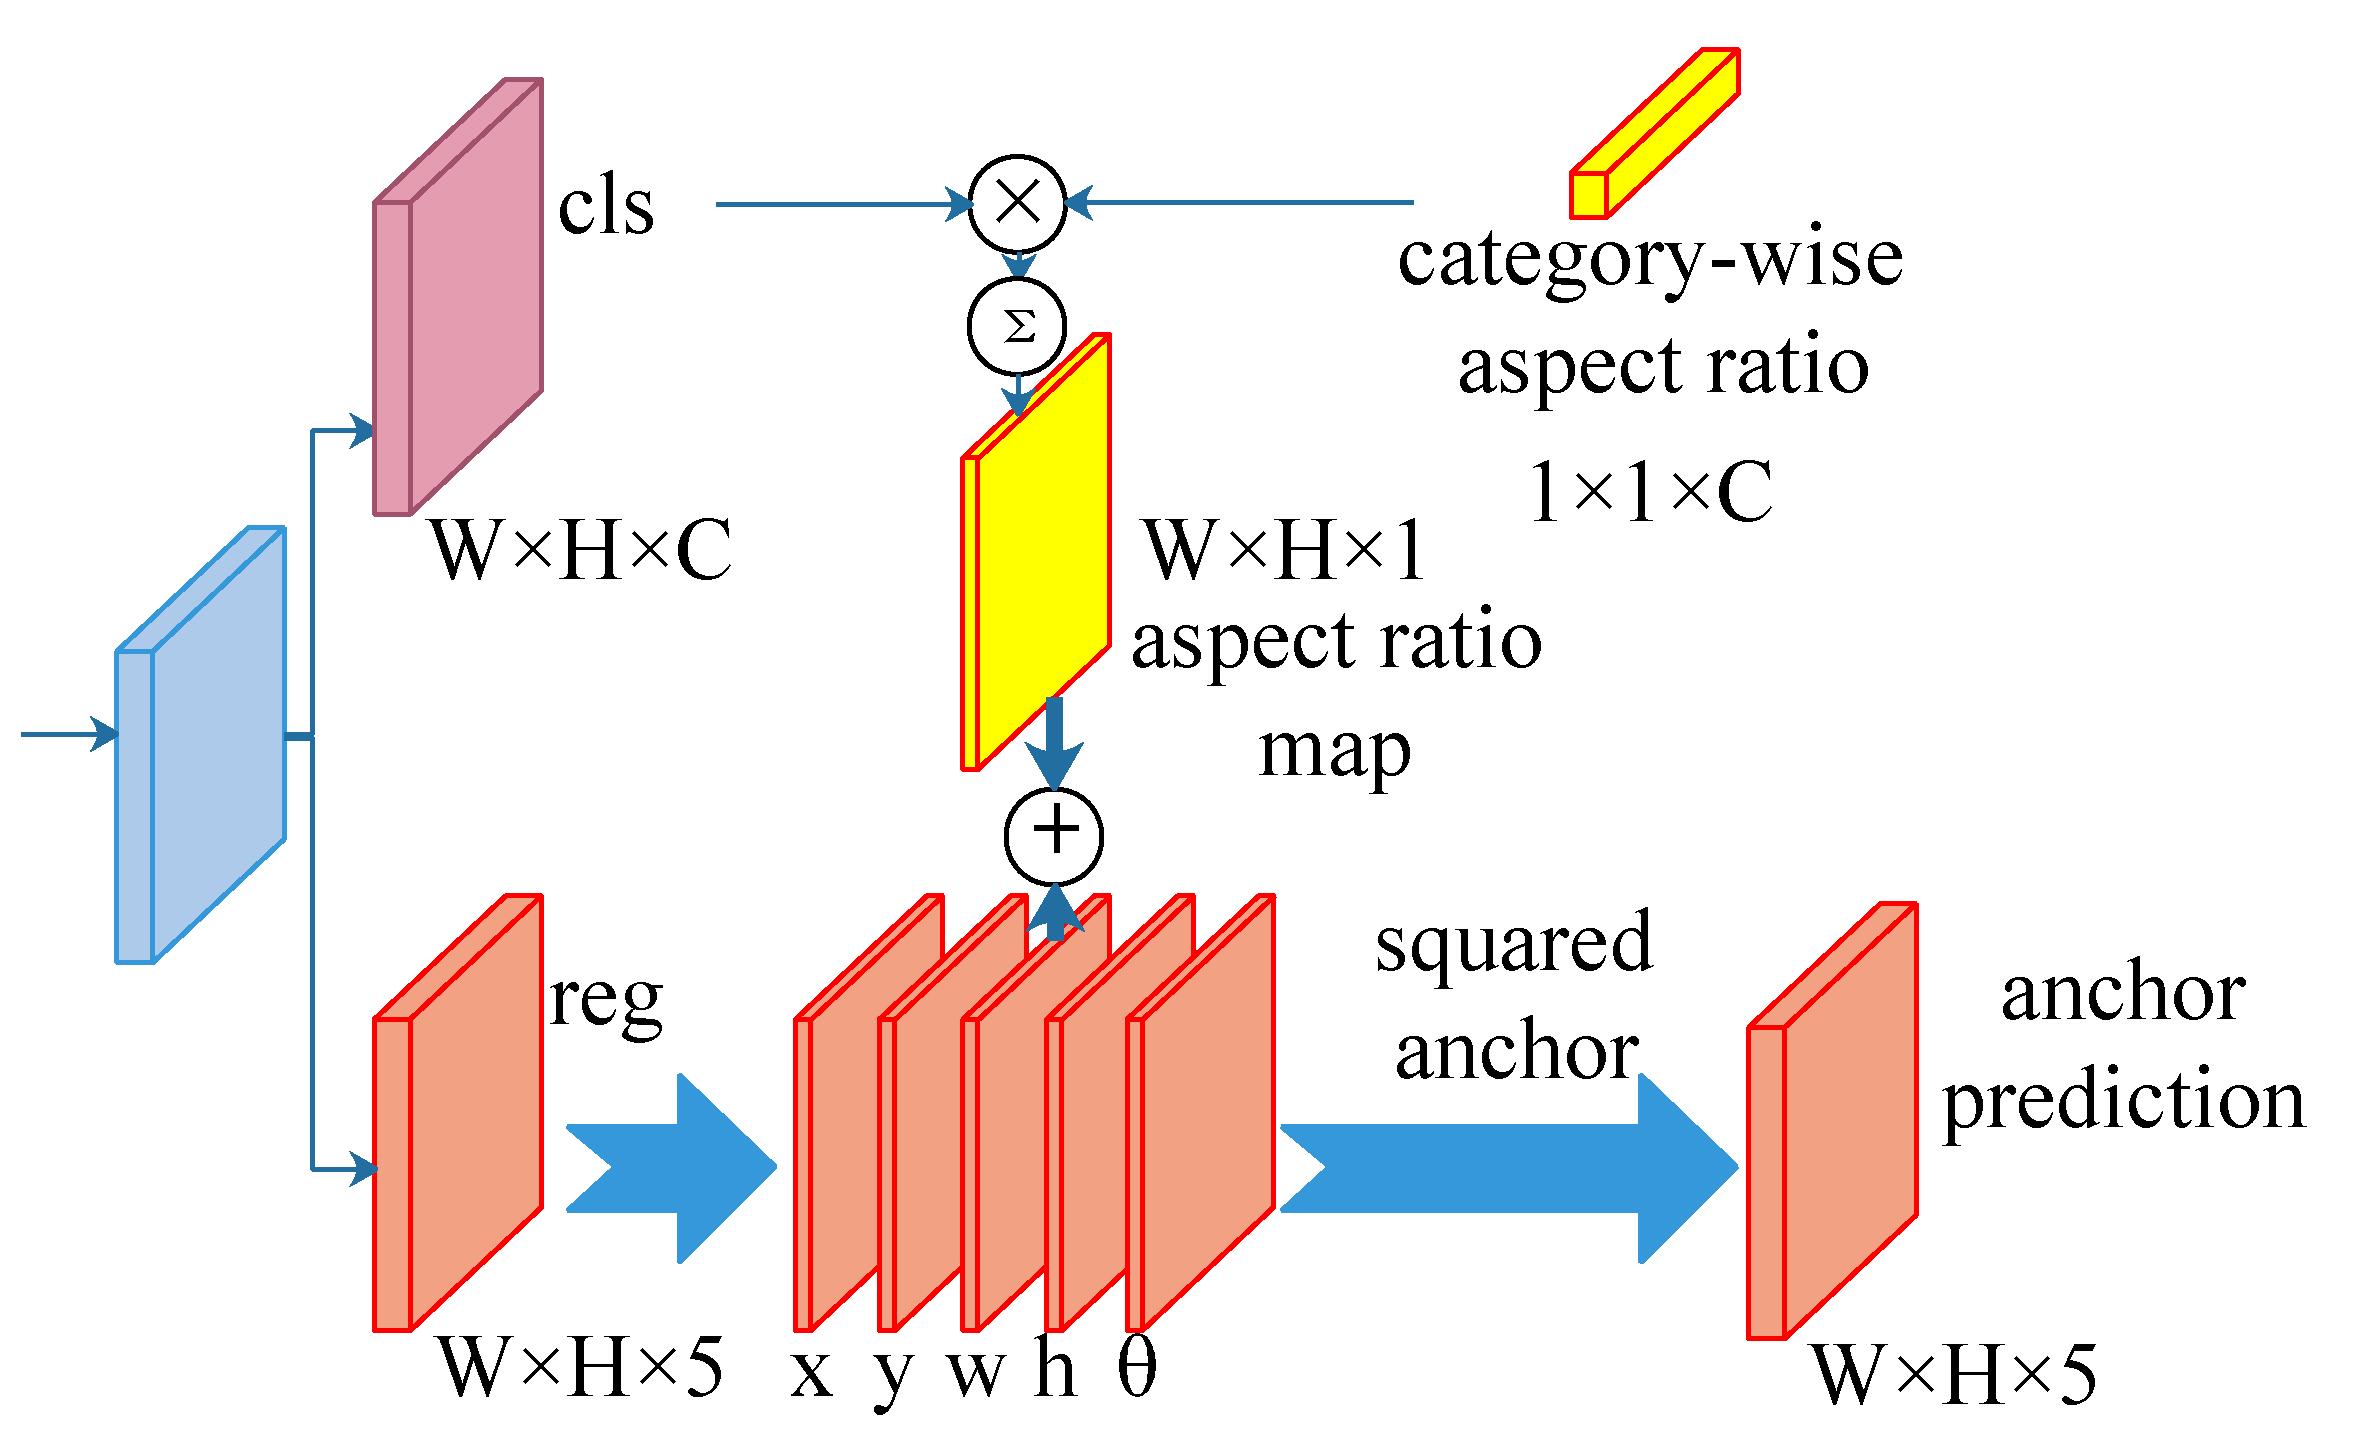
The Self-Adaptive Aspect Ratio Anchor Mechanism (SARA) can be regarded as a high-quality anchor generator. As shown in Figure 7, the inputs of SARA are two branches: classification ( W × H × C ) and regression ( W × H × 5 ). W and H represent the width and height of the feature maps, C means there are C categories. The outputs of SARA are predicted initiatory oriented boxes. In SARA, each category has a self-adaptive aspect ratio value (i.e., category-wise aspect ratios), these category-wise aspect ratios are unsupervised updated with the gradient of the following anchor prediction. Notably, the predicted category-wise aspect ratios of SARA only contribute to the regression reference rather generates real anchors for matching samples. The output anchor predictions for the following OBB are also for regression reference only.
The predicted classification probabilities ( W × H × C ) can be regarded as attention weights for the category-wise aspect ratios. For each position in classification, it has C channels to represent the probabilities of the C categories. The category-wise aspect ratios multiply by the classification probabilities, then the weighted sum of them generate the aspect ratio of a given sample. The predicted aspect ratios of all positions ( W × H × 1 ) compose the aspect ratio map. The regression maps contains 5 channels, i.e., ( x , y , w , h , θ ) , the w (width) channel add the aspect ratio map then generates the regression results benefited aspect ratio. After converting with the simple squared anchor (related to the strides of feature maps in Feature Pyramid Networks), the final oriented boxes of SARA is predicted. The details of one position are mathematically described as following:
A R = ( i = 1 C P i c l s · C a r ) / ( i = 1 C P i c l s ) ,
w a r = w + A R ,
where A R denotes predicted aspect ratio of current position; P i c l s means the probability of i-th category; C a r represents the category-wise aspect ratios; w denotes the predicted width; and w a r means sum of predicted width and predicted aspect ratio.
Following previous works for OBB (such as S 2 A-Net [17]), the regression targets of SARA and the following OBB is defined as
Δ x = R ( θ ) ( x g x a ) R ( θ ) w a , Δ y = R ( θ ) ( y g y a ) R ( θ ) h a , Δ w = l o g ( w g ) l o g ( w a ) , Δ h = l o g ( h g ) l o g ( h a ) , Δ θ = θ g θ a + k π π ,
where Δ x , x g , and x a represent the regression target x, the ground-truth x, and the anchor center x, respectively (likewise for y , w , h , θ ), and R ( θ ) denotes the transformational relation between θ and width/height. Combining the Equation (2), the origin task of baseline if to regress the w to the target Δ w . When we add our SARA, the task will change to regress the w a r (i.e., w + A R ) to the target Δ w .

Compare with Other Anchor Mechanism

As shown in Figure 8, different from complex pre-defined anchors, i.e., rotated anchors (RRPN [16]) or anchors with several pre-defined ratios (Faster R-CNN [13]), our SARA only utilize one simple squared anchor. The scale ( 4 × S ) of the squared anchor we utilized is related to the strides (S) of feature maps in Feature Pyramid Networks. As described in Section 3.3, our SARA utilizes the category-wise self-adaptive aspect ratio to generate anchor references with various aspect ratios.

3.4. Oriented Box Decoder

The predicted oriented bounding boxes by SARA can be regarded as predicted high-quality anchors (anchor prediction in Figure 7), we utilize an Oriented Box Decoder (OBD) to refine the oriented bounding boxes based on these predicted anchors. Inspired by S 2 A-Net [17], we adopt Alignment Convolution Layer (ACL) [17] and Active Rotating Filters (ARF) [25] to align the feature maps and encode the orientation information, respectively. In this way, the feature maps can benefit from the oriented bounding box regression task. The regression targets of OBB are the same as SARA in Equation (3).

3.4.1. Feature Alignment

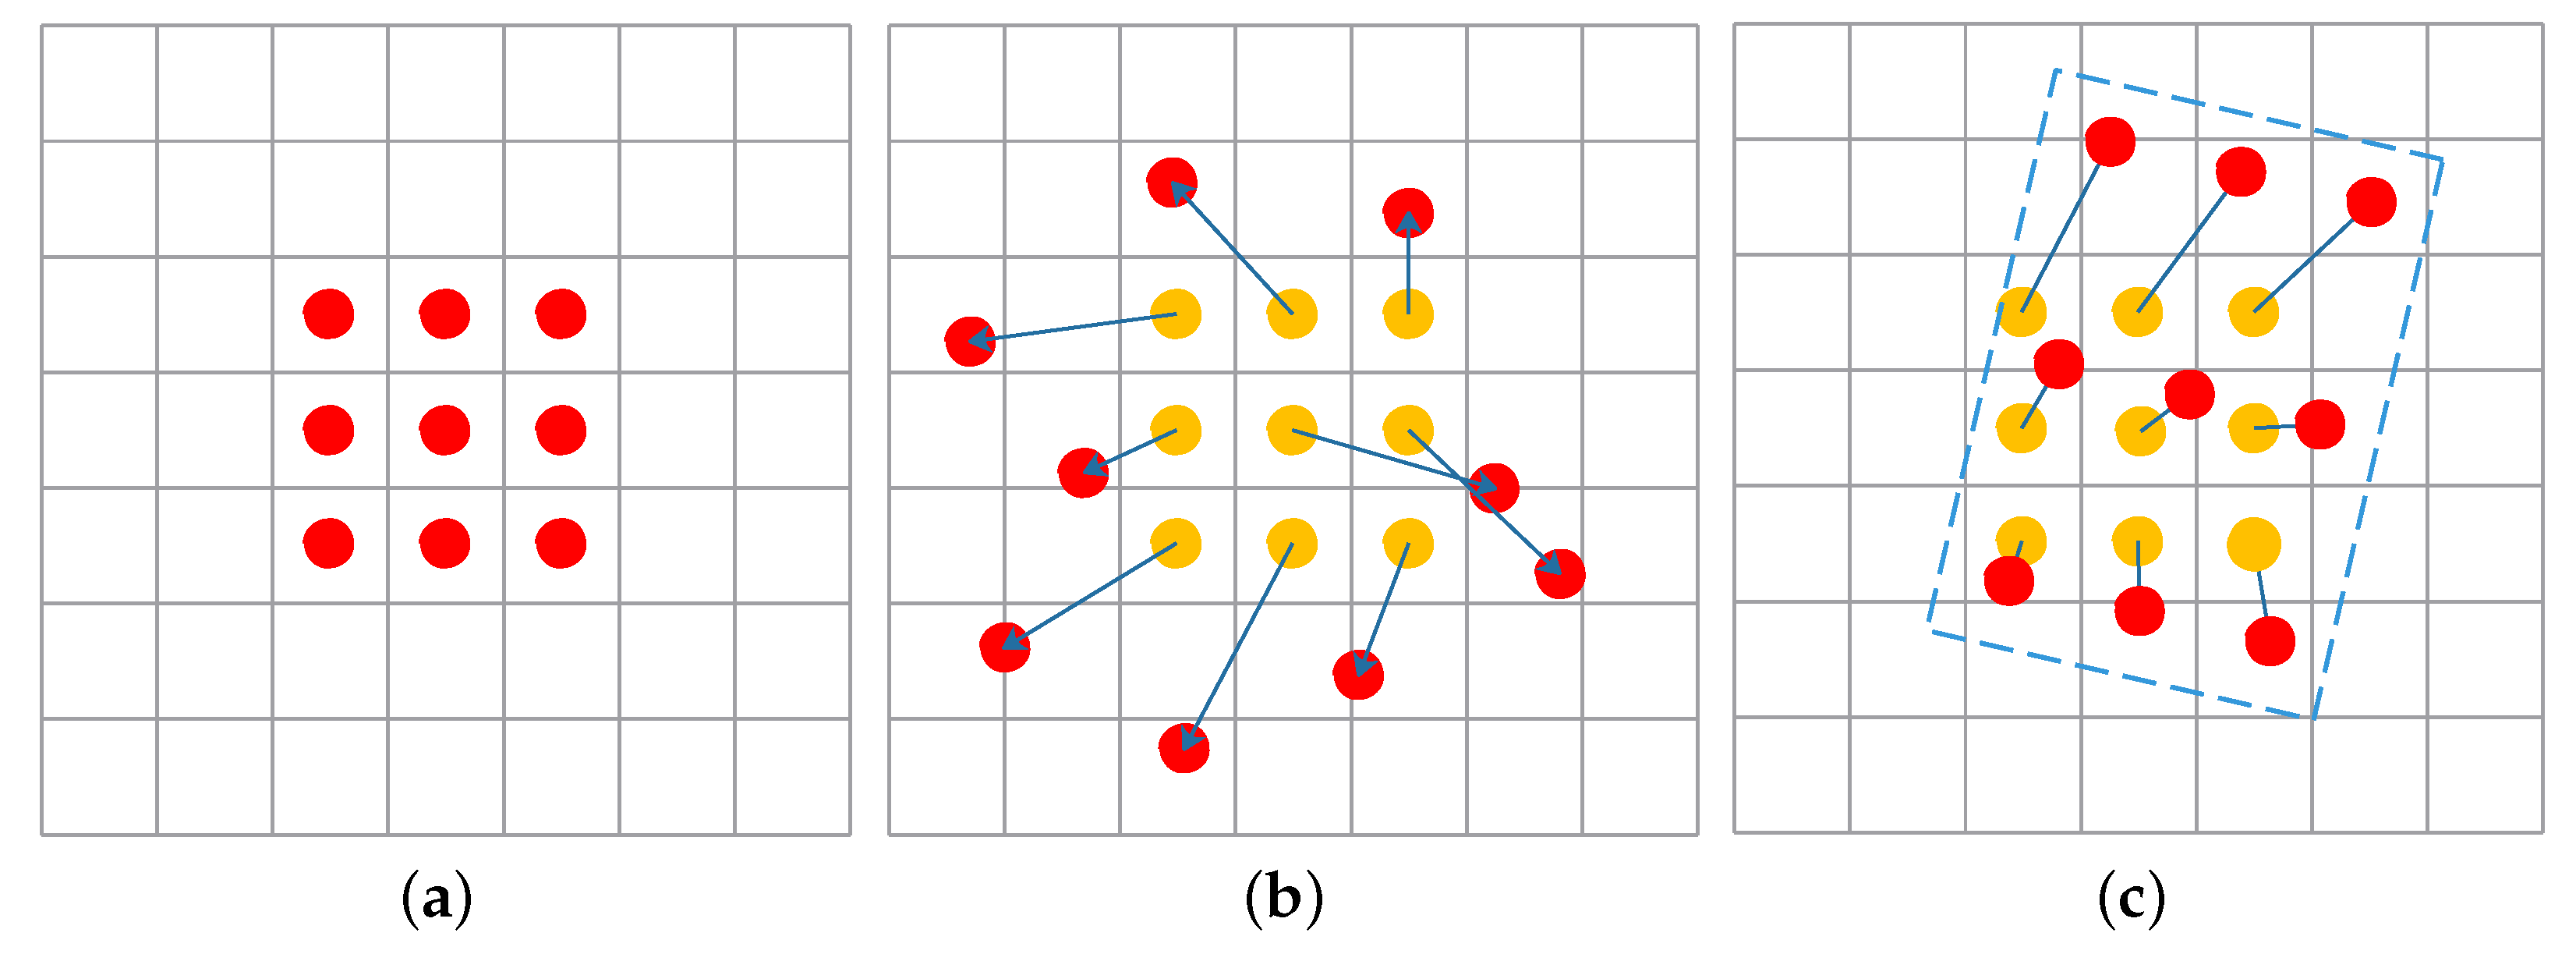
Feature Alignment is important for oriented object detection, we utilize the AlignConv [17] (shown in Figure 9c) to adaptively align the feature maps based on the predicted oriented bounding boxes. AlignConv can alleviate the misalignment between axis-aligned feature maps and oriented objects in a fully convolutional way. Alignment Convolution Layer (ACL) [17] is a layer adopt AlignConv to extract aligned features by the predicted oriented bounding boxes (anchor prediction in Figure 7).

3.4.2. Feature Orientation Information

Since we need to detect oriented bounding boxes (OBB) of objects, we adopt Active Rotating Filters (ARF) [25] to encode the orientation information, which can benefit the oriented bounding box regression task. An ARF is defined as a W × W × N filter that rotates N-1 times for convolution to generate N orientation feature maps. With an ARF (F), for an input feature map X, the k-th orientation output feature map Y ( k ) is defined as
Y ( k ) = n = 0 N 1 F θ k ( n ) * X ( n ) , θ k = k 2 π N , k = 0 , . . . , N 1 ,
where F θ k is the clockwise θ k -rotated version of F, and F θ k ( n ) and X ( n ) are the n-th orientation channel of F θ k and X, respectively.

4. Loss Function

The loss function of our method contains two parts: loss of SARA and loss of OBD. The loss function of SARA and OBD are the same, the both utilize Focal loss [15] ( L c ) for classification and Smooth-L1 loss ( L r ) for regression.
L c _ r = 1 N ( i Ω c L c ( F i c , G i c ) + i Ω r L r ( F i r , G i r ) )
L = L S A R A + L O B D ,
where Ω c and Ω r denote all the samples in feature maps for classification and all the positive samples for regression, respectively; F i c and G i c mean the i-th predicted classification result and ground-truth, respectively; F i r and G i r represent the i-th predicted regression result and ground-truth, respectively; L c _ r denote the sum of classification and regression loss; and L S A R A and L O B D represent loss for SARA and OBD, respectively. They both use L c _ r .

5. Experiments

5.1. Dataset Description

DOTA [50] is one of the largest remote sensing datasets for object detection which contains 15 categories: plane (PL), baseball diamond (BD), bridge (BR), ground field track (GTF), small vehicle (SV), large vehicle (LV), ship (SH), tennis court (TC), basketball court (BC), storage tank (ST), soccer ball field (SBF), roundabout (RA), harbor (HA), swimming pool (SP), and helicopter (HC). It contains 2806 images collected from different sensors and platforms, has been divided into a training set (1411 images), validation set (458 images), and testing set (937 images). These images are with size ranges from 800 × 800 to 4000 × 4000 . There are 188,282 annotated object instances, which are labeled by arbitrary quadrilaterals, and it contains two detection tasks: horizontal bounding boxes (HBB) and oriented bounding boxes (OBB). We focus on OBB task in this paper.
Following most of the other state-of-the-art methods, such as References [6,17,23], our method is trained on the training and validation set, and evaluated on the testing set. In the training phase, we randomly flip and rotate the images as data augmentation, we also crop a series of 1024 × 1024 patches from original images with a stride of 824 following References [17,50]. In the testing phase, we crop testing images into 1024 × 1024 patches with a stride of 512. And for multi-scale testing, we resize original images into three scales (i.e., 0.5, 1.0, and 1.5).

5.2. Implementation Details

5.2.1. Training and Inference

We utilize ResNet-101/ResNet-50 [51] with Feature Pyramid Networks (FPN) [40] as our backbone. Following Reference [17], we adopt one simple squared anchor for each level of FPN, and the scale ( 4 × S ) of the squared anchor is related to the strides (S, i.e., 32, 64, 128, 256, 512) in FPN. Our method is trained with a total batch size of 16 for 12 epochs on the DOTA dataset, using 4 GTX 1080Ti GUPs. The learning rate, momentum, and weight decay are 001, 0.9, and 0.001, respectively. At the testing phase, NMS is utilized as the post-processing step.

5.2.2. Evaluation Indicators

AP is a popular evaluation indicators, which is the average precision of the target in the range of recall= [ 0 , 1 ] , and is generally the area under precision-recall curve (PRC). PRC can be calculated by recall and precision. Recall (R) and precision (P) are defined as
R = T P T P + F N ,
P = T P T P + F P ,
A P = 0 1 P ( R ) d R ,
where true positive (TP), false positive (FP), and false-negative (FN) represent the number of correctly detected targets, the number of incorrectly detected targets, and the number of non-detected targets, respectively. mAP is adopted for multi-class evaluation, which is the average value of AP values for all classes,
m A P = N i = 1 A P i N ,
where N denotes the number of class. The larger the mAP value, the better the object detection performance. The evaluation of mAP on DOTA is reported by submitting the results to the official DOTA evaluation server.

5.3. Ablation Study

To verify the effectiveness of the proposed SARA, we compare our SARA and baseline in this Section. Our SARA can be Plug-and-Play for methods with anchor-free or simple squared anchor without aspect ratio. Thus, we adopt S 2 A-Net [17] as the baseline in our work, which achieves state-of-the-art and only adopts one simple squared anchor.
Baseline: The baseline network is S 2 A-Net [17] which is a state-of-the-art method for oriented object detection on DOTA dataset. In Table 2, † means S 2 A-Net [17] does not report the performance, and we re-evaluate and re-inference them based on the provided models and code https://github.com/csuhan/s2anet (accessed on 26 March 2021).
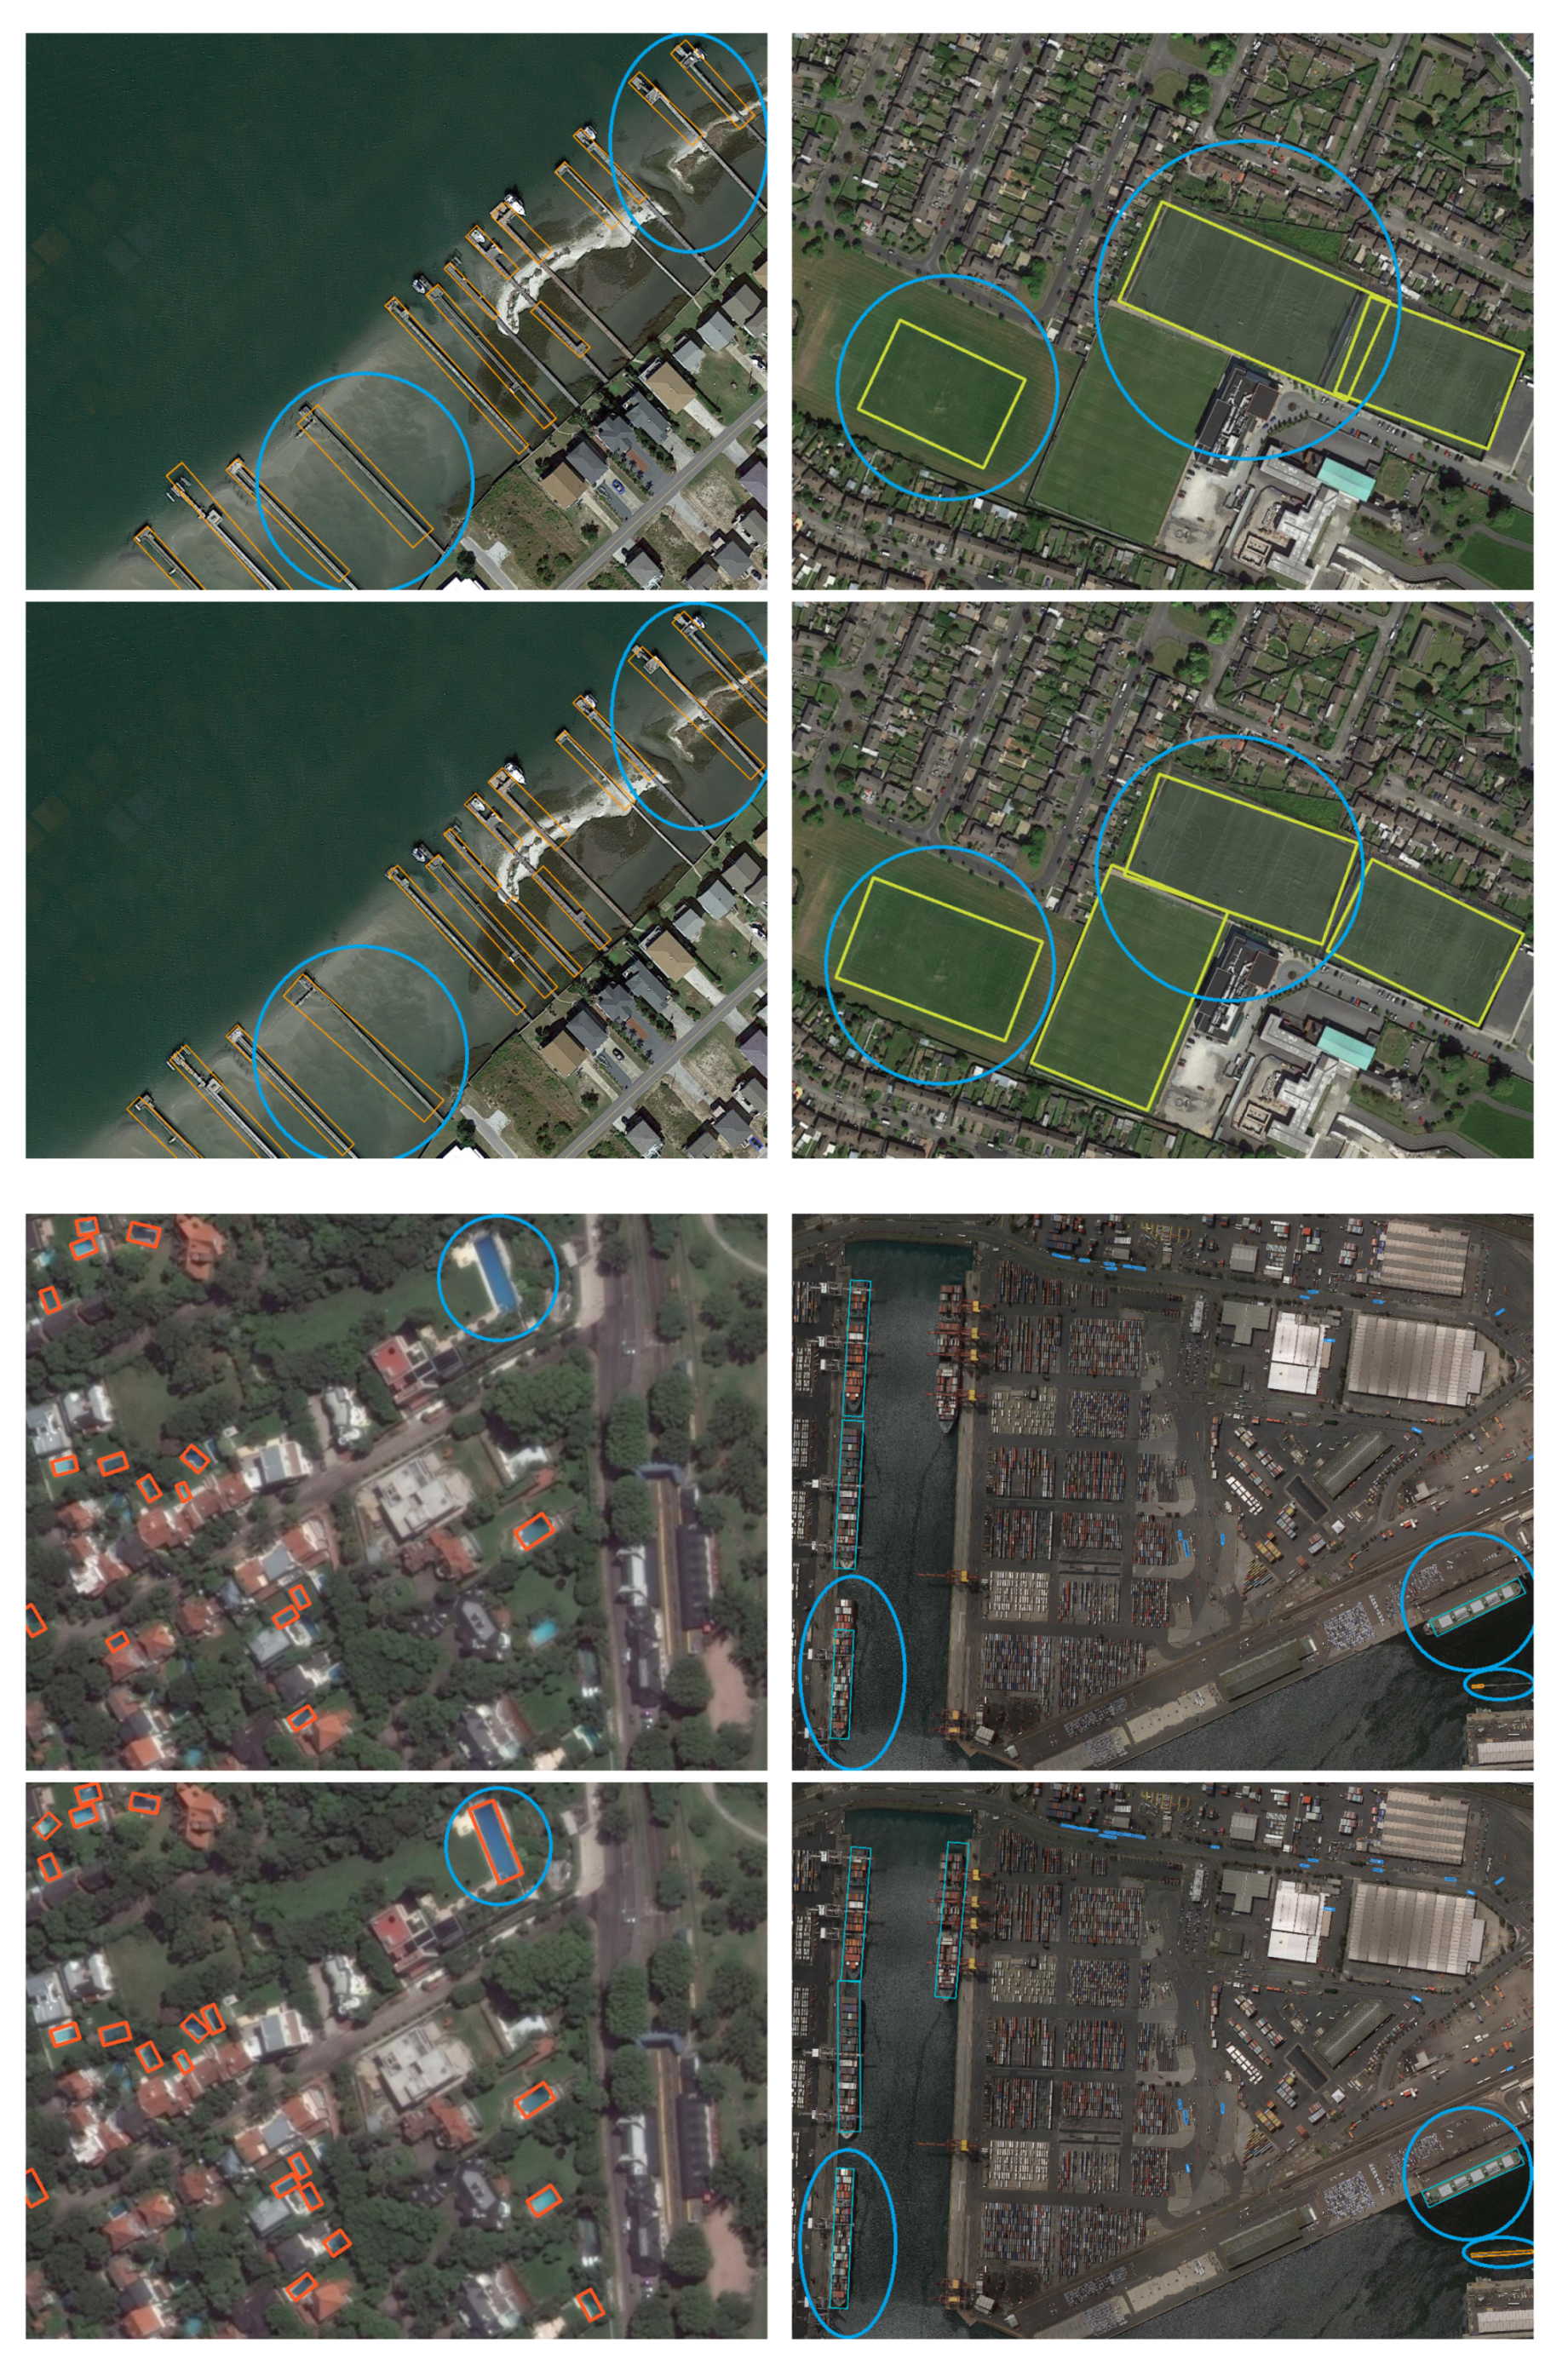
Effect of proposed SARA: Representative results are shown in Figure 10. We can figure out that our SARA performs better than baseline, especially in objects with big aspect ratios. We train and test our method on the DOTA dataset with both ResNet-50/ResNet-101 as backbone, and our SARA can outperforms baseline in both of these backbone with small degradation in speed (FPS). Quantitative results are listed in Table 2. When we adopt ResNet-50 as backbone, our method (baseline+SARA) improves 0.63% in terms of mAP (78.65% versus 78.02%) compared with the baseline . Specifically, our method achieves improvement in many categories: 89.13% versus 88.94% for PL, 85.81% versus 83.77% for BD, 73.39% versus 72.62% for GTF, 80.31% versus 80.14% for SV, 81.84% versus 81.76% for LV, 89.01% versus 88.72% for SH, 87.45% versus 85.36% for BC, 87.02% versus 86.98% for ST, 65.52% versus 64.33% for SBF, 78.38% versus 78.10% for HA, 80.08% versus 73.45% for SP, and 70.13% versus 69.18% for HC. As for ResNet-101 as backbone, our method outperforms 1.82% in terms of mAP (77.93% versus 76.11%) compared with the baseline [17] (84.60% versus 81.41% for BD, 73.71% versus 69.75% for GTF, 75.57% versus 73.37% for SP, and 67.60% versus 58.86% for HC). We also compare our method with baseline , i.e., 77.93% versus 77.67%, which improves 0.26% in terms of mAP.

5.4. Comparisons with the State-of-the-Arts

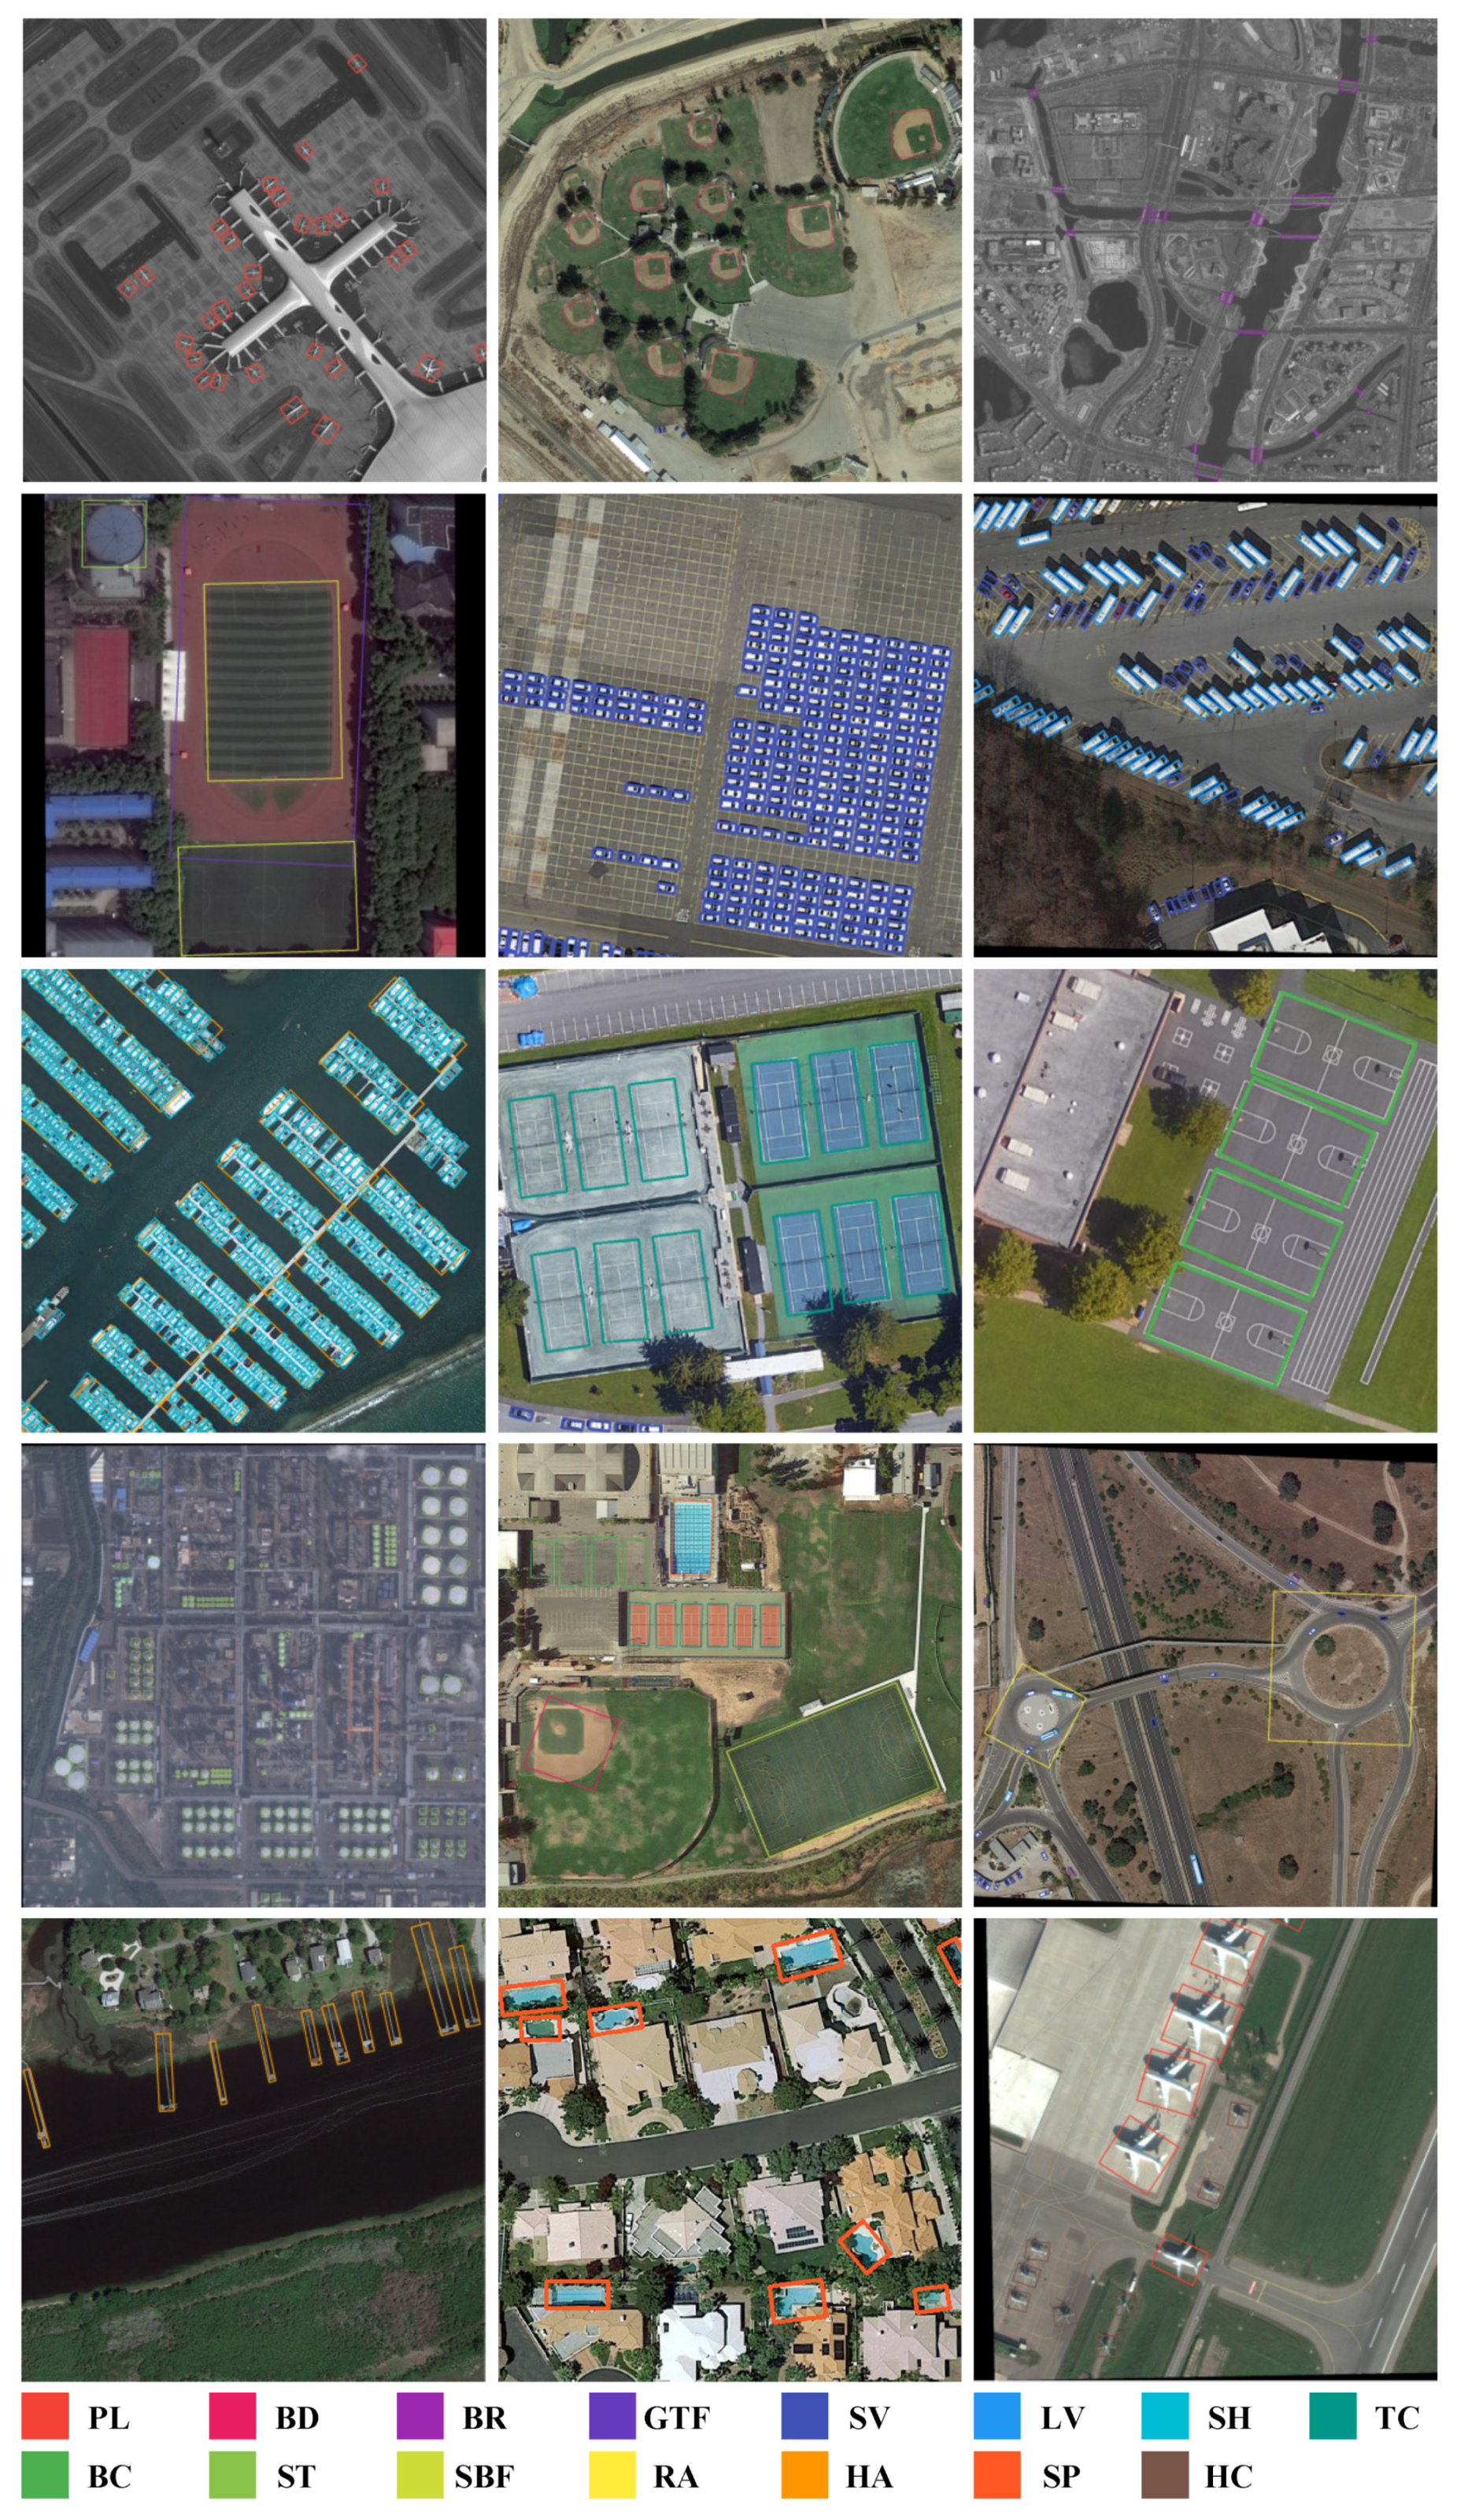
Representative results are shown in Figure 11. Table 3 shows a comparison of our method (SARA) with state-of-the-art methods, including one-stage methods (RetinaNet [15], A 2 S-Det [23], DRN [52], R 3 Det [30], and S 2 A-Net [17]) and two-stage methods (FR-O [50], Azimi et al. [53], RoITransformer [26], CAD-Net [54], SCRDet [4], GLS-Net [5], Xu et al. [55], Mask OBB [6], and F 3 -Net [1]). Our SARA surpassed all the state-of-the-art methods and is only a slightly slower than S 2 A-Net (10.9 FPS vs 11.6 FPS on Titan 1080 Ti GPU), demonstrating the effectiveness of proposed SARA in oriented object detection in remote sensing images. As listed in Table 3, our SARA achieves the best performance in many categories: 82.29% in GTF, 80.49% in SV, 83.54% in LV, 89.37% in SH, 88.07% in ST, 78.94% in HA, 80.98% in SP, and 70.13% in HC. The results show that our method performs better with ResNet-50 than ResNet-101, which is similar to S 2 A-Net [17]. Compare with state-of-the-art methods, for single scale testing, our method achieves 78.65% in terms of mAP, outperforms F3-Net [1] (76.02%, two-stage) and S 2 A-Net (76.11%, one-stage). While, for multi-scale testing, our method achieves 79.91% in terms of mAP and outperforms the second method S 2 A-Net (79.42%).

5.5. Failure Cases

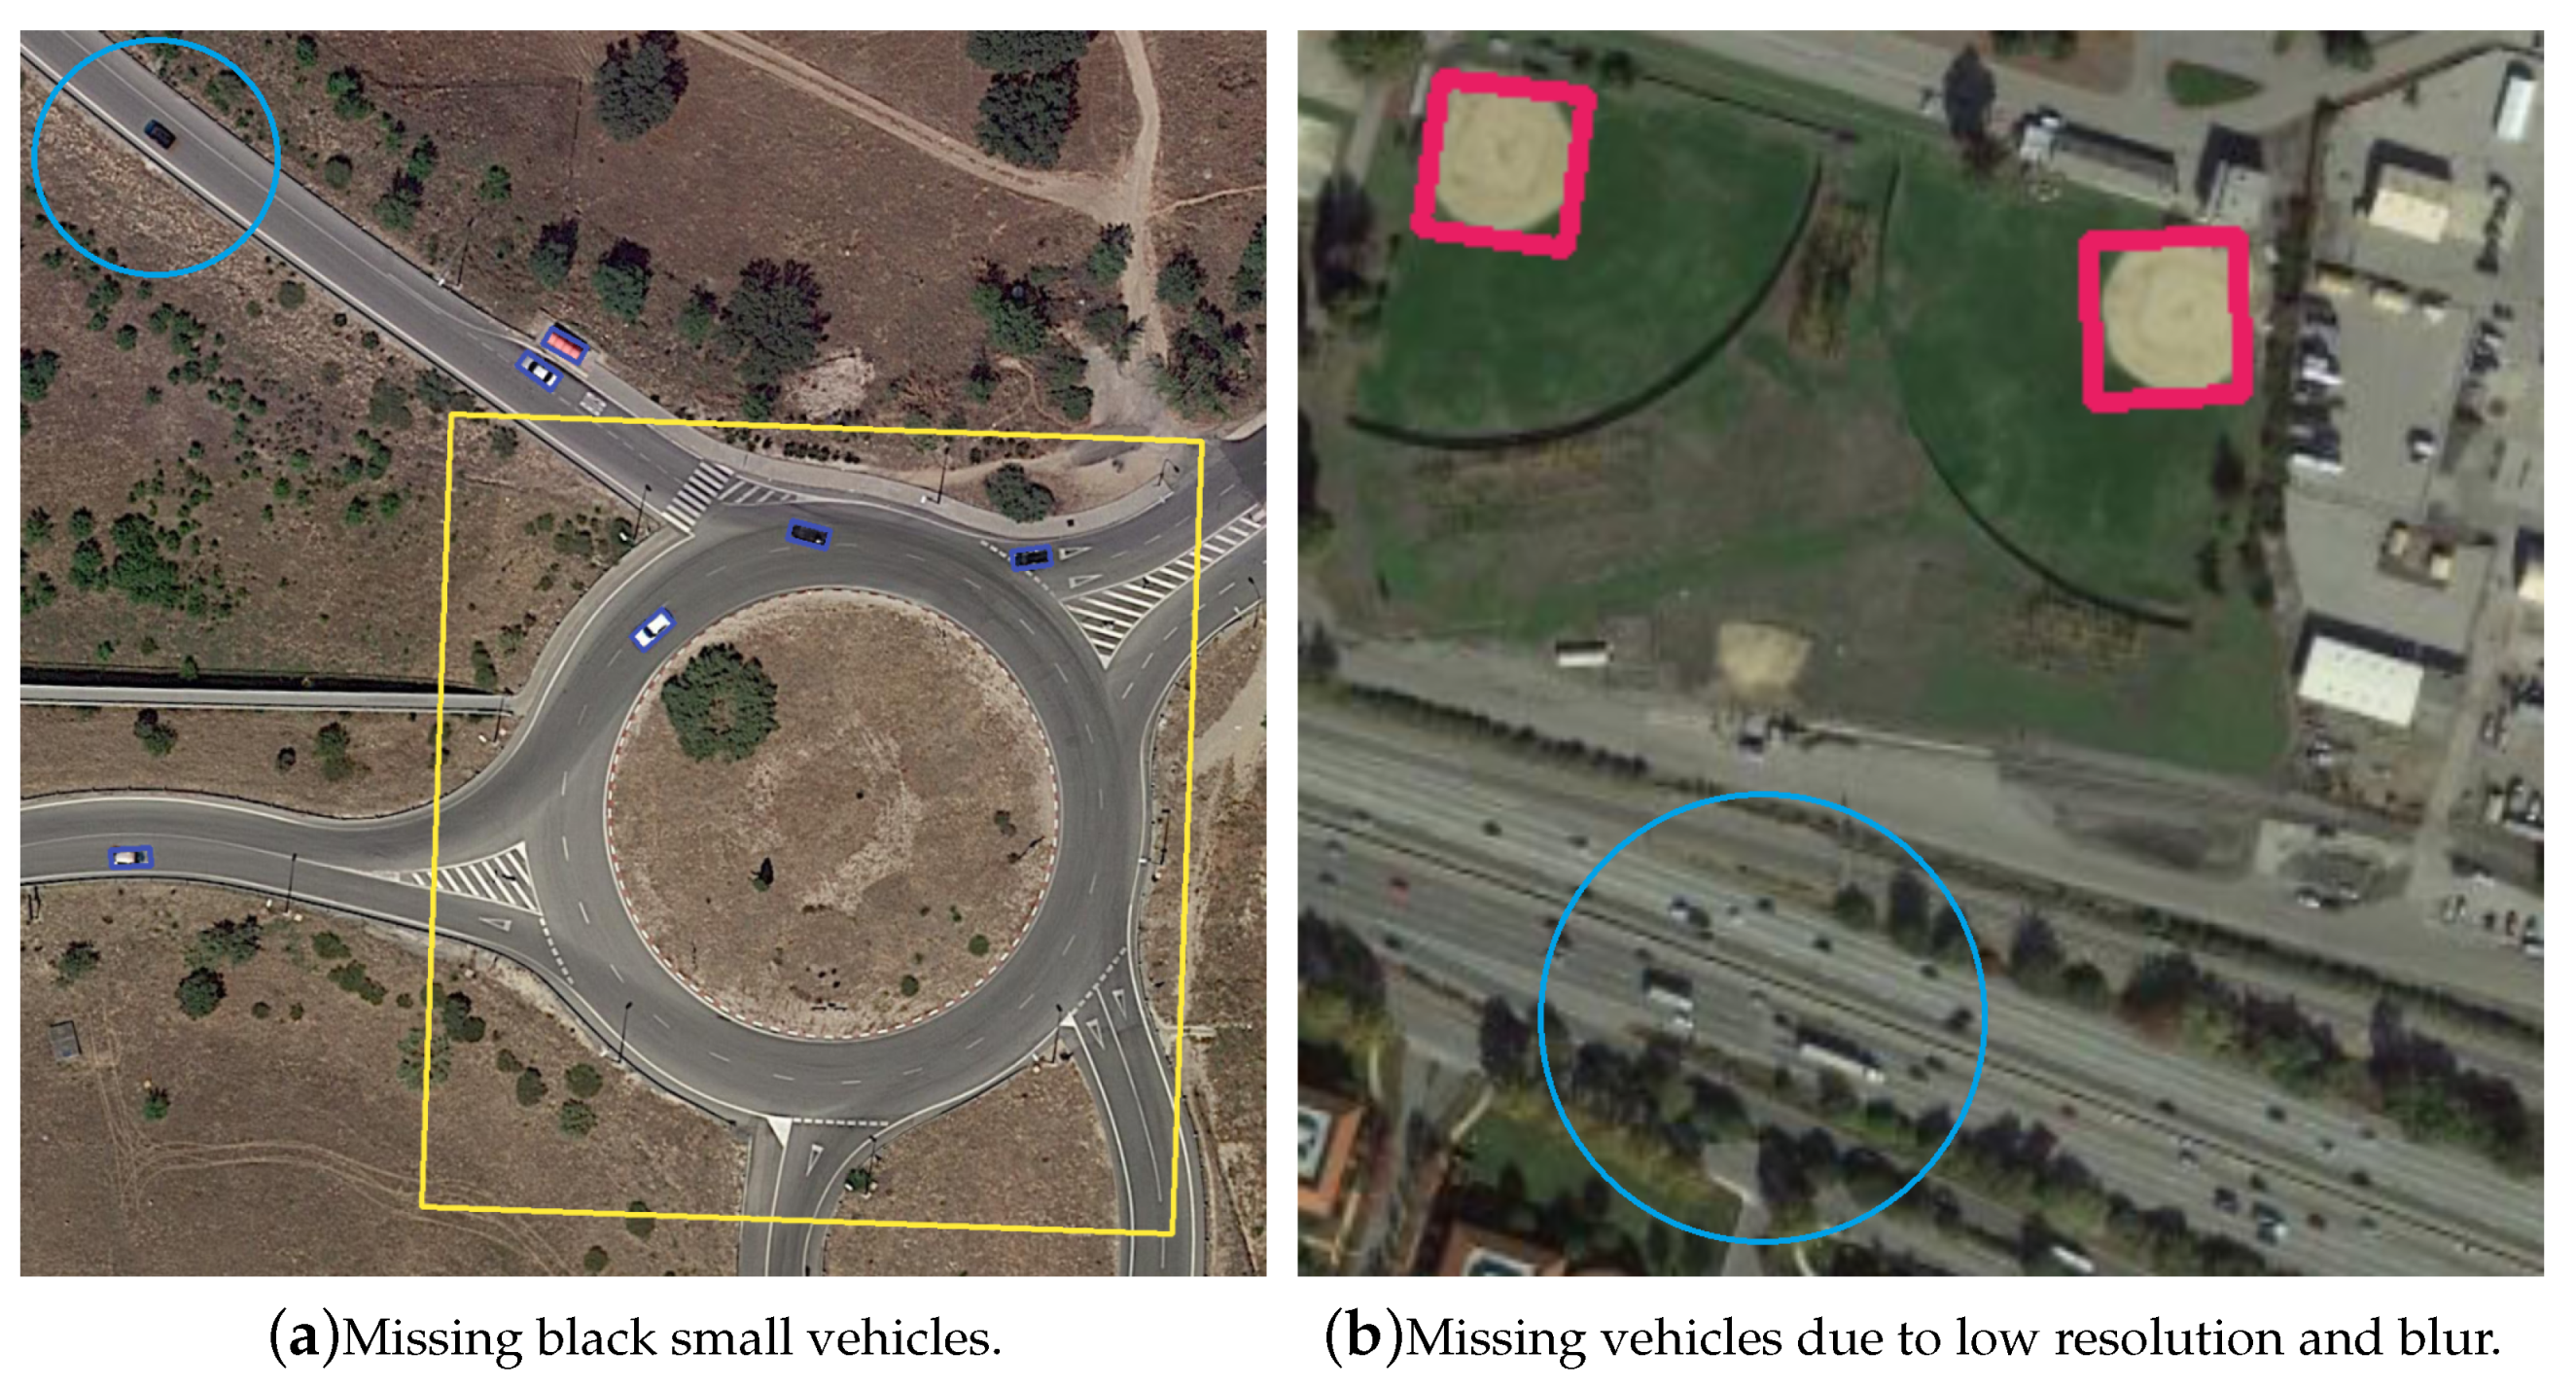
Figure 12 shows some typical failure predictions of our method. Figure 12a shows black small vehicles may be missing since they are similar to the black background. Some small and large vehicles in Figure 12b are also missing due to the low resolution and blur.

6. Conclusions

In this paper, we propose a novel Self-Adaptive Aspect Ratio Anchor (SARA) for the aspect ratio variations of objects in remote sensing images, which can self-adaptively learn the appropriate aspect ratio for each category and benefit the regression. With the help of SARA, we can only utilize a simple squared anchor (related to the strides of feature maps in Feature Pyramid Networks) to regress objects in variation aspect ratio. We also utilize an Oriented Box Decoder (OBD) to align the feature maps and encode the orientation information of oriented objects. Our method achieves mAP value of 79.91% on the DOTA dataset, which has achieved state-of-the-art.

Author Contributions

Conceptualization, J.-B.H. and X.Z.; methodology, J.-B.H.; software, J.-B.H.; validation, J.-B.H., X.Z., and X.-C.Y.; investigation, J.-B.H.; resources, X.Z. and X.-C.Y.; writing—original draft preparation, J.-B.H.; writing—review and editing, X.Z. and X.-C.Y. All authors have read and agreed to the published version of the manuscript.

Funding

This work is supported by National Key R&D Program of China ( 2019 Y F B 1405900 ), and the Fundamental Research Funds for the Central Universities and USTB-NTUT Joint Research Program

Institutional Review Board Statement

Not applicable.

Informed Consent Statement

Not applicable.

Acknowledgments

This author would like to thank the providers of the awesome remote sensing images DOTA dataset. The author would like to express their appreciation to the developers of pytorch and S 2 A-Net for their open source code.

Conflicts of Interest

The authors declare no conflict of interest.

Abbreviations

The following abbreviations are used in this manuscript:
SARASelf-Adoptive Aspect Ratio Anchor
OBDOriented Box Decoder
mAPmean Average Precision
HBBHorizontal bounding boxes
OBBOriented bounding boxes
IoUIntersection-over-union
RoIRegion of Interest

References

  1. Ye, X.; Xiong, F.; Lu, J.; Zhou, J.; Qian, Y. F3-Net: Feature Fusion and Filtration Network for Object Detection in Optical Remote Sensing Images. Remote Sens. 2020, 12, 4027. [Google Scholar] [CrossRef]
  2. Qiu, H.; Li, H.; Wu, Q.; Meng, F.; Ngan, K.N.; Shi, H. A2RMNet: Adaptively Aspect Ratio Multi-Scale Network for Object Detection in Remote Sensing Images. Remote Sens. 2019, 11, 1594. [Google Scholar] [CrossRef] [Green Version]
  3. Xiao, Z.; Qian, L.; Shao, W.; Tan, X.; Wang, K. Axis Learning for Orientated Objects Detection in Aerial Images. Remote Sens. 2020, 12, 908. [Google Scholar] [CrossRef] [Green Version]
  4. Yang, X.; Yang, J.; Yan, J.; Zhang, Y.; Zhang, T.; Guo, Z.; Sun, X.; Fu, K. SCRDet: Towards More Robust Detection for Small, Cluttered and Rotated Objects. In Proceedings of the 2019 IEEE/CVF International Conference on Computer Vision, ICCV 2019, Seoul, Korea, 27 October–2 November 2019; pp. 8231–8240. [Google Scholar]
  5. Li, C.; Luo, B.; Hong, H.; Su, X.; Wang, Y.; Liu, J.; Wang, C.; Zhang, J.; Wei, L. Object Detection Based on Global-Local Saliency Constraint in Aerial Images. Remote Sens. 2020, 12, 1435. [Google Scholar] [CrossRef]
  6. Wang, J.; Ding, J.; Guo, H.; Cheng, W.; Pan, T.; Yang, W. Mask OBB: A Semantic Attention-Based Mask Oriented Bounding Box Representation for Multi-Category Object Detection in Aerial Images. Remote Sens. 2019, 11, 2930. [Google Scholar] [CrossRef] [Green Version]
  7. Zhang, X.; Zhu, K.; Chen, G.; Tan, X.; Zhang, L.; Dai, F.; Liao, P.; Gong, Y. Geospatial Object Detection on High Resolution Remote Sensing Imagery Based on Double Multi-Scale Feature Pyramid Network. Remote Sens. 2019, 11, 755. [Google Scholar] [CrossRef] [Green Version]
  8. Liu, Z.; Wang, H.; Weng, L.; Yang, Y. Ship Rotated Bounding Box Space for Ship Extraction From High-Resolution Optical Satellite Images With Complex Backgrounds. IEEE Geosci. Remote Sens. Lett. 2016, 13, 1074–1078. [Google Scholar] [CrossRef]
  9. Liu, Z.; Hu, J.; Weng, L.; Yang, Y. Rotated region based CNN for ship detection. In Proceedings of the 2017 IEEE International Conference on Image Processing, ICIP 2017, Beijing, China, 17–20 September 2017; pp. 900–904. [Google Scholar]
  10. Kwan, C.; Chou, B.; Yang, J.; Rangamani, A.; Tran, T.D.; Zhang, J.; Etienne-Cummings, R. Deep Learning-Based Target Tracking and Classification for Low Quality Videos Using Coded Aperture Cameras. Sensors 2019, 19, 3702. [Google Scholar] [CrossRef] [Green Version]
  11. Liu, W.; Anguelov, D.; Erhan, D.; Szegedy, C.; Reed, S.E.; Fu, C.; Berg, A.C. SSD: Single Shot MultiBox Detector. In Proceedings of the Computer Vision - ECCV 2016—14th European Conference, Amsterdam, The Netherlands, 11–14 October 2016; pp. 21–37. [Google Scholar]
  12. Nguyen, P.H.; Arsalan, M.; Koo, J.H.; Naqvi, R.A.; Truong, N.Q.; Park, K.R. LightDenseYOLO: A Fast and Accurate Marker Tracker for Autonomous UAV Landing by Visible Light Camera Sensor on Drone. Sensors 2018, 18, 1703. [Google Scholar] [CrossRef] [Green Version]
  13. Ren, S.; He, K.; Girshick, R.B.; Sun, J. Faster R-CNN: Towards Real-Time Object Detection with Region Proposal Networks. IEEE Trans. Pattern Anal. Mach. Intell. 2017, 39, 1137–1149. [Google Scholar] [CrossRef] [Green Version]
  14. Redmon, J.; Farhadi, A. Yolov3: An incremental improvement. arXiv 2018, arXiv:1804.02767. [Google Scholar]
  15. Lin, T.; Goyal, P.; Girshick, R.B.; He, K.; Dollár, P. Focal Loss for Dense Object Detection. In Proceedings of the IEEE International Conference on Computer Vision, ICCV 2017, Venice, Italy, 22–29 October 2017; pp. 2999–3007. [Google Scholar]
  16. Ma, J.; Shao, W.; Ye, H.; Wang, L.; Wang, H.; Zheng, Y.; Xue, X. Arbitrary-Oriented Scene Text Detection via Rotation Proposals. IEEE Trans. Multimed. 2018, 20, 3111–3122. [Google Scholar] [CrossRef] [Green Version]
  17. Han, J.; Ding, J.; Li, J.; Xia, G. Align Deep Features for Oriented Object Detection. arXiv 2020, arXiv:2008.09397. [Google Scholar]
  18. Tang, T.; Liu, Y.; Zheng, Y.; Zhu, X.; Zhao, Y. Rotating Objects Detection in Aerial Images via Attention Denoising and Angle Loss Refining. DEStech Trans. Comput. Sci. Eng. 2020. [Google Scholar]
  19. Yang, X.; Yan, J.; Yang, X.; Tang, J.; Liao, W.; He, T. SCRDet++: Detecting Small, Cluttered and Rotated Objects via Instance-Level Feature Denoising and Rotation Loss Smoothing. arXiv 2020, arXiv:2004.13316. [Google Scholar]
  20. Li, C.; Xu, C.; Cui, Z.; Wang, D.; Jie, Z.; Zhang, T.; Yang, J. Learning Object-Wise Semantic Representation for Detection in Remote Sensing Imagery. In Proceedings of the IEEE Conference on Computer Vision and Pattern Recognition Workshops, CVPR Workshops 2019, Long Beach, CA, USA, 16–20 June 2019; pp. 20–27. [Google Scholar]
  21. Fu, K.; Chang, Z.; Zhang, Y.; Xu, G.; Zhang, K.; Sun, X. Rotation-aware and multi-scale convolutional neural network for object detection in remote sensing images. ISPRS J. Photogramm. Remote Sens. 2020, 161, 294–308. [Google Scholar] [CrossRef]
  22. Li, Y.; Huang, Q.; Pei, X.; Jiao, L.; Shang, R. RADet: Refine Feature Pyramid Network and Multi-Layer Attention Network for Arbitrary-Oriented Object Detection of Remote Sensing Images. Remote Sens. 2020, 12, 389. [Google Scholar] [CrossRef] [Green Version]
  23. Xiao, Z.; Wang, K.; Wan, Q.; Tan, X.; Xu, C.; Xia, F. A2S-Det: Efficiency Anchor Matching in Aerial Image Oriented Object Detection. Remote Sens. 2021, 13, 73. [Google Scholar] [CrossRef]
  24. Ming, Q.; Zhou, Z.; Miao, L.; Zhang, H.; Li, L. Dynamic Anchor Learning for Arbitrary-Oriented Object Detection. arXiv 2020, arXiv:2012.04150. [Google Scholar]
  25. Zhou, Y.; Ye, Q.; Qiu, Q.; Jiao, J. Oriented Response Networks. In Proceedings of the 2017 IEEE Conference on Computer Vision and Pattern Recognition, CVPR 2017, Honolulu, HI, USA, 21–26 July 2017; pp. 4961–4970. [Google Scholar]
  26. Ding, J.; Xue, N.; Long, Y.; Xia, G.; Lu, Q. Learning RoI Transformer for Oriented Object Detection in Aerial Images. In Proceedings of the IEEE Conference on Computer Vision and Pattern Recognition, CVPR 2019, Long Beach, CA, USA, 16–20 June 2019; pp. 2849–2858. [Google Scholar]
  27. He, K.; Gkioxari, G.; Dollár, P.; Girshick, R.B. Mask R-CNN. In Proceedings of the IEEE International Conference on Computer Vision, ICCV 2017, Venice, Italy, 22–29 October 2017; pp. 2980–2988. [Google Scholar]
  28. Redmon, J.; Farhadi, A. YOLO9000: Better, Faster, Stronger. In Proceedings of the 2017 IEEE Conference on Computer Vision and Pattern Recognition, CVPR 2017, Honolulu, HI, USA, 21–26 July 2017; pp. 6517–6525. [Google Scholar]
  29. Liao, M.; Shi, B.; Bai, X. Textboxes++: A single-shot oriented scene text detector. IEEE Trans. Image Process. 2018, 27, 3676–3690. [Google Scholar] [CrossRef] [PubMed] [Green Version]
  30. Yang, X.; Liu, Q.; Yan, J.; Li, A. R3Det: Refined Single-Stage Detector with Feature Refinement for Rotating Object. arXiv 2019, arXiv:1908.05612. [Google Scholar]
  31. Long, J.; Shelhamer, E.; Darrell, T. Fully Convolutional Networks for Semantic Segmentation. In Proceedings of the IEEE Conference on Computer Vision and Pattern Recognition, CVPR 2015, Boston, MA, USA, 7–12 June 2015; pp. 3431–3440. [Google Scholar]
  32. Huang, L.; Yang, Y.; Deng, Y.; Yu, Y. DenseBox: Unifying Landmark Localization with End to End Object Detection. arXiv 2015, arXiv:1509.04874. [Google Scholar]
  33. Zhou, X.; Yao, C.; Wen, H.; Wang, Y.; Zhou, S.; He, W.; Liang, J. EAST: An Efficient and Accurate Scene Text Detector. In Proceedings of the 2017 IEEE Conference on Computer Vision and Pattern Recognition, CVPR 2017, Honolulu, HI, USA, 21–26 July 2017; pp. 2642–2651. [Google Scholar]
  34. Yu, J.; Jiang, Y.; Wang, Z.; Cao, Z.; Huang, T.S. UnitBox: An Advanced Object Detection Network. In Proceedings of the 2016 ACM Conference on Multimedia Conference, MM 2016, Amsterdam, The Netherlands, 15–19 October 2016; pp. 516–520. [Google Scholar]
  35. He, W.; Zhang, X.Y.; Yin, F.; Liu, C.L. Deep Direct Regression for Multi-oriented Scene Text Detection. In Proceedings of the IEEE International Conference on Computer Vision, ICCV 2017, Venice, Italy, 22–29 October 2017; pp. 745–753. [Google Scholar]
  36. He, W.; Zhang, X.Y.; Yin, F.; Liu, C.L. Multi-oriented and multi-lingual scene text detection with direct regression. IEEE Trans. Image Process. 2018, 27, 5406–5419. [Google Scholar] [CrossRef] [PubMed]
  37. Tian, Z.; Shen, C.; Chen, H.; He, T. FCOS: Fully Convolutional One-Stage Object Detection. In Proceedings of the 2019 IEEE/CVF International Conference on Computer Vision, ICCV 2019, Seoul, Korea, 27 October–2 November 2019; pp. 9626–9635. [Google Scholar]
  38. Zhou, X.; Wang, D.; Krähenbühl, P. Objects as Points. arXiv 2019, arXiv:1904.07850. [Google Scholar]
  39. Zhu, C.; He, Y.; Savvides, M. Feature Selective Anchor-Free Module for Single-Shot Object Detection. In Proceedings of the IEEE Conference on Computer Vision and Pattern Recognition, CVPR 2019, Long Beach, CA, USA, 16–20 June 2019; pp. 840–849. [Google Scholar]
  40. Lin, T.; Dollár, P.; Girshick, R.B.; He, K.; Hariharan, B.; Belongie, S.J. Feature Pyramid Networks for Object Detection. In Proceedings of the 2017 IEEE Conference on Computer Vision and Pattern Recognition, CVPR 2017, Honolulu, HI, USA, 21–26 July 2017; pp. 936–944. [Google Scholar]
  41. Law, H.; Deng, J. CornerNet: Detecting Objects as Paired Keypoints. In Proceedings of the Computer Vision-ECCV 2018—15th European Conference, Munich, Germany, 8–14 September 2018; Ferrari, V., Hebert, M., Sminchisescu, C., Weiss, Y., Eds.; Springer: Berlin/Heidelberg, Germany, 2018; Volume 11218, pp. 765–781. [Google Scholar]
  42. Duan, K.; Bai, S.; Xie, L.; Qi, H.; Huang, Q.; Tian, Q. CenterNet: Keypoint Triplets for Object Detection. In Proceedings of the 2019 IEEE/CVF International Conference on Computer Vision, ICCV 2019, Seoul, Korea, 27 October 27–2 November 2019; pp. 6568–6577. [Google Scholar]
  43. Zhou, X.; Zhuo, J.; Krähenbühl, P. Bottom-Up Object Detection by Grouping Extreme and Center Points. In Proceedings of the IEEE Conference on Computer Vision and Pattern Recognition, CVPR 2019, Long Beach, CA, USA, 16–20 June 2019; pp. 850–859. [Google Scholar]
  44. Wei, H.; Zhou, L.; Zhang, Y.; Li, H.; Guo, R.; Wang, H. Oriented Objects as pairs of Middle Lines. arXiv 2019, arXiv:1912.10694. [Google Scholar] [CrossRef]
  45. Deng, D.; Liu, H.; Li, X.; Cai, D. PixelLink: Detecting Scene Text via Instance Segmentation. In Proceedings of the Thirty-Second AAAI Conference on Artificial Intelligence, (AAAI-18), the 30th innovative Applications of Artificial Intelligence (IAAI-18), and the 8th AAAI Symposium on Educational Advances in Artificial Intelligence (EAAI-18), New Orleans, LA, USA, 2–7 February 2018; pp. 6773–6780. [Google Scholar]
  46. Xu, Y.; Wang, Y.; Zhou, W.; Wang, Y.; Yang, Z.; Bai, X. TextField: Learning a Deep Direction Field for Irregular Scene Text Detection. IEEE Trans. Image Process. 2019, 28, 5566–5579. [Google Scholar] [CrossRef] [PubMed] [Green Version]
  47. Tian, Z.; Shu, M.; Lyu, P.; Li, R.; Zhou, C.; Shen, X.; Jia, J. Learning Shape-Aware Embedding for Scene Text Detection. In Proceedings of the IEEE Conference on Computer Vision and Pattern Recognition, CVPR 2019, Long Beach, CA, USA, 16–20 June 2019; pp. 4234–4243. [Google Scholar]
  48. Wang, W.; Xie, E.; Li, X.; Hou, W.; Lu, T.; Yu, G.; Shao, S. Shape Robust Text Detection with Progressive Scale Expansion Network. In Proceedings of the IEEE Conference on Computer Vision and Pattern Recognition, CVPR 2019, Long Beach, CA, USA, 16–20 June 2019; pp. 9336–9345. [Google Scholar]
  49. Dai, J.; Qi, H.; Xiong, Y.; Li, Y.; Zhang, G.; Hu, H.; Wei, Y. Deformable Convolutional Networks. In Proceedings of the IEEE International Conference on Computer Vision, ICCV 2017, Venice, Italy, 22–29 October 2017; pp. 764–773. [Google Scholar]
  50. Xia, G.; Bai, X.; Ding, J.; Zhu, Z.; Belongie, S.J.; Luo, J.; Datcu, M.; Pelillo, M.; Zhang, L. DOTA: A Large-Scale Dataset for Object Detection in Aerial Images. In Proceedings of the 2018 IEEE Conference on Computer Vision and Pattern Recognition, CVPR 2018, Salt Lake City, UT, USA, 18–22 June 2018; pp. 3974–3983. [Google Scholar]
  51. He, K.; Zhang, X.; Ren, S.; Sun, J. Deep Residual Learning for Image Recognition. In Proceedings of the 2016 IEEE Conference on Computer Vision and Pattern Recognition, CVPR 2016, Las Vegas, NV, USA, 27–30 June 2016; pp. 770–778. [Google Scholar]
  52. Pan, X.; Ren, Y.; Sheng, K.; Dong, W.; Yuan, H.; Guo, X.; Ma, C.; Xu, C. Dynamic Refinement Network for Oriented and Densely Packed Object Detection. In Proceedings of the 2020 IEEE/CVF Conference on Computer Vision and Pattern Recognition, CVPR 2020, Seattle, WA, USA, 13–19 June 2020; pp. 11204–11213. [Google Scholar]
  53. Azimi, S.M.; Vig, E.; Bahmanyar, R.; Körner, M.; Reinartz, P. Towards Multi-class Object Detection in Unconstrained Remote Sensing Imagery. In Proceedings of the Computer Vision—ACCV 2018—14th Asian Conference on Computer Vision, Perth, Australia, 2–6 December 2018; Volume 11363, pp. 150–165. [Google Scholar]
  54. Zhang, G.; Lu, S.; Zhang, W. CAD-Net: A Context-Aware Detection Network for Objects in Remote Sensing Imagery. IEEE Trans. Geosci. Remote Sens. 2019, 57, 10015–10024. [Google Scholar] [CrossRef] [Green Version]
  55. Xu, Y.; Fu, M.; Wang, Q.; Wang, Y.; Chen, K.; Xia, G.; Bai, X. Gliding vertex on the horizontal bounding box for multi-oriented object detection. arXiv 2019, arXiv:1911.09358. [Google Scholar] [CrossRef] [PubMed] [Green Version]
Figure 1. GSD, width in pixel, width in meter, and aspect ratio of small-vehicle.
Remotesensing 13 01318 g001
Figure 2. The GSD, width in pixel, and width in meters of basketball-court, plane, and ground-track-field. The width in meter of basketball-court is close to Gaussian distribution. However, the width in meters of plane and ground-track-field are close to mixed Gaussian distribution.
Remotesensing 13 01318 g002
Figure 3. Illustration of Anchor-based methods. (a) anchor-based methods regression target box (blue box) based on the predefined anchor (green dotted box); (b) one-stage methods directly regress the bounding boxes based on the anchors; (c) two-stage methods firstly generate proposals based on anchors, then refine proposals through RoI pooling layer.
Remotesensing 13 01318 g003
Figure 4. Illustration of Anchor-free methods. (a) directly regression methods usually directly regress the offset of each positive point to the four points of bounding boxes without anchor references. (b) Corner based methods predict the corners of bounding box (some methods contain center point), then pair the top-left point and bottom-right point to generate the bounding box. (c) segmentation-based methods regard detection task as segmentation task, them get the minimum bounding rectangle as the final predictions.
Remotesensing 13 01318 g004
Figure 5. The pipeline of proposed method, which contains two parts: Self-Adaptive Aspect Ratio Anchor Mechanism (SARA) and Oriented Box Decoder (OBD). The SARA can be regarded as high-quality anchor generator, which products anchor prediction map for the following OBD, details are illustrated in Figure 7. The OBD adopts Alignment Convolution Layer (ACL) [17] and Active Rotating Filters (ARF) [25] to align the feature maps and encode the orientation information, respectively.
Remotesensing 13 01318 g005
Figure 6. Horizontal bounding boxes (HBB) and oriented bounding boxes (OBB). (a) HBB is widely utilized in object detection task, it contains four dimensions ( x , y , w , h ) , which means the center point position ( x , y ) , the width, and the height, respectively. (b) OBB contains five dimensions ( x , y , w , h , θ ) , which means the center point position ( x , y ) , the width (the longest side), the height (the shortest side), and θ denote the angle of OBB. HBB is a particular case of OBB, i.e., θ = 0.
Remotesensing 13 01318 g006
Figure 7. Category-wise aspect ratios are self-adaptive aspect ratio for each category. The category-wise aspect ratios firstly multiply by the classification probabilities, then the weighted sum of them generate the aspect ratio map. The w (width) channel adds the values of aspect ratio map to generate the w a r in Equation (2). After converting with the simple squared anchor, the final anchor prediction is generated.
Remotesensing 13 01318 g007
Figure 8. Comparison with other anchors. (a) rotated anchors such as RRPN [16]; (b) Anchors with several predefined aspect ratios such as Faster R-CNN [13]; (c) proposed Self-Adaptive Aspect Ratio Anchor (SARA), SARA utilize one simple squared anchor and category-wise self-adaptive aspect ratio to generate anchor references with various aspect ratios.
Remotesensing 13 01318 g008
Figure 9. Examples of the sampling locations in different methods with 3 × 3 convolution kernel. (a) Standard 2D convolution; (b) the sampling locations of Deformable Convolution [49] are predicted for each point; (c) the sampling locations of AlignConv [17] are the corresponding oriented bounding box.
Remotesensing 13 01318 g009
Figure 10. Representative results of ablation study. The first row of each subfigure shows detected results of baseline, and the second row shows results of our SARA. Blue ellipses hight the significant differences. Notably, we only show the detect boxes whose score is higher than a threshold of 0.5.
Remotesensing 13 01318 g010
Figure 11. Representative results on DOTA.
Remotesensing 13 01318 g011
Figure 12. Some typical failure predictions of our method. Blue circles hight the missing detected objects. Notably, we only show the detect boxes whose score is higher than a threshold of 0.5.
Remotesensing 13 01318 g012
Table 1. Statistical results of aspect ratios, visualization are shown in Figure 2. “Var” represents Variance, “Std” represents Standard Deviation, and “CV” represents Coefficient of Variation.
PLBDBRGTFSVLVSHTCBCSTSBFRAHASPHC
Mean1.261.103.151.972.163.932.912.801.781.091.651.104.391.692.93
Var0.040.0112.850.100.091.440.650.010.040.050.060.0217.350.240.65
Std0.200.123.590.310.301.200.810.120.190.220.240.164.170.490.81
CV0.160.111.140.160.140.310.280.060.110.210.150.140.950.290.28
Table 2. Ablation study. † means Baseline [17] does not report the performance, we re-evaluate and re-inference them base on the provided model of the Baseline [17]. R-101 represents ResNet-101 with FPN (so does R-50). The short names of the categories are plane (PL), baseball diamond (BD), bridge (BR), ground field track (GTF), small vehicle (SV), large vehicle (LV), ship (SH), tennis court (TC), basketball court (BC), storage tank (ST), soccer ball field (SBF), roundabout (RA), harbor (HA), swimming pool (SP) and helicopter (HC), respectively. Note that the FPS is a relative FPS calculated by the overall inference time and the number of chip images.
MethodBackbonePLBDBRGTFSVLVSHTCBCSTSBFRAHASPHCmAPFPS
Baseline R-5088.9483.7757.4972.6280.1481.7688.7290.8385.3686.9864.3368.7578.1073.4569.1878.0211.6
Baseline+SARAR-5089.1385.8154.8873.3980.3181.8489.0790.7887.4587.0265.0266.5278.3880.0870.1378.6510.9
Baseline [17]R-10188.7081.4154.2869.7578.0480.5488.0490.6984.7586.2265.0365.8176.1673.3758.8676.1112.7
Baseline R-10188.9684.6556.9673.2180.0681.7188.7190.7884.8086.1362.3970.4478.5873.9663.7777.679.3
Baseline+SARAR-10189.2084.6055.9473.7179.7782.0388.9990.7585.7087.2562.3666.6178.9475.5767.6077.938.8
Table 3. Comparisons with state-of-the-art methods (both two-stage and one-stage) on DOTA OBB task. R-50, R-101, R-152, and H-104 represents ResNet-50, ResNet-101, ResNet-152, and Hourglass-104, respectively. * means multi-scale testing. Note that the FPS is a relative FPS calculated by the overall inference time and the number of chip images. For FPS, denotes tested on Titan Xp GPU, means on V100 GPU, and § represents on Titan 1080 Ti.
MethodBackbonePLBDBRGTFSVLVSHTCBCSTSBFRAHASPHCmAPFPS
t w o - s t a g e :
FR-O [50]R-10179.4277.1317.7064.0535.3038.0237.1689.4169.6459.2850.3052.9147.8947.4046.3054.13-
Azimi et al. [53]R-10181.3674.3047.7070.3264.8967.8269.9890.7679.0678.2053.6462.9067.0264.1750.2368.16-
RoITransformer * [26]R-10188.6478.5243.4475.9268.8173.6883.5990.7477.2781.4658.3953.5462.8358.9347.6769.565.9
CAD-Net [54]R-10187.8082.4049.4073.5071.1063.5076.6090.9079.2073.3048.4060.9062.0067.0062.2069.90-
SCRDet [4]R-10189.9880.6552.0968.3668.3660.3272.4190.8587.9486.8665.0266.6866.2568.2465.2172.61-
GLS-Net [5]R-10188.6577.4051.2071.0373.3072.1684.6890.8780.4385.3858.3362.2767.5870.6960.4272.96-
Xu et al. [55]R-10189.6485.0052.2677.3473.0173.1486.8290.7479.0286.8159.5570.9172.9470.8657.3275.0210.0
Mask OBB [6]R-5089.6185.0951.8572.9075.2873.2385.5790.3782.0885.0555.7368.3971.6169.8766.3374.86-
Mask OBB [6]R-10189.5685.9554.2172.9076.5274.1685.6389.8583.8186.4854.8969.6473.9469.0663.3275.33-
F 3 -Net [1]R-15288.8978.4854.6274.4372.8077.5287.5490.7887.6485.6363.8064.5378.0672.3663.1976.02-
o n e - s t a g e :
RetinaNet [15]R-10188.8281.7444.4465.7267.1155.8272.7790.5582.8376.3054.1963.6463.7169.7353.3768.7212.7
A 2 S-Det [23]R-5089.4578.5242.7853.9376.3774.6286.0390.6883.3583.5548.5860.5163.4671.3353.1070.42-
A 2 S-Det [23]R-10189.5977.8946.3756.4775.8674.8386.0790.5881.0983.7150.2160.9465.2969.7750.9370.64-
DRN [52]H-10488.9180.2243.5263.3573.4870.6984.9490.1483.8584.1150.1258.4167.6268.6052.5070.70-
DRN * [52]H-10489.7182.3447.2264.1076.2274.4385.8490.5786.1884.8957.6561.9369.3069.6358.4873.23-
R 3 Det [30]R-10189.5481.9948.4662.5270.4874.2977.5490.8081.3983.5461.9759.8265.4467.4660.0571.69-
R 3 Det [30]R-15289.4981.1750.5366.1070.9278.6678.2190.8185.2684.2361.8163.7768.1669.8367.1773.74-
S 2 A-Net [17]R-10188.7081.4154.2869.7578.0480.5488.0490.6984.7586.2265.0365.8176.1673.3758.8676.1112.7 /9.3 §
S 2 A-Net * [17]R-10189.2884.1156.9579.2180.1882.9389.2190.8684.6687.6171.6668.2378.5878.2065.5579.1512.7 /9.3 §
S 2 A-Net * [17]R-5088.8983.6057.7481.9579.9483.1989.1190.7884.8787.8170.3068.2578.3077.0169.5879.4216.0 /11.6 §
o u r s : -
SARA (Ours)R-10189.2084.6055.9473.7179.7782.0388.9990.7585.7087.2562.3666.6178.9475.5767.6077.938.8 §
SARA (Ours) *R-10189.2482.8157.4481.2180.2383.5489.2990.7585.5588.0769.7066.1178.9275.5368.6279.138.8 §
SARA (Ours)R-5089.1385.8154.8873.3980.3181.8489.0790.7887.4587.0265.0266.5278.3880.0870.1378.6510.9 §
SARA (Ours) *R-5089.4084.2956.7282.2980.4983.0189.3790.6786.2087.4471.3469.0678.4980.9868.9879.9110.9 §
Publisher’s Note: MDPI stays neutral with regard to jurisdictional claims in published maps and institutional affiliations.