Article

Precipitation Drives the NDVI Distribution on the Tibetan Plateau While High Warming Rates May Intensify Its Ecological Droughts

1
Key Laboratory of Forest Ecology and Management, Institute of Applied Ecology, Chinese Academy of Science, Shenyang 110016, China
2
Key Laboratory of Land Surface Pattern and Simulation, Institute of Geographic Sciences and Natural Resources Research, Chinese Academy of Science, Beijing 100101, China
3
Academy of Plateau Science and Sustainability, Xining 810016, China
*
Author to whom correspondence should be addressed.
Remote Sens. 2021, 13(7), 1305; https://doi.org/10.3390/rs13071305
Submission received: 22 February 2021 / Revised: 18 March 2021 / Accepted: 26 March 2021 / Published: 29 March 2021

Abstract

:
Climate change has significantly affected the ecosystem of the Tibetan Plateau. There, temperature rises and altered precipitation patterns have led to notable changes in its vegetation growth processes and vegetation cover features. Yet current research still pays relatively little attention to the regional climatic determinants and response patterns of such vegetation dynamics. In this study, spatial patterns in the response of the normalized difference vegetation index (NDVI) to climate change and its dynamic characteristics during the growing season were examined for the Tibetan Plateau, by using a pixel-scale-based geographically weighted regression (GWR) based on the Global Inventory Modeling and Mapping Studies (GIMMS) NDVI data, as well as data for temperature and moisture indices collected at meteorological stations, for the period 1982–2015. The results show the following. Spatial nonstationary relationships, primarily positive, were found between the NDVI and climatic factors in the Tibetan Plateau. However, warming adversely affected vegetation growth and cover in some arid and semiarid regions of the northeast and west Tibetan Plateau. Additionally, precipitation played a dominant role in the NDVI of the Tibetan Plateau in the largest area (accounting for 39.7% of total area). This suggests that increased moisture conditions considerably facilitated vegetation growth and cover in these regions during the study period. Temperature mainly played a dominant role in the NDVI in some parts of the plateau sub-cold zone and some southeastern regions of the Tibetan Plateau. In particular, the minimum temperature was the dominant driver of NDVI over a larger area than any of the other temperature indices. Furthermore, spatial regressions between NDVI dynamics and climatic variability revealed that a faster warming rate in the arid and semiarid regions impeded vegetation growth through mechanisms such as drought intensification. Moisture variability was found to act as a key factor regulating the extent of vegetation cover on the south Tibetan Plateau.

Graphical Abstract

1. Introduction

Hydrothermal conditions in the climatic environment are the primary nonbiological factors that determine vegetation characteristics (e.g., phenology, productivity, and distribution patterns of plants) and their dynamic variation [1,2]. The normalized difference vegetation index (NDVI) is a commonly used index to study vegetation growth and cover, and it has been extensively applied on various regional scales [3,4]. Time-series NDVI data are often used to analyze the characteristics of changes in vegetation and their relationships with climatic factors [5]. However, while able to promote vegetation growth and development as well as the physiological and biochemical attributes of vegetation, changes in climatic conditions may also adversely affect vegetation growth and cover and display a pronounced nonlinear pattern of action [6,7]. Thus, climate change will inexorably alter vegetation habitats and thereby influence its growth conditions and, to a significant extent, its key characteristics (e.g., geographical distribution and diversity) [8]. Hence, studying the relationship between climate and vegetation can provide a theoretical basis for coping with climate change and improving and optimizing ecological functions, making it an important area of current research on global change [9].
Due to its geographical conditions—high altitudes and middle-low latitudes—and special underlying surface features (e.g., permafrost), the Tibetan Plateau, also known as the “Third Pole” of the Earth, is a region quite sensitive to global change, one that significantly influences the climate in its surrounding regions or even at the global scale [10]. Since the 1980s, the Tibetan Plateau has experienced notable warming, at a rate approximately twice the global average [11], which has had an immense impact on its terrestrial carbon sink [12]. Studies in recent years have demonstrated that the vegetation greening trend on the Tibetan Plateau is driven by climate change [13,14]. By integrating multiple models, research has shown that the contribution of climate change to gross primary productivity has surpassed that of land use and carbon dioxide concentration on the Tibetan Plateau [15]; however, this negative warming effect upon vegetation productivity generally occurs in relatively arid regions. This is because warming intensifies the evapotranspiration, which then amplifies soil moisture deficiencies [16,17]. Thus, the response of vegetation to climate change may be even more complex under the dual stresses of frigidity and aridity [18]. Evidently, examining the impact of climate change on the dynamics and regional distribution of vegetation on the Tibetan Plateau has paramount ecological value and practical significance for deepening our understanding of global climate change and protecting the ecological environment.
Current research concerned with ecosystems of the Tibetan Plateau tends to mostly focus on the pattern of change in alpine grassland and its correlation with hydrothermal factors amidst climatic warming. Nonetheless, it remains necessary to advance research into distinguishing the regional climatic determinants and the response mechanisms of vegetation dynamics and their corresponding spatial pattern on a macroscopic scale [19]. Further, the superimposition of multiple climatic factors compounds the uncertainty in the investigation of their relationships with vegetation growth and cover [20]. In this context, based on the eco-geographical regionalization of the Tibetan Plateau, this study analyzed the spatial nonstationary relationships of NDVI vis-à-vis various climatic factors and their respective variability over a recent time period (at least 30 years), by using such methods as geographically weighted regression (GWR), with two objectives in mind. Firstly, to determine the role of climatic factors in controlling alpine vegetation and its general distribution pattern, and secondly, to examine the spatial pattern of the response of vegetation dynamics to climate change from 1982 to 2015, both under the overarching aim to continuing to strengthen research on the relationships between vegetation and climate on the Tibetan Plateau.

2. Materials and Methods

2.1. Study Region

Situated in southwest China, the Tibetan Plateau is a vast region spanning six provinces (Tibet, Qinghai, Sichuan, Yunnan, Gansu, and Xinjiang) which, at an average altitude of over 4000 m, is known as the “Roof of the World”. The Tibetan Plateau is an important ecological security barrier in China. Climatically, the Tibetan Plateau is characterized by intense radiation, low temperatures, and wide daily temperature difference (14~17 °C) and annual temperature range (−5.6~17.6 °C). Annual average precipitation in this region is mostly below 400 mm, and moisture and thermal conditions transition from warm and wet to cold and dry from southeast to northwest. Alpine grassland is the predominant type of vegetation in this region, which accounts for one third of China’s total grassland area [21]. Zonally, vegetation transitions from forests to meadows, to steppes, and eventually deserts, when going from east to west on the Tibetan Plateau. For the analysis, it was divided into 10 ecoregions (Figure 1, Table 1) according to the eco-geographical regions established for China by Zheng [22].

2.2. Climatic Variables

Two types of climatic variables, namely temperature variables (mean temperature, Tave; maximum temperature, Tmax; and minimum temperature, Tmin) and moisture variables (precipitation, P; and relative humidity, RH), were used in this study. These data are available from the China Meteorological Data Service Center. We collected monthly data sets produced by 135 meteorological stations on the Tibetan Plateau from 1982 to 2015. Then, the station climate data were interpolated using the Auspline v4.2 to 8-km raster data, to match the spatial resolution of the NDVI, with a view to facilitating subsequent analyses and computations. Finally, climate data for a randomly chosen period, collected at the meteorological stations not previously used (because of missing data for some months) in the interpolation procedure, were selected to compare with and validate the values in the corresponding interpolated grid cells. The correlation coefficients (Pearson’s r) between the interpolated data for each of the three temperature indices and their measured values were >0.99, while those for P and RH were 0.86 and 0.89, respectively. Hence, the interpolation accuracy was relatively high and thus met the requirements for a robust study of their overall patterns on the Tibetan Plateau. After these treatments, the monthly temperature variables and relative humidity during the growing season (from May to September) were averaged to obtain interannual data, and the annual total precipitation was obtained by summing the monthly data of the growing season.

2.3. Normalized Difference Vegetation Index (NDVI)

The NDVI dataset (temporal resolution: 15 days; spatial resolution: 8 km) for the 1982–2015 period provided by the Global Inventory Monitoring and Modeling Studies (GIMMS) is used here to derive vegetation growth and cover indices. Characterized by relatively high accuracy and a long time series, the GIMMS NDVI dataset has been extensively used to study global and regional large-scale changes in vegetation [23,24,25]. Monthly NDVI values were then calculated using the maximum value composite (MVC) method. On this basis, monthly average NDVI values for the growing season (based on previous studies obtained for the Tibetan Plateau, the growing season was defined here as the period from May to September each year) were obtained. In addition, regions with annual average NDVI values <0.1 were removed, to eliminate the effects of non-vegetation factors [26]. It should be noted that non-vegetation area accounted for a large proportion in some arid regions (ER1D1, ER2D1, and ER2D2), which were not considered in this study. Subsequently, the spatial relationship between the monthly average NDVI and climate variables was analyzed by the methods mentioned in the following sections.

2.4. Spatial Autocorrelation

The precondition for using geographically weighted regression (GWR, see Section 2.6) is that geospatially correlated independent and dependent variables differ spatially, i.e., the regression coefficient varies with the spatial location of the independent variable [27]. The Moran’s I index is a measure of global spatial autocorrelation that reflects the extent of the similarity between the attribute values of a spatial variable in adjacent spaces. The Moran’s I is calculated this way:
I = n i = 1 n j = 1 n W i j ( x i x ¯ ) ( x j x ¯ ) i = 1 n j = 1 n W i j i = 1 n ( x i x ¯ ) 2
where Wij is the spatial connection matrix between points i and j; the n is the total number of spatial locations, and the xi and xj are the spatial attribute values of points i and j, respectively, while x ¯ is the average value of the variable in all the spaces. The value of I ranges from –1 to 1. When I > 0, it means the variable is positively spatially autocorrelated. Conversely, when I < 0, the variable is negatively spatially autocorrelated. When I = 0, however, the variable is not spatially correlated.
Usually, the standard Z-statistic is used to examine the significance of the Moran’s I:
Z = I E I var ( I )
where EI and var(I) are the mean and variance of the Moran’s I, respectively. A positive and statistically significant Z-score indicates a positive spatial autocorrelation and that similar attribute values tend to cluster spatially. A negative and statistically significant Z-score indicates a negative spatial autocorrelation and that similar attribute values tend to disperse spatially. Accordingly, Z-score of 0 indicates that the attribute values of the spatial variable are distributed independently and randomly.

2.5. Trend Analysis

In this study, the interannual trends of change in the growing-season climate and vegetation indices were analyzed using the grid-scale-based ordinary least-squares (OLS) method [28]. The equation for trend analysis is given by:
θ s l o p e = n × i = 1 n i × Y i i = 1 n i i = 1 n Y i n × i = 1 n i 2 ( i = 1 n i ) 2
where θ s l o p e is the slope of the linear regression, which conveys the trend and rate of change in the climate or vegetation index for the Tibetan Plateau, Yi is the value of the climate or vegetation index of the ith year, and n is the total number of years examined in this study (n = 34).

2.6. Geographically Weighted Regression (GWR)

GWR, originally proposed by Brunsdon et al. [29], is a method used to extend ordinary linear regression (e.g., OLS) when carrying out local spatial analyses. Using this method can clarify changes in the spatial relationships within a given region, for better understanding. The GWR’s parameters are a function of spatial location, in this way:
y i = β 0 ( μ i , ν i ) + k = 1 p β k ( μ i , ν i ) x i k + ε i
where yi, xik, and εi are, respectively, the dependent variable (NDVI/NDVI variation), independent variable (climate variable/variability), and random error at the spatial point i; the (μi, vi) is the spatial location of point i; the k is the number of independent variables; the βk is the regression coefficient at point i; and the β0 is the intercept.
A Gaussian model is generally used as the weight function for the GWR method, as follows:
ω i j = exp ( d i j 2 b 2 )
where ωij is the weight of observation point j of point i; the dij is the Euclidean distance between points i and j; and the b is the bandwidth, which is a function that describes how weight and distance are related. When dij > b, the ωij = 0; conversely, when dij = 0, the ωij = 1. Here, the corrected Akaike information criterion (AICc) was employed to evaluate model complexity and accuracy, as well as to determine an optimum b value. Lower AICc values indicate better-performing models for a given simulation. Generally, when the difference of AICc values between two models is greater than 3, the model with the lower AICc value has the optimum b value [30].
Here, GWR considered both the spatial distribution and the dynamics patterns to reveal the spatial variations in relationships between NDVI and climate variables. First, the annual average climatic variables and NDVI should be conducted with normalization by using the maximum–minimum standardized treatment [31], making the scopes from 0 to 1, and then the normalized climatic variables and NDVI were used as independent and dependent variables, respectively, to calculate the regression coefficients, which indicated the spatial relationship between NDVI and climatic factors. The purpose of normalized coefficients was to compare the results from climate variables in different dimensions, and this treatment did not affect the spatial relationship between climate and vegetation. Second, the climatic determinants for NDVI can be obtained by comparing the regression coefficients for different climate variables, combined with the NDVI and climate trends. If variations in both temperature and moisture factors coupled with relevant spatial relationship were inconsistent with the varying trend of NDVI (that is, θslope_climateβkθslope_NDVI < 0), non-hydrothermal factors (such as radiation, terrain and grazing) could be the dominant driver of vegetation growth and cover. At last, the interannual variability of climate variable (hereafter, climate variability) and NDVI variation during the study period were used in the GWR as independent and dependent variables, respectively, to evaluate the spatial correlation of climate change and vegetation dynamics.

3. Results

3.1. Nonstationarity test of NDVI and Climate Change

First, the GWR coefficients of the mean and variability of each climatic factor were subjected to a spatial autocorrelation analysis, to determine whether their relationships of NDVI and its dynamics to climate change are spatially stationary (Table 2). These results showed that the autocorrelation indices of the GWR coefficients were all > 0.8. This suggested that the selected coefficients were highly spatially autocorrelated; that is, they are spatially nonstationary. Additionally, each coefficient had a Z-score well above 2.58, which is statistically significant at an alpha level of 0.01. Thus, GWR can comprehensively display the quantitative effects of the climatic factors on the NDVI and its dynamics in different regions.

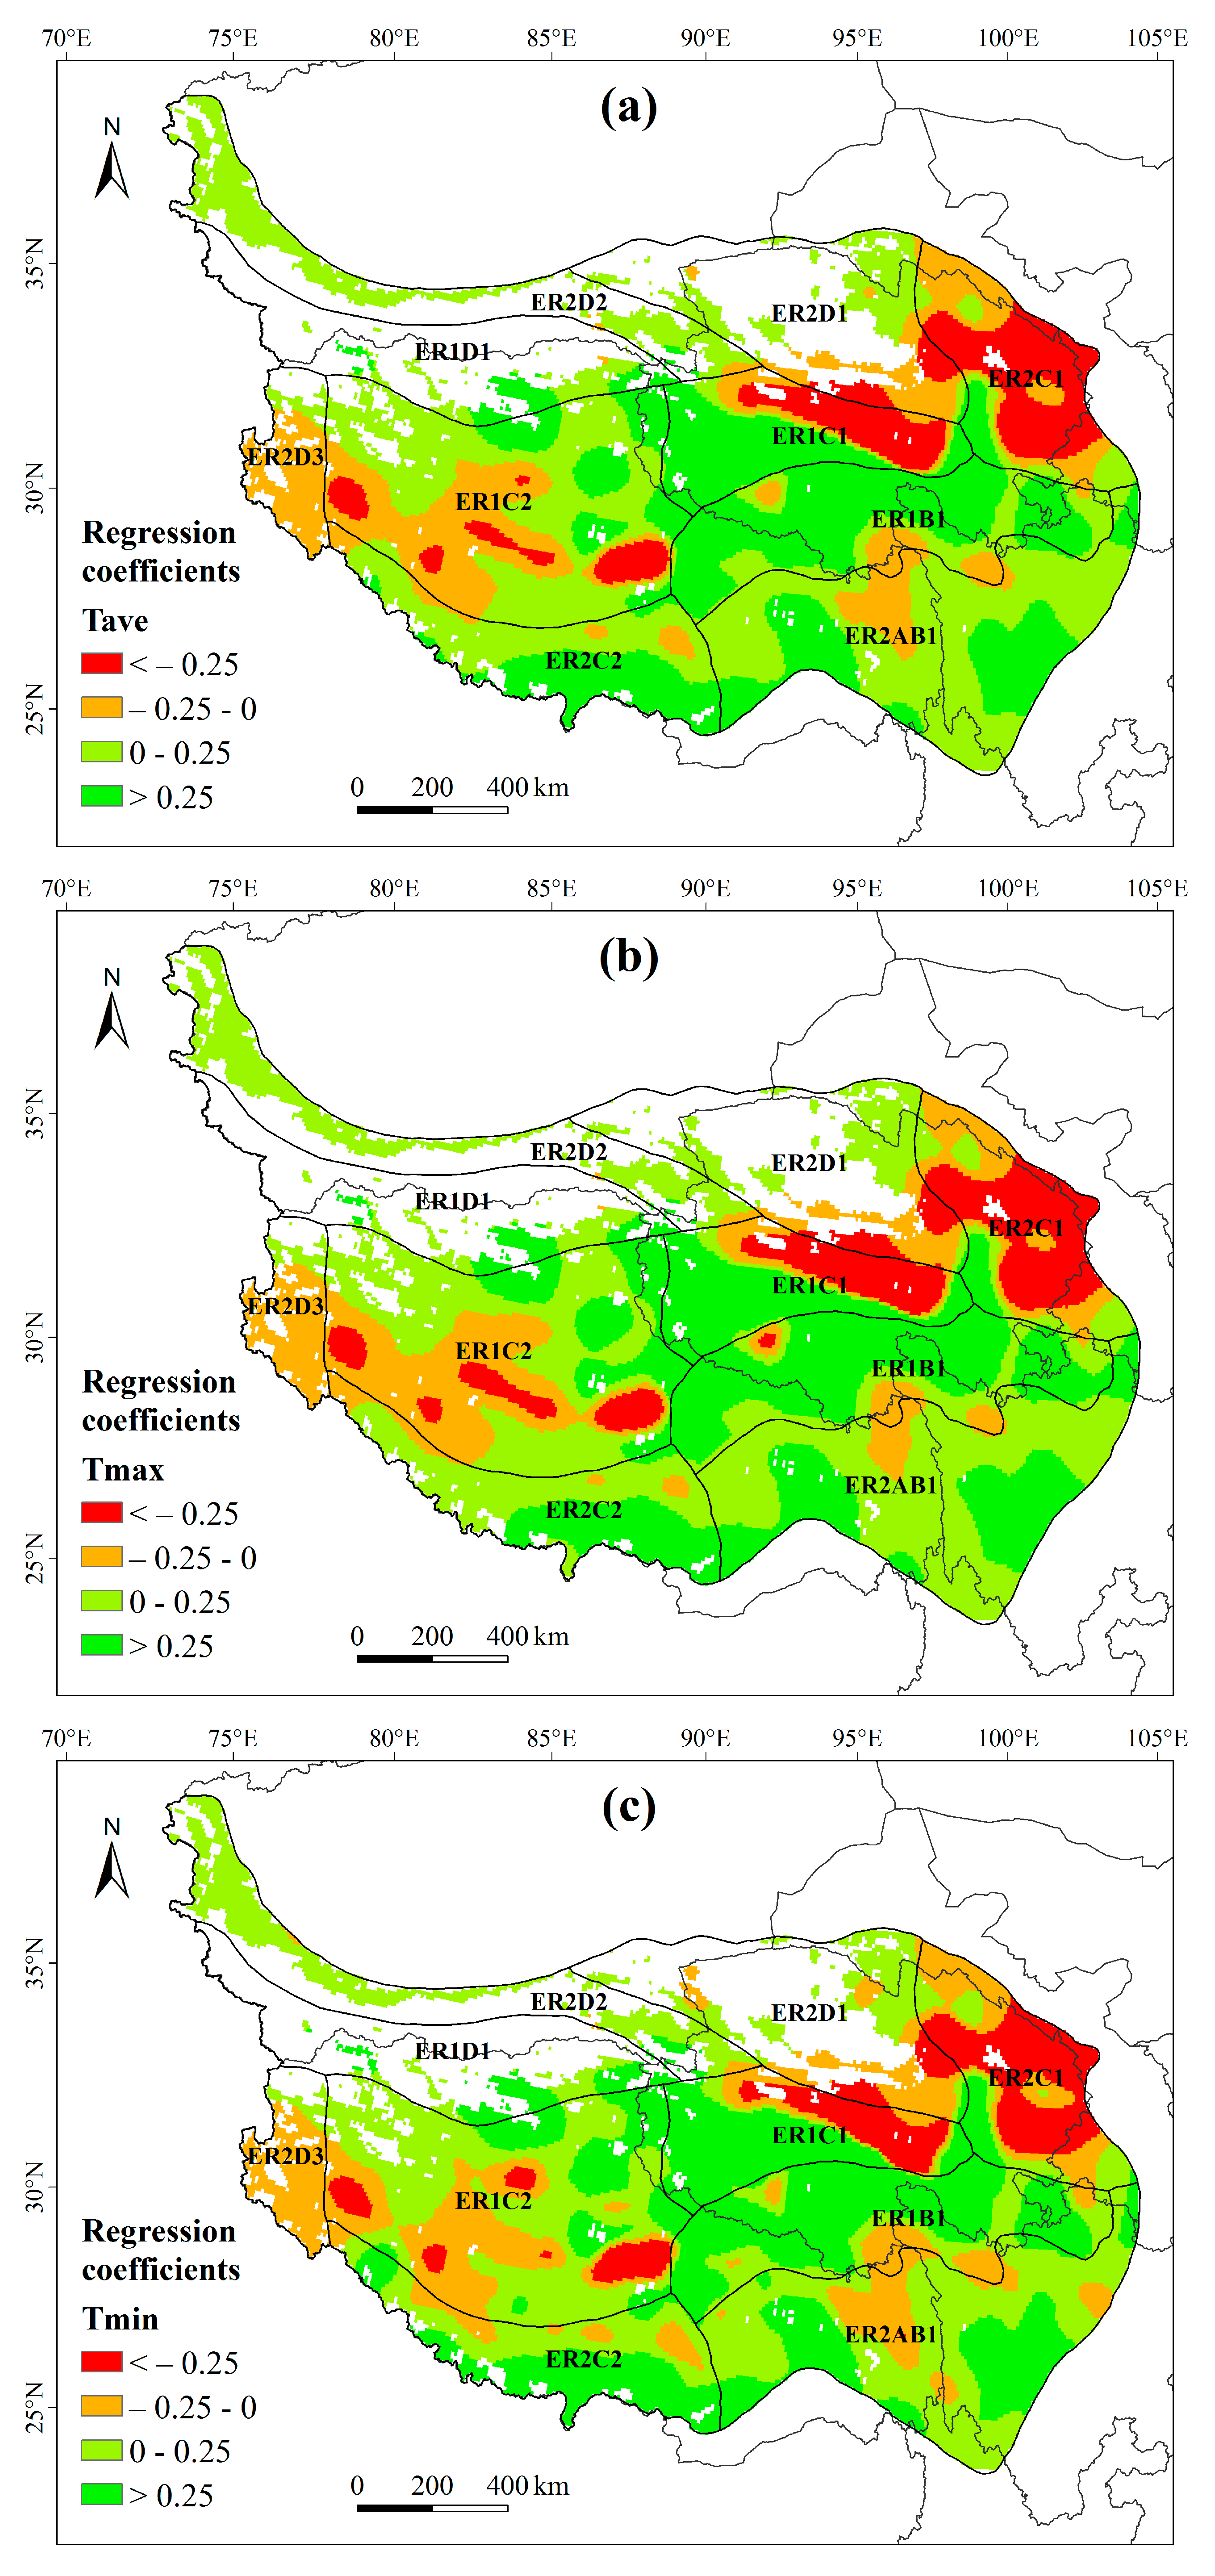
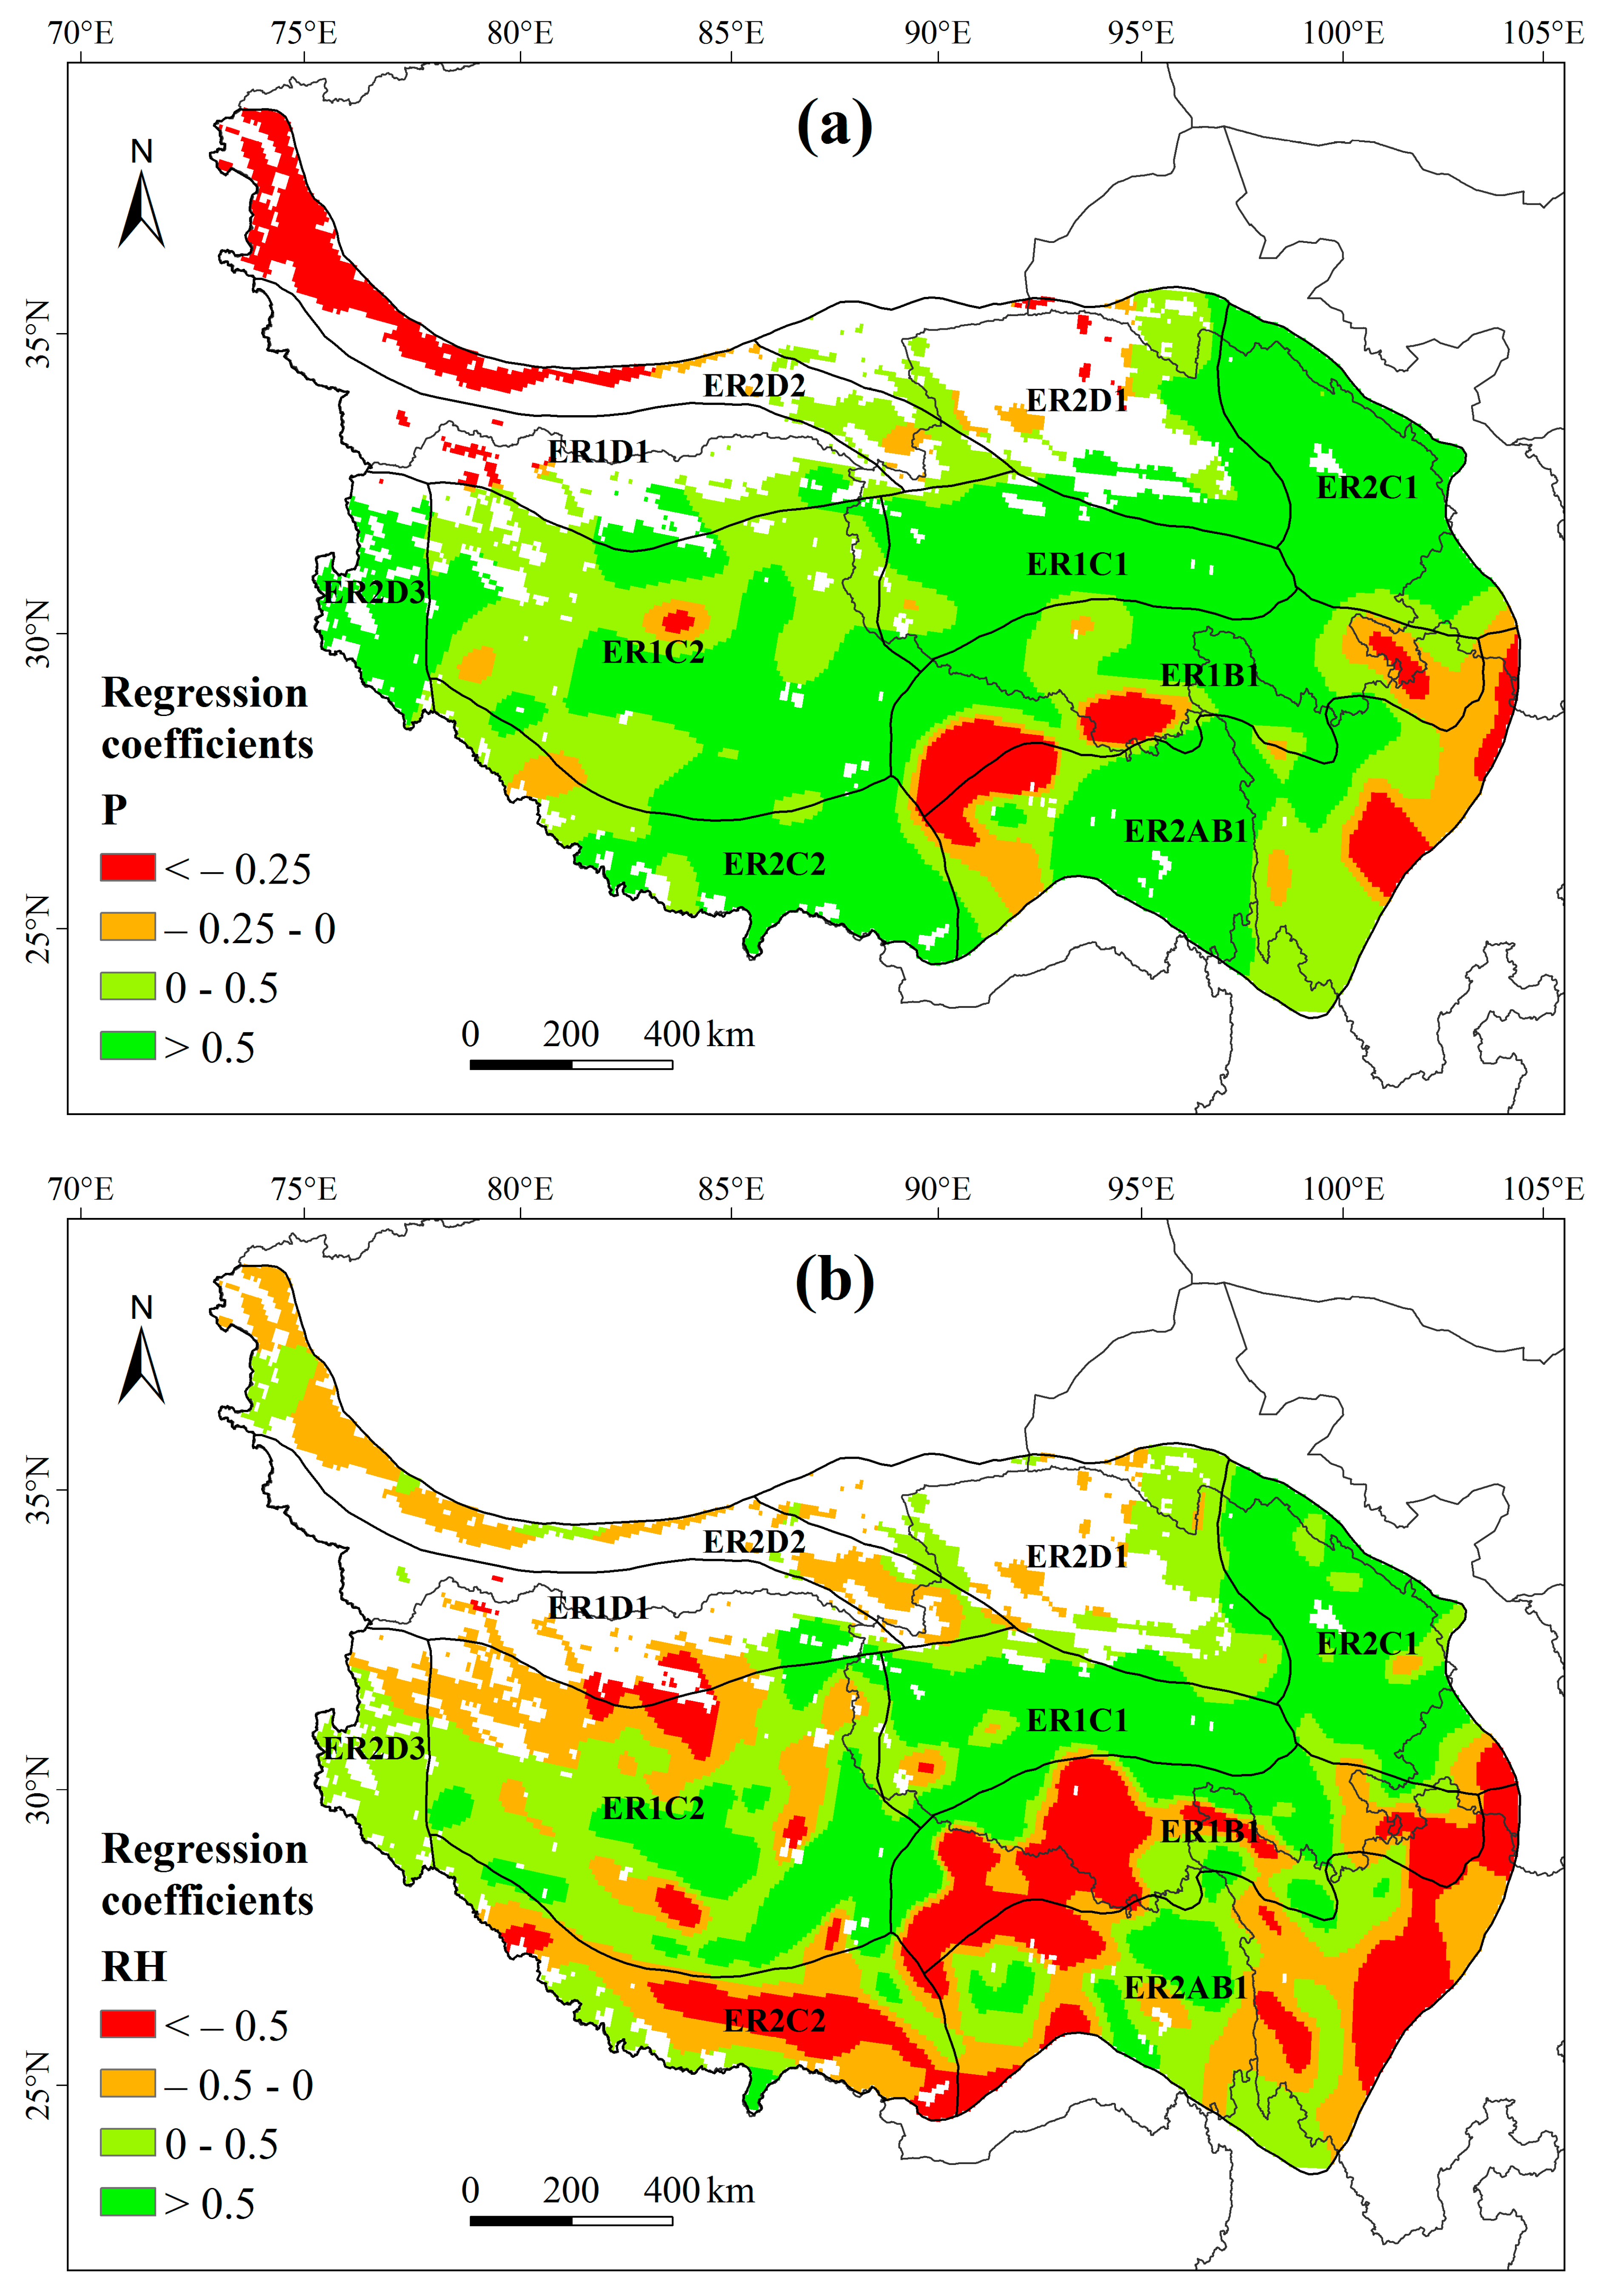
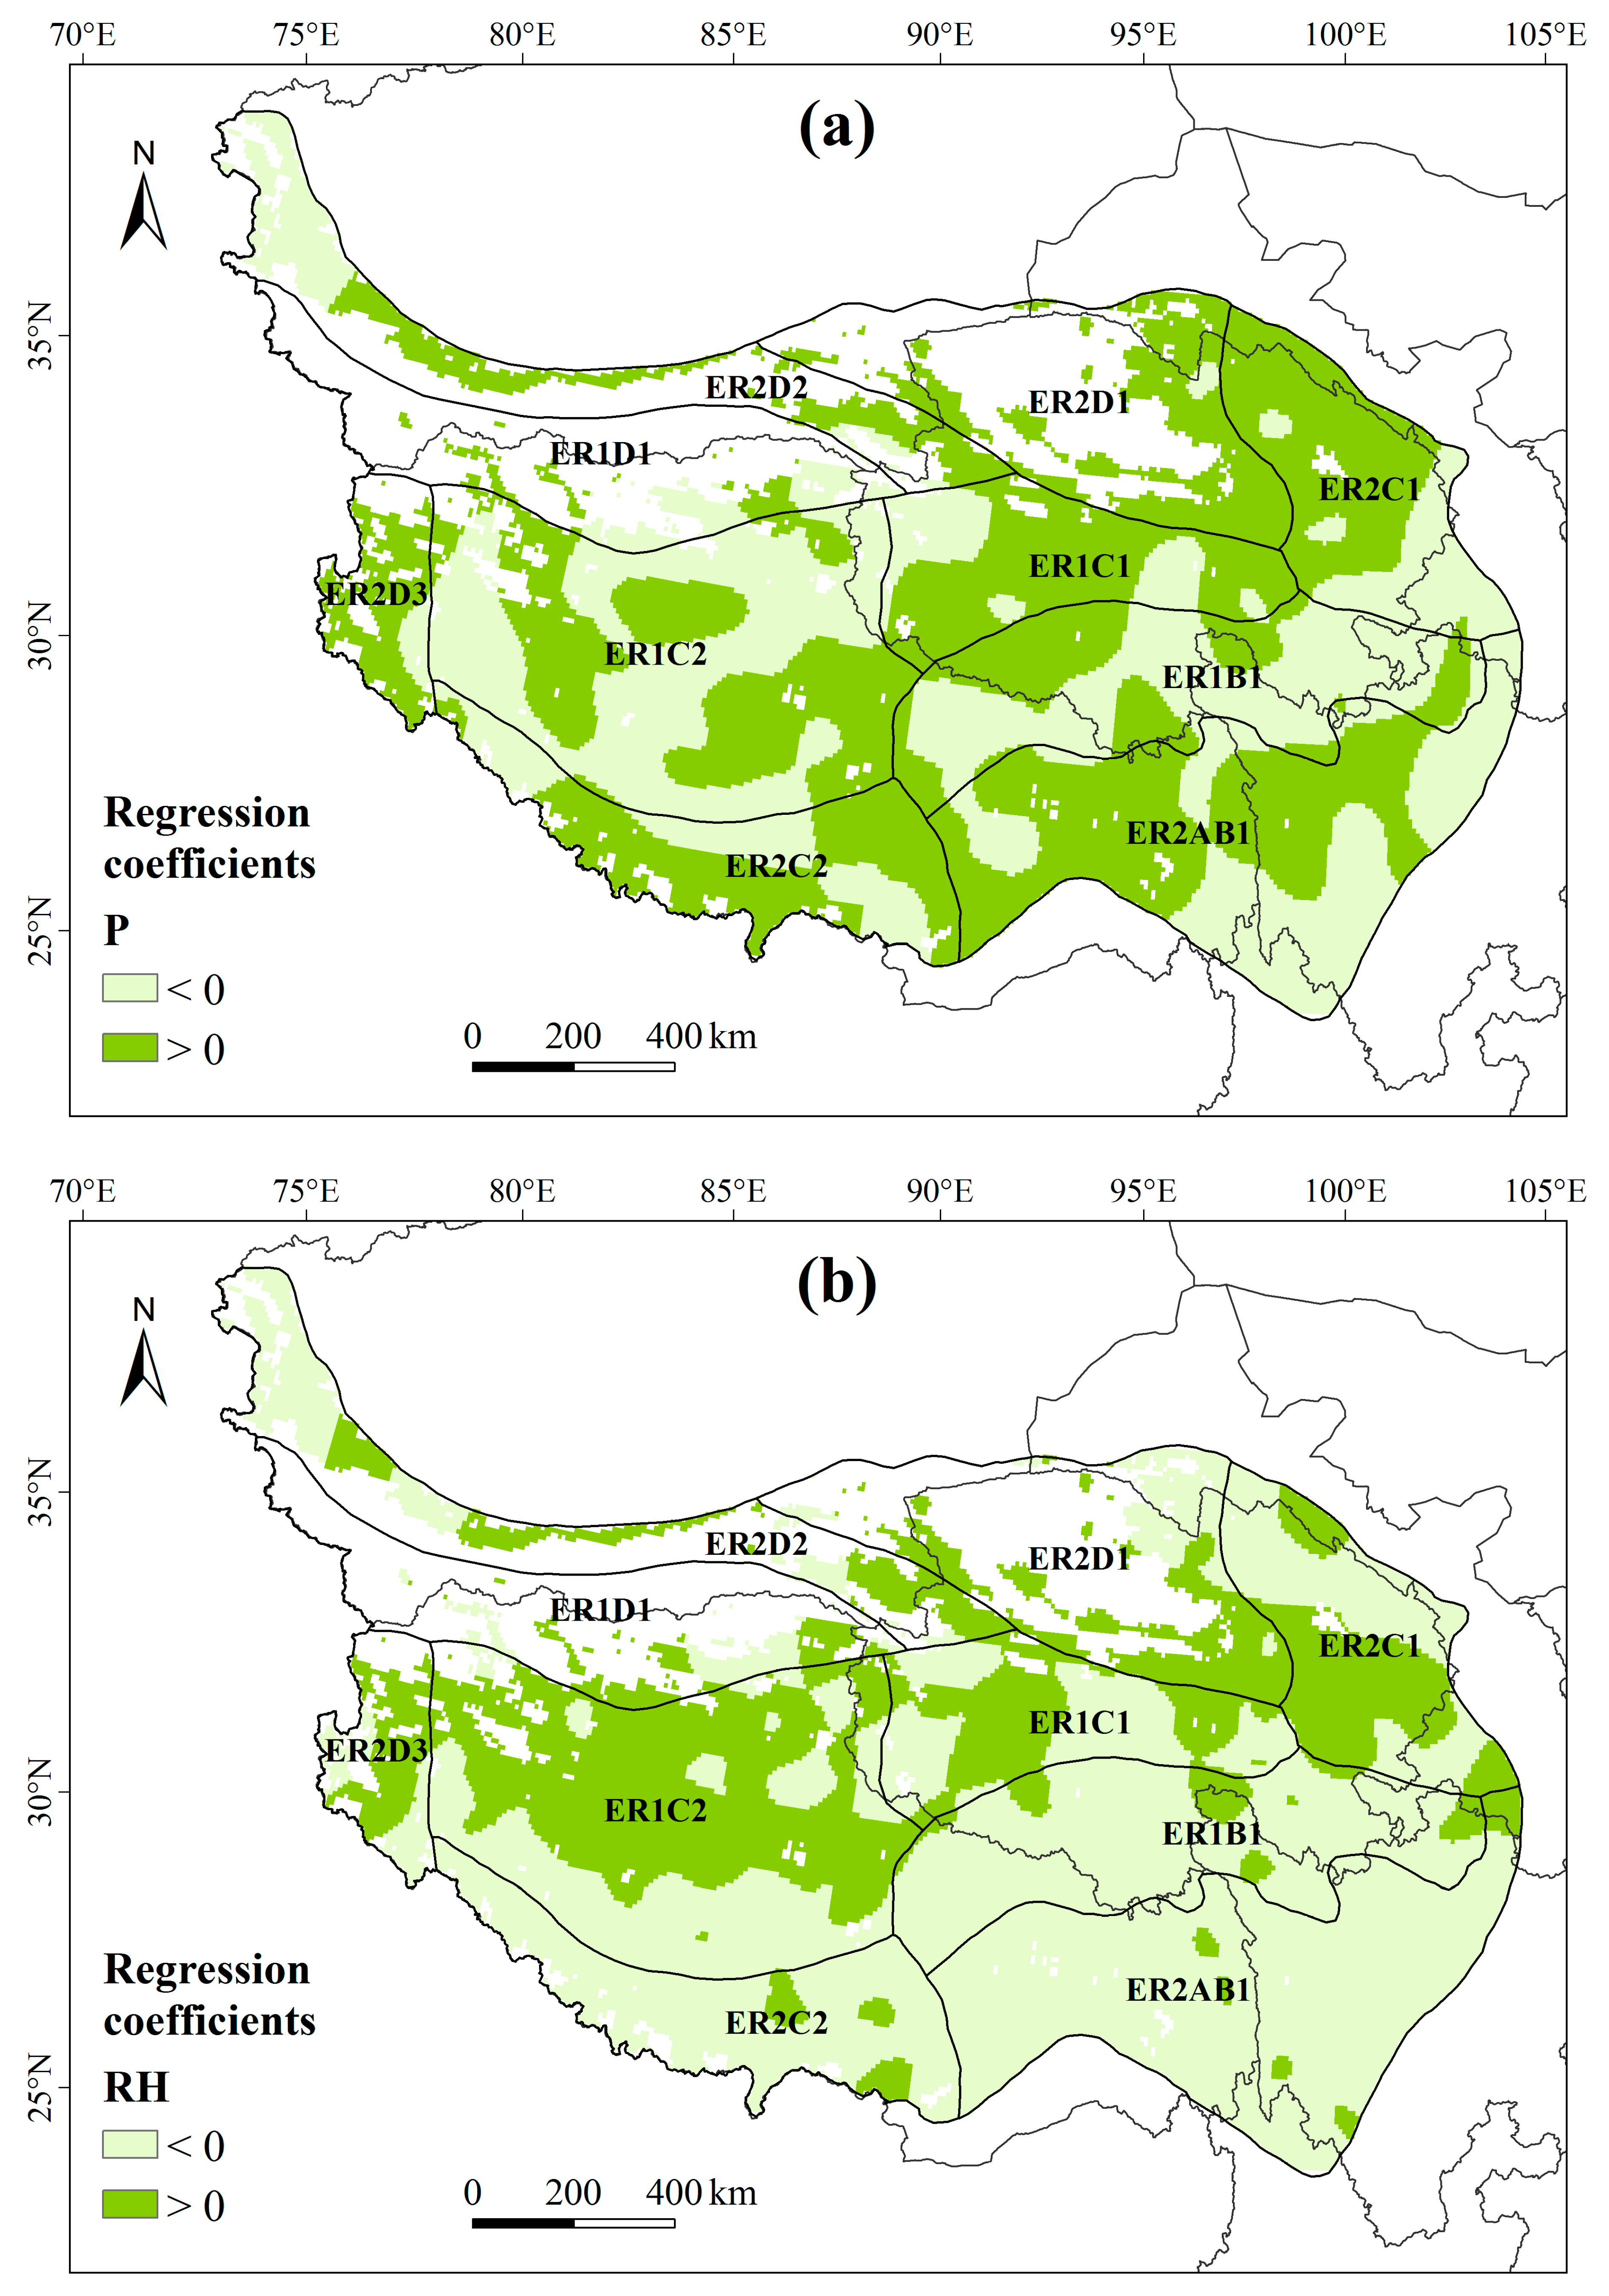
3.2. Spatial Nonstationary Relationship Between NDVI and Climatic Factors

It can be seen from the interannual variability of climate variables during the growing season of the study period (Table 3) that the Tibetan Plateau had experienced a significant warming with a rate of 0.42°C/decade. In arid and semiarid regions, the warming rates were faster, and the Tmin varied more obviously. Precipitation also showed an increasing trend. Areas with a faster increase rate of precipitation appeared in the semiarid region of the plateau sub-cold zone, but the precipitation rate in the sub-humid and arid regions increased slowly. The RH trend was nearly constant throughout the Tibetan Plateau during the study period, and all ecoregions except the semiarid region of the plateau sub-cold zone showed a downward trend. Spatially, the three temperature variables showed increasing trends in almost all regions of the Tibetan Plateau, and the precipitation in most regions was also an upward trend (Figure 2b). The RH trend, however, was decreasing in the southeastern parts of the Tibetan Plateau (Figure 2c).
The GWR results for the NDVI and temperature indices revealed a positive spatial correlation in most regions of the Tibetan Plateau (Figure 3). This indicated that warming, to a certain extent, facilitated vegetation growth on the Tibetan Plateau. A negative spatial correlation was found between the NDVI and each of the three temperature indices in some arid and semiarid regions (e.g., ER1C1, ER1C2, ER2C1, and ER2D3). Temperature rises accelerated the evapotranspiration of soil moisture and further increased the extent of droughts and, as a result, reduced the vegetation cover. This phenomenon was particularly prominent in region ER2C1 and the northeastern part of region ER1C1.
The GWR results for the NDVI and moisture indices showed a positive spatial correlation between the NDVI and precipitation in most regions of the Tibetan Plateau (Figure 4a), so an increase in precipitation could increase the NDVI in these regions. A negative spatial correlation between the NDVI and RH was found in some southern and northwestern regions of the Tibetan Plateau (Figure 4b). An increase in RH might result in stomatal closure in vegetation and weaken its transpiration [32] and, as a result, inhibit its growth and development. This phenomenon was the most prominent in some parts of southern regions, namely, ER1B1, ER2AB1, and ER2C2.

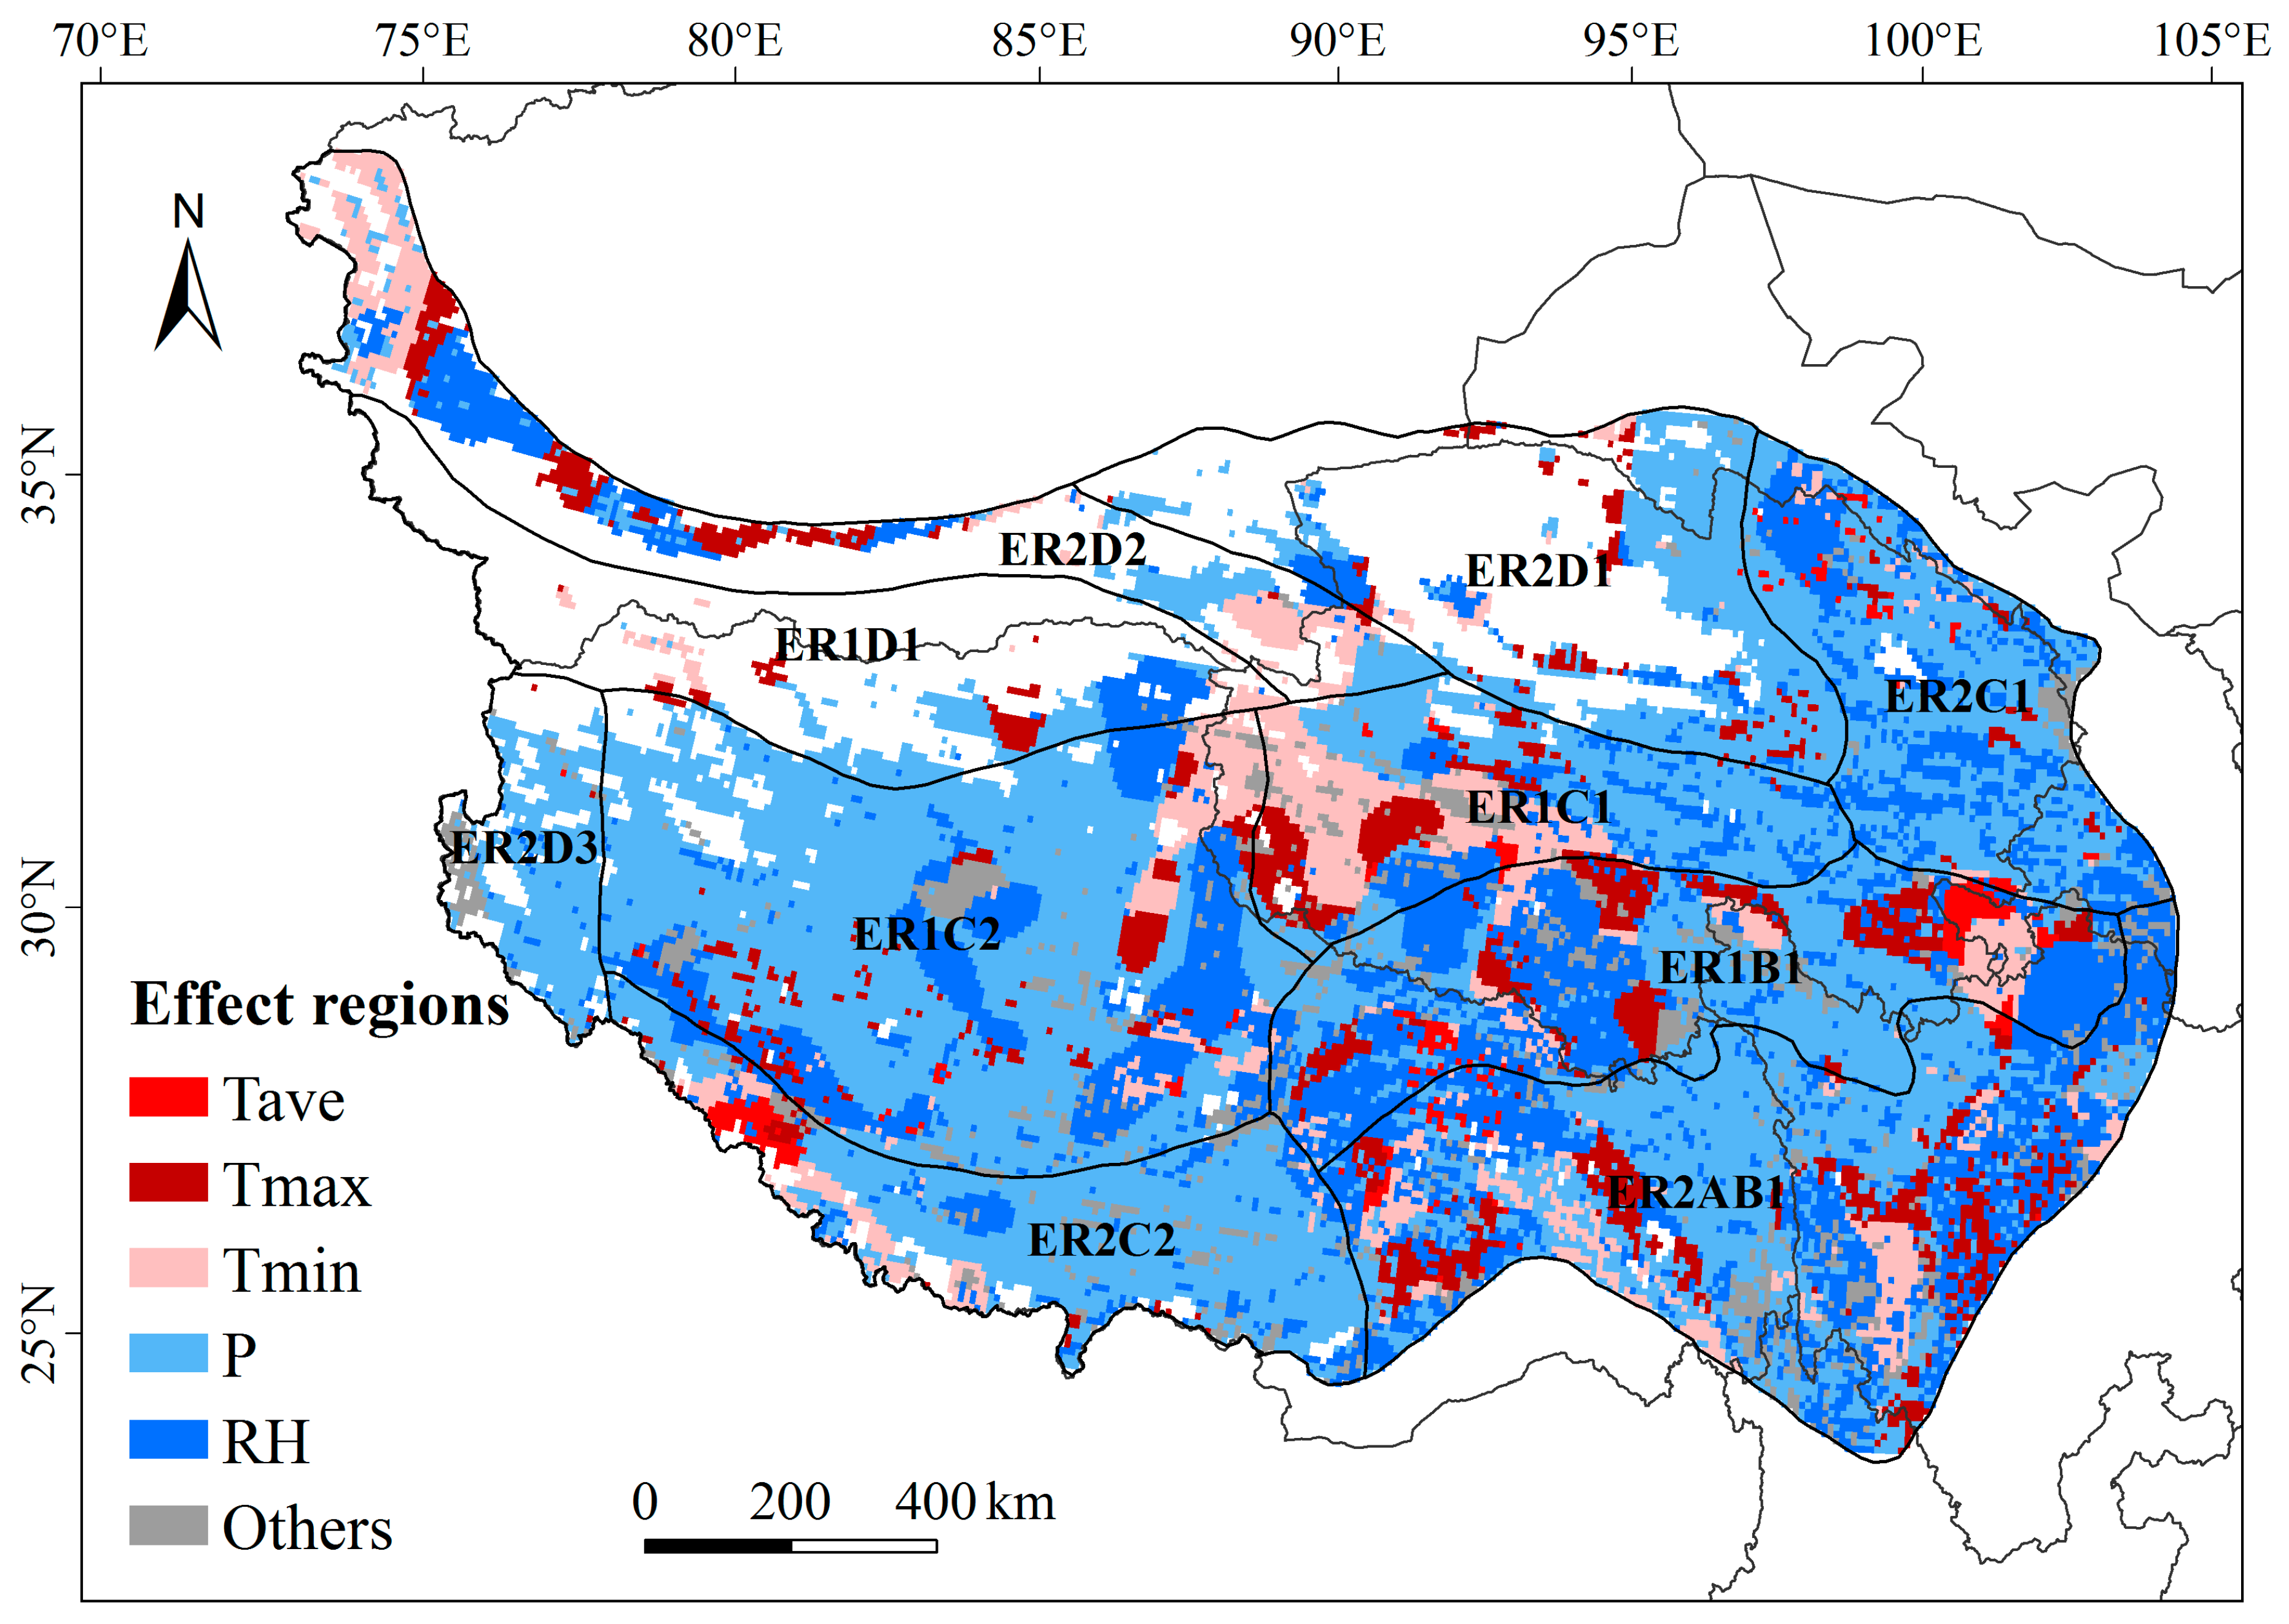
3.3. Climate Determinants for NDVI in Different Ecoregions

The spatial domain of climatic determinants for NDVI is shown in Figure 5. In terms of the overall pattern, precipitation was predominantly involved in NDVI, accounting for 39.7% of the Tibetan Plateau’s total area, a proportion larger than that of any other index (Table 4). In the period of more than 30 years examined in this study, the NDVI increased mainly in those regions where precipitation increased prominently (Figure 2a). Thus, the increase in precipitation played a vital role in fostering a gradual increase in vegetation cover. RH was found to have played a dominant role in the NDVI in the western part of region ER1B1, the eastern part of region ER2AB1, and some parts of region ER1C2. In addition, a negative spatial correlation was mostly found between RH and NDVI. Thus, at least spatially, vegetation growth in these regions was hindered by RH.
The regions of dominant effect of temperature on the NDVI were mainly distributed in some parts of the plateau sub-cold zone (ER1) and region ER2AB1 of the Tibetan Plateau. Among the three temperature indices, the effect of Tmin was the most pronounced, influencing NDVI over the largest area (7.1%) of the Tibetan Plateau (Table 4). This dominant role of Tmin was most prominent in the southwestern part of region ER1C1 and the northeastern part of region ER1C2. A positive correlation was found between the NDVI and each of the temperature indices in these regions; this suggested that, at least spatially, gradual temperature rises could foster greater vegetation cover.

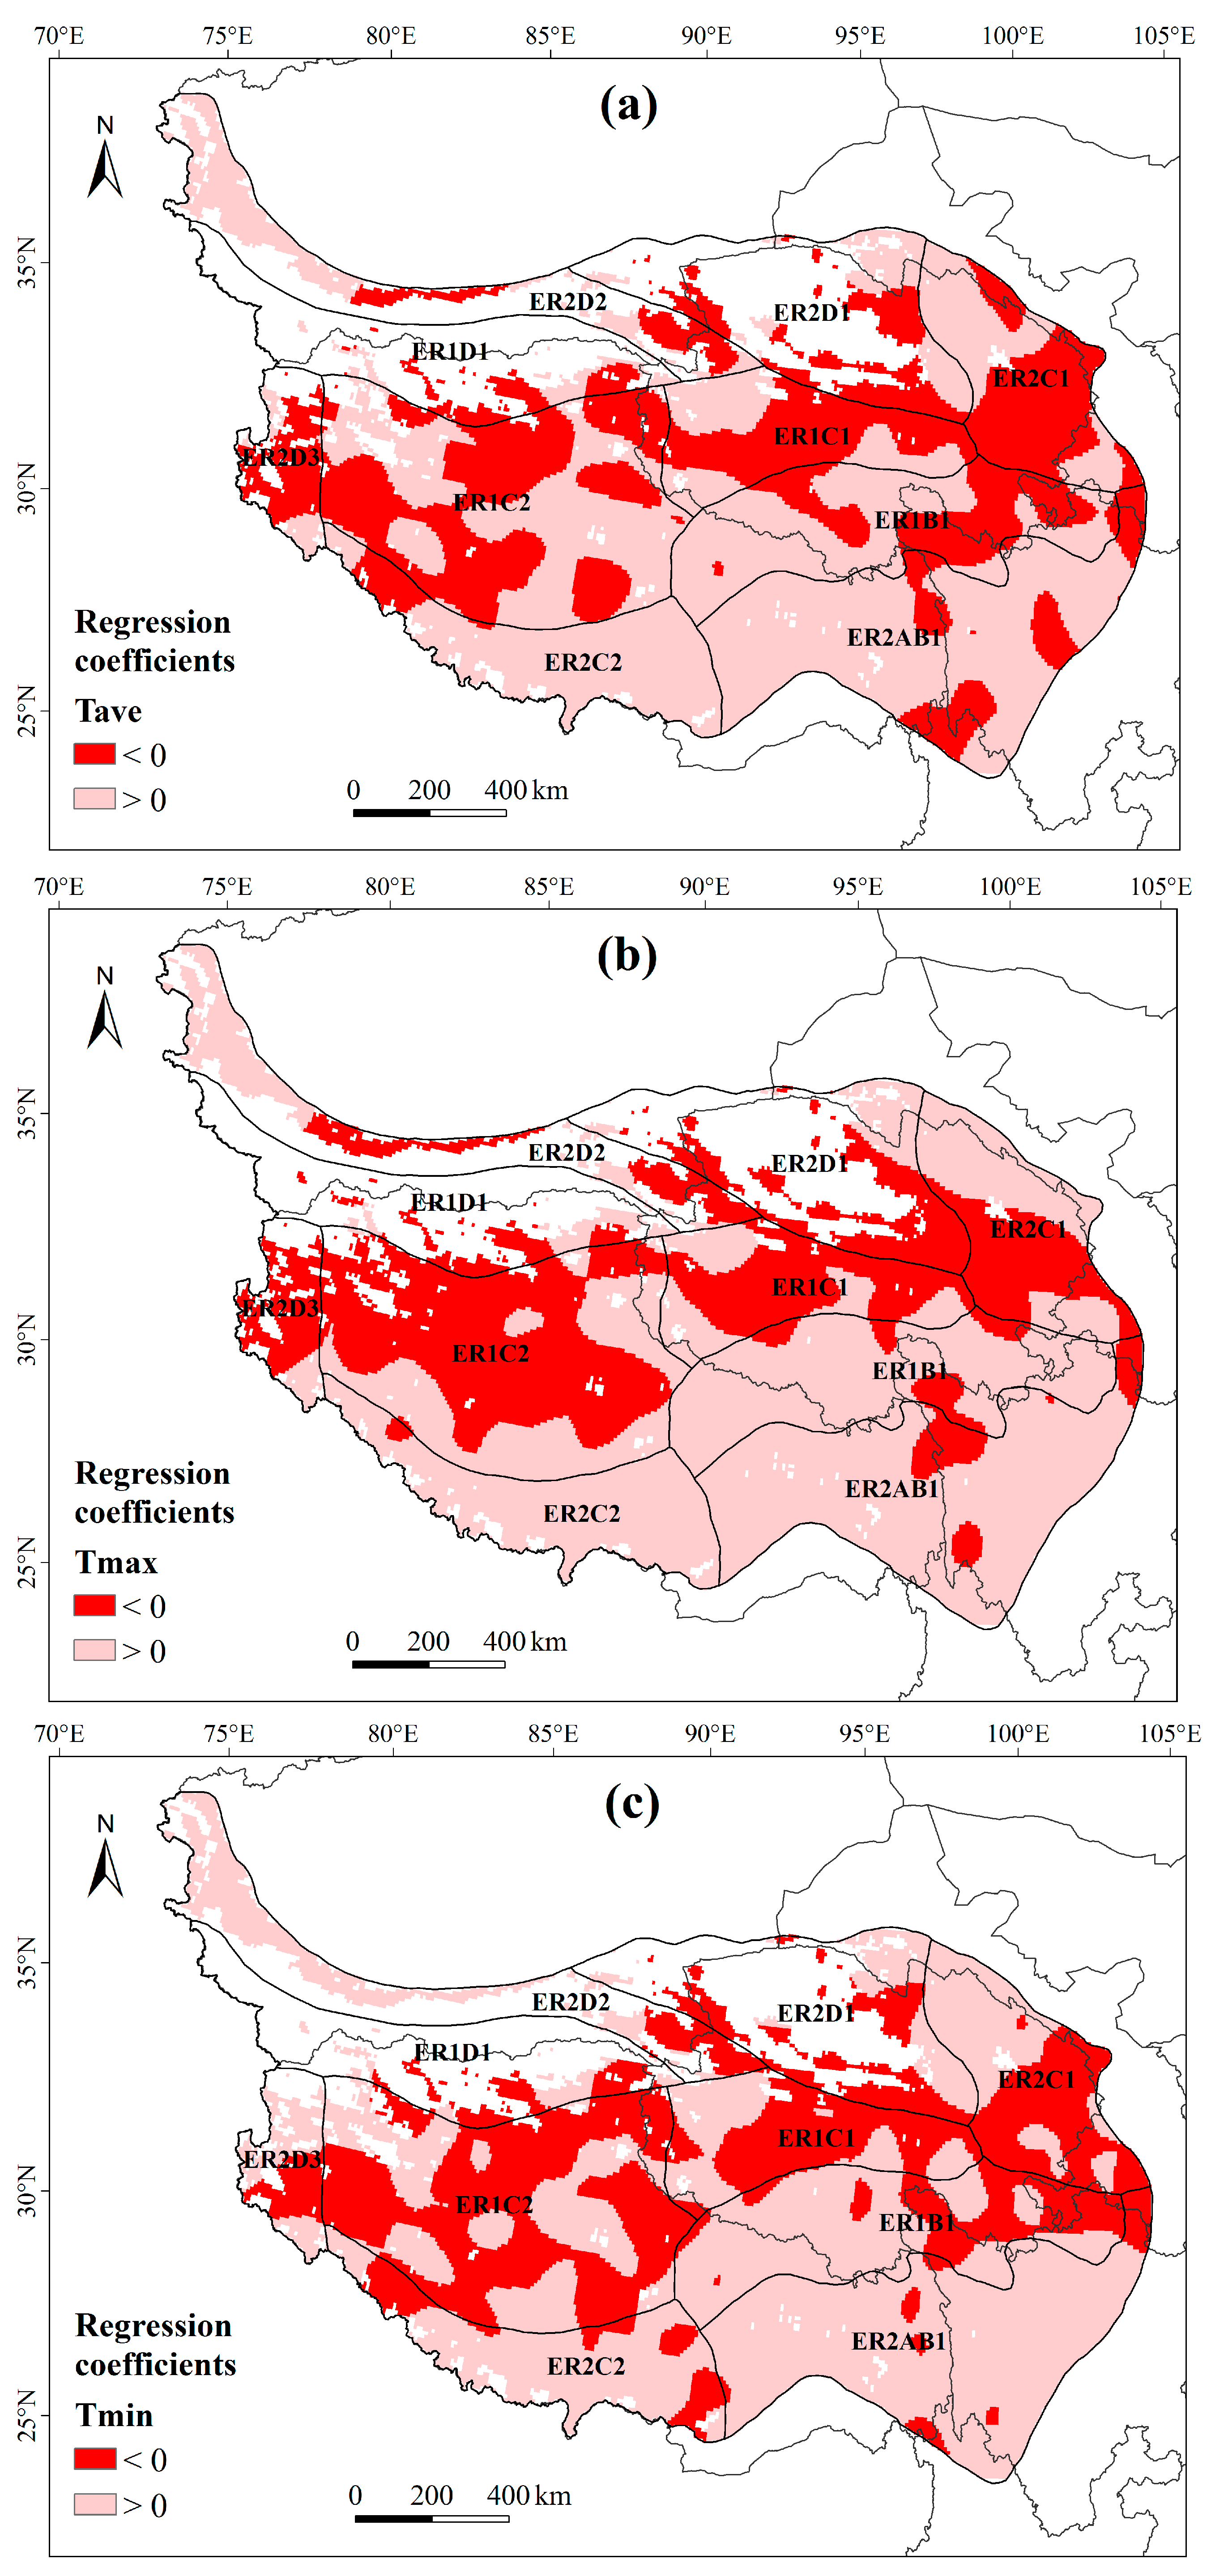
3.4. Response Pattern of the NDVI Variation to Climate Variability

From the GWR results for climatic variability and NDVI dynamics, a negative spatial correlation between NDVI dynamics and the variability of each of the three temperature indices was mainly in the semiarid regions (e.g., ER1C1, ER1C2, and south ER2C1) (Figure 6). The NDVI mostly increased in all but some southern parts of region ER2C1 (Figure 2a). In other words, the NDVI increased slowly in these regions where temperature increased rapidly. In the western and southern parts of region ER1C1, the NDVI was predominantly affected by Tmin (Figure 5). In most of the other regions, the NDVI was predominantly affected by moisture.
The NDVI mostly increased in the eastern part of region ER1B1 and region ER2D3 (Figure 2a). Spatially, NDVI variability was positively correlated with Tmax variability yet negatively correlated with the respective variability of Tave and Tmin in the eastern part of region ER1B1 (Figure 6). Thus, the adverse effects of temperature variability on vegetation growth and cover were primarily due to Tmin variability. Spatially, in region ER2D3, NDVI variability was also found positively correlated with Tmin variability and negatively correlated with the variability of Tave as well as that of Tmax (Figure 6). This suggested that the adverse effects of temperature variability on vegetation growth and cover were primarily a result of Tmax variability. Both regions were characterized by increased precipitation and decreased RH (Figure 2b, c). Spatially, a negative correlation was found between NDVI variability and each of the moisture indices in the eastern part of region ER1B1 (Figure 7). In other words, a high rate of decrease in RH led to a high rate of increase in the NDVI. By contrast, a positive correlation was found between the NDVI variability and the variability of each of the moisture indices in region ER2D3 (Figure 7). Apparently then, climate change was able to alter vegetation growth and cover in semi-humid and semiarid regions via differing mechanisms.
The variability of each climatic factor and NDVI variability were found to display the same spatial relationship in the southern regions (ER2AB1 and ER2C2) of the Tibetan Plateau. In addition, the variability of each climatic factor tested except RH was positively correlated with NDVI variability in these regions (Figure 6 and Figure 7). This suggested similarities in the mechanisms by which climate change impacts vegetation growth and cover in these regions. In these two regions, the NDVI was predominantly affected by precipitation (Figure 5). In region ER2AB1, there was a decrease in precipitation (Figure 2b) but a relatively marked decrease in its NDVI (Figure 2a). In other words, a high rate of decrease in precipitation led to a high rate of decrease in the NDVI. An opposite pattern characterized region ER2C2: there, both its precipitation and NDVI have increased (Figure 2a and b). Put differently, a faster rise in precipitation levels fostered a high rate of increase in the NDVI. Arguably, changes in precipitation were the principal driving factor for differential vegetation growth and cover between these regions.

4. Discussion

Overall, the climate on the Tibetan Plateau is characterized by low temperatures, large temperature differences, intense radiation, and high precipitation in summer [33]. In addition, those effect regions of climatic determinants on NDVI on the Tibetan Plateau in this study are consistent with those found across China (at a higher scale and lower resolution) [34]. As temperature rises, the response of vegetation growth to temperature becomes increasingly prominent [35,36]. Before reaching the optimum temperature for photosynthesis, temperature rises will facilitate photosynthesis [37], which we found in some parts of the plateau sub-cold zone (ER1). Beyond this optimum temperature, warming will, on the one hand, improve vegetation respiration and accelerate nutrient consumption (e.g., the northeast Tibetan Plateau) and, on the other hand, accelerate moisture evapotranspiration and reduce the accumulation of organic matter content [38], as it did in the southeast Tibetan Plateau. Changes in moisture can, to a certain extent, modify vegetation growth and cover in the largest areas of the Tibetan Plateau during the study period. However, more moisture can also hinder vegetation growth and reduce vegetation cover by increasing cloud cover and RH [32], which could be found in some sub-humid regions (e.g., ER1B1). As many studies have shown, the response of NDVI on the Tibetan Plateau to climate change follows a nonlinear process and generates a composite effect [39,40,41]. Consequently, this necessitates an examination of the spatial distribution and temporal dynamic patterns of vegetation growth and cover through multifactor comprehensive analysis, and provides the theoretical reference for natural restoration of alpine ecosystem.
Regression analysis of climatic variability is crucial for helping to quantify the NDVI’s response to climatic factors, since by conveying the dynamic responses of vegetation growth and cover to climate change, it can better explain the dynamic relationships that temperature and moisture have with vegetation. The intensity of vegetation growth depends on the rates at which photosynthesis and respiration respond to climatic factors [42]. A positive correlation of climatic variability arises when the increase in the photosynthetic rate surpasses that in the respiratory rate [43]. Specifically, an increase in Tmin variability can have accelerated the consumption of biomass by increasing the nighttime assimilation rate of vegetation. This is perhaps why Tmin became the principal factor inhibiting vegetation growth in some regions (e.g., some parts of ER1C1). An increase in Tmax variability, however, can have inhibited vegetation growth and reduced vegetation cover by strengthening the daytime respiration of vegetation and weakening its photosynthesis (e.g., ER2D3). In addition, a faster warming rate accelerates moisture loss from soil and vegetation and reduced regional vegetation cover [17], as it did in some southern parts of the Tibetan Plateau. Evidently, analyzing the variation in NDVI and climatic variability as objects of investigation can better capture and convey the relationship between vegetation dynamics and climate change, as well as accentuate the impact of climate change upon mechanisms of vegetation growth and cover on the Tibetan Plateau. It also provides new ideas for the further processing of remote sensing data.
While climate is the principal driving factor affecting both vegetation growth and cover on the Tibetan Plateau, the NDVI is also influenced by non-climatic factors [44], which might appear in some humid/sub-humid regions (Figure 5; Table 4). Of the factors contributing to spatial heterogeneity of the NDVI on the Tibetan Plateau, only climatic factors were taken into consideration in this study. In reality, a multitude of other environmental factors, including terrain [45] and soil conditions [46], will also shape the spatial heterogeneity of vegetation growth and cover. In comparison with other regions, the Tibetan Plateau’ vegetation has remained relatively intact, that is insignificantly affected by human activity [47]. The GWR used in this study is a local range-based spatial regression model. Human activity displays certain similarities in the neighborhood. Thus, this statistical method can be employed to uncover and establish the effects of climatic factors on the spatial heterogeneity of NDVI.

5. Conclusions

In this study, spatial nonstationary relationships were simulated between the NDVI and climatic factors in the Tibetan Plateau. Then, based on the regressions between NDVI dynamics and the respective variability of moisture and temperature indices, the leading climatic factors and their mechanisms of action were established for different regions of the Tibetan Plateau. Ample moisture and heat enabled a gradual increase in both vegetation growth and cover on the Tibetan Plateau. Spatially, temperature and precipitation are positively correlated with NDVI in most regions. However, adverse effects of warming upon vegetation growth and cover have begun to emerge in a concentrated manner in some arid and semiarid regions of northeast and west Tibetan Plateau. Precipitation plays a dominant role in the NDVI in nearly 40% of the Tibetan Plateau, an area larger than any of the other indices. Temperature mainly governs the NDVI in some parts of the plateau sub-cold zone (ER1) and some southeastern regions of the Tibetan Plateau. Among the temperature indices, Tmin has the greatest influence on NDVI over the largest area of the Tibetan Plateau (7.1%).
The increase in the warming rate mainly inhibits the NDVI in the semiarid regions of the Tibetan Plateau. Furthermore, different temperature indices are capable of impeding vegetation growth and reducing vegetation cover by means of intensifying respiration and reducing the moisture available. This explains the difference in the climatic determinants found among regions. Spatially, temperature and precipitation variability are both positively correlated with NDVI dynamics on the south Tibetan Plateau. This suggests similarities in the mechanisms of moisture and thermal conditions acting upon the NDVI in plateau temperature zone (ER2). Looking ahead, further adjustments to the combination of moisture and thermal conditions could substantially affect vegetation growth and cover in this region.

Author Contributions

Conceptualization, J.G.; methodology, K.J. and J.G.; software, K.J.; validation, K.J. and J.G.; writing—original draft preparation, K.J.; writing—review and editing, J.G. and Z.L.; supervision, K.J., J.G. and Z.L. All authors have read and agreed to the published version of the manuscript.

Funding

This work was funded by the National Natural Science Foundation of China [Grant number 41901125]; the Second Tibetan Plateau Scientific Expedition and Research Program [Grant number 2019QZKK0403]; and the National Key Research and Development Program of China [Grant numbers 2018YFC1508801, 2018YFC1508900].

Institutional Review Board Statement

Not applicable.

Informed Consent Statement

Not applicable.

Data Availability Statement

Publicly available datasets were analyzed in this study. Climatic variables can be found here: [https://data.cma.cn/data/cdcdetail/dataCode/SURF_CLI_CHN_MUL_MON.html (accessed on 7 August 2020)]; and NDVI dataset can be found here: [https://ecocast.arc.nasa.gov/data/pub/gimms/3g.v1/ (accessed on 22 October 2019)].

Acknowledgments

The authors acknowledge the GIMMS group for producing and sharing the NDVI dataset, and the China Meteorological Data Service Center for providing the climatic data. Thanks to the editor Skylar Wang and the anonymous reviewers for improving this paper significantly.

Conflicts of Interest

The authors declare no conflict of interest.

References

  1. Ji, F.; Wu, Z.H.; Huang, J.P.; Chassignet, E.P. Evolution of land surface air temperature trend. Nat. Clim. Chang. 2014, 4, 462–466. [Google Scholar] [CrossRef]
  2. Zhao, M.S.; Running, S.W. Drought-induced reduction in global terrestrial net primary production from 2000 through 2009. Science 2010, 329, 940–943. [Google Scholar] [CrossRef] [Green Version]
  3. Huang, N.; He, J.S.; Chen, L.T.; Wang, L. No upward shift of alpine grassland distribution on the Qinghai-Tibetan Plateau despite rapid climate warming from 2000 to 2014. Sci. Total Environ. 2018, 625, 1361–1368. [Google Scholar] [CrossRef]
  4. Zhang, Y.H.; Ye, A.Z. Spatial and temporal variations in vegetation coverage observed using AVHRR GIMMS and Terra MODIS data in the mainland of China. Int. J. Remote Sens. 2020, 41, 4238–4268. [Google Scholar] [CrossRef]
  5. Zhao, X.; Hu, H.F.; Shen, H.H.; Zhou, D.J.; Zhou, L.M.; Myneni, R.B.; Fang, J.Y. Satellite-indicated long-term vegetation changes and their drivers on the Mongolian Plateau. Landscape Ecol. 2015, 30, 1599–1611. [Google Scholar] [CrossRef]
  6. Franzke, C.L.E. Warming trends: Nonlinear climate change. Nat. Clim. Chang. 2014, 4, 423–424. [Google Scholar] [CrossRef]
  7. Loarie, S.R.; Duffy, P.B.; Hamilton, H.; Asner, G.P.; Field, C.B.; Ackerly, D.D. The velocity of climate change. Nature 2009, 462, 1052–1055. [Google Scholar] [CrossRef] [PubMed]
  8. Dong, B.W.; Sutton, R. Dominant role of greenhouse-gas forcing in the recovery of Sahel rainfall. Nat. Clim. Chang. 2015, 5, 757–760. [Google Scholar] [CrossRef] [Green Version]
  9. Levine, J.M. Ecology: A trail map for trait-based studies. Nature 2015, 529, 163–164. [Google Scholar] [CrossRef]
  10. Piao, S.L.; Zhang, X.Z.; Wang, T.; Liang, E.Y.; Wang, S.P.; Zhu, J.T.; Niu, B. Responses and feedback of the Tibetan Plateau’s alpine ecosystem to climate change. Chin. Sci. Bull. 2019, 64, 2842–2855. [Google Scholar] [CrossRef]
  11. Yao, T.D. Tackling on environmental changes in Tibetan Plateau with focus on water, ecosystem and adaptation. Sci. Bull. 2019, 64, 417. [Google Scholar] [CrossRef] [Green Version]
  12. Liu, L.L.; Zhang, X.Y.; Donnelly, A.; Liu, X.J. Interannual variations in spring phenology and their response to climate change across the Tibetan Plateau from 1982 to 2013. Int. J. Biometeorol. 2016, 60, 1563–1575. [Google Scholar] [CrossRef]
  13. Piao, S.L.; Yin, G.D.; Tan, J.G.; Cheng, L.; Huang, M.T.; Li, Y.; Liu, R.G.; Mao, J.F.; Myneni, R.B.; Peng, S.S.; et al. Detection and attribution of vegetation greening trend in China over the last 30 years. Glob. Chang. Biol. 2015, 21, 1601–1609. [Google Scholar] [CrossRef]
  14. Zhu, Z.C.; Piao, S.L.; Myneni, R.B.; Huang, M.T.; Zeng, Z.Z.; Canadell, J.G.; Ciais, P.; Sitch, S.; Friedlingstein, P.; Arneth, A.; et al. Greening of the earth and its drivers. Nat. Clim. Chang. 2016, 6, 791–796. [Google Scholar] [CrossRef]
  15. Luo, X.; Jia, B.H.; Lai, X. Contributions of climate change, land use change and CO2 to changes in the gross primary productivity of the Tibetan Plateau. Atmos. Ocean. Sci. Lett. 2020, 13, 8–15. [Google Scholar] [CrossRef] [Green Version]
  16. Fu, G.; Zhang, X.Z.; Zhang, Y.J.; Shi, P.L.; Li, Y.L.; Zhou, Y.T.; Yang, P.W.; Shen, Z.X. Experimental warming does not enhance gross primary production and above-ground biomass in the alpine meadow of Tibet. J. Appl. Remote Sens. 2013, 7, 6451–6465. [Google Scholar] [CrossRef] [Green Version]
  17. Crausbay, S.D.; Ramirez, A.R.; Carter, S.L.; Cross, M.S.; Hall, K.R.; Bathke, D.J.; Betancourt, J.L.; Colt, S.; Cravens, A.E.; Dalton, M.S.; et al. Defining ecological drought for the twenty-first century. Bull. Am. Meteorol. Soc. 2017, 98, 2543–2550. [Google Scholar] [CrossRef]
  18. Zeng, B.; Yang, T.B. Impacts of climate warming on vegetation in Qaidam Area from 1990 to 2003. Environ. Monit. Assess. 2008, 144, 403–417. [Google Scholar] [CrossRef] [PubMed]
  19. Reyer, C.P.O.; Leuzinger, S.; Rammig, A.; Wolf, A.; Bartholomeus, R.P.; Bonfante, A.; de Lorenzi, F.; Dury, M.; Gloning, P.; Abou Jaoude, R.; et al. A plant’s perspective of extremes: Terrestrial plant responses to changing climatic variability. Glob. Chang. Biol. 2013, 19, 75–89. [Google Scholar] [CrossRef] [PubMed]
  20. Fridley, J.D.; Lynn, J.S.; Grime, J.P.; Askew, A.P. Longer growing seasons shift grassland vegetation towards more-productive species. Nat. Clim. Chang. 2016, 6, 865–868. [Google Scholar] [CrossRef]
  21. Zhang, Y.L.; Qi, W.; Zhou, C.P.; Ding, M.J.; Liu, L.S.; Gao, J.G.; Bai, W.Q.; Wang, Z.F.; Zheng, D. Spatial and temporal variability in the net primary production of alpine grassland on the Tibetan Plateau since 1982. J. Geogr. Sci. 2014, 24, 269–287. [Google Scholar] [CrossRef]
  22. Zheng, D. Research on Eco-Geographical Region Systems of China; The Commercial Press: Beijing, China, 2008; pp. 284–295. [Google Scholar]
  23. Alcaraz-Segura, D.; Chuvieco, E.; Epstein, H.E.; Kasischke, E.S.; Trishchenko, A. Debating the greening vs. browning of the North American boreal forest: Differences between satellite datasets. Glob. Chang. Biol. 2010, 16, 760–770. [Google Scholar] [CrossRef]
  24. Mao, D.H.; Wang, Z.M.; Luo, L.; Ren, C.Y. Integrating AVHRR and MODIS data to monitor NDVI changes and their relationships with climatic parameters in Northeast China. Int. J. Appl. Earth Obs. 2012, 18, 528–536. [Google Scholar] [CrossRef]
  25. Li, Y.; Xie, Z.X.; Qin, Y.C.; Zheng, Z.C. Estimating relations of vegetation, climate change, and human activity: A case study in the 400 mm annual precipitation fluctuation zone, China. Remote Sens. 2019, 11, 1159. [Google Scholar] [CrossRef] [Green Version]
  26. Shen, M.G.; Piao, S.L.; Jeong, S.J.; Zhou, L.M.; Zeng, Z.Z.; Ciais, P.; Chen, D.L.; Huang, M.T.; Jin, C.S.; Li, L.Z.X.; et al. Evaporative cooling over the Tibetan Plateau induced by vegetation growth. Proc. Natl. Acad. Sci. USA 2015, 112, 9299–9304. [Google Scholar] [CrossRef] [Green Version]
  27. Szymanowski, M.; Kryza, M. Local regression models for spatial interpolation of urban heat island—an example from Wrocaw, SW Poland. Theor. Appl. Climatol. 2012, 108, 53–71. [Google Scholar] [CrossRef] [Green Version]
  28. Sun, J.; Cheng, G.W.; Li, W.P.; Sha, Y.K.; Yang, Y.C. On the variation of NDVI with the principal climatic elements in the Tibetan Plateau. Remote Sens. 2013, 5, 1894–1911. [Google Scholar] [CrossRef] [Green Version]
  29. Brunsdon, C.; Fotheringham, A.S.; Charlton, M.E. Geographically weighted regression: A method for exploring spatial nonstationarity. Geogr. Anal. 1996, 28, 281–298. [Google Scholar] [CrossRef]
  30. Brown, S.; Versace, V.L.; Laurenson, L.; Ierodiaconou, D.; Fawcett, J.; Salzman, S. Assessment of spatiotemporal varying relationships between rainfall, land cover and surface water area using geographically weighted regression. Environ. Model. Assess. 2012, 17, 241–254. [Google Scholar] [CrossRef]
  31. Gao, J.B.; Jiao, K.W.; Wu, S.H. Quantitative assessment of ecosystem vulnerability to climate change: Methodology and application in China. Environ. Res. Lett. 2018, 13, 094016. [Google Scholar] [CrossRef]
  32. Shen, Z.X.; Fu, G.; Yu, C.Q.; Sun, W.; Zhang, X.Z. Relationship between the growing season maximum enhanced vegetation index and climatic factors on the Tibetan Plateau. Remote Sens. 2014, 6, 6765–6789. [Google Scholar] [CrossRef] [Green Version]
  33. Shi, C.M.; Wang, K.C.; Sun, C.; Zhang, Y.D.; He, Y.Y.; Wu, X.X.; Gao, C.; Wu, G.C.; Shu, L.F. Significantly lower summer minimum temperature warming trend on the Southern Tibetan Plateau than over the Eurasian continent since the Industrial Revolution. Environ. Res. Lett. 2019, 14, 124033. [Google Scholar] [CrossRef] [Green Version]
  34. Gao, J.B.; Jiao, K.W.; Wu, S.H.; Ma, D.Y.; Zhao, D.S.; Yin, Y.H.; Dai, E.F. Past and future effects of climate change on spatially heterogeneous vegetation activity in China. Earth’s Future 2017, 5, 679–692. [Google Scholar] [CrossRef] [Green Version]
  35. Piao, S.L.; Wang, X.H.; Ciais, P.; Zhu, B.; Wang, T.; Liu, J. Changes in satellite-derived vegetation growth trend in temperate and boreal Eurasia from 1982 to 2006. Glob. Chang. Biol. 2011, 17, 3228–3239. [Google Scholar] [CrossRef]
  36. Urban, M.C. Accelerating extinction risk from climate change. Science 2015, 348, 571–573. [Google Scholar] [CrossRef] [PubMed] [Green Version]
  37. Michaletz, S.T.; Cheng, D.L.; Kerkhoff, A.J.; Enquist, B.J. Convergence of terrestrial plant production across global climate gradients. Nature 2014, 512, 39–43. [Google Scholar] [CrossRef] [PubMed]
  38. Brohan, P.; Kennedy, J.J.; Harris, I.; Tett, S.F.B.; Jones, P.D. Uncertainty estimates in regional and global observed temperature changes: A new data set from 1850. J. Geophys. Res. Atmos. 2006, 111, 121–133. [Google Scholar] [CrossRef] [Green Version]
  39. Meng, F.D.; Ji, S.N.; Zhang, Z.H.; Wang, S.P.; Duan, J.C.; Wang, Q.; Li, B.W.; Luo, C.Y.; Jiang, L.L.; Zhang, L.R.; et al. Nonlinear responses of temperature sensitivities of community phenophases to warming and cooling events are mirroring plant functional diversity. Agr. Forest Meteorol. 2018, 253, 31–37. [Google Scholar] [CrossRef]
  40. Peng, W.F.; Kuang, T.T.; Tao, S. Quantifying influences of natural factors on vegetation NDVI changes based on geographical detector in Sichuan, western China. J. Clean. Prod. 2019, 233, 353–367. [Google Scholar] [CrossRef]
  41. Wang, X.Y.; Wang, T.; Liu, D.; Zhang, T.T.; Xu, J.F.; Cui, G.S.; Lv, G.T.; Huang, H.B. Multisatellite analyses of spatiotemporal variability in photosynthetic activity over the Tibetan Plateau. J. Geophys. Res. Biogeo. 2019, 124, 3778–3797. [Google Scholar] [CrossRef]
  42. Wang, Q.; Ni, J.; Tenhunen, J. Application of a geographically-weighted regression analysis to estimate net primary production of Chinese forest ecosystems. Global Ecol. Biogeogr. 2005, 14, 379–393. [Google Scholar] [CrossRef]
  43. Peng, S.S.; Piao, S.L.; Ciais, P.; Myneni, R.B.; Chen, A.P.; Chevallier, F.; Dolman, A.J.; Janssens, I.A.; Penuelas, J.; Zhang, G.X.; et al. Asymmetric effects of daytime and night-time warming on northern hemisphere vegetation. Nature 2013, 501, 88–92. [Google Scholar] [CrossRef]
  44. Tian, L.; Gong, Q.W.; Chen, J.Q. Coupled dynamics of socioeconomic and environmental systems in Tibet. Environ. Res. Lett. 2018, 13, 034001. [Google Scholar] [CrossRef]
  45. Wang, D.; Li, X.X.; Zou, D.F.; Wu, T.H.; Xu, H.Y.; Hu, G.J.; Li, R.; Ding, Y.J.; Zhao, L.; Li, W.P.; et al. Modeling soil organic carbon spatial distribution for a complex terrain based on geographically weighted regression in the eastern Qinghai-Tibetan Plateau. Catena 2020, 187, 104399. [Google Scholar] [CrossRef]
  46. Ren, G.H.; Shang, Z.H.; Long, R.J.; Hou, Y.; Deng, B. The relationship of vegetation and soil differentiation during the formation of black-soil-type degraded meadows in the headwater of the Qinghai-Tibetan Plateau, China. Environ. Earth Sci. 2013, 69, 235–245. [Google Scholar] [CrossRef]
  47. Li, P.; Peng, C.H.; Wang, M.; Luo, Y.P.; Li, M.X.; Zhang, K.R.; Zhang, D.L.; Zhu, Q.A. Dynamics of vegetation autumn phenology and its response to multiple environmental factors from 1982 to 2012 on Qinghai-Tibetan Plateau in China. Sci. Total Environ. 2018, 637, 855–864. [Google Scholar] [CrossRef] [PubMed]
Figure 1. Location of the Tibetan Plateau and its vegetation types and eco-geographical regions.
Remotesensing 13 01305 g001
Figure 2. The spatial distributions of NDVI (a), precipitation (b), and relative humidity (c) trends during the 1982–2015 period. The blank regions represent non-vegetation area defined in this study (annual average NDVI<0.1). The same below.
Remotesensing 13 01305 g002
Figure 3. The spatial pattern regression coefficients for temperature (a): Tave; (b): Tmax; (c): Tmin, in the geographically weighted regression model.
Remotesensing 13 01305 g003
Figure 4. The spatial pattern regression coefficients for moisture ((a): P; (b): RH) in the geographically weighted regression model.
Remotesensing 13 01305 g004
Figure 5. The effect regions of climatic determinants on NDVI on the Tibetan Plateau. “Others” means the role of non-hydrothermal factors.
Remotesensing 13 01305 g005
Figure 6. The spatial regression coefficients between NDVI variability and temperature variability ((a): Tave; (b): Tmax; (c): Tmin) from the geographically weighted regression model.
Remotesensing 13 01305 g006
Figure 7. The spatial regression coefficients between NDVI variability and moisture variability ((a): P; (b): RH) from the geographically weighted regression model.
Remotesensing 13 01305 g007
Table 1. The ecoregions of the Tibetan Plateau.
Temperature ZonesHumidity RegionsEco-Geographical Regions
ER1: Plateau sub-cold zoneB: Sub-humid regionER1B1: Guoluo-Naqu Plateau mountain alpine shrub-meadow region
C: Semiarid regionER1C1: Southern Qinghai Plateau and wide valley alpine meadow-steppe region
ER1C2: Qiangtang Plateau lake basin alpine steppe region
D: Arid regionER1D1: Kunlun high mountain and plateau alpine desert region
ER2: Plateau temperature zoneA/B: Humid/sub-humid regionER2A/B1: Western Sichuan and Eastern Xizang high mountain and deep valley coniferous forest region
C: Semiarid regionER2C1: Qilian Mountains of eastern Qinghai high mountain and basin coniferous forest and steppe region
ER2C2: Southern Xizang high mountain and valley shrub-steppe region
D: Arid regionER2D1: Qaidam Basin desert region
ER2D2: North Kunlun mountain desert region
ER2D3: Ngali mountain desert region
Table 2. Moran’s I and Z scores of regression coefficients for each factor in the geographically weighted regression model.
Regression CoefficientsTaveTmaxTminPRH
NormalizationMoran’s I0.940.950.920.830.90
Z117.0118.7114.3103.6111.5
VariabilityMoran’s I0.930.970.890.830.90
Z116.5120.3111.3103.6112.6
Table 3. Climatic variables and trends in ecoregions of Tibetan Plateau during the growing season of 1982–2015.
Eco-Geographical RegionsTaveTmaxTminPRH
Mean
/°C
Trend
/°C 10yr−1
Mean
/°C
Trend
/°C 10yr−1
Mean
/°C
Trend
/°C 10yr−1
Mean
/mm
Trend
/mm 10yr−1
Mean
/%
Trend
/% 10yr−1
ER1B127.90.4428.60.4527.40.67465.08.669.7−0.46
ER1C127.70.4828.40.3827.20.77243.819.860.70.42
ER1C227.80.4328.50.3627.20.75207.819.152.40.73
ER2A/B128.30.3229.00.4327.80.50516.40.571.1−0.52
ER2C128.20.5128.80.4227.60.65337.19.165.8−0.66
ER2C228.00.2828.70.3127.50.58315.68.864.3−0.12
ER2D328.10.5328.80.4127.40.7962.82.143.8−1.35
Tibetan Plateau28.00.4228.70.3927.50.66311.710.560.70.003
Table 4. Percentage of the area occupied by the effect regions of climatic determinants in ecoregions of the Tibetan Plateau (%).
Eco-Geographical RegionsTaveTmaxTminPRHOthers
ER1B13.411.68.332.636.27.7
ER1C11.111.420.939.916.76.4
ER1C20.44.25.159.120.24.8
ER2A/B11.110.88.539.931.87.0
ER2C12.11.82.257.631.63.5
ER2C22.61.76.663.412.06.9
ER2D30.10.3055.23.16.7
Tibetan Plateau1.16.27.139.719.34.3
Publisher’s Note: MDPI stays neutral with regard to jurisdictional claims in published maps and institutional affiliations.

