Abstract
Geo-Kompsat-2A (Geostationary-Korean Multi-Purpose SATtellite-2A, GK2A), a new generation of Korean geostationary meteorological satellite, carry state-of-the-art optical sensors with significantly higher radiometric, spectral, and spatial resolution than the Communication, Ocean, and Meteorological Satellite (COMS) previously available in the geostationary orbit. The new Advanced Meteorological Imager (AMI) on GK2A has 16 observation channels, and its spatial resolution is 0.5 or 1 km for visible channels and 2 km for near-infrared and infrared channels. These advantages, when combined with shortened revisit times (around 10 min for full disk and 2 min for sectored regions), provide new levels of capacity for the identification and tracking of rapidly changing weather phenomena and for the derivation of quantitative products. These improvements will bring about unprecedented levels of performance in nowcasting services and short-range weather forecasting systems. Imagery from the satellites is distributed and disseminated to users via multiple paths, including internet services and satellite broadcasting services. In post-launch performance validation, infrared channel calibration is accurate to within 0.2 K with no significant diurnal variation using an approach developed under the Global Space-based Inter-Calibration System framework. Visible and near infrared channels showed unexpected seasonal variations of approximately 5 to 10% using the ray matching method and lunar calibration. Image navigation was accurate to within requirements, 42 µrad (1.5 km), and channel-to-channel registration was also validated. This paper describes the features of the GK2A AMI, GK2A ground segment, and data distribution. Early performance results of AMI during the commissioning period are presented to demonstrate the capabilities and applications of the sensor.
1. Introduction
The new-generation geostationary (GEO) meteorological satellite from the Korea Meteorological Agency (KMA), Geo-Kompsat-2A (GK2A), was successfully launched on 4 December 2018. The satellite started operation at 128.2°E on 25 July 2019, after the completion of overall system checking and initial performance analysis. GK2A features the new Advanced Meteorological Imager (AMI) with significantly higher radiometric, spectral, and spatial resolution than the Meteorological Imager (MI) used on the Communication, Ocean, and Meteorological Satellite (COMS) previously available in the geostationary orbit. For example, the spatial resolution of the COMS imager’s infrared (IR) channel is 4 km at the nadir as compared to 2 km for the AMI. The AMI produces a full-disk image every 10 min. The hardware configuration of the AMI is similar to that of the Advanced Baseline Imager (ABI) aboard the Geostationary Operational Environmental Satellite (GOES)-16 series satellite [1,2,3] and that of the Advanced Himawari Imager (AHI) aboard the Himawari-8/9 [4], which were manufactured by L3Harris Corporation in USA.
An image of the GK2A satellite is shown in Figure 1, and the specifications are listed in Table 1. It is a three-axis, attitude-controlled satellite with a length of approximately 9 m and a mass of approximately 3500 kg at launch. The bus was made by the Korean Aerodynamic Research and Institute (KARI).
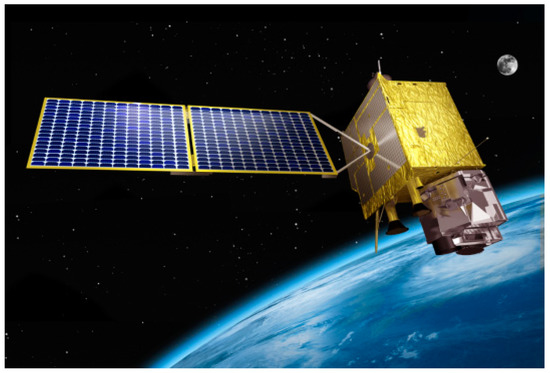
Figure 1.
Illustration of Geo-Kompsat-2A (GK2A).

Table 1.
Major Specifications of GK2A.
GK2A AMI has a spatial resolution of 0.5 or 1 km for visible channels and 2 km for near-infrared and infrared channels. AMI has multi-channel visibility through a thermal infrared imaging radiometer that provides observations in 16 spectral channels, which significantly exceeds the five channels of the imager on the COMS [5]. AMI is a flexible sensor, meaning that the sensor can be configured to image different areas of the Earth at varying frequencies and collection sizes. In summary, compared to the COMS imager, AMI captures the Earth’s hemisphere in approximately three times more spectral channels, at four times more spatial resolution, and five times faster image update rates.
This paper provides an overview and early results from the GK2A AMI. First, the instrument characteristics of the GK2A AMI are further outlined in Section 2. Section 3 describes the ground segment and data distribution/dissemination scheme for the new satellite. Section 4 outlines the early radiometric performance of GK2A AMI. In Section 5, the early image navigation and registration (INR) performance are explained. Finally, Section 6 summarizes the paper.
2. GK2A Advanced Meteorological Imager
The AMI, the payload for the meteorological mission of GK2A, is comparable to those of the AHI and ABI onboard the Himawari-8/9 and GOES-16 series, respectively. Of its 16 spectral channels, there are 6 reflective solar channels (one 0.5 km, three 1 km, and two 2 km spatial resolution) and 10 emissive channels with 2 km spatial resolution (Table 2).
Table 2.
GK2A Advanced Meteorological Imager (AMI) channels, central wavelength, spatial resolution, the number of detectors in each row and column of the focal plane, and the number of bits downlinked.
The detailed specification of AMI is as follows:
- Multichannel capacity: 16 channels (4 visible, 2 near-infrared, and 10 infrared channels);
- High spatial resolution: 0.5–1.0 km for visible and 2 km for infrared channels;
- Fast imaging within 10 min for full disk observation;
- Flexibility for regional area selection and scheduling.
2.1. AMI Channel Characteristics
Table 2 shows details of the GK2A AMI and COMS MI channels along with the related wavelengths, and Figure 2 presents their spectral response functions (SRFs) compared with those for COMS MI channels.
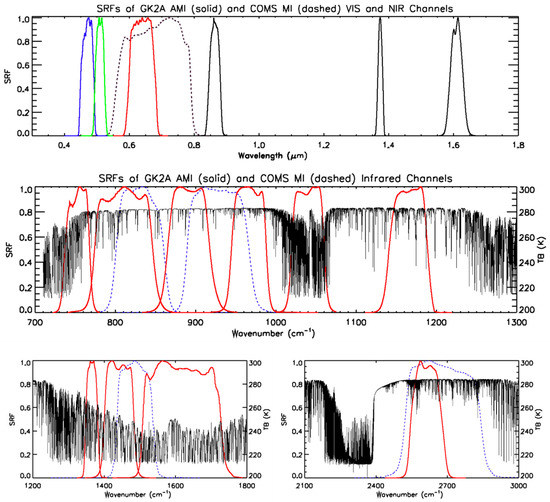
Figure 2.
Spectral response functions (SRFs) for visible and near-infrared channels (top) and infrared channels (middle) and (bottom) of the GK2A AMI and Communication, Ocean, and Meteorological Satellite (COMS) Meteorological Imager (MI). The solid and dashed lines in the visible and near-infrared channels represent values for AMI and MI, respectively, and the corresponding red lines and blue dashed lines represent the same in the infrared channels. The black lines in the infrared channels represent the brightness temperatures of up-welling radiances at the top of the atmosphere, as simulated using the radiative transfer model with HITRAN2000 (AER updates) line parameters on the basis of the U.S. standard atmosphere.
Each AMI channel has distinct characteristics. True-color images from a combination of the three visible channels—VI004 (blue: 0.47 µm), VI005 (green: 0.51 µm), and VI006 (red: 0.64 µm)—appear as if seen by the human eye (see Figure 3 of first true-color composite image from GK2A). Another visible channel of AMI, VI008 (0.86 µm), is used for land and sea masks and vegetarian observations. Two near-infrared (NIR) channels, NR013 and NR016 (1.38 and 1.6 µm), provide cloud physical parameter data such as information on the water/ice phase, particle size, and optical thickness. Solar reflectance differences in the visible and NIR channels enable the collection of surface property data, such as information on snow/ice cover and vegetation. The short-wave infrared channel SW038 (3.8 µm), which is inherited from the COMS MI, is used to monitor low-level clouds, fog, wildfires, and other phenomena. Three water vapor absorption channels, WV063, WV069, and WV073 (6.2, 6.9, and 7.3 µm, respectively), are available, as opposed to the single channel available on the COMS MI. The water vapor channels are sensitive to middle-to-upper tropospheric humidity, and differences in sensitivity between them provide vertical humidity profile information. IR087 (8.7 µm) is used for thin ice cloud monitoring in conjunction with other atmospheric window channels. This channel and WV073 are also sensitive to volcanic SO2 gas. IR096 (9.6 µm), in the ozone absorption channel, is used to monitor stratospheric ozone and (indirectly) potential vorticity. There are three channels—IR105, IR112, and IR123 (10.4, 11.2, and 12.4 µm, respectively)—in the 10 to 12 µm atmospheric window as opposed to the two (known as “split window channels”) channels in COMS MI. These are used to monitor ice crystals/water, lower water vapor, volcanic ash, sea surface temperature, and other phenomena. The atmospheric window channel is present on most meteorological satellites and is mainly used at operational weather centers to support real-time weather analysis and forecasting. The IR133 channel (13.3 µm), which is in the CO2 absorption channel, is used for cloud top height assignment and estimation of thin cirrus opacity.
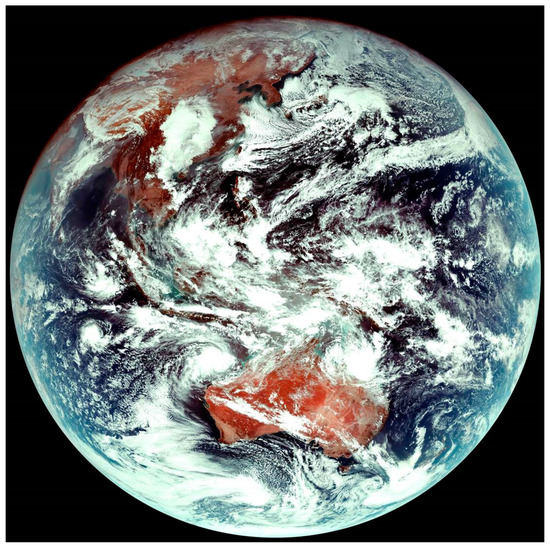
Figure 3.
First true-color composite image from GK2A at 03:10 Coordinated Universal Time (UTC) on 25 January 2019.
2.2. Observation Areas and Frequencies
Specific scanning scenarios are defined as “timelines,” which specify the imaging sequence and collection frequency. For GK2A AMI, in one timeline, the entire full disk of the Earth is imaged in all 16 channels at a 10-min interval while also imaging 0.1064 (EW) × 0.067 (NS) radian (3800 km × 2400 km at nadir) regional extended local area (ELA) area every 2 min and a separate 0.028 × 0.028 radian (equivalent to 1000 × 1000 km at nadir) mesoscale area or local area (LA) every 2 min, where each mesoscale can be located anywhere on the earth or in space (e.g., the Moon). A timeline provides spatiotemporal information. Within each timeline, the imager also performs observations for radiometric and geometric calibration, such as adjustments for internal blackbody targets, space, or stars. All these data are seamlessly interleaved and transmitted to a command and data handling ground station, where the raw data are processed as follows:
- Data are uncompressed to detector sample values;
- Radiometric calibration is applied;
- Calibrated detector values are navigated to Earth location;
- Calibrated and navigated values are re-sampled to form pixels;
- Images are generated in the GK2A AMI fixed grid angular coordinate projection.
The ground system continuously receives and processes AMI data into radiances, imagery, and several higher-level products that provide geophysical measurements of land, oceans, and atmosphere for operational meteorology.
Figure 4 shows a 10-min timeline of AMI observation areas and frequencies. On a specific timeline, the AMI scans the full disk once, the ELA five times, and the LA five times. Accordingly, full disk images are taken every 10 min, visible channel observations every 100 s, and IR channel observations every 300 s for image navigation and registration. For the GK2A AMI baseline observation, the timeline is repeated every 10 min other than when in housekeeping operation.
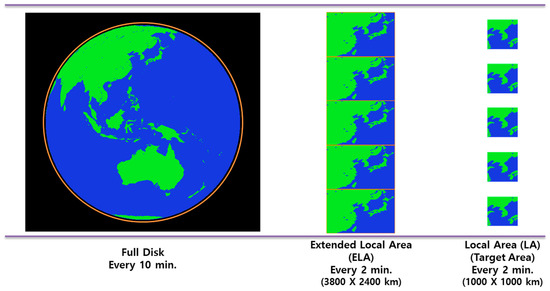
Figure 4.
GK2A AMI observation areas and frequencies on one timeline of 10 min.
3. Ground Segment and Data Distribution of GK2A
The GK2A ground system is designed to support missions and operations for 10 years. It is composed of the Satellite Operations Center of KARI and the National Meteorological Satellite Center (Figure 5). The Satellite Operations Center provides the functionality to operate the GK2A satellite by receiving and transmitting commands. The National Meteorological Satellite Center receives and converts payload data from the satellite into calibrated data. Then, the AMI image data are disseminated to end users via GK2A.
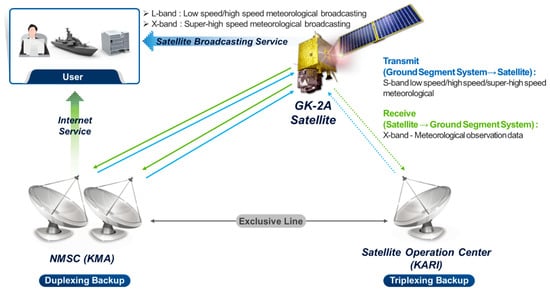
Figure 5.
Overview of GK2A ground segment.
The AMI samples (detector counts) are compressed, formatted into data packets (packetized), and downlinked to the ground station (Level 0 data, L0) for conversion to calibrated (Level 1A data, L1A) and geo-located pixel images (Level 1B data, L1B). The detector samples must be decompressed, radiometrically calibrated, navigated, and resampled to produce pixels that are located on an invariant output grid, referred to as the fixed grid. Each of these processes is described below.
The following definitions are used to define various data types in processing sensor data from AMI:
- Raw data: Data within Consultative Committee for Space Data Systems (CCSDS) protocol transfer frames, as received from the satellite;
- Level 0 data: Reconstructed unprocessed instrument data at full resolution; all communication artifacts (e.g., synchronization frames and communications headers) are removed;
- Level 1A data: Calibrated detector samples in radiance units in a swath but not navigated;
- Level 1B data: Calibrated detector samples in a swath, with detector rows aligned, navigated, and resampled into pixels in the fixed grid.
GK2A uses S-band, X-band, and L-band communication frequencies. X-band is used for the downlink of payload data and the downlink of the Ultra-HRIT dissemination channel. Compared to the existing COMS system, the GK2A ground system has the following improvements in terms of function and performance:
- Satellite collocation operation for COMS and GK2A;
- Manual/automatic optional operation in mission scheduling and flight dynamics;
- Increased payload data volume, more than 20 times in case of AMI;
- Faster AMI timeliness requirement compared to the current COMS requirement from 15 min to 3 min (calibration and broadcasting shall be completed within 3 min after the full Earth observation);
- New Ultra-HRIT broadcasting service to disseminate the all full-resolution AMI L1B products;
- Compatible LRIT/HRIT services with the those of COMS.
The GK2A low-rate information transmission (LRIT) and high rate information transmission (HRIT) will replace the COMS LRIT/HRIT broadcasting service. The GK2A ground system will process the downsizing of AMI imagery data in close channels to generate approximately identical contents and formats. To avoid technical problems with the existing COMS end-user systems, researchers will downlink the GK2A LRIT and HRIT to the end user system through the same response function characteristics and data format. COMS has been providing the LRIT and HRIT broadcasting service in the L-Band since 2011 for free, but user registration must be provided by the KMA. Ultra-HRIT will be newly added as a means of AMI imagery data dissemination in full resolutions and channels.
4. Radiometric Calibration and Performance of GK2A AMI
The GK2A AMI has two onboard calibration targets: a blackbody for emissive channels, referred to as the Internal Calibration Target (ICT), and a solar diffuser for the reflective channels called the solar calibration target (SCT), which is made of Spectralon. The ICT is observed at the beginning of every timeline, whereas the SCT is observed less frequently because the change in calibration of the visible and near-infrared (VNIR) channels is far slower than that of the longwave infrared (LWIR). The SCT is protected from degradation due to UV radiation and molecular contamination by the solar calibration cover, which is opened only when the SCT has to be exposed to the Sun during calibration events. The SCT is viewed frequently (e.g., every 2 days) during the IOT period after launch, but it is gradually changed to quarterly observations after the radiometric calibration is well characterized [6].
The GK2A ground segment implements the radiometric calibration of the AMI thermal emissive channels and reflective solar channels as a collection of algorithms for processing the blocks of AMI detector data generated by the L0 processing subsystem after the decompression and assembly of the telemetry packets. These ground processing calibration algorithms achieve on-board International System Units (SI) metrological traceability using a blackbody source with an emissivity greater than 0.995, called the ICT, for emissive channel calibration, and a Spectralon diffuser, called the SCT, for reflective channel calibration [7]. AMI uses these calibration targets together with a space view collected every 30 s to determine the background count level from the instrument optics and electronics at zero radiance. Using these calibration targets, one can derive linear and bias calibration coefficients to convert the counts of raw detector sample data into radiances. After solar diffuser stability checking was completed in June 2019, calibration coefficients were updated on the basis of the observation results from SCT in the visible and near-infrared channels. With this stability check, the KMA can perform lunar observations for long-period stable references [8,9].
For “solar calibration”, SCT measurements combined with a spacelook provide the necessary data to perform a radiometric calibration of the reflective channel data. Each solar calibration uses the Sun as it is stable and is a spectral irradiance source. Hence, the calibration can only be performed when a specific geometry between the SCT and the Sun is achieved. Specifically, solar calibrations can be performed once per day between 06:00 and 06:15 spacecraft local time (SLT). Solar calibrations can be performed more frequently than shown here as long as the total lifetime UV exposure of the SCT does not exceed 10 h. After 10 h of UV exposure, the SCT’s Spectralon material degrade to the point that calibration accuracy is affected. Each solar calibration takes approximately 17 s for data collection and 20 s to cycle the solar calibration cover.
To meet the latency requirements for L1B radiance products, the ground system uses a set of algorithms optimized for the system architecture design to process a block of detector data from each scene type, including space looks; ICT; SCT; star looks; and the Earth view scanning modes of full disk, ELA, and LA. The AMI calibration algorithms are similar to those for the ABI on the GOES-16 series of National Oceanic and Atmospheric Administration (NOAA) [6] and the AHI on the Himawari-8/9 of the Japan Meteorological Agency (JMA) [10] because of the similarities in the instrument design.
The normal radiometric calibration equation of the AMI emissivity and reflectivity channels is a quadratic equation, shown as Equation (1).
where is the channel-averaged radiance for each channel, and m and Q are calibration coefficients. ΔC is the relative count as (X-), that is,
where X is the count of the observed target and is the count in space look.
From Equation (2), the average spectral radiance is given by Equation (3) as radiance for the observation area in each channel of the AMI,
where m is the gain, Q is determined prelaunch and remains unchanged during the mission life, and m is the gain computed from Equation (4)
where is the average ICT count; is the average space look count for each detector in each channel; is the effective average spectral radiance; and are the effective average spectral radiances for the EW and NS scan mirrors during the blackbody look, respectively; and and are the effective average spectral radiances for the east–west (EW) and north–south (NS) scan mirrors during space look for each channel, respectively. In addition, each effective average spectral is computed with the mirror emissivity and reflectivity for each mirror during ICT measurement (blackbody look) using the following equations:
where the average spectral radiances are , , and , for the average temperature of the EW and NS scan mirrors and ICT, respectively. is channel-specific ICT emissivity, and and are the mirror emissivity and reflectivity at the time of the calibration, respectively.
In the reflective channels, the terms in parentheses on the right side of Equation (3) are zero by definition. Therefore, m of the calibration coefficient is given by
where is the average SCT count, is the average space count during solar calibration for each detector in each channel, is the SCT effective average spectral radians as in Equation (9) for each channel, and f_(int.ch) is the integration factor for the SCT scene.
where is the average spectral radiance of this SCT calculated by the average radial distance from the Earth to the Sun (i.e., 1 AU), average spectral radiance at 1 AU, the actual distance between the Earth and the Sun at the time of the calibration, and the effective bidirectional reflectance function (BRDF) of the solar calibration target by the equation.
4.1. Radiometric Performance of Visible and Near-Infrared (VNIR) Channels
The post-launch AMI calibration and validation methods outlined below were developed in collaboration with the KMA and the Global Space-based Inter-Calibration System (GSICS). This paper focuses on approaches (a) and (c), and approach (b) will be described in another paper.
- Ray matching with reference to Terra/Moderate Resolution Imaging Spectroradiometer (MODIS) and Suomi-NPP/Visible Infrared Imaging Radiometer Suite (VIIRS);
- Radiative transfer calculation (RTC) involving comparison with simulated top-of-atmosphere (TOA) radiance;
- Lunar irradiance, involving comparison with a lunar model.
4.1.1. Ray Matching
Despite confidence about the on-board absolute calibrator SCT, KMA developed various inherited vicarious calibration methods for VNIR channels. Ray-matching is an inter-comparison method between geostationary (GEO) satellites and well-calibrated low earth orbit (LEO) satellites (e.g., Terra MODIS, Suomi-NPP VIIRS). Each grid (pixels) from GEO and LEO are matched by satellite and solar angle, spatial resolution, and temporal interval. This method has the advantage of securing data without gaps whenever LEO overpasses the GEO observation area because it does not select any specific target. Thus, it is possible to obtain the various reflectance ranges for inter-comparison.
Table 3 specifies the thresholds for selecting ray-matched pixels between GEO and LEOs (MODIS, VIIRS). In the calibration domain, the GEO and LEO pixels are binned and gridded within 0.1° × 0.1° considering the different spatial resolutions of each satellite, and the time difference is ±5 min for matching temporal resolution. The different operation orbits for matching the satellite and solar viewing angles and the different SRFs have to be considered using the National Aeronautics and Space Administration (NASA) spectral band adjustment factor (SBAF) (Table 4). The closest matching SRFs between AMI and LEOs are used, and the SRF of LEOs are adjusted using the NASA SBAF tool on the basis of the scanning imaging absorption spectrometer for atmospheric CHartographY (SCIAMACHY) visible hyperspectral data [11,12].
Table 3.
Thresholds for inter-comparison among AMI, MODIS, and VIIRS using ray-matching method.
Table 4.
Spectral band adjustment factor (SBAF) values and matching channels for ray matching method.
Figure 6 shows the monthly mean reflectance ratio obtained from the ray-matching results from May 2019 to January 2020. The reflectance ratio (AMI/LEOs) was used to investigate the performance of AMI VNIR channel calibration. The monthly averaged reflectance ratios were obtained by averaging approximately 5000 collocated data points per month. It can be seen that the monthly averaged ratios were mostly within ±5% of the overall averaged values. The reflectance ratios between AMI/MODIS showed relatively large variance and strong seasonal variation compared with those between AMI/VIIRS. The magnitude of seasonal variations using the reflectance ratio (AMI/MODIS) was up to 10%, showing a minimum in summer and maximum in winter, while there was no clear seasonal variation in the reflectance ratios of AMI/VIIRS. Among the VNIR channels, the ratios between AMI and MODIS at VI004 were small (<1.0) throughout the year, except in winter, while those of the other VNIR channels were mostly ≥1.0.
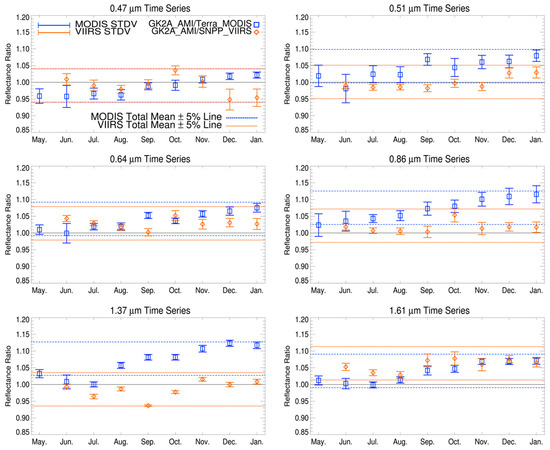
Figure 6.
Ray-matching results from May 2019 to January 2020. Trend of the ratio of observation to reference computed using the ray-matching approach. The blue square (MODIS) and orange diamond (VIIRS) represent monthly averages of reflectance ratio (AMI/low earth orbit (LEO)). The error bar is standard deviation of monthly reflectance ratio. Each dotted line represents the upper/lower 5% line from the total mean values of the reflectance ratio.
When compared with lunar calibration (Section 4.1.2), they showed relatively large variances with clear seasonal variations. Analysis of the cause of the large variations in ray matching between AMI and LEOs compared with lunar calibration is currently being investigated, including factors such as seasonal variation of SCT on-board calibration, and will be presented in another report.
4.1.2. Lunar Calibration
The Moon is a very stable reflector and is an invariable target over time; images of the Moon by satellite sensors are used for long-term characterization of their radiometric performance [13]. AMI can collect several Moon images without impacting the core image collections of the full disk and ELA in the 10-min timeline. Instead, the time slot allocated to collect LA images can be repurposed to observe the Moon. The height of the Moon is approximately 50% of the AMI swath height, which means that only a single swath is required to cover the entire Moon. This allows many Moon images to be collected each time the Moon passes through the AMI field of regard. Many Moon images observed with similar phase angles (the observation geometry of Sun–Moon–satellite) can be used to reduce uncertainties in the evaluation of each individual image. The ability to scan the entire Moon in a single swath also drastically reduces one of the significant error sources in using the Moon for characterization; that is, the knowledge of the location on the Moon for each detector sample was collected. With the complete image of the Moon in a single swath, the north, south, east, and west edges can be clearly identified, which permits every detector sample to be precisely registered to the lunar surface. The World Meteorological Organization (WMO) and Coordination Group for Meteorological Satellites (CGMS), through the GSICS [14], coordinates international collaboration to develop a standard methodology for long-term calibration of satellite instruments using lunar irradiance. AMI is particularly well suited for such an approach.
GK2A has observed approximately 40 Moon images every month since May 2019, when the Moon is positioned between the Earth limb and the AMI field of regard. The GK2A AMI observes the Moon three times using one LA with three swaths in the Moon observation timeline, which is similar to the operation timeline (Figure 4), but the first LA observation is replaced with three Moon observations. Figure 7 shows the Moon image from the AMI VI006 channel. Occasionally, the Moon image can be observed with the edge of the earth in each swath. Lunar calibration of the visible and near-infrared channels is performed by comparing the disk-integrated lunar irradiance derived from satellite observations with a reference lunar irradiance retrieved by an empirical irradiance model, the Robotic Lunar Observatory (ROLO) model [14,15]. Lunar calibration aims to define unified calibration references in the framework of GSICS activities; therefore, it uses a lunar calibration tool named the GSICS implementation of the ROLO model (GIRO) [16]. GIRO can cover a spectral range from visible (0.35 µm) to near-infrared (2.35 µm) with 1% relative accuracy and has been widely used as a reference for instrument monitoring on GEO [17,18] and LEO [19] satellites. GIRO is a lunar calibration tool for European Organisation for the Exploitation of Meteorological Satellites (EUMETSAT) and has been made available to the GSICS community for activities that are focused on defining unified calibration references [16]. Using this, and with the possibility of obtaining superior lunar calibration accuracy, the objective of this study was to use GIRO to monitor and improve the radiometric calibration accuracy of the AMI VNIR channels.
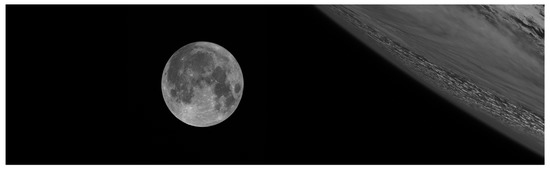
Figure 7.
An AMI image of the Moon and portion of the Earth observed by GK2A AMI on 9 September 2019 in VI006 channel (0.64 µm).
Figure 8 shows the lunar calibration results for the six VNIR channels. The results indicated that the ratios of irradiances retrieved by GIRO and lunar observations were within 5%, except VIS004, and showed strong seasonal variation, possibly due to seasonal variation in the phase angle of the Moon. The phase angle of the Moon showed a repeated pattern with a half-year frequency, that is, the maximum positive (negative) phase angle is in July/January (June/December), which is related to Moon observation attitude and time. Furthermore, the seasonal variation trend is similar to the results obtained using the ray matching method. Seasonal variation also appeared in the calibration coefficient of the VNIR channel, showing a variation trend of approximately 1 to 2% (not shown in this paper). In order to analyze the causes of seasonal variation in lunar calibration result, one must reprocess the lunar observation data must without the updates of solar calibration coefficients, which will allow the de-coupling of the SCT from the instrument performance.
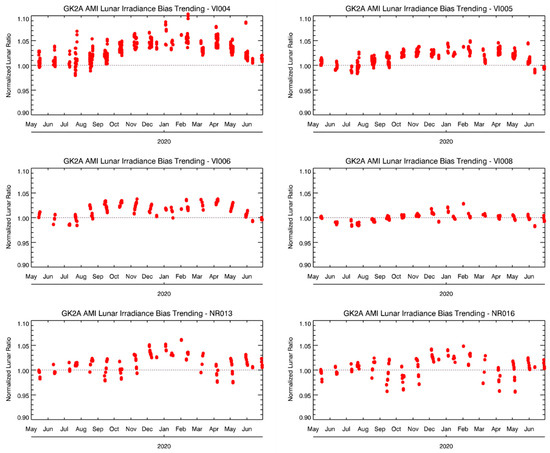
Figure 8.
Lunar irradiance bias trending of AMI visible and near-infrared (VNIR) channels from May 2019 to June 2020.
4.2. Radiometric Performance of Infrared Channels
4.2.1. GEO–LEO Inter-Calibration
The performance of the AMI IR channel was monitored using five well-calibrated hyper-spectral sounders from LEO satellites; infrared atmospheric sounding interferometer (IASI)/MetOp-A, B, and Cross-track Infrared Sounder (CrIS)/Suomi-NPP; NOAA-20; and Atmospheric Infrared Sounder (AIRS)/Aqua as references for inter-calibration under the framework of GSICS [5,13,20]. AMI data from 1 June to 30 September 2019 (from 23 July for IR133) were analyzed in the domain (35° N to 35° S and 110° E to 170° E). The inter-comparison procedures were similar to those used for COMS IR channel inter-calibration [5] but with different spectral ranges and spatial resolutions. The target area is defined by an array of 7 × 7 AMI pixels with 2 km resolution and corresponding LEO pixel (AIRS/CrIS/IASI pixel with 13.5 km/14 km/12 km diameters). Thus, AMI radiances (7 × 7 pixels) in the target area need to be averaged to compare with one LEO pixel radiance. Then, pixels with a time difference of less than 300 s were selected. The satellite zenith angles of the selected pixels were checked to consider the difference in the atmospheric optical length of the two satellites. In addition, the homogeneity of the collocation scenes using environmental areas were checked to avoid possible contamination due to fractional clouds. The environmental area was defined as 21 × 21 AMI pixels centered on its target area corresponding to 3 × 3 LEO pixels.
Once the temporal and geometric collocations were performed, we applied the normalization procedure to ensure that the radiances obtained with the different SRFs became a spectrally comparable dataset. A convolution of the LEO hyperspectral data with the AMI SRF for the given channel was applied for the normalization procedure. Then, the LEO hyperspectral radiance values were converted into AMI equivalent LEO radiances. Finally, there were cases for the hyperspectral radiance that did not fully cover the spectral bandwidth of the broadband AMI channels. Using the simulated spectral radiance and the measured IASI radiance, researchers established the relationship between the measured and simulated radiance and used it to reconstruct the gap spectral radiance [21,22]. Meanwhile, the CrIS gap channel was used as a gap-filling method, which predicted the CrIS gap channels on the basis of the principal component-based regression method [23].
In Figure 9 and Table 5, the mean biases for Brightness Temperature (TB) between AMI and IASI-B (used as a reference instrument among the LEOs in this study) were within 0.2 K, except for SW038 (−0.32 K), while the biases at standard scene TB were mostly within −0.10 K, except for SW038 (−0.15 K). The large negative biases in the cold scene (<230 K), when compared with both IASI-A/B, were possibly caused by the partially negative values of IASI radiances in the spectral range in the cold TB ranges. As the TB biases between AMI and LEOs are dependent on measured scene TB, it is necessary to define channel-specified standard TB. The standard scene TB in Table 5 were calculated for each channel using a radiative transfer model (RTM) based on a U.S. standard atmospheric profile and surface conditions, accounting for the SRF of each channel. When considering biases at standard TB, there were excellent agreements between AMI and LEOs, although the comparison results depended on the channels. The biases were not consistent and showed slightly different values among the LEO instruments. For example, there were relatively large biases around 0.17 K in window channels compared with CrIS of NOAA-20, while showing a large bias of −0.15 K in the upper water vapor channel with CrIS of Suomi-NPP among the hyperspectral sounders. The largest bias at standard TB did not exceed 0.2 K among the five LEOs.
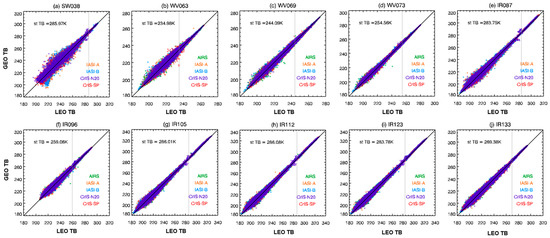
Figure 9.
The scatter plot of Brightness Temperature (TB) from GK2A AMI and LEOs (infrared atmospheric sounding interferometer (IASI)-A (orange), IASI-B (blue), Atmospheric Infrared Sounder (AIRS) (green), Cross-track Infrared Sounder (CrIS)/NOAA-20 (purple), and CrIS/Suomi-PP (red)) for IR channel and grey line of standard scene TB. The period of the AMI data is from 1 June to 30 September 2019 (from 23 July for IR133). The statistics of the results are represented in Table 5.
Table 5.
TB mean biases and the bias at standard scene TB with respect to LEOs.
During the satellite commissioning period, the CO2 channel (IR133, 13.3 µm) showed a large negative mean bias of −0.44 K and −0.6 K at standard scene TB, which implies more cold bias at the warm target temperature. This systematic cold bias is similar to a specific channel in the instrument of the GOES series satellite, and it is often suspected that the SRF uncertainty of the instrument might be an error, that is, some cases have demonstrated that a shifted SRF could eliminate the differences between the measured and the expected values. A GSICS-based inter-comparison with well-calibrated hyperspectral radiometers could conclude that the SRF error is the cause for the bias of the AMI IR133 channel. The radiometric algorithm provides a theoretical basis for correcting the SRF, as the shifted central wavenumber is used in the computation of blackbody radiance [24,25]. First, it is necessary to estimate the central wave number of the shifted SRF in a practical way to reduce the bias. To investigate a first-order estimation, we shifted the SRF of the IR133 channel with a relatively large value, that is, −1 cm−1, and the result showed warm bias from cold bias at standard scene temperature. To find an appropriate central wave number for the IR133 channel, we generated the SRF of AMI for the test at 0.1 cm−1 interval from −1 cm−1 to 1 cm−1 in the central wave number of the existing SRF. By applying several SRFs and performing calibration through a ground processing algorithm (GPA), we were able to compare the updated L1B data of AMI with IASI-B using the GSICS algorithm [13,20]. Through this iterative test, when the bias was minimized, we obtained the central wave number of SRF (752.79248 cm−1) by shifting by −0.8 cm−1. The test was performed using data from 23 July to 11 August 2019.
The mean biases of IASI-B were −0.45 K and −0.69 K at standard scene TB before applying shifted SRF, while the biases after applying it were 0.01 and −0.07 K at standard scene TB. In particular, the biases after applying shifted SRF (Figure 10d) were stable compared to the biases before applying the shifted SRF (Figure 10b) at the high temperature scene (approximately 250 K to290 K). The updated SRF (−0.8 cm−1) was implemented in the operational system on 27 September 2019. After the SRF update, the biases of the 13.3 µm channel were stable and used to reprocess the previous observation data of the CO2 channel.
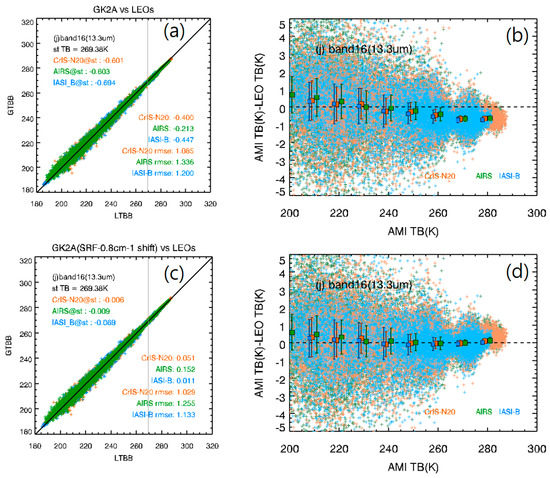
Figure 10.
(a) Scatter plot (LEO TB vs. AMI TB) and (b) ΔTB(AMI-LEO) according to AMI TB with respect to MetOp-B/IASI, Aqua/AIRS, and NOAA-20/CrIS before and those (c,d) after applying shifted SRF.
Overall, IR channel calibration using GEO–LEO inter-calibration method was accurate to within 0.2 K at standard scene TB after applying the SRF shift in IR133 channel, with no significant diurnal and seasonal variations.
4.2.2. GEO–GEO Inter-Calibration
To evaluate the radiometric calibration performance of the AMI infrared channels, we performed an inter-comparison between AMI and AHI on Himawari-8. GEO–GEO inter-calibration in close geostationary orbits has some advantages compared with GEO–LEO inter-calibration, as GEO–GEO inter-comparison between AMI and AHI can be monitored in almost real-time considering that the AHI data can be collected within 10 min. The GEO–GEO approach also helps clarify diurnal calibration variations by complementing missing periods of GEO–LEO collocation time, and work on its development is ongoing [26]. The hardware configuration of the GK2A AMI is similar to that of the Himawari-8/9 AHI, and they are located at adjacent orbits that are only 12.5° longitude apart (AMI is 128.2° E and AHI is 140.7° E), making them suitable for inter-comparison. Figure 11 shows the IR channel SRFs of AMI (red line) and AHI (blue line).
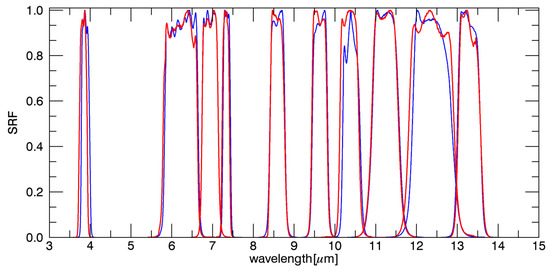
Figure 11.
IR channel spectral response function of AMI (red line) and Advanced Himawari Imager (AHI) (blue line).
Inter-comparison involved generating temporal and spatial collocation data on the basis of the GEO–LEO infrared channel algorithm [20]. The atmospheric optical pass lengths were matched to select the difference of satellite zenith angles of less than 0.5%. The procedure provided a narrow and long collocated area corresponding to 133.45° E–135.45° E. The pixels with an observation time difference within 60 s between AMI and AHI were chosen from the collocated areas. To avoid uncertainty due to the parallax effect of fractional high clouds, we removed pixels having a coefficient of variance (STDV/MEAN) of radiance for the environmental area of (5 × 5 pixels) more than 1. Then, the averaged target area (3 × 3 pixels) in the center of the selected pixels were compared. As geostationary satellites always have the same latitude and longitude regardless of the observation time and the two GEOs have the same relative position, we applied the prior collocation pixel information equally to the observation data of the two satellites for inter-comparison.
Figure 12 presents the scatter plots of the inter-comparison between the GK2A AMI and Himawari-8 AHI IR channels in January 2020. The biases were approximately <0.3 K, except for SW038 and WV063, indicating that the two imagers had a similar radiometric calibration performance. In SW038, a large bias appeared in the cold scene, showing a tail shape inclined toward AMI with biases up to 3.11 K at 220 K. AHI had slightly larger cold anomaly (−6.85 K for TBAHI-IASI/B at 220 K) than that of AMI (−3.74 K for TBAMI-IASI/B at 220 K), which demonstrates a positive anomaly in Figure 12.
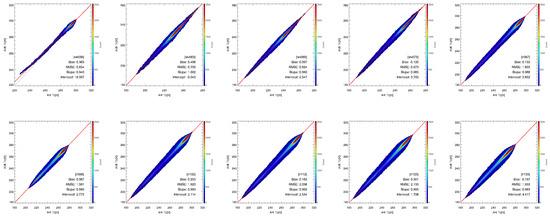
Figure 12.
Scatter plots of TB from GK2A AMI and Himawari-8 AHI IR channels in January 2020.
As shown in Figure 11, the SRFs of each infrared channel between AMI and AHI were very similar but were not completely the same. However, the SRF differences between the two imagers were not taken into account for the direct inter-comparison in Figure 12. Thus, the biases may be greater or smaller than the real difference between the two imagers. One example is the WV063 channel that shows a slightly large bias among all IR channels. However, when the SRF difference was adjusted by applying the SBAF, the mean bias of the WV063 channel decreased from 0.498 K to 0.189 K. The IASI-based SBAFs were computed from algorithms and online tools developed at NASA Langley Research Center with IASI L1C data obtained from EUMETSAT [11,27,28]. The slope and offset were obtained through linear regression after convolution of each SRF of AMI and that of AHI to the radiance of the IASI observing a tropical western Pacific (TWP) region. Because there are many uncertainties such as atmospheric and surface conditions for SRF adjustment, this study mainly focused on the changes in the difference (bias) with time, without correcting the SRF difference between two imagers.
Figure 13 shows the diurnal variation of AMI and AHI TB at 10-min intervals during January 2020. The x-axis represents the Coordinated Universal Time (UTC) time from 00:00 to 23:50 UTC (09:00–08:50 Korea Standard Time (KST)), and the y-axis represents the difference between AMI and AHI TB [K]. A gray dotted line at 15:00 UTC (00:00 KST) indicates local midnight. All channels except SWIR038 (only nighttime) showed a stable variation range of 0.1 K. The peak of diurnal variation is shown around midnight when both satellites were located in the line of Sun–Earth–Satellite. The sunlight directly reached the instrument surface, and this extra heating affected the radiometric calibration coefficients in spite of active cooling system [6,29]. However, AMI has a cryocooler, an active cooler that cools the LWIR and MWIR Focal Plane Modules to their required temperature of about 60 K. Even if the detectors are heated by sunlight over the Earth at midnight, the focal planes can maintain their temperatures and a stable radiometric calibration performance. The time at 00:47 UTC represents the wheel off-loading (WOL) time to control attitude, and the times 02:40 UTC (1 to 31 January except for 13 January) and 14:40 UTC (1 to 31 January) are the AHI’s House Keeping times. Therefore, AHI’s full disk data are not observed at the time. The results show that the mean bias of AMI and AHI is fairly stable within a range of 0.1 K. Both imagers have no distinct diurnal variations in TB biases, unlike the legacy instrument of COMS/MI.
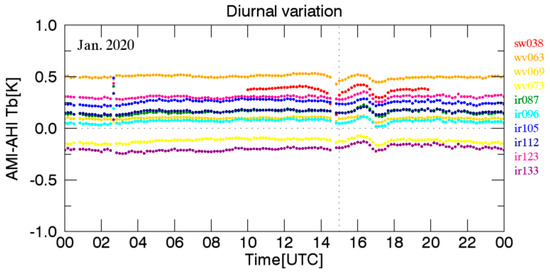
Figure 13.
Diurnal variation of ΔTB (AMI-AHI) [K].
5. Image Navigation and Registration Performance
The data points in GK2A AMI L1B are located at the AMI fixed grid, which is a projection based on the viewing perspective of the idealized location of a satellite in a geosynchronous orbit. This allows the same data points in every product to be at the same location on Earth. All the dynamics associated with an orbiting satellite were removed from the data. The GK2A ground system receives raw data from the AMI and performs the processing required to place the data points on the AMI fixed grid. The fixed grid is rectified to a WGS84 ellipsoid viewed from the idealized geostationary position. Data points at a particular horizontal spatial resolution on the fixed grid have the same angular separation from the satellites in both east to west and north to south directions.
The INR for the GK2A AMI ensures that the L1B pixels are accurately registered to a fixed grid for each spectral channel. The AMI fixed grid is an angle–angle coordinate system that represents an ideal scanning instrument with the origin being the sub-satellite point for an ideally positioned satellite. In case of AMI, a star must be measured to correct the state vectors of INR every 100 s for the visible channel (VI006) and every 300 s for the infrared channel (IR038). These errors are compensated for satellite attitude bias and image distortion. The channel-to-channel co-registration is determined via direct pattern matching between different channels, and a real-time correction is performed using the relationship between these co-registrations and AMI optical system temperatures.
INR performance was monitored by the INR Performance Monitoring (INRPM) tool that performs tie-point matches under clear skies to measure frame-to-frame offsets. The INRPM landmarks are located at predefined sites where land–water boundaries are present and stored in a configuration-controlled catalog. To evaluate whether these results satisfy the user requirements, we assessed the navigation performance using landmark subset offline. The landmarks were created from Landsat-8 observations of corresponding channels with a resolution of 30 m and then remapped onto the GK2A fixed grid.
The performance of GK2A AMI INR was assessed by star measurements and landmark residuals. GK2A INR assessments results from 25 to 31 July 2019, spanning 7 days from the beginning of regular AMI operations, are presented. The results show the visible star residual, IR star residual, and navigation average residual of the full disk images. Then, the results were verified using the validation indices of frame-to-frame registration (FFR), channel-to-channel registration (CCR), swath-to-swath registration (SSR), within-frame registration (WFR), and landmark navigation performance. Table 6 shows the GK2A AMI INR requirements and on-orbit validation performance. The AMI INR navigation residuals summarized in Table 6 are within the required values for these periods.
Table 6.
Required and on-orbit validation of channel navigation residuals for GK2A AMI. The residual is bias plus three standard deviations (confidence level 99.73% (3σ)).
Figure 14 shows the measured GK2A AMI star residuals and averaged residuals for the EW and NS directions from 25 to 31 July 2019. The visible star residuals are the azimuth (EW) and elevation (NS) residuals between the cataloged position of the star recorded in a star list and the observed star position. During this period, approximately 85% of the star residuals in the NS direction and 93% in the EW direction were within 42 µrad. More than 99% of the star residuals in both NS (Figure 14a) and EW (Figure 14b) directions were within the mean ± 3σ. The IR star residual is defined in the same way as the visible star residual. The IR star residuals were much larger than those of visible stars. Only approximately 26% in the EW direction and 12% in the NS direction were within 42 µrad. However, more than 99% of the observations were within the mean ±3σ in both the NS (Figure 14c) and EW directions (Figure 14d). The diurnal patterns that were decreasing at 09:00 UTC (18:00 KST) and increasing at 21:00 UTC (06:00 KST) were shown in IR star residuals. The navigation average residual is the average of all second stars of back-to-back during a scene (Figure 14e,f). During the analysis period, more than 99% were within 42 µrad. The residual in the EW direction showed a diurnal pattern that increased around 06:00 UTC (15:00 KST) and decreased around 20:00 to 21:00 UTC (06:00 KST), and the residual in the NS direction increased around 18:00 UTC and decreased around 09:00 UTC (18:00 KST). In Figure 14, the GK2A AMI star residual in the EW direction was less than that in the NS direction and was more stable over time in the VIS and IR channels. However, further analysis is needed to determine the daily variation for the IR star residual in the EW direction (Figure 14d) and continuous and long-term monitoring.
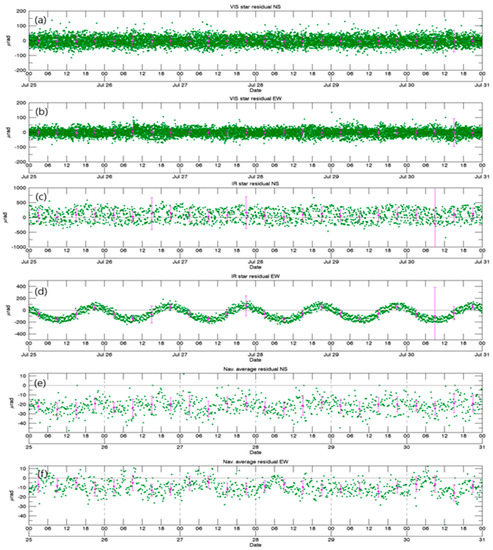
Figure 14.
Visible star residual of NS (a) and EW directions (b), and IR star residuals of NS (c) and EW (d) directions. Navigation average residual of NS (e) and EW (f) from 25 to 31 July 2019.
Figure 15 shows time series plots of navigation performance validated using landmarks for five principal channels (VI005, VI006, SW038, IR105, and IR133). In Figure 15, the x-axis represents the UTC time from 25 to 31 July 2019, with 10-min intervals; the y-axis represents the residuals in units of µrad; and the gray dotted lines represent criteria for 0.5 km, 1 km, and 2 km. Landmark matching of visible channels was only carried out during the daytime. The residuals in the EW direction (upper panel) increased significantly after the north–south station keeping (NSSK) maneuver performed at 12:24 to 12:29 UTC on 30 July. The AMI navigation performance is stable over time and satisfies the requirements in Table 6. As a result of other validation indices analysis, some residual values exceeded the criteria for frame-to-frame registration and swath-to-swath registration, but almost all residuals were within the criteria satisfying the requirements in Table 6.
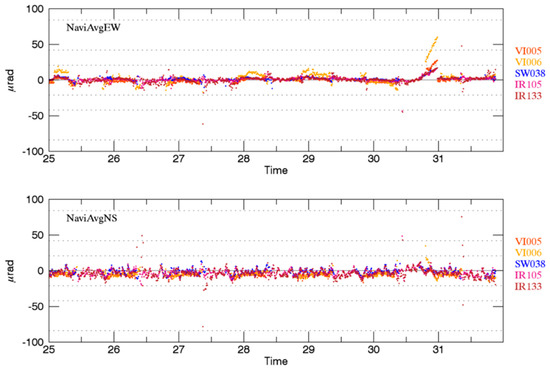
Figure 15.
Time series plots of navigation performance for the five principal channels from 25 to 31 July 2019 since the start of normal operation. y-axis is the residuals in micro radian unit and the gray dotted lines represent criteria.
6. Summary
The GK2A AMI has significant technical enhancements over legacy COMS MI and allows collection of Earth observation data with improved spectral, spatial, and temporal resolutions, as well as advanced capabilities for radiometric calibration. New and improved algorithms have been developed and implemented in the GK2A ground system to process raw observations from AMI into radiometrically calibrated and geolocated imagery to take advantage of the full capabilities of the sensor. Early results demonstrate that AMI is performing as designed, and the ground processing algorithms are processing the raw data into imagery that is of superior quality than that of the COMS imager. AMI has already had a significant impact on meteorologist’s ability to monitor and track significant meteorological events in greater detail than before, since its operation commenced on 25 July 2019.
In post-launch performance validation, IR channel calibration is accurate to within 0.2 K, with no significant diurnal variation using an approach developed under the Global Space-based Inter-Calibration System framework. According to the GEO–LEO inter-calibration results of Himawari-8, TB biases showed −0.21 K to −0.11 K in 3.8 µm to 7.3 µm, −0.29 K in 9.6 µm, and −0.09 K to +0.05 K in 8.7µm or more channels [30]. The ratiometric performance of AMI also was as stable as Himawari-8 through all channels. Likely, the TB biases of GOES-16 showing −0.14 K to +0.03 K in all infrared channels [30] indicate that AMI radiometric calibration performance had stable and good accuracy.
VNIR channels showed unexpected seasonal variation of approximately 5 to 10% using the ray matching method and lunar calibration. The AMI VNIR channels had similar radiometric performance with GOES-16 ABI and Himawari-8 AHI in spite of showing a little bit larger seasonal variation. Seasonal variation requires more analysis and will be reported in future papers.
During the satellite commissioning period, for the CO2 (IR133, 13.3 µm) channel, an updated SRF (−0.8 cm−1) was implemented in the operational system. After the SRF update, the biases of the 13.3 µm channel were stable and could be used to reprocess the previous observation data of the CO2 channel.
The performance of image navigation was accurate within approximately 42 µrad within requirements, and channel-to-channel registration was validated.
Small diurnal variations in IR channels and discrepancies in validation results for VNIR channels can be re-examined by checking the onboard ICT calibration system and investigating in order to determine the possible root causes of the discrepancies described in Section 4.1 and Section 4.2. Revisiting the analysis of SCT observation data to reduce seasonal variations and develop new calibration and validation methods, such as Deep Convective Cloud (DCC) inter-calibration and lunar calibration, will contribute significantly to the monitoring of long-term calibration stability. The analyses will be reported in more detail in the future.
The AMI’s enhanced observation capabilities, based on multiple channels and improved temporal and spatial resolution, are expected to provide a greater wealth of information for use in new applications, for example, for information on ocean color, flood monitoring, and vegetation index, which was not derived from heritage GEO imager data. To support the utilization of GK2A AMI data in a wide variety of applications, more accurate and stable radiometric calibration and validation are needed.
Author Contributions
D.K. formulated and directed the methodology, validation, results, and analysis. M.G. processed GK2A AMI and LEO satellite data, plotted and analyzed the results of inter-calibration, and prepared the manuscript. T.-H.O. processed GK2A AMI Moon observation data, plotted and analyzed the results of Moon calibration, and prepared the manuscript. E.-K.K. processed GK2A AMI VNIR channel observation data, plotted and analyzed results of Moon calibration, and prepared the manuscript. H.-J.Y. processed GK2A AMI and Himawari-8 AHI satellite data and AMI INR results, plotted and analyzed the results of inter-calibration, and prepared the manuscript. All authors contributed to the methodology, validation, results, and analysis, and reviewed the manuscript. All authors have read and agreed to the published version of the manuscript.
Funding
This research received no external funding.
Institutional Review Board Statement
Not applicable.
Informed Consent Statement
Not applicable.
Data Availability Statement
Data sharing not applicable.
Acknowledgments
This study was supported by the project entitled “Development of Advanced Meteorological Imager on Geo-Kompsat-2A Satellite” of the KMA/NMSC (Korea Meteorological Administration/National Meteorological Satellite Center).
Conflicts of Interest
The authors declare no conflict of interest.
References
- Schmit, T.J.; Gunshor, M.M.; Menzel, W.P.; Gurka, J.J.; Li, J.; Bachmeier, A.S. Introducing the next-generation advanced baseline imager on GOES-R. Bull. Am. Meteorol. Soc. 2005, 86, 1079–1096. [Google Scholar] [CrossRef]
- Schmit, T.J.; Li, J.; Li, J.; Feltz, W.F.; Gurka, J.J.; Goldberg, M.D.; Schrab, K.J. The GOES-R advanced baseline imager and the continuation of current sounder products. J. Appl. Meteorol. Clim. 2008, 47, 2696–2711. [Google Scholar] [CrossRef]
- Schmit, T.J.; Griffith, P.; Gunshor, M.M.; Daniels, J.M.; Goodman, S.J.; Lebair, W.J. A closer look at the ABI on the GOES-R series. Bull. Am. Meteorol. Soc. 2017, 98, 681–698. [Google Scholar] [CrossRef]
- Bessho, K.; Date, K.; Hayashi, M.; Ikeda, A.; Imai, T.; Inoue, H.; Kumagai, Y.; Miyakawa, T.; Murata, H.; Ohno, T.; et al. An Introduction to Himawari-8/9—Japan’s new-generation geostationary meteorological satellites. J. Meteorol. Soc. Jpn. 2016, 94, 151–183. [Google Scholar] [CrossRef]
- Kim, D.; Ahn, M. Introduction to the in-orbit-test and its performance of the first meteorological imager of the communication ocean, and meteorological satellite. Atmos. Meas. Tech. 2014, 7, 2471–2485. [Google Scholar] [CrossRef]
- Kalluri, S.; Alcala, C.; Carr, J.; Griffith, P.; Lebair, W.; Lindsey, D.; Race, R.; Wu, X.; Zierk, S. From photons to pixels: Processing data from the advanced baseline imager. Remote Sens. 2018, 10, 177. [Google Scholar] [CrossRef]
- Datla, R.; Shao, X.; Cao, C.; Wu, X. Comparison of the calibration algorithms and SI traceability of MODIS, VIIRS, GOES, and GOES-R ABI sensors. Remote Sens. 2016, 8, 126. [Google Scholar] [CrossRef]
- Kieffer, H.H.; Stone, T.C. The spectral irradiance of the moon. Astron. J. 2005, 129, 2887–2901. [Google Scholar] [CrossRef]
- Griffith, P.C. 11.2 ABI’s unique calibration and validation capabilities. In Proceedings of the 12th Annual Symposium on New Generation Operational Environmental Satellite Systems, AMS Annual Meeting, New Orleans, LA, USA, 11–14 January 2016. [Google Scholar]
- Okuyama, A.; Andou, A.; Date, K.; Hoasaka, K.; Mori, N.; Murata, H.; Tabata, T.; Takahashi, M.; Yoshino, R.; Bessho, K. Preliminary validation of Himawari-8/AHI navigation and calibration. Earth Observ. Syst. XX 2015, 9607, 96072. [Google Scholar] [CrossRef]
- Scarino, B.R.; Doelling, D.R.; Minnis, P.; Gopalan, A.; Chee, T.; Bhatt, R.; Lukashin, C.; Haney, C. A web-based tool for calculating spectral band difference adjustment factors derived from sciamachy hyperspectral data. IEEE Trans. Geosci. Remote Sens. 2016, 54, 2529–2542. [Google Scholar] [CrossRef]
- Bovensmann, H.; Burrows, J.P.; Buchwitz, M.; Frerick, J.; Noël, S.; Rozanov, V.V.; Chance, K.V.; Goede, A.P.H. SCI-AMACHY: Mission objectives and measurement modes. J. Atmos. Sci. 1999, 56, 127–150. [Google Scholar] [CrossRef]
- Stone, T.C.; Kieffer, H.H.; Anderson, J.M. Status of use of lunar irradiance for on-orbit calibration. Earth Observ. Syst. VI 2002, 4483, 165–176. [Google Scholar] [CrossRef]
- Goldberg, M.; Ohring, G.; Butler, J.; Cao, C.; Dalta, R.; Doelling, D.; Gaertner, V.; Hewison, T.; Iacovazzi, B.; Kim, D. Global space-based inter-calibration system (GSICS). Bull. Am. Meteorol. Soc. 2011, 92, 468–475. [Google Scholar] [CrossRef]
- Oh, T.-H.; Kim, D. Coms visible channel calibration using moon observation data. Remote Sens. 2018, 10, 726. [Google Scholar] [CrossRef]
- EUMETSAT, High Level Description of the GIRO Application and Definition of the Input/Output Formats. 2015. Available online: http://gsics.atmos.umd.edu/bin/view/Development/LunarWorkArea (accessed on 2 February 2015).
- Wu, X.; Stone, T.C.; Yu, F.; Han, D. Vicarious calibration of GOES Imager visible channel using the Moon. Proc. SPIE Earth Obs. Syst. XI 2006, 6296, 62960Z. [Google Scholar] [CrossRef]
- Viticchie, B.; Wagner, S.C.; Hewison, T.J.; Stone, T.C.; Nain, J.; Gutierrez, R.; Muller, J.; Hanson, C. Lunar calibration of MSG/SEVIRI solar channels. In Proceedings of the EUMETSAT Meteorological Satellite Conference, Vienna, Austria, 16–20 September 2013. [Google Scholar]
- Eplee, R.E.; Meister, G.; Patt, F.S.; Barnes, R.A.; Bailey, S.W.; Franz, B.A.; McClain, C.R. On-orbit calibration of SeaWiFS. Appl. Opt. 2012, 51, 8702–8730. [Google Scholar] [CrossRef]
- Hewison, T.; Wu, X.; Yu, F.; Tahara, Y.; Hu, X.; Kim, D.; Koenig, M. GSICS inter-calibration of infrared channels of geosta-tionary imagers using Metop/IASI. IEEEE Geosci. Remote Sens. 2013, 51, 1160–1170. [Google Scholar] [CrossRef]
- Tahara, Y. New Approach to Intercalibration Using High Spectral Resolution Sounder. MSC/JMA Tech. Note 2008, 50, 1–14. Available online: https://www.data.jma.go.jp/mscweb/technotes/msctechrep50-1.pdf (accessed on 2 February 2015).
- Tahara, Y.; Kato, K. New spectral compensation method for intercalibration using high spectral resolution sounder. MSC/JMA Tech. Note 2009, 52, 1–37. Available online: https://www.data.jma.go.jp/mscweb/technotes/msctechrep52-1.pdf (accessed on 2 February 2015).
- Xu, H.; Chen, Y.; Wang, L. Cross-track infrared sounder spectral gap filling toward improving intercalibration uncertainties. IEEE Trans. Geosci. Remote Sens. 2019, 57, 509–519. [Google Scholar] [CrossRef]
- Wu, X.; Yu, F. Correction for GOES Imager Spectral Response Function Using GSICS. Part I: Theory. IEEE Trans. Geosci. Remote Sens. 2013, 51, 1215–1223. [Google Scholar] [CrossRef]
- Yu, F.; Wu, X. Correction for GOES imager spectral response function using GSICS. Part II: Applications. IEEE Trans. Geosci. Remote Sens. 2013, 51, 1200–1214. [Google Scholar] [CrossRef]
- Okuyama, A.; Takahashi, M.; Date, K.; Hosaka, K.; Murata, H.; Tabata, T.; Yoshino, R. Validation of himawari-8/Ahi ra-diometric calibration based on two years of in-orbit data. J. Meteorol. Soc. Jpn. 2018, 96B, 91–109. [Google Scholar] [CrossRef]
- Cayla, R.-R. L’interféromètre IASI, un nouveau sondeur satellitaire à haute resolution. La météorologie 2001, 8, 23–39. [Google Scholar] [CrossRef][Green Version]
- Chalon, G.; Cayla, F.; Diebel, D. IASI: An advanced sounder for operational meteorology. In Proceedings of the 52nd Congress of IAF, Toulouse, France, 1–5 October 2001. [Google Scholar]
- Johnson, R.X.; Weinreb, M. GOES-8 Imager midnight effects and slope correction. Proc. SPIE 1996, 2812, 596–607. [Google Scholar]
- GSICS Web Meeting on the Annual Calibration Report. Available online: http://gsics.atmos.umd.edu/bin/view/Development/20200416 (accessed on 16 April 2020).
Publisher’s Note: MDPI stays neutral with regard to jurisdictional claims in published maps and institutional affiliations. |
© 2021 by the authors. Licensee MDPI, Basel, Switzerland. This article is an open access article distributed under the terms and conditions of the Creative Commons Attribution (CC BY) license (http://creativecommons.org/licenses/by/4.0/).