Abstract
Understanding rainfall processes as the main driver of the hydrological cycle is important for formulating future water management strategies; however, rainfall data availability is challenging for countries such as Ethiopia. This study aims to evaluate and compare the satellite rainfall estimates (SREs) derived from tropical rainfall measuring mission (TRMM 3B43v7), rainfall estimation from remotely sensed information using artificial neural networks—climate data record (PERSIANN-CDR), merged satellite-gauge rainfall estimate (IMERG), and the Global Satellite Mapping of Precipitation (GSMaP) with ground-observed data over the varied terrain of hydrologically diverse central and northeastern parts of Ethiopia—Awash River Basin (ARB). Areal comparisons were made between SREs and observed rainfall using various categorical indices and statistical evaluation criteria, and a non-parametric Mann–Kendall (MK) trend test was analyzed. The monthly weighted observed rainfall exhibited relatively comparable results with SREs, except for the annual peak rainfall shifts noted in all SREs. The PERSIANN-CDR products showed a decreasing trend in rainfall at elevations greater than 2250 m above sea level in a river basin. This demonstrates that elevation and rainfall regimes may affect satellite rainfall data. On the basis of modified Kling–Gupta Efficiency, the SREs from IMERG v06, TRMM 3B43v7, and PERSIANN-CDR performed well in descending order over the ARB. However, GSMaP showed poor performance except in the upland sub-basin. A high frequency of bias, which led to an overestimation of SREs, was exhibited in TRMM 3B43v7 and PERSIANN-CDR products in the eastern and lower basins. Furthermore, the MK test results of SREs showed that none of the sub-basins exhibited a monotonic trend at 5% significance level except the GSMap rainfall in the upland sub-basin. In ARB, except for the GSMaP, all SREs can be used as alternative options for rainfall frequency-, flood-, and drought-monitoring studies. However, some may require bias corrections to improve the data quality.
1. Introduction
Rainfall is considered the most critical element of the hydrological cycle, as it affects the environment both directly and indirectly [1]. It plays a vital role in understanding the mechanism and interaction of global water and energy balance and is the main input of hydrometeorological models and climate studies [2,3]. Usually, rainfall measurements are performed using station-based rain gauges. However, rain gauge-based techniques for rainfall observations have non-negligible limitations in eco-hydrology research because of their large spatial nonuniformity and temporal availability in rainfall fields [4].
Similarly, Dinku [5] argued that vulnerabilities due to climate variabilities and changes in Africa urged the need for quality climate data where agriculture is dependent on subsistence rain-fed farming [6]. Hence, rainfall-related studies require due attention to sustain millions of lives. However, the distribution and availability of ground-based rainfall data in Africa are sparse and rare [5], particularly in countries such as Ethiopia. This limits the scope for conducting in-depth research in hydrometeorology and climate-related studies. Nevertheless, the availability of remotely retrieved rainfall data at different spatial and temporal resolutions has accorded a breakthrough in the development of a wide range of studies in various disciplines and supplemented ground-based rainfall estimates. Some freely available spatially distributed satellite rainfall products include the merged satellite-gauge rainfall estimate (IMERG), tropical rainfall measuring mission (TRMM), rainfall estimation from remotely sensed information using artificial neural networks—climate data record (PERSIANN-CDR), national oceanic and atmospheric administration (NOAA), climate prediction center morphing technique (CMORPH), multi-sensor precipitation estimate–geostationary (MPEG), the multi-satellite precipitation analysis (TMPA) near-real-time product (3B42RT), climate hazards group infrared rainfall with station data (CHIRPS), African Rainfall Climatology (ARC v2) and tropical applications of meteorology using satellite data and ground-based observation (TAMSAT), the Global Satellite Mapping of Precipitation (GPMaP_NRT), and others.
These different satellite rainfall product comparisons have been widely evaluated to validate whether rainfall estimation accuracy is affected by convective or orographic effects in different parts of the world—e.g., in China [7], the Tibetan Plateau [8], Brazil [9,10], Morocco [11], and East Africa [5,12,13,14,15,16,17,18,19,20]—to demonstrate which products present the greatest potential for use in specific environments.
Gella [19] evaluated six satellite products (CHIRPS, TAMSAT, TRMM-3B42RT v7, PERSIANN-CDR, ARC v2, and CMORPH) over Eastern Ethiopia in the Wabi-Shebele River Basin. He found that TAMSAT has a relatively better capability for detecting rain events. In addition, it was found that all the products underestimated the rainfall amount in the region. Furthermore, Romilly and Gebremichael [18] evaluated TRMM 3B42RT, CMORPH, and PERSIANN rainfall products in Ethiopian river basins. They showed TRMM 3B42RT and CMORPH tended to overestimate rainfall at low elevations but provided reasonably accurate results at high elevations of the river basins. On the other hand, PERSIANN provides reasonably accurate values at low elevations but underestimates at high elevations. Dinku et al. [21] compared CMORPH and TRMM-3B42RT, and TRMM-3B42 rainfall products in the western highlands of Ethiopia and the highlands of Colombia. They reported that the occurrence of rain was underestimated for all products. Hirpa et al. [17] compared CMORPH, TRMM-3B42RT, and PERSIANN in a large river basin of Ethiopia with wider elevation ranges. The researchers found that TRMM-3B42RT and CMORPH underestimated at higher elevations; however, these products also exhibited elevation-dependent trends. Nevertheless, the PERSIANN products did not exhibit any trends for the specific study area. In mountainous Northwest Mexico, Nesbitt et al. [22] found that CMORPH and PERSIANN overestimated the rainfall rate and frequency; TRMM-3B42 estimates agree well with the observed rainfall. In the same basin of Northwest Mexico, Hong et al. [2] found that PERSIANN-CCS products overestimated rainfall at lower altitudes and underestimated the rainfall in highlands. It has also exhibited an elevation-dependent bias in the region.
Gebere et al. [13] compare the performance of three satellite rainfall products (TRMM 3B42, Global Satellite Mapping of Precipitation (GSMaP)_MVK+, and PERSIANN) in the data-scarce Wabi-Shebele River Basin. They used a point-to-grid comparison to evaluate using the satellite product using different categorical indices. In this river basin, TRMM and PERSIANN performed well as compared to GSMaP. Moreover, Derin et al. [13] used nine global-scale high-resolution satellite-based rainfall (SBR) on different complex terrains of the world. As part of the research focus area, the Blue Nile in the Eastern Africa region was considered, and they found that the SBR products underestimate wet season and overestimate dry season precipitation. Investigation of the extreme rainfall rates using the satellite retrieved rainfall product in the Upper Awash River Basin for flood and drought monitoring systems was studied by Mekonnen et al. [13]. Their study was categorized on the basis of the type of sensors (infrared or microwave) and topographic elevation conditions (highlands/lowlands). They found that microwave-based SREs effectively captured/detected the high rainfall rates while infrared-base SREs detected the low rainfall rate.
Reviewing the above studies, particularly those based in Ethiopia, most evaluated the rainfall products; however, only a limited number of authors validated comparisons with the ground observed data in a few locations in Ethiopia [2,19,23]. Different studies have indicated that no single satellite rainfall performs best in all types of climatic and topographic conditions. Therefore, a site-specific satellite rainfall evaluation at the sub-basin level is recommended [13]. In this study, the products that were not studied by previous researchers, but which have been recommended for hydrological and water resources studies, particularly in the Awash River Basin (ARB), were used to evaluate and compare rainfall products (IMERG, TRMM 3B43v7, PERSIANN-CDR, and GSMaP) with ground-observed station data across a varied elevation range, i.e., 240–4187 m, in the central and northeastern parts of Ethiopia. This study helps to identify and select the relatively best-fitted rainfall product at a specific sub-basin level for use in extreme rainfall analysis, frequency of rainfall, flood and drought forecasting, and synchronization with the hydrologic model to predict the flow of water in a basin.
This study aimed to evaluate and compare the rainfall estimates derived from IMERG, TRMM 3B43v7, PERSIANN-CDR, and GSMaP_NRT with ground-observed data. The remainder of this paper is organized as follows. Section 1 presents the introduction and objective of this study. Section 2 includes the areal description and methods used to compare the satellite rainfall estimation. Section 3 presents the results and Section 4 presents the discussion. Conclusions are presented in Section 5 of this article, and future recommendations are given in Section 6.
2. Data and Methods
2.1. Study Area
Awash River Basin is among the 12 major river basins of Ethiopia. The basin is located between 7°53′ N, 37°57′ E and 12° N, 43°25′ E. It covers an area of 116,373 km2, with altitudes in the range of 240–4187 m above sea level (a.s.l.) (Figure 1).
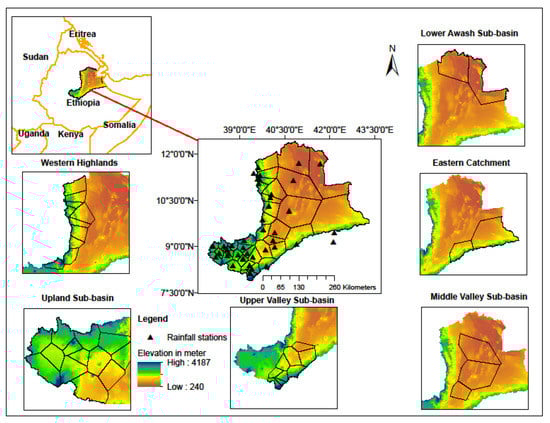
Figure 1.
Location, elevation, and Thiessen polygon map of Awash River Basin (ARB), Ethiopia.
According to the GIS shape file obtained from the Ministry of Water, Irrigation, and Electricity of Ethiopia (MoWIE), the hydrology of the basin is classified into 7 main sub-basins. The sub-basins are the upland (11,229 km2), upper valley (13,063 km2), western highlands (25,776 km2), middle valley (16,259 km2), eastern catchment (39,347 km2), lower valley (4214 km2), and lower plain (6485 km2).
As explained by Adeba et al. [24], the western highlands contribute to almost the entire surface flow of the basin. However, the eastern catchment does not contribute to any surface flow to the river.
The main physiographic features of the river basin are the Ethiopian Plateau and rift valley that widen to the north into the Afar Triangle [25]. The topography of the Ethiopian Plateau is generally flat, with elevations ranging from 2000 to 2500 m. However, there are deeply incised river valleys and volcanic masses rising to 3000 m. In the rift valley, the adjacent alluvial plains are relatively wide, extending to over 25 km in some parts. The rift valley is seismically active and has a history of earthquakes [25].
The climatic conditions in the basin are dominated by humid subtropical areas (the Upper Awash), semi-arid areas (the middle valley), and arid areas (the lower Awash). A river basin characterized with wide variability in mean annual rainfall ranges (160 mm at Asayita of the Lower Plain to 1600 mm at Ankober in the western highlands). The mean annual temperature varies from 20.8 to 29 °C at Koka (in the upland) and Dubti (in the lower valley) [26]. Adeba et al. [24] also stated that land use in the basin was dominated by agricultural land (51.39%), grassland (29.79%), and shrubland (8.11%) [27].
2.2. Data Type
The elevation map shown in Figure 1 was created using the digital elevation model (DEM) provided by the U.S. National Aeronautics and Space Administration (NASA) through the Shuttle Radar Topographic Mission (SRTM 90-m-resolution).
The observed meteorological rainfall data of all 41 stations were obtained from the National Meteorology Agency (NMA) of Ethiopia, whereas the spatially distributed monthly rainfall products, IMERG v06, TRMM 3B43v7, PERSIANN-CDR, and GSMap_NRT—with different spatial resolutions—were retrieved from the NASA Earth data (https://giovanni.gsfc.nasa.gov/giovanni/ accessed on 5 March 2020) and the Center for Hydrometeorology and Remote Sensing [28] website (http://chrsdata.eng.uci.edu/ accessed on 15 March 2020), and JAXA Global Rainfall Watch (https://sharaku.eorc.jaxa.jp/GSMaP/ accessed on 24 February 2021) for the length of records presented in Table 1. Depending on the data input requirement, either for SREs detection using categorical indices (1998–2014) or for computation of rainfall elevation relation (1998–2018), various years of analysis period were used.

Table 1.
Summary of the climatic data used in this study.
2.2.1. Pre-Processing of Data
The recorded rainfall (observed) data may be discontinued for various reasons. As a preliminary step before use for further analysis, the continuity and consistency of rainfall records at each station were checked. Stations with 20% missing data were excluded from the analysis as it may introduce errors into the outputs. A long-term daily average value of various years was used to fill in the missing observed data, even though it was too small; however, none was noted in all retrieved monthly satellite rainfall data. Thereafter, the monthly rainfall was summed up from the daily dataset of observed rainfall and outliers (which can affect the detection of inhomogeneties in the time series data of observed rainfall) were determined using the Tukey fence method [29,30]. MATLAB R2020a programming was used for statistical analysis and graph production. ArcMap 10.3.1 software was used to extract a Net-CDF file of the PERSIANN-CDR product and for producing maps (elevation map and Thiessen polygon) of the basin.
2.2.2. Consistency Analysis
The consistency (homogeneity) of the observed rainfall data in the ARB was checked using double-mass curve techniques [29,31]. The consistency of all selected observed rainfall station data in a basin was found to be consistent, except at Huruta station. This station demonstrated inconsistencies (from 2000 to 2006) and was adjusted using double mass curve techniques. The results of the consistency of the rainfall stations in sub-basin categories are shown in Figure 2.
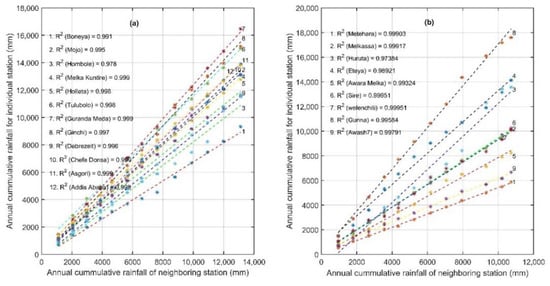
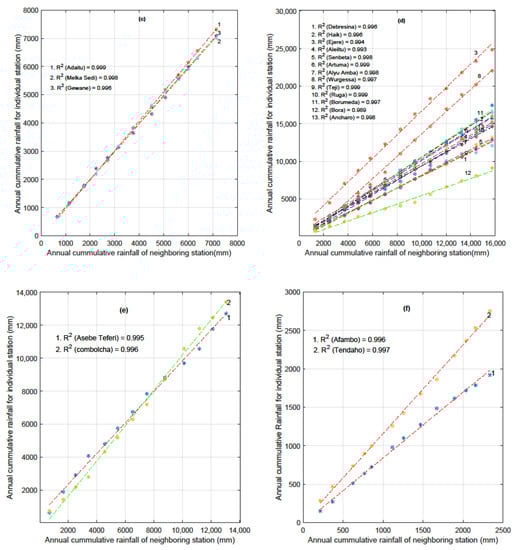
Figure 2.
Consistency test for 41 stations in the ARB: (a) upland sub-basin; (b) upper valley sub-basin; (c) middle valley sub-basin; (d) western highland catchments; (e) eastern catchments; (f) lower Awash sub-basin.
2.3. Methods
The observed rainfall and SREs of the sub-basins have different spatial scales. The observed gauged rainfall data from 41 stations are represented as point rainfall, with an irregular distribution across the basin. The majority of the stations are concentrated in the uplands, upper valley, and western highlands of the ARB. However, it is sparsely distributed in the middle valley, eastern catchment, and lower Awash basin (Figure 1).
There are 2 ways that linked the gridded satellite rainfall estimation with ground rainfall observations [19]. Here, the point rainfall data in ARB were clustered into 6 sub-basins and transformed into areal data to compare with the gridded satellite rainfall data.
2.3.1. Areal Rainfall Using Thiessen Polygon
Point rainfall data (gauged) of each station were spatially interpolated using the Thiessen polygon method and weighted for each sub-basin in the study area. This method calculates the station weights on the basis of the areas of each station. Each weight is then multiplied by the station rainfall to obtain the average areal rainfall [32]. The entire ARB was clustered into 6 different sub-basins and compared with the normal area-weighted on monthly/annual bases. In line with this, the areal average rainfall (observed) of each sub-basins in a given month was compared with different SREs (IMERG, PERSIANN-CDR TRMM 3B43v7, and GSMap_RT) for the period 2000–2014. The accuracy of the remotely retrieved rainfall data was evaluated using standard statistics. The finer spatial resolution of grid data that covers the sub-basins was aggregated and averaged to compare with areal observed rainfall.
2.3.2. SRE Detection Skill Indices
Comparison of the SRE was made with the observed rainfall records on a monthly basis from the year 1998 to 2014 for all sub-basins using categorical error metrics/indices. The categorical performance indices used for this study include computing the probability of detection (POD), false alarm ratio (FAR), and frequency of bias (FBI). These indices are crucial if SRE products are used for computation of rainfall–runoff modeling purposes [12,33]. Gebere et al. [13] and Mekonnen et al. [20] assumed 1 mm/day rainfall as a threshold to decide whether there is rain or not. Therefore, 30 mm of rain was used as a threshold for quantification of a categorical error matrix to detect the expected rainfall on a given month.
As explained in Mekonnen et al. [20], the POD (hits) measures the correct detection by the SREs for the corresponding fraction of observed rainfall rates, or else it is considered as FAR (miss). The false alarm may occur if the SREs has detected but none is recorded by a rain gauage devices. In addition, if both the SREs and the observed stations detects no rainfall records, then it is considered as a correct negative [13,20]. The ratio of the total number of rainfall rates detected by SREs to observed rainfall rates defined as FBI. The formula used to compute POD, FAR, and FBI are explained below.
where H is designated as Hit, F as False alarm and M is the miss which is not detected by SREs but recorded in rain gauge stations. The indices ranges are between 0 to 1 (for POD and FAR) and 0 to ∞ (for FBI), where 1 is a perfect score for POD and FBI and 0 for FAR. FBI > 1 shows the overestimation of SREs and vise versa [34].
2.3.3. Statistical Evaluation of Satellite-Derived Rainfall
In addition to the above categorical error metrics, different statistical measures were used to compare the SREs with on-site rainfall observations for monthly data from 1998 to 2014. The modified Kling–Gupta efficiency (KGE’), Pearson correlation coefficient (PCC), bias ratio (β), and variability ratio (ϒ) were used to evaluate the SREs with the observed rainfall records in ARB [35,36].
The Kling–Gupta efficiency (KGE’) was developed by Gupta et al. [37] to measure the goodness-of-fit between observed and simulated values. Later, Kling et al. [35] modified the measure to improve the performance criteria of hydrological models. Here, the KGE’ was used to test the performance of satellite rainfall estimates and the observed rainfall computed using the following equation.
where r is the linear correlation between observed rainfall and SREs, and ϒ stands for variability ratio. The optimum value for KGE’, ϒ, and β are 1, and all are dimensionless.
The Pearson correlation coefficient (PCC or r, Equation (5) was used to measure the goodness of the fit and linear association between 2 variables. It measures how well the SREs correspond to the observed rainfall. Its value ranges from 0 to 1, where 1 indicates a perfect score.
where and are the annual or monthly on-site observed rainfall (gauged) and satellite rainfall estimates, respectively.
The β and ϒ of the SREs and the corresponding observed rainfall were computed using Equations (6) and (7).
where and are the mean satellite and observed rainfall, respectively. CVSRE and CVGauge are the coefficient variation of the SREs and the observed rainfall, respectively. In the computation of variability ratio, the CV value was used instead of using the standard deviation to ensure the bias and variability ratio were not cross-correlated [35].
The percent of bias was computed using the following equation as stated in [38]:
2.3.4. Mann–Kendall (MK) Trend Test and Sen’s Slope Estimator
The non-parametric MK trend test statistics and Sen’s slope estimators were employed to detect monotonic trends in climatic data and to estimate the magnitude of a trend in the time series, respectively [27,39,40,41,42]. The details of this MK trend test and Sen’s slope estimator (Q2) follow the method explained in Adane et al. [27].
3. Results
3.1. Rainfall–Elevation Relationship
The long-term average annual observed rainfall versus station elevation graph (Figure 3) was developed to observe the rainfall in the basin and to determine whether it is affected by convective effects, orographic effects, or both. Orographic rainfall from the mountain area of the upland and western highlands has a large contribution to the surface flow of the basin. Ashkriz [43] explained that the rainfall in Ethiopian highlands are due to a combination of orographic and convective rainfall. Therefore, the rainfall in ARB is most likely affected by both effects due to its complex topographic nature. Furthermore, Mekonnen et al. [20] and Beck et al. [44] stated that the heavy rainfall in the Upper Awash Basin is due to influences of very deep convective systems. The average annual rainfall trends in a basin demonstrated a 40 mm (in observed rainfall), 38 mm (in PERSIANN-CDR), and 19 mm (in TRMM 3B43v7, IMERG and GSMaP_NRT) increment for an increase of 100 m elevation across the basin (Figure 3). PERSIANN-CDR rainfall estimation showed an increasing trend (R2 = 0.68) in the elevation range of 400–2250 m (Figure 3b). However, a sharp decline was observed in the higher elevation areas (2254–2800 m) of the basin (as shown in blue asterisk in Figure 3b). This finding agrees well with Hirpa et al. (2010), and the PERSIANN rainfall data did not show trends in the high-elevation area (1400–2400 m) of the ARB. These differences may have been due to variations in the type of satellite rainfall products, the retrieval algorithms of the SREs, and temporal resolution differences. The PERSIANN-CDR (infrared-based SREs) rainfall product is preferred for making in-depth investigations on hydrometeorological statistical trends and frequency analysis. In contrast, the PERSIANN data recommended using a short time scale for decision making (1 h to 2 days) [45].
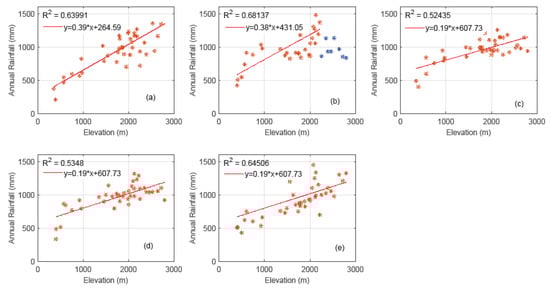
Figure 3.
Long-term annual rainfall with station elevation: (a) gauged rainfall; (b) rainfall estimation from remotely sensed information using artificial neural networks—climate data record (PERSIANN-CDR); (c) tropical rainfall measuring mission (TRMM 3B43v7); (d) merged satellite-gauge rainfall estimate (IMERG); (e) Global Satellite Mapping of Precipitation (GSMaP)_NRT.
3.2. Area-Weighted Rainfall of the River Basin
The clustered observed rainfall records using the Thiessen polygon method showed that the highest annual mean area-weighted rainfall was 1332.39 mm (western highlands) and lowest in the lower basin (461.38 mm) (Table 2, Figure 4a). PERSIANN-CDR data showed the highest areal average rainfall in the eastern catchment (1072.8 mm) of the basin, followed by the upland and upper valley sub-basins. Unlike the PERSIANN-CDR rainfall, the TRMM 3B43v7 and IMERG rainfall showed the highest rainfall in the uplands of the basin (Table 2, Figure 4b–e). However, all satellite rainfall data showed the lowest rainfall records in the lower part of the river basin, below 465 mm/annum. The maximum coefficient of variation (CV) of the annual weighted rainfall of the basin was observed in the lower basin, i.e., 18.45% (in gauged), 17.51% (in PERSIANN-CDR), 17.88% (in TRMM 3B43v7), and 16.24% (in IMERG), as presented in Table 2. The range of variability of the annual weighted observed rainfall, PERSIANN-CDR, TRMM 3B43v7, IMERG v06, and GSMaP_NRT was from 461.38 to 1332.39 mm yr−1, 435.84 to 1072.8 mm yr−1, 445.58 to 1047.4 mm yr−1, 398.55 to 1141.7 mm yr−1, and 558.0 to 958.4 mm yr−1, respectively. Subsequently, all satellite data showed a relatively close range of variability with the observed areal rainfall data, except that the GSMaP_NRT rainfall records experienced a higher coefficient of variabilities of above 30%.
Table 2.
Statistics of the annual area-weighted rainfall of the ARB.
Figure 4.
Box plot showing the median, quantile, and range of annual area-averaged rainfall: (a) observed rainfall, (b) PERSIANN-CDR, (c) TRMM 3B43v7, (d) IMERG, (e) GSMap_NRT. The red plus signs (+) are the outliers of areal average rainfall in sub-basins. UV: upper valley; MV: middle valley; WH: western highland catchment; EC: eastern catchment; LB: lower basin.
The monthly weighted satellite rainfall distribution across the basin indicated that the rainfall increment (in June and July) reached a peak in August and started to decline after September (Figure 5b–e). Nevertheless, it was observed that rainfall increased in May and June, with peak rainfall in July. These results showed a delay in the peak months (August) of satellite rainfall records compared to the observed ones (July).
Figure 5.
Monthly area-averaged rainfall across the ARB: (a) observed rainfall, (b) PERSIANN-CDR, (c) TRMM 3B43v7, (d) IMERG, (e) GSMap_NRT. The red plus signs (+) are the outliers of monthly areal average rainfall in sub-basins.
In general, the monthly weighted rainfall estimation using the observed and satellite data displayed relatively comparable results except for GSMaP, with wider ranges of standard deviation (172–308 mm/yr). However, the annual weighted rainfall between the gauged (observed) and satellite rainfall exhibited variations both in the upland and western highlands of the ARB.
3.3. Evaluation and Comparison of Satellite Rainfall Data
The areal ground rainfall observation stations (GROS) generated using the Thiessen polygon for the sub-basins were compared with the areal satellite rainfall data of individual stations in the ARB. The comparison is based on the different statistical evaluation criteria discussed below.
3.3.1. SRE Detection Using Categorical Indices
The monthly comparison of the POD of satellite rainfall estimates were in the range of 0.68–0.90 (in TRMM 3B43v7), 0.59–0.93 (in PERSIANN-CDR), 0.70–0.94 (in IMERG), and 0.42–0.77 (in IMERG). All the SREs showed relatively lower detection skill (POD) in the western highlands of the ARB. This sub-basin is dominated by a rugged mountainous topography that can affect the rainfall records by the satellite. In contrast, all the rainfall products experienced a good POD in the upland sub-basin (Table 3). The FBI of the SREs depicted the best performance between the observed and satellite rainfall in the TRMM 3B43 product, except that it was underestimated in the western highland catchment (WH) (FBI < 1). The upland, upper valley, and middle valley of the river basin showed good performance when using PERSIANN-CDR, but it overestimated in the eastern catchment and lower sub-basin. The IMERGv06 product estimates showed relatively better performance across the entire basin. The GSMaP_NRT rainfall product underestimated (FBI < 1) in all sub-basins (Table 3).
Table 3.
Categorical error matrix of the ARB.
3.3.2. Statistical Comparison of SREs
The statistical comparison test of the satellite rainfall with GROS showed that the highest KGE’ above 0.85 was observed in TRMM 3B43v7, PERSIANN-CDR, and IMERGv06 (Table 4). The results showed that the median values of KGE’ for the SREs in all sub-basins had the highest positive value of 0.89 in IMERGv06 and 0.78 in TRMM 3B43v7 and PERSIANN-CDR. However, the GSMaP_NRT rainfall data showed poor performance with the lowest median value of KGE’ (0.29) (Figure 6). The SREs in the western highland and eastern catchments of the river basin experienced a lower KGE’ in three of the rainfall products (TRMM 3B43v7, PERSIANN-CDR, and IMERG v06). Furthermore, the GSMaP_NRT records depicted that only the upland sub-basin exhibited the higher KGE’ (0.61), and the remaining sub-basins experienced poor performance. The middle valley and western highland showed an exceptionally negative KGE’. This shows that the mean observed rainfall provides better estimates than the SREs of GSMaP_NRT in the basin [46].
Table 4.
Statistical comparison of satellite rainfall estimates (SREs) in the ARB.
Figure 6.
Statistical comparison of TRMM 3B43v7, PERSIANN-CDR, and IMERG compared with ground rainfall observation stations (GROS). The red plus signs (+) are the outliers in different statistical criteria.
The highest PCC was observed in most sub-basins in using the satellite rainfall products (Table 4). However, this goodness-of-fit test (PCC) result alone could not guarantee how good the SREs performed in a specific basin. For example, a higher PCC and lower KGE’ was displayed in the western highland of the river basin using the tested satellite rainfall products. Moreover, the GSMaP_NRT results strengthened the above conclusion over the entire basin (Figure 6).
The ideal variability and bias ratio for evaluating the performance of the observed and estimated values are close to 1 [20,35,36]. The dispersion of the SREs from the observed rain gauge records are explained as the ratio of the coefficient of variation, and a higher variability ratio (1.29–2.41) was observed in GSMap_NRT (Figure 7, Figure A1 and Figure A4). Comparing the satellite rainfall with areal GROS, using PCC as a criterion, presented a minimum value in the eastern catchment (0.42–0.62), and a maximum in the upland sub-basins (above 0.89) showed all SRE products (Figure 7). Details of the regression plot using KGE’ and statistically evaluated results of satellite rainfall estimates with areal GROS are shown in the Appendix A (Figure A1, Figure A2, Figure A3 and Figure A4).
Figure 7.
Comparison of statistics of satellite rainfall using a radar chart.
Results of the bias ratio explained that 50% of the sub-basins (upland, upper valley, and middle valley) were overestimated using TRMM 3B43v7 and IMERG v06 rainfall products. The PERSIANN-CDR products overestimated 67% of the basin, including the aforementioned basins and the eastern catchment. The majority of GSMaP_NRT estimates showed underestimation, except for the upland (β = 1.01) and lower sub-basins (β = 1.23). In general, TRMM 3B43v7 and IMERG tended to underestimate 50% of the sub-basin and vice versa (Table 5, Figure 6 and Figure 7). In contrast, the PERSIANN-CDR product overestimated the result (67% of part of the river basin) for elevations below 2250 m a.s.l. and highly underestimated the result for the western highlands of the ARB. This requires bias corrections before being used for hydro-climatic and drought-related analyses.
Table 5.
Sub-basin cluster with percent bias (PBIAS) distribution.
Bias correction techniques help to reduce bias and improve the satellite rainfall data quality, particularly those greater than ±30%. Different bias correction methods from simple additive corrections [47] to a more complex histogram matching techniques [48] might be used to improve the data qualities. Therefore, these satellite data can be used for hydrological analysis when required, particularly in a data-scarce region of the ARB. However, the bias is poorly explained in the western highland catchment (PERSIANN-CDR) of the basin (Table 5).
3.4. MK Trend Test and Sen’s Slope Estimate of Satellite Rainfall Products
As explained in Section 3.3, the regression parameters (PCC) exhibited good results when comparing the satellite rainfall product with GROS. However, the results of the MK trend test and Sen’s slope estimation for satellite products with observed rainfall demonstrated that none of these rainfall products exhibited a statistically significant trend at the 5% significance level for ARB. However, GSMaP exceptionaly identified statistically significant monotonic trends of the SREs in the upland sub-basin. The magnitude of the trends showed an almost negligible rainfall increment or reduction on a monthly basis. The Sen’s slope showed various ranges, i.e., −0.04–0.04 mm/month in TRMM 3B43v7, −0.02–0.05 mm/month in PERSIANN-CDR, and −0.05–0 mm/month in IMERG and −0.02–0.57 mm/month in GSMap_NRT (Table 6).
Table 6.
Mann–Kendall (MK) trend test and Sen’s slope (Q2) result of satellite products.
4. Discussion
Dinku et al. [15] validated different satellite rainfall products of CMORPH, TRMM 3B42RT, and TRMM 3B42 over the complex terrain of Ethiopia. They found that the occurrence of rain was underestimated for all the products. Hirpa et al. [17] evaluated CMORPH, PERSIANN, and TMPA products in ARB—all three resulted in underestimation at higher elevations using the mean annual temporal scale. However, the PERSIANN rainfall products exhibited no trends for specific areas. Romilly and Gebremichael [18] evaluated the satellite rainfall estimates over Ethiopian river basins. They concluded that the bias in the satellite rainfall estimates in Ethiopian river basins depends on the rainfall regime and, in some regimes, the elevation. The findings of these studies, as stated in Section 3.4, shows that TRMM 3B43v7, PERSIANN-CDR, IMERG, and GSMaP_NRT rainfall products exhibited no monotonic trends at a 5% significance level in all six sub-basins of the Awash River, except that the GSMaP_NRT showed an increasing trend in the upland sub-basin. However, a linear regression pattern was observed for all sub-basins.
Furthermore, Mekonnen et al. [13] concluded that microwave sensors showed the highest performance in capturing high rainfall rates while infrared-based SREs captured the low rainfall rates. In the ARB, the uplands and the western highlands receive high rainfall and contribute to a continuous flow of the Awash River. In this basin, the microwave sensors (TRMM 3B43v7 and IMERG) showed relatively low PBIAS and the highest performance in capturing the high rainfall rate. The PBIAS in upland sub-basin exhibited 8% (in TRMM 3B43v7) and 16% (in IMERG v06). In contrast, the PERSIANN-CDR (infrared-based SREs) performed weakly (PBIAS of −46%) in the western highland sub-basin, which receives high annual rainfall. Moreover, the microwave sensor SREs (TRMM 3B43v7 and IMERG v06) showed a PBIAS of −29% in both rainfall products. The IMERG SREs detected the highest POD, followed by TRMM 3B43v7 and PERSIANN-CDR in these two sub-basins. Gebere et al. [13] found GSMaP rainfall estimate performed poorly in the Wabi-Shebele river basin, which has the largest share of the eastern parts of Ethiopia. Some portions of this eastern part of Ethiopia also drain into Awash River, and a comparison of these rainfall records with GSMap SREs resulted in poor performances. In conclusion, satellite rainfall estimates provide better options in sparsely gauged areas with unreliable observed data availability, which affects the hydro-climatic analysis for preventing flooding and impairing the livelihood of society in the ARB, Ethiopia.
5. Conclusions
This study compared and validated the rainfall estimates derived from TRMM 3B43v7, PERSIANN-CDR, and IMERG with GROS over the diversified terrain of the central and northeastern parts of Ethiopia. The major findings of this study are as follows:
- The monthly weighted rainfall estimation using the observed and satellite data displayed relatively comparable results. However, peak mean rainfall shifts were noted from July (for observed rainfall) to August (for all satellite rainfall products).
- The annual PERSIANN-CDR rainfall exhibited a decreasing trend, particularly in the highest elevation areas, ranging from 2250 to 2800 m. This indicates that the SREs using PERSIANN-CDR are highly affected by elevation due to the orographic effect and rainfall regime of the river basin. Furthermore, the very deep convective systems forced not to capture the heavy rainfall in the highlands of Upper Awash Basin using infrared-based SREs (PER-SIANN-CDR).
- On the basis of the statistical result of modified Kling–Gupta efficiency, we found that the microwave-based SREs (IMERG v06 and TRMM 3B43v7) performed well in descending order over the entire basin, followed by the infrared-based SREs (PERSIANN-CDR). However, GSMaP showed poor performance, except in the upland of the ARB.
- In terms of the categorical error metric criteria (POD, FAR, FBI), all the SREs showed relatively lower detection skill (POD) in the Western highlands of the ARB. However, IMERGv06 product estimates showed relatively better performance across the entire basin.
- High dispersion of the SREs was observed in the western highlands of the river basin in all satellite rainfall products, and the GSMap records in particular showed high variability.
- TRMM 3B43v7, PERSIANN-CDR, IMERG, and GSMap rainfall data exhibited poor performance in the eastern catchment with lower KGE and PCC.
- A high frequency of bias that led to an overestimation of SREs was noted in TRMM 3B43v7 and PERSIANN-CDR products in the eastern and Lower Awash Basin.
- Statistically, no monotonic trends of SREs were observed in all six sub-basins, except that the GSMap rainfall product in the upland sub-basin showed a monotonic increasing trend.
- In general, TRMM 3B43v7 and IMERG v06 tended to underestimate 50% of the sub-basin and vice versa. In contrast, the PERSIANN-CDR product exhibited overestimation (67%) for elevations below 2250 m asl and highly underestimated the result for the western highlands of the ARB. This requires bias corrections before being used for hydro-climatic, flood, and drought-related analyses.
6. Recommendations
The observed rainfall stations in the ARB are concentrated in the Upper Awash and part of the western highland, which contributes to the majority of river flow in the basin. However, these rainfall data are sparsely located in other portions of the sub-basin. Therefore, this study recommends using these satellite products as an alternative for the effective planning, designing, and implementation of flood and drought mitigation strategies at the sub-basin level, which will help saves millions of lives in the ARB.
Author Contributions
Conceptualization, G.B.A. and B.A.H.; methodology, G.B.A. and B.A.H.; software, G.B.A.; validation, G.B.A. and B.A.H.; formal analysis, G.B.A. and B.A.H.; investigation, G.B.A. and B.A.H.; resources, G.B.A. and W.-K.L.; data curation, G.B.A. and B.A.H.; writing—original draft preparation, G.B.A. and B.A.H.; writing—review and editing, G.B.A., C.-H.L. and W.-K.L.; visualization, G.B.A., B.A.H., C.-H.L. and W.-K.L.; supervision: G.B.A. and W.-K.L.; project administration, G.B.A.; funding acquisition, G.B.A. and W.-K.L. All authors have read and agreed to the published version of the manuscript.
Funding
This research received no external funding.
Institutional Review Board Statement
Not applicable.
Informed Consent Statement
Not applicable.
Data Availability Statement
Not applicable.
Acknowledgments
The authors gratefully acknowledge the support of the OJEong Resilience Institute (OJERI) at Korea University, National Meteorological Agency of Ethiopia (NMA), NASA Earth data (https://giovanni.gsfc.nasa.gov/giovanni/ accessed on 5 March 2020), Center for Hydrometeorology and Remote Sensing (https://chrsdata.eng.uci.edu/ accessed on 15 March 2020), JAXA Global Rainfall Watch (https://sharaku.eorc.jaxa.jp/GSMaP/ accessed on 24 February 2021) for providing us with rainfall datasets.
Conflicts of Interest
The authors declare no conflict of interest. This research did not receive any specific grant from funding agencies in the public, commercial, or not-for-profit sectors.
Appendix A

Figure A1.
Comparison of TRMM 3B43v7 with GROS.
Figure A1.
Comparison of TRMM 3B43v7 with GROS.


Figure A2.
Comparison of PERSIANN-CDR with GROS.
Figure A2.
Comparison of PERSIANN-CDR with GROS.


Figure A3.
Comparison of IMERG with GROS.
Figure A3.
Comparison of IMERG with GROS.


Figure A4.
Comparison of GSMaP with GROS.
Figure A4.
Comparison of GSMaP with GROS.

References
- Bharti, V.; Singh, C. Evaluation of error in TRMM 3B42V7 precipitation estimates over the Himalayan region. J. Geophys. Res. Atmos. 2015, 120, 12458–12473. [Google Scholar] [CrossRef]
- Hong, Y.; Gochis, D.; Cheng, J.; Hsu, K.; Sorooshian, S. Evaluation of PERSIANN-CCS rainfall measurement using the NAME event rain gauge network. J. Hydrometeorol. 2007, 8, 469–482. [Google Scholar] [CrossRef]
- Kidd, C.; Huffman, G. Global precipitation measurement. Meteorol. Appl. 2011, 18, 334–353. [Google Scholar] [CrossRef]
- Hong, Y.; Tang, G.; Ma, Y.; Huang, Q.; Han, Z.; Zeng, Z.; Yang, Y.; Wang, C.; Guo, X. Remote Sensing Precipitation: Sensors, Retrievals, Validations, and Applications. In Observation and Measurement of Ecohydrological Processes; Li, X., Vereecken, H., Eds.; Springer: Berlin/Heidelberg, Germany, 2018; pp. 1–23. [Google Scholar]
- Dinku, T. Chapter 7-Challenges with availability and quality of climate data in Africa. In Extreme Hydrology and Climate Variability; Melesse, A.M., Abtew, W., Senay, G.B.T., Eds.; Elsevier: Amsterdam, The Netherlands, 2019; pp. 71–80. ISBN 978-0-12-815998-9. [Google Scholar]
- Alexandratos, N.; Bruinsma, J. World Agriculture Towards 2030/2050: The 2012 Revision; FAO: Italy, Rome, 2012. [Google Scholar]
- Li, X.; Zhang, Q.; Xu, C.-Y. Assessing the performance of satellite-based precipitation products and its dependence on topography over Poyang Lake basin. Theor. Appl. Climatol. 2014, 115, 713–729. [Google Scholar] [CrossRef]
- Yin, Z.-Y.; Zhang, X.; Liu, X.; Colella, M.; Chen, X. An assessment of the biases of satellite rainfall estimates over the Tibetan Plateau and correction methods based on topographic analysis. J. Hydrometeorol. 2008, 9, 301–326. [Google Scholar] [CrossRef]
- de Melo, D.C.D.; Xavier, A.C.; Bianchi, T.; Oliveira, P.T.S.; Scanlon, B.R.; Lucas, M.C.; Wendland, E. Performance evaluation of rainfall estimates by TRMM Multi-satellite Precipitation Analysis 3B42V6 and V7 over Brazil. J. Geophys. Res. Atmos. 2015, 120, 9426–9436. [Google Scholar] [CrossRef]
- Paredes-Trejo, F.J.; Barbosa, H.A.; Kumar, T.V.L. Validating CHIRPS-based satellite precipitation estimates in Northeast Brazil. J. Arid Environ. 2017, 139, 26–40. [Google Scholar] [CrossRef]
- Milewski, A.; Elkadiri, R.; Durham, M. Assessment and comparison of TMPA satellite precipitation products in varying climatic and topographic regimes in Morocco. Remote Sens. 2015, 7, 5697–5717. [Google Scholar] [CrossRef]
- Derin, Y.; Yilmaz, K.K. Evaluation of multiple satellite-based precipitation products over complex topography. J. Hydrometeorol. 2014, 15, 1498–1516. [Google Scholar] [CrossRef]
- Gebere, S.B.; Alamirew, T.; Merkel, B.J.; Melesse, A.M. Performance of high resolution satellite rainfall products over data scarce parts of Eastern Ethiopia. Remote Sens. 2015, 7, 11639–11663. [Google Scholar] [CrossRef]
- Bayissa, Y.; Tadesse, T.; Demisse, G.; Shiferaw, A. Evaluation of satellite-based rainfall estimates and application to monitor meteorological drought for the Upper Blue Nile Basin, Ethiopia. Remote Sens. 2017, 9, 669. [Google Scholar] [CrossRef]
- Dinku, T.; Ceccato, P.; Grover-Kopec, E.; Lemma, M.; Connor, S.J.; Ropelewski, C.F. Validation of satellite rainfall products over East Africa’s complex topography. Int. J. Remote Sens. 2007, 28, 1503–1526. [Google Scholar] [CrossRef]
- Gella, G.W. Statistical evaluation of high resolution satellite precipitation products in arid and semi-arid parts of Ethiopia: A note for hydro-meteorological applications. Water Environ. J. 2019, 33, 86–97. [Google Scholar] [CrossRef]
- Hirpa, F.A.; Gebremichael, M.; Hopson, T. Evaluation of high-resolution satellite precipitation products over very complex terrain in Ethiopia. J. Appl. Meteorol. Climatol. 2010, 49, 1044–1051. [Google Scholar] [CrossRef]
- Romilly, T.G.; Gebremichael, M. Evaluation of satellite rainfall estimates over Ethiopian river basins. Hydrol. Earth Syst. Sci. 2011, 15, 1505. [Google Scholar] [CrossRef]
- Worqlul, A.W.; Maathuis, B.; Adem, A.A.; Demissie, S.S.; Langan, S.; Steenhuis, T.S. Comparison of rainfall estimations by TRMM 3B42, MPEG and CFSR with ground-observed data for the Lake Tana basin in Ethiopia. Hydrol. Earth Syst. Sci. 2014, 18, 4871–4881. [Google Scholar] [CrossRef]
- Mekonnen, K.; Melesse, A.M.; Woldesenbet, T.A. Spatial evaluation of satellite-retrieved extreme rainfall rates in the Upper Awash River Basin, Ethiopia. Atmos. Res. 2021, 249, 105297. [Google Scholar] [CrossRef]
- Dinku, T.; Connor, S.J.; Ceccato, P. Comparison of CMORPH and TRMM-3B42 over mountainous regions of Africa and South America. In Satellite Rainfall Applications for Surface Hydrology; Springer: Dordrecht, The Netherlands, 2010; pp. 193–204. [Google Scholar]
- Nesbitt, S.W.; Gochis, D.J.; Lang, T.J. The diurnal cycle of clouds and precipitation along the Sierra Madre Occidental observed during NAME-2004: Implications for warm season precipitation estimation in complex terrain. J. Hydrometeorol. 2008, 9, 728–743. [Google Scholar] [CrossRef]
- Lemma, E.; Upadhyaya, S.; Ramsankaran, R. Investigating the performance of satellite and reanalysis rainfall products at monthly timescales across different rainfall regimes of Ethiopia. Int. J. Remote Sens. 2019, 40, 4019–4042. [Google Scholar] [CrossRef]
- Adeba, D.; Kansal, M.L.; Sen, S. Assessment of water scarcity and its impacts on sustainable development in Awash basin, Ethiopia. Sustain. Water Resour. Manag. 2015, 1, 71–87. [Google Scholar] [CrossRef]
- Berhe, F.T.; Melesse, A.M.; Hailu, D.; Sileshi, Y. MODSIM-based water allocation modeling of Awash River Basin, Ethiopia. Catena 2013, 109, 118–128. [Google Scholar] [CrossRef]
- Karimi, P.; Bastiaanssen, W.G.M. Spatial evapotranspiration, rainfall and land use data in water accounting. Part 1: Review of the accuracy of the remote sensing data. Hydrol. Earth Syst. Sci. Discuss. 2014, 11, 1073–1123. [Google Scholar]
- Adane, G.B.; Hirpa, B.A.; Lim, C.-H.; Lee, W.-K. Spatial and Temporal Analysis of Dry and Wet Spells in Upper Awash River Basin, Ethiopia. Water 2020, 12, 3051. [Google Scholar] [CrossRef]
- Ashouri, H.; Hsu, K.-L.; Sorooshian, S.; Braithwaite, D.K.; Knapp, K.R.; Cecil, L.D.; Nelson, B.R.; Prat, O.P. PERSIANN-CDR: Daily precipitation climate data record from multisatellite observations for hydrological and climate studies. Bull. Am. Meteorol. Soc. 2015, 96, 69–83. [Google Scholar] [CrossRef]
- Adane, G.B.; Hirpa, B.A.; Song, C.; Lee, W.-K. Rainfall Characterization and Trend Analysis of Wet Spell Length across Varied Landscapes of the Upper Awash River Basin, Ethiopia. Sustainability 2020, 12, 9221. [Google Scholar] [CrossRef]
- Ngongondo, C.; Xu, C.-Y.; Gottschalk, L.; Alemaw, B. Evaluation of spatial and temporal characteristics of rainfall in Malawi: A case of data scarce region. Theor. Appl. Climatol. 2011, 106, 79–93. [Google Scholar] [CrossRef]
- Searcy, J.K.; Hardison, C.H. Double-mass curves. Manual of hydrology: Part I, General surface water techniques. Geol. Surv. Water-Supply Pap. United States Gov. Print. Off. Washingt. 1960, 1541, 31–40. [Google Scholar]
- Faisal, N.; Gaffar, A. Development of Pakistan’s new area weighted rainfall using Thiessen polygon method. Pakistan J. Meteorol. 2012, 9, 107–116. [Google Scholar]
- Bajracharya, S.R.; Palash, W.; Shrestha, M.S.; Khadgi, V.R.; Duo, C.; Das, P.J.; Dorji, C. Systematic evaluation of satellite-based rainfall products over the Brahmaputra basin for hydrological applications. Adv. Meteorol. 2015, 2015. [Google Scholar] [CrossRef]
- Ayehu, G.T.; Tadesse, T.; Gessesse, B.; Dinku, T. Validation of new satellite rainfall products over the Upper Blue Nile Basin, Ethiopia. Atmos. Meas. Tech. 2018, 11, 1921–1936. [Google Scholar] [CrossRef]
- Kling, H.; Fuchs, M.; Paulin, M. Runoff conditions in the upper Danube basin under an ensemble of climate change scenarios. J. Hydrol. 2012, 424, 264–277. [Google Scholar] [CrossRef]
- Knoben, W.J.M.; Freer, J.E.; Woods, R.A. Inherent benchmark or not? Comparing Nash–Sutcliffe and Kling–Gupta efficiency scores. Hydrol. Earth Syst. Sci. 2019, 23, 4323–4331. [Google Scholar] [CrossRef]
- Gupta, H.V.; Kling, H.; Yilmaz, K.K.; Martinez, G.F. Decomposition of the mean squared error and NSE performance criteria: Implications for improving hydrological modelling. J. Hydrol. 2009, 377, 80–91. [Google Scholar] [CrossRef]
- Harrigan, S.; Zsoter, E.; Alfieri, L.; Prudhomme, C.; Salamon, P.; Wetterhall, F.; Barnard, C.; Cloke, H.; Pappenberger, F. GloFAS-ERA5 operational global river discharge reanalysis 1979–present. Earth Syst. Sci. Data 2020, 12, 2043–2060. [Google Scholar] [CrossRef]
- Ali, R.; Kuriqi, A.; Abubaker, S.; Kisi, O. Long-term trends and seasonality detection of the observed flow in Yangtze River using Mann-Kendall and Sen’s innovative trend method. Water 2019, 11, 1855. [Google Scholar] [CrossRef]
- Gocic, M.; Trajkovic, S. Analysis of changes in meteorological variables using Mann-Kendall and Sen’s slope estimator statistical tests in Serbia. Glob. Planet. Chang. 2013, 100, 172–182. [Google Scholar] [CrossRef]
- Karpouzos, D.K.; Kavalieratou, S.; Babajimopoulos, C. Trend analysis of precipitation data in Pieria Region (Greece). Eur. Water 2010, 30, 30–40. [Google Scholar]
- Shadmani, M.; Marofi, S.; Roknian, M. Trend analysis in reference evapotranspiration using Mann-Kendall and Spearman’s Rho tests in arid regions of Iran. Water Resour. Manag. 2012, 26, 211–224. [Google Scholar] [CrossRef]
- Ashkriz, E. Regional Sources of Precipitation in the Ethiopian Highlands; Department of Earth Sciences, Uppsala University: Uppsala, Sweden, 2015; pp. 5–10. [Google Scholar]
- Beck, H.E.; Vergopolan, N.; Pan, M.; Levizzani, V.; Van Dijk, A.I.J.M.; Weedon, G.P.; Brocca, L.; Pappenberger, F.; Huffman, G.J.; Wood, E.F. Global-scale evaluation of 22 precipitation datasets using gauge observations and hydrological modeling. Hydrol. Earth Syst. Sci. 2017, 21, 6201–6217. [Google Scholar] [CrossRef]
- Nguyen, P.; Ombadi, M.; Sorooshian, S.; Hsu, K.; AghaKouchak, A.; Braithwaite, D.; Ashouri, H.; Thorstensen, A.R. The PERSIANN family of global satellite precipitation data: A review and evaluation of products. Hydrol. Earth Syst. Sci. 2018, 22, 5801–5816. [Google Scholar] [CrossRef]
- Castaneda-Gonzalez, M.; Poulin, A.; Romero-Lopez, R.; Arsenault, R.; Brissette, F.; Chaumont, D.; Paquin, D. Impacts of regional climate model spatial resolution on summer flood simulation. Epic Ser. Eng. 2018, 3, 372–380. [Google Scholar]
- Berg, P.; Feldmann, H.; Panitz, H.-J. Bias correction of high resolution regional climate model data. J. Hydrol. 2012, 448, 80–92. [Google Scholar] [CrossRef]
- Teutschbein, C.; Seibert, J. Bias correction of regional climate model simulations for hydrological climate-change impact studies: Review and evaluation of different methods002E. J. Hydrol. 2012, 456, 12–29. [Google Scholar] [CrossRef]


Publisher’s Note: MDPI stays neutral with regard to jurisdictional claims in published maps and institutional affiliations. |
© 2021 by the authors. Licensee MDPI, Basel, Switzerland. This article is an open access article distributed under the terms and conditions of the Creative Commons Attribution (CC BY) license (http://creativecommons.org/licenses/by/4.0/).