Abstract
Weathering and oxidation of sulphide minerals in mine wastes release toxic elements in surrounding environments. As an alternative to traditional sampling and chemical analysis methods, the capability of proximal and remote sensing techniques was investigated in this study to predict Chromium (Cr) concentration in 120 soil samples collected from a dumpsite in Sarcheshmeh copper mine, Iran. The samples’ mineralogy and Cr concentration were determined and were then subjected to laboratory reflectance spectroscopy in the range of Visible–Near Infrared–Shortwave Infrared (VNIR–SWIR: 350–2500 nm). The raw spectra were pre-processed using Savitzky-Golay First-Derivative (SG-FD) and Savitzky-Golay Second-Derivative (SG-SD) algorithms. The important wavelengths were determined using Partial Least Squares Regression (PLSR) coefficients and Genetic Algorithm (GA). Artificial Neural Networks (ANN), Stepwise Multiple Linear Regression (SMLR) and PLSR data mining methods were applied to the selected spectral variables to assess Cr concentration. The developed models were then applied to the selected bands of Aster, Hyperion, Sentinel-2A, and Landsat 8-OLI satellite images of the area. Afterwards, rasters obtained from the best prediction model were segmented using a binary fitness function. According to the outputs of the laboratory reflectance spectroscopy, the highest prediction accuracy was obtained using ANN applied to the SD pre-processed spectra with = 0.91, RMSE = 8.73 mg/kg and RPD = 2.76. SD-ANN also showed an acceptable performance on mapping the spatial distribution of Cr using the ordinary kriging technique. Using satellite images, SD-SMLR provided the best prediction models with values of 0.61 and 0.53 for Hyperion and Sentinel-2A, respectively. This led to the higher visual similarity of the segmented Hyperion and Sentinel-2A images with the Cr distribution map. This study’s findings indicated that applying the best prediction models obtained by spectroscopy to the selected wavebands of Hyperion and Sentinel-2A satellite imagery could be considered a promising technique for rapid, cost-effective and eco-friendly assessment of Cr concentration in highly heterogeneous mining areas.
1. Introduction
Mining and related activities are among the industries heavily releasing toxic elements into the environment. Accumulation of these elements in the upper soil horizons and their transfer into the food chain have adverse effects on crop yield, food quality and soil microbial groups [1]. Chromium (Cr), as one of the most harmful toxic elements, causes severe health implications such as skin and mucous membrane ulceration, allergic and eczematous skin reactions, allergic asthmatic reactions, perforation of the nasal septum and bronchial carcinomas [2]. Therefore, continuous environmental monitoring should be conducted to identify and track toxic elements, including Cr, at their early release stages.
The typical standard chemical analysis methods such as Inductively Coupled Plasma-Mass Spectroscopy (ICP-MS), Inductively Coupled Plasma-Optical Emission Spectroscopy (ICP-OES) and Atomic Absorption Spectroscopy (AAS), despite being precise and reliable, are expensive, time-consuming and very laborious since they require sample preparation with harmful acids containing solutions [3]. Hence, a fast, low-cost and environmental-friendly method is desired to evaluate and monitor changes in soils of contaminated areas.
The emersion of proximal and remote sensing in the range of Visible–Near Infrared–Shortwave Infrared (VNIR–SWIR: 350–2500 nm) has been recognized as alternative and efficient non-contacted detection methods for monitoring and mapping of various soil toxic elements [4,5]. Low to medium levels of toxic elements do not cause apparent signature changes in the soil reflectance spectra [6]; however, their indirect estimation employing laboratory reflectance spectroscopy and remote sensing in VNIR–SWIR region is possible via their correlation with spectrally active soil components such as organic carbon, Iron (Fe)-oxides/hydroxides and clay [7], or through their impacts on vegetation status [8]. Recent studies have reported successful application of VNIR–SWIR reflectance spectra for prediction of Cr, Arsenic (As), Cadmium (Cd), Copper (Cu), Lead (Pb), Nickle (Ni) and Zinc (Zn) in small field scales [9,10,11,12,13].
Satellite/airborne-based sensors have been developed and launched, and more are under development for the near future, generating massive data streams for land monitoring [14]. However, these sensors obtain the signal from the surface and the spectral information from them is related to the bare soil availability (i.e., no vegetation coverage), images derived from remote sensing have the capability of continuous and regular imaging of terrestrial phenomena, collecting data from inaccessible areas and integration with the Geographic Information System (GIS) [15,16,17]. These sensors can extend the related information to soil attributes (e.g., toxic elements) estimation over larger spatial areas. Moreover, spatial distribution of soil toxic elements has been mapped through remote sensing data for large-scale natural resources and environmental management purposes. For instance, Kemper and Sommer [18], Choe et al. [4], Wu et al. [19], Peng et al. [20] and Shi et al. [21] predicted and mapped several soil toxic elements (As, Cr, Ni, Zn, Cu and Pb), using images from the HyMap airborne sensor as well as Landsat and QuickBird satellites.
The use of some spaceborne/airborne sensors in quantitative soil estimation is still challenging due to considerable limitations [22]. For example, despite the high temporal, spectral and spatial resolutions in HyMap or other airborne imaging systems, they have low to medium coverage area and high operational costs compared to freely available existing multispectral and upcoming hyperspectral spaceborne sensors [23]. QuickBird satellite offers a limited spectral resolution. Landsat and Aster revisit cycle of 16 days can result in only a limited number of opportunities to observe bare soil in any given crop calendar and time-series studies [24]. Further research on applying higher spectral/spatial resolution spaceborne imaging sensors with open data policy and shorter revisit time is in high demand. This enables the accessibility of a large data stream, allowing the monitoring of soil contamination for repetitive coverage of large areas.
Hyperion provides high spectral resolution data with 242 bands at 10 nm spectral resolution, 30 m length pixels and swath width of 7.5 km [25]. Sentinel-2A with a high temporal resolution provides moderate spatial and spectral resolution images containing 13 spectral bands with 10 to 60 m pixel length [26]. Hence, Hyperion and Sentinel-2A were considered in this study to overcome the shortcomings mentioned above, which to the best of our knowledge, images derived from these sensors have not been used to assess and predict concentration of toxic elements in highly polluted areas. The main objective of the current study is prediction and mapping Cr in the Sarcheshmeh mine (the largest mine in Iran and one of the largest porphyry copper mines in the world) using images from Hyperion and Sentinel-2A satellites. The capability of Hyperion and Sentinel-2A in Cr prediction and mapping is then compared to the performance of Aster and Landsat 8-OLI satellites, as well as laboratory reflectance spectroscopy as a common approved optical technique for toxic elements determination while testing the potential of Artificial Neural Networks (ANN), Stepwise Multiple Linear Regression (SMLR) and Partial Least Squares Regression (PLSR) machine learning methods and PLSR coefficients and Genetic Algorithm (GA) feature selection techniques.
2. Materials and Methods
2.1. Study Area, Soil Sampling and Chemical Analysis
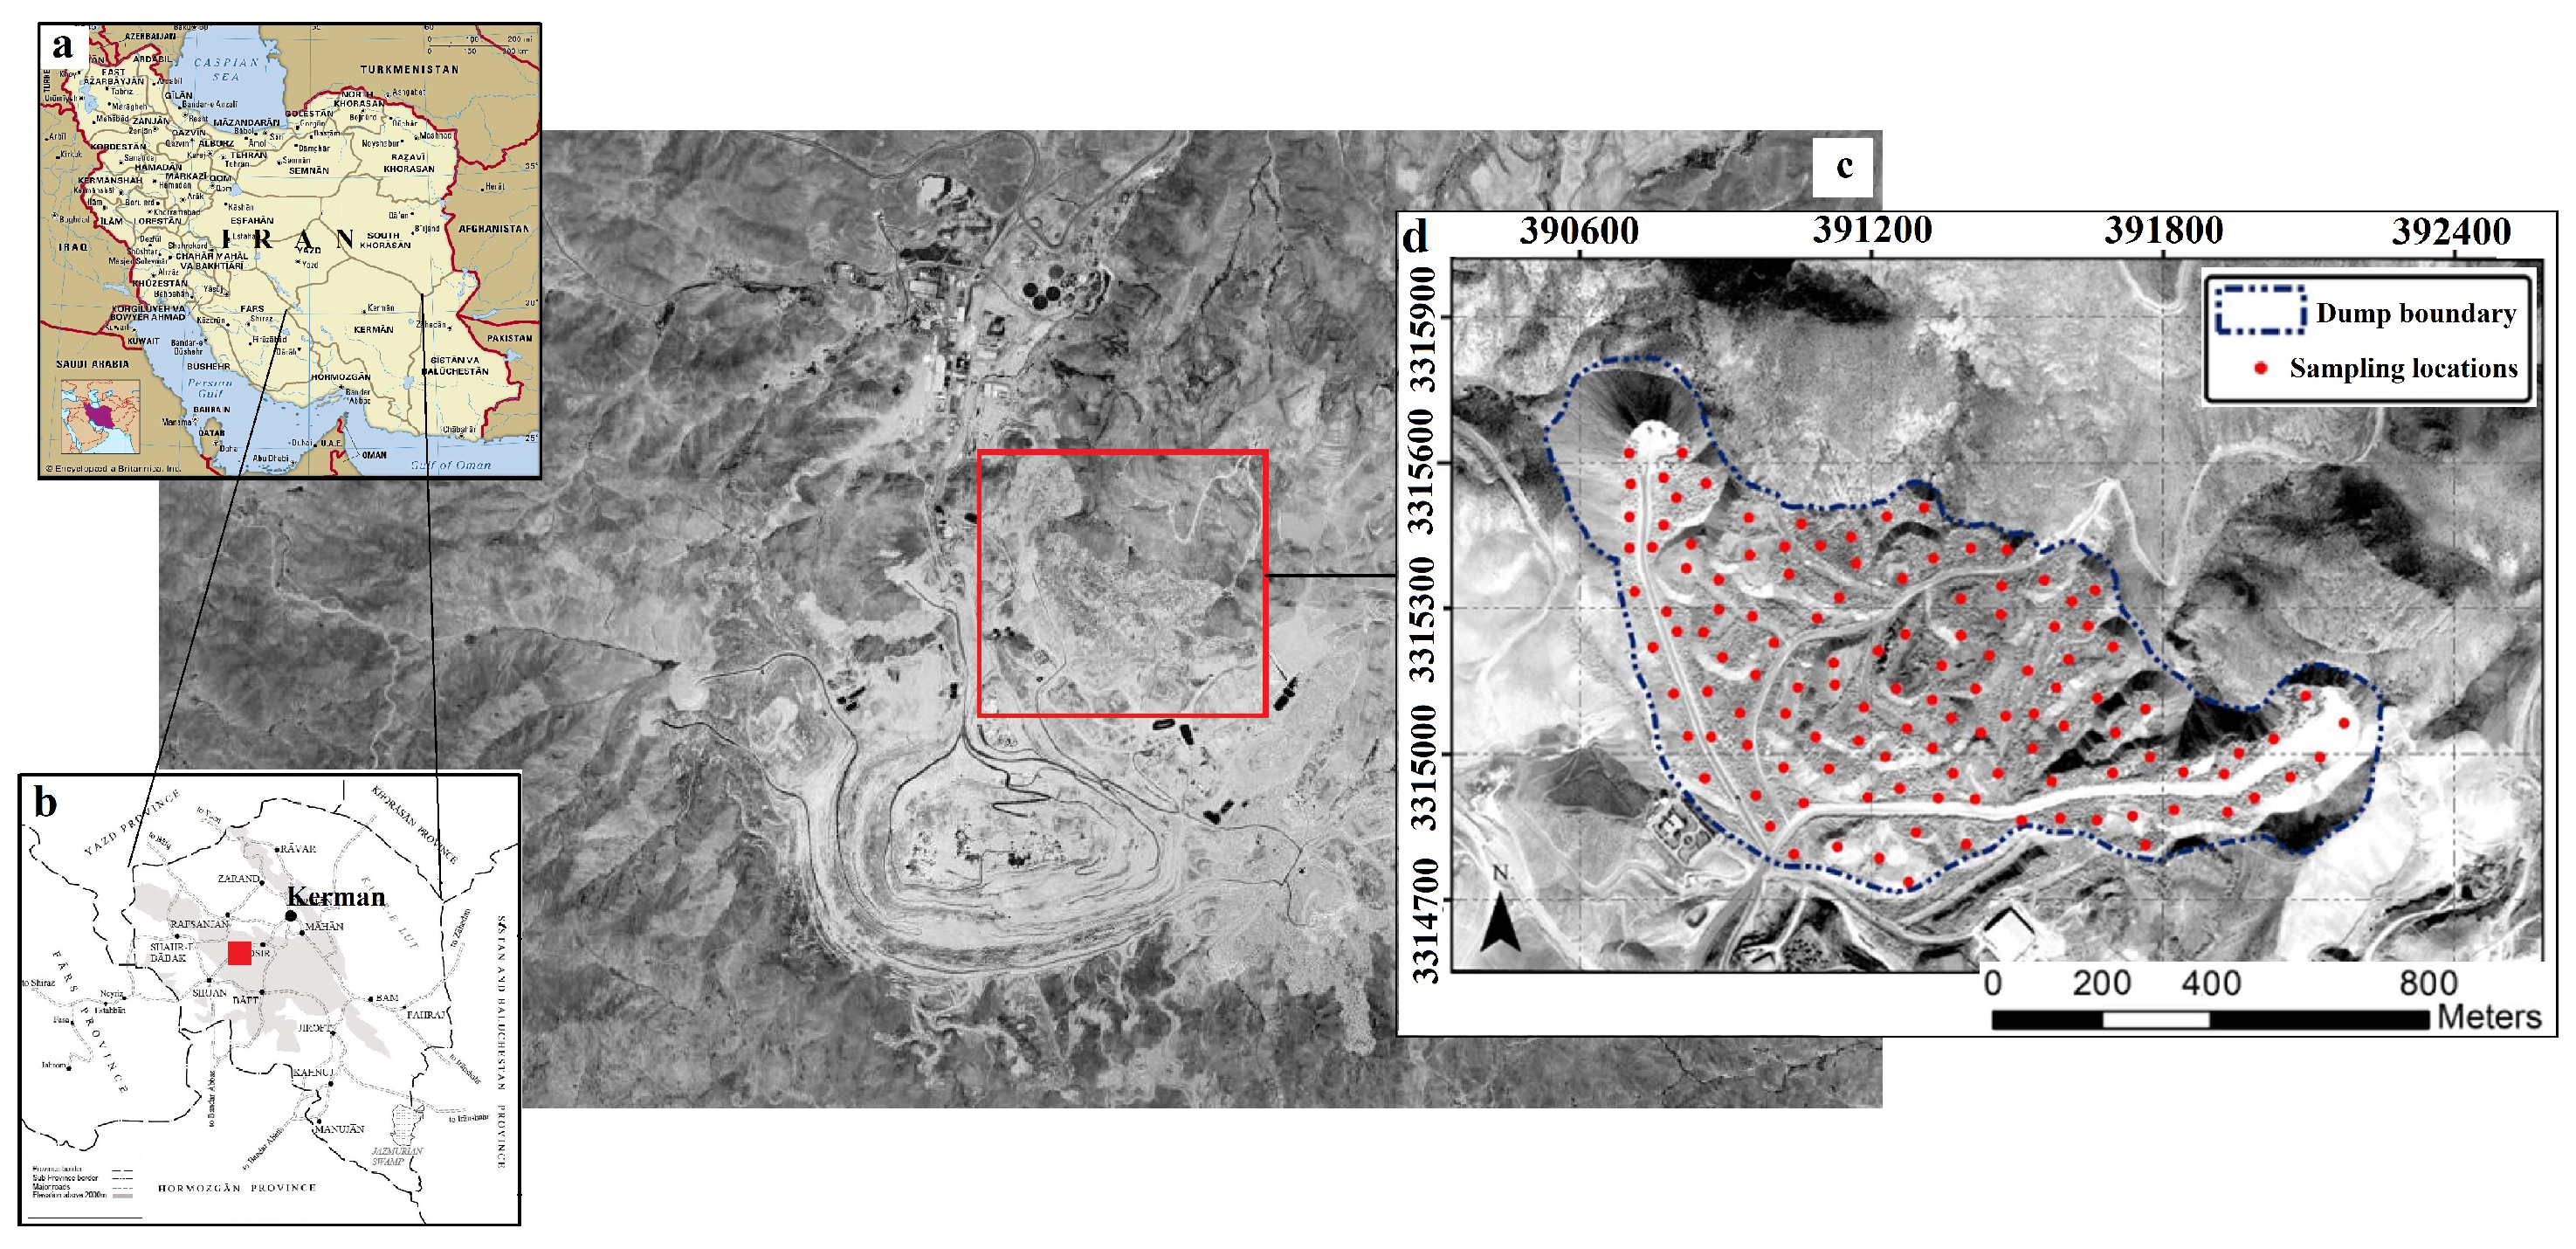
Sarcheshmeh copper mine, with average annual precipitation of about 400 mm, is located in an arid to semi-arid zone in Southwest of Kerman province and South of Iran [11]. Several waste dumps, which are the main sources of Acid Mine Drainage (AMD), have caused spreading of toxic elements in mine’s surrounding environment. The dumpsite no. 31, located in the northeastern part of the mine’s main pit, was chosen as the study area (Figure 1). This dump site was selected according to the following criteria: (i) waste dump inactivity, so that no change occurs in the time gap between sampling and the image acquisition date, (ii) dump surface be accessible via road network, (iii) being highly contaminated and has severe acid generation risk; therefore, no vegetation can grow on its surface due to the extreme condition of the dump environment, and (iv) has a flat surface that avoids spectral diffraction.
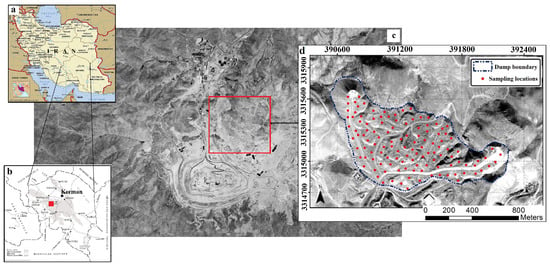
Figure 1.
Study area in Iran (a), in Kerman province (b), in Sarcheshmeh copper complex (c) and dump number 31 (d).
One-hundred twenty (120) soil samples were collected on August 12th, 2015 from depths 0 to 2 cm above the dump surface while recording the coordinates using Garmin etrex 30×, Handheld Global Positioning System (GPS) with an accuracy of ±3 m. Due to the importance of uniform sampling, an attempt was made to take samples from all predetermined points of the dump. For each sample, about 4 kg of waste materials were collected using a geological hammer and a plastic shovel (to prevent any possible contamination) and poured into plastic bags after passing through a 4 mesh (4.76 mm) sieve.
The samples were then transferred to the laboratory, dried at 40 °C and ground to <75 µm (200 mesh) to minimize the impacts of particle size on soil spectral reflectance. Afterwards, they were divided into two parts, one for chemical and the other for spectral analysis. The concentration of Cr was analyzed by ICP-MS (LabWest Minerals Analysis Pty Ltd., Malaga, WA, Australia). X-Ray Diffraction (XRD) along with study of the thin and polished sections were also carried out for quantitative and qualitative analyses of Fe-oxides/hydroxides and clay minerals. Each sample’s pH was measured using a pH electrode inserted in the slurry containing 50 g of soil in 50 mL of distilled water [10].
2.2. Laboratory Reflectance Spectra Measurement and Pre-Processing
Before spectral measurements, samples were dried at 105 °C overnight to reduce the disturbing effects of moisture on soil spectra [27]. An ASD FieldSpec® 3 spectroradiometer (Analytical Spectral Devices Inc., Denver, CO, USA) was used to measure the soil samples’ reflectance spectra in the laboratory. For each measurement, soil samples were placed into 2 cm diameter glass containers and leveled with a stainless-steel blade, formed a 10 cm layer of soil, to guarantee a flat surface flush with the top of the container as a smooth soil surface ensures maximum light reflection and a high Signal-to-Noise Ratio (SNR) [28]. The average of three consecutive readings was considered as the final record of each sample. The spectrometer was re-calibrated every ten samples using a Barium Sulphate (BaSO4) panel.
Variations in the structural properties of the soil samples and the operating condition of the spectrometer cause nonlinearities in the spectra, which may result in random noise, multiple scattering effects and baseline drift [6]. Therefore, spectral pre-processing procedure was applied to the data to reduce these effects. First, spectral bands in the range of 350 to 400 nm and 2451 to 2500 nm were removed from the measured spectra to decrease the instrumental noise and improve the SNR. The reflectance spectra were then transformed to absorbance using Equation (1) to avoid scattering effects [29]:
where A is the Absorbance and R is the Reflectance spectra.
After performing the spectral jump correction, the resulting spectra were re-sampled to 10 nm wavelength intervals to transform each sample’s spectra into 205 variables. Savitzky-Golay (SG) smoothing [30] with a moving window size of 7 smoothing points and a second-order polynomial fit was also used to remove the artificial noise caused by the spectrometer [10]. The smoothed spectra were then subjected to the polynomial First-Derivative (FD) and Second-Derivative (SD) filters.
The raw, Savitzky-Golay First-Derivative (SG-FD) and Savitzky-Golay Second-Derivative (SG-SD) pre-processed spectra were later used for development of the prediction models. A Principal Component Analysis (PCA) transformation was independently applied to each raw and pre-processed spectra using a varimax rotation to detect outliers. Two- and three-dimensional plots were obtained by plotting the score plots of the first three PCs. Data points lying outside the 95% confidence ellipse were considered as the outliers.
2.3. Feature Selection
The important spectral wavelengths were extracted using filter-based PLS regression coefficients () and wrapper-based GA methods. In filter methods, the selected subsets of variables are assessed and scored independently and the n top score features are used as input to the classifier/regressor. Wrapper methods iteratively select variables while being evaluated by a classifier/regressor based on a randomized population. The possible interactions between variables can be detected and taken into concern using wrapper-based feature selection [31,32]. Both feature selection techniques were performed on the calibration (training: 75%) data set.
Correlation analysis was performed between the contents of Cr, clay and Fe-oxides/hydroxides of the samples to determine which soil spectral features have leading roles in the prediction mechanism. Furthermore, the important wavelengths affected by the level of Cr in soil were defined using Pearson correlation coefficients between Cr concentrations of the samples and their absorbance spectra. By this procedure, the most effective spectral variables for estimating Cr concentration were identified.
The PLSR method, sometimes called projection to latent structures, generates a linear model to predict a dependent response variable from a large set of independent variables [33]. -coefficients or Regression Coefficients (RCs) are single measures of association between each variable and the response. They are obtained from the PLSR calibration model and used for selecting the optimal wavelengths. In our study, the top 15 wavelengths corresponding to the highest absolute values of -coefficients (i.e., regardless of sign) were selected as the optimal wavelengths.
GA yielded wavelengths used to select the optimal ANN input variables. It is a general-purpose random search and optimization technique based on Darwinian principle mechanics of natural selection and natural genetics. It is a particular class of Evolutionary Algorithms (EA), which uses mutation, natural selection, and crossover as techniques inspired by evolutionary biology. The following literature can be referred for detailed theory of GA [34,35,36]. GA parameters were set as follows: population size = 100 chromosomes, cross-over ratio = 0.8, cross-over probability = 0.5, mutation rate = 0.01, mutation probability = 0.2 and number of iterations = 1000. Wavelengths selected by PLSR were then used to develop the PLSR, while the GA-selected variables were subsequently used for calibration of the ANN and SMLR prediction models.
2.4. Model Development
The ANN, SMLR and PLSR methods were used in this study to predict Cr concentrations of the soil samples. The implementation of the techniques for spectroscopic modeling has been described in detail in some literature [37,38]. Our previously developed three-layered feed forward ANN was implemented in this study. The Levenberg–Marquardt (LM) training algorithm was used for adjusting weight and bias values of the ANN. Sigmoid (tansig) and linear (purelin) activation functions were implemented for neurons of the hidden and output layers, respectively [10]. The number of neurons in input and hidden layers were optimized to obtain maximum performance.
Before performing the modeling process, data were randomly divided into calibration (training: 75%) and validation (testing: 25%) data sets. Models were then developed using the Leave-One-Out Cross-Validation (LOOCV) on the variables selected from the calibration data set. According to Gomez et al. [39], in LOOCV, all samples participate in model construction except one. The model is then evaluated by the sample that did not participate in modeling and the prediction error is obtained. This process continues until all samples are excluded from the modeling process once and the final error is calculated by averaging the error for each sample. The final evaluation of the developed models was also conducted on validation data set. In this study, random division of samples and development of the prediction models, and the final evaluation of each model were performed in triplicate. The final result was finally determined by averaging. It is noteworthy to mention that all models were developed using log-transformed Cr concentration data. The predicted concentrations were then back transformed to non-logarithmic values to calculate performance evaluation metrics.
2.5. Spatial Distribution Mapping
Geostatistics is based on the theory of regionalized variables and is used to describe the spatial structure of the data [40]. Kriging is the key spatial interpolation and estimation tool used in geostatistics and is continuously being used in soil science, particularly due to its unbiased nature [41]. In this study, the spatial distribution of Cr concentration obtained through chemical analysis and lab spectroscopy (the best prediction model) was mapped as follows:
First, semi-variograms were created to estimate the spatial correlations and the appropriate variogram models. Then, spatial distribution maps of Cr concentration were obtained using an ordinary kriging method. The resulting maps were compared to evaluate the capability of prediction models to determine the spatial distribution of Cr.
2.6. Satellite Image Selection and Pre-Processing
Hyperion, Sentinel-2A, Aster and Landsat 8-OLI images were selected for this study (Table 1). Selecting appropriate images was based on spectral coverage, regional parameters and acquisition conditions such as (i) date and time, (ii) cloud coverage, (iii) the coordinates of the area, (iv) water vapor in the atmosphere and (v) climate.

Table 1.
Satellite image information.
Before processing, standard pre-processing scenarios were applied to each image. Since Aster SWIR sensor stopped functioning in April 2008 due to high SWIR detector temperature [42], VNIR bands of the image was subjected to radiometric calibration using the Internal Average Relative Reflection (IARR) method and then processed to mask the clouds and shadows. For Hyperion, the uncalibrated and overlay bands with low SNR were removed [43]. Atmospheric correction was also implemented using the Fast Line-of-sight Atmospheric Analysis of Hypercubes (FLAASH) algorithm [44]. Sentinel-2A was atmospherically corrected using the SNAP toolbox included the Sen2Cor algorithm [45]. The bilinear interpolation method was then used to resample the image bands to 10 m. Radiance calibration and atmospheric correction using FLAASH algorithm were conducted for Landsat 8-OLI pre-processing. The spectral bands one to seven were down-scaled to 15 m using the Landsat 8-OLI panchromatic band. Geometric rectification of all four images was finally performed using 20 Ground Control Points (GCP).
2.7. Spectral Similarity between Samples and Images Spectra
The degree of similarity between each sample’s spectra and the spectra of the same position pixel was calculated using the Spectral Angle Mapper (SAM) [46]. In this method, spectra are considered as space vectors with dimensions equal to the number of spectral bands (Equation (2)).
where t is the spectra of the image pixel and r is the spectra of the soil sample measured using a spectrometer. Lower values indicate a higher degree of similarity between the two spectra [46].
The one-way ANOVA method tested the statistical similarity between the spectral properties of images and soil samples. According to the null hypothesis in ANOVA, there was no significant difference between the mean values of the selected image features and the lab spectra. In other words, the null hypothesis is that the samples in the two groups are drawn from populations with the same mean values. This hypothesis was tested by calculating the F-value at the significant level of 0.05. In the case of significant correlation, the spectral features of the image were used as independent variables for the prediction model obtained by lab spectroscopy to determine the concentration and spatial distribution of Cr. The resulting maps were compared to the measured Cr distribution maps.
2.8. Image Segmentation
Rasters resulted from the best models were also segmented using a binary fitness function. Accordingly, if the predicted concentration of Cr for a pixel is greater than a threshold value (i.e., the average measured concentration), the desired pixel got the value of one; otherwise, it obtained the zero value. The binary fitness function used to classify image pixel is as Equation (3):
where is the pixel in row i and column j of the image matrix, is the threshold value, and and are the predicted and segmented values for the same pixel, respectively.
2.9. Models Performance Evaluation
The performance of the prediction models in both lab reflectance spectroscopy and satellite imaging spectroscopy was assessed by comparing the predicted values on the validation data set with the observed ones using the metrics; correlation coefficient (R2), Root Mean Square Error (RMSE) and Residual Prediction Deviation (RPD). R2 (Equation (4)) and RMSE (Equation (5)) can be measured considering the difference between observed and predicted values:
where is the predicted value, and is the observed value and N is the number of samples.
In addition to the correlation between the predicted and measured values, the reliability of each model can be better confirmed by checking its RPD [47,48], which is the ratio of standard deviation to RMSE (Equation (6)). According to a five-level criterion, the models with RPD values less than 1.5 are considered unreliable, while ones between 1.5 and 2.0 are appropriate for rough predictions, between 2.0 and 2.5 are fit for quantitative predictions, those between 2.5 and 3.0 are regarded as good models and those greater than 3.0 are assumed as satisfactory models [47,49].
where STD is the Standard Deviation of the validation data set.
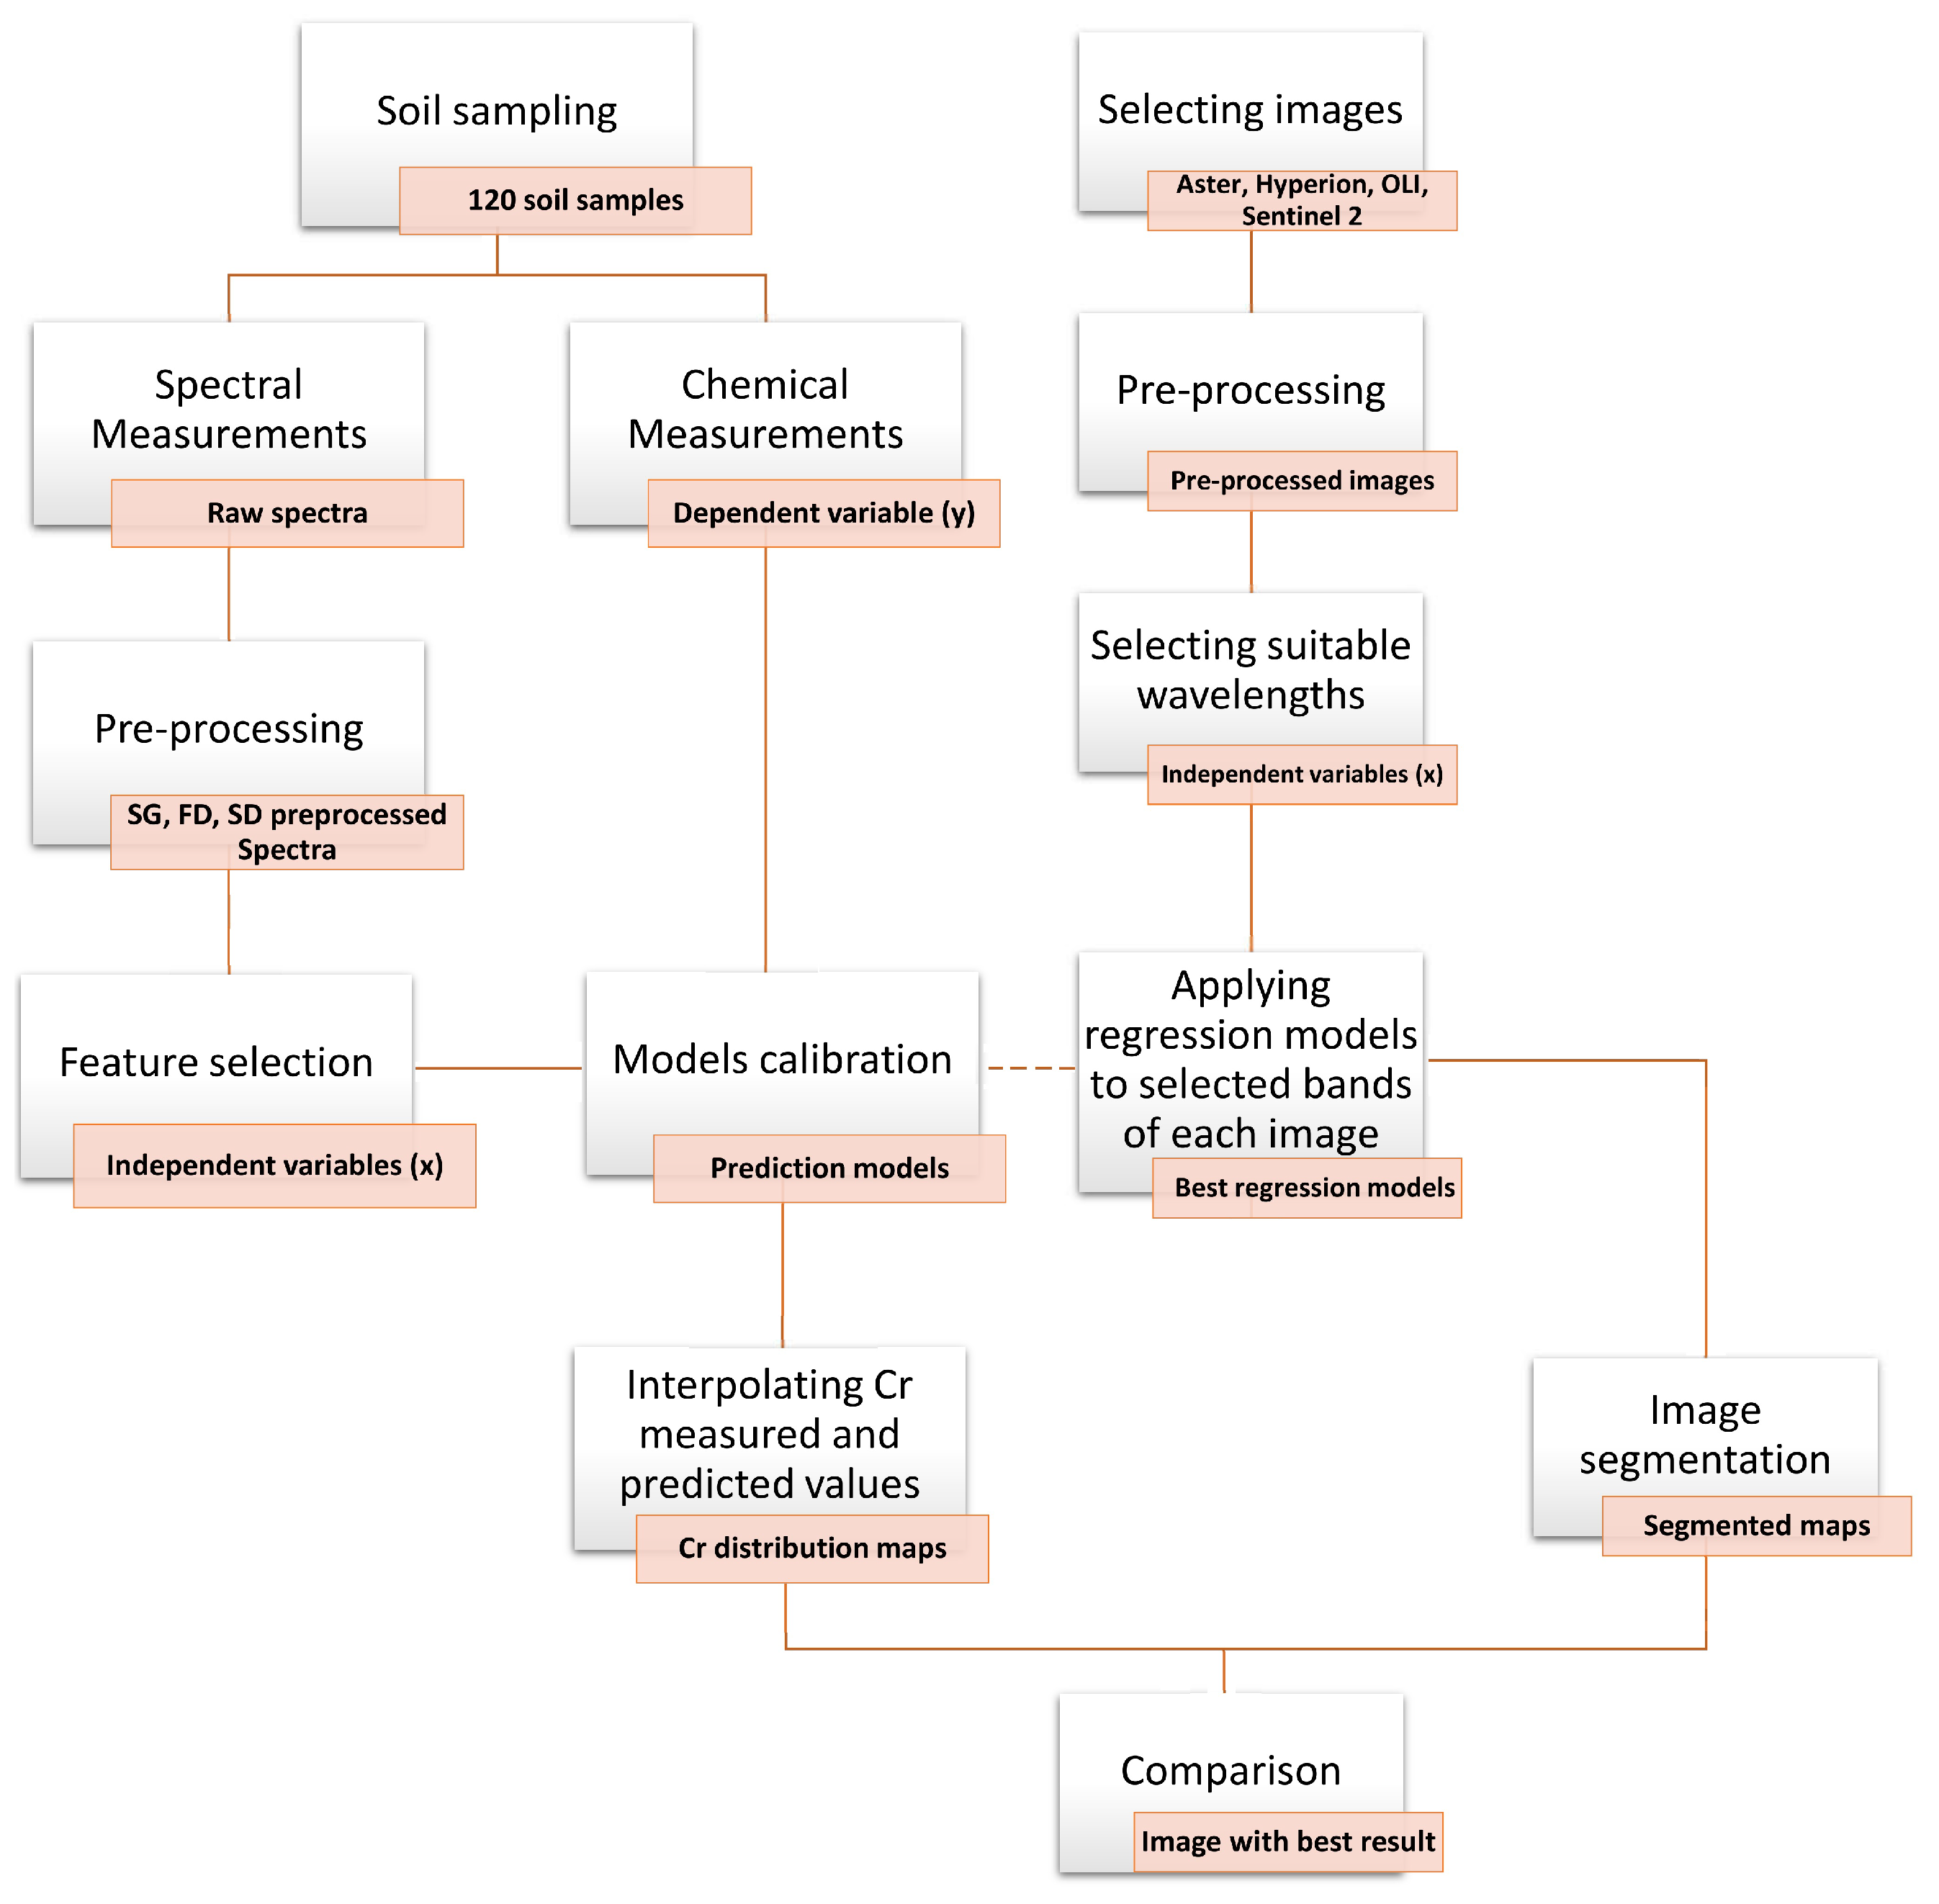
Figure 2 shows a concise description of the procedure used in this study.
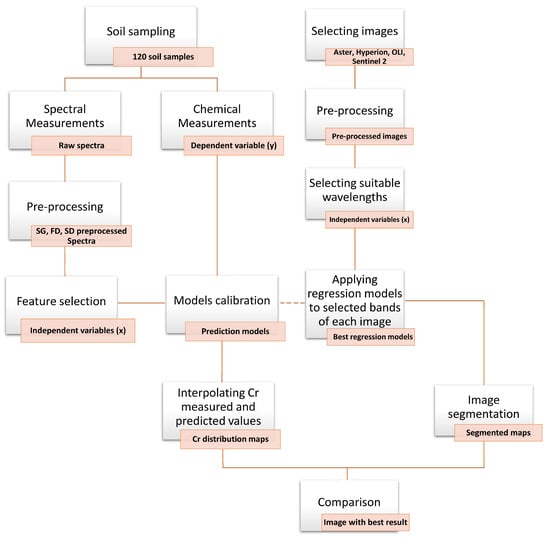
Figure 2.
Flowchart of the procedure applied in this study.
3. Results and Discussion
3.1. Statistics of the Soil Samples
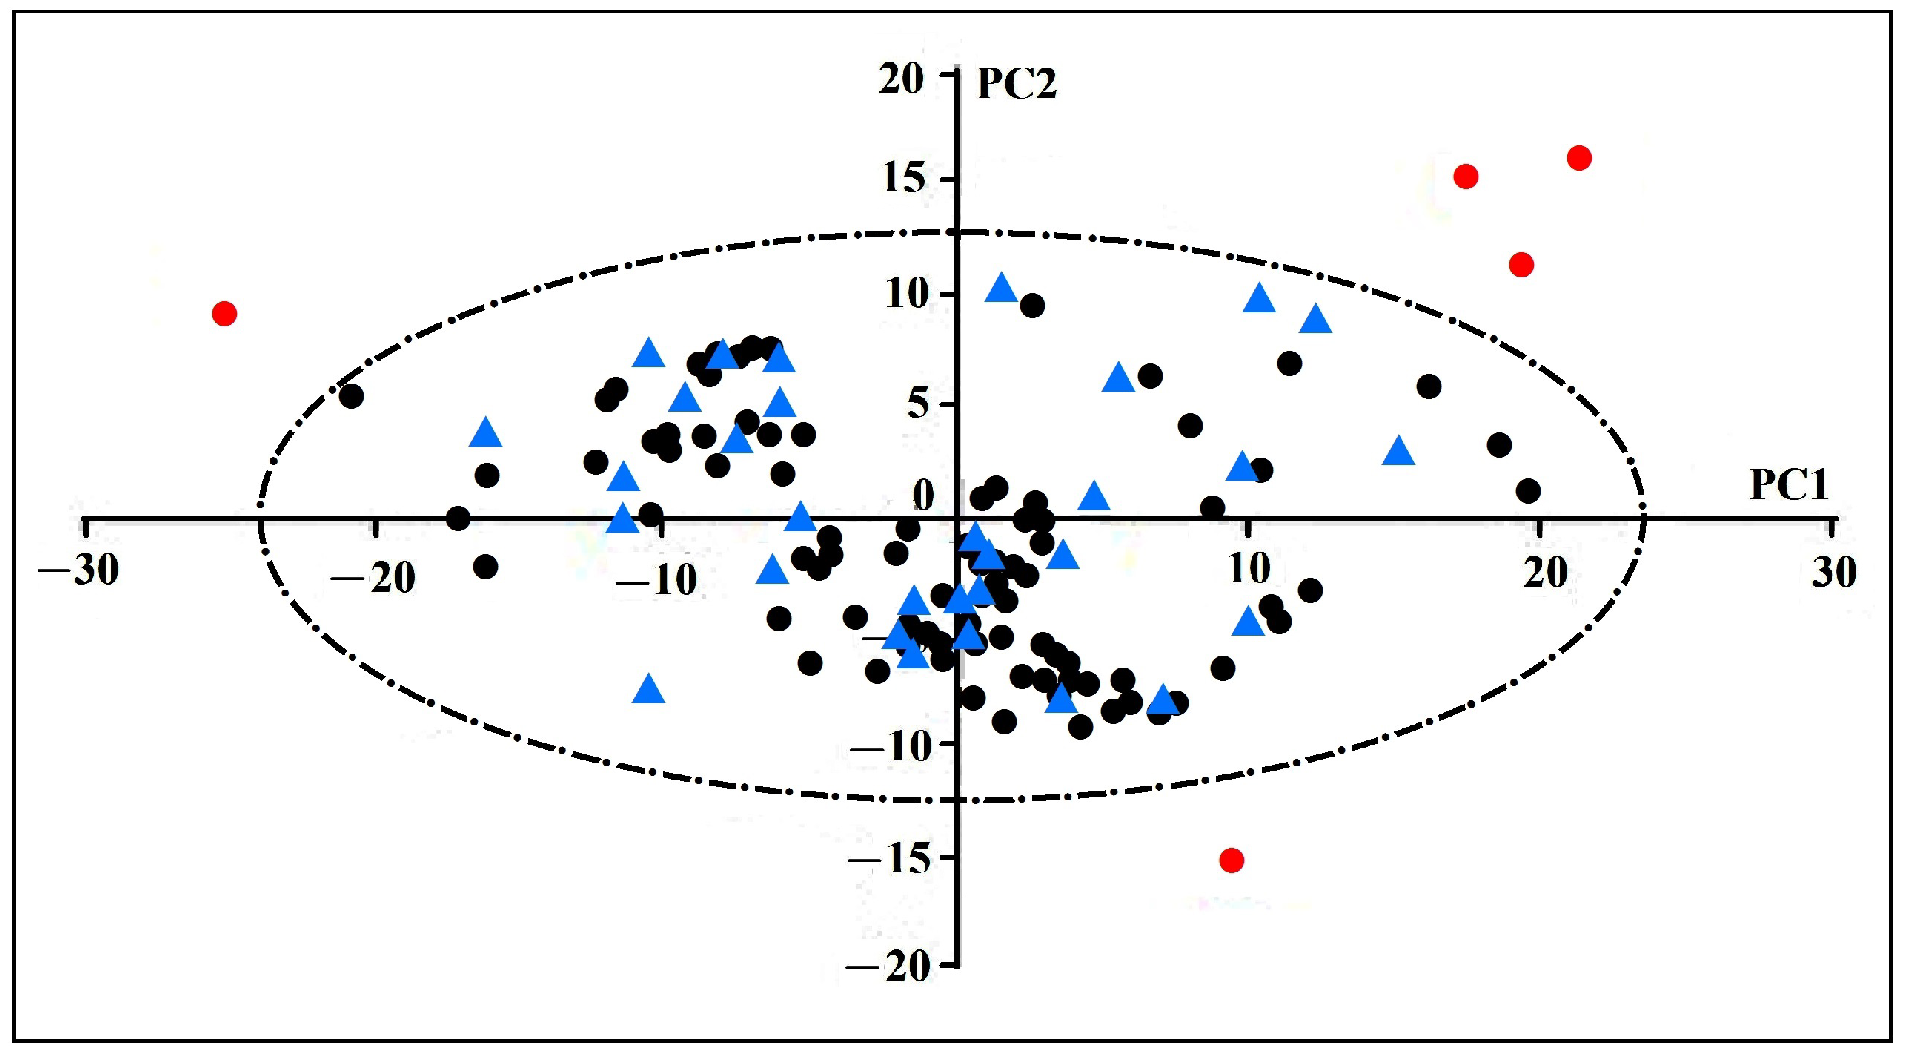
According to the 2D plots obtained from the first two PCs of raw and pre-processed spectral data, five similar samples were outside the 95% confidence level ellipse, which were considered as outliers and excluded from the data set (Figure 3). All further analysis was performed using the remaining 115 samples.
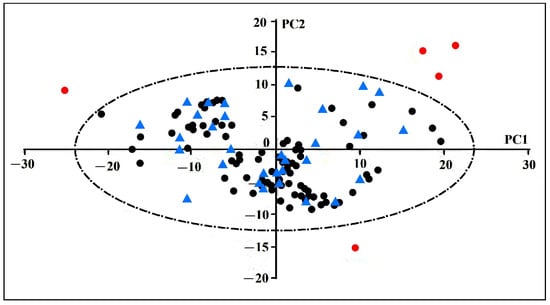
Figure 3.
2D score plot of the first two PCs provided by Principal Component Analysis (PCA) applied on the spectra (calibration set, validation set and outliers are shown as black circles, blue triangles and red circles, respectively).
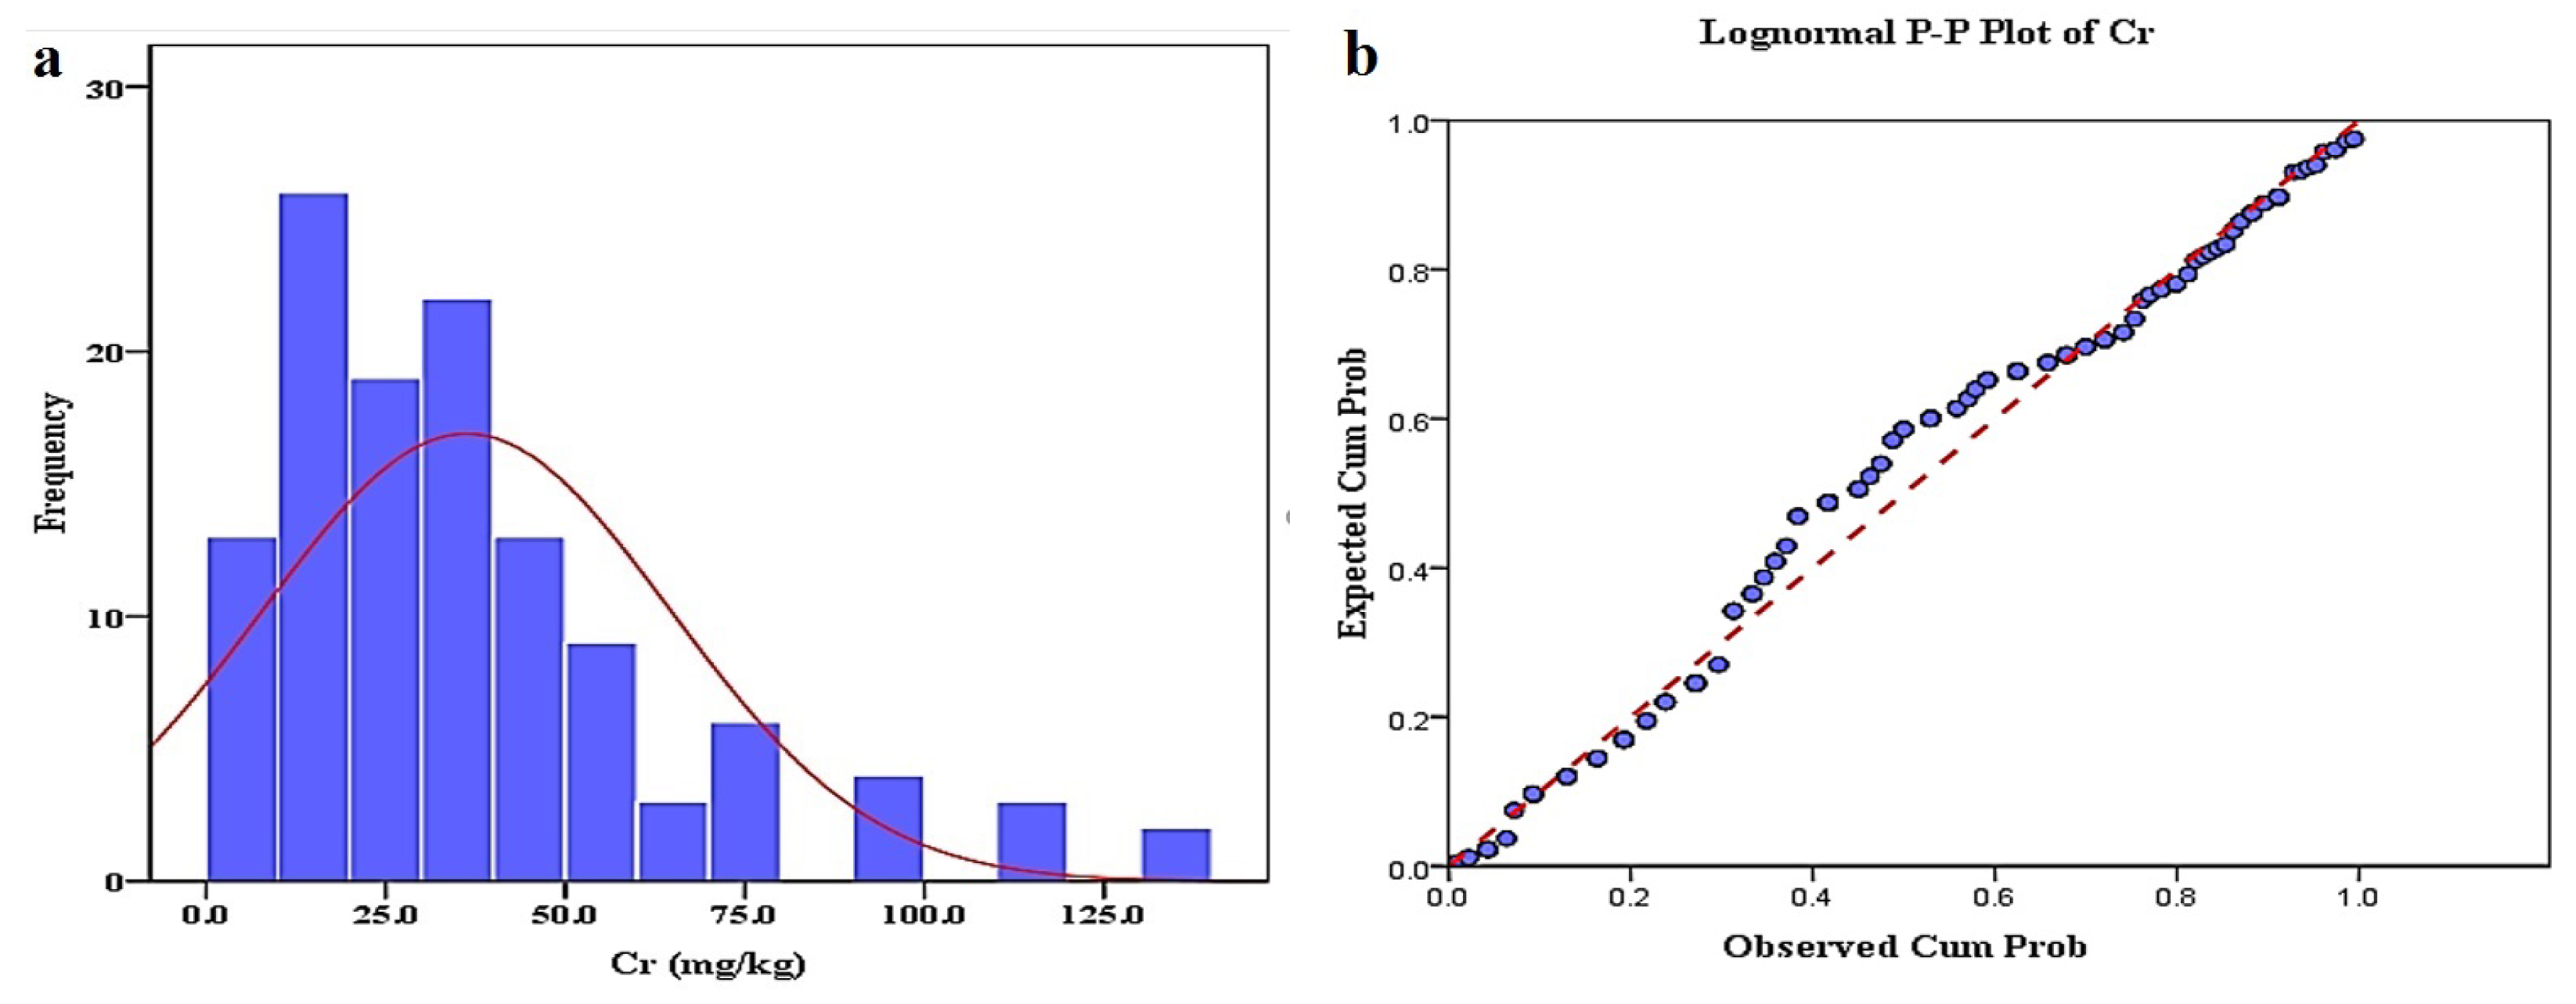
Descriptive statistics of the remaining samples’ Cr concentration, pH, Fe-oxides/hydroxides and clay (as a spectrally active attribute) are presented in Table 2. It can be indicated that the Cr concentration ranged between Minimum (Min) and Maximum (Max) values of 3 and 137 mg/kg, with the mean value of 36.26 mg/kg (Table 2), which is very high considering the World Health Organization (WHO) recommended safe limits of 0.05 and 0.1 mg/kg in wastewater and soils used for agriculture, respectively [50]. Furthermore, Cr concentration of the soil samples showed high Standard Deviation (Std) of 28.10 mg/kg and Coefficient of Variation (CV) of 77%, which shows heterogeneity of Cr in the area mainly attributed to soil gathered from different areas of the mine. It can also be seen that the Cr data had strong positively skewed distribution with the skewness of 1.49. The pH of the samples ranged from 2.1 to 7.7 with a mean value of 5.1, which suggests an acidic condition in the study area. The Fe-oxide/hydroxides ranged between 5.13 and 31.82% with a mean value of 14.53%. The average clay content was 9.12% with Min and Max values of 4.33% and 15.31%, respectively. As can be seen, soil under study contains both Fe-oxide/hydroxides and clay minerals, which can affect spectral properties of the samples.

Table 2.
Descriptive statistics of the soil attributes.
Based on the Kolmogorov–Smirnov statistical test at the 5% significance level, Cr concentration of the samples didn’t meet the requirements of a normal distribution and hence was subjected to logarithm transformation (log10). p-value plot of Cr concentration indicated the log-normal distribution of the data (Figure 4).
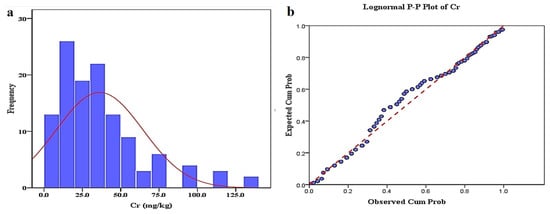
Figure 4.
Histogram (a) and P-P plot (b) of Cr concentration in soil samples.
3.2. Soil Samples Spectral Pattern
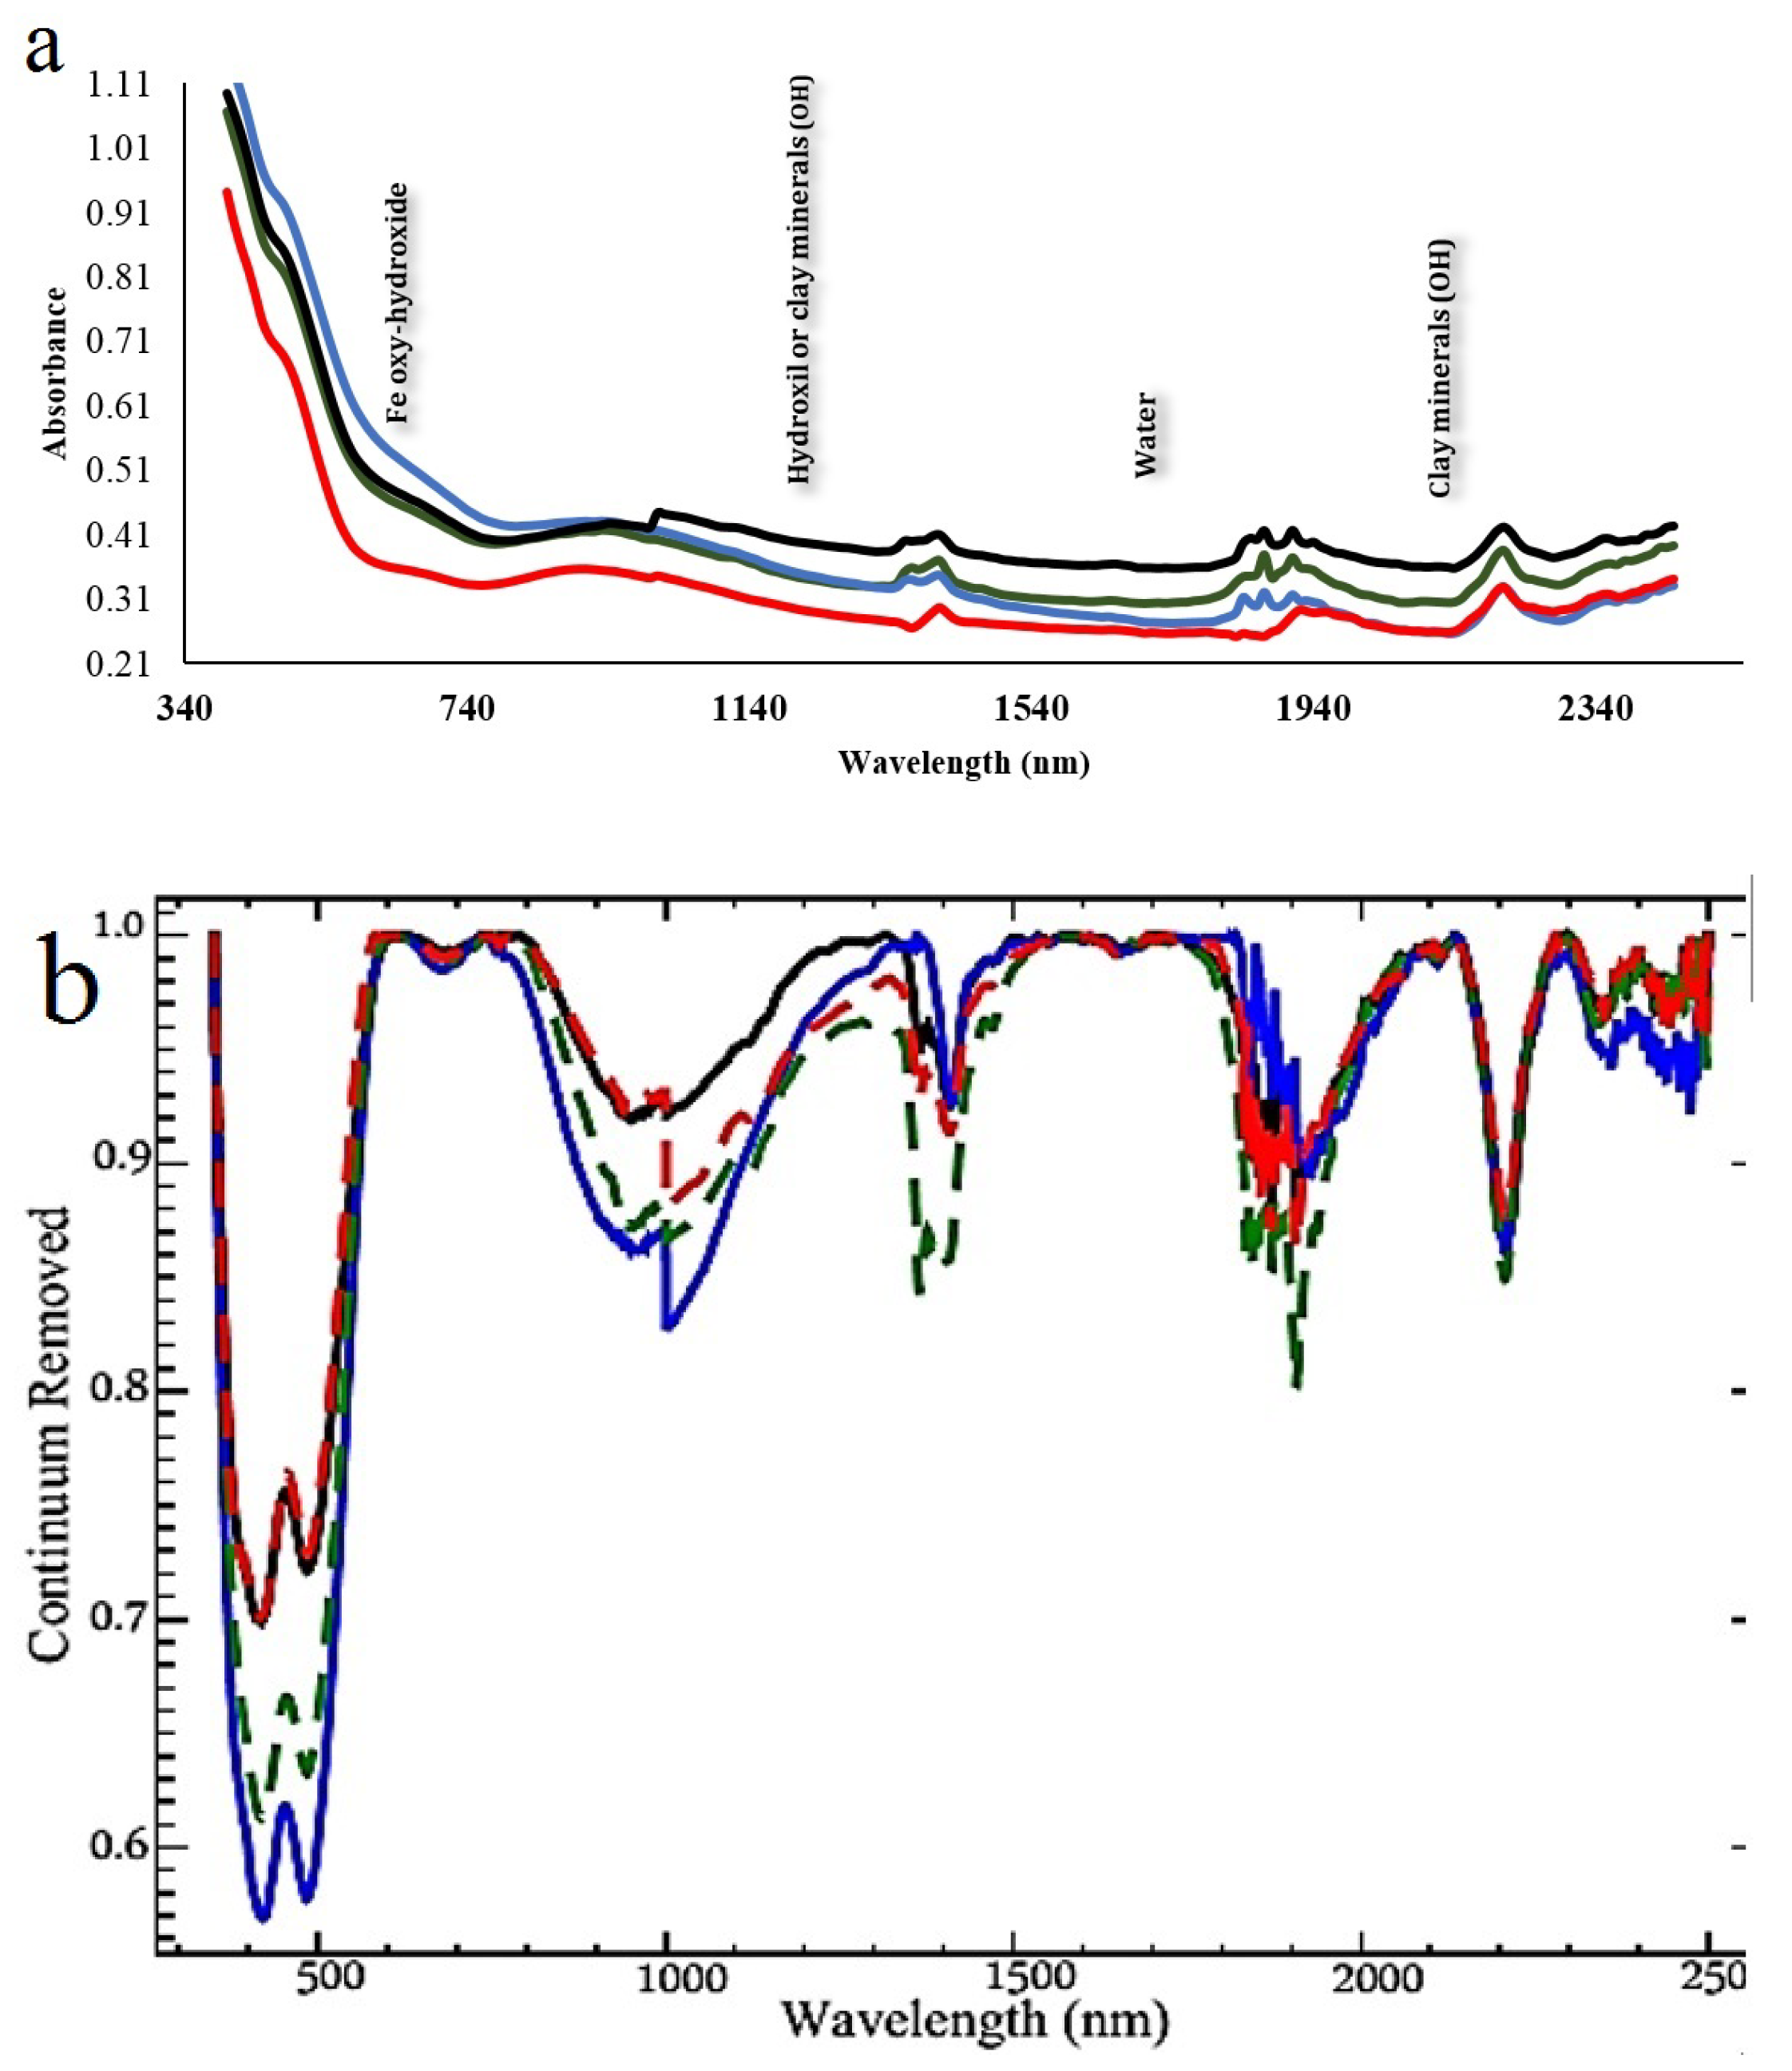
Figure 5 illustrates the raw absorption spectra of four randomly-selected soil samples along with their continuum-removed spectra, which are calculated to highlight the absorption features.
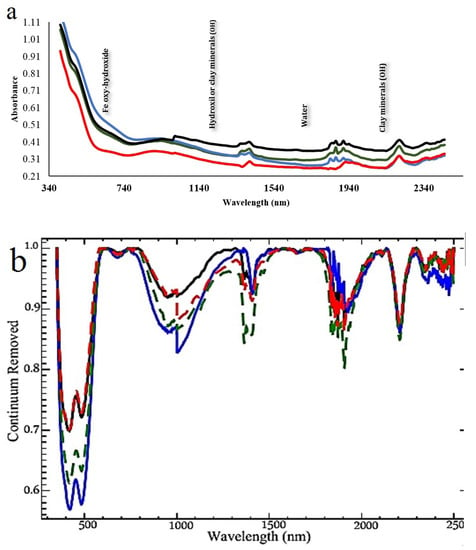
Figure 5.
Raw absorbance (a) and continuum-removed (b) spectra of four randomly-selected soil samples.
Visual inspection of the spectra of the selected samples in Figure 5 shows that the overall forms and patterns of the spectral curves were roughly the same and comparable indicating their relatively similar characteristics. The spectral range of Fe-oxide/hydroxides is obvious in the VNIR region, which is linked to the electron transition of Fe3+ in Fe minerals such as goethite (FeOOH) and hematite (Fe2O3) [13,51]. Moreover, O-H bonds in hydroxyl or clay minerals are responsible for the peaks in the NIR and SWIR regions [52,53,54]. The absorption peak at 1900 nm is also attributed to the O-H binding in water [55].
3.3. Correlation of Cr with Soil Properties and Spectra Wavelength
Table 3 shows the correlation coefficients between Cr concentration with clay and Fe-oxide/hydroxide of the soil samples.

Table 3.
Pearson correlation coefficients of Cr, clay minerals and Fe-oxides/hydroxides in soil (The numbers in bold are significant at the p < 0.01 level).
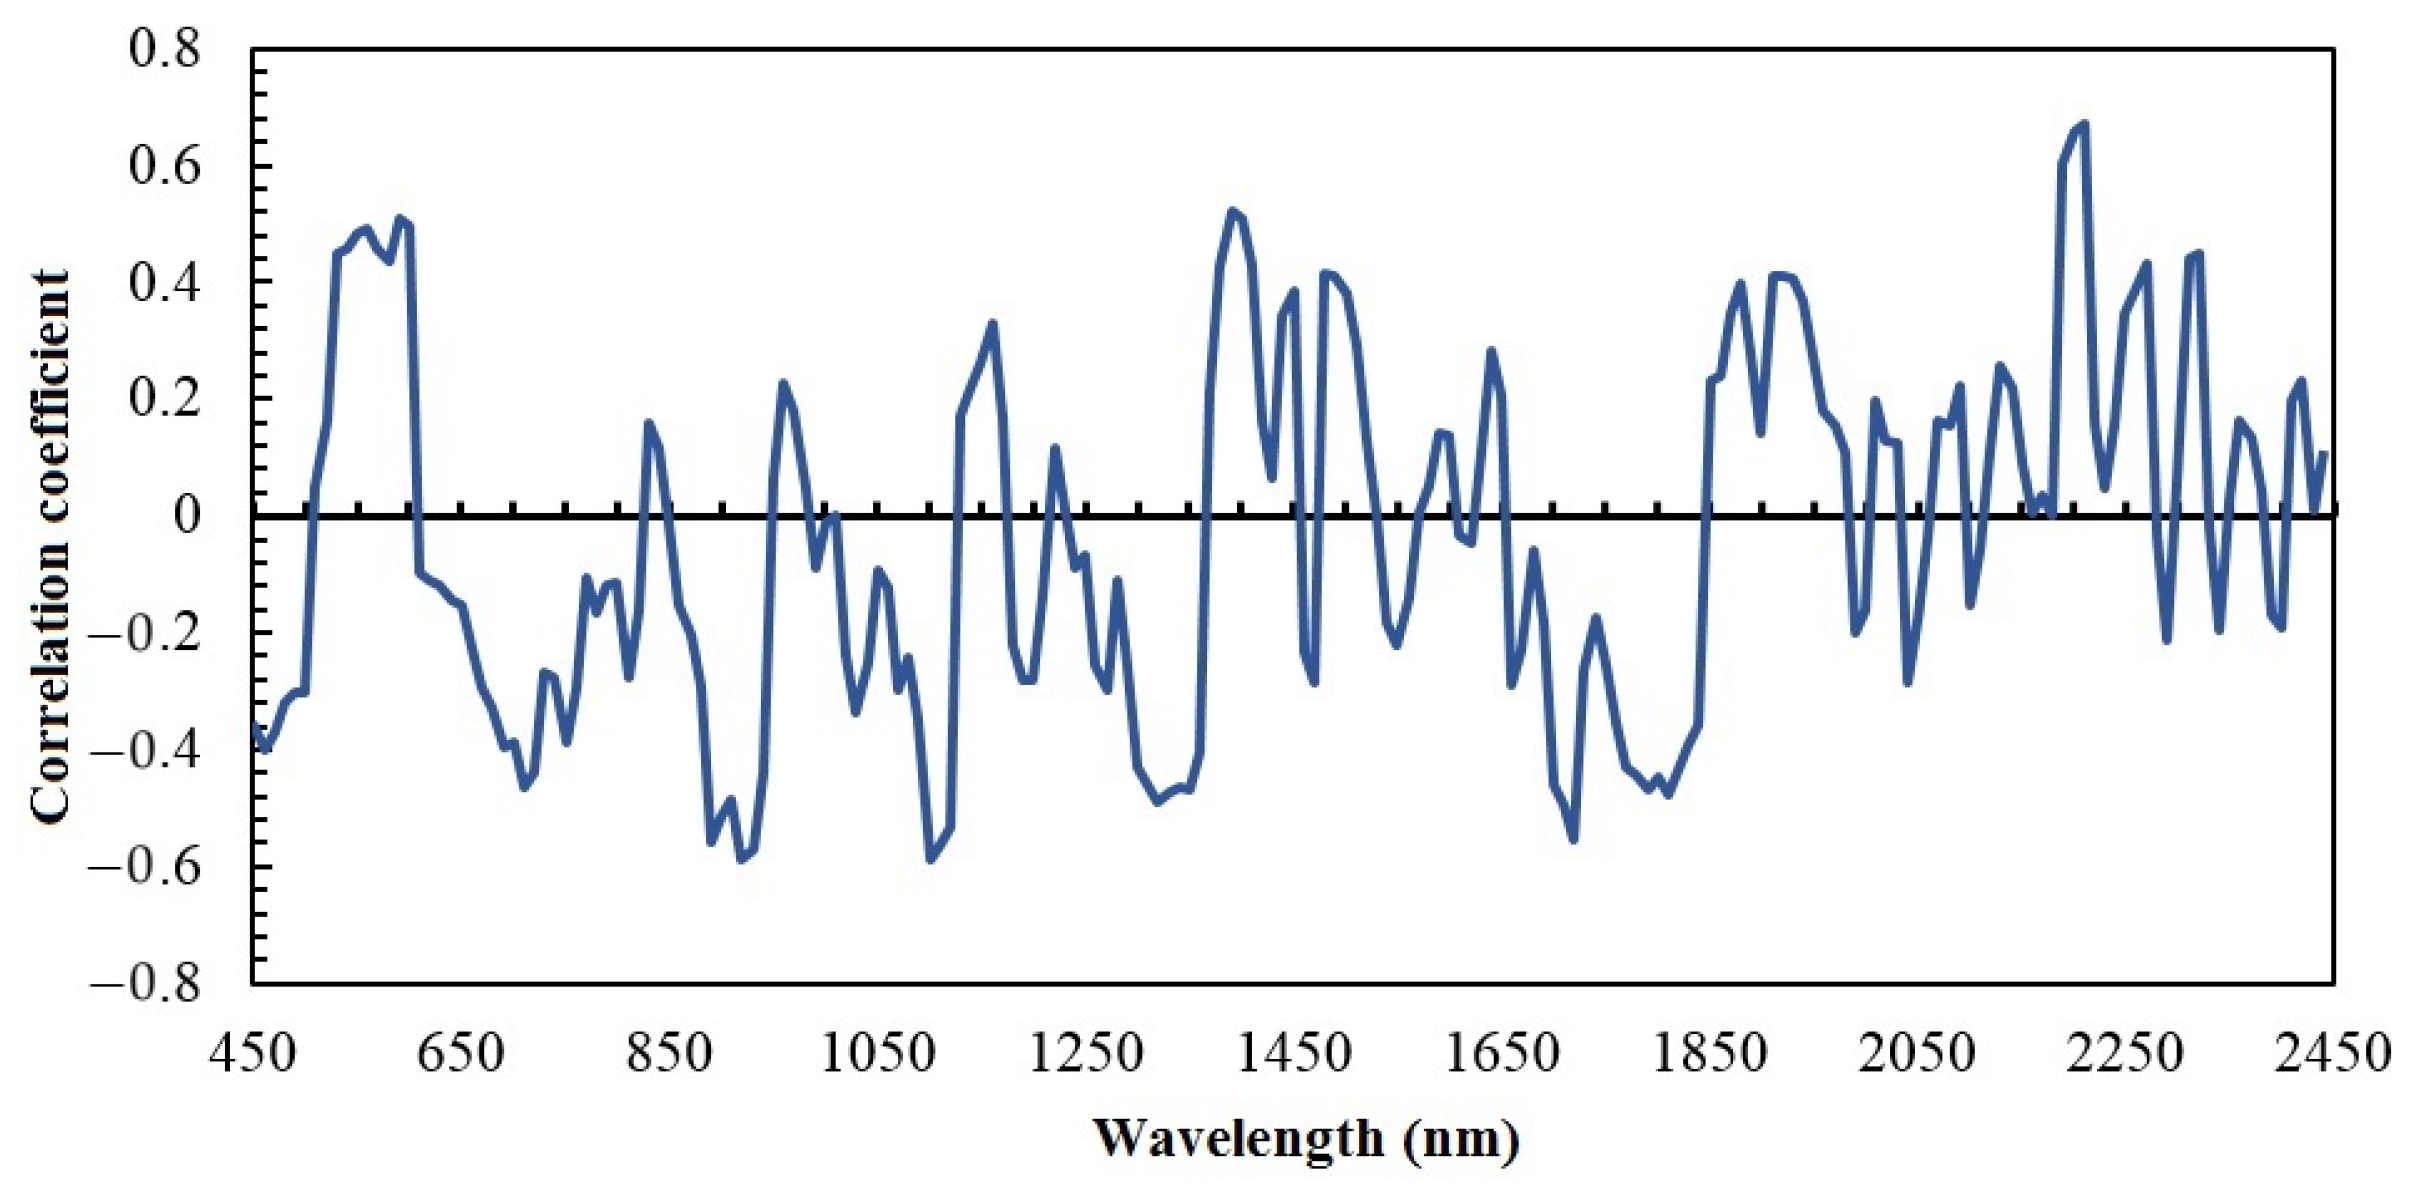
Notably, soil Cr contents exhibited significant positive correlations with both Fe-oxide/hydroxide and clay minerals, which highlight the positive association of Cr with both clay and Fe contents of the soil. However, the correlation between Cr and clay minerals was slightly higher (r = 0.67). These results were further supported by the correlation plot between the soil samples’ FD absorbance spectra and Cr concentration, showing the most effective spectral variables in the prediction mechanism of Cr (Figure 6).
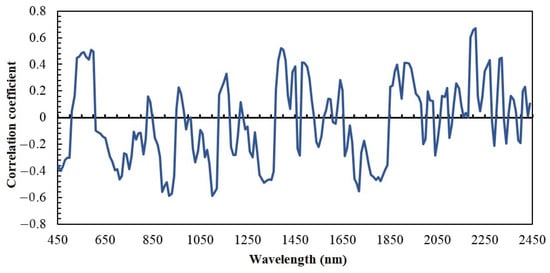
Figure 6.
Correlation between the samples’ FD absorbance spectra and Cr concentration.
According to Figure 6, the key spectral bands for predicting Cr concentration in VNIR range are at about 430, 460, 560, 590 and 930 nm. The wavelengths of 430 and 930 nm correspond to the spectral response of goethite while hematite causes absorption bands at 520, 650 and 880 nm [37,56]. High correlation coefficients in the SWIR region are apparent at about 1400, 1900 and 2200 nm respectively, linked to the spectral response of O-H, molecular water and Al-OH in clay minerals such as kaolinite, illite, muscovite and montmorillonite [57] suggesting an internal relationship between them and Cr as another important prediction mechanism. The higher correlation between Cr and the clay spectral features shows the higher ability of these minerals to absorb Cr compared to Fe-oxide/hydroxides. High affinity of clay minerals and Fe-oxide/hydroxides with Cr has also been noticed in other studies [58,59,60].
3.4. Feature Selection Using GA and PLSR Techniques
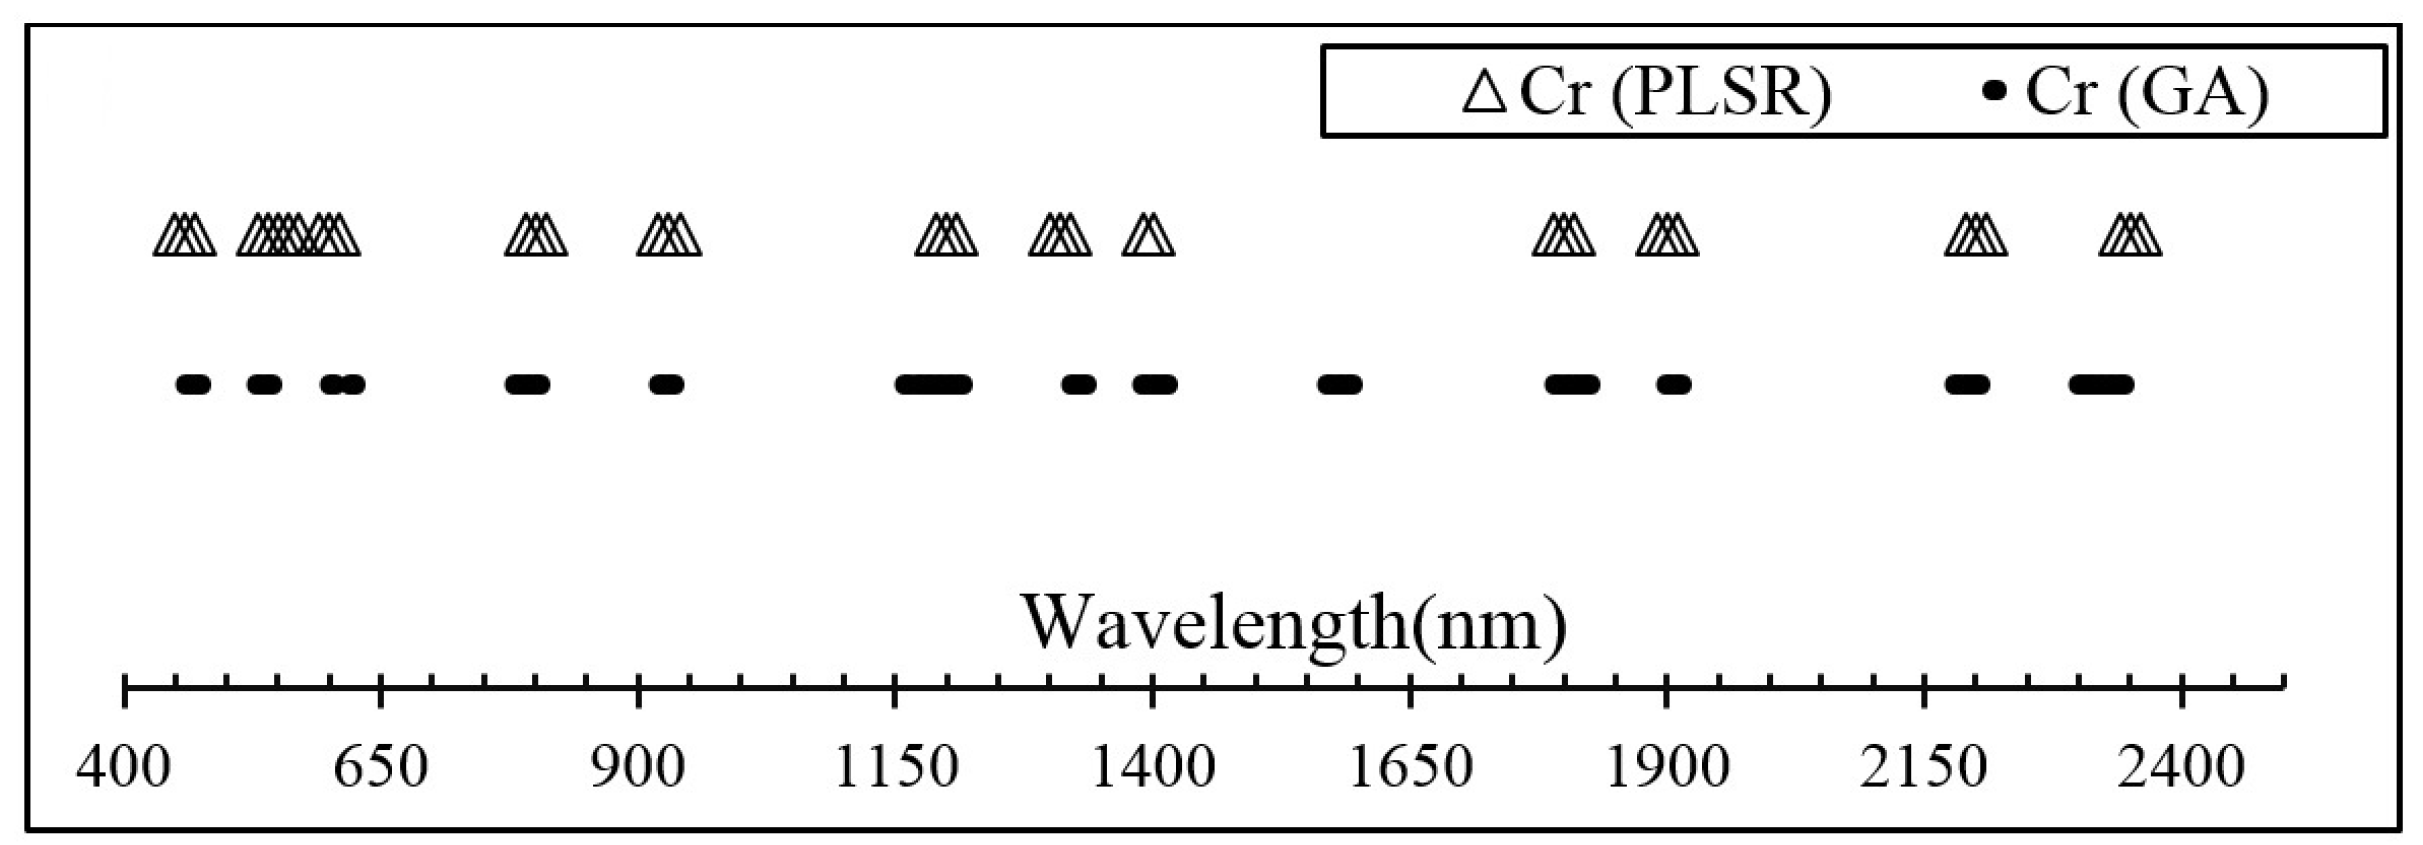
Figure 7 highlights the important wavelengths obtained by applying GA and PLSR on the consecutive 205 wavelengths selected in increments of 10 nm. Spectral wavelength related to Fe-oxide/hydroxides and clay minerals can be observed among the key variables selected using both GA and PLSR techniques. This further indicated the internal relations of Fe-oxides and clay minerals with Cr ions in soil.
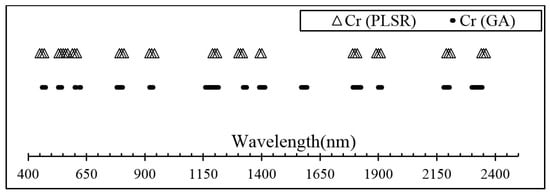
Figure 7.
Important wavelengths selected by GA and PLSR methods.
3.5. Prediction Results of Cr Using Laboratory Spectra
The summary of Cr concentration prediction results using the laboratory Raw Spectra (RS), FD and SD spectra are tabulated in Table 4.

Table 4.
Prediction results of Cr concentration using lab spectra and different data mining methods (validation data set).
Based on Table 4, SD of the absorbance spectra provided better results compared to RS and FD, regardless of the applied data mining technique. Although high noise sensitivity of the derivative transformations [61], the SD technique’s superiority can be due to its ability to remove both baseline drift and linear trend, separate overlapping absorption bands and increase apparent spectral resolution [62].
Considering different data mining algorithms for developing the Cr prediction models, an optimized ANN structure of 18-14-1, obtained after 400 iterations, had the highest performance in the SD spectra (R2 = 0.91, RMSE = 8.73 mg/kg and RPD = 2.76). The poorest performance was derived using PLSR on the RS (R2 = 0.35, RMSE = 22.85 mg/kg and RPD = 1.23). The superiority of ANN can be attributed to the internal nonlinear relationship between Cr and the active spectral components of the soil and the inherent ability of ANN to deal with these nonlinear conditions and complex relationships [63]. Various types of ANNs have also been successful in prediction of As [64], Pb [3], Zn [10,65] and Cd [65,66].
ANN was followed by the SMLR model. SD-SMLR showed the best performance after SD-ANN with R2 = 0.78, RMSE = 12.27 mg/kg and RPD = 2.29 clearly indicated a fit model for quantitative prediction of Cr. FD-SMLR and RS-SMLR with RPD values of 1.88 and 1.26 were appropriate for rough prediction and unreliable models, respectively.
Regarding PLSR and based on the lowest RMSE and the optimal number of hidden factors, each factor was added to the model in case of decreasing RMSE by 2% or more. Among the PLSR models tested, the SD-PLSR had the minimum number of hidden factors (4) with the minimum RMSE (12.95 mg/kg). RS-PLSR and FD-PLSR had 7 and 5 hidden factors in their least RMSE values, respectively. According to the five-level criterion, RPD of the SD-PLSR model was 2.17, which shows a very good quantitative prediction. On the other hand, FD-PLSR and RS-PLSR models were appropriate for rough prediction and unreliable models, with RPD values of 1.82 and 1.23, respectively.
In a study conducted by Song et al. [59], to estimate Cr concentration in a river delta in China by univariate regression method, the R2 value of 0.58 was obtained. R2 values obtained in the study of Cr concentration prediction by PLSR method were generally in the range of 0.2 < R2 < 0.89 [19,58,59,60,67,68]. Models calibrated in this study can be seen, compared to similar publications, provided relatively acceptable Cr predictions. Moreover, in all literature mentioned above, models built on pre-processed spectra showed better performance than those calibrated on raw spectra, which is comparable to the outcome of this study.
3.6. Spatial Distribution Maps
The Cr logarithmic values of soil samples were transformed back to their original values. The resulting semi-variogram parameters (Table 5) show that the spherical models fitted both predicted and measured concentrations. However, a weak spatial dependence was obtained due to Nugget/Sill values of 0.86 and 0.9 for Cr measured and predicted concentrations, respectively. The measured values higher compatibility to experimental semi-variogram and lower RMSE, resulted in a better spatial distribution pattern of soil Cr contamination.

Table 5.
Parameters of an ordinary kriging semi-variogram model for Cr concentration.
Ordinary kriging and semi-variograms of measured and SD-ANN predicted values were used to provide two spatial distribution maps of Cr concentration (Figure 8).

Figure 8.
Spatial distribution maps of Cr measured (a) and predicted by an SD-ANN method (b).
A similar spatial trend can be observed between two maps, although there were slight differences in the Cr intensity of very high and low risk areas. Highly polluted areas located in central and western parts of the waste dump need significant remediation plans. Conversely, very low concentrations of Cr were detected in northwest and south of the study area (Figure 8). This implies the heterogeneity and complexity of the dump surface in terms of Cr content of topsoil. The combination of VNIR-SWIR spectroscopy and geostatistics successfully mapped Cr spatial distribution of soil and delivered important information for further remediation and contamination restoration planning. This was in agreement with our previous works [10,11] where spatial variability maps of soil Cu, Pb and Zn were rapidly produced using VNIR-SWIR spectroscopy in combination with the kriging interpolation technique.
3.7. Degree of Spectral Similarity
To evaluate the feasibility of applying the best prediction models obtained in the previous section on selected bands of the image’s pixels, the degree of similarity between samples measured spectra and corresponding co-located pixels spectra was determined. The mean SAM values obtained showed different degrees of similarity between the spectra of different images and samples laboratory spectra (Table 6). As expected, SAM values between the samples’ spectra and Sentinel-2A and Landsat 8-OLI were significantly lower in the VNIR region comparing to the SWIR, which is mainly due to better spectral resolution of these images in VNIR. On the other hand, Hyperion showed more similarity to the samples’ spectral response in the SWIR region. This can be explained by the better SNR of Hyperion in SWIR. These results supported the idea that the prediction models can be applied to all desired images (except Aster in the SWIR region).

Table 6.
Spectral similarity of soil samples and images spectra calculated by the SAM method.
The statistical difference-one-way ANOVA-between the mean reflectance values of the selected bands of the samples’ spectra and same location image pixels are shown in Table A1.
The null hypothesis was tested by calculating the F-value at the significance level of 0.05. There would be no significant difference between the image spectral parameters’ mean values and the laboratory spectra in the case of approving. According to the results, at 460 nm, the p-values for Hyperion and Sentinel-2A were greater than 0.05 and the F-value was less than the critical F indicating no significant difference between average spectral reflectance of the band in two data sets. The statistical similarity was also found between samples’ spectra and Aster and Sentinel-2A at 560 nm. In summary, statistical similarity was found between the samples’ spectra and three (Aster), eleven (Hyperion), eight (Sentinel-2A) and six (Landsat 8-OLI) wavebands. Wavelengths that show no significant difference between two data sets and confirmed the null hypothesis were used in the prediction models applied to the images.
3.8. Prediction Results of Cr Using Satellite Images
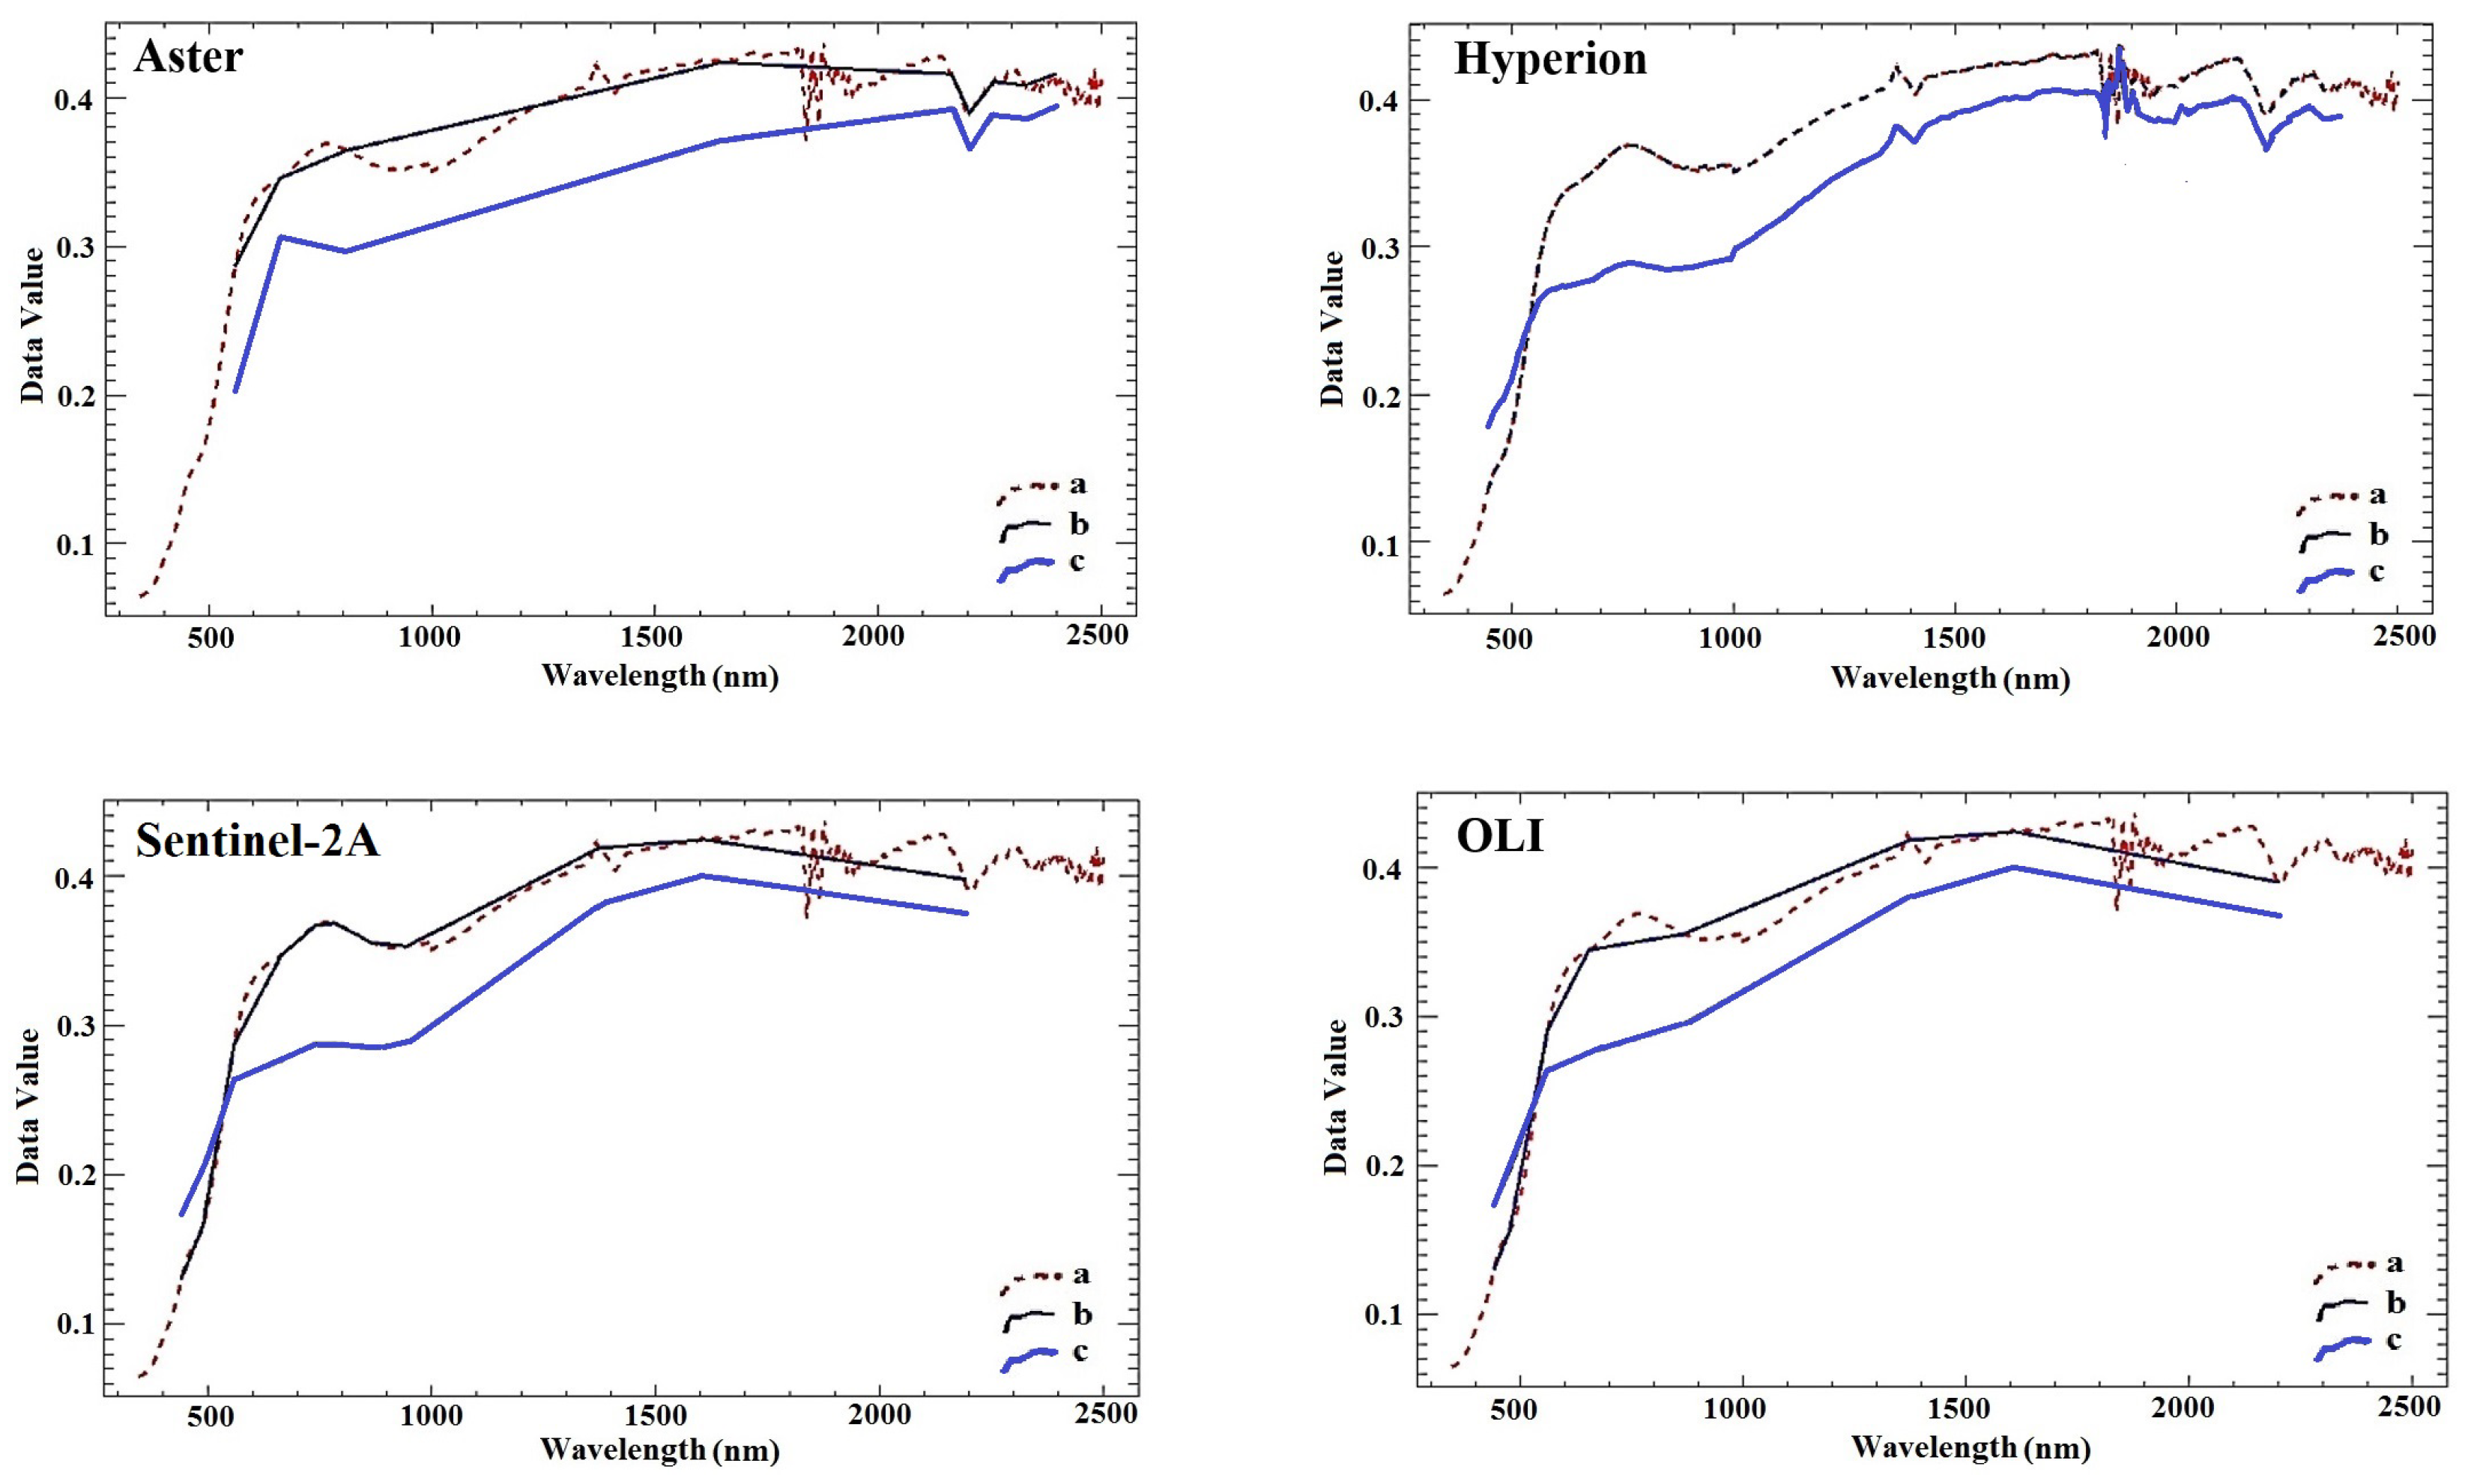
Figure 9 shows the laboratory spectra of one of the randomly selected samples resampled to 9, 191, 13 and 8 bands of Aster, Hyperion, Sentinel-2A and Landsat 8-OLI images, respectively, and the pixels’ spectra with the same location to that sample.
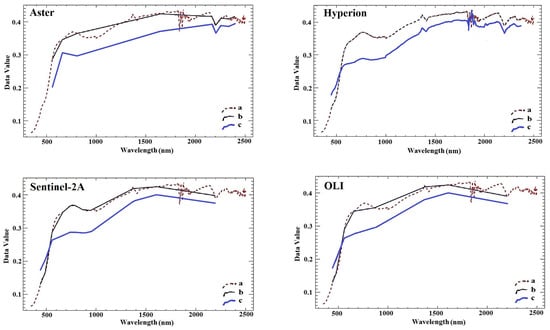
Figure 9.
Full laboratory spectra of a randomly selected sample (a), sample’s spectra resampled to image bands (b) and the pixel’s spectra with the same location to the sample (c).
Considering the results obtained from lab spectroscopy (Table 4), SD-ANN, SD-SMLR and SD-PLSR prediction models were applied to the selected bands of the satellite images’ spectra to predict the concentration of Cr (Table 7). Due to limited spectral wavebands, it was not possible to use all independent variables for multispectral images.

Table 7.
Prediction results of Cr concentration using satellite images.
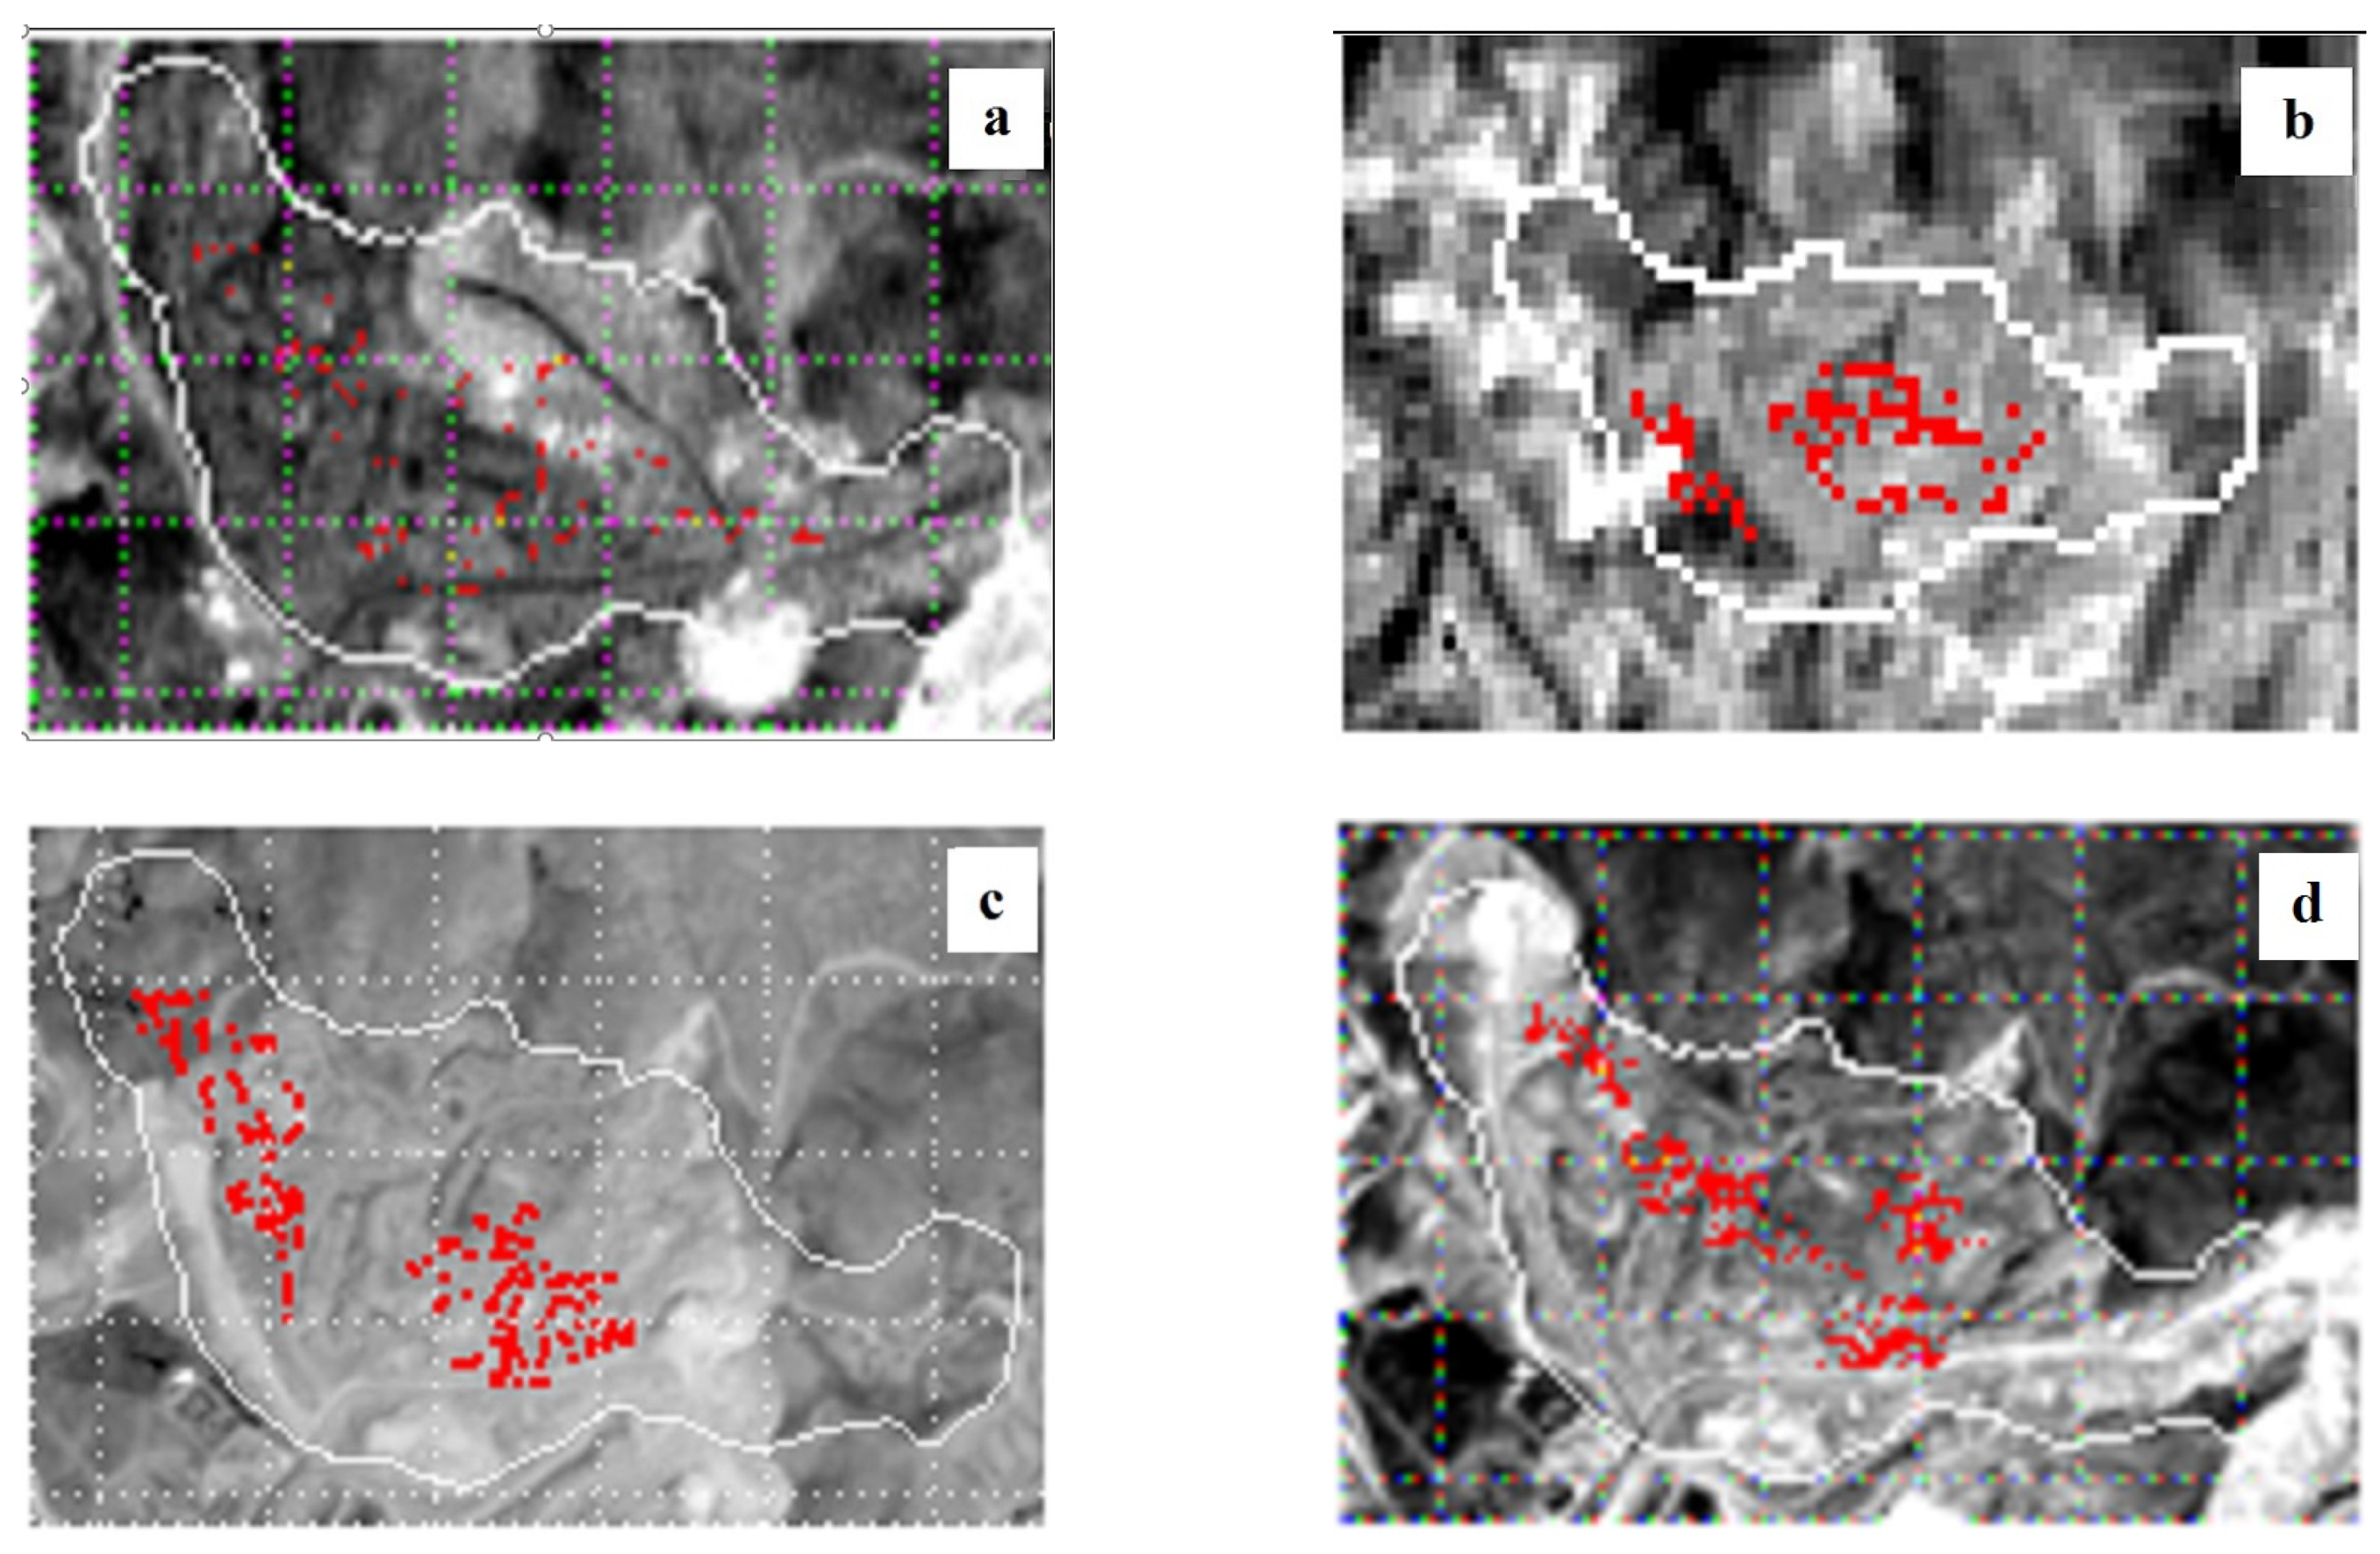
Table 7 highlights that the results obtained from multispectral images (Aster, Sentinel-2A and Landsat 8-OLI) were not as acceptable as the Hyperion results. Moreover, it can be seen that SMLR provided the highest R2 values for all satellites (0.68, 0.53, 0.45 and 0.31 for Hyperion, Sentinel-2A, Landsat 8-OLI and Aster, respectively). Therefore, image segmentation was performed on rasters obtained by the SMLR approach (Figure 10) and were compared to the measured Cr distribution map in Figure 8a. Accordingly, segmented Hyperion raster showed the highest similarity to the Cr distribution map, which could be explained by the continuous coverage of the VNIR–SWIR region. The other reason is that Hyperion had the most significant number of similar waveband with the samples’ spectra (11 wavebands) compared to other sensors. The superiority of Hyperion followed by Sentinel-2A, which showed an acceptable similarity with the Cr distribution map. This can be attributed to its relatively high spatial resolution in both VNIR and SWIR regions.
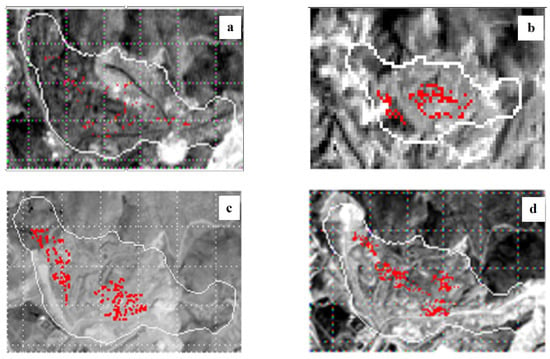
Figure 10.
Segmented Aster (a), Hyperion (b), Sentinel-2A (c) and Landsat 8-OLI (d) images (the red dots are the pixels got the value of one after image segmentation using binary fit function).
The results of applying the SMLR prediction model to Aster and Landsat 8-OLI pixels’ spectra are also shown in Figure 10. It can be seen that the resulting rasters did not indicate sufficient similarity to the Cr concentration map (Figure 8a), which is not far-fetched due to lack of SWIR bands in Aster and low spatial resolution of both sensors (Aster and Landsat 8-OLI). Nevertheless, some similar trends were observed between the Landsat 8-OLI segmented image and distribution map of Cr (Figure 8a), which can be attributed to the higher spectral resolution of Landsat 8-OLI in the VNIR range and the medium inter-relations of Cr with this spectral region. In addition to spectral and spatial resolutions of the images, it should be noted that the level of Cr affinity with Fe-Oxide/hydroxide and clay minerals is another important factor affecting the prediction performance of prediction models, which is in agreement with results obtained by several authors [12,58,60,69].
This study revealed that the satellite imagery from Hyperion and Sentinel-2A combined with SD-SMLR were superior approaches for monitoring and mapping Cr polluted soils of Sarcheshmeh mining area in Iran in a cost-effective and environmentally-friendly way. The technique permits the creation of massive soil data, which can facilitate soil contamination monitoring and mapping. Future studies need to focus on developing new prediction models using geometric characteristics of the soil spectra (e.g., depth, symmetry, area, etc.). Moreover, in future, employing spectroradiometers in field condition and comparing their performance with satellite images should also be considered. Basic research is also needed on how toxic elements affect soil spectral properties by increasing the number of samples and using higher spectral resolution spectrometers and advanced spectral enhancement methods such as wavelet analysis. Other regression and feature selection techniques can also be evaluated based on efficiency in predicting the concentration of different toxic elements. Available, newly-developed and forthcoming hyper/multispectral aerial and satellite images with high spectral and spatial resolutions (e.g., HyMap, EnMAP, Prisma, Worldview, etc.) can be used for more reliable prediction of toxic elements concentration. Finally, satellite data fusion can be considered to obtain proper images with higher spatial/spectral/temporal resolutions.
4. Conclusions
The purpose of this study was predicting and mapping Cr in the Sarcheshmeh mine (the largest mine in Iran and one of the largest porphyry copper mines in the world) investigating the capability of lab reflectance spectroscopy and satellite imaging. The following are the most important conclusions:
- 1.
- Cr content was successfully monitored and mapped through applying models derived from lab spectroscopy to the Hyperion and Sentinel-2A images pixels’ spectra.
- 2.
- The second-derivative was the best pre-processing method among the others used in this study. None of the models built on the raw spectra had an acceptable prediction accuracy.
- 3.
- Based on the lab spectroscopy, the best prediction model and the most similar distribution map to the map constructed on measured Cr were obtained using the ANN method.
- 4.
- The wavelength 650 nm with significant similarity between the samples’ spectra and four images and the wavelength 2200 nm with significant similarity with three images were identified as the most effective wavebands.
- 5.
- SMLR model obtained from lab spectroscopy and applied to satellite image pixels showed superior performance, providing a prediction map with comparable similarity to the measured Cr distribution map.
Using the outcomes of this study, surface reflectance derived from remote sensing data coupled with feature selection and machine learning algorithms, pollution control establishments can quickly survey soil pollution.
Author Contributions
Conceptualization, V.K., F.D.A., A.G. and M.S.; methodology, M.S., A.G., and V.K.; software, V.K. and M.S.; validation, A.G., M.S. and F.D.A.; formal analysis, V.K., A.G. and M.S.; investigation, V.K.; resources, A.G. and M.S.; data curation, V.K. and F.D.A.; writing—original draft preparation, V.K., A.G. and M.S.; writing—review and editing, A.G. and M.S.; visualization, V.K., M.S. and A.G.; supervision, F.D.A.; project administration, A.G. and M.S.; funding acquisition, A.G. All authors have read and agreed to the published version of the manuscript.
Funding
The corresponding author (A.G.) likes to thank the financial support of the Czech Science Foundation (project No. 18-28126Y) and USDA NIFA (award No. 2020-67021-32467).
Data Availability Statement
Publicly available data sets were analyzed in this study. Sentinel-2 data can be found here: https://scihub.copernicus.eu/ (accessed on 6 February 2021). Hyperin, Landsat-8 and Aster data can be found here: https://earthexplorer.usgs.gov/ (accessed on 6 February 2021). Field data and resulting data sets presented in this study are available on request from the corresponding author.
Conflicts of Interest
The authors declare no conflict of interest.
Appendix A

Table A1.
One-way ANOVA test results between selected bands of samples’ and image pixels’ spectra.
Table A1.
One-way ANOVA test results between selected bands of samples’ and image pixels’ spectra.
| Spectral Parameter | ANOVA | Aster | Hyperion | Sentinel-2A | Landsat 8-OLI |
|---|---|---|---|---|---|
| p-value | - | 0.424 | - | 0.003 | |
| 430 | F | - | 3.127 | - | 9.01 |
| F-critical | - | 6.381 | - | 6.043 | |
| p-value | - | 0.491 | 0.067 | 0.000 | |
| 460 | F | - | 3.342 | 4.105 | 10.432 |
| F-critical | - | 7.402 | 8.098 | 7.519 | |
| p-value | - | 0.04 | 0.411 | 0.289 | |
| 500 | F | - | 5.121 | 3.361 | 3.144 |
| F-critical | - | 6.821 | 6.230 | 5.509 | |
| p-value | 0.481 | 0.017 | - | 0.077 | |
| 530 | F | 2.217 | 4.442 | - | 2.653 |
| F-critical | 4.112 | 8.172 | - | 4.118 | |
| p-value | 0.539 | 0.022 | 0.103 | 0.006 | |
| 560 | F | 2.627 | 8.193 | 0.873 | 12.497 |
| F-critical | 5.602 | 7.213 | 7.918 | 7.483 | |
| p-value | 0.005 | 0.035 | - | 0.481 | |
| 590 | F | 13.347 | 12.238 | - | 3.209 |
| F-critical | 6.073 | 7.452 | - | 7.163 | |
| p-value | 0.067 | 0.099 | 0.105 | 0.111 | |
| 650 | F | 3.402 | 2.216 | 6.352 | 5.817 |
| F-critical | 4.591 | 5.229 | 9.128 | 8.641 | |
| p-value | - | - | 0.953 | 0.304 | |
| 880 | F | - | - | 3.056 | 1.667 |
| F-critical | - | - | 7.168 | 8.531 | |
| p-value | - | 0.327 | - | - | |
| 930 | F | - | 5.218 | - | - |
| F-critical | - | 7.458 | - | - | |
| p-value | - | 0.701 | - | - | |
| 1290 | F | - | 1.208 | - | - |
| F-critical | - | 7.394 | - | - | |
| p-value | - | 0.351 | - | - | |
| 1400 | F | - | 6.610 | - | - |
| F-critical | - | 8.642 | - | - | |
| p-value | - | 0.219 | - | - | |
| 1410 | F | - | 5.831 | - | - |
| F-critical | - | 7.452 | - | - | |
| p-value | - | 0.003 | - | - | |
| 1720 | F | - | 6.002 | - | - |
| F-critical | - | 5.461 | - | - | |
| p-value | - | 0.431 | - | - | |
| 1810 | F | - | 4.042 | - | - |
| F-critical | - | 6.412 | - | - | |
| p-value | - | 0.082 | 0.078 | 0.006 | |
| 2160 | F | - | 6.116 | 8.853 | 11.938 |
| F-critical | - | 7.298 | 18.176 | 7.309 | |
| p-value | - | 0.083 | 0.247 | 0.633 | |
| 2200 | F | - | 5.461 | 7.762 | 2.381 |
| F-critical | - | 7.316 | 10.148 | 7.218 | |
| p-value | - | 0.002 | 0.674 | 0.04 | |
| 2210 | F | - | 14.108 | 2.883 | 9.336 |
| F-critical | - | 7.556 | 7.148 | 7.218 | |
| p-value | - | 0.563 | - | - | |
| 2340 | F | - | 2.513 | - | - |
| F-critical | - | 7.619 | - | - |
References
- Gholizadeh, A.; Borůvka, L.; Vašát, R.; Saberioon, M.; Klement, A.; Kratina, J.; Tejneckỳ, V.; Drábek, O. Estimation of potentially toxic elements contamination in anthropogenic soils on a brown coal mining dumpsite by reflectance spectroscopy: A case study. PLoS ONE 2015, 10, e0117457. [Google Scholar] [CrossRef]
- Baruthio, F. Toxic effects of chromium and its compounds. Biol. Trace Elem. Res. 1992, 32, 145–153. [Google Scholar] [CrossRef]
- Chakraborty, S.; Weindorf, D.C.; Paul, S.; Ghosh, B.; Li, B.; Ali, M.N.; Ghosh, R.K.; Ray, D.; Majumdar, K. Diffuse reflectance spectroscopy for monitoring lead in landfill agricultural soils of India. Geoderma Reg. 2015, 5, 77–85. [Google Scholar] [CrossRef]
- Choe, E.; van der Meer, F.; van Ruitenbeek, F.; van der Werff, H.; de Smeth, B.; Kim, K.W. Mapping of heavy metal pollution in stream sediments using combined geochemistry, field spectroscopy, and hyperspectral remote sensing: A case study of the Rodalquilar mining area, SE Spain. Remote Sens. Environ. 2008, 112, 3222–3233. [Google Scholar] [CrossRef]
- Gholizadeh, A.; Saberioon, M.; Ben-Dor, E.; Borůvka, L. Monitoring of selected soil contaminants using proximal and remote sensing techniques: Background, state-of-the-art and future perspectives. Crit. Rev. Environ. Sci. Technol. 2018, 48, 243–278. [Google Scholar] [CrossRef]
- Shi, T.; Chen, Y.; Liu, Y.; Wu, G. Visible and near-infrared reflectance spectroscopy—An alternative for monitoring soil contamination by heavy metals. J. Hazard. Mater. 2014, 265, 166–176. [Google Scholar] [CrossRef]
- Gholizadeh, A.; Boruvka, L.; Saberioon, M. Spectroscopic approach to assess potentially toxic elements of reclaimed dumpsites in the Czech Republic. Int. J. Environ. Sci. Dev. 2015, 6, 571. [Google Scholar] [CrossRef]
- Gholizadeh, A.; Kopačková, V. Detecting vegetation stress as a soil contamination proxy: A review of optical proximal and remote sensing techniques. Int. J. Environ. Sci. Technol. 2019, 16, 2511–2524. [Google Scholar] [CrossRef]
- Khosravi, V.; Ardejani, F.D.; Yousefi, S. Spectroscopic-based assessment of the content and geochemical behaviour of arsenic in a highly heterogeneous sulphide-rich mine waste dump. Environ. Earth Sci. 2017, 76, 459. [Google Scholar] [CrossRef]
- Khosravi, V.; Ardejani, F.D.; Yousefi, S.; Aryafar, A. Monitoring soil lead and zinc contents via combination of spectroscopy with extreme learning machine and other data mining methods. Geoderma 2018, 318, 29–41. [Google Scholar] [CrossRef]
- Khosravi, V.; Ardejani, F.D.; Aryafar, A.; Yousefi, S.; Karami, S. Prediction of copper content in waste dump of Sarcheshmeh copper mine using visible and near-infrared reflectance spectroscopy. Environ. Earth Sci. 2020, 79, 165. [Google Scholar] [CrossRef]
- Piroozfar, P.; Alipour, S.; Modabberi, S.; Cohen, D. Application of Geochemistry and VNIR Spectroscopy in Mapping Heavy Metal Pollution of Stream Sediments in the Takab Mining Area, NW of Iran. Acta Geol. Sin. Engl. Ed. 2018, 92, 2382–2394. [Google Scholar]
- Zhang, X.; Sun, W.; Cen, Y.; Zhang, L.; Wang, N. Predicting cadmium concentration in soils using laboratory and field reflectance spectroscopy. Sci. Total Environ. 2019, 650, 321–334. [Google Scholar] [CrossRef]
- Buckingham, R.; Staenz, K. Review of current and planned civilian space hyperspectral sensors for EO. Can. J. Remote Sens. 2008, 34, S187–S197. [Google Scholar] [CrossRef]
- Tomaštík, J.; Mokroš, M.; Surovỳ, P.; Grznárová, A.; Merganič, J. UAV RTK/PPK Method—An Optimal Solution for Mapping Inaccessible Forested Areas? Remote Sens. 2019, 11, 721. [Google Scholar] [CrossRef]
- Singh, A. Remote sensing and GIS applications for municipal waste management. J. Environ. Manag. 2019, 243, 22–29. [Google Scholar] [CrossRef] [PubMed]
- Werner, T.; Bebbington, A.; Gregory, G. Assessing impacts of mining: Recent contributions from GIS and remote sensing. Extr. Ind. Soc. 2019, 6, 993–1012. [Google Scholar] [CrossRef]
- Kemper, T.; Sommer, S. Use of airborne hyperspectral data to estimate residual heavy metal contamination and acidification potential in the Guadiamar floodplain Andalusia, Spain after the Aznacollar mining accident. In Proceedings of the Remote Sensing for Environmental Monitoring, GIS Applications, and Geology IV, Canary Islands, Spain, 13–16 September 2004; Volume 5574, pp. 224–234. [Google Scholar]
- Wu, Y.; Zhang, X.; Liao, Q.; Ji, J. Can contaminant elements in soils be assessed by remote sensing technology: A case study with simulated data. Soil Sci. 2011, 176, 196–205. [Google Scholar] [CrossRef]
- Peng, Y.; Kheir, R.B.; Adhikari, K.; Malinowski, R.; Greve, M.B.; Knadel, M.; Greve, M.H. Digital mapping of toxic metals in Qatari soils using remote sensing and ancillary data. Remote Sens. 2016, 8, 1003. [Google Scholar] [CrossRef]
- Shi, T.; Yang, C.; Liu, H.; Wu, C.; Wang, Z.; Li, H.; Zhang, H.; Guo, L.; Wu, G.; Su, F. Mapping lead concentrations in urban topsoil using proximal and remote sensing data and hybrid statistical approaches. Environ. Pollut. 2020, 272, 116041. [Google Scholar] [CrossRef] [PubMed]
- Gholizadeh, A.; Žižala, D.; Saberioon, M.; Borůvka, L. Soil organic carbon and texture retrieving and mapping using proximal, airborne and Sentinel-2 spectral imaging. Remote Sens. Environ. 2018, 218, 89–103. [Google Scholar] [CrossRef]
- Salehi, S.; Mielke, C.; Rogass, C. Mapping ultramafic complexes using airborne imaging spectroscopy and spaceborne data in Arctic regions with abundant lichen cover, a case study from the Niaqornarssuit complex in South West Greenland. Eur. J. Remote Sens. 2020, 53, 156–175. [Google Scholar] [CrossRef]
- Immitzer, M.; Vuolo, F.; Atzberger, C. First experience with Sentinel-2 data for crop and tree species classifications in central Europe. Remote Sens. 2016, 8, 166. [Google Scholar] [CrossRef]
- Kruse, F.A.; Boardman, J.W.; Huntington, J.F. Comparison of airborne hyperspectral data and EO-1 Hyperion for mineral mapping. IEEE Trans. Geosci. Remote Sens. 2003, 41, 1388–1400. [Google Scholar] [CrossRef]
- Sentinel, E. User Handbook; ESA Standard Document; European Space Agency: Paris, France, 2015; Volume 2, p. 64. [Google Scholar]
- Lobell, D.B.; Asner, G.P. Moisture effects on soil reflectance. Soil Sci. Soc. Am. J. 2002, 66, 722–727. [Google Scholar] [CrossRef]
- Mouazen, A.M.; De Baerdemaeker, J.; Ramon, H. Towards development of online soil moisture content sensor using a fibre-type NIR spectrophotometer. Soil Tillage Res. 2005, 80, 171–183. [Google Scholar] [CrossRef]
- Viscarra Rossel, R.; Walvoort, D.; McBratney, A.; Janik, L.; Skjemstad, J. Visible, near infrared, mid infrared or combined diffuse reflectance spectroscopy for simultaneous assessment of various soil properties. Geoderma 2006, 131, 59–75. [Google Scholar] [CrossRef]
- Savitzky, A.; Golay, M.J. Smoothing and differentiation of data by simplified least squares procedures. Anal. Chem. 1964, 36, 1627–1639. [Google Scholar] [CrossRef]
- Mehmood, T.; Liland, K.H.; Snipen, L.; Sæbø, S. A review of variable selection methods in partial least squares regression. Chemom. Intell. Lab. Syst. 2012, 118, 62–69. [Google Scholar] [CrossRef]
- Liu, D.; Sun, D.W.; Zeng, X.A. Recent advances in wavelength selection techniques for hyperspectral image processing in the food industry. Food Bioprocess Technol. 2014, 7, 307–323. [Google Scholar] [CrossRef]
- Wold, S.; Sjöström, M.; Eriksson, L. PLS-regression: A basic tool of chemometrics. Chemom. Intell. Lab. Syst. 2001, 58, 109–130. [Google Scholar] [CrossRef]
- Goldberg, D.E.; Holland, J.H. Genetic Algorithms and Machine Learning; Kluwer Academic Publishers: Dordrecht, The Netherlands, 1988. [Google Scholar]
- Mirjalili, S.; Dong, J.S.; Sadiq, A.S.; Faris, H. Genetic algorithm: Theory, literature review, and application in image reconstruction. In Nature-Inspired Optimizers; Springer: Berlin/Heidelberg, Germany, 2020; pp. 69–85. [Google Scholar]
- Katoch, S.; Chauhan, S.S.; Kumar, V. A review on genetic algorithm: past, present, and future. Multimed. Tools Appl. 2020, 80, 8091–8126. [Google Scholar] [CrossRef] [PubMed]
- Rossel, R.V.; Behrens, T. Using data mining to model and interpret soil diffuse reflectance spectra. Geoderma 2010, 158, 46–54. [Google Scholar] [CrossRef]
- Gholizadeh, A.; Borůvka, L.; Saberioon, M.; Vašát, R. A Memory-Based Learning Approach as Compared to Other Data Mining Algorithms for the Prediction of Soil Texture Using Diffuse Reflectance Spectra. Remote Sens. 2016, 8, 341. [Google Scholar] [CrossRef]
- Gomez, C.; Lagacherie, P.; Coulouma, G. Regional predictions of eight common soil properties and their spatial structures from hyperspectral Vis–NIR data. Geoderma 2012, 189, 176–185. [Google Scholar] [CrossRef]
- Sun, W.; Zhang, X. Estimating soil zinc concentrations using reflectance spectroscopy. Int. J. Appl. Earth Obs. Geoinf. 2017, 58, 126–133. [Google Scholar] [CrossRef]
- Yuan, F.; Li, X.; Jowitt, S.M.; Zhang, M.; Jia, C.; Bai, X.; Zhou, T. Anomaly identification in soil geochemistry using multifractal interpolation: A case study using the distribution of Cu and Au in soils from the Tongling mining district, Yangtze metallogenic belt, Anhui province, China. J. Geochem. Explor. 2012, 116, 28–39. [Google Scholar] [CrossRef]
- NASA/JPL. ASTER User Advisory. 2011. Available online: http://asterweb.jpl.nasa.gov/swir-alert.asp (accessed on 28 July 2013).
- Zhou, T.; Li, Z.; Pan, J. Multi-feature classification of multi-sensor satellite imagery based on dual-polarimetric sentinel-1A, landsat-8 OLI, and hyperion images for urban land-cover classification. Sensors 2018, 18, 373. [Google Scholar] [CrossRef] [PubMed]
- Cooley, T.; Anderson, G.P.; Felde, G.W.; Hoke, M.L.; Ratkowski, A.J.; Chetwynd, J.H.; Gardner, J.A.; Adler-Golden, S.M.; Matthew, M.W.; Berk, A.; et al. FLAASH, a MODTRAN4-based atmospheric correction algorithm, its application and validation. In Proceedings of the IEEE International Geoscience and Remote Sensing Symposium, Toronto, ON, Canada, 24–28 June 2002; Volume 3, pp. 1414–1418. [Google Scholar]
- Main-Knorn, M.; Pflug, B.; Louis, J.; Debaecker, V.; Müller-Wilm, U.; Gascon, F. Sen2Cor for sentinel-2. In Proceedings of the Image and Signal Processing for Remote Sensing XXIII, Warsaw, Poland, 11–14 September 2017; Volume 10427, p. 1042704. [Google Scholar]
- Kruse, F.; Lefkoff, A.; Boardman, J.; Heidebrecht, K.; Shapiro, A. The Spectral Image Processing System (SIPS). Interative visualization and analysis of imaging spectrometer data. Remote. Sens. Environ. 1993, 44, 145–163. [Google Scholar] [CrossRef]
- Olarewaju, O.O.; Bertling, I.; Magwaza, L.S. Non-destructive evaluation of avocado fruit maturity using near infrared spectroscopy and PLS regression models. Sci. Hortic. 2016, 199, 229–236. [Google Scholar] [CrossRef]
- Davey, M.W.; Saeys, W.; Hof, E.; Ramon, H.; Swennen, R.L.; Keulemans, J. Application of visible and near-infrared reflectance spectroscopy (Vis/NIRS) to determine carotenoid contents in banana (Musa spp.) fruit pulp. J. Agric. Food Chem. 2009, 57, 1742–1751. [Google Scholar] [CrossRef]
- Magwaza, L.S.; Opara, U.L.; Terry, L.A.; Landahl, S.; Cronje, P.J.; Nieuwoudt, H.; Mouazen, A.M.; Saeys, W.; Nicolaï, B.M. Prediction of ‘Nules Clementine’mandarin susceptibility to rind breakdown disorder using Vis/NIR spectroscopy. Postharvest Biol. Technol. 2012, 74, 1–10. [Google Scholar] [CrossRef][Green Version]
- Kinuthia, G.K.; Ngure, V.; Beti, D.; Lugalia, R.; Wangila, A.; Kamau, L. Levels of heavy metals in wastewater and soil samples from open drainage channels in nairobi, Kenya: Community health implication. Sci. Rep. 2020, 10, 1–13. [Google Scholar] [CrossRef]
- Wang, C.; Zhang, T.; Pan, X. Potential of visible and near-infrared reflectance spectroscopy for the determination of rare earth elements in soil. Geoderma 2017, 306, 120–126. [Google Scholar] [CrossRef]
- Kooistra, L.; Wanders, J.; Epema, G.; Leuven, R.; Wehrens, R.; Buydens, L. The potential of field spectroscopy for the assessment of sediment properties in river floodplains. Anal. Chim. Acta 2003, 484, 189–200. [Google Scholar] [CrossRef]
- White, W.B. Infrared characterization of water and hydroxyl ion in the basic magnesium carbonate minerals. Am. Mineral. J. Earth Planet. Mater. 1971, 56, 46–53. [Google Scholar]
- Nayak, P.S.; Singh, B. Instrumental characterization of clay by XRF, XRD and FTIR. Bull. Mater. Sci. 2007, 30, 235–238. [Google Scholar] [CrossRef]
- Clark, R.N.; King, T.V.; Klejwa, M.; Swayze, G.A.; Vergo, N. High spectral resolution reflectance spectroscopy of minerals. J. Geophys. Res. Solid Earth 1990, 95, 12653–12680. [Google Scholar] [CrossRef]
- Wu, G.; Xu, T.; Zhang, X.; Zhang, C.; Yan, N. The visible spectroscopy of iron oxide minerals in dust particles from ice cores on the Tibetan Plateau. Tellus Chem. Phys. Meteorol. 2016, 68, 29191. [Google Scholar] [CrossRef]
- Fang, Q.; Hong, H.; Zhao, L.; Kukolich, S.; Yin, K.; Wang, C. Visible and near-infrared reflectance spectroscopy for investigating soil mineralogy: A review. J. Spectrosc. 2018, 2018, 3168974. [Google Scholar] [CrossRef]
- Wu, Y.; Chen, J.; Wu, X.; Tian, Q.; Ji, J.; Qin, Z. Possibilities of reflectance spectroscopy for the assessment of contaminant elements in suburban soils. Appl. Geochem. 2005, 20, 1051–1059. [Google Scholar] [CrossRef]
- Song, Y.; Li, F.; Yang, Z.; Ayoko, G.A.; Frost, R.L.; Ji, J. Diffuse reflectance spectroscopy for monitoring potentially toxic elements in the agricultural soils of Changjiang River Delta, China. Appl. Clay Sci. 2012, 64, 75–83. [Google Scholar] [CrossRef]
- Cheng, H.; Shen, R.; Chen, Y.; Wan, Q.; Shi, T.; Wang, J.; Wan, Y.; Hong, Y.; Li, X. Estimating heavy metal concentrations in suburban soils with reflectance spectroscopy. Geoderma 2019, 336, 59–67. [Google Scholar] [CrossRef]
- Tsai, F.; Philpot, W. Derivative analysis of hyperspectral data. Remote Sens. Environ. 1998, 66, 41–51. [Google Scholar] [CrossRef]
- Lin, M.; Al-Holy, M.; Mousavi-Hesary, M.; Al-Qadiri, H.; Cavinato, A.; Rasco, B. Rapid and quantitative detection of the microbial spoilage in chicken meat by diffuse reflectance spectroscopy (600–1100 nm). Lett. Appl. Microbiol. 2004, 39, 148–155. [Google Scholar] [CrossRef]
- Abiodun, O.I.; Jantan, A.; Omolara, A.E.; Dada, K.V.; Mohamed, N.A.; Arshad, H. State-of-the-art in artificial neural network applications: A survey. Heliyon 2018, 4, e00938. [Google Scholar] [CrossRef]
- Jia, X.; Cao, Y.; O’Connor, D.; Zhu, J.; Tsang, D.C.; Zou, B.; Hou, D. Mapping soil pollution by using drone image recognition and machine learning at an arsenic-contaminated agricultural field. Environ. Pollut. 2021, 270, 116281. [Google Scholar] [CrossRef]
- Naderi, A.; Delavar, M.A.; Kaboudin, B.; Askari, M.S. Assessment of spatial distribution of soil heavy metals using ANN-GA, MSLR and satellite imagery. Environ. Monit. Assess. 2017, 189, 214. [Google Scholar] [CrossRef]
- Chen, T.; Chang, Q.; Clevers, J.; Kooistra, L. Rapid identification of soil cadmium pollution risk at regional scale based on visible and near-infrared spectroscopy. Environ. Pollut. 2015, 206, 217–226. [Google Scholar] [CrossRef]
- Wu, Y.; Chen, J.; Ji, J.; Gong, P.; Liao, Q.; Tian, Q.; Ma, H. A mechanism study of reflectance spectroscopy for investigating heavy metals in soils. Soil Sci. Soc. Am. J. 2007, 71, 918–926. [Google Scholar] [CrossRef]
- Moros, J.; Vallejuelo, S.F.O.d.; Gredilla, A.; Diego, A.d.; Madariaga, J.M.; Garrigues, S.; Guardia, M.d.l. Use of reflectance infrared spectroscopy for monitoring the metal content of the estuarine sediments of the Nerbioi-Ibaizabal River (Metropolitan Bilbao, Bay of Biscay, Basque Country). Environ. Sci. Technol. 2009, 43, 9314–9320. [Google Scholar] [CrossRef] [PubMed]
- Kim, H.; Yu, J.; Wang, L.; Jeong, Y.; Kim, J. Variations in Spectral Signals of Heavy Metal Contamination in Mine Soils Controlled by Mineral Assemblages. Remote Sens. 2020, 12, 3273. [Google Scholar] [CrossRef]
Publisher’s Note: MDPI stays neutral with regard to jurisdictional claims in published maps and institutional affiliations. |
© 2021 by the authors. Licensee MDPI, Basel, Switzerland. This article is an open access article distributed under the terms and conditions of the Creative Commons Attribution (CC BY) license (http://creativecommons.org/licenses/by/4.0/).

