Abstract
Land use/land cover (LULC) change has been recognized as one of the most important indicators to study ecological and environmental changes. Remote sensing provides an effective way to map and monitor LULC change in real time and for large areas. However, with the increasing spatial resolution of remote sensing imagery, traditional classification approaches cannot fully represent the spectral and spatial information from objects and thus have limitations in classification results, such as the “salt and pepper” effect. Nowadays, the deep semantic segmentation methods have shown great potential to solve this challenge. In this study, we developed an adaptive band attention (BA) deep learning model based on U-Net to classify the LULC in the Three Gorges Reservoir Area (TGRA) combining RapidEye imagery and topographic information. The BA module adaptively weighted input bands in convolution layers to address the different importance of the bands. By comparing the performance of our model with two typical traditional pixel-based methods including classification and regression tree (CART) and random forest (RF), we found a higher overall accuracy (OA) and a higher Intersection over Union (IoU) for all classification categories using our model. The OA and mean IoU of our model were 0.77 and 0.60, respectively, with the BA module and were 0.75 and 0.58, respectively, without the BA module. The OA and mean IoU of CART and RF were both below 0.51 and 0.30, respectively, although RF slightly outperformed CART. Our model also showed a reasonable classification accuracy in independent areas well outside the training area, which indicates the strong model generalizability in the spatial domain. This study demonstrates the novelty of our proposed model for large-scale LULC mapping using high-resolution remote sensing data, which well overcomes the limitations of traditional classification approaches and suggests the consideration of band weighting in convolution layers.
1. Introduction
The Three Gorges Project (TGP) built the largest dam across the third longest river (Yangtze River) in the world. It was built to provide great power, improve the river shipping, and control floods in the upper reaches while increasing the dry season flow in the middle and lower reaches of the Yangtze River. The TGP has created a reservoir area of 1080 km by damming the Yangtze River and greatly changed the landscape pattern in the Three Gorges Reservoir Area (TGRA) [1]. Approximately 1.25 million people were displaced over a 16-year period ending in 2008. Thus far, this project has begun to bring enormous economic benefits but caused adverse and often irreversible environmental impacts [2,3]. To characterize the environmental impacts of the TGP, the Chinese government has formulated a series of relevant polices to monitor the ecological and environmental changes [2,4,5].
LULC change has been recognized as one of the most important indicators to study ecological and environmental changes [6,7]. Remote sensing technology provides the most effective way for monitoring LULC at large scales [8,9]. LULC mapping with high spatial resolution is the fundament to assess ecosystem service and global environmental change [10]. It is necessary to develop an automated and efficient classification method for high-resolution LULC mapping at large scales.
With the increasing availability and spatial resolution of remote sensing data, traditional classification approaches for LULC mapping using remote sensing can be divided into two groups: pixel-based methods and objected-based methods [11].
Pixel-based methods have long been the main approach to classify remote sense images by using the spectral information of each pixel. Initially, parametric classifiers were commonly used such as parallelepiped, maximum likelihood, and minimum distance classifiers [12]. In 2014, Yu and Liang et al. found that 32% of the1651 studies about remote sensing classification used maximum likelihood due to its efficiency and accessibility in most remote sensing software [13]. In recent years, non-parametric machine learning classifiers were also developed to improve classification accuracy, such as the classification and regression tree (CART) [14,15,16], support vector machine (SVM) [17,18,19], and random forest (RF) [20,21]. These classifiers are often used for hyperspectral data with more spectral information provided in each pixel [22,23]. However, the increase in within-class variance and decrease in between-class variance often limit the accuracy of pixel-based methods [24]. In addition, with the increase in the spatial resolution of sensors to 5–30 m or higher, the pixel-based classification results tend to possess “salt and pepper” noise, that is, in some categories, there are other categories of noise due to the effect of spectral confusion of different land cover types [25].
To overcome this issue, object-based classification methods were proposed for high-resolution image analysis [26]. In contrast to pixel-based methods, object-based methods use both spectral and spatial features of objects and divide the classification into two steps: image segmentation and classification [27]. Image segmentation splits an image into separate regions or objects based on geometric features, spatial relations, and scale topology relations of upscale and downscale inheritances. A group of pixels with similar spectral and spatial properties are aggregated into one object, thereby avoiding “salt and pepper” noise [28,29]. The classic segmentation algorithms mainly include the recursive hierarchical segmentation (RHSeg) [6,30], multiresolution segmentation [31], and watershed segmentation [32]. Zhang et al. mapped the land cover of China using HJ satellite imagery based on an object-based method, which showed an overall accuracy of 86%. However, this two-step classification method requires great human involvement to adjust the parameters in each step, which limits the model generalization and adaptability in large area [3].
Over the past few years, deep learning based on convolution neural networks (CNN) has become a technology of considerable interest in computer vision with the emergence of graphic processing units (GPU). CNN is a very powerful tool for object identification and image classification which can yield informative features hierarchically [33]. Recently, fully convolutional networks (FCN) based on CNN were developed for pixel-wise semantic segmentation, which assigns a semantic label (i.e., a class) to each coherent region of an image using dense pixel-wise prediction models. They were first used for semantic segmentation of digital images [34], multi-modal medical image analyses, and multispectral satellite image segmentation. Several semantic network architectures have been proposed, e.g., SegNet [35], U-Net [36], FC-Densenet [37], E-Net [38], Link-Net [39], RefineNet [40], and PSPNet [41]. In particular, the U-Net architecture initially developed for biomedical image segmentation has now been widely used in Kaggle competition and classifying ground features with high accuracy. The rapid development of semantic segmentation architecture brings opportunities for high-resolution remote sensing classification.
However, compared to digital images with red, green, and blue bands, multispectral imagery normally has 3–10 bands and hyperspectral imagery even consists hundreds or thousands of bands. In addition, the data from different remote sensing sensors or platforms can be stacked together to provide multi-band information [11]. The relationship between bands is a critical feature in remote sensing classification. Traditionally, vegetation indices such as normalized difference vegetation index (NDVI) [42], soil-adjusted vegetation index (SAVI) [43], and normalized difference water index (NDWI) [44] are calculated to enhance the contrast between targets and background. However, in a CNN, the convolutional operations extract the feature information from input bands with equal weights without considering the different importance of spectral information in multiple bands.
In this study, we developed an adaptive band attention (BA) deep learning model based on U-Net to classify LULC in TGRA using RapidEye imagery and topographic information. We introduced the BA module that weighted bands adaptively in CNN by learning the different importance of input bands. To evaluate our model, the results based on traditional pixel-based classification methods including CART and RF, as well as an object-based multiresolution segmentation method, were generated for comparison. The main contributions of this study are listed as follows:
- 1.
- We proposed an end-to-end deep learning method which overcame the limitations of traditional methods for high-resolution remote sensing classification.
- 2.
- We investigated the impact of the BA module on model performance which generated a dynamic weight for each band in CNN.
- 3.
- To evaluate the spatial generalizability of the proposed model, we tested the trained model at other regions of the study area.
2. Materials and Methods
2.1. Study Area
In this study, the TGRA was selected as the study area. It is located in the transition zone from the Qinghai-Tibet plateau to the lower reaches of the Yangtze River within 10616′E–11128′E and 2856′N–3144′N (Figure 1). The TGRA has an area of 58,000 km and a population of 20 million. Approximately 74% of this region is mountainous, 4.3% is plain, and 21.7% is hilly, with the elevation ranging from 73 to 2977 m. The TGRA consists of 20 counties, with 16 in Chongqing province and 4 in Hubei province. The study area is ecologically vulnerable with frequent landslides. Due to the monsoon climate, there is obvious seasonality in the TGRA. Annual precipitation ranges from 1000 to 1200 mm, with 60% of the precipitation occurring during June–September.
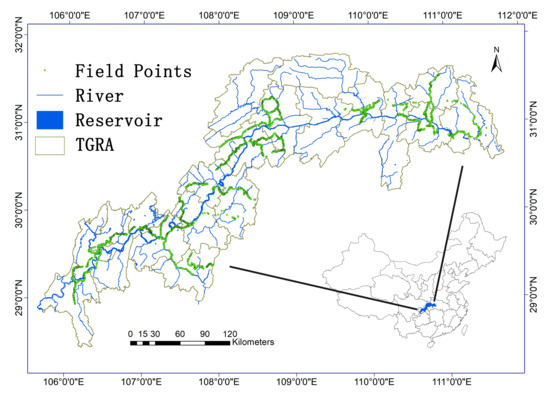
Figure 1.
Location map of the TGRA. The green points show the ground-truth field points.
Moreover, Wushan county located at the west entrance of the Wu Gorge is called the ‘core heart’ of TGRA (Figure 2). Its location is within 10933′E–11011′E and 3045′N–2328′N. Wushan county occupies 2958 km (∼5% of TGRA) and has a population of 600,000. In this study, our proposed model was first trained and validated in Wushan county. We then evaluated the model generalizability in other counties in TGRA.
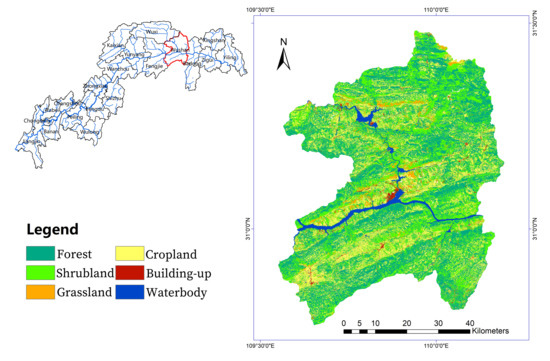
Figure 2.
Wushan county with its LULC map in 2012. This LULC map was used for model training and validation.
2.2. Data Sources
The RapidEye imagery at 5-m resolution was used in this study. The RapidEye constellation was launched into orbit on 29 August 2008. RapidEye constellation sensors provided five bands: blue (440–510 nm), green (520–590 nm), red (630–685 nm), red edge (690–730 nm), and near infrared (760–850 nm). The abundant spatial and spectral information in RapidEye imagery has been used for agriculture, forestry, environmental monitoring, etc. In particular, the unique red edge band, which is sensitive to change in chlorophyll content, can assist in monitoring vegetation health and improving species separation [45]. In this study, 198 tiles of RapidEye Surface Reflectance Product in summer and autumn of 2012 with minimum cloud cover were collected. The atmospheric effects were removed by atmospheric correction using 6S [46].
Topographic attributes such as elevation and slope provide useful terrain information for land cover classification [47]. The elevation from SRTM 1 arc-second global data at 30-m resolution was used in this study [48]. The slope was calculated from elevation using the Spatial Analyst toolbox in ArcGIS [49]. The elevation and slope were both re-sampled to 5 m using the nearest neighbor interpolation to match the RapidEye imagery.
The LULC map of Wushan county in 2012 was generated as the ground truth map using object-oriented classification methods, which includes six categories: forest, shrubland, grassland, cropland, built-up, and waterbody Figure 2. The segmentation was processed by multiresolution segmentation [29] in eCognition [27]. CART [50] was used to classify the segmented objects. The LULC maps were further corrected manually by visual interpretation and validated by extensive ground survey points [51]. The ground survey points were collected by technicians driving randomly through a survey area and recording the homogeneous land cover types within the visible range on both sides of the road using a smartphone app named GVG (a volunteer geographical information smart phone app) [52,53]. The location of all points were corrected manually based on Google Maps. In total, 4174 points were used in this study (Figure 1).
2.3. The Model Architecture
In this study, the U-Net architecture was selected as our based structure (Figure 3). The U-Net, with a simple and efficient architecture, has become the most widely used semantic segmentation structure in recent years [36]. The most important innovation of U-Net is the skip connection, which allows the decoder at each stage to learn back relevant features that are lost when pooled in the encoder. The skip connection has proved effective in recovering the details of target objects even on a complex background. As Figure 3 shows, the structure consists of encoder and decoder parts. The encoder extracts feature map from the input image by passing several convolution-pooling operations and the decoder is used to predict the classification result and recover the deep hidden feature to original image size by up sampling.
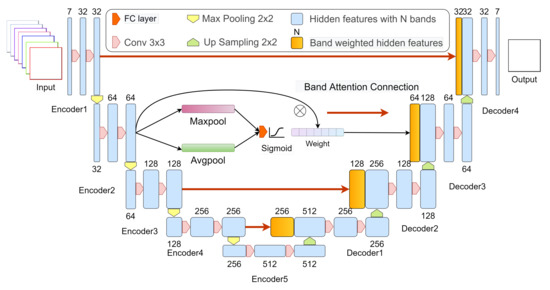
Figure 3.
The structure of proposed model.
The input bands are fed into the encoder part to generate hidden features. For each encoder operation, the band number of the feature will be doubled, and the band size will become half. Each encoder block contains a max pooling layer and two repeat conv operations. The max pooling down sample the input representation to half size. The conv operation has a 3 × 3 convolution kernel followed by a rectified linear unit (ReLU) [54] and a BatchNorm layer [55]. The operation can be formulated as:
where is the hidden feature in i layers, is the upper hidden feature of , represents the down sampling operation by max pooling, and means the Conv operation.
The decoder adopts a structure similar to the encoder by replacing the max pooling layer to an up-sampling layer to bilinear extend the deep feature to the original size. For each decoder block, the upscale was set to 2 to make sure the size of output is the same as the forward encoder output. A skip connection was used to concatenate the encoder and decoder at each layer. The original skip connection was simply the residual learning. The hidden feature from encoder was directly concatenated to the decoder part. The decoder operation can be formulated as:
where is the hidden feature of decoder part in i layers, is the lower hidden feature of , and presents the up-sampling operation.
In this study, the model input included seven bands by combining RapidEye imagery and the elevation and slope information. To emphasize the effect of the spectral relationship between bands, a BA connection module was introduced to replace the skip connection in original U-Net structure. Four BA modules were added at different depths in the semantic segmentation model and provided 32, 64, 128, and 256 weights, respectively. The aim of this operation is to generate a dynamic weight for each band. We first squeezed each channel to a single numeric vector using pooling layers. Here, we used average and max pooling to create two values for each channel. Then, the squeezed vector was fed into a fully connected (FC) layer with ReLU activation, which reduces the dimensionality while introduces new non-linearities. Sigmoid activation was used at the end to give each channel a smooth weight and ranged the value to 0–1. At last, the original hidden feature was used to multiply weights and then send to the decoder part. It can be formulated as:
where , and P represent the Sigmoid, FC, and pooling operation, respectively. Consequently, the decoder operation with the BA connection can be formulated as:
The model was trained by a pixel-wise loss function. The categorical cross entropy was selected in this work as:
where is ground truth classes in i location and is the predicted value in the corresponding place.
2.3.1. Data Preprocessing
In this study, we conducted data preprocessing before training and evaluating the proposed model (Figure 4). First, to standardize the brightness of original RapidEye images, a histogram matching was performed in mosaicking all images [56]. The original images and the image mosaic after histogram matching are shown in Figure 5. Then, we stacked the five-band RapidEye imagery with the topographic data including DEM and slope together.

Figure 4.
The flow chat of the data preprocessing.
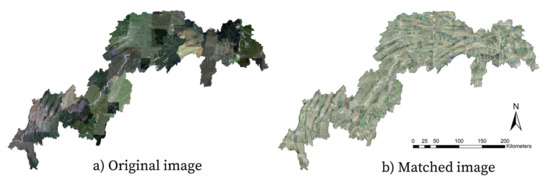
Figure 5.
RapidEye data coverage in the TGRA. The left and right images are the image mosaic before and after histogram matching, respectively.
In general, remote sensing images are too large to pass through a CNN. Given the limited GPU memory, we split our input bands into small patches (256 × 256 pixels) using an overlapped sliding window Figure 6. The overlap rate was set as half of the patch size, which doubled the number of training samples. In total, we sampled 6664 image patches using sliding window. Moreover, to reduce model overfitting, three forms of data augmentation were used for each sample: random brightness and contrast, vertical and horizontal flip, and random rotate [57].
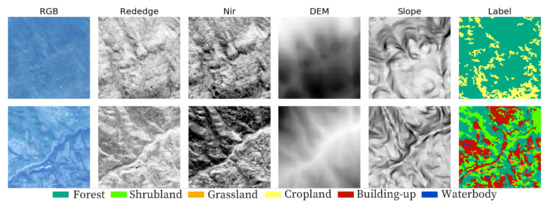
Figure 6.
Image patches with ground truth label using sliding window. The RGB, red edge, and near infrared band were from RapidEye imagery. The DEM and slope represent topographic information.
2.3.2. Experiment Design
Models for Comparison
In our proposed model, 80% of the image patches were used for model training and the left were used for validation. The model was implemented based on PyTorch and executed on a server with an Intel(R) Xeon(R) CPU E5-2650, NVIDIA 2080TI, and 64 GB memory. To optimize model parameters, Adam, a stochastic optimization algorithm with a batch size of 64 samples, was used to train the model. We firstly set the learning rate (LR) as . The LR decreased to 1 × 10⁻⁶ with increasing iterations.
Moreover, two commonly used pixel-based classification methods, CART and RF, were selected for results comparison. CART, often referred to as ‘decision trees’, is strictly a nonparametric model that can be trained on any input without parameter adjustment, and the prediction is rapid without complex computation. Due to its simplicity, CART has many advantages in land cover analysis. RF is an ensemble classifier that uses a set of CARTs. In a RF model, the out-of-Bag (OOB) and permutation tests can determine the importance of each feature. RF is also computationally efficient and deals better with high-dimension data without over-fitting. In this study, we randomly selected 2000 pixels for each category from training images to train the pixel-based classifiers. The pixel-based classifiers were implemented in python with Scikit-Learn package [58]. Detailed parameters are shown in Table 1.

Table 1.
Pixel-based classifiers and parameter setting.
Accuracy Metrics
Two metrics derived from confusion matrix were calculated to assess the classification accuracy of each method: the overall accuracy (OA) and F1-score. OA is used to evaluate the overall effectiveness of an algorithm and F1-score measures the accuracy by combining the precision and recall measures. OA and F1-score are formulated as:
where is the total number of correctly classified pixels, n means total number of validation pixels, and is the observation in row i column j in confusion matrix. is the marginal total of row I and is the marginal total of column j in confusion matrix.
The Intersection over Union (IoU) was also used to evaluate the segmentation performance of each method. IoU is the ratio of overlapped area to the area of union between predicted and ground truth category (Figure 7). This metric ranges 0–1 (0–100%) with 0 signifying no overlap and 1 signifying perfect segmentation. The mean IoU (MIoU) is calculated by averaging the IoU of each category.
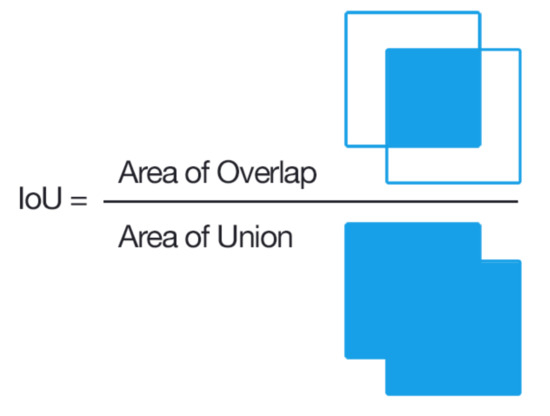
Figure 7.
Illustration of IoU calculation. Source: Wikipedia.
3. Results
3.1. Classification Results
The performance of our proposed model with or without the BA module was significantly better than that based on traditional pixel-based classification methods (Table 2). For pixel-based classification methods, the performance of RF was better than CART. The OA and MIoU of RF were 0.510 and 0.265, respectively, while the OA and MIoU of CART were only 0.390 and 0.175, respectively. However, the OA and MIoU of our model were 0.771 and 0.596, respectively, and were 0.754 and 0.578, respectively, without the BA module.

Table 2.
The classification performance between pixel-based classification methods and our proposed model without and with the band attention (BA) module.
Among the six categories, the classification result of waterbody had the highest accuracy in each method (Figure 8). Overall, 91–96% of waterbody pixels could be correctly classified. Among vegetation categories, the classification accuracy of forest was higher than the others. Specifically, 52% and 67% of forest pixels were correctly classified using CART and RF, respectively, and 80% and 82% forest pixels were correctly classified using our proposed model without and with band attention module, respectively. For the two pixel-based classification methods, the classification accuracy of shrubland and grassland were the lowest, with an accuracy of 32–36% for shrubland and 39–53% for grassland Figure 8b. Moreover, a small proportion of cropland was classified into built-up, especially based on our proposed model.
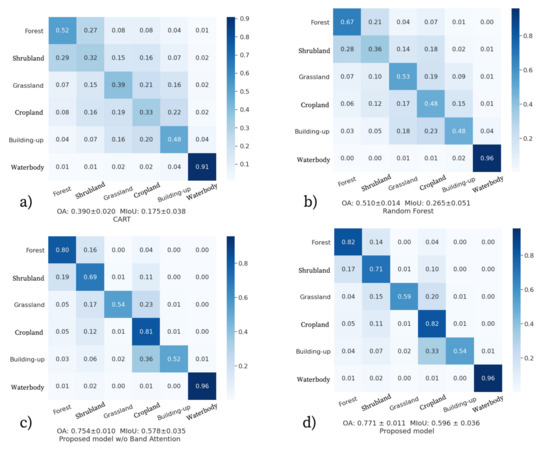
Figure 8.
Confusion matrix of the classification results achieved by CART, RF, and our proposed model without and with BA.
3.2. Model Generalizability
In total, 4174 fields ground truth points were used to evaluate the generalizability and adaptability of the proposed model in other counties. Our proposed model was originally trained in Wushan county and further evaluated by this independent dataset. As Figure 9 shows, in many counties, the OA of classification was above 70%. The lowest OA estimates occurred in Wuxi and Yuyang counties where there were a few ground truth points. The OA for the whole TGRA was 72.7% based on all ground truth points.
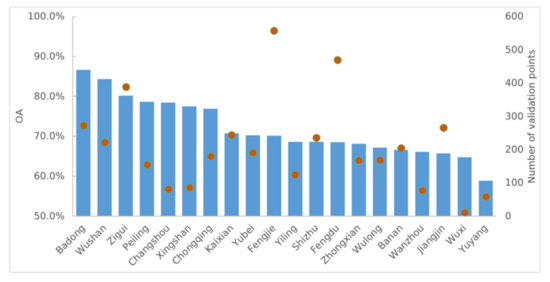
Figure 9.
The OA of the trained proposed model in other counties based on field validation points. Solid points represent number of validation points. Blue bars represent the OA.
4. Discussion
In this study, we developed a novel adaptive BA deep learning model based on U-Net to classify the LULC in the TGRA using RapidEye imagery and topographic information. We comprehensively evaluated the performance of the proposed model by comparison with two traditional pixel-based classification methods. Given the relationship of the spectral information between input bands, we also investigated the effectiveness of an adaptive BA module which generates a dynamic weight for each band in CNN. As the results show, the accuracy of our proposed model was considerably higher than that of the pixel-based methods. By adding the BA module, the model performance could be further improved. Our proposed deep learning model not only showed a higher classification accuracy in training region, but also demonstrated strong spatial generalizability in other regions, which allows for large-scale LULC mapping based on a model trained at a local region.
4.1. Traditional Methods vs CNN Based Methods
The pixel-based classification methods only use the spectral information of each pixel, as shown in Figure 10. The waterbody has lower reflectance in NIR and is mostly distributed in low and flat areas Figure 10. Thus, waterbody had the highest accuracy using all methods in our study Figure 8). However, the vegetation categories such as forest, shrubland, grassland, and cropland share similar spectral properties, which makes it difficult to distinguish them. Forest had a relatively higher accuracy than the other vegetation types because forests are usually distributed in the mountainous area with high elevation. In our study, many cropland pixels were assigned to built-up. One reason is that Wushan county is a farming-based county where most croplands are distributed around residential areas, which increases the misclassification. Another reason is that RapidEye images were acquired in summer and autumn when most cropland is near harvest or after harvest, which results in the misclassification of bare ground cropland into built-up.
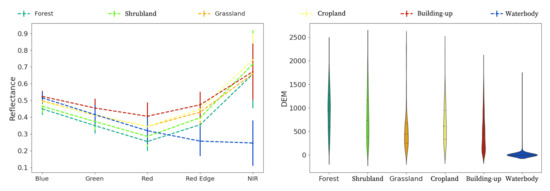
Figure 10.
Spectral and topographic features for each category.
In comparison, the classification output based on our proposed model showed a much smoother look than that based on pixel-based method (e.g., RF) and matched well with the ground truth labels (Figure 11). The disadvantage of pixel-based methods relying on spectral information will be amplified when dealing with higher spatial resolution imagery, resulting in severe “salt and pepper” noise in the classified images. This was also demonstrated by the lower MIoU (<30%) estimates using pixel-based classification methods (Table 2). In our proposed model, the CNN can deal with joint spatial-spectral information using convolution kernels. All values in adjacent pixels are fed into a convolution filter to extract feature information. The pooling layers further extract the average or maximum value of adjacent pixels while excluding the abnormal and unimportant information, which avoids the “salt and pepper” effect in results.
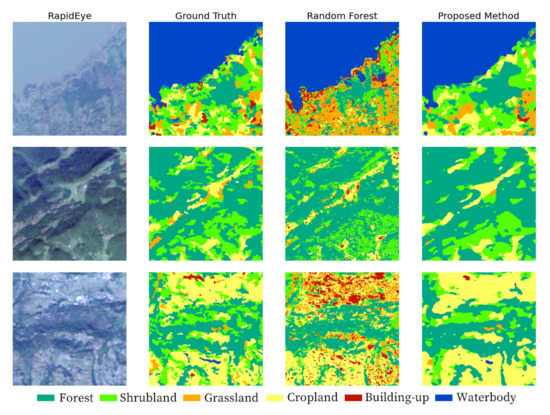
Figure 11.
Comparison of random forest and proposed model outputs. The first column shows the RGB image, the second column shows the ground truth label, the third column shows the classification results from Random forest, and the fourth column shows the classification results from proposed model.
Furthermore, as the proposed model can generate a segmented result, we compared the segmentation performance between the proposed model with a tradition object-based method. In this work, the multiresolution segmentation algorithm, which is the most widely used segmentation method and has been integrated in the eCognition land cover mapping software, was selected. The LULC map of Wushan county (Ground truth map) was also generated using this method. This method creates objects using an iterative algorithm. Objects (beginning with individual pixels) are clustered until an upper object variance threshold is reached. To minimize the fractal borders of the objects, the variance threshold (scale parameter) is weighted with shape parameters. Larger objects will be generated when the scale parameter is raised, but their exact size and dimensions will be determined by the underlying data [59]. In this study, given the large size of the remote sensing images and the 5 m spatial resolution, the scale parameter was set as 30 for the segmentation. Figure 12 shows the segmentation results using the multiresolution segmentation method and our proposed model. As shown in the second column of Figure 12, the edge of each segmented object looks rough due to the scale effect of segmentation. However, the results of our proposed model were smoother and more realistic by visual check. In this study, we evaluated our model generalization in other counties using an independent ground truth points. The accuracy in these counties was still acceptable, which demonstrated the strong model generalizability. In our study, our proposed model was trained using massive training samples. The data augmentation randomly transformed the training images to offer more possibilities of the data, which enables the CNN based model to have good generalizability.
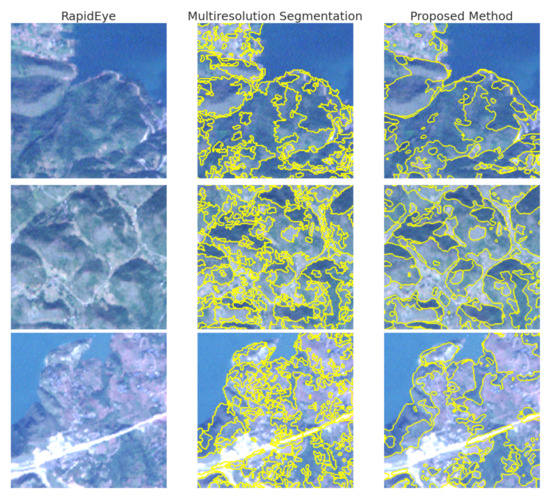
Figure 12.
Segmentation results of multiresolution segmentation method and the proposed method.
4.2. The Importance of Band Weighting
In this study, the topographic datasets were combined with RapidEye imagery to provide more attribute information. Benediktsson et al. demonstrated that the elevation information is responsible for up to 80% of contribution on land cover classification [47]. Figure 13 shows the importance score of each band in pixel-based classification; the DEM showed the highest feature importance and the near-infrared, which is generally considered as the most important band for identifying vegetation, provided the second highest importance. The blue band showed a negative importance, which can also be explained by the similar spectral distribution shared by each category in Figure 10.
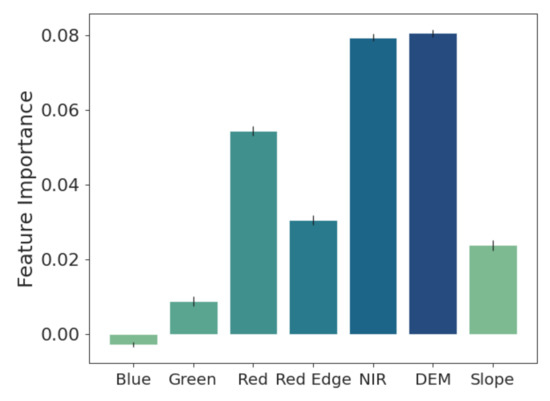
Figure 13.
The importance score of model inputs in pixel-based classification.
However, in CNN-based models, the weights of each band are generally set equal. It is reasonable when dealing with traditional RGB or BW images which only have three and one bands. In this study, the model input has a total of seven bands including RapidEye imagery and elevation and slope information. We introduced a BA module which generated an adaptive weight for each band in the convolution operation. Four BA modules were added at different depths in the semantic segmentation model. The number of bands was extended to 32, 64, 128, and 258 in hidden features, and the band weights were multiplied on the hidden features. Based on the adaptive weight for each band for each category in Figure 14, the weight of each class varied, which demonstrated that the BA module changed the weight of each band in the prediction. The F1-score of forest, shrubland grassland, cropland, and built-up increased by adding the BA module (Table 2). Especially, for the three most difficult categories, namely built-up, grassland, and shrubland, the F1-score increased by 0.025, 0.046, and 0.025, respectively. The OA and MIoU improved from 0.754 to 0.771 and 0.578 to 0.596, respectively, which demonstrated the effectiveness of band weighting in our proposed model for classification. However, the F1-score of the water body slightly dropped by adding the band attention module (Table 2). One of the reasons is that the ground truth land cover data were corrected by visual interpretation and validated by extensive ground survey points. It cannot be guaranteed that the field data were collected on the acquisition date of the remote sensing data. Thus, some seasonal water bodies might be assigned into water bodies in ground truth map. However, the remote sensing images were captured in summer when these water bodies might dry out. This situation can lead to the slight decline in accuracy of proposed model with BA module. Moreover, the deep learning method is usually referred as “black box” and its mechanism is difficult to explain by traditional methods. Although we analyzed the impact of the BA module on the classification results, we still cannot explain clearly how BA modules have affected the results. How to explain the mechanism of the BA module in deep learning is also a direction of our future work.
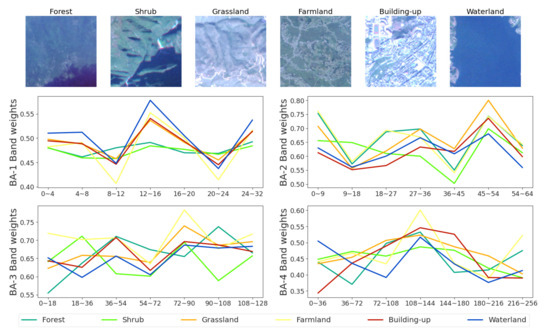
Figure 14.
The band weights induced by the BA module at different depths in the proposed model. Six images from different categories were fed into the trained model and the weights for each band were class specific.
5. Conclusions
Land use and land cover mapping is a critical work in remote sensing application. It is still challenging with the increasing high spatial resolution remote sensing data. The traditional commonly used pixel-based classification methods cannot fully represent the feature information from objects and thus have limitations in classification results, such as the “salt and pepper” effect. Although the object-oriented classification methods provide a way to solve this challenge, they usually include two steps, namely image segmentation and classification, which requires great human involvement by adjusting the parameters in each step and lacks generalization and adaptability when dealing with large areas. In this study, an end-to-end CNN based method integrated with a band attention (BA) module was proposed. The BA module was introduced to leverage the spectral information in our proposed model. The results show that the proposed CNN model outperformed traditional pixel-based methods in classifying high-resolution images. By adding the BA module, the model performance increased further. By evaluating the trained model at independent regions outside the training area, the classification accuracy was still acceptable, which demonstrated the strong model generalizability at the spatial domain.
Author Contributions
Conceptualization, all authors; Methodology, X.Z.; Data acquisition, F.W. and L.Z.; Software, X.Z.; Analysis, X.Z. and L.Z.; Writing—original draft preparation, X.Z. and L.D.; Writing—review and editing, all authors; and Supervision, B.W. All authors have read and agreed to the published version of the manuscript.
Funding
This research was supported by the National Key R&D Program of China (2016YFA0600301) and the program from China Three Gorges Corporation.
Data Availability Statement
Not applicable.
Acknowledgments
We thank the anonymous reviewers for reviewing the manuscript and providing comments to improve the manuscript.
Conflicts of Interest
The authors declare no conflict of interest.
References
- Lei, Z.; Bingfang, W.; Liang, Z.; Peng, W. Patterns and driving forces of cropland changes in the Three Gorges Area, China. Reg. Environ. Chang. 2012, 12, 765–776. [Google Scholar] [CrossRef]
- Tullos, D. Assessing the influence of environmental impact assessments on science and policy: An analysis of the Three Gorges Project. J. Environ. Manag. 2009, 90, S208–S223. [Google Scholar] [CrossRef] [PubMed]
- Zhang, J.; Zhengjun, L.; Xiaoxia, S. Changing landscape in the Three Gorges Reservoir Area of Yangtze River from 1977 to 2005: Land use/land cover, vegetation cover changes estimated using multi-source satellite data. Int. J. Appl. Earth Obs. Geoinf. 2009, 11, 403–412. [Google Scholar] [CrossRef]
- Zhang, Q.; Lou, Z. The environmental changes and mitigation actions in the Three Gorges Reservoir region, China. Environ. Sci. Policy 2011, 14, 1132–1138. [Google Scholar] [CrossRef]
- Wu, J.; Huang, J.; Han, X.; Gao, X.; He, F.; Jiang, M.; Jiang, Z.; Primack, R.B.; Shen, Z. The three gorges dam: An ecological perspective. Front. Ecol. Environ. 2004, 2, 241–248. [Google Scholar] [CrossRef]
- Meyer, W.B.; Meyer, W.B.; BL Turner, I. Changes in Land Use And Land Cover: A Global Perspective; Cambridge University Press: Cambridge, UK, 1994; Volume 4. [Google Scholar]
- Pabi, O. Understanding land-use/cover change process for land and environmental resources use management policy in Ghana. GeoJournal 2007, 68, 369–383. [Google Scholar] [CrossRef]
- Gong, P.; Wang, J.; Yu, L.; Zhao, Y.; Zhao, Y.; Liang, L.; Niu, Z.; Huang, X.; Fu, H.; Liu, S.; et al. Finer resolution observation and monitoring of global land cover: First mapping results with Landsat TM and ETM+ data. Int. J. Remote. Sens. 2013, 34, 2607–2654. [Google Scholar] [CrossRef]
- Mora, B.; Tsendbazar, N.E.; Herold, M.; Arino, O. Global land cover mapping: Current status and future trends. In Land Use and Land Cover Mapping in Europe; Springer: Berlin/Heidelberg, Germany, 2014; pp. 11–30. [Google Scholar]
- Zhang, L.; Li, X.; Yuan, Q.; Liu, Y. Object-based approach to national land cover mapping using HJ satellite imagery. J. Appl. Remote. Sens. 2014, 8, 083686. [Google Scholar] [CrossRef]
- Zhang, X.; Han, L.; Han, L.; Zhu, L. How well do deep learning-based methods for land cover classification and object detection perform on high resolution remote sensing imagery? Remote. Sens. 2020, 12, 417. [Google Scholar] [CrossRef]
- Schowengerdt, R.A. Remote Sensing: Models and Methods for Image Processing; Elsevier: Amsterdam, The Netherlands, 2006. [Google Scholar]
- Yu, L.; Liang, L.; Wang, J.; Zhao, Y.; Cheng, Q.; Hu, L.; Liu, S.; Yu, L.; Wang, X.; Zhu, P.; et al. Meta-discoveries from a synthesis of satellite-based land-cover mapping research. Int. J. Remote. Sens. 2014, 35, 4573–4588. [Google Scholar] [CrossRef]
- Friedl, M.A.; Brodley, C.E. Decision tree classification of land cover from remotely sensed data. Remote. Sens. Environ. 1997, 61, 399–409. [Google Scholar] [CrossRef]
- Chasmer, L.; Hopkinson, C.; Veness, T.; Quinton, W.; Baltzer, J. A decision-tree classification for low-lying complex land cover types within the zone of discontinuous permafrost. Remote. Sens. Environ. 2014, 143, 73–84. [Google Scholar] [CrossRef]
- Hua, L.; Zhang, X.; Chen, X.; Yin, K.; Tang, L. A feature-based approach of decision tree classification to map time series urban land use and land cover with Landsat 5 TM and Landsat 8 OLI in a Coastal City, China. ISPRS Int. J. Geo-Inf. 2017, 6, 331. [Google Scholar] [CrossRef]
- Melgani, F.; Bruzzone, L. Classification of hyperspectral remote sensing images with support vector machines. IEEE Trans. Geosci. Remote. Sens. 2004, 42, 1778–1790. [Google Scholar] [CrossRef]
- Munoz-Marí, J.; Bovolo, F.; Gómez-Chova, L.; Bruzzone, L.; Camp-Valls, G. Semisupervised one-class support vector machines for classification of remote sensing data. IEEE Trans. Geosci. Remote. Sens. 2010, 48, 3188–3197. [Google Scholar] [CrossRef]
- Mountrakis, G.; Im, J.; Ogole, C. Support vector machines in remote sensing: A review. ISPRS J. Photogramm. Remote. Sens. 2011, 66, 247–259. [Google Scholar] [CrossRef]
- Belgiu, M.; Drăguţ, L. Random forest in remote sensing: A review of applications and future directions. ISPRS J. Photogramm. Remote. Sens. 2016, 114, 24–31. [Google Scholar] [CrossRef]
- Khatami, R.; Mountrakis, G.; Stehman, S.V. A meta-analysis of remote sensing research on supervised pixel-based land-cover image classification processes: General guidelines for practitioners and future research. Remote. Sens. Environ. 2016, 177, 89–100. [Google Scholar] [CrossRef]
- Jimenez-Rodriguez, L.O.; Rivera-Medina, J. Integration of spatial and spectral information in unsupervised classification for multispectral and hyperspectral data. In Image and Signal Processing for Remote Sensing V; International Society for Optics and Photonics: Bellingham, WA, USA, 1999; Volume 3871, pp. 24–33. [Google Scholar]
- Chen, Y.; Lin, Z.; Zhao, X.; Wang, G.; Gu, Y. Deep learning-based classification of hyperspectral data. IEEE J. Sel. Top. Appl. Earth Obs. Remote. Sens. 2014, 7, 2094–2107. [Google Scholar] [CrossRef]
- Huang, X.; Zhang, L. A multilevel decision fusion approach for urban mapping using very high-resolution multi/hyperspectral imagery. Int. J. Remote. Sens. 2012, 33, 3354–3372. [Google Scholar] [CrossRef]
- Chan, R.H.; Ho, C.W.; Nikolova, M. Salt-and-pepper noise removal by median-type noise detectors and detail-preserving regularization. IEEE Trans. Image Process. 2005, 14, 1479–1485. [Google Scholar] [CrossRef] [PubMed]
- Blaschke, T. Object based image analysis for remote sensing. ISPRS J. Photogramm. Remote. Sens. 2010, 65, 2–16. [Google Scholar] [CrossRef]
- Xiaoying, D. The application of ecognition in land use projects. Geomat. Spat. Inf. Technol. 2005, 28, 116–120. [Google Scholar]
- Burnett, C.; Blaschke, T. A multi-scale segmentation/object relationship modelling methodology for landscape analysis. Ecol. Model. 2003, 168, 233–249. [Google Scholar] [CrossRef]
- Benz, U.C.; Hofmann, P.; Willhauck, G.; Lingenfelder, I.; Heynen, M. Multi-resolution, object-oriented fuzzy analysis of remote sensing data for GIS-ready information. ISPRS J. Photogramm. Remote. Sens. 2004, 58, 239–258. [Google Scholar] [CrossRef]
- Tilton, J.C. Image segmentation by region growing and spectral clustering with a natural convergence criterion. In Proceedings of the IGARSS’98-Sensing and Managing the Environment-1998 IEEE International Geoscience and Remote Sensing, Symposium Proceedings (Cat. No. 98CH36174), Seattle, WA, USA, 6–10 July 1998; Volume 4, pp. 1766–1768. [Google Scholar]
- Tian, J.; Chen, D.M. Optimization in multi-scale segmentation of high-resolution satellite images for artificial feature recognition. Int. J. Remote. Sens. 2007, 28, 4625–4644. [Google Scholar] [CrossRef]
- Roerdink, J.B.; Meijster, A. The watershed transform: Definitions, algorithms and parallelization strategies. Fundam. Inform. 2000, 41, 187–228. [Google Scholar] [CrossRef]
- Audebert, N.; Le Saux, B.; Lefèvre, S. Semantic segmentation of earth observation data using multimodal and multi-scale deep networks. In Proceedings of the Asian Conference on Computer Vision, Taipei, Taiwan, 20–24 November 2016; pp. 180–196. [Google Scholar]
- Long, J.; Shelhamer, E.; Darrell, T. Fully convolutional networks for semantic segmentation. In Proceedings of the IEEE Conference on Computer Vision and Pattern Recognition, Boston, MA, USA, 7–12 June 2015; pp. 3431–3440. [Google Scholar]
- Badrinarayanan, V.; Handa, A.; Cipolla, R. Segnet: A Deep Convolutional Encoder-Decoder Architecture for Robust Semantic Pixel-Wise Labelling. arXiv 2015, arXiv:1505.07293. [Google Scholar]
- Ronneberger, O.; Fischer, P.; Brox, T. U-net: Convolutional networks for biomedical image segmentation. In Proceedings of the International Conference on Medical Image Computing and Computer-Assisted Intervention, Munich, Germany, 5–9 October 2015; pp. 234–241. [Google Scholar]
- Jégou, S.; Drozdzal, M.; Vazquez, D.; Romero, A.; Bengio, Y. The one hundred layers tiramisu: Fully convolutional densenets for semantic segmentation. In Proceedings of the IEEE Conference on Computer Vision and Pattern Recognition Workshops, Honolulu, HI, USA, 21–26 July 2017; pp. 11–19. [Google Scholar]
- Paszke, A.; Chaurasia, A.; Kim, S.; Culurciello, E. Enet: A Deep Neural Network Architecture for Real-Time Semantic Segmentation. arXiv 2016, arXiv:1606.02147. [Google Scholar]
- Chaurasia, A.; Culurciello, E. Linknet: Exploiting encoder representations for efficient semantic segmentation. In Proceedings of the 2017 IEEE Visual Communications and Image Processing (VCIP), St. Petersburg, FL, USA, 10–13 December 2017; pp. 1–4. [Google Scholar]
- Lin, G.; Milan, A.; Shen, C.; Reid, I. Refinenet: Multi-path refinement networks for high-resolution semantic segmentation. In Proceedings of the IEEE Conference on Computer Vision and Pattern Recognition, Honolulu, HI, USA, 21–26 July 2017; pp. 1925–1934. [Google Scholar]
- Zhao, H.; Shi, J.; Qi, X.; Wang, X.; Jia, J. Pyramid scene parsing network. In Proceedings of the IEEE Conference on Computer Vision and Pattern Recognition, Honolulu, HI, USA, 21–26 July 2017; pp. 2881–2890. [Google Scholar]
- Rouse, J.W.; Haas, R.H.; Schell, J.A.; Deering, D.W.; Harlan, J.C. Monitoring the Vernal Advancement and Retrogradation (Green Wave Effect) of Natural Vegetation; NASA/GSFC Type III Final Report; NASA: Greenbelt, MD, USA, 1974; Volume 371.
- Huete, A.R. A soil-adjusted vegetation index (SAVI). Remote. Sens. Environ. 1988, 25, 295–309. [Google Scholar] [CrossRef]
- Gao, B.C. NDWI—A normalized difference water index for remote sensing of vegetation liquid water from space. Remote. Sens. Environ. 1996, 58, 257–266. [Google Scholar] [CrossRef]
- De Sousa, C.; Souza, C.; Zanella, L.; De Carvalho, L. Analysis of RapidEye’s Red edge band for image segmentation and classification. In Proceedings of the 4th GEOBIA, Rio de Janeiro, Brazil, 7–9 May 2012; Volume 79, pp. 7–9. [Google Scholar]
- Kotchenova, S.Y.; Vermote, E.F.; Levy, R.; Lyapustin, A. Radiative transfer codes for atmospheric correction and aerosol retrieval: Intercomparison study. Appl. Opt. 2008, 47, 2215–2226. [Google Scholar] [CrossRef] [PubMed]
- Benediktsson, J.A.; Swain, P.H.; Ersoy, O.K. Neural Network Approaches Versus Statistical Methods in Classification of Multisource Remote Sensing Data. IEEE Trans. Geosci. Remote. Sens. 1990, 28, 540–552. [Google Scholar] [CrossRef]
- Farr, T.G.; Rosen, P.A.; Caro, E.; Crippen, R.; Duren, R.; Hensley, S.; Kobrick, M.; Paller, M.; Rodriguez, E.; Roth, L.; et al. The shuttle radar topography mission. Rev. Geophys. 2007, 45. [Google Scholar] [CrossRef]
- Burrough, P.A.; McDonnell, R.; McDonnell, R.A.; Lloyd, C.D. Principles of Geographical Information Systems; Oxford University Press: Oxford, UK, 2015. [Google Scholar]
- Fonarow, G.C.; Adams, K.F.; Abraham, W.T.; Yancy, C.W.; Boscardin, W.J.; ADHERE Scientific Advisory Committee. Risk stratification for in-hospital mortality in acutely decompensated heart failure: Classification and regression tree analysis. JAMA 2005, 293, 572–580. [Google Scholar] [CrossRef] [PubMed]
- Gao, W.; Zeng, Y.; Zhao, D.; Wu, B.; Ren, Z. Land Cover Changes and Drivers in the Water Source Area of the Middle Route of the South-to-North Water Diversion Project in China from 2000 to 2015. Chin. Geogr. Sci. 2020, 30, 115–126. [Google Scholar] [CrossRef]
- Zhang, X.; Wu, B.; Zhang, M.; Zeng, H. Mapping rice extent map with crop intensity in south China through integration of optical and microwave images based on google earth engine. In Proceedings of the AGU Fall Meeting, Washington, DC, USA, 11–15 December 2017; Volume 2017, p. B51C-1812. [Google Scholar]
- GVG—Apps on Google Play. Available online: https://play.google.com/store/apps/details?id=com.sysapk.gvg&hl=en_GB&gl=US (accessed on 28 December 2020).
- Xu, B.; Wang, N.; Chen, T.; Li, M. Empirical evaluation of rectified activations in convolutional network. arXiv 2015, arXiv:1505.00853. [Google Scholar]
- Ioffe, S.; Szegedy, C. Batch normalization: Accelerating deep network training by reducing internal covariate shift. In Proceedings of the International Conference on Machine Learning, Lille, France, 6–11 July 2015; pp. 448–456. [Google Scholar]
- Richards, J.A.; Richards, J. Remote Sensing Digital Image Analysis; Springer: Berlin/Heidelberg, Germany, 1999; Volume 3. [Google Scholar]
- Krizhevsky, A.; Sutskever, I.; Hinton, G.E. Imagenet classification with deep convolutional neural networks. Adv. Neural Inf. Process. Syst. 2012, 25, 1097–1105. [Google Scholar] [CrossRef]
- Pedregosa, F.; Varoquaux, G.; Gramfort, A.; Michel, V.; Thirion, B.; Grisel, O.; Blondel, M.; Prettenhofer, P.; Weiss, R.; Dubourg, V.; et al. Scikit-learn: Machine learning in Python. J. Mach. Learn. Res. 2011, 12, 2825–2830. [Google Scholar]
- Happ, P.; Ferreira, R.S.; Bentes, C.; Costa, G.; Feitosa, R.Q. Multiresolution segmentation: A parallel approach for high resolution image segmentation in multicore architectures. Int. Arch. Photogramm. Remote. Sens. Spat. Inf. Sci. 2010, 38, C7. [Google Scholar]
Publisher’s Note: MDPI stays neutral with regard to jurisdictional claims in published maps and institutional affiliations. |
© 2021 by the authors. Licensee MDPI, Basel, Switzerland. This article is an open access article distributed under the terms and conditions of the Creative Commons Attribution (CC BY) license (http://creativecommons.org/licenses/by/4.0/).