Article

Earthquake Damage Region Detection by Multitemporal Coherence Map Analysis of Radar and Multispectral Imagery

by
Mahdi Hasanlou
1,*,
Reza Shah-Hosseini
1,
Seyd Teymoor Seydi
1,
Sadra Karimzadeh
2,3,4 and
Masashi Matsuoka
4
1
School of Surveying and Geospatial Engineering, College of Engineering, University of Tehran, Tehran 1439957131, Iran
2
Department of Remote Sensing and GIS, University of Tabriz, Tabriz 5166616471, Iran
3
Institute of Environment, University of Tabriz, Tabriz 5166616471, Iran
4
Department of Architecture and Building Engineering, Tokyo Institute of Technology, Yokohama 226-8502, Japan
*
Author to whom correspondence should be addressed.
Remote Sens. 2021, 13(6), 1195; https://doi.org/10.3390/rs13061195
Submission received: 26 January 2021 / Revised: 16 March 2021 / Accepted: 17 March 2021 / Published: 20 March 2021

Abstract

:
Earth, as humans’ habitat, is constantly affected by natural events, such as floods, earthquakes, thunder, and drought among which earthquakes are considered one of the deadliest and most catastrophic natural disasters. The Iran-Iraq earthquake occurred in Kermanshah Province, Iran in November 2017. It was a 7.4-magnitude seismic event that caused immense damages and loss of life. The rapid detection of damages caused by earthquakes is of great importance for disaster management. Thanks to their wide coverage, high resolution, and low cost, remote-sensing images play an important role in environmental monitoring. This study presents a new damage detection method at the unsupervised level, using multitemporal optical and radar images acquired through Sentinel imagery. The proposed method is applied in two main phases: (1) automatic built-up extraction using spectral indices and active learning framework on Sentinel-2 imagery; (2) damage detection based on the multitemporal coherence map clustering and similarity measure analysis using Sentinel-1 imagery. The main advantage of the proposed method is that it is an unsupervised method with simple usage, a low computing burden, and using medium spatial resolution imagery that has good temporal resolution and is operative at any time and in any atmospheric conditions, with high accuracy for detecting deformations in buildings. The accuracy analysis of the proposed method found it visually and numerically comparable to other state-of-the-art methods for built-up area detection. The proposed method is capable of detecting built-up areas with an accuracy of more than 96% and a kappa of about 0.89 in overall comparison to other methods. Furthermore, the proposed method is also able to detect damaged regions compared to other state-of-the-art damage detection methods with an accuracy of more than 70%.

Graphical Abstract

1. Introduction

Earth is constantly undergoing dynamic processes such as natural disasters as well as anthropogenic changes to Earth’s surface [1,2,3]. Natural disasters, in particular, are a growing concern worldwide that threatens the lives of a large population [4,5,6]. Among the various types of natural disasters, the earthquake is considered one of the deadliest and most catastrophic ones [7,8]. Earthquakes potentially cause massive loss of life and property damage, especially in urban areas, and damage assessment is one of the critical problems after each of such disasters [9,10,11,12,13,14]. Tracking the evolution of damage in earthquake areas and determining the damage level is vital, as they can help direct rescue teams to the most critical sites [6]. Additionally, such data provide highly important information for reconstruction operations, restorations of facilities, and repair of critical lines [11].
The processing of satellite remote sensing imagery is a tool that continuously provides valuable information about Earth, on a large scale, with minimum time and cost, and over long periods of time [15]. During recent years, the development of remote sensing satellites has allowed researchers to widely employ multitemporal image datasets with high spectral, spatial, and temporal resolutions [16,17]. Such techniques play a key role in environmental monitoring in many applications, especially in damage assessment [18,19,20,21].
Recently, there is a tremendous interest by researchers in producing damage maps using remote sensing imagery, and many methods have been proposed for damage assessment [22,23,24]. These methods generally focus on optical high-resolution imagery. Although many research efforts have proposed a number of damage detection algorithms and applied them to optical high-resolution imagery and LiDAR data, many limitations remain, such as: (1) some of these methods are based on change detection and classification methods that require training data and prior knowledge or ground truth [25]; (2) the high-resolution remote sensing imagery has a low spectral resolution and sometimes, due to some conditions, the pre-event imagery is unavailable [26,27]; (3) the high-resolution imagery suffers from low spectral resolution, so the detection of damaged areas becomes exceedingly difficult and/or suffers from a high false alarm rate due to, e.g., the shadows of buildings; (4) a separation between damage and shadows using high-resolution imagery is extraordinarily difficult; (5) the high-resolution imagery covers a low scale area and has more commercial aspects; (6) the building subsidence is not detected by optical data, unless a hole happens to open in the roof while the SAR (Synthetic Aperture Radar) imagery is being recorded (Figure 1) [7,10]; and (7) optical data are often limited by cloud cover.
Airborne LiDAR systems, on the other hand, allow for the fast and extensive acquisition of precise height (altitude) data which can be used to detect some specific damage types [8]. Damage detection based on LiDAR data and a subsequent fusion with further optical data could improve the performance of damage detection, albeit with numerous limitations: (1) LiDAR data acquired by an airborne system does not cover all areas, and limitations are resulting from permission. (2) The problem of pre-event data availability persists.
Recently, the use of radar imagery for damage detection has been considered by researchers and much research has been presented [10,14,24,28,29,30,31,32,33,34,35,36]. They were focused mainly on the indexing of two temporal datasets, ignoring many factors such as the effects of noise and vegetation on the coherency products.
Based on these issues, it is necessary to resolve the aforementioned problems in order to achieve practicable damage detection. In that respect, this research proposes a novel damage detection method based on both optical and SAR imagery in an unsupervised framework with the following properties: (1) extraction of urban areas in an unsupervised framework, (2) detecting damaged areas and classifying them according to different levels based on the coherence spectral signature, (3) an unsupervised damage detection algorithm with no need for the initial parameter setting, (4) easy implementation with low computational complexity, (5) using free-access optical (Sentinel-2) and SAR (Sentinel-1) imagery with medium spatial resolution and good temporal resolution (with the latter having small sensitivity with respect to clouds and light rain and the capability of being operated by day and by night).

2. Study Area and Datasets
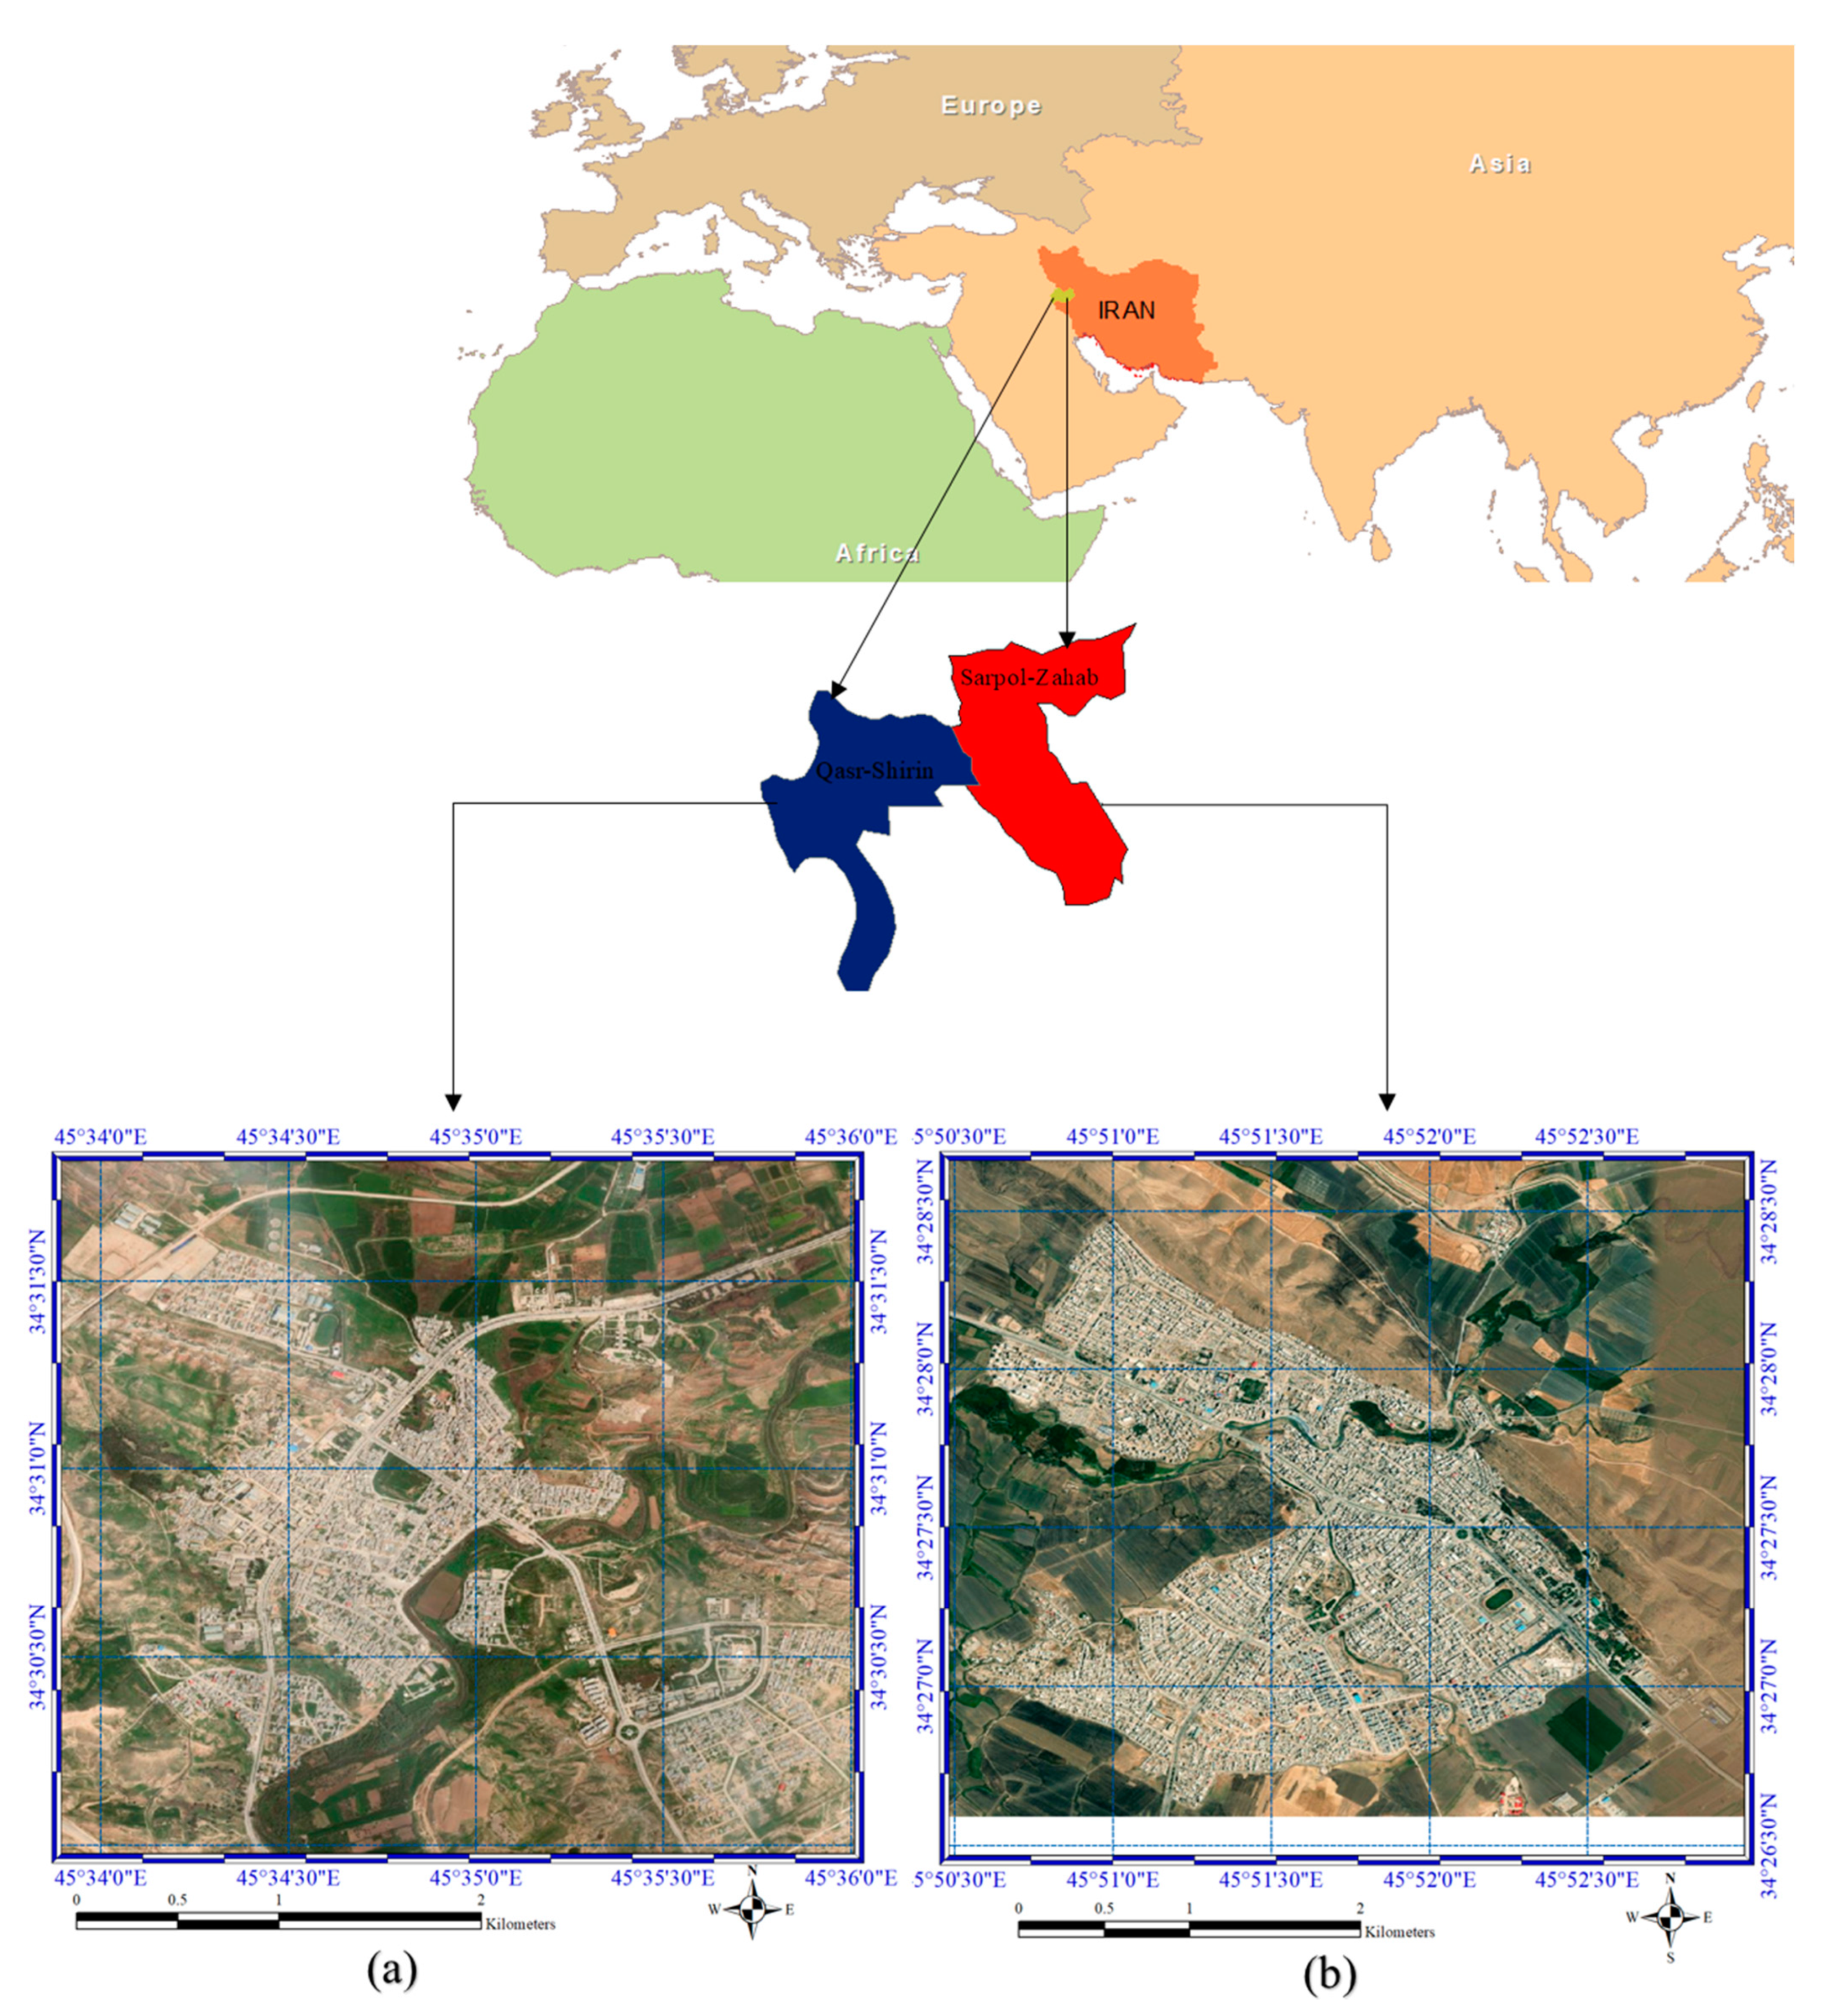
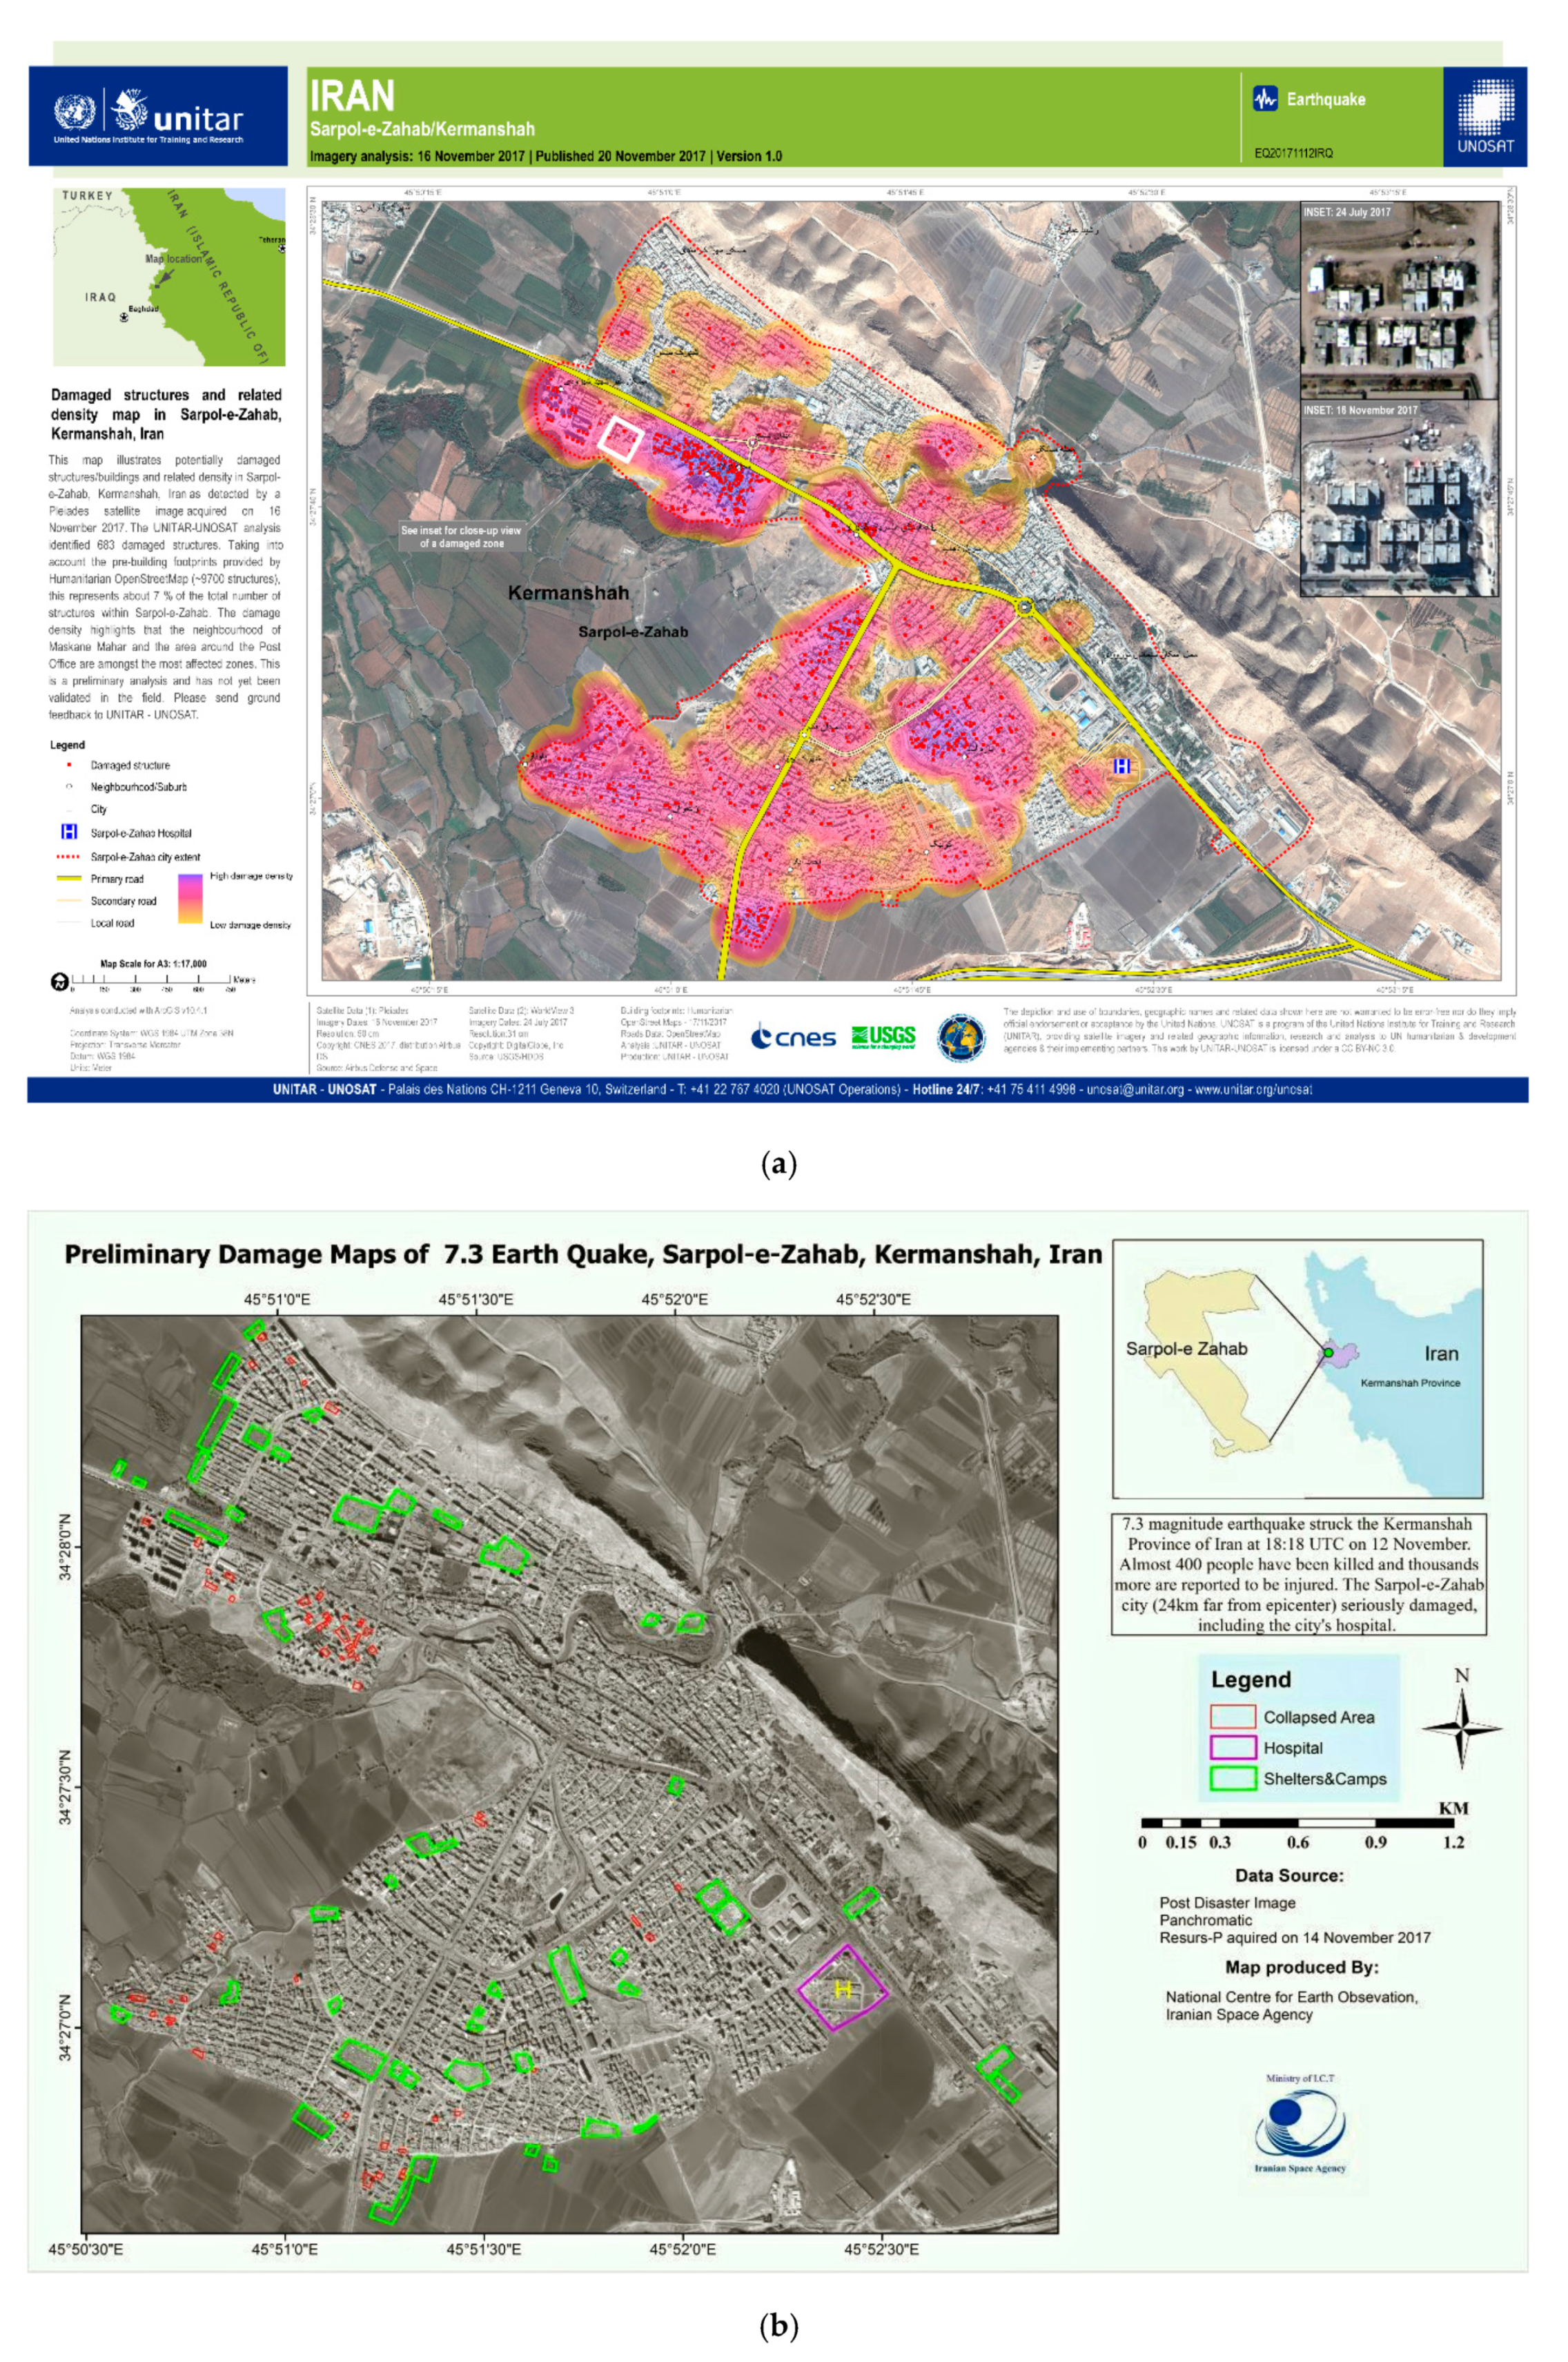
The study areas are located in Kermanshah Province in western Iran. Several satellites with optical sensors and/or SAR observed the Sarpol-Zahab and Qasr-Shirin areas before and after the Iran-Iraq earthquake on 12 October 2017. To evaluate the performance of the proposed method and assess the accuracy of the results, a ground truth map is required. The ground truth for built-up areas is obtained by the visual analysis of the optical Sentinel imagery by an expert, and, additionally, detailed visual comparison imagery available in the Google Earth platform. For evaluation of multiple damage map, sample region is selected for Sarpol-Zahab case study (Figure 2b). The damage map is created using maps generated by the Iranian space agency and field visits. All these datasets can be found on the University of Tehran’s Remote Sensing Laboratory website (rslab.ut.ac.ir, accessed on 18 March 2021)).

2.1. Case Study

Qasr-Shirin is a county in Kermanshah Province in western Iran. It is located at coordinates between 34°29′ and 34°30′ N and 45°33′ and 45°36′ E. The extent of the studied region, as extracted from Sentinel-1 satellite imagery, was 295 × 341 pixels. In this area, we incorporated four multitemporal datasets acquired on 30 October, 11 November, 17 November, and 5 December 2017. The optical remote sensing dataset was acquired on 5 November 2017 by Sentinel-2. Figure 2b shows the optical Sentinel-2 image for Qasr-Shirin county.
The ground truth Sarpol-Zahab is also a county in Kermanshah Province in western Iran. It is located at coordinates between 34°26′ and 34°28′ N and 45°50′ and 45°52′ E. The extent of the studied region, as extracted from Sentinel-1 satellite imagery, was 403 × 345 pixels. In this area, we incorporated four multitemporal datasets acquired on 30 October, 11 November, 17 November, and 5 December 2017. The optical remote sensing dataset was acquired on 5 November 2017 by Sentinel-2. Figure 2a shows the optical Sentinel-2 image for Sarpol-Zahab county.
Sentinel-1 is a constellation of two satellites (1A and 1B) operating in the C-band. Sentinel-2 delivers 13 spectral bands with wide spectral coverage over the visible, near-infrared (NIR), and Shortwave-Infrared (SWIR) domains at different spatial resolutions from 10 m to 60 m. These datasets are freely available at Sentinel Scientific Data Hub (https://scihub.copernicus.eu, accessed on 18 March 2021).
All maps are presented in a reference geographic coordinate system of the World Geodetic System 1984 (WGS 1984). The spatial resolution of optical and SAR datasets is 10 (m) for both case studies.

2.2. Reference Data for the Damaged Area and Accuracy Assessment
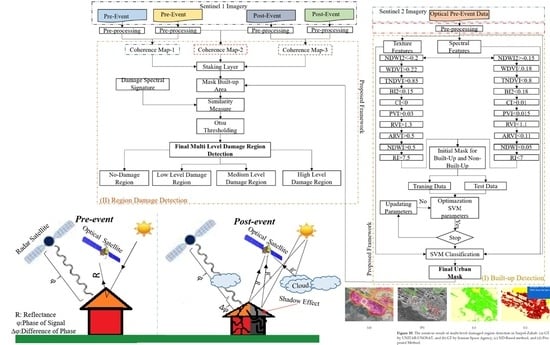
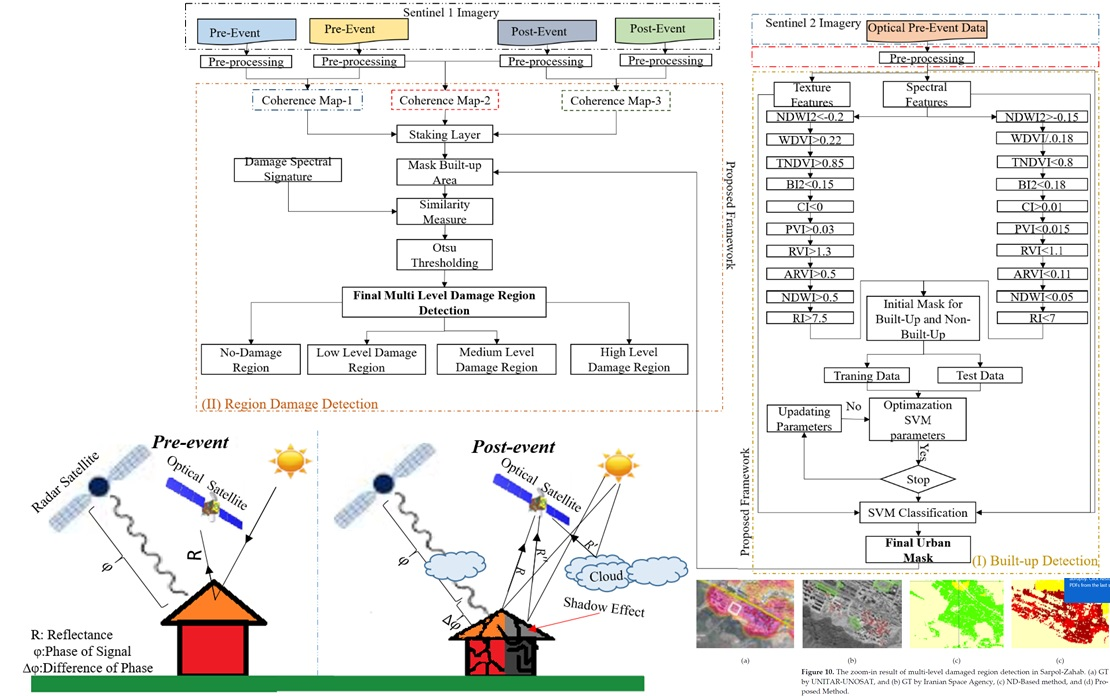
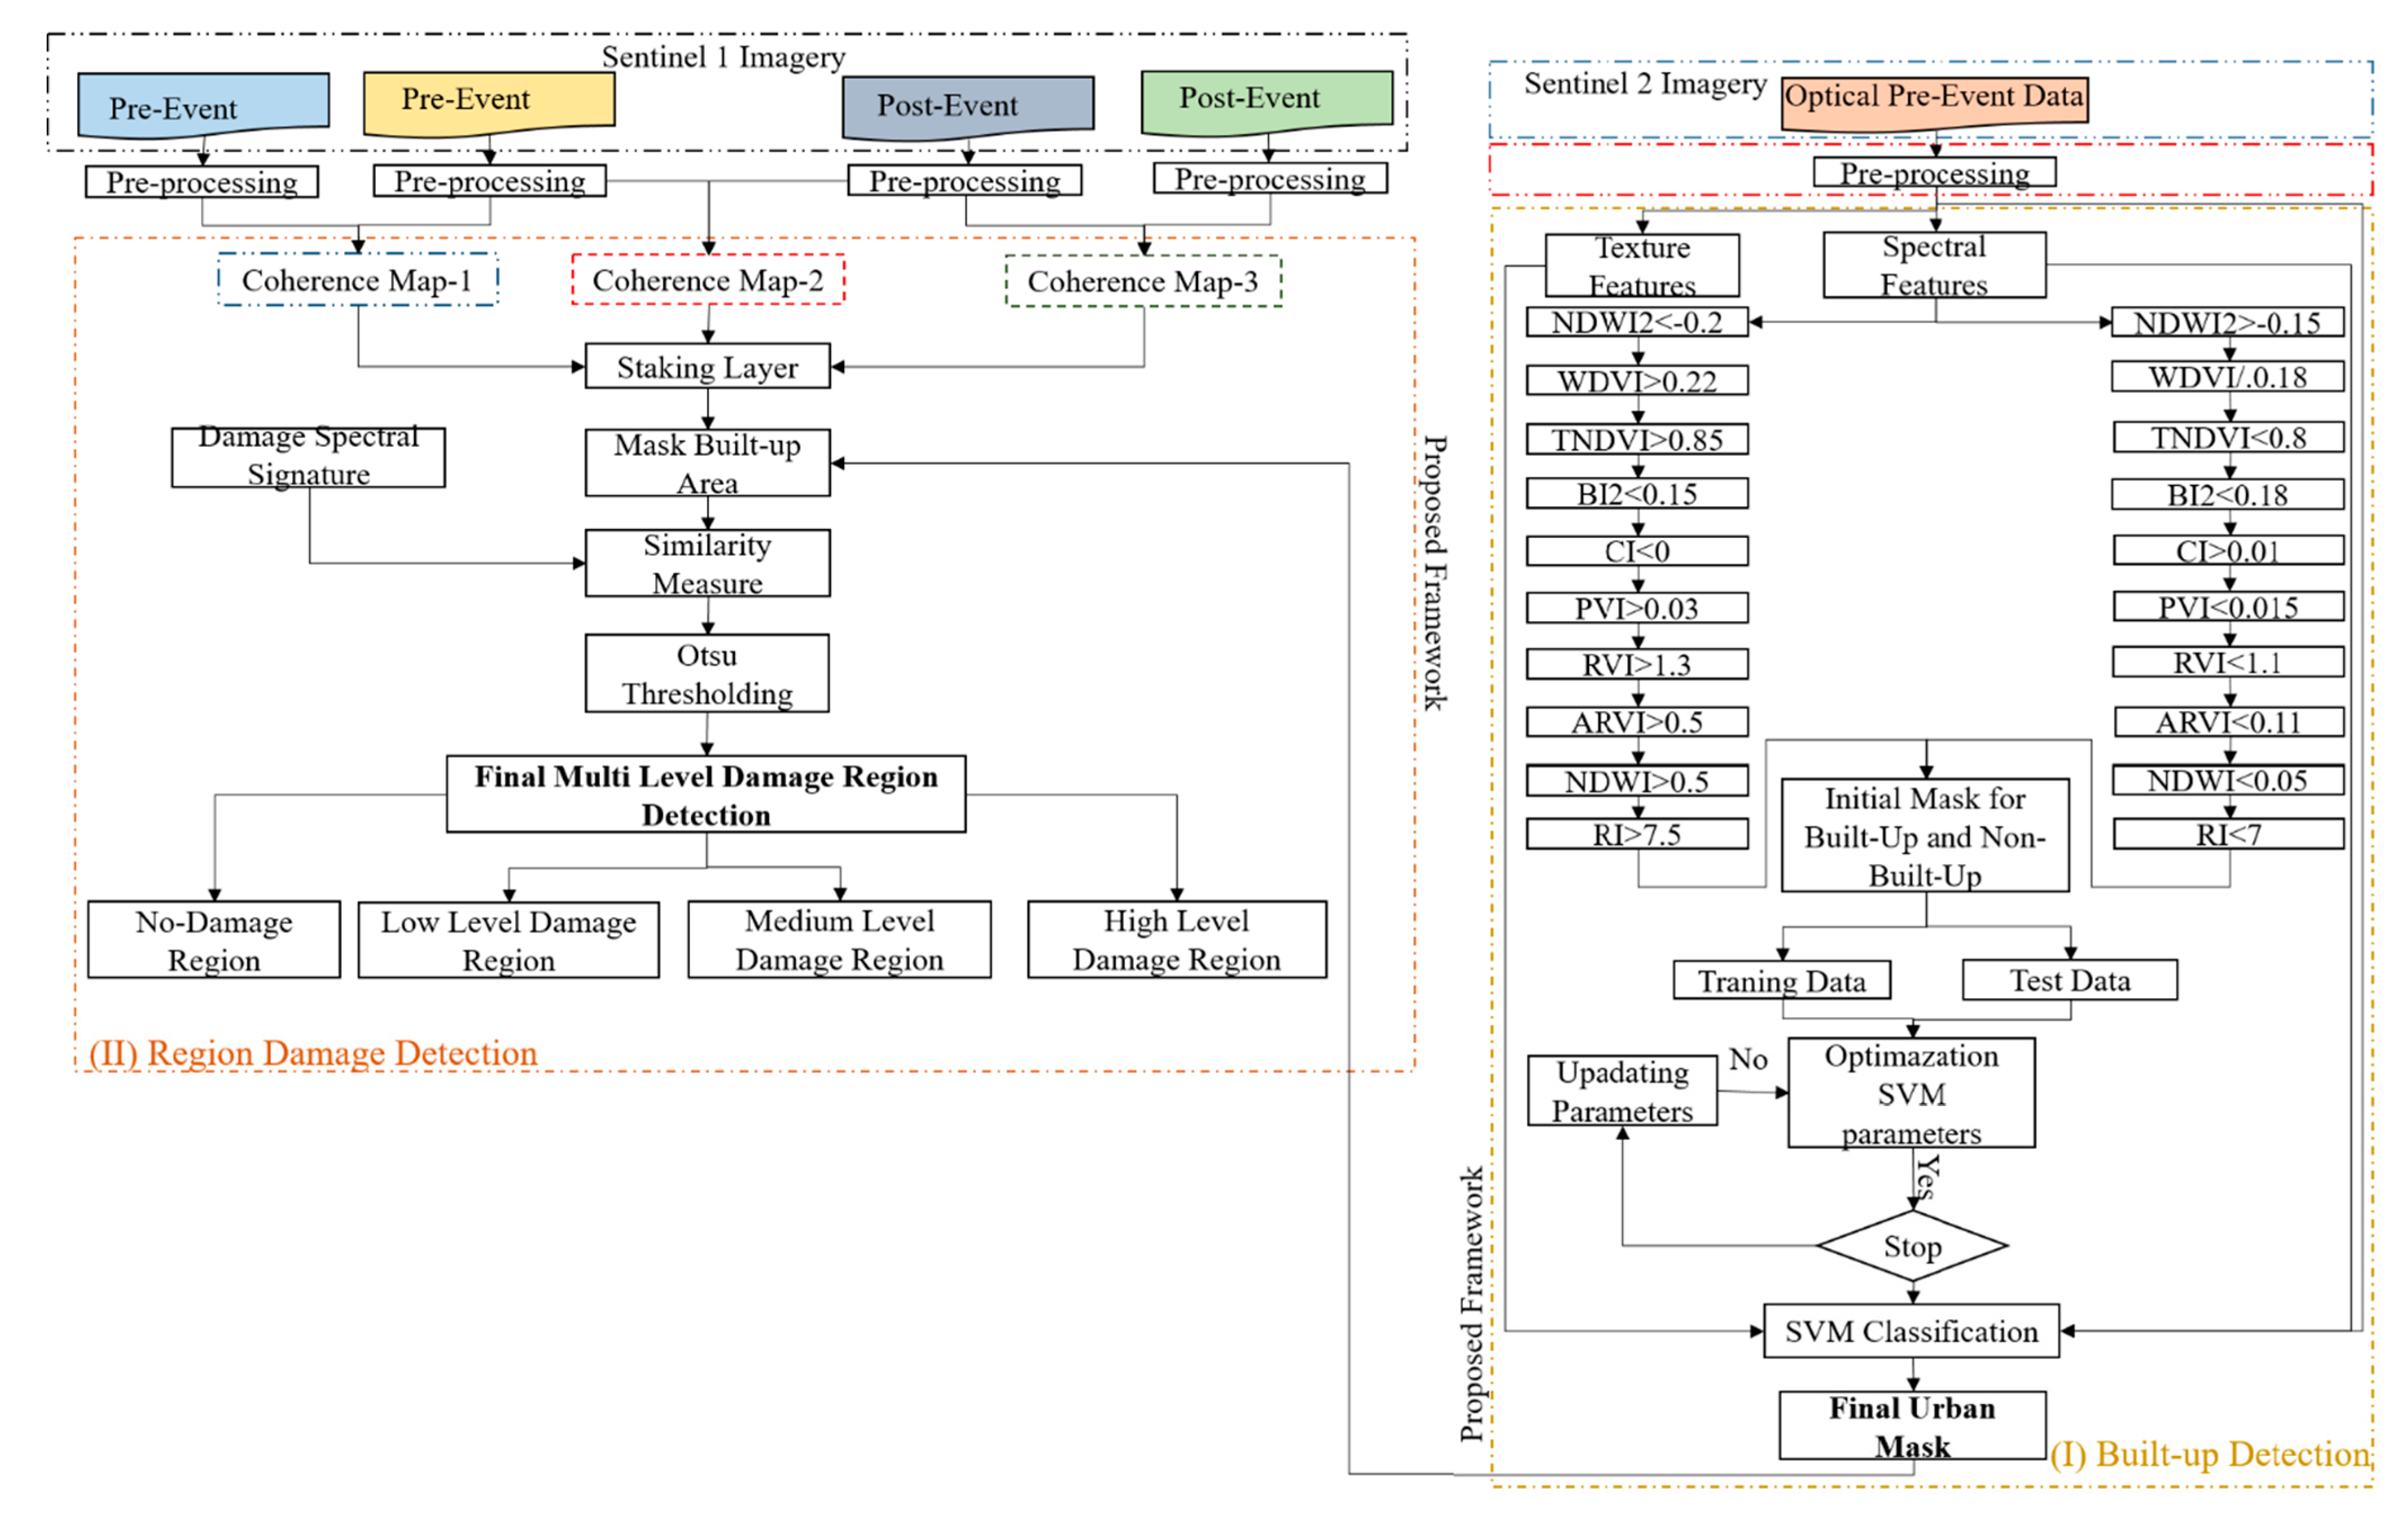
This research used two ground truths presented by international agencies. The first ground truth was made by UNITAR-UNOSAT and it is available on this website (https://unitar.org/unosat/, accessed on 18 March 2021). In addition, the second ground truth was made by the Iranian space agency and it is available on the website (https://isa.ir/, accessed on 18 March 2021). Figure 3 presents some reference maps for Sarpol-Zahab that are obtained from some national agencies.
The first analysis relied on visual analysis and the second one on numerical analysis which is defined by a confusion matrix containing four components of true positive, true negative, false positive, and false negative (Table 1).
The result of built-up area detection was compared with the ground truth data by calculating several most common accuracy assessment indices. Table 2 provides the equations of these indices including the overall accuracy (OA), miss-detection (MD), F1-score, balanced error (BE), false rate (FAR), and Kappa coefficient (KC).

3. Methodology

This section considers the proposed method in more detail, particularly regarding its combination with optical and radar imagery for detecting built-up and damaged areas.
The proposed method consists of two main steps after preprocessing (Figure 4). Step (1) is the extraction of man-made objects using spectral indices and an unsupervised learning framework. Step (2) is the estimation of the coherence map and damage region detection using the SAM algorithm and automatic thresholding.

3.1. Preprocessing

In this study, the optical Sentinel-2 and SAR Sentinel-1 datasets were used. Data preprocessing plays an important role before the beginning of the main process. Pre-processing is different for optical and radar Sentinel datasets. The optical Sentinel-2 data have good quality and only need atmospheric correction done to transform TOA reflectance to BOA reflectance via algorithms developed by DLR/Telespazio [37].
The preprocessing steps for radar data include thermal noise removal, radiometric calibration, and despeckling. All preprocessing operations were accomplished using the Sentinel toolbox, a free and open-source software (https://sentinel.esa.int/web/sentinel/toolboxes, accessed on 18 March 2021).

3.2. Phase 1: Built-Up Area Detection

The main purpose of this phase is to extract man-made objects from the imagery obtained from Sentinel-2 satellite data. This step is applied in two main phases by active learning procedure. The first step is feature extraction which is conducted by spatial and spectral features.
The spectral and spatial features are extracted by spectral indices and Grey Level Co-occurrence Matrices (GLCM). The second step is the pseudo sample generation in which sample data is gathered in two groups (man-made areas and other targets), extracted by considering a hard threshold for the indices.

3.2.1. Spectral/Spatial Feature Extraction

The spectral band indices are the most common spectral transformations used widely in remote sensing analysis [38]. The main purpose of these indices is to make some features more discernible compared to the original data based on a pixel-to-pixel operation, creating new values for individual pixels according to some predefined settings. The main purpose of using these indices is to extract built-up areas by eliminating other objects such as vegetation, water, and bare soil as they are predicted by spectral indices. This research used ten spectral indices (Table 3).
The spatial features can also improve the classification results. One of the most important spatial features is texture features that are widely used in the classification of remote sensing datasets. Texture features consider the relations between individual pixels and their neighboring pixels and provide informative features [39]. Different features, such as homogeneity, entropy, and size uniformity can be generated by texture analysis. In this study, 7 texture features were generated from the Grey Level Co-occurrence Matrices (GLCM) [39]. Table 4 presents various types of texture features originated from the GLCM matrix.
In this research, three visible bands such as Green, Blue, and Red were combined based on Equation (1) to be converted into panchromatic data. Then, the texture features are extracted by the generated band [15].
B pan = 0.2989 × B 4 + 0.5870 × B 3 + 0.1140 × B 2
where B pan is the panchromatic band; B 2 , B 3 , and B 4 are the blue, green, and red bands, respectively. The window size for texture analysis was set to 3 × 3.

3.2.2. Pseudo Sample Generation and Classification

In this phase, built-up areas are detected by an active learning framework. To this end, after feature extraction, several spectral indices are used to designate vegetation, water, and soil. The main challenge lies with the extraction of man-made areas by finding the optimum threshold on indices. To remove it, this research proposes a novel framework able to extract man-made objects with high accuracy. The hard threshold is applied on spectral indices to generate sample data in two classes (built-up area and nonbuilt-up area). After finding the location of pseudo sample data, spatial and spectral features are generated. The spatial and spectral bands are stacked to apply the next step. The generated sample data is divided into two parts: (1) training data and (2) testing data. The second step then follows, i.e., optimizing Support Vector Machine (SVM) parameters (penalty and kernel parameter) and binary classifications. After finding the optimum values of SVM parameters, the optimum model is built and the stacked spatial and spectral bands are classified into two classes.

3.2.3. SVM Classifier

The SVM is a supervised machine learning algorithm commonly used for classification purposes. It is based on statistical learning theory. The main idea behind SVM is to find a hyperplane that maximizes the margin between two classes [40]. The SVM classifier has two parameters: kernel parameters and penalty coefficient. For our study, we used the radial basis function (RBF) kernel, which is widely utilized in the remote sensing community [41,42]. These parameters are needed for optimization, and their optimum values are obtained by a grid search algorithm [15].

3.3. Phase 2: Damaged Region Mapping

The main purpose of this step is to detect damaged regions using a time series of the coherence map, i.e., pre- and postearthquake data. Preprocessing is applied to Sentinel-1 SAR imagery, and then a coherence map is estimated for pair imageries in the time series. These coherence maps relate pair images to pre-event images, pre-event to postevent images, and pair images to postevent images.
After the extraction of man-made areas and the masking of other objects on the coherence map, the SAM algorithm is used to measure the similarity values between the reference signature and the target signature. The reference signature (damage pixel) can be either low coherence or high coherence. The low-value pixel in the coherence map is known as “low coherence” and the high-value pixel in the coherence map can be considered “high coherence”. This means that each pixel showing behavior similar to the reference pixel can be considered a damaged pixel. Next, the Otsu Algorithm is used to determine the damage level and to detect no-damage areas. To achieve this, the Otsu Algorithm is applied using four different classes. The first class has the lowest similarity, which means it corresponds to the no-damage class. The second class represents the low-level damage region. The third class is related to the destruction of the moderate level damage region, and the fourth class signifies the complete destruction of the building regions.

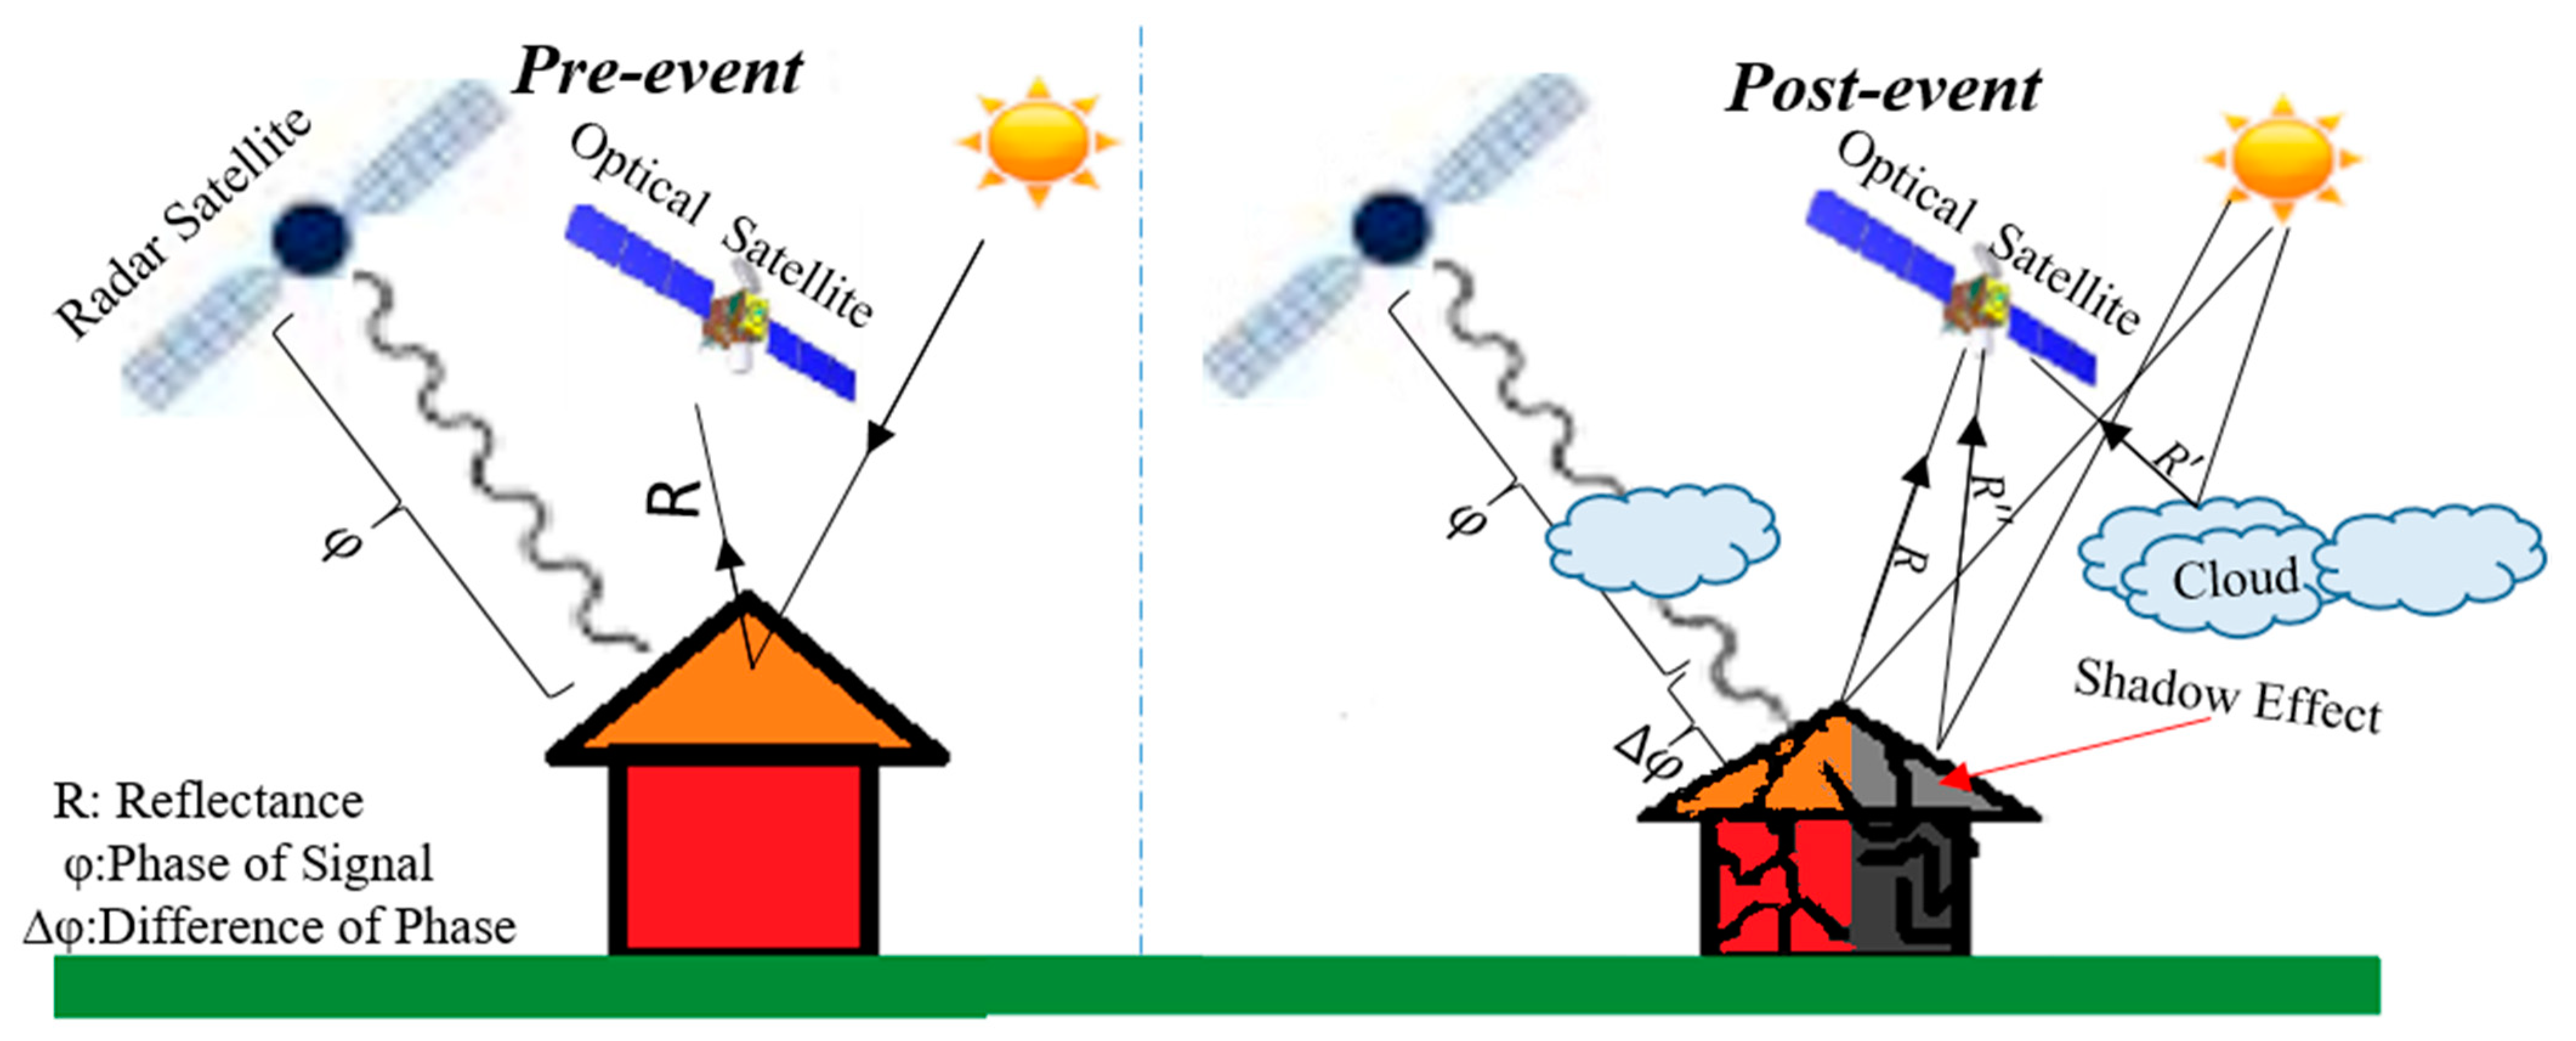
3.3.1. Coherence Map

Interferometry is the complex coherence value estimated by the absolute value of the correlation coefficient between corresponding samples of two SAR images [10,32,33,36,43]. The complex coherence value can be defined for two zero-mean circular Gaussian variables m and s as Equation (2):
γ = E { m   , s * } E { | m 2 | } . E { | s 2 | }
where E is the expectation operator and * denotes complex conjugation. M and S are the master and slave images, respectively. γ denotes the complex coherence between slave and master images. The coherence value obtained from the magnitude of the complex coherence is defined as Equation (3):
γ ^ = | γ | = 1 N 1 N M . S * 1 N 1 N M . S * . 1 N 1 N M . S *
where N is the number of pixels in a moving window.

3.3.2. SAM Algorithm

The SAM algorithm is used to measure the spectral angle between the reference map and the target vectors in n-dimensional space widely used in remote sensing applications [44]. The SAM algorithm can be calculated as Equation (4):
S A M α = cos 1 ( | x . y | | x | . | y | )
where S A M α is the spectral angle, x , and y represent the target and reference spectra, respectively.

3.3.3. Otsu Algorithm

The Otsu Algorithm is a thresholding algorithm that automatically clusters the image [45]. The goal of this approach is to determine the threshold by minimizing the weight of the variance within the class. The variance within the class is the variance of the total weight of each defined cluster. In this study, the Otsu algorithm is applied to determine the multiple damage mapping.

4. Experiment and Discussion

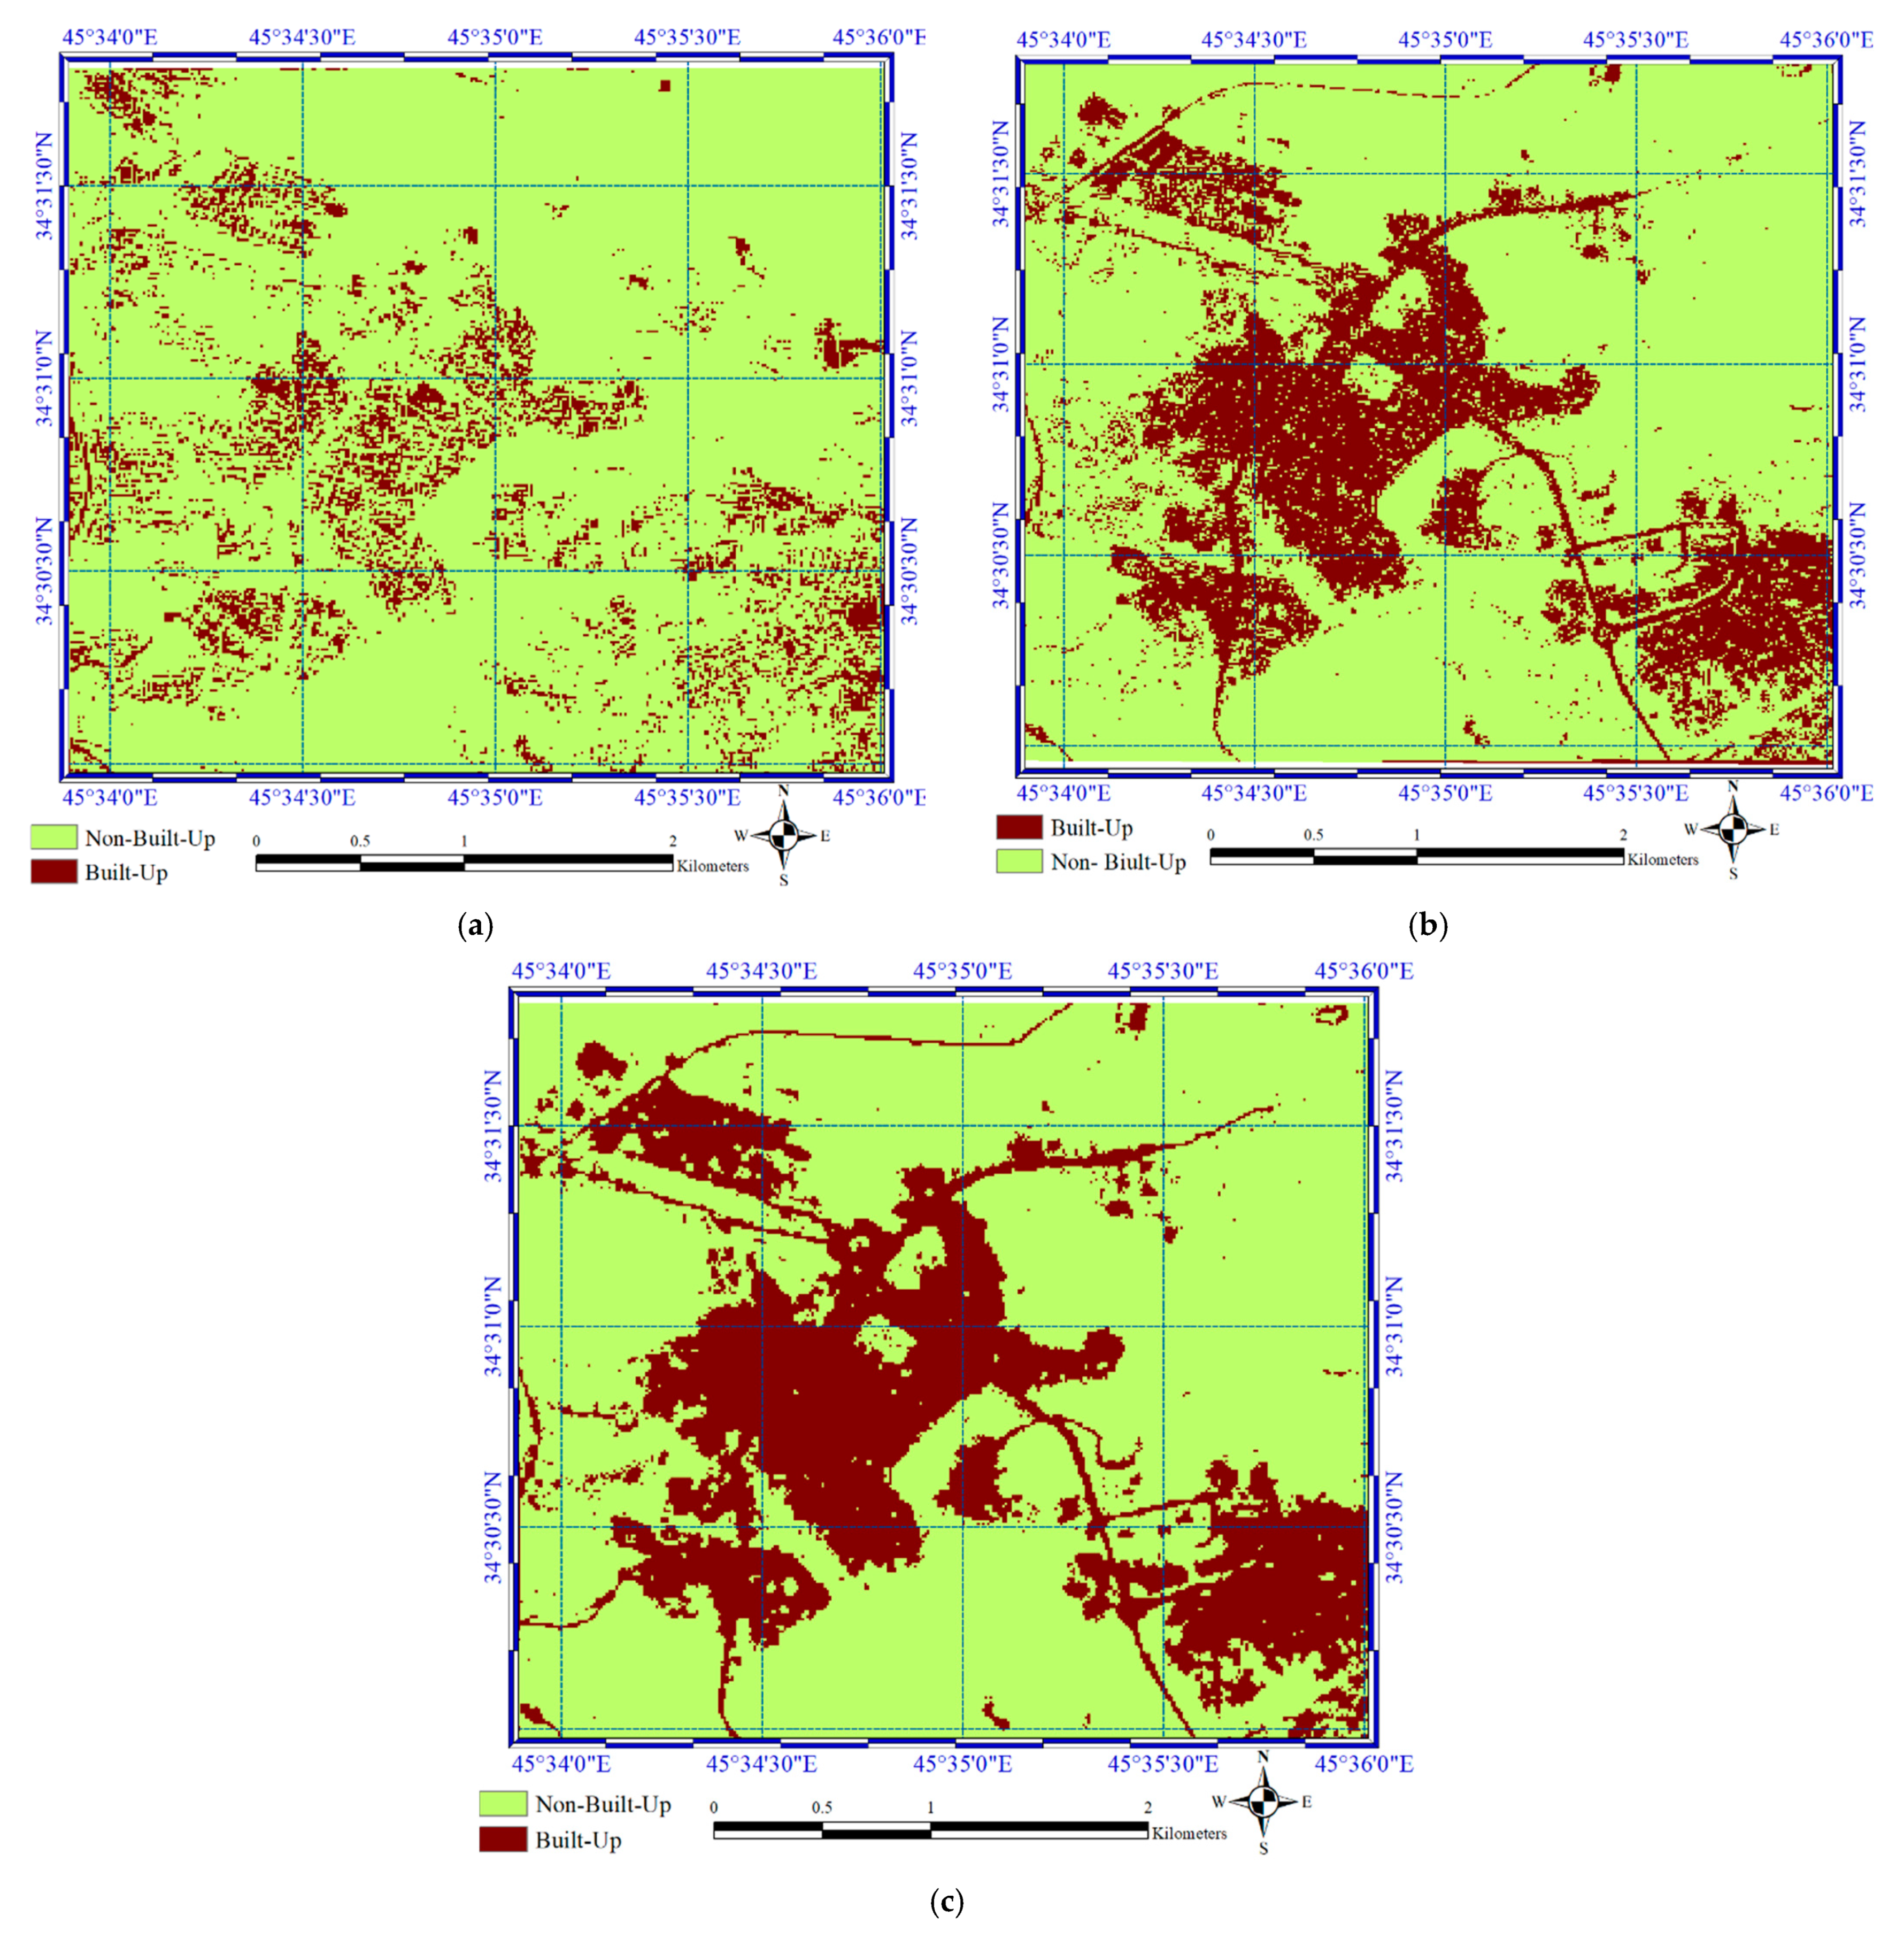
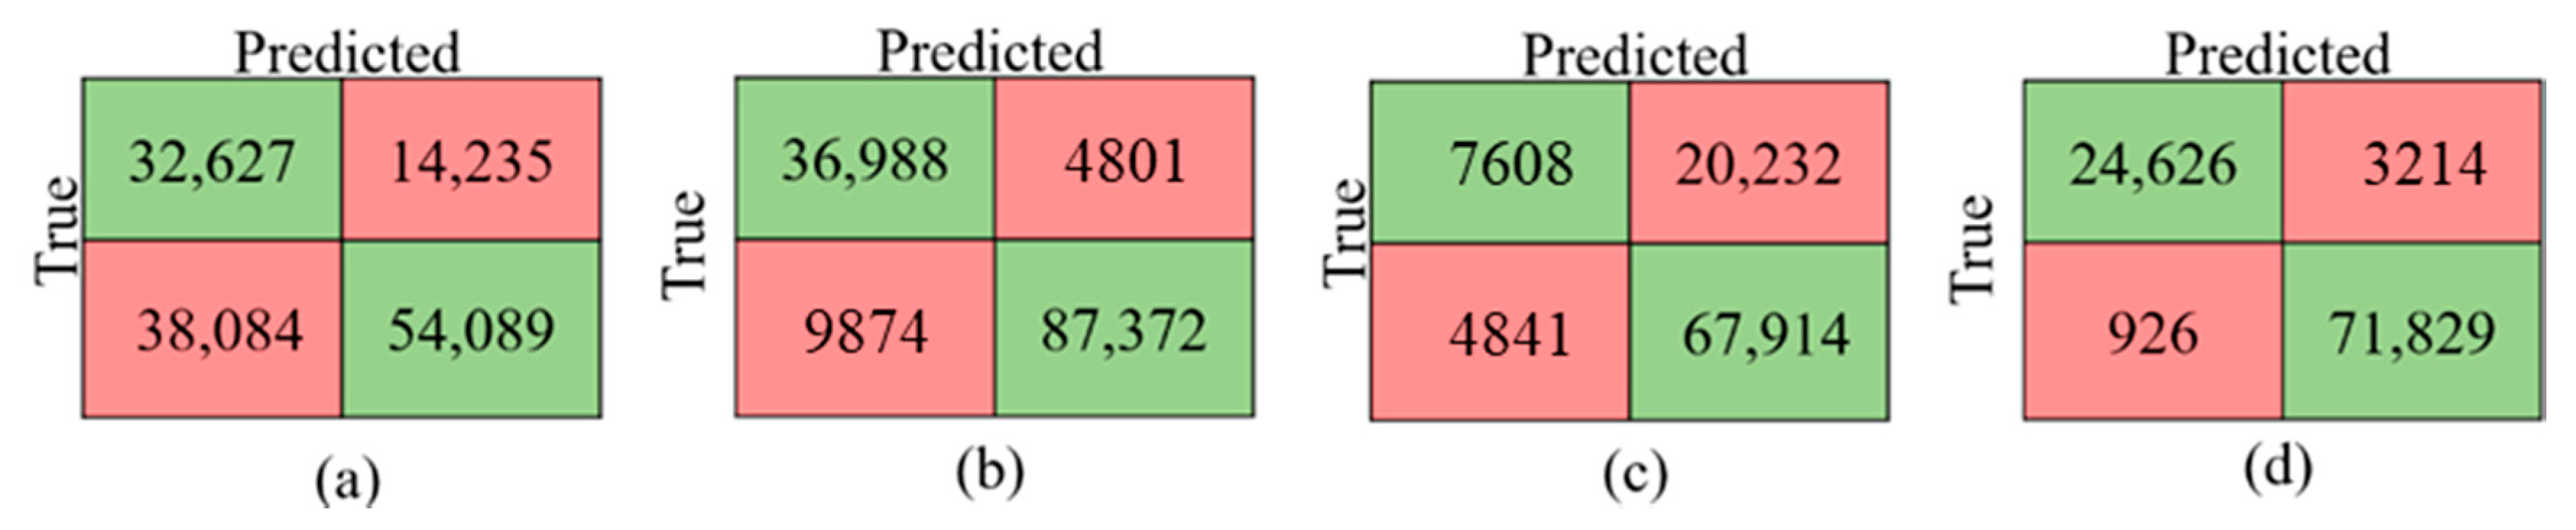
4.1. Built-Up Areas Extraction

The proposed method can extract built-up areas in an unsupervised framework from optical remote sensing data. For this purpose, preprocessing is applied to the optical dataset and the desired features are extracted. After producing an initial training dataset by a strict threshold selection on indices, all features and original spectral bands are considered as input for the SVM classifier. The optimum value for the penalty coefficient is 103 for both case studies, and the optimal values for the kernel parameter are 10−2 and 10−3 for Qasr-Shirin and Sarpol-Zahab, respectively. The proposed approach was compared with a similar method based on normalized differences (ND) between the pre- and coevent interferometric coherence and impervious surfaces extracted using optical imagery [43]. Figure 5 presents the result of built-up area detection in Qasr-Shirin. As seen, the proposed method provided a better performance on the built-up area detection compared to the ND-Based method.
Figure 6 shows the built-up area detection result for Sarpol-Zahab. Figure 6a represents the application of the ND-Based method. In this image, one can see misdetections in part of the area and a high false rate, so this method does not work very well. Figure 6b shows the built-up area detection result obtained by the proposed method, indicating the detection of almost all of the built-up areas.
The result of the built-up area detection is considered by numerical analysis using some of the indices. Table 5 presents the numerical results of the built-up area detection by the proposed method as well as the ND-based method. Results from the proposed method indicate an improved performance on both datasets compared to the ND-based method.
In addition, the proposed method provided the lowest MD (under 20%) and FA rates (under 5%). Based on the obtained numerical results, the performance of the proposed method in the detection of non-built-up areas is better than built-areas because utilized methods provided high MD rates compared to FA rates. In addition, the precision rates are more than Recall. Figure 7 presents the confusion matrix of both datasets.

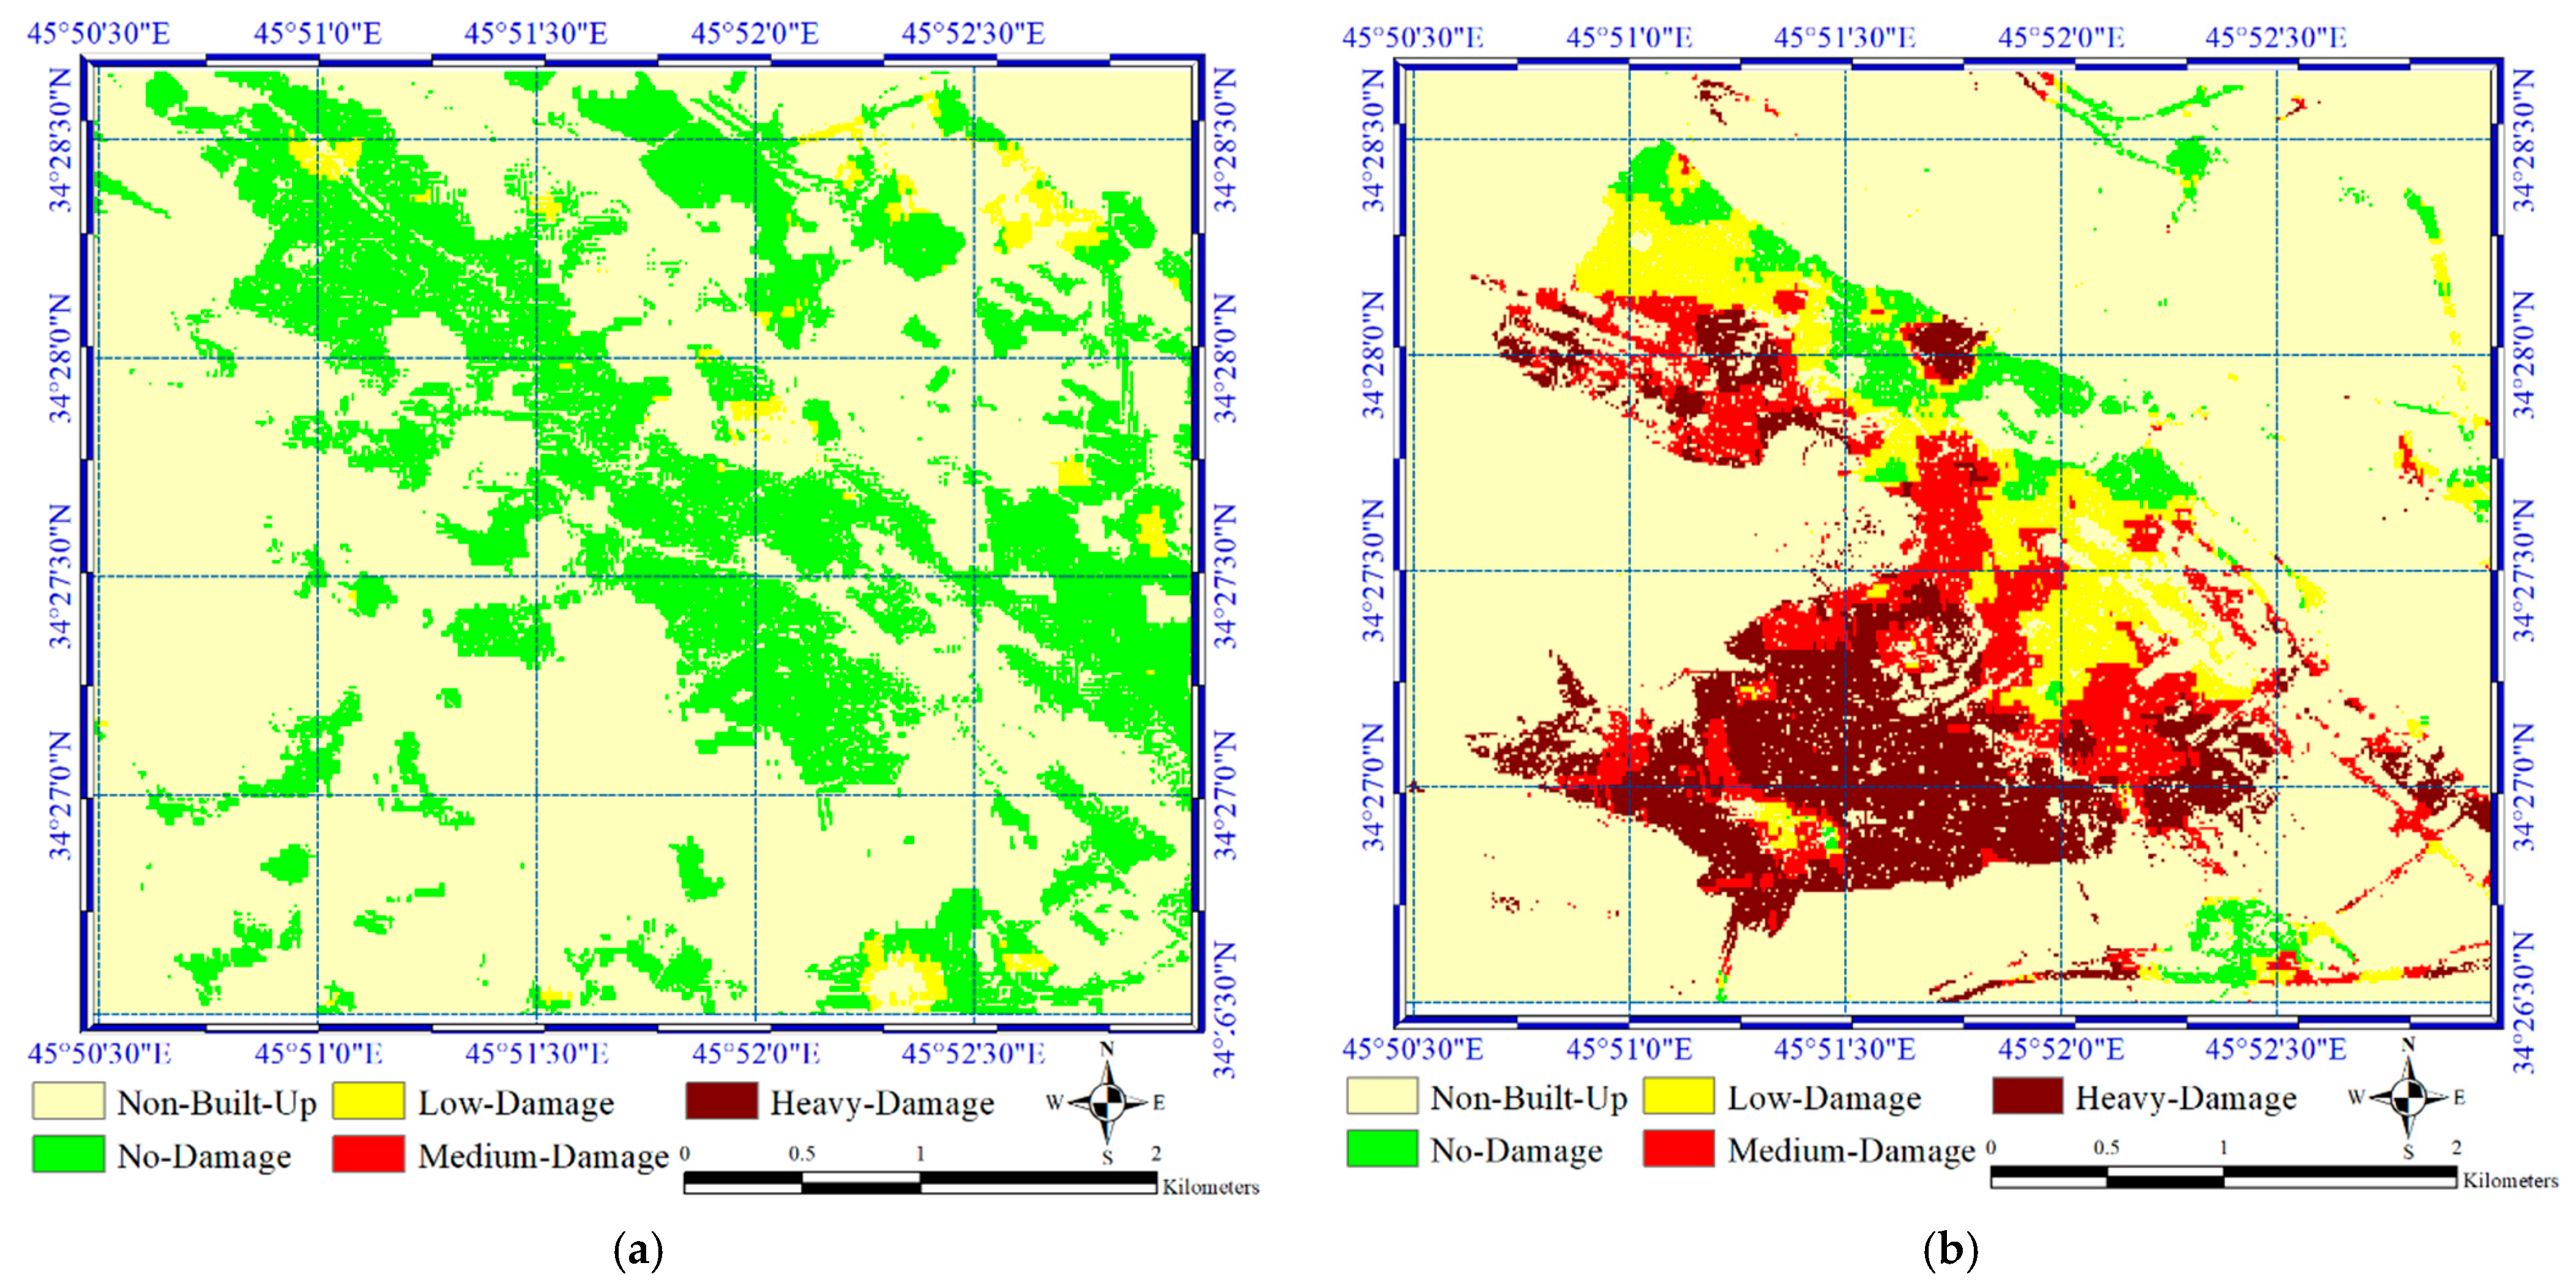
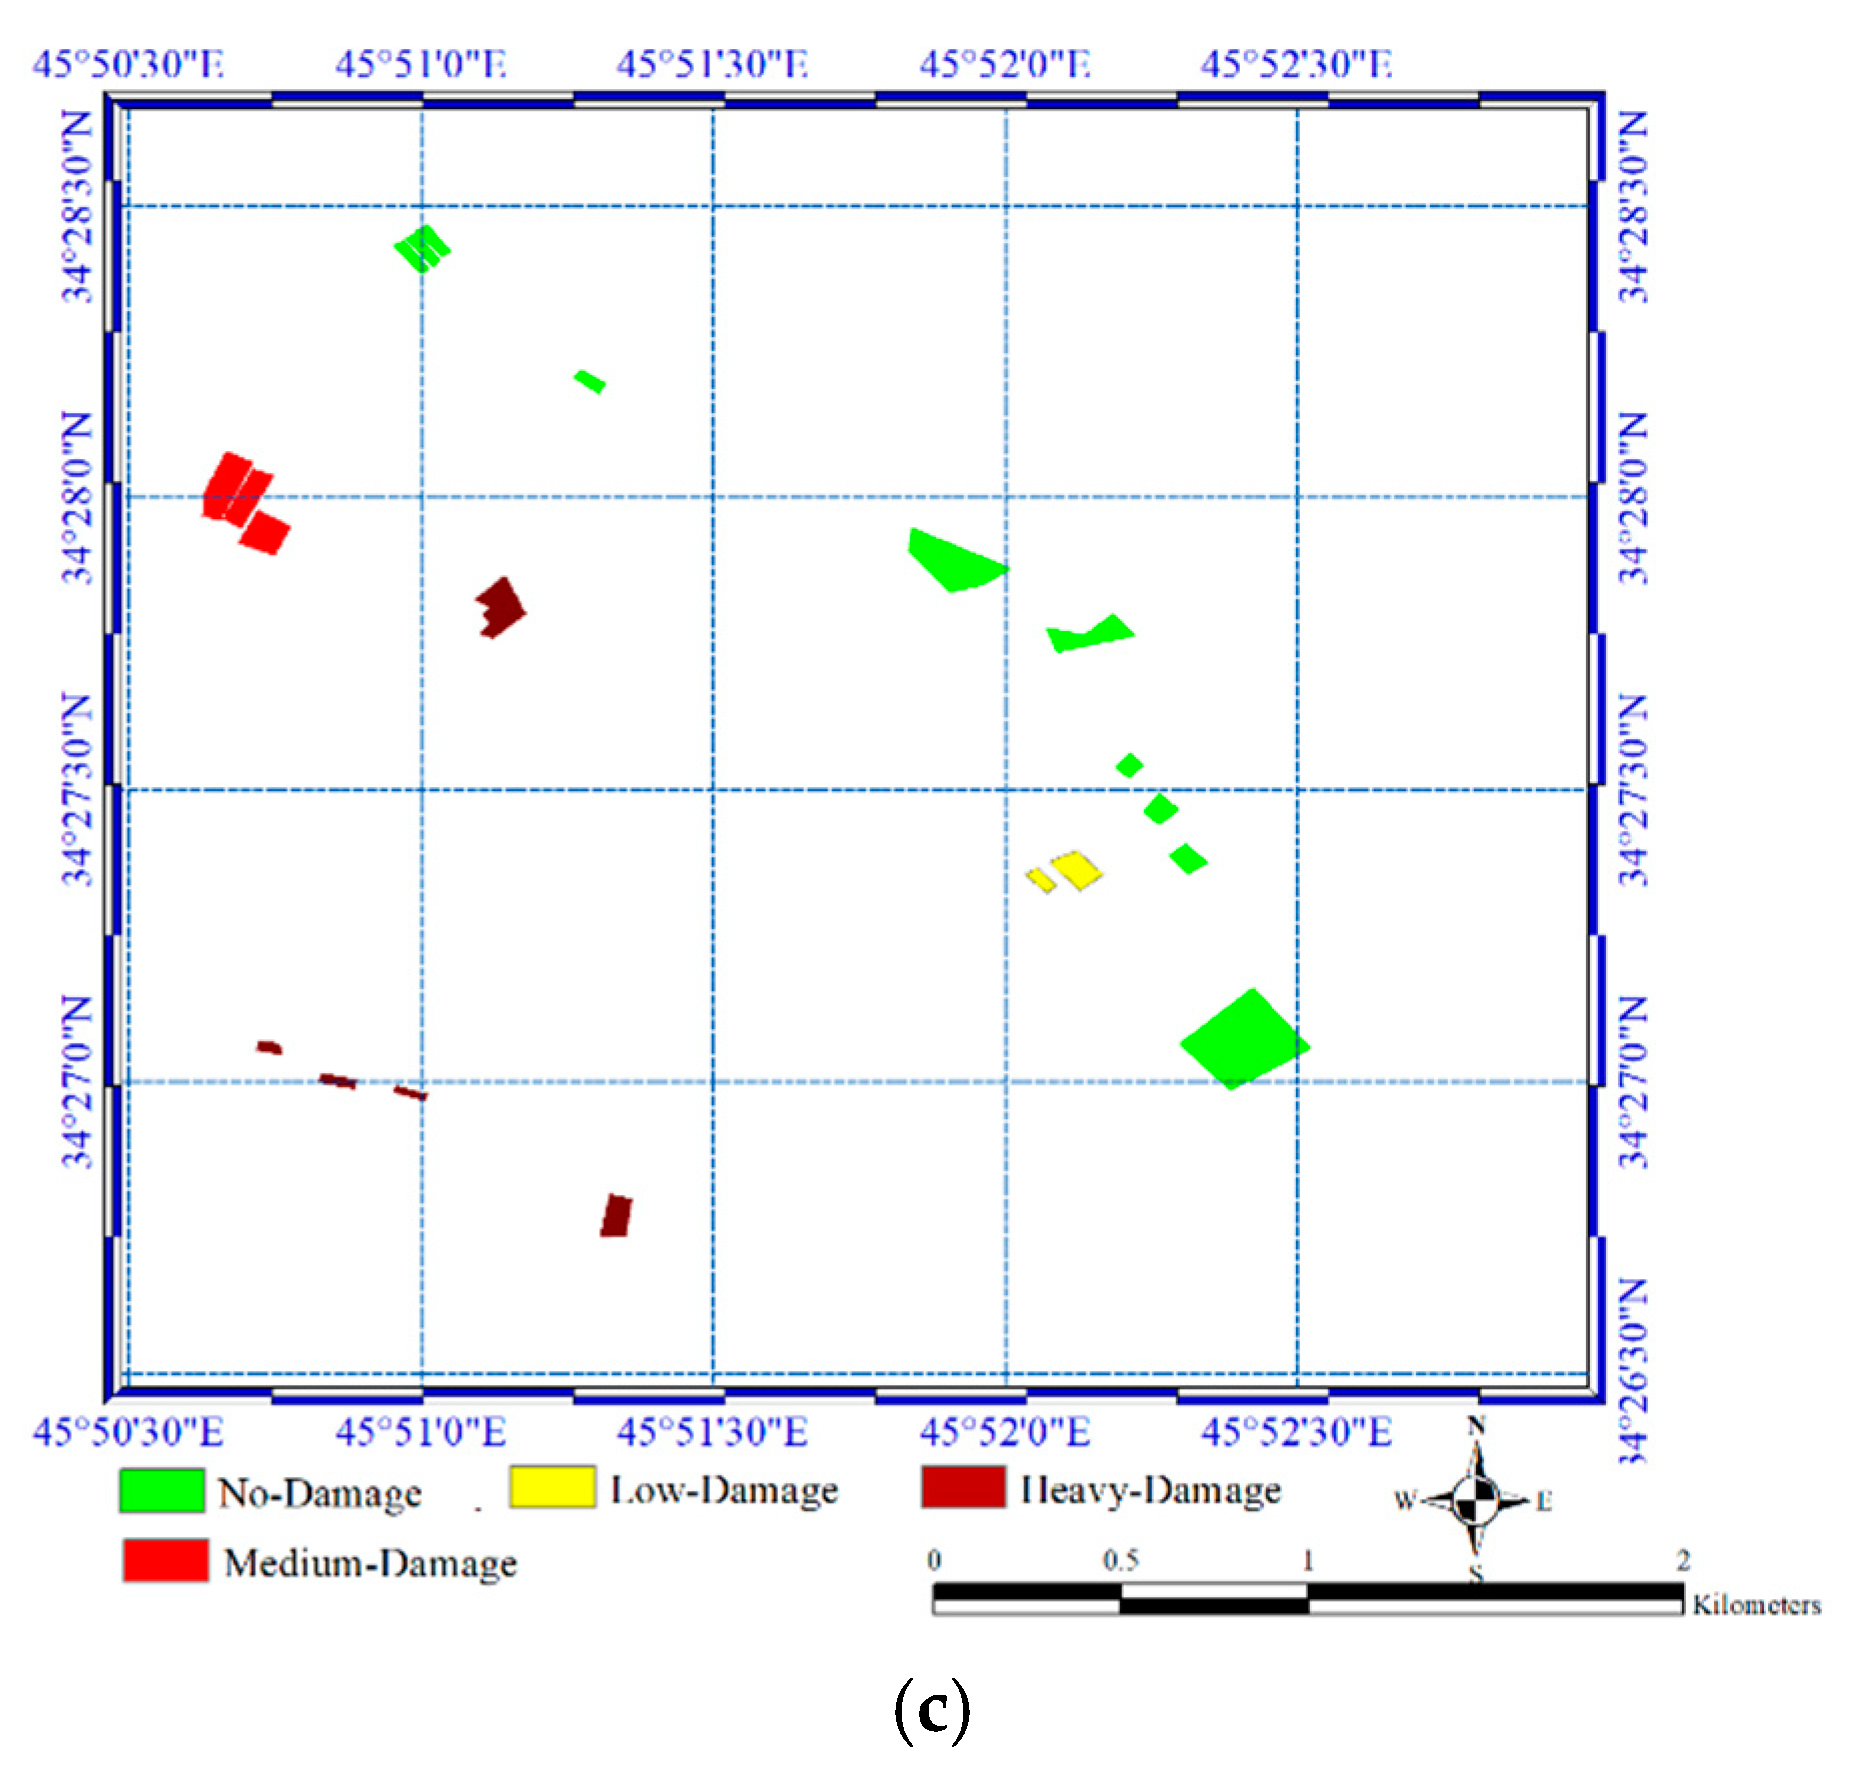
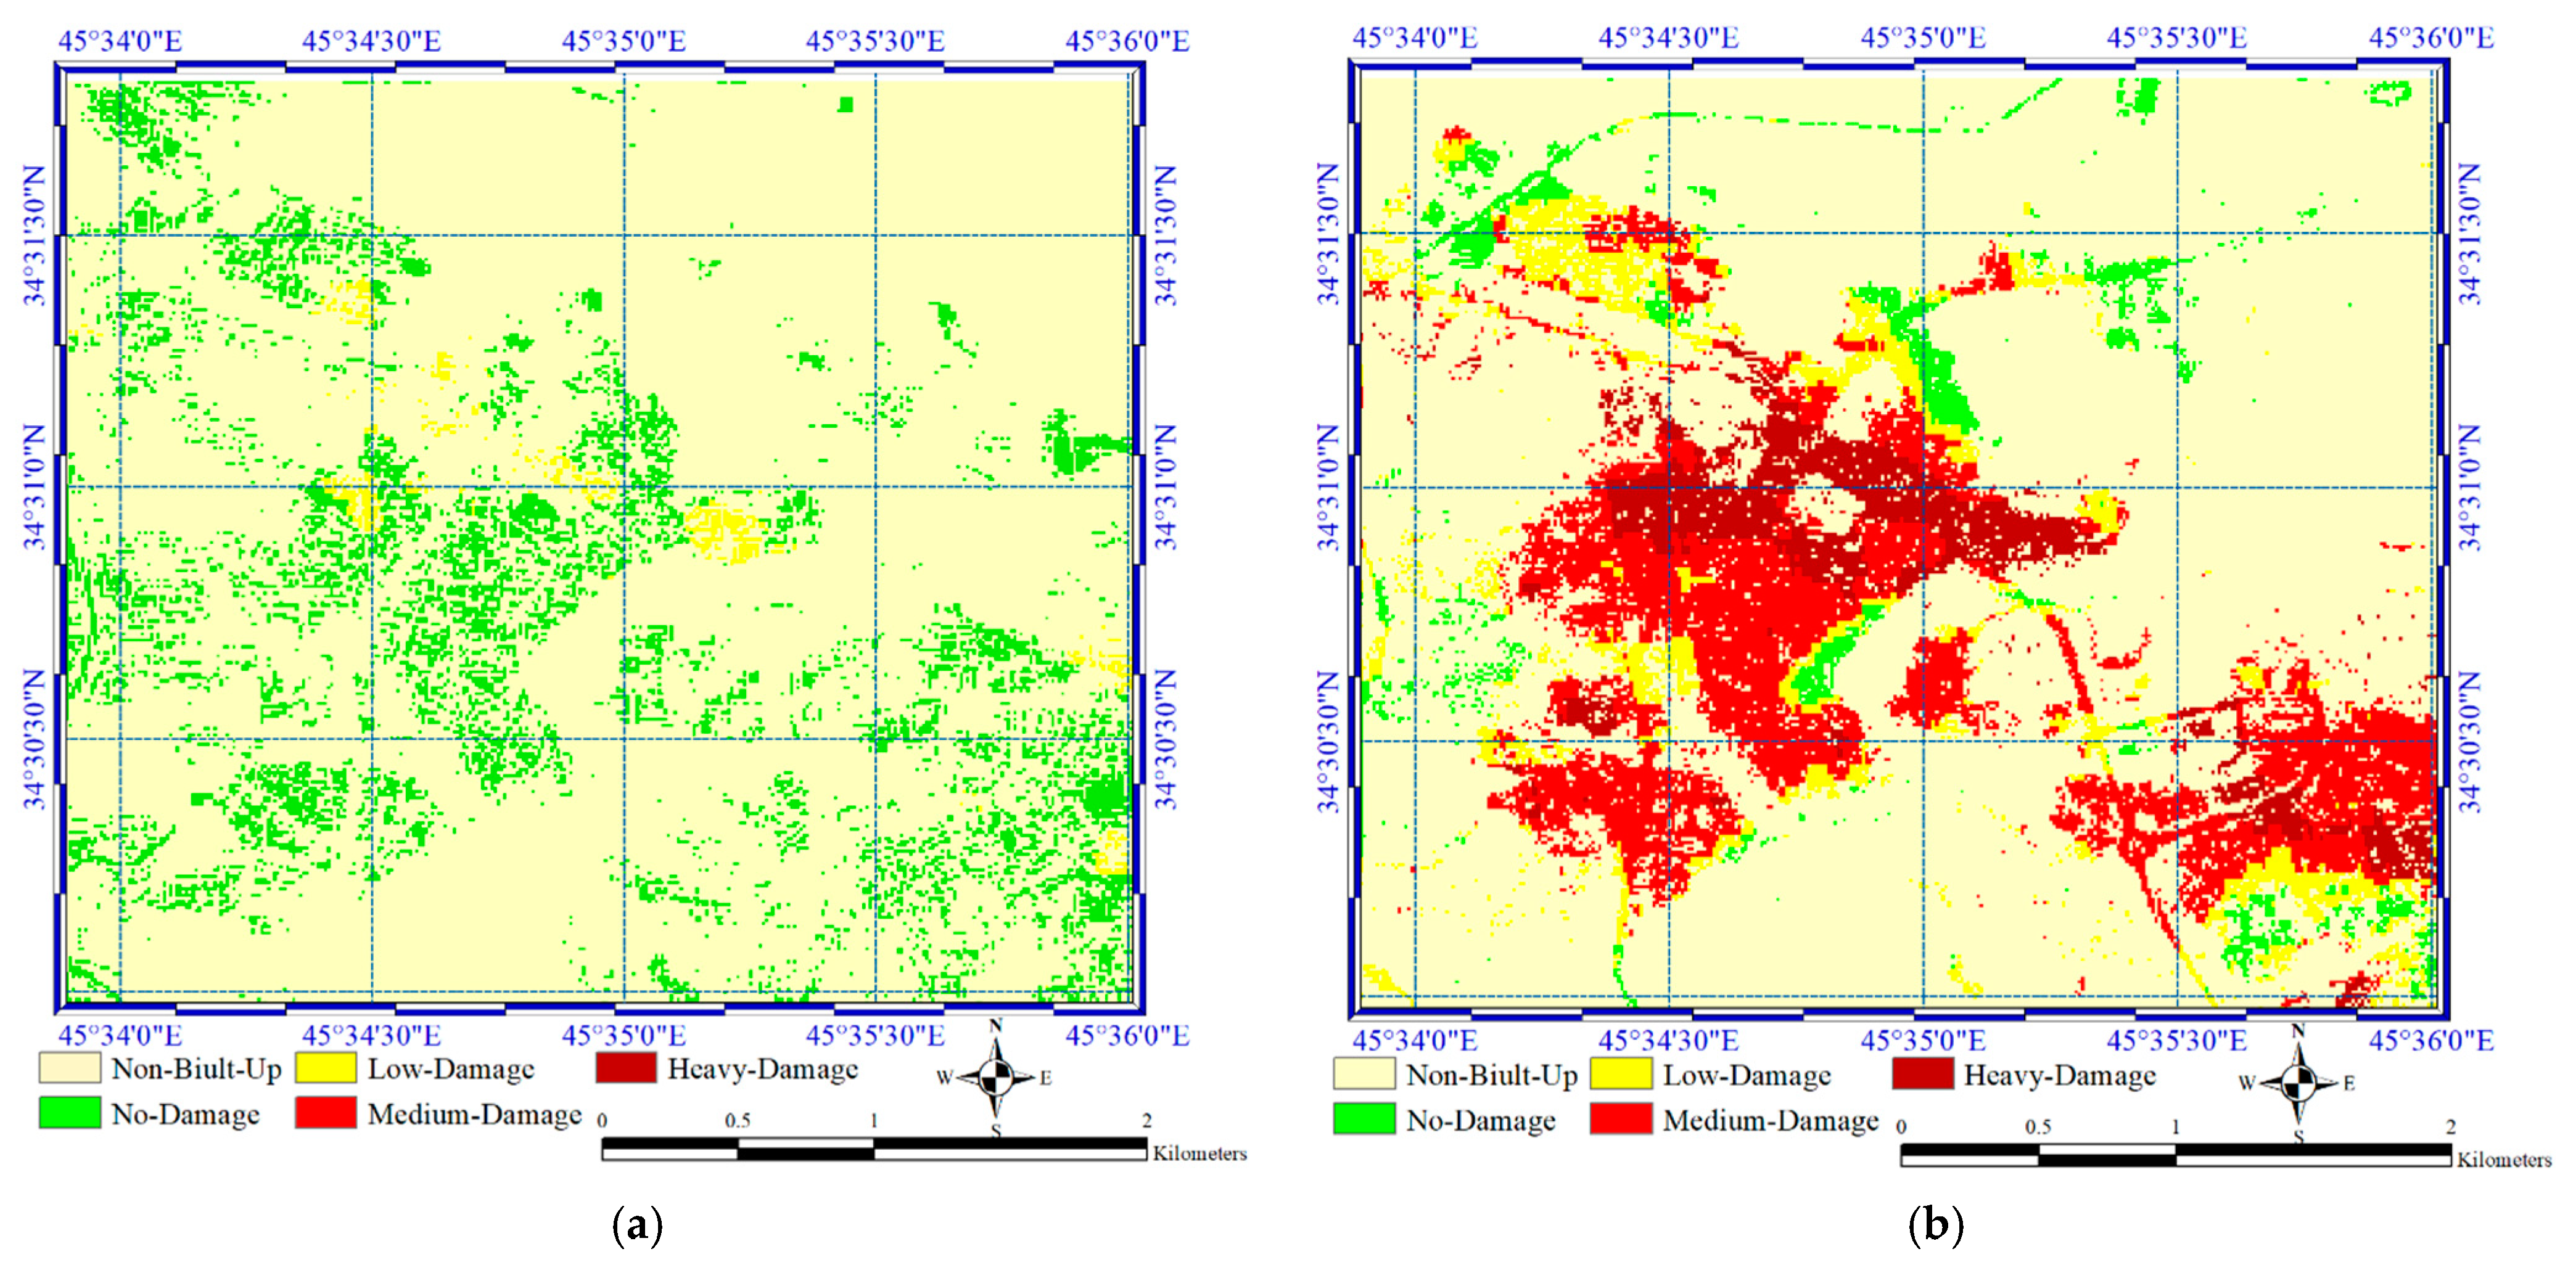
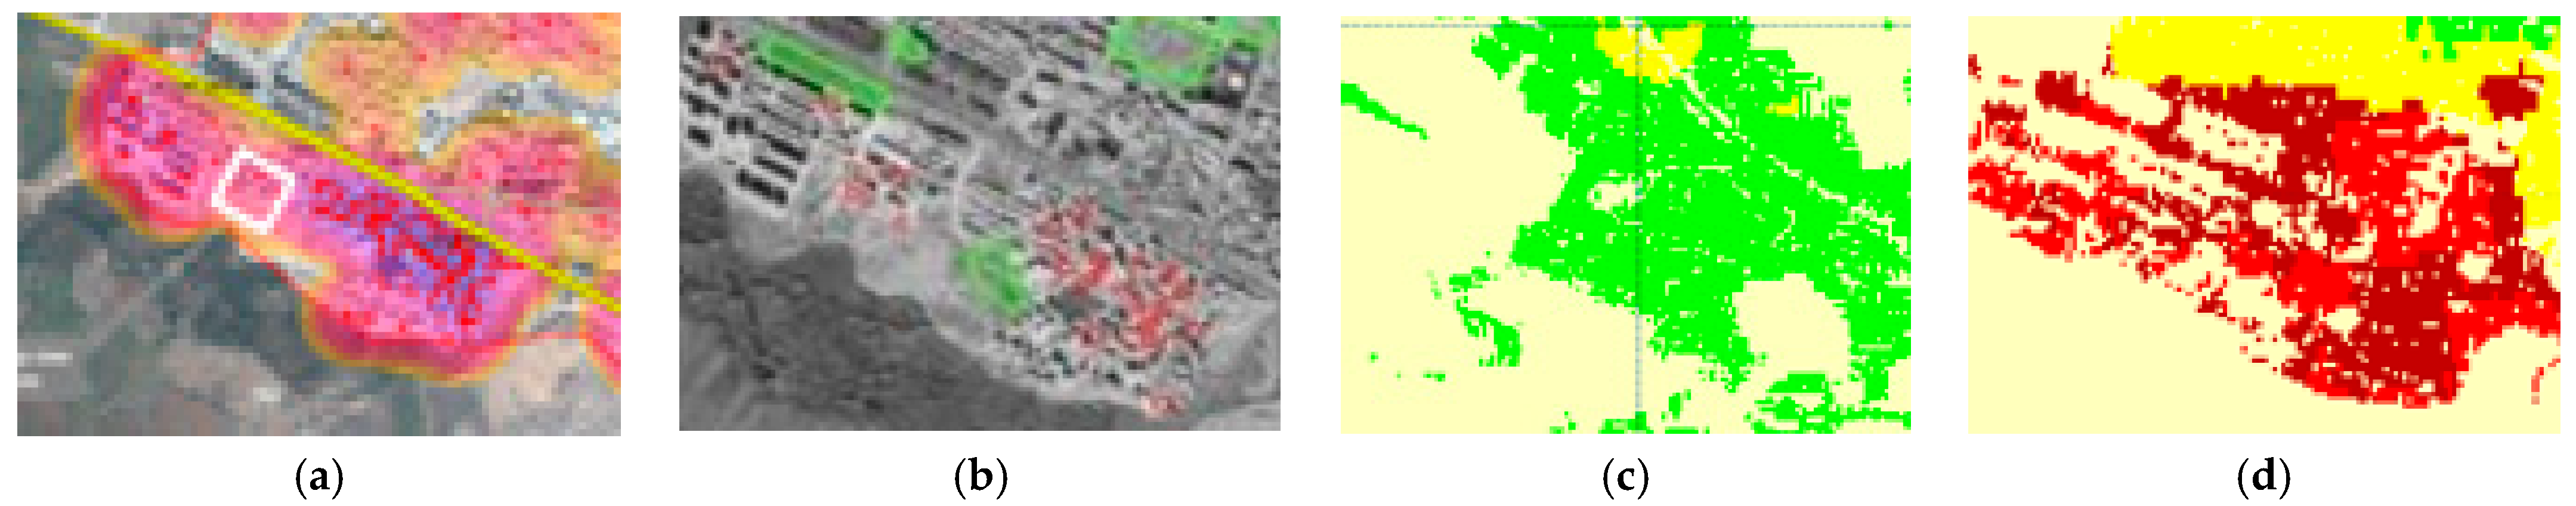
4.2. Damaged Region Detection

The obtained mask for built-up areas is applied to the multitemporal coherence map. Evaluation of results were based on visual analysis and accuracy assessment.
Figure 8 presents the results of the damaged region detection in Sarpol-Zahab. Based on the visual analysis and comparison to the ground truth for some sample regions (Figure 8c), it is clear that the proposed method predicted damaged areas well on damage classes. The proposed method has a good performance on highly damaged region detection compared to ND-based methods. However, some no-damage areas were considered as high damage. This issue originated from the effect of irrelevant changes and performance of the proposed method in classification damage regions.
Table 6 and Table 7 present the confusion matrix of results of the damage region detection on the Sarpol-Zahab dataset for both datasets. The multiple data map is evaluated by 20 sample region areas for four classes.
Based on the obtained results, our proposed method shows good performance for multiple damage region detection at more damage levels compared to the ND-based method. Based on presented numerical results, the proposed method is provided an accuracy of more than 70(%) while the ND-based method achieves an accuracy of 50(%). In addition, it is worth noting the proposed method is applied in an unsupervised framework in the generation of multiple damage map.
Among the type of damage level results, the no-damage level has the lowest accuracy compared to other classes. However, the ND-based method has good performance (No-Damage class) but it has weak performance in detection of other damage classes.

5. Discussion

The optical Sentinel-2 imagery has a high potential for extracting built-up areas based on the feature extraction using incorporated indices. Built-up area extraction is the first part of damage assessment and plays a key role. High accuracy is therefore crucial so that the obtained results become reliable. The results presented in Figure 9 show almost all built-up areas extracted by the proposed framework that conforms to the performance of the proposed method on both datasets. However, other built-up extraction methods are not very efficient, because they ignore some of the areas, especially on the Qasr-Shirin dataset. This issue originates from the threshold selection process using various types of features. The proposed method has a good framework for threshold selection and uses new and efficient indices for feature extraction.
Recently, much research has been done on built-up area detection. Mainly, these methods are based on supervised learning methods and need a training sample. Table 8 presents the Overall Accuracy of these methods and the proposed one.
Based on the presented numerical results, the proposed method has a good performance compared to other state-of-the-art methods. Besides, these methods are applied in a supervised framework and require sample data. The quality and quantity of sample data play a key role in classification while the proposed method provides the sample data in an active learning framework. It is worth noting the collection of sample data is a big challenge and time-consuming, especially for a project like this study.
The index-based methods mainly focus on spectral features while the spatial features improve the performance of the built-up area detection. In addition, one of the main disadvantages of index-based methods is finding an optimum threshold for each spectral index. So, some methods like ND-based methods do not provide good, promising results.
The multiple damage map is another product of the proposed method (Figure 8 and Figure 9, Table 6 and Table 7). The multiple damage map provides valuable information about the nature of damages. However, some state-of-the-art-methods provided promising results about damaged regions but they ignore multiple-damage maps. The proposed method presents a multiple damage map in three classes. On the other hand, the mentioned ground truth maps only focused on damaged areas. The result of the multiple damage map was evaluated by some sample damage regions. Based on numerical and visual analysis, the proposed method was provided the accuracy of more than 70 (%) by overall accuracy index.
Because of the good temporal resolution and the general advantages of SAR data, damage information extraction using multitemporal SAR data could be very important. The results of damage information extraction are applied in an unsupervised framework. Our proposed method not only detects regions damaged but also can provide additional details such as the extent of the damage at three levels based on the coherence spectral signature. It shows good results compared to other damage detection methods.
Figure 10 presents the result of damaged region detection in Sarpol-Zahab on a local scale. Based on this figure, it is clear the proposed method has a good performance in the detection of damaged regions compared to the ND-based method.
One advantage of our proposed method is that it uses three temporal datasets, which can reduce the noise effects of some of the factors that increase the coherence value and could potentially cause false results. Our proposed method uses a measure based on the spectral signature of each pixel, while other methods use only an index. Additionally, our proposed method does not require threshold selection while other methods do.

6. Conclusions

This study presents a new method for achieving a fast damaged-region-detection framework without requiring prior knowledge of the case study. The proposed method uses five steps to enhance the content and quality of the final damage detection results. The experiments were conducted using real Sentinel datasets of different regions.
The proposed method utilized Sentinel-1 imagery that has acceptable temporal resolution compared to other SAR sensors. These advantages make the proposed method applicable after occurring any earthquake. This helps to quickly map damaged regions and assess damages while field monitoring takes more time for evaluating damaged areas especially, on large scale.
The findings of this study have shown: (1) improved accuracy results while not requiring prior knowledge of damages; (2) this method can provide both binary maps and ranges of damage level; (3) the potential of incorporating a new temporal series of remote-sensing imagery; (4) the advantages of using a SAR dataset with all-weather capability and day-and-night operation; and (5) the proposed method is simple to implement and has high efficiency with a low computational cost.
This research focused on damaged region detection based on high-resolution satellite imagery. However, these datasets have poor spatial resolution and building damage detection is very hard at this level. So, we proposed this algorithm for very high-resolution SAR imagery that could extract the multiple building damage.

Author Contributions

M.H. and R.S.-H. did preprocesses and prepared datasets. S.T.S. and M.H. designed modeling concepts and implemented the damage detection. S.K. and M.M. wrote and checked the manuscript. All authors have read and agreed to the published version of the manuscript.

Funding

The APC was funded by the Japan Society for the Promotion of Science (JSPS) Grants-in-Aid for scientific research (KAKENHI) No. 20H02411.

Institutional Review Board Statement

Not applicable.

Informed Consent Statement

Not applicable.

Data Availability Statement

All related datasets can be found on rslab.ut.ac.ir (accessed on 18 March 2021).

Conflicts of Interest

The authors declare no conflict of interest.

References

  1. Sahin, Y.G. A sensor selection model in simultaneous monitoring of multiple types of disaster. In Proceedings of the Geospatial Informatics IX, Baltimore, MD, USA, 15–16 April 2019; Volume 10992, p. 109920C. [Google Scholar]
  2. Garcia, J.; Istomin, E.; Slesareva, L.; Pena, J. Spatial data infrastructure for the management and risk assessment of natural disasters. In Proceedings of the Sixth International Conference on Remote Sensing and Geoinformation of the Environment (RSCy2018), Paphos, Cyprus, 26–29 March 2018; p. 1077310. [Google Scholar]
  3. Rosser, J.F.; Leibovici, D.; Jackson, M.J. Rapid flood inundation mapping using social media, remote sensing and topographic data. Nat. Hazards 2017, 87, 103–120. [Google Scholar] [CrossRef] [Green Version]
  4. Aksha, S.K.; Resler, L.M.; Juran, L.; Carstensen, L.W., Jr. A geospatial analysis of multi-hazard risk in Dharan, Nepal. Geomat. Nat. Hazards Risk 2020, 11, 88–111. [Google Scholar] [CrossRef] [Green Version]
  5. Anniballe, R.; Noto, F.; Scalia, T.; Bignami, C.; Stramondo, S.; Chini, M.; Pierdicca, N. Earthquake damage mapping: An overall assessment of ground surveys and VHR image change detection after L’Aquila 2009 earthquake. Remote Sens. Environ. 2018, 210, 166–178. [Google Scholar] [CrossRef]
  6. Dong, L.; Shan, J. A comprehensive review of earthquake-induced building damage detection with remote sensing techniques. ISPRS J. Photogramm. Remote Sens. 2013, 84, 85–99. [Google Scholar] [CrossRef]
  7. Sharma, R.C.; Tateishi, R.; Hara, K.; Nguyen, H.T.; Gharechelou, S.; Nguyen, L.V. Earthquake Damage Visualization (EDV) Technique for the Rapid Detection of Earthquake-Induced Damages Using SAR Data. Sensors 2017, 17, 235. [Google Scholar] [CrossRef]
  8. Seydi, S.; Rastiveis, H. A deep learning framework for roads network damage assessment using post-earthquake lidar data. Int. Arch. Photogramm. Remote Sens. Spat. Inf. Sci. 2019, 42, 955–961. [Google Scholar] [CrossRef] [Green Version]
  9. Yamazaki, F.; Yano, Y.; Matsuoka, M. Visual Damage Interpretation of Buildings in Bam City using QuickBird Images following the 2003 Bam, Iran, Earthquake. Earthq. Spectra 2005, 21, 329–336. [Google Scholar] [CrossRef]
  10. Natsuaki, R.; Nagai, H.; Tomii, N.; Tadono, T. Sensitivity and Limitation in Damage Detection for Individual Buildings Using InSAR Coherence—A Case Study in 2016 Kumamoto Earthquakes. Remote Sens. 2018, 10, 245. [Google Scholar] [CrossRef] [Green Version]
  11. Menderes, A.; Erener, A.; Sarp, G. Automatic Detection of Damaged Buildings after Earthquake Hazard by Using Remote Sensing and Information Technologies. Procedia Earth Planet. Sci. 2015, 15, 257–262. [Google Scholar] [CrossRef] [Green Version]
  12. Matsuoka, M.; Yamazaki, F. Use of Satellite SAR Intensity Imagery for Detecting Building Areas Damaged Due to Earthquakes. Earthq. Spectra 2004, 20, 975–994. [Google Scholar] [CrossRef]
  13. Miyajima, M.; Fallahi, A.; Ikemoto, T.; Samaei, M.; Karimzadeh, S.; Setiawan, H.; Talebi, F.; Karashi, J. Site Investigation of the Sarpole-Zahab Earthquake, Mw 7.3 in SW Iran of November 12, 2017. Available online: https://committees.jsce.or.jp/disaster/FS2018-E-0002 (accessed on 18 March 2021).
  14. Aimaiti, Y.; Liu, W.; Yamazaki, F.; Maruyama, Y. Earthquake-Induced Landslide Mapping for the 2018 Hokkaido Eastern Iburi Earthquake Using PALSAR-2 Data. Remote Sens. 2019, 11, 2351. [Google Scholar] [CrossRef] [Green Version]
  15. Seydi, S.T.; Akhoondzadeh, M.; Amani, M.; Mahdavi, S. Wildfire Damage Assessment over Australia Using Sentinel-2 Imagery and MODIS Land Cover Product within the Google Earth Engine Cloud Platform. Remote Sens. 2021, 13, 220. [Google Scholar] [CrossRef]
  16. Seydi, S.T.; Hasanlou, M.; Amani, M. A New End-to-End Multi-Dimensional CNN Framework for Land Cover/Land Use Change Detection in Multi-Source Remote Sensing Datasets. Remote Sens. 2020, 12, 2010. [Google Scholar] [CrossRef]
  17. Seydi, S.T.; Hasanlou, M. A new land-cover match-based change detection for hyperspectral imagery. Eur. J. Remote Sens. 2017, 50, 517–533. [Google Scholar] [CrossRef]
  18. Zheng, Z.; Pu, C.; Zhu, M.; Xia, J.; Zhang, X.; Liu, Y.; Li, J. Damaged road extracting with high-resolution aerial image of post-earthquake. In Proceedings of the International Conference on Intelligent Earth Observing and Applications 2015, Guilin, China, 23–24 October 2015; p. 980807. [Google Scholar]
  19. Zhao, L.; Yang, J.; Li, P.; Zhang, L.; Shi, L.; Lang, F. Damage assessment in urban areas using post-earthquake airborne PolSAR imagery. Int. J. Remote Sens. 2013, 34, 8952–8966. [Google Scholar] [CrossRef]
  20. Wang, J.; Qin, Q.; Zhao, J.; Ye, X.; Feng, X.; Qin, X.; Yang, X. Knowledge-Based Detection and Assessment of Damaged Roads Using Post-Disaster High-Resolution Remote Sensing Image. Remote Sens. 2015, 7, 4948–4967. [Google Scholar] [CrossRef] [Green Version]
  21. Vetrivel, A.; Gerke, M.; Kerle, N.; Vosselman, G. Identification of damage in buildings based on gaps in 3D point clouds from very high resolution oblique airborne images. ISPRS J. Photogramm. Remote Sens. 2015, 105, 61–78. [Google Scholar] [CrossRef]
  22. Wei, D.; Yang, W. Detecting damaged buildings using a texture feature contribution index from post-earthquake remote sensing images. Remote Sens. Lett. 2019, 11, 127–136. [Google Scholar] [CrossRef]
  23. Song, D.; Tan, X.; Wang, B.; Zhang, L.; Shan, X.; Cui, J. Integration of super-pixel segmentation and deep-learning methods for evaluating earthquake-damaged buildings using single-phase remote sensing imagery. Int. J. Remote Sens. 2019, 41, 1040–1066. [Google Scholar] [CrossRef]
  24. Park, S.-E.; Jung, Y.T. Detection of Earthquake-Induced Building Damages Using Polarimetric SAR Data. Remote Sens. 2020, 12, 137. [Google Scholar] [CrossRef] [Green Version]
  25. Al-Khudhairy, D.; Caravaggi, I.; Giada, S. Structural Damage Assessments from Ikonos Data Using Change Detection, Object-Oriented Segmentation, and Classification Techniques. Photogramm. Eng. Remote Sens. 2005, 71, 825–837. [Google Scholar] [CrossRef] [Green Version]
  26. Ranjbar, H.R.; Ardalan, A.A.; Dehghani, H.; Saradjian, M.R. Using high-resolution satellite imagery to provide a relief priority map after earthquake. Nat. Hazards 2017, 90, 1087–1113. [Google Scholar] [CrossRef]
  27. Janalipour, M.; Taleai, M. Building change detection after earthquake using multi-criteria decision analysis based on extracted information from high spatial resolution satellite images. Int. J. Remote Sens. 2016, 38, 82–99. [Google Scholar] [CrossRef]
  28. Saha, S.; Bovolo, F.; Bruzzone, L. Building Change Detection in VHR SAR Images via Unsupervised Deep Transcoding. IEEE Trans. Geosci. Remote Sens. 2021, 59, 1917–1929. [Google Scholar] [CrossRef]
  29. Liu, W.; Yamazaki, F. Bridge Damage Assessment Using Single Post-Event Terrasar-X Image. In Proceedings of the IGARSS 2019—2019 IEEE International Geoscience and Remote Sensing Symposium, Yokohama, Japan, 28 July–2 August 2019; pp. 4833–4836. [Google Scholar]
  30. Li, Y.; Martinis, S.; Wieland, M. Urban flood mapping with an active self-learning convolutional neural network based on TerraSAR-X intensity and interferometric coherence. ISPRS J. Photogramm. Remote Sens. 2019, 152, 178–191. [Google Scholar] [CrossRef]
  31. Li, Q.; Gong, L.; Zhang, J. A correlation change detection method integrating PCA and multi- texture features of SAR image for building damage detection. Eur. J. Remote Sens. 2019, 52, 435–447. [Google Scholar] [CrossRef] [Green Version]
  32. Karimzadeh, S.; Matsuoka, M.; Miyajima, M.; Adriano, B.; Fallahi, A.; Karashi, J. Sequential SAR Coherence Method for the Monitoring of Buildings in Sarpole-Zahab, Iran. Remote Sens. 2018, 10, 1255. [Google Scholar] [CrossRef] [Green Version]
  33. Hajeb, M.; Karimzadeh, S.; Fallahi, A. Seismic damage assessment in Sarpole-Zahab town (Iran) using synthetic aperture radar (SAR) images and texture analysis. Nat. Hazards 2020, 103, 1–20. [Google Scholar] [CrossRef]
  34. Brando, G.; Rapone, D.; Spacone, E.; O’Banion, M.S.; Olsen, M.J.; Barbosa, A.R.; Faggella, M.; Gigliotti, R.; Liberatore, D.; Russo, S.; et al. Damage Reconnaissance of Unreinforced Masonry Bearing Wall Buildings after the 2015 Gorkha, Nepal, Earthquake. Earthq. Spectra 2017, 33, 243–273. [Google Scholar] [CrossRef]
  35. Bai, Y.; Adriano, B.; Mas, E.; Gokon, H.; Koshimura, S. Object-Based Building Damage Assessment Methodology Using Only Post Event ALOS-2/PALSAR-2 Dual Polarimetric SAR Intensity Images. J. Disaster Res. 2017, 12, 259–271. [Google Scholar] [CrossRef]
  36. Arciniegas, G.A.; Bijker, W.; Kerle, N.; Tolpekin, V.A. Coherence- and Amplitude-Based Analysis of Seismogenic Damage in Bam, Iran, Using ENVISAT ASAR Data. IEEE Trans. Geosci. Remote Sens. 2007, 45, 1571–1581. [Google Scholar] [CrossRef]
  37. Main-Knorn, M.; Pflug, B.; Louis, J.; Debaecker, V.; Müller-Wilm, U.; Gascon, F. Sen2Cor for Sentinel-2. In Proceedings of the Image and Signal Processing for Remote Sensing XXIII, Warsaw, Poland, 11–13 September 2017; Volume 10427. [Google Scholar]
  38. Xue, J.; Su, B. Significant Remote Sensing Vegetation Indices: A Review of Developments and Applications. J. Sens. 2017, 2017, 1–17. [Google Scholar] [CrossRef] [Green Version]
  39. Haralick, R.M.; Shanmugam, K.; Dinstein, I. Textural Features for Image Classification. IEEE Trans. Syst. Man Cybern. 1973, SMC-3, 610–621. [Google Scholar] [CrossRef] [Green Version]
  40. Vapnik, V. The Nature of Statistical Learning Theory; Springer: New York, NY, USA, 1995. [Google Scholar]
  41. Yu, H.; Chen, G.; Gu, H. A machine learning methodology for multivariate pore-pressure prediction. Comput. Geosci. 2020, 143, 104548. [Google Scholar] [CrossRef]
  42. Thanh, N.D.; Thang, L.T.; Trung, V.A.; Vinh, N.Q. Identify some aerodynamic parameters of a airplane using the spiking neural network. Vietnam. J. EARTH Sci. 2020, 42, 276–287. [Google Scholar] [CrossRef]
  43. Tamkuan, N.; Nagai, M. Fusion of Multi-Temporal Interferometric Coherence and Optical Image Data for the 2016 Kumamoto Earthquake Damage Assessment. ISPRS Int. J. Geo. Inf. 2017, 6, 188. [Google Scholar] [CrossRef] [Green Version]
  44. Kruse, F.; Lefkoff, A.; Boardman, J.; Heidebrecht, K.; Shapiro, A.; Barloon, P.; Goetz, A. The spectral image processing system (SIPS)—interactive visualization and analysis of imaging spectrometer data. Remote Sens. Environ. 1993, 44, 145–163. [Google Scholar] [CrossRef]
  45. Ng, H.-F. Automatic thresholding for defect detection. Pattern Recognit. Lett. 2006, 27, 1644–1649. [Google Scholar] [CrossRef]
  46. Zhang, J.; Li, P.; Wang, J. Urban Built-Up Area Extraction from Landsat TM/ETM+ Images Using Spectral Information and Multivariate Texture. Remote Sens. 2014, 6, 7339–7359. [Google Scholar] [CrossRef] [Green Version]
  47. Osgouei, P.E.; Kaya, S.; Sertel, E.; Alganci, U. Separating Built-Up Areas from Bare Land in Mediterranean Cities Using Sentinel-2A Imagery. Remote Sens. 2019, 11, 345. [Google Scholar] [CrossRef] [Green Version]
  48. Li, Y.; Tan, Y.; Li, Y.; Qi, S.; Tian, J. Built-Up Area Detection From Satellite Images Using Multikernel Learning, Multifield Integrating, and Multihypothesis Voting. IEEE Geosci. Remote Sens. Lett. 2015, 12, 1190–1194. [Google Scholar] [CrossRef]
Figure 1. The ability of radar data for detecting damaged areas under cloud and shadow conditions.
Remotesensing 13 01195 g001
Figure 2. The case study areas from Sentinel-2 data that acquired on the 5th of 2017, (a) Qasr-Shirin, and (b) Sarpol-Zahab.
Remotesensing 13 01195 g002
Figure 3. The primary result was reported by (a) UNITAR-UNOSAT and (b) the Iranian Space Agency.
Remotesensing 13 01195 g003
Figure 4. An overview of the proposed method in three steps.
Remotesensing 13 01195 g004
Figure 5. The result of built-up area detection on both datasets. (a) The ND-Based method in Qasr-Shirin, (b) Proposed method in Qasr-Shirin, and (c) Ground Truth of Qasr-Shirin.
Remotesensing 13 01195 g005
Figure 6. The result of built-up detection on both datasets. (a) The ND-Based method in Sarpol-Zahab, (b) Proposed method in Sarpol-Zahab, and (c) Ground Truth of Sarpol-Zahab.
Remotesensing 13 01195 g006
Figure 7. The result of the damage detection in both datasets. (a) The ND-Based method, (b) Proposed method in Sarpol-Zahab, (c) The ND-Based method, and (d) Proposed method in Qasr-Shirin.
Remotesensing 13 01195 g007
Figure 8. The result of damage detection on both datasets. (a) The ND-Based method in Sarpol-Zahab, (b) Proposed method in Sarpol-Zahab, and (c) some sample region for damage analysis.
Remotesensing 13 01195 g008aRemotesensing 13 01195 g008b
Figure 9. The result of damage detection on both datasets. (a) The ND-Based method in Qasr-Shirin, and (b) Proposed method in Qasr-Shirin.
Remotesensing 13 01195 g009
Figure 10. The zoom-in result of multilevel damaged region detection in Sarpol-Zahab. (a) GT by UNITAR-UNOSAT, and (b) GT by Iranian Space Agency, (c) ND-Based method, and (d) Proposed Method.
Remotesensing 13 01195 g010
Table 1. Confusion matrix (TP: True Positive, TN: True Negative, FP: False Positive, and FN: False Negative).
Predicted
Built-UpNon-Built-Up
ActualBuilt-UpTPFN
Non-Built-UpFPTN
Table 2. The metrics were used for the accuracy assessment of the built-up mapping.
Accuracy IndexFormula
OA ( TN + TP ) ( N )
BA ( Recall + Specificity ) ( 2 )
F1-Score 2 × TP ( 2 × TP + FP + FN )
FA ( FP ) ( TN + FP )
KC PCC P e 1 P e
Precision ( TN ) ( TN + FP )
Recall ( TP ) ( TP + FN )
MD ( FN ) ( TP + FN )
Specificity ( TN ) ( TN + FP )
N TN + TP + FP + FN
P e ( T P + F P ) × ( T P + F N ) + ( F N + T N ) × ( F P + T N ) N 2
Table 3. Various types of the spectral index used for predicting objects [15].
FormulaAbbreviationIndex
( G r e e n N I R ) / ( G r e e n + N I R ) NDWI2Second Normalized Difference Water Index
( N I R L × R e d ) , L is the slope of the soil lineWDVIWeighted Difference Vegetation Index
( ( G r e e n N I R ) / ( G r e e n + N I R ) + 0.5 ) 0.5 TNDVITransformed Difference Vegetation Index
( ( G r e e n 2 + N I R 2 + R e d 2 ) / 3 ) 0.5 BI2Second Brightness Index
( R e d G r e e n ) / ( G r e e n + R e d ) CIColour Index
NIR-cos(a) × Red,
a is the angle between the soil line and the NIR axis
PVIPerpendicular Vegetation Index
N I R / R e d RVIRatio Vegetation Index
( N I R R B ) / ( N I R + R B )
RB = Red − Gamma × (Blue − Red), Gamma = 1
ARVIAtmospherically Resistant Vegetation Index
( N I R m i d d l e _ N I R ) / ( N I R + m i d d l e _ N I R ) NDWINormalize Difference Water Index
R e d 2 / G r e e n 2 RIRedness Index
Table 4. Various types of spatial indices originated from the GLCM matrix [15,39].
NO.Full NameFormulaDescription
1Contrast n = 0 N 1   n 2 i = 1 N   j = 1 N p ( i , j ) 2 ,   | i j | = n Degree of Spatial Frequency
2Correlation i = 0 N 1   j = 0 N 1 { i j ) P ( i , j ) μ x μ y σ x σ y P ( i , j ) Grey Tone Linear Dependencies in the Image
3Variance i = 1 N   j = 1 N ( i μ ) 2 P ( i , j ) Heterogeneity of Image
4Homogeneity i = 0 N 1   j = 0 N 1 1 1 + ( i j ) 2 P ( i , j ) Image Homogeneity
5Sum Average i = 2 2 N i P x + y ( i ) The Mean of the Gray Level Sum Distribution Of The Image
6Entropy i = 0 N 1   j = 0 N 1 P ( i , j ) log ( P ( i , j ) ) The randomness of Intensity Distribution
7Dissimilarity i = 1 N   j = 1 N   | i j | P ( i , j ) Total Variation Present
Where p(i, j) is (i, j)-th entry of the normalized GLCM, N is the total number of gray levels in the image, and x, y, and μ, σ denote the mean and standard deviation of the row and column sums of the GLCM, respectively.
Table 5. The numerical results for the built-up area detection on two datasets.
MethodRegionOAPrecisionMDFAF1-ScoreRecallSpecificityKC
ND-BasedSarpol-Zahab62.370.4610.3040.4130.5550.6960.5870.252
Qasr-Shirin75.070.6110.7270.0660.3770.2730.9330.249
ProposedSarpol-Zahab89.440.8850.21070.0520.8340.7890.9470.757
Qasr-Shirin95.880.9640.1150.0130.9220.8850.9870.894
Table 6. The accuracy assessment of the result of multiple damage map of the ND-based method on the Sarpol-Zahab dataset.
Ground Truth
No-DamageLow-DamageMedium-DamageHeavy-DamageClassification OverallUser’s Accuracy (%)
PredictedNo-Damage102352050
Low-Damage000000
Medium-Damage000000
Heavy-Damage000000
Truth Overall1020020------
Producer’s accuracy (%)100000------------
Overall accuracy (%) 50
Table 7. The accuracy assessment of the obtained multiple damage map based on comparison with the reference map for the Sarpol-Zahab dataset.
Ground Truth
No-DamageLow-DamageMedium-DamageHeavy-DamageClassification OverallUser’s Accuracy (%)
PredictedNo-Damage60006100
Low-Damage1200366.67
Medium-Damage2021540
Heavy-Damage1014666.67
Truth Overall1023520------
Producer’s accuracy (%)6010066.6780------------
Overall accuracy (%) 70
Table 8. Comparison of the built-up area detection methods in terms of accuracy.
MethodZhang, et al. [46]Ettehadi Osgouei, et al. [47]Li, et al. [48]Proposed Method
Overall Accuracy92%93%94%96%
Publisher’s Note: MDPI stays neutral with regard to jurisdictional claims in published maps and institutional affiliations.

