1. Introduction
With the free-of-charge release of high temporal resolution Moderate Resolution Imaging Spectroradiometer (MODIS) imagery by the U.S. Geological Survey (USGS) in 1999, the enormous potential of Earth Observation (EO) time-series analyses became apparent to a broad geoscientific community. Publishing the USGS Landsat Archive in 2008/2009 [
1,
2] further boosted the use of remote sensing data, allowing for large-scale land-use studies at low costs [
3]. Fortunately, the European Commission also adopted an open data policy for its Copernicus program with its Sentinel satellites [
4] and high-capacity ground segment. This took the distribution of microwave and optical EO data with high geometric and temporal resolution to a new level [
5]. The amount of available raw and value-added data from Copernicus’ Sentinel satellites has been rising steadily since the launch of the first Sentinel satellite (Sentinel-1A) in 2014, reaching levels of 18.5 TiB per day in November 2019 [
6]. The variety and unprecedented volumes of freely available EO data provided by the MODIS sensors or by satellites such as from the Landsat or the Copernicus Sentinel series forced a paradigm shift in how EO data are managed and processed at the Petabyte scale [
7], urging software and processing capabilities to be brought to the data archives. New big data technologies capable of dealing with the increased volume, variety, velocity, and veracity of the EO data [
8] are emerging, paving the way for new market players, service offerings, and new user groups.
With EO data becoming more and more attractive for science, the industry, and public services alike, the amount of providers of backends (data access and processing layers with an internal structure, normally hidden to the users) has grown quickly in recent years [
9]. All these backend providers have adopted their own customer-driven development paradigm [
10], leading to a lack of widely accepted and used standards [
11]. The resulting technical challenges for end and intermediate users [
12] are manifested in their inability to switch easily between service providers and to compare the results of different backends. With increasingly available data from new satellites and sensors, the relatively slow progress regarding interoperability, transparency, and reproducibility between cloud services [
13] becomes an obstacle for users and information and communication technology experts.
Addressing the need for cross cloud platform comparability, users and service providers increasingly implement policies to develop consensus-based open standards for EO processing [
14]. Here, the International Organisation for Standardisation (ISO) and the Open Geospatial Consortium (OGC) are leading organisations in defining formal standards for geodata models (ISO on an abstract level and OGC following the implementation of EO data). However, these standards, such as ISO 19123 or the subsequent OGC model, are designed very strictly regarding data representation at the backend. Continuing this example, to become Web Coverage Service (WCS) compatible, image collection would have to be mosaicked into coverages in a preprocessing step, resulting in data loss by abandoning overlaps and acquisition time information. Therefore, the current formal standards do not offer flexibility to users and service providers about data representation. While the developing process of these standards is inclusive, expected investments in the form of member fees and long-term time consumption to jointly evolve them is an impediment to openness [
14]. Therefore, not all service providers follow these formal standards for the usability of EO data and choose their own methods of data storage and distribution: such as scenes/tiles (or granules) typically spread over different coordinate reference systems. Tiles are homogeneous sections of the Earth, which may only be partly filled with imagery when the satellite swath does not cover them entirely. Because most satellites move while observing, the time stamp of an observation is aligned with the satellite’s path. Google Earth (GE) and, later, Google Earth Engine (GEE) [
15] have set a new benchmark about the usability of EO data, creating a system that allows for interactive and responsive visualisation (GE) and analysis (GEE) despite huge data sizes by hiding the complexity of tiles, by varying coordinate reference systems, and by using irregular time stamps from the end users. GEE does that (i) by giving the user access to all tiles of image collections from a certain sensor rather than spatially restricting the access to individual tiles; (ii) by allowing users to work with arbitrary coordinate reference systems, coordinate extents, and spatiotemporal resolutions while performing on-the-fly resampling; and (iii) by lazy evaluation, meaning that only pixels that are actually requested to be visualised are queried or computed.
As it is the case with most closed-source cloud-processing platforms, a limitation of GEE is that its functionality, despite being large, cannot be easily extended by users; for example, user-defined time-series models or machine learning prediction algorithms cannot be applied easily to an image collection stored in such a system. Additionally, developing an independent implementation for validating the results against another backend tends to be cumbersome and not very likely to be undertaken by dedicated researchers, which questions the scientific relevance of such results. This limited reproducibility may be increased by a possible lack of backend documentation regarding specific functions or collections. Furthermore, it is not easy to compare the costs of a processing job (for jobs that exceed the free limits) with the costs on another platform. All these difficulties contribute in varying degrees towards a vendor lock-in of the cloud platforms. To encourage thriving innovation processes, connecting user communities and service providers, innovation processes need to be opened up to all active players so that knowledge can circulate more freely in a multi-collaborative environment [
16].
Over the last years, acceptance of and demand for EO-related open source software and data have increased among users from the industrial, academic, and governmental sectors (see, e.g. [
17]). Answering this demand, the open source openEO API [
18] was developed. With its possibilities of a standardised communication and of hiding architectural differences between cloud platforms [
19,
20], it reduces the described lack of cross cloud platform comparability. Next to a growing amount of predefined EO data-related processes to be accessed by users in a standardised way on the backend (currently 140+), openEO enables users to process user-defined functions (UDFs) at cloud providers’ premises to allow for wide use of the API. While being platform independent, the openEO API currently supports the most popular clients within the EO community: R, Python, and JavaScript. Seven cloud platforms (see backend description) are presented here, serving as templates for additional endpoints. While not all platforms support the full range of possible processes, comparing and validating different cloud-processing platforms still becomes more trivial using this API.
This article describes the functionality of the openEO API, its architecture, and its communication strategies. The homogenisation of EO data access via the API is discussed as well as specific strategies of its realisation for participating backend providers. Afterwards, its functionality will be demonstrated on two use cases, showing its comparability between different cloud platforms and with a locally implemented workflow.
2. openEO API
2.1. Communication Strategy to the Backends
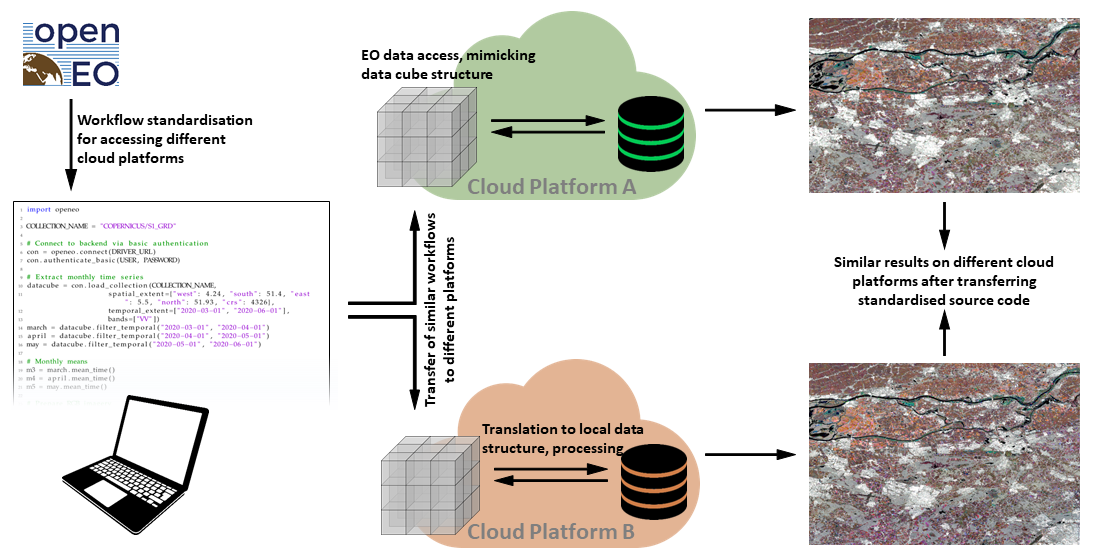
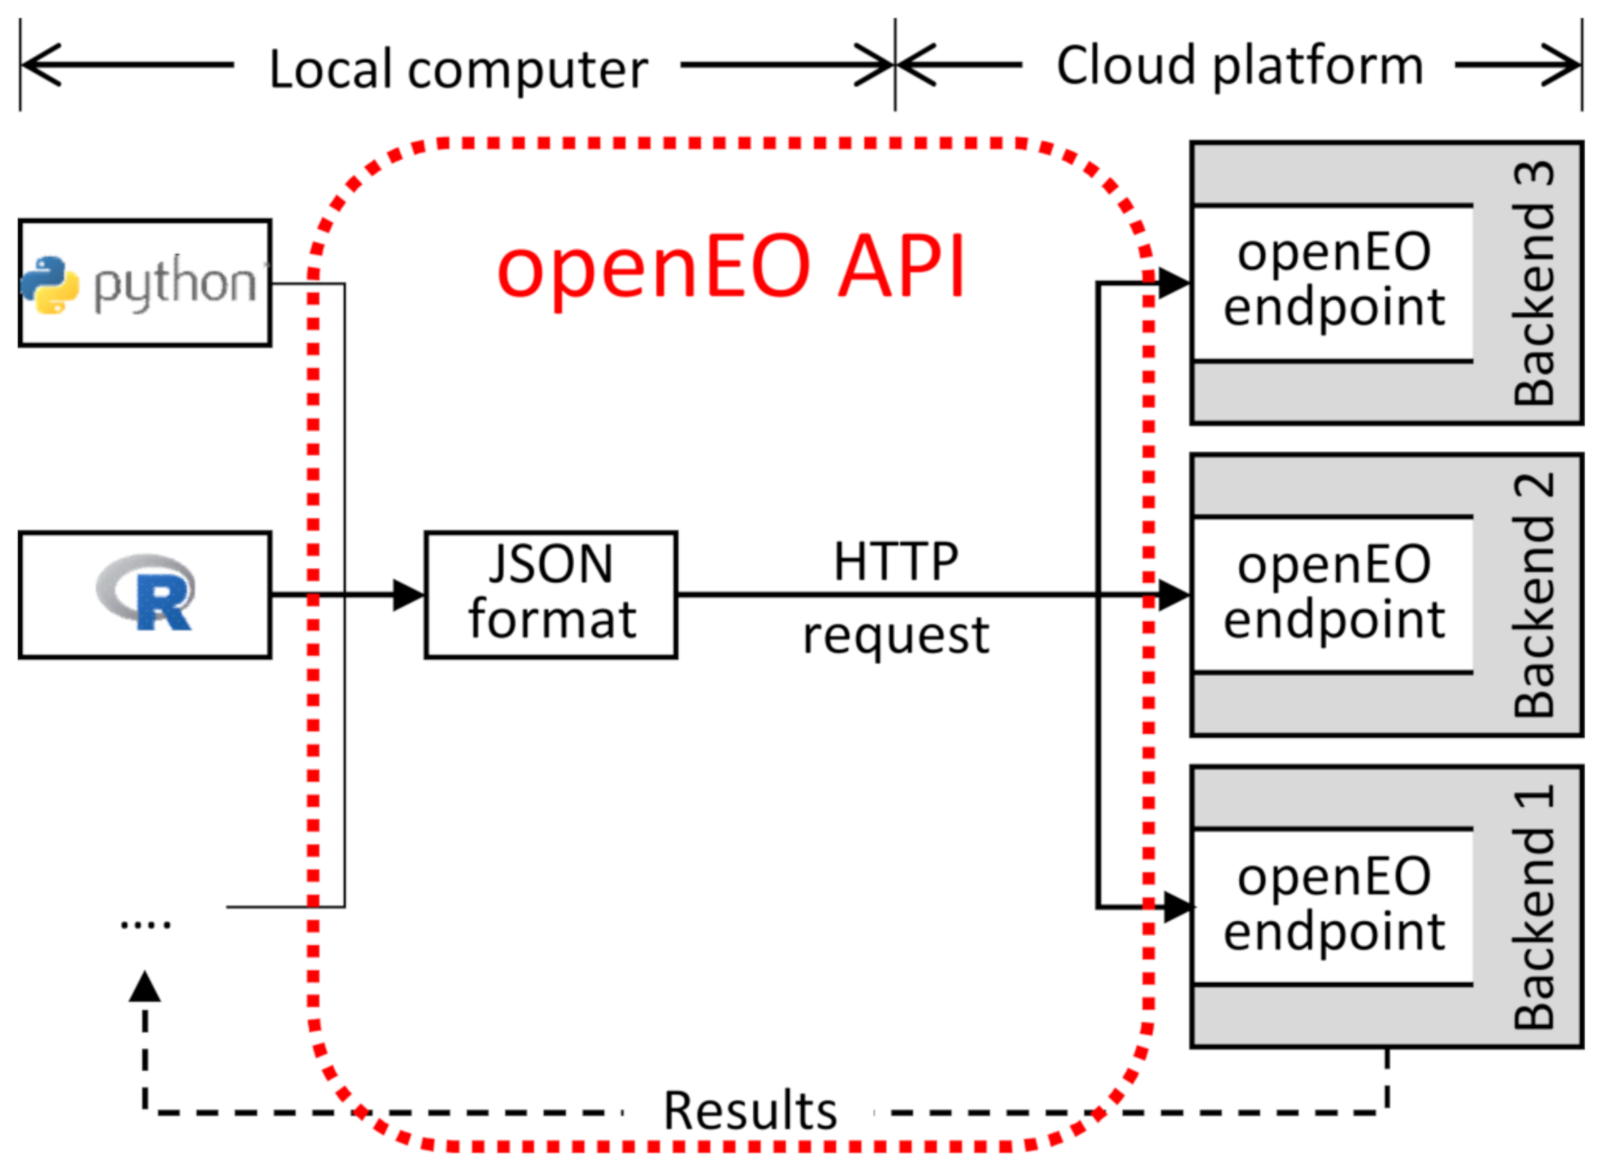
The openEO API is a communication interface that enables standardised access to EO data/processing capabilities across distinct cloud service providers with unique architectures. It provides a common method for client software written in different programming languages, such as Python, R, or JavaScript, to connect to EO backends. Thus, openEO users can query and process EO data directly at the backend side. Instead of a direct many-to-many communication between various programming languages and cloud providers, many-to-one communication can be realised towards the openEO access points of compliant backends (see
Figure 1). Being placed between the clients’ applications and the service providers’ backends, the openEO API establishes standardised contracts between them.
For this purpose, openEO provides a set of software components that are deployed by participating cloud providers to interpret and run standardised processes on their EO data. The provided functionality covers all aspects of the EO data life cycle—from querying and accessing EO data, through their processing, to the distribution of resulting products. By adopting these components, third-party platform providers are able to create new openEO endpoints tailored to their backends and thus to become openEO compatible. Furthermore, the openEO API can be extended by new process libraries or additional programming languages. This requires either an adjustment of existing components or the one-time development of new ones that follow the openEO specification and translate requests into backend-specific operations.
To enable users to communicate with the backends via the API, an openEO client library needs to be embedded into the locally written code. The client library’s syntax is adapted to its representing programming language environment. While this implies a limitation of comparability between the different programming languages’ workflows, it is seen as user friendly to follow their respective syntax standards. Since the communication itself is designed as being language neutral, openEO is expandable to additional programming languages.
The openEO API translates the locally implemented source code into a uniform human- and machine-readable JavaScript Object Notation (JSON) format (see
Figure 1), which is sent via HTTP request to a compatible backend. To become compatible with the API, a backend needs to provide an openEO endpoint that translates the received standardised process chain to the local requirements. The process chain will then be executed using EO data, hardware, and software provided by the cloud service. The resulting data can be visualised or downloaded by the user on demand by sending another HTTP request to the backend. The execution of this workflow can be done either (i) as a submitted batch job, which will be processed once on request and stores the results at the backend premises; (ii) via on-demand web services using protocols such as OGC Web Map Service (WMS), OGC WCS, or XYZ tiles for web-based access; or (iii) by executing synchronously lightweight processes, such as for small test areas.
openEO-compatible backends are currently run for the following EO cloud commercial and academic service providers: CREODIAS (Warszawa / PL), EODC GmbH (Vienna / AT), EURAC Research (Bolzano / IT), Google Earth Engine (Mountain View, CA / US), Joint Research Centre (Ispra / IT), mundialis GmbH & Co. KG (Bonn / DE), Sinergise Ltd. (Ljubljana / SI), and VITO N.V. (Mol / BE). These openEO backend drivers are meant to serve as templates for third-party cloud providers to connect their additional standards, architectures, technologies, or processes to the openEO syntax without having to change their existing infrastructure. This eases creating new backends for other interested cloud operators.
By accessing these service providers via their openEO endpoints, users do not have to adapt their processes to possible backend-specific constraints regarding, e.g., complex backend infrastructure, various software layers, virtual environments, or data representation. Instead, the access points provide users with a standardised data model, as described in the following section. The only limitation for the users may result from backend internal decisions regarding implementation of the available processes.
2.2. openEO Data Cube Model
openEO helps users connect to the compatible backend providers’ EO data in a comparable way by mimicking the functionalities of geospatial data cubes, independent of the local data structure. With the API transferring standardised commands into the real data storage structure, users are able to treat the backends’ EO data and meta-data as virtual data cubes via the openEO access points. These principles, which are made to be compatible with the currently evolving standards of the SpatioTemporal Asset Catalog (STAC) [
21], involve typical data cube aspects, as described in [
22,
23]. This section characterises firstly the virtual data cube, provided by the openEO API, and secondly existing data representation and access strategies of select compatible backends. Finally, the use of UDFs for the virtual data cube is described.
2.2.1. Virtual Data Cube
Parameter Model
The virtual data cube itself, being visible to the client users, is designed as a multidimensional array of diverse spatial, temporal, and band-related dimensions, representing a function . While the range of independent dimensions of the domain D is designed to be backend-specific and to depend on the characteristics of the provided geospatial data, it includes in the openEO syntax at least two spatial dimensions, typically one temporal and one band/polarisation dimension. While the details of the co-domain C may also depend on the backend’s policies, it is represented by a single scalar value. For both the domain and co-domain, their data types and syntax are backend-specific and depend on the nature of the underlying EO data. The virtual data cube is accompanied by a meta-database, consisting of all the additional information (e.g., platform, dataset descriptions, or user rights) and following the STAC metadata specifications. The meta-database also entails ordering all nominal dimensions’ value ranges (including, e.g., spectral bands).
Data Representation
The canonical data cube for EO data is typically a dense array [
24], where for (nearly) every combination of, e.g.,
2D/3D coordinates,
time, and
spectral band, a valid pixel value is available. In practice, EO data are collected along a satellite’s orbit and form a spatial trajectory; an upscaling of the spatial and temporal dimensions may become necessary to create dense data cubes (coverages of analysis ready data) from this information. These resampling processes result in some data loss, which cannot be reversed. The virtual data cube model created here does not create and store a dense data cube but gives access to spatiotemporal array data that may be in dense form or that may consist of a very sparse array, formed by the image collection of the originally distributed product (e.g., the collection of Sentinel-2 scenes). The virtual data cube model of the openEO API allows users to query such image collections using data cube queries, where backends—if necessary—composite image collections to dense data cubes on the fly and where parameterisation of this process can be controlled by the user’s query.
Data Organisation
The EO data on which the virtual data cube is based are structured by backend providers in diverse local strategies (e.g., by granule, as collections of GRIB or NetCDF files, or as a collection of arrays in an array database). Since the locally required access commands are operationally translated into a data-cube-compatible form, the backends’ choices about the data management do not affect its access beyond a potential on-the-fly transformation of data formats. Only with the download of products, the user has to settle for a specific data format and characteristics. Although the API is format agnostic, backends allow the data to be downloaded as NetCDF, GeoTIFF, PNG, GIF, JPEG, CovJSON, and generic JSON. In addition, web services can be set up to interactively browse the computed imagery with lazy calculation—triggered, e.g., by panning or zooming—or with already pre-computed data.
Access and Analysis
Following the Committee on Earth Observation Satellites (CEOS) OpenSearch Best Practice [
25], openEO classifies data extent into two granularity levels. Granules, being the finest granularity of EO data that can be independently accessed, refer in the openEO syntax typically to limited areas and single overpasses, leading to very short observation periods (i.e., seconds) or pre-computed temporal aggregations of such data (e.g., MODIS 16-day composite MOD13Q1). Collections—a set of granules sharing the same product specification—typically correspond here to the series of products derived from data acquired by a sensor on board a satellite and having the same mode of operation. Being a choice of the backend providers, fused data or value-added products also can be provided within single collections. When accessing (a subset of) a collection, the openEO API provides on-the-fly spatiotemporally mosaicked and resampled EO data from the backend to the user as a virtual geospatial sparse data cube. All further openEO functionalities are designed to address this data cube format.
The openEO functionalities are represented by a set of EO data-related processes between compatible clients and backends and cover aspects from all domains of processing EO raster data in the cloud: (i) user authentication; (ii) data query and filtering; (iii) math and logical operators for pixels and slices; (iv) binary reduction and subsetting operators; (v) data merge, mosaicking, and layer stacking operators; (vi) sorting and ordering; (vii) resampling processes such as reprojection to change the virtual data cube’s geometry; (viii) processes to visualize, store, or download EO data from the backend; and (ix) contracts regarding job management and process monitoring. A full and maintained list of predefined processes can be found at
https://processes.openeo.org/ (accessed on 9 March 2021). While several of the defined processes are dimension neutral, others explicitly are designed for temporal or for spatial dimensions, e.g., aggregation over a spatial polygon or particular temporal intervals.
The extent of the processes’ implementation, which is seen as a basic catalogue, finally depends on the backend providers. Additionally, user-defined functions (UDFs, see below) can be developed, accessing the virtual data cube. These UDFs can also be composed of the available contracts, chained into higher-level workflows and stored for re-usage in other processes.
Interoperability
While the used standards in the data cube design, the common processes, and the communication via standardised HTTP requests foster comparability between different backend services, the data availability and denomination of data resources are not influenced by the virtual data cube. Therefore, interoperability between participating service providers at the level of being able to execute identical (pieces of) code cannot be guaranteed by the openEO API itself. Instead, the (intermediate or end) user has to take into account these backend-specific decisions to be able to query and process similar EO data. Two backends are interoperable, when all processes of the openEO standard are implemented and they provide the same collection of EO data (including identical naming).
2.2.2. Description of the Compatible Backends
This section describes the openEO compatible backends currently available. The existing driver APIs are tailored to serve as access points to these infrastructures. Due to the platforms’ varying business models, not all functionalities of the openEO API are implemented at the different platforms alike.
Table 1 lists differences in the backend implementations of the openEO API.
Apache Airflow + eoDataReaders
This driver targets file-based backends, storing Copernicus’ Sentinel Level-1 data in a PetaByte scale in their original compressed format. A developed Python library (eoDataReaders) based on OSGeo’s GDAL is able to read and process Sentinel-1, -2, and -3 data as well as generic geocoded raster data. eoDataReaders is used in conjunction with Apache Airflow to schedule and monitor jobs and with a Celery cluster for job execution. With this approach, an openEO job is dynamically converted to an Airflow Directed Acyclic Graph (DAG). Each task in the DAG is executed on a Celery worker using eoDataReaders. The API layer is built with Python’s Flask and Nameko microservices. Metadata are stored and published via OGC Catalogue Service for the Web (CSW). This driver additionally supports UDFs in Python and R.
Spring Boot Backend (Supporting Web Coverage Processing Service (WCPS) and Open Data Cube (ODC))
Using Spring Boot 2, this implementation of the openEO backend API allows for interacting with existing frameworks for data cube management. Currently, it supports the Open Geospatial Consortium (OGC) Web Coverage Processing Service (WCPS) by translating an openEO process graph into a WCPS request and a newly developed processing engine based on x-array and dask on top of the Open Data Cube (ODC). The WCPS is provided by rasdaman version 10 [
26], an array database that allows for storing and querying of data, which are organised as multi-dimensional arrays. Both ODC and rasdaman can analyse arrays residing in file system directories as well as in databases.
Spring Boot allows for flexible configuration with respect to the authentication and authorisation workflow as well as data persistence. The current implementation at the premises of EURAC Research uses keycloak linked to the EURAC Active Directory and generally Microsoft Accounts as identity providers for authentication and authorisation and a simple h2 database for persistent management of batch jobs, results, and process graphs.
The driver supports UDFs written in Python and R by hosting them as microservices in independent docker containers.
Sentinel Hub
The Sentinel Hub accesses EO data from external data storage without storing copies on its own infrastructure. Therefore, the data organisation and data representation are slightly different for each dataset. In most cases, the data are stored in single-band two-dimensional image files organised by acquisition time, location, and band. The design of the backend relies on the fact that many existing image formats are already optimised for fast retrieval of partial data from encoded files—JPEG 2000 has built-in pyramids based on wavelet transform, and cloud-optimised GeoTIFF and NetCDF/HDF are often self-contained data cubes themselves. The service combines this with a comprehensive catalogue, allowing for transfer of only the parts of source files that contribute to the requested end result, and exploits the fast data access and parallelisation capabilities of contemporary cloud infrastructures.
For accessing and analysing the data, the service offers low-level APIs for custom per-pixel processing, both single-scene and multi-temporal. The results are produced on the fly with user-defined grid spacing, projection, and encoding.
GeoTrellis
GeoTrellis is an open source Scala library that facilitates operations on data, organised in a 2D raster or 2D/3D vector format using Scala and Apache Spark. Raster data must be organised as single GeoTIFF files in a common location [
27]. Compatible tile storage or database backends are Apache Accumulo, Cassandra, GeoMesa, HBase, and S3. The GeoTrellis library also includes a large collection of processes for accessing and analysing geospatial data; Python bindings are used to enable integration of libraries available in that ecosystem.
While the used libraries do not impose a specific data organisation, its choice does affect the performance. File organisations based on cloud-optimised GeoTIFFs have been shown to work well; other formats such as JPEG 2000 are equally possible. Ingestion into dedicated systems, such as Accumulo, gives very good results performance wise but is more costly to set up and operate.
The use of Apache Spark to distribute processing jobs makes this a very scalable implementation as long as the workflows can be designed to work on smaller parts of the data cube in parallel. Algorithms that are designed to work on the original files or depend on a given file organisation are harder to integrate in this framework. Data are mostly kept in memory, but Spark can dynamically decide to write intermediate results to a disk if insufficient memory is available.
For very large-scale processing (e.g., global of Sentinel-2 archive), it is currently recommended that the end user splits the processing job into smaller regions to prevent requiring a very large processing cluster. The recommended size of a processing job depends on the job complexity and type of input data.
GRASS GIS-Actinia
GRASS is an open source GIS for 2D/3D raster and vector data that includes a SQL-based attribute management [
28]. EO data of a specific geographic extent have to be organised in the same projection (coordinate reference system). They can be accessed via the geoprocessing platform actinia, ingesting and analysing EO and GIS data [
29]. Data storage and file format are handled internally by GRASS GIS. Supporting spatiotemporal data cubes through its GRASS GIS backend, actinia can serve as an access point for EO data cube-related processes of all aspects of the EO data life cycle. Using the
PyGRASS [
30] or the
GRASS GIS Temporal framework [
31], these processes can be realised at a GRASS GIS-based backend. Data are mostly kept on disk, typically only a single raster row is loaded to memory, processed, and written out. This makes it possible to process very large datasets with limited resources. Raster data cubes are represented as stacks of 2D raster maps with associated metadata such as timestamps or band reference information for multispectral data. Each stacked layer can be accessed as a particular slice of a raster data cube or directly as a single 2D raster map, handled as a virtual dataset, and managed in an internal database.
JEODPP
The JRC Big Data Platform is a versatile data-intensive computing platform that has been developed to accommodate different service levels ranging from large-scale batch processing to interactive visualisation and analysis of geospatial data. Data collections are described in a
PostGIS database that holds metadata of all available geospatial data. The data are stored in their original format and gridding. A representational state transfer (RESTful) web service is implemented that can handle HTTP requests to query the collections in the database. The concept of a virtual data cube is implemented, using the open source Python library
pyjeo [
32].
Data cubes are created in-memory on the fly in a target reference system. Re-projection, resampling, and composition occur at the time of the data cube creation. The pyjeo library uses a multi-band 3D model, where each band represents a 3D contiguous array. Two dimensions refer to the spatial domain (x and y), and a third dimension refers to the temporal domain. The datacube is tiled to reduce the memory footprint, and each tile is processed in parallel in a cluster managed via Kubernetes. Processing performance is further optimised via multi-threading.
Google Earth Engine
Google Earth Engine is an online platform offering free cloud-based computation on EO data. It provides a set of JavaScript and Python processes that can be accessed via the Google Earth Engine API. The internal architecture of the hosted service is mostly hidden to the user community [
15]. The openEO Google Earth Engine driver is a facade to the GEE API, currently hosted by a separate infrastructure. It is a Node.js server implementation that realises the openEO API and translates incoming openEO processes into corresponding requests to the GEE API. Therefore, the driver capabilities are limited to the provided functionality by GEE.
As a major difference to the openEO’s virtual data cube model, GEE works mostly on images and image collections. The most similar element to the data cube in the backend is image collection as well-defined by two spatial dimensions, one temporal and one spectral dimension. It is defined as a stack of image data models. Due to differences in the image collections regarding available operations and metadata structure, the openEO driver internally manages the virtual data cube with metadata that is required to offer a data cube view on top of Google’s data models.
2.2.3. User-Defined Functions
UDFs—arbitrary code snippets—can be embedded into the openEO process chains to supplement the provided predefined processes. UDFs are currently supported for Python and R. The custom scripts are uploaded to a backend file storage and are called via a predefined process. Their I/O data need to be openEO compliant and can be defined as a multi-dimensional array, a time series, or an array. They can be applied either to individual values, to specific dimensions, or to a complete neighbourhood. Additionally, they can reduce dimensions to single values. Their enhanced flexibility is offset by a missing transparency for the backends regarding their functionality, preventing possible support regarding processing efficiency or future optimisation.
Unlike the predefined processes, the UDF service is not directly accessible to the clients. Instead, to avoid security issues, the scripts are sand-boxed at the backend. For its execution, the uploaded UDF script (see
Figure 2) is sent together with data from the processing chain to a UDF platform. Upon completion of the processing, the result is sent back and re-integrated into the process chain.
A backend can provide multiple runtime environments in which the function is executed. That gives the user the ability to switch between different versions and combinations of libraries and helps to ensure reproducibility. This is implemented by using Docker containers, which also provides a way to sandbox execution of user codes. As data cubes can be very large, the backend might run the code on a smaller subset of the whole cube. Therefore, depending on the context in which a UDF is invoked, a backend passes different subsets of data into a single UDF call. This allows the UDF to be invoked in a parallel manner.
UDFs can be stored at the backend for reuse.
3. Materials and Methods
The openEO API can be used for general processing of EO data on the various participating backend infrastructures. A typical workflow consists of a sequence of the existing predefined processes (currently 140). However, many EO algorithms require particular, non-standard processing blocks that are beyond these tailored openEO processes and beyond processes available at other EO cloud solutions. To demonstrate both possibilities, two use cases are presented. At first, a workflow of predefined processes is executed on three different backends to demonstrate their comparability with the API. Secondly, a more complex workflow that combines both openEO predefined processes and UDFs is shown and compared to a locally executed workflow.
The two use case descriptions firstly entail descriptions of the test areas and used EO data. Afterwards, the workflows are described, followed by analyses of their results.
3.1. Use Case 1: Predefined Functions—Comparability of Backends
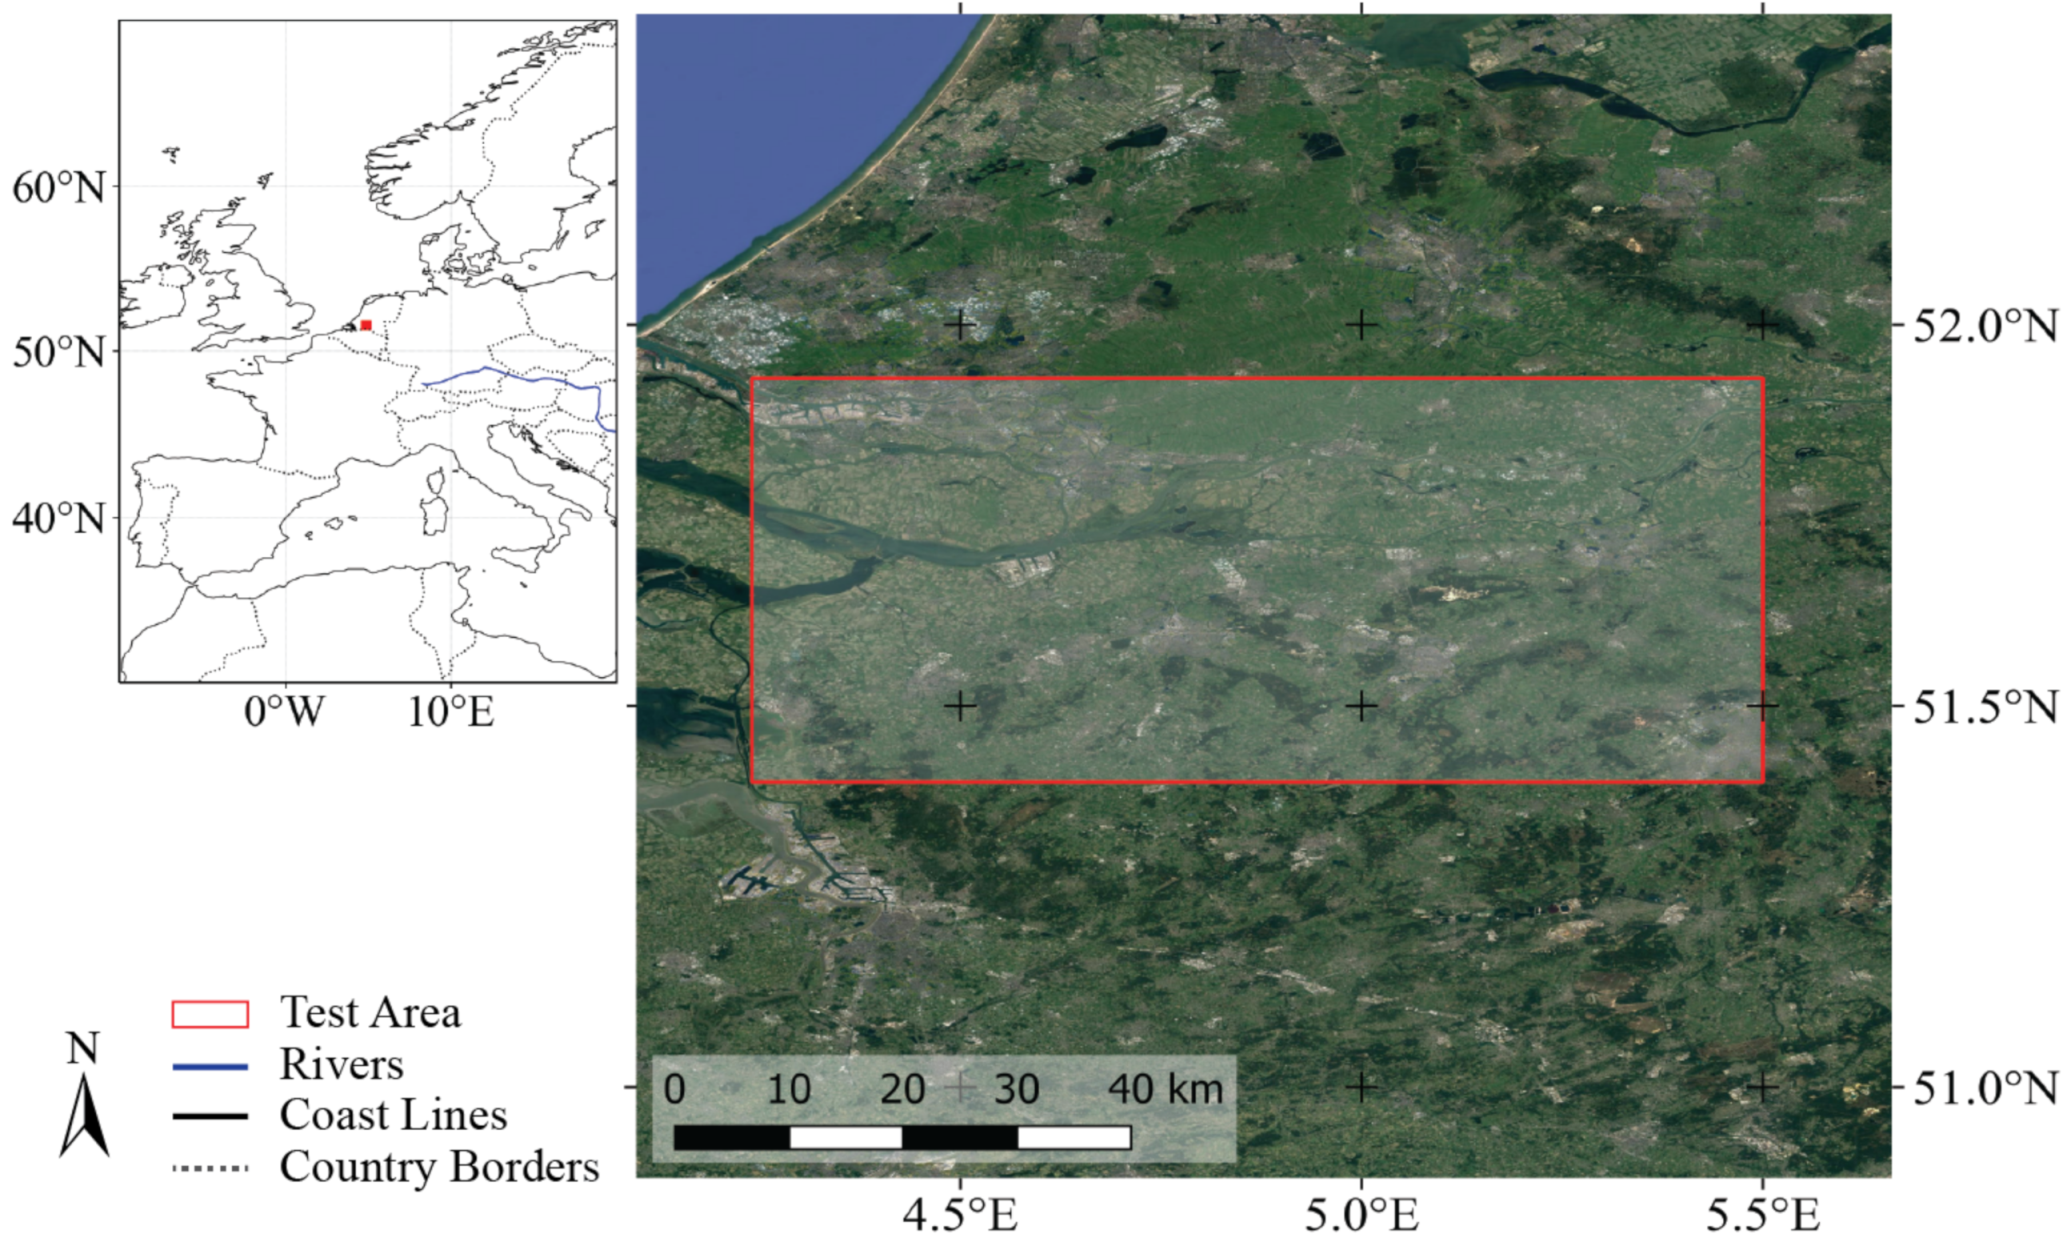
For this use case, a region of interest (ROI) was chosen in The Netherlands, between the cities of Rotterdam and of Eindhoven (see
Figure 3). This area is characterised by diverse land cover types, including a national park, urban areas, agriculture, forestry, grassland, bare soil, and open water bodies. This diverse landscape implies different radar backscatter characteristics over time, which were monitored in this example. From the time series of Sentinel-1
backscatter data between March and May of 2020, temporal composites were created on different backends by using an identical workflow of available predefined openEO processes.
The workflow was written in Python (Listing ) and executed at the backends of GEE, Flemish Institute for Technological Research (VITO), and JRC mostly without changing the syntax. Backend-specific definitions such as the backend URL or collection name were written for GEE and added as comments for VITO and JRC. After importing the openEO library, authentication details for the backend of choice were defined. An image collection was loaded (line 16) and separated into three time periods of one month each. The collection’s name was not standardised by the openEO API but was an internal decision of the backend; it can be searched for with the process con.listcollections(). The lines 25 ff. deals with the monthly composites that are merged into an RGB image in lines 30 ff. This workflow was then sent with line 38 for execution to the backend of choice. Here, another deviation between running this job on different platform providers can be seen: the defined output formats were named differently.
Listing 1.
Python workflow for creating monthly composites of Sentinel-1 data at different backends.
Varying code segments are illustrated here with Google Earth Engine (GEE), Flemish Institute for
Technological Research (VITO), and Joint Research Centre (JRC).
Listing 1.
Python workflow for creating monthly composites of Sentinel-1 data at different backends.
Varying code segments are illustrated here with Google Earth Engine (GEE), Flemish Institute for
Technological Research (VITO), and Joint Research Centre (JRC).
3.2. Use Case 2: UDFs—Comparison with Local Workflows
This second example used a more complex workflow that combined both openEO predefined processes and UDFs and compared the results of the workflow executed at a backend and locally. The example was based on the Breaks For Additive Season and Trend (
BFAST) algorithm [
33] and its underlying
bfastmonitor method (
http://bfast.r-forge.r-project.org/ (accessed on 9 March 2021) that detects abnormal events (breaks) at the end of satellite-image time series (in the monitoring period) [
34,
35]. The method was used to detect activity data in the Brazilian Amazon and was applied on the Spring Boot backend of EURAC Research’s cloud platform, using the openEO API.
3.2.1. Test Area and Data Description
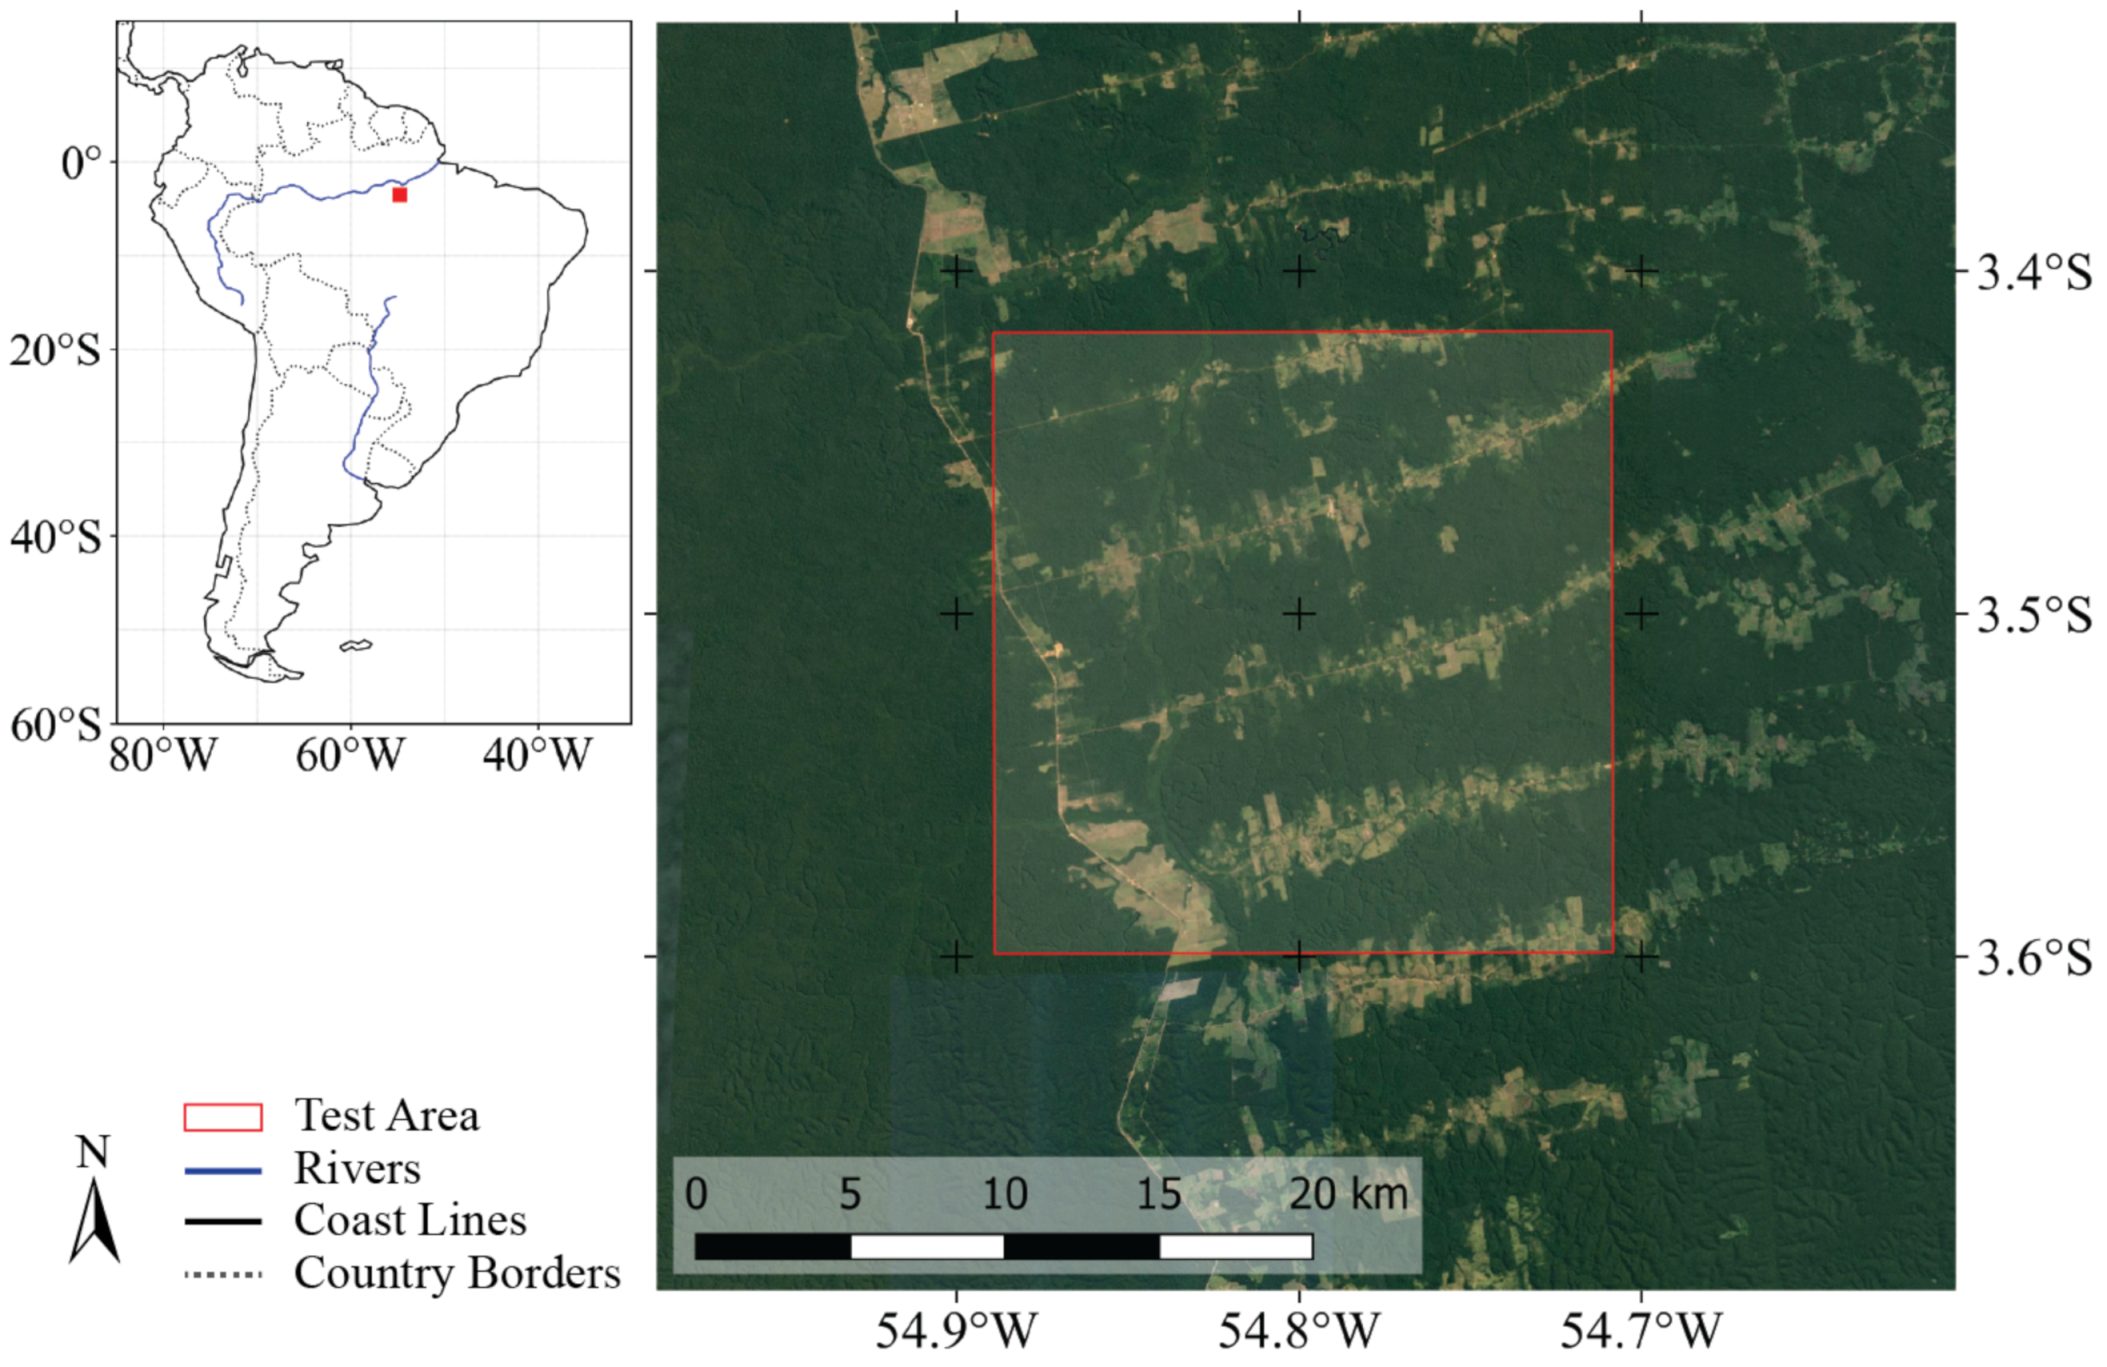
The ROI was located in the Brazilian Amazon rainforest (
Figure 4). This area is affected by anthropogenic impacts (mainly logging), resulting in a loss of total forest area and in degradation of the remaining primary forest [
36]. According to [
37], by 2013, only 20% of the tropical forest regions were without any remotely detectable sign of human activity, modifying their state either to secondary forest or to degraded primary forest. This use case demonstrated detection of the time of disturbances by determining the breaks in Sentinel-1 satellite time series with the
bfastmonitor method on the EURAC platform.
The test area covers about 40,000 hectares (20 km × 20 km) and is located east of the Tapajos river in the central-west part of Para state, Brazil (
Figure 4). It is characterised by intensive logging, resulting in a typical fishbone deforestation pattern with regularly shaped forest loss parcels spreading laterally from local roads. Beside deforestation, the region undergoes other land cover and land use conversions, which should ensure enough time-series breaks to test the openEO-BFAST workflow.
The workflow required Sentinel-1 backscatter images as input data. EURAC Research does not provide Sentinel-1 data at a global scale on its Spring Boot backend. Therefore, Sentinel-1 images were processed locally for the test area and then uploaded manually to the backend, where they are provided to the users as an image collection. This processing started from Sentinel-1, IW (interferometric wide-swath) mode, Level-1 ground range detected (GRD) images. To reduce the data volume and the upload time, only Sentinel-1A images acquired from 2017 to 2020 with the VH polarisation were considered. This resulted in a total of 92 images with time steps of 12 days between consecutive images. The produced Sentinel-1 image collection was an analysis-ready dataset (radiometrically corrected radar backscatter images) that is now available at this backend under the collection name “openEO_WUR_Usecase”.
3.2.2. Workflow
UDF Implementation
The UDF performs a BFAST-related workflow, processing input data in the form of a virtual data cube that is defined in the R client from the prepared Sentinel-1 image collection. The definition of the data cube in the R client is explained in the following section. Within the openEO UDF data framework, this virtual data cube was then injected as a stars-object data structure defined by the stars library for multi-dimensional array inputs.
Listing 2 shows the UDF code in R. After injecting the input data as a stars object and loading required R packages, a SpatialBFM (Spatial BFast Monitoring) function was defined (line 6) to create a single time-series object for the bfastmonitor method. The time series was set here to start at the beginning of 2017 and to include 30.67 observations per year (line 8), while the monitoring period of the bfastmonitor method itself began in 2019 (line 10). The output of bfastmonitor was a single value, representing the date of a potentially detected break. The function was applied pixel-wise (i.e., along the time dimension), resulting in a spatial raster with the break times given as a fraction of the year (line 16).
Listing 2.
Breaks For Additive Season and Trend (BFAST) UDF in R environment.
Listing 2.
Breaks For Additive Season and Trend (BFAST) UDF in R environment.
Client Implementation
This implementation part was based on the openEO R client library and its predefined processes. They were used to build, send, and run the processing graph for the openEO-BFAST workflow at the Spring Boot backend. The code developed for that is shown in Listing 3.
In a preprocessing step, the user firstly connected to an openEO backend via the openEO connect process, specifying the host URL and the appropriate user authentication details (Block 1). Secondly, a virtual data cube was defined from the Sentinel-1 data collection, using a specific identifier and limited spatially, temporally, and to the VH polarisation (Block 2). This data cube served as an input dataset for the UDF, as explained above. Therefore, the UDF code (Listing 2) was imported here as a string variable (Block 3); a processing graph was then built from the UDF with the run_udf process, using the data cube as input data (Block 4). This processing graph was then sent to be run on the backend as a batch call (Block 5).
Listing 3.
BFAST in an R client environment.
Listing 3.
BFAST in an R client environment.
Local Implementation
To compare the openEO-based implementation with an independent result, the BFAST UDF was also executed on a local computer, called by an openEO and backend independent workflow in an R environment (see Listing 4). Its output was used to identify possible backend-specific circumstances that may affect the results of openEO-dependent workflows at the cloud platforms (e.g., data transformation, resampling, and data type conversion). Therefore, the input dataset (line 2) used here is a multiband raster that is identical to the Sentinel-1 data collection used for the backend (Listing 3, Block 2).
Listing 4.
R code for local execution of BFAST UDF.
Listing 4.
R code for local execution of BFAST UDF.
4. Results
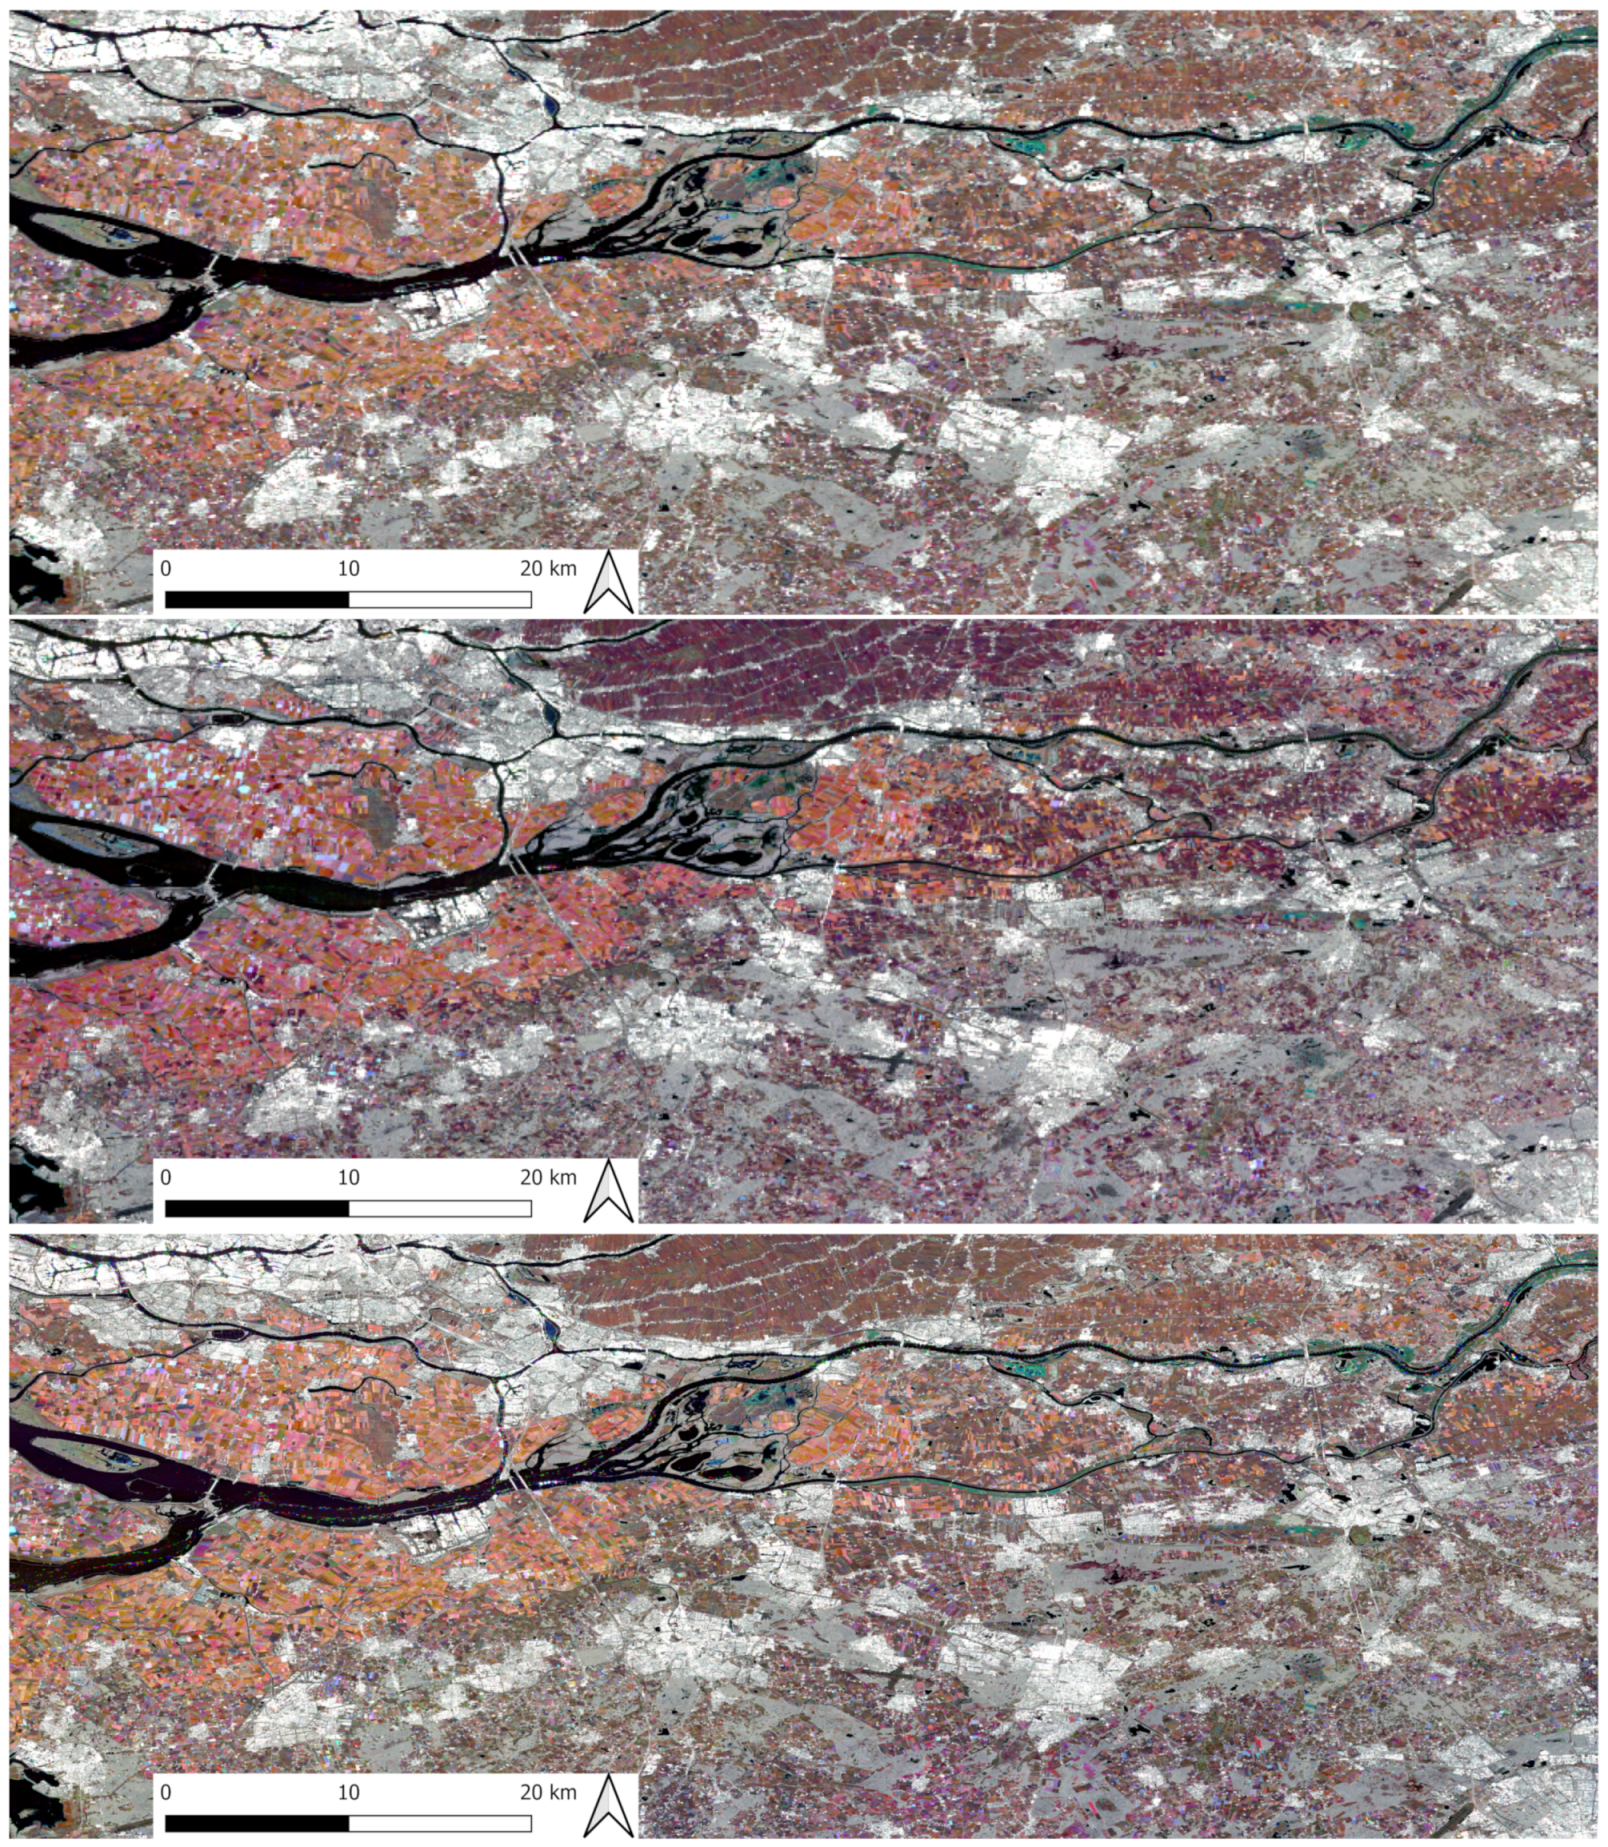
4.1. Use Case 1: Predefined Functions—Comparability of Backends
Figure 5 shows the output of the same workflow based on openEO-predefined functions executed at three different service providers. It can be seen that the results are similar but not identical. This is due to differences in the input data. For example, VITO provides data in a range of natural number values, while GEE does it in decibels. To avoid idle comparison between linear and logarithmic scaled input data, VITO’s EO data underwent a preprocessing step for this example, which resulted in not identical input data. More about the speciality of the chosen workflow and why these results do not stand for a general interchangeability of backends can be found in the Discussion section.
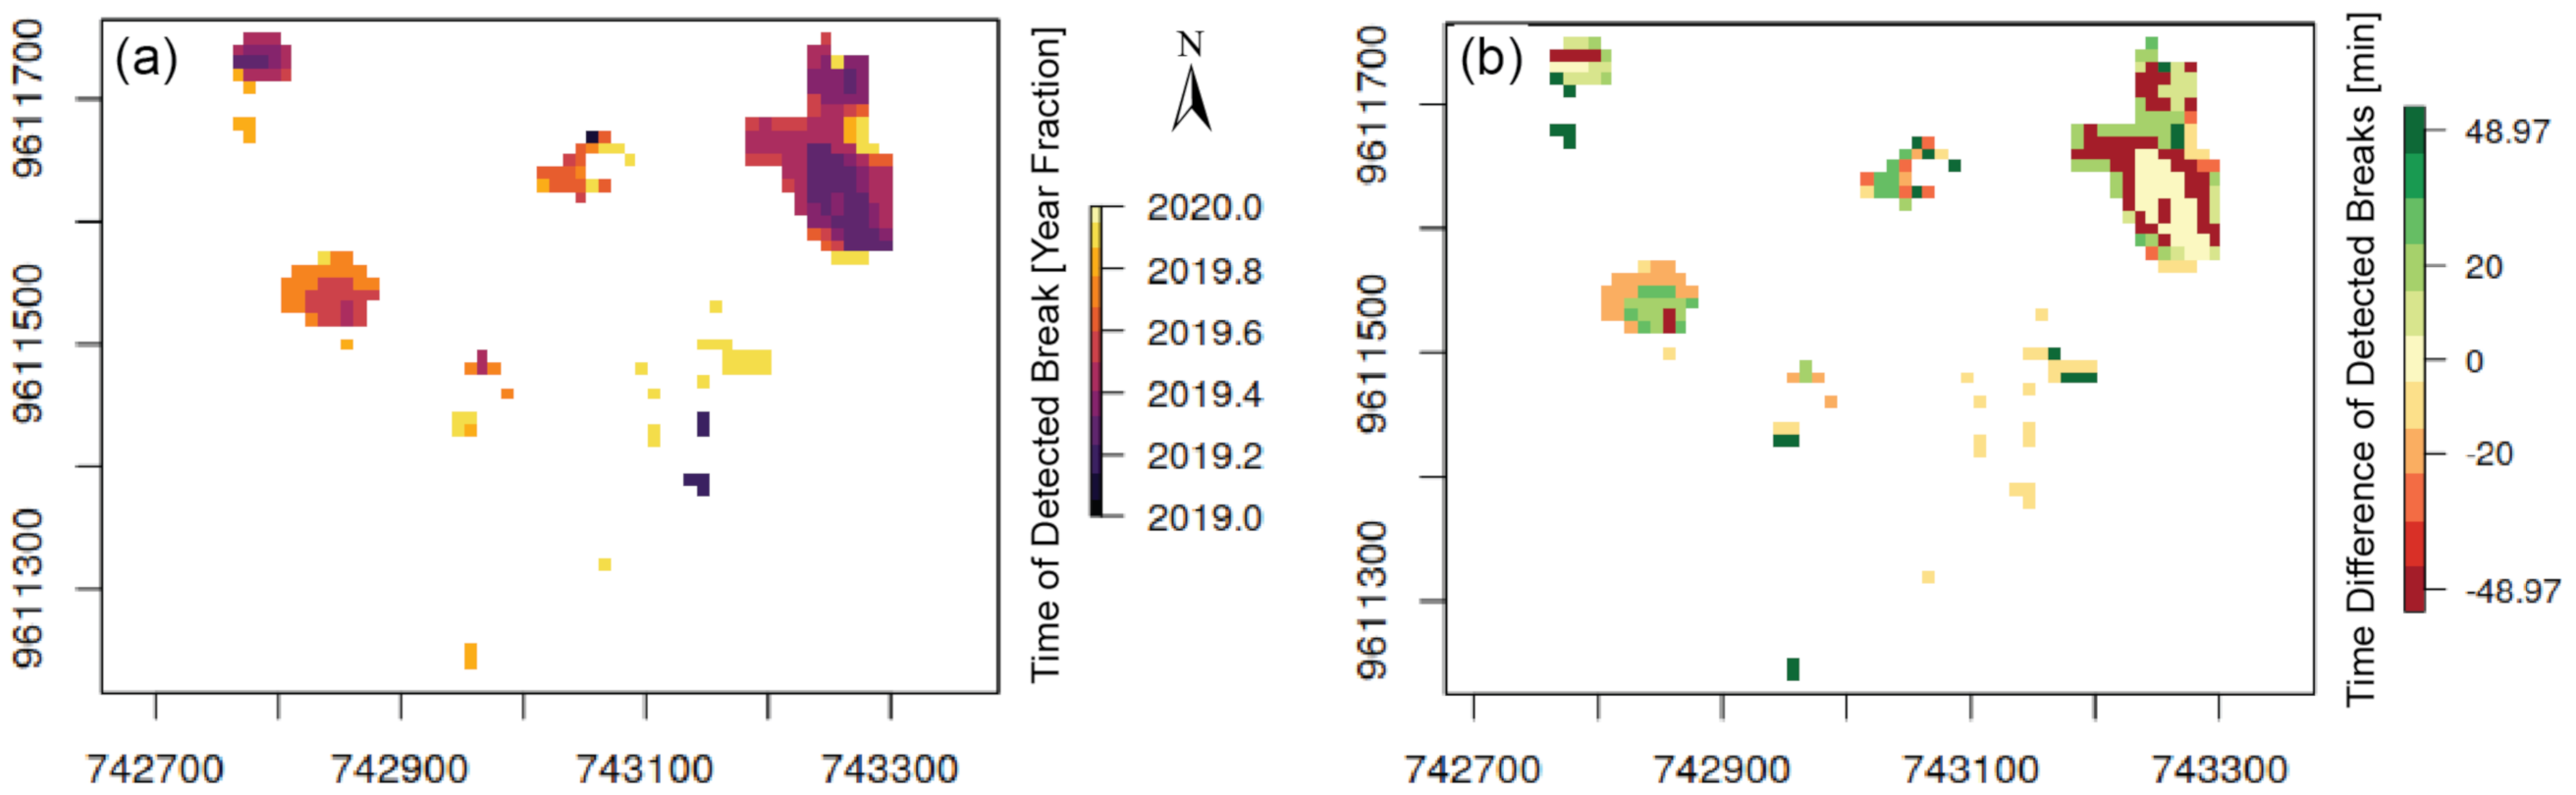
4.2. Use Case 2: UDFs—Comparison with Local Workflows
Figure 6 shows the output of the BFAST workflow, calculated as an UDF with openEO syntax at the EURAC backend. Its comparison with the result, calculated in a local R environment, revealed no visually distinguishable differences. The maximum absolute difference between the two outputs (see
Figure 6) is below 50 min, which is several orders of magnitude lower than the 12-day temporal sampling of the Sentinel-1 time series used in the calculation. This confirms the ability of the openEO API to reproduce local EO-related workflows on a cloud platform with differences only at the magnitude of computational accuracy.
5. Discussion
Following the explosive increase in freely available high-quality EO data, the landscape of cloud-based platforms that offer access to this information became confusing. This is an obstacle for conducting equal analyses of EO data on different platforms. The Copernicus Data and Information Access Service (DIAS) platforms, for instance, offer mostly cloud infrastructure but require users to install their own software and to find their way through millions of image tiles. Systems such as GEE or Sentinel-hub offer higher-level interfaces but do not allow users to run their own code, e.g., in the form of Python or R scripts for time-series analysis.
A major roadblock for navigating this landscape is that each platform or system has its own interface, even when a very large portion of the user demands is limited to a rather small set of problems. This leads to a situation where (i) comparing whether two systems give identical results when given the same task is too cumbersome to be carried out; (ii) moving activities from one system to another is very costly (vendor lock-in); and (iii) comparing the costs between identical computations on different platforms is complicated, if not impossible. By providing a single API that can be adapted to each of these platforms, the openEO API is a step to solve these problems. It helps users work reproducibly and extend validation studies; for all users, vendor lock-in decreases and costs become clear and comparable.
However, backends do not become automatically interchangeable by using the openEO API. The described first use case to compare the results of different backends was tailored towards an ideal case, where all commands, input, and output data are identical for the backends accessed. Since this cannot generally be guaranteed due to distinct business models of the platform providers, workflows of predefined openEO functions do differ at the individual backends. These differences can be caused by one of the following aspects:
Implementation of predefined functions and UDFs—while future cloud platforms are encouraged to implement all developed predefined functions as openEO compatible, its realisation is up to each backend provider. UDFs have not been realised for all participating platforms (see
Table 1).
Image collections—the EO data provided at the cloud platforms can differ, e.g., in time, region, sensor, or value-adding products. Data can be preprocessed differently, which would require unique processing steps for several backends. As an example, the Sentinel-1 data for the first use case described here are stored in different value ranges at GEE, VITO, and JRC. This leads to the need for preprocessing steps to guarantee similar input data for this study.
Metadata—the data stored at cloud platforms do not have identical metadata. Differences can occur, e.g., in the naming of bands: bands of Sentinel-2 data are called, e.g., at GEE “B1”, “B2”, etc., while at VITO, they are “B01”, “B02”, etc. These special aspects must be taken into account by the users. Additionally, data may be stored in different projections, resulting in another preprocessing step.
Output format—another backend internal decision that the openEO API passes on to the user is the choice of format of the process’ result. This includes, next to the data format, its label. For example, in Listing, the GeoTIFF format of GEE is called “GTIFF-THUMB” and the one from VITO is “GTIFF”.
These limitations, resulting from internal choices of the cloud providers mean that the openEO API does not automatically guarantee an interchangeability but rather allow for an easy way to compare platforms. For realising the first use case using identical workflows, the different backends internally preprocessed their data to generate similar input image collections. These preprocessing steps (e.g., reprojection or changing value range) resulted in differences in the input data and thus in the final results.
However, the use cases shown in this manuscript should not be confused with toy examples. The partners involved in developing the use cases work with massive EO data archives on an daily basis and have taken the openEO API into production. One of the experiences was that new employees need a shorter time to become productive using openEO than with the legacy systems used. The second use case also shows the possibility to execute locally developed workflows as UDFs via the openEO API. This brings about additional possibilities in using the API in a diverse and specialised manner. All software from clients, backends, API and supporting tools is open source and found at a single GitHub organisation. The API is being further expanded, adding additional backends and functions to the standards.
6. Conclusions
The openEO API aims to standardise the interface between frontend users and backend platforms to process big EO data. The approach of accessing data and services in the form of a virtual data cube permits a more profound comparison between compatible EO cloud services than via accessing them directly. The use case of a disturbance mapping in the Brazilian Amazon forest shown here was conducted on a local computer and on a cloud platform, where the latter bases on predefined processes of the openEO standard. The differences in the results are within computational accuracy. This indicates a comprehensive possibility to use diverse predefined and user-defined processes from the openEO tool at the service providers, covering different aspects of the EO data life cycle. The possibility of using similar process chains at different backends creates a new level of flexibility for users regarding the choice of and switch between EO data service providers. For instance, users are able to divide their workflows for execution on several platforms and thus to make use of possibly optimised EO datasets that are only provided on distinct cloud platforms. Theoretically, backends can also serve as intermediate users, redirecting commands in the openEO syntax to other EO cloud service providers that host an instance of the API. In this way, de-centralised, federated EO data processing, and combined offerings and services can become possible in the future for cloud service providers.
However, as explained in the model description, several aspects of describing data cubes are not driven by the openEO API itself but depend on the data centre’s policy regarding services and data storage. The different availabilities of input data, their characteristics, or their preprocessing strategies affect every processing results; therefore, their detailed documentation is crucial for the users. This also includes information about specific naming conventions of image collections, dimensions, and their discretisation (e.g., band names). As an example, the quality of the raw EO data, regarding, e.g., cloud coverage, is a limiting but variable factor for backends in storing or preprocessing them. In addition, different policies regarding, e.g., the spatial, temporal, and radiometric resolution of the stored EO data or their chosen projection influence the need for possibly additional processing steps by the users. The processes provided by the openEO API are currently concentrating on raster representations. A future implementation of vector data-related processes would grant the development of a wider spectrum of EO-related workflows.
The openEO API is designed as an open source project to connect diverse clients with multiple EO cloud platform providers, using chains of an increasing set of representative pre- and user-defined processes. The implemented client and backend repositories are seen as templates for future connectivity to additional service providers and programming languages. The currently implemented processes answer to existing needs for a diverse range of EO-related big data processing. However, processing specific state-of-the-art workflows often requires the use of UDFs. Future enhancements to cover expectations from additional user communities are planned but can also be suggested/provided by interested users. In this way, future work will directly build on the current implementation and expand it to allow for a federation of backends. This will further benefit users by removing one more layer of complexity in the growing ecosystem of EO data centres. With the planned federated approach, the user will be able to transparently see and process data collections available in different backends while the logic and monitoring of resources used will be implicitly handled by the system. This will help foster further uptake of the openEO API across scientific and commercial users.
A limitation of the cloud processing is that no provider currently offers public access to processing on large EO data collections for free. Because computing is not a free resource, this is not expected to happen any time soon. However, partners of the openEO project were successful in their bids for scientific follow-up projects to fund the deployment of a number of backends with openEO interfaces that will be open to the public for several years. Once such a critical mass builds and users become aware that DIAS-like platforms can provide rich analytical functionality, third-party backend providers (and open source software) will find motivation to also offer access to processing using this API.
Author Contributions
conceptualisation, M.S., W.W., E.P., J.V., and J.D.; methodology, M.S., M.M. (Milutin Milenković), A.J., J.V., and P.K.; software, all; validation, M.M. (Milutin Milenković), M.S., A.J., J.D., and P.K.; formal analysis, M.M. (Milutin Milenković) and M.S.; investigation, all; resources, M.M. (Milutin Milenković), E.P., L.F., J.D., A.J., M.N., M.K., T.M., P.K., and M.M. (Matthias Mohr); data curation, M.M. (Milutin Milenković), A.J., J.D., P.K., and B.G.; writing—original draft preparation, M.S., M.M. (Milutin Milenković), E.P., L.F., J.D., A.J., M.N., M.K., W.W., T.M., P.K., and M.M. (Matthias Mohr); writing—review and editing, M.S., M.M. (Milutin Milenković), E.P., L.F., W.W., and M.M. (Matthias Mohr); visualisation, M.M. (Milutin Milenković) and M.S.; supervision, W.W.; project administration, W.W. and M.S.; funding acquisition, W.W., E.P., M.S., J.V., J.D., A.J., M.N., M.K., and P.K. All authors have read and agreed to the published version of the manuscript.
Funding
The openEO project received funding from the European Union’s Horizon 2020 research and innovation programme under grant agreement No 776242. This publication only reflects the author’s views; the European Commission is not responsible for any use that may be made of the information it contains.
Institutional Review Board Statement
Not applicable.
Informed Consent Statement
Not applicable.
Data Availability Statement
The openEO API, source code listed here, and its results are freely available online:
https://github.com/Open-EO (accessed on 9 March 2021).
Acknowledgments
The openEO project received funding from the European Union’s Horizon 2020 research and innovation programme under grant agreement No 776242. This publication only reflects the author’s views; the European Commission is not responsible for any use that may be made of the information it contains.
Conflicts of Interest
The authors declare no conflict of interest.
Abbreviations
The following abbreviations are used in this manuscript:
| API | Application Programming Interface |
| BFAST | Breaks For Additive Season and Trend |
| CEOS | Committee on Earth Observation Satellites |
| CSW | Catalogue Service for the Web |
| DAG | Directed Acyclic Graph |
| DIAS | Copernicus Data and Information Access Service |
| EO | Earth Observation |
| GE | Google Earth |
| GEE | Google Earth Engine |
| JSON | JavaScript Object Notation |
| MODIS | Moderate Resolution Imaging Spectroradiometer |
| ODC | Open Data Cube |
| OGC | Open Geospatial Consortium |
| ROI | Region of interest |
| UDF | User-Defined Function |
| USGS | U.S. Geological Survey |
| WCPS | Web Coverage Processing Service |
| WCS | Web Coverage Service |
| WMS | Web Map Service |
| WMTS | Web Map Tile Service |
References
- Woodcock, C.E.; Allen, R.; Anderson, M.; Belward, A.; Bindschadler, R.; Cohen, W.; Gao, F.; Goward, S.N.; Helder, D.; Helmer, E.; et al. Free Access to Landsat Imagery. Science 2008, 320, 1011a. [Google Scholar] [CrossRef] [PubMed]
- Wulder, M.A.; Loveland, T.R.; Roy, D.P.; Crawford, C.J.; Masek, J.G.; Woodcock, C.E.; Allen, R.G.; Anderson, M.C.; Belward, A.S.; Cohen, W.B.; et al. Current status of Landsat program, science, and applications. Remote Sens. Environ. 2019, 225, 127–147. [Google Scholar] [CrossRef]
- Zhu, Z.; Wulder, M.A.; Roy, D.P.; Woodcock, C.E.; Hansen, M.C.; Radeloff, V.C.; Healey, S.P.; Schaaf, C.; Hostert, P.; Strobl, P.; et al. Benefits of the free and open Landsat data policy. Remote Sens. Environ. 2019, 224, 382–385. [Google Scholar] [CrossRef]
- Berger, M.; Moreno, J.; Johannessen, J.A.; Levelt, P.F.; Hanssen, R.F. ESA’s sentinel missions in support of Earth system science. Remote Sens. Environ. 2012, 120, 84–90. [Google Scholar] [CrossRef]
- Potin, P.; Rosich, B.; Miranda, N.; Grimont, P. Sentinel-1 Mission Status. Procedia Comput. Sci. 2016, 100, 1297–1304. [Google Scholar] [CrossRef]
- Knowelden, R.; Castriotta, A.G. Copernicus Sentinel Data Access Annual Report 2019; Technical report; European Space Agency: Frascati, Italy, 2020. [Google Scholar]
- Hey, T.; Tansley, S.; Tolle, K. (Eds.) The Fourth Paradigm: Data-Intensive Scientific Discovery; Microsoft Research: Redmond, WA, USA, 2009. [Google Scholar]
- Schade, S. Big Data breaking barriers—First steps on a long trail. ISPRS 2015, XL-7/W3, 691–697. [Google Scholar] [CrossRef]
- O’Sullivan, C.; Wise, N.; Mathieu, P.P. The Changing Landscape of Geospatial Information Markets. In Earth Observation Open Science and Innovation; Springer International Publishing: Cham, Switzerland, 2018; pp. 3–23. [Google Scholar] [CrossRef]
- Yue, P.; Zhou, H.; Gong, J.; Hu, L. Geoprocessing in Cloud Computing platforms—A comparative analysis. Int. J. Digit. Earth 2012, 6, 404–425. [Google Scholar] [CrossRef]
- Baumann, I.; Deiters, G. New Legal Challenges for Earth Observation Data and Services? In Proceedings of the 2019 Big Data from Space (BiDS’19); Soille, P., Loekken, S., Albani, S., Eds.; Publications Office of the European Union: Luxembourg, 2019; pp. 57–60. [Google Scholar] [CrossRef]
- Santoro, M.; Andres, V.; Jirka, S.; Koike, T.; Looser, U.; Nativi, S.; Pappenberger, F.; Schlummer, M.; Strauch, A.; Utech, M.; et al. Interoperability challenges in river discharge modelling: A cross domain application scenario. Comput. Geosci. 2018, 115, 66–74. [Google Scholar] [CrossRef]
- Craglia, M.; Nativi, S. Mind the Gap: Big Data vs. Interoperability and Reproducibility of Science. In Earth Observation Open Science and Innovation; Springer International Publishing: Cham, Switzerland, 2018; pp. 121–141. [Google Scholar] [CrossRef]
- Coetzee, S.; Ivánová, I.; Mitasova, H.; Brovelli, M. Open Geospatial Software and Data: A Review of the Current State and A Perspective into the Future. ISPRS Int. J. Geo-Inf. 2020, 9, 90. [Google Scholar] [CrossRef]
- Gorelick, N.; Hancher, M.; Dixon, M.; Ilyushchenko, S.; Thau, D.; Moore, R. Google Earth Engine: Planetary-scale geospatial analysis for everyone. Remote Sens. Environ. 2017, 202, 18–27. [Google Scholar] [CrossRef]
- Open Innovation, Open Science, Open to the World: A Vision for Europe; European Commission; Directorate-General for Research and Innovation; Publications Office of the European Union: Luxembourg, 2016. [CrossRef]
- Mobasheri, A.; Mitasova, H.; Neteler, M.; Singleton, A.; Ledoux, H.; Brovelli, M.A. Highlighting recent trends in open source geospatial science and software. Trans. GIS 2020, 24, 1141–1146. [Google Scholar] [CrossRef]
- openEO API. Available online: https://openeo.org/ (accessed on 9 March 2021).
- Pebesma, E.; Wagner, W.; Schramm, M.; Von Beringe, A.; Paulik, C.; Neteler, M.; Reiche, J.; Verbesselt, J.; Dries, J.; Goor, E.; et al. openEO—A Common, Open Source Interface Between Earth Observation Data Infrastructures and Front-End Applications. Zenodo 2017. [Google Scholar] [CrossRef]
- Schramm, M.; Pebesma, E.; Wagner, W.; Verbesselt, J.; Dries, J.; Briese, C.; Jacob, A.; Mohr, M.; Neteler, M.; Mistelbauer, T.; et al. openEO—A Standardised Connection To and Between Earth Observation Service Providers. In Proceedings of the 2019 Big Data from Space (BiDS’19); Soille, P., Loekken, S., Albani, S., Eds.; Publications Office of the European Union: Luxembourg, 2019; pp. 229–232. [Google Scholar] [CrossRef]
- SpatioTemporal Asset Catalog. Available online: http://stacspec.org/ (accessed on 9 March 2021).
- Strobl, P.; Baumann, P.; Lewis, A.; Szantoi, Z.; Killough, B.; Purss, M.; Craglia, M.; Nativi, S.; Held, A.; Dhu, T. The Six Faces of the Data Cube. In Proceedings of the 2017 Conference on Big Data from Space (BiDS’17); Soille, P., Marchetti, P.G., Eds.; Publications Office of the European Union: Luxembourg, 2017; pp. 32–35. [Google Scholar] [CrossRef]
- Nativi, S.; Mazzetti, P.; Craglia, M. A view-based model of data-cube to support big earth data systems interoperability. Big Earth Data 2017, 1, 75–99. [Google Scholar] [CrossRef]
- Baumann, P.; Misev, D.; Merticariu, V.; Huu, B.; Bell, B. Datacubes: A Technology Survey. In Proceedings of the IGARSS 2018-2018 IEEE International Geoscience and Remote Sensing Symposium, Valencia, Spain, 22–27 July 2018; pp. 430–433. [Google Scholar] [CrossRef]
- CEOS OpenSearch Best Practice Document—Version 1.2. 2017. Available online: https://ceos.org/document_management/Working_Groups/WGISS/Interest_Groups/OpenSearch/CEOS-OPENSEARCH-BP-V1.2.pdf (accessed on 9 March 2021).
- Baumann, P. Rasdaman—Raster Data Manager. Zenodo 2018. [Google Scholar] [CrossRef]
- What is GeoTrellis? Available online: https://geotrellis.readthedocs.io/en/latest/ (accessed on 9 March 2021).
- Neteler, M.; Bowman, M.H.; Landa, M.; Metz, M. GRASS GIS: A multi-purpose open source GIS. Environ. Model. Softw. 2012, 31, 124–130. [Google Scholar] [CrossRef]
- Neteler, M.; Gebbert, S.; Tawalika, C.; Bettge, A.; Benelcadi, H.; Löw, F.; Adams, T.; Paulsen, H. Actinia: Cloud based geoprocessing. In Proceedings of the 2019 Big Data from Space (BiDS’19); Soille, P., Loekken, S., Albani, S., Eds.; Publications Office of the European Union: Luxembourg, 2019; pp. 41–44. [Google Scholar] [CrossRef]
- Zambelli, P.; Gebbert, S.; Ciolli, M. Pygrass: An Object Oriented Python Application Programming Interface (API) for Geographic Resources Analysis Support System (GRASS) Geographic Information System (GIS). ISPRS Int. J. Geo-Inf. 2013, 2, 201–219. [Google Scholar] [CrossRef]
- Gebbert, S.; Pebesma, E. The GRASS GIS temporal framework. Int. J. Geogr. Inf. Sci. 2017, 31, 1273–1292. [Google Scholar] [CrossRef]
- Kempeneers, P.; Pesek, O.; Marchi, D.D.; Soille, P. pyjeo: A Python Package for the Analysis of Geospatial Data. ISPRS Int. J. Geo-Inf. 2019, 8, 461. [Google Scholar] [CrossRef]
- Verbesselt, J.; Hyndman, R.; Newnham, G.; Culvenor, D. Detecting trend and seasonal changes in satellite image time series. Remote Sens. Environ. 2010, 114, 106–115. [Google Scholar] [CrossRef]
- DeVries, B.; Verbesselt, J.; Kooistra, L.; Herold, M. Robust monitoring of small-scale forest disturbances in a tropical montane forest using Landsat time series. Remote Sens. Environ. 2015, 161, 107–121. [Google Scholar] [CrossRef]
- Hamunyela, E.; Verbesselt, J.; Herold, M. Using spatial context to improve early detection of deforestation from Landsat time series. Remote Sens. Environ. 2016, 172, 126–138. [Google Scholar] [CrossRef]
- Hawes, J.E.; Vieira, I.C.G.; Magnago, L.F.S.; Berenguer, E.; Ferreira, J.; Aragão, L.E.O.C.; Cardoso, A.; Lees, A.C.; Lennox, G.D.; Tobias, J.A.; et al. A large-scale assessment of plant dispersal mode and seed traits across human-modified Amazonian forests. J. Ecol. 2020, 108, 1373–1385. [Google Scholar] [CrossRef]
- Potapov, P.; Hansen, M.C.; Laestadius, L.; Turubanova, S.; Yaroshenko, A.; Thies, C.; Smith, W.; Zhuravleva, I.; Komarova, A.; Minnemeyer, S.; et al. The last frontiers of wilderness: Tracking loss of intact forest landscapes from 2000 to 2013. Sci. Adv. 2017, 3, e1600821. [Google Scholar] [CrossRef] [PubMed]
| Publisher’s Note: MDPI stays neutral with regard to jurisdictional claims in published maps and institutional affiliations. |
© 2021 by the authors. Licensee MDPI, Basel, Switzerland. This article is an open access article distributed under the terms and conditions of the Creative Commons Attribution (CC BY) license (http://creativecommons.org/licenses/by/4.0/).


 ,
, 


